the Creative Commons Attribution 4.0 License.
the Creative Commons Attribution 4.0 License.
 | 20 Jun 2019
Organic aerosol source apportionment in Zurich using an extractive electrospray ionization time-of-flight mass spectrometer (EESI-TOF-MS) – Part 2: Biomass burning influences in winter
Lu Qi
Mindong Chen
Giulia Stefenelli
Veronika Pospisilova
Yandong Tong
Amelie Bertrand
Christoph Hueglin
Xinlei Ge
Urs Baltensperger
André S. H. Prévôt
Jay G. Slowik
Real-time, in situ molecular composition measurements of the organic fraction of fine particulate matter (PM2.5) remain challenging, hindering a full understanding of the climate impacts and health effects of PM2.5. In particular, the thermal decomposition and ionization-induced fragmentation affecting current techniques has limited a detailed investigation of secondary organic aerosol (SOA), which typically dominates OA. Here we deploy a novel extractive electrospray ionization time-of-flight mass spectrometer (EESI-TOF-MS) during winter 2017 in downtown Zurich, Switzerland, which overcomes these limitations, together with an Aerodyne high-resolution time-of-flight aerosol mass spectrometer (HR-TOF-AMS) and supporting instrumentation. Positive matrix factorization (PMF) implemented within the Multilinear Engine (ME-2) program was applied to the EESI-TOF-MS data to quantify the primary and secondary contributions to OA. An 11-factor solution was selected as the best representation of the data, including five primary and six secondary factors. Primary factors showed influence from cooking, cigarette smoke, biomass burning (two factors) and a special local unknown event occurred only during two nights. Secondary factors were affected by biomass burning (three factors, distinguished by temperature and/or wind direction), organonitrates, monoterpene oxidation, and undetermined regional processing, in particular the contributions of wood combustion. While the AMS attributed slightly over half the OA mass to SOA but did not identify its source, the EESI-TOF-MS showed that most (>70 %) of the SOA was derived from biomass burning. Together with significant contributions from less aged biomass burning factors identified by both AMS and EESI-TOF-MS, this firmly establishes biomass burning as the single most important contributor to OA mass at this site during winter. High correlation was obtained between EESI-TOF-MS and AMS PMF factors where specific analogues existed, as well as between total signal and POA–SOA apportionment. This suggests the EESI-TOF-MS apportionment in the current study can be approximately taken at face value, despite ion-by-ion differences in relative sensitivity. The apportionment of specific ions measured by the EESI-TOF-MS (e.g., levoglucosan, nitrocatechol, and selected organic acids) and utilization of a cluster analysis-based approach to identify key marker ions for the EESI-TOF-MS factors are investigated. The interpretability of the EESI-TOF-MS results and improved source separation relative to the AMS within this pilot campaign validate the EESI-TOF-MS as a promising approach to source apportionment and atmospheric composition research.
- Article
(12912 KB) - Companion paper
-
Supplement
(4513 KB) - BibTeX
- EndNote


Organic aerosol (OA) is relevant due to its roles in several atmospheric processes including radiative forcing, visibility, heterogeneous reactions, and uncertain effects on human health (Nel, 2005; Docherty et al., 2008; Stocker et al., 2013). OA sources are typically classified as either directly emitted primary organic aerosol (POA) or secondary organic aerosol (SOA) formed from gas-to-particle conversion after chemical reactions. SOA is estimated to comprise approximately 20 % to 90 % of OA, depending on location and time of year (Jimenez et al., 2009; Hallquist et al., 2009). Many studies have successfully linked POA to specific sources, but the level of chemical characterization achieved by conventional online instrumentation has been in most cases proven insufficient for quantitative resolution of SOA source contributions and/or formation pathways. Therefore, the effects of individual SOA sources on health and climate remain poorly constrained, hampering the design of efficient emissions control policies.
A range of methods to measure molecular composition of aerosol particles have so far mostly been conducted offline, using filter samples (Wang et al., 2009, 2017; Daellenbach et al., 2017). Compared to online methods, offline methods have low time resolution typically integrating aerosol over hours and introducing sampling/storage artifacts (Timkovsky et al., 2015). Moreover, offline measurement techniques like gas chromatography–mass spectrometry (GC–MS) or liquid chromatography–mass spectrometry (LC–MS), are chemically highly specific, but often struggle with the fraction of mass that can be characterized (typically <20 % of the total OA), which hinders our understanding of the SOA.
Currently available online speciation techniques to measure aerosol particle composition often rely on some type of thermal desorption and/or hard ionization leading to thermal decomposition and/or ionization-induced fragmentation of the original molecules. For example, the Aerodyne aerosol mass spectrometer (AMS) vaporizes molecules at 600 ∘C followed by electron ionization at 70 eV, facilitating quantification but yielding extensive decomposition and fragmentation (Jayne et al., 2000; Sasaki et al., 2001; Samy et al., 2011; Hayes et al., 2013). The chemical analysis of an aerosol online proton-transfer-reaction mass spectrometer (CHARON-PTR-MS) has no significant thermal decomposition but the ionization scheme fragments typical SOA molecules (Eichler et al., 2015; Muller et al., 2017). Several semicontinuous methods have also been developed, including thermal desorption aerosol GC (TAG-MS, GC family; Williams et al., 2006) and a gas and aerosol chemical-ionization time-of-flight mass spectrometer (FIGAERO-CIMS; Lopez-Hilfiker et al., 2014). However, these systems remain subject to some degree of thermal decomposition, as well as potential reaction on the collection substrate, and significantly lower time resolution. Above all, an online instrument able to detect the original OA and resolve its chemical composition at the molecular level with higher time resolution is needed. The Paul Scherrer Institute (PSI) has developed such an instrument, i.e., the extractive electrospray ionization time-of-flight mass spectrometer (EESI-TOF-MS), measuring particles at the molecule level with a time resolution of seconds while overcoming the usual limitations, e.g., thermal decomposition, ionization-induced fragmentation, semicontinuous operation (Lopez-Hilfiker et al., 2019).
Due to the lacking ability to apportion SOA to specific sources, a terminology based on properties rather than sources was previously introduced, such as the AMS-based discrimination into semi-volatile and low-volatility oxygenated organic aerosol (SV-OOA and LV-OOA, respectively). The current state-of-the-art SOA source apportionment is to be improved based on large laboratory experiments which generate a “library” of species of the SOA products (H. Zhang et al., 2015; Bianchi et al., 2017; Nakao et al., 2011; Nah et al., 2016; X. Zhang et al., 2017). An isoprene OA source was identified based on fragments in AMS and ACSM (aerosol chemical speciation monitor) mass spectra that are consistent with those of laboratory-generated isoprene SOA (via reactive uptake of epoxydiols, IEPOX; Xu et al., 2015; Y. Zhang et al., 2017). Offline analysis identified winter OOA and summer OOA, which to some extent appear to be linked to sources (Daellenbach et al., 2017, 2016; Bozzetti et al., 2017), even though the corresponding sources cannot be retrieved. Zhang et al. (2018) combined the offline GC–MS method and online FIGAERO-CIMS measurements to better characterize summertime monoterpene SOA.
Domestic wood combustion has been identified as a major source of OA in central Europe (Lanz et al., 2010; Herich et al., 2014), as well as in Asia (Sun et al., 2013; Quan et al., 2014). Recent studies have been devoted to the chemical characterization of the gas and particle-phase emissions from biomass burning in the laboratory, to provide information for a better source apportionment of primary and secondary biomass burning OA (Iinuma et al., 2010; Nakao et al., 2011; Ofner et al., 2011; Chan et al., 2005; Bruns et al., 2017; Bertrand et al., 2018). Various tracer compounds for biomass burning were reported, including levoglucosan, which is a sugar anhydride compound produced from the pyrolysis of cellulose and hemicellulose (Fine et al., 2001), or methoxyphenols (e.g., guaiacol and syringol), derived from the pyrolysis of lignin (Coeur-Tourneur et al., 2009; Veres et al., 2010; He et al., 2018), and methyl-nitrocatechols, nitrated aromatic compounds from biomass burning (Iimuma et al., 2010). Furthermore, biomass burning has been shown to produce significant SOA in laboratory measurements (Bruns et al., 2016; Nakao et al., 2011; Yee et al., 2013; Stefenelli et al., 2019a), but this component has not yet been resolved in the field with the partial exception of winter OOA.
Here, we report on a study in Zurich, a midsize city in central Europe, utilizing the EESI-TOF-MS, complemented with AMS source apportionment results for a winter case. Summer measurement and source apportionment are presented in the companion paper (Stefenelli et al., 2019b). In both cases, due to the enhanced chemical resolution of the EESI-TOF-MS we are able to resolve more POA and SOA sources than in previous studies at the same site.
2.1 Measurement campaign
Measurements were performed from 25 January to 5 February 2017 at the Swiss National Air Pollution Monitoring Network (NABEL) station at Zurich Kaserne, Switzerland (Richard et al., 2011). The station is located in the center of the metropolitan area of Zurich (1.3 million inhabitants). It is characterized as an urban background site, although several restaurants are nearby (Lanz et al., 2007). Long-term measurements at the site include ambient meteorological data such as temperature, relative humidity (RH), solar radiation, wind speed and direction, trace gas measurements comprising nitrogen oxides (NOx, Thermo Environmental Instruments 42i, Thermo Electro Corp., Waltham, MA) and ozone (O3, Thermo Environmental Instruments 49C, Thermo Electro Corp., Waltham, MA), and particle measurements which include size distributions (scanning mobility particle sizer, SMPS, TSI) and number concentration (condensation particle counter, CPC). Although the measurement period is relatively short (12 d), the similarity of the AMS results obtained in the current study compared to previous AMS and ACSM measurements at the same site (Lanz et al., 2007; Canonaco et al., 2013; Richard et al., 2011; Daellenbach et al., 2016) gives us high confidence that the sampled aerosol is representative of typical wintertime conditions. Exceptions to this are resolved by the source apportionment into unique event-driven factors, as discussed in the Results section.
For the intensive campaign, an EESI-TOF-MS, an HR-TOF-AMS (Aerodyne Research Inc.) and an SMPS were additionally deployed. The sampling was performed in a mobile trailer installed outside the NABEL station. Ambient air was sampled through a PM2.5 cyclone to remove coarse particles (∼75 cm above the trailer roof and ∼5 m above ground). The air passed through a stainless steel (∼6 mm) tube into the AMS, EESI-TOF-MS, and SMPS, installed on the same line and in close proximity.
2.2 Instrumentation
2.2.1 Extractive electrospray ionization time-of-flight mass spectrometer (EESI-TOF-MS)
The extractive electrospray ionization time-of-flight mass spectrometer (EESI-TOF-MS) is a novel instrument for real-time measurement of organic aerosol without thermal decomposition or ionization-induced fragmentation. The instrument is discussed in detail elsewhere (Lopez-Hilfiker et al., 2019) and a brief overview is presented here. Ambient aerosol is continuously sampled at 900 cm3 min−1, either directly or through a particle filter to yield a background measurement. In this study, 10 min ambient air sampling was alternated with 2 min through the filter with spectra recorded with 40 s time resolution. The flow then passes through a 5 cm long 6 mm outer diameter (OD) multichannel extruded carbon denuder housed in a stainless steel tube, which removes most trace gas-phase species. The denuder eliminates artifacts from semi-volatile species desorbing from the filter, and also improves detection limits by reducing the gas-phase background. The particle-laden flow then intersects a spray of charged droplets generated by a conventional electrospray capillary. Particles collide with the electrospray droplets and the soluble components are extracted, ionized by Coulomb explosion of the charged droplets, and detected by TOF-MS (resolution ∼4000 at mass-to-charge ratio (m∕z) 185). The electrospray droplets are generated by a commercially available 360 µm OD untreated fused silica capillary with an inner diameter of 50 µm (BGB Analytik). The sample flow remains unheated until after extraction of aerosol material into the electrospray droplets, minimizing volatilization of labile particle-phase components and thermal decomposition. The droplets then enter the mass spectrometer through a capillary heated to 250 ∘C; however, the very short residence time in this capillary means that the effective temperature experienced by the analyzer is much lower and no thermal decomposition is observed. The electrospray working solution is a 50:50 water∕acetonitrile (>99.9 %, Sigma-Aldrich) mixture, which has less background signal compared to the water∕methanol mixture, with 100 ppm of sodium iodide (NaI) as a charge carrier. Spectra are recorded in positive ion mode, in nearly all cases as adducts with Na+. Depending on voltage settings in the ion transfer optics (i.e., collision energy), clusters with acetonitrile can potentially be detected; however, these clusters were observed to be negligible with our settings. The recorded signals are linear with mass and free of detectable matrix effects, in part due to the suppression of ionization pathways other than Na+ adduct formation (Lopez-Hilfiker et al., 2019). Here we report the signal measured by the EESI-TOF-MS in terms of the mass flux of ions to the microchannel plate detector (ag s−1, neglecting Na+), calculated as shown in Eq. (1).
Here Mx is the mass flux of ions united in attograms per second; x represents the measured molecular composition. Ix is the recorded signal measured by EESI-TOF-MS. MWx and MWcc represent the molecular weight of the ion and the charge carrier (e.g., H+, Na+), respectively. Note that this measured mass flux can be related to ambient concentration by the instrument flow rate, EESI extraction/ionization efficiency, declustering probability, and ion transmission, where several of these parameters are ion-dependent (Lopez-Hilfiker et al., 2019). A comparison of the EESI-TOF-MS mass flux to the AMS signal in terms of total signal or mass, bulk properties, and source apportionment results is presented in Sect. 3.5.
With the EESI-TOF-MS, we almost continuously collected data from 25 January to 5 February 2017 (84.6 %), missing a few data points due to instrumental calibration and issues such as cleaning the electrospray capillary due to lost or unstable signal. EESI-TOF-MS stability and linearity with mass were confirmed by periodic measurement of nebulized levoglucosan aerosol with quantification of the mass concentration with an SMPS.
Data processing was executed using Tofware version 2.5.7 (Tofwerk AG, Thun, Switzerland). The total number of 1125 fitted ions (including 882 Na+ adducts, one H+ adduct, and 242 unknown ions) between m∕z 135 and 400 were identified. Negligible signal was detected below m∕z 135 due to the selected mass spectrometer transmission window. Data were pre-averaged to 1 min time resolution, and high-resolution peak fitting was performed. Individual 1 min spectra were classified as ambient measurements, background sampling (through the particle filter), or transitional measurements immediately after switching between ambient and background sampling. Transitional measurements were excluded from further analysis. Background spectra were averaged across each 2 min filter period, and these filter periods were interpolated to estimate the background spectrum during each ambient sampling period. The estimated backgrounds were subtracted from individual ambient spectra to yield the final ion time series of difference spectra. Ions with a mean signal-to-noise ratio (SNR) below 2 were removed from further analysis. No corrections for the relative sensitivity of individual ions or drift in instrument sensitivity were applied. For the Multilinear Engine (ME-2) source apportionment analysis (Sect. 2.3), data were re-averaged to 2 min. The corresponding error matrix σij, which has the same dimensions as the data matrix, follows the model of Allan et al. (2003), whose calculation includes the uncertainty deriving from electronic noise, ion-to-ion variability at the detector, and ion counting statistics. The error estimates in this case incorporate the uncertainties related to both the ambient measurements (δi) (direct ambient sampling periods) and the background (βij) (filter blank measuring periods; both are processed with Tofware), which are combined in quadrature according to Eq. (2):
The final data matrix and error matrix have the size of 10 165 (time series) × 892 (variables).
2.2.2 Aerosol mass spectrometer (AMS)
An HR-TOF-AMS was deployed for online measurements of non-refractory (NR) PM2.5 (with an inline PM2.5 cyclone). A detailed description of the instrument can be found elsewhere (Jayne et al., 2000; DeCarlo et al., 2006). The AMS recorded data with 1 min time resolution, of which 30 s was spent recording the ensemble mass spectrum (mass spectrum (MS) mode) and 30 s recording size-resolved mass spectra (“particle time-of-flight (ePToF) mode”). A Nafion dryer was used to dry the sampled air stream, which kept the relative humidity (RH) of air below 30 % within the AMS. Particles are continuously sampled (∼0.8 L min−1) through a 100 µm critical orifice and are focused by a recently developed PM2.5 aerodynamic lens (Williams et al., 2013). The particles impact on a heated tungsten surface (heated to 600 ∘C) at Torr ( Pa) and the NR components are flash vaporized. The resulting gases are ionized by electron ionization (EI, ∼70 eV) and the m∕z values of the resulting fragments are determined by the TOF mass spectrometer. The AMS was calibrated for inlet flow and ionization efficiency (IE) at the beginning, middle, and end of the campaign following standard protocols.
AMS data were analyzed in Igor Pro 6.36 using the Squirrel (version 1.57) and Pika (1.16) analysis software (Donna Sueper, ToF-AMS high-resolution analysis software). The collection efficiency (CE) was estimated using a composition-dependent collection efficiency (CDCE) algorithm (Middlebrook et al., 2012) implemented in Squirrel. A CE=0.5 was assumed except in the case of strongly acidic aerosols, and high ammonium nitrate content where the approach by Middlebrook et al. (2012) was applied.
For ME-2 analysis, the input matrices consisted of the time series of fitted ions from high-resolution mass spectral analysis, together with their corresponding uncertainties (Allan et al., 2003). According to the recommendations of Ulbrich et al. (2009), a minimum error value was added to the error matrix and ions were assessed and treated according to their signal-to-noise ratio (SNR) as follows: ions with an SNR less than 0.2 were excluded from ME-2 analysis, while those with an SNR between 0.2 and 2 were down-weighted by increasing their uncertainties by a factor of 2. Further, ions that were not independently fit but rather calculated from were removed to avoid overweighting . Likewise, isotopes were not included in the matrices to avoid overweighting the parent ions. The source apportionment input matrices consisted of 257 ions between m∕z 12 and 120.
2.3 Source apportionment techniques
Source apportionment was performed on the organic AMS and EESI-TOF-MS data separately using PMF as implemented by the Multilinear Engine (ME-2) (Paatero, 1997) and with model configuration and analysis executed via the SoFi (Source Finder, version 6.39) interface (Canonaco et al., 2013), coded in Igor Pro (WaveMetrics 6.37). PMF represents the input data matrix as a linear combination of characteristic factor profiles and their time-dependent contributions, which can be expressed in matrix notation as
The measured X is an m×n matrix, representing m measurements of n m∕z. G and F are m×p and p×n matrices, respectively, where p is the number of factors contained in a given model solution and is selected by the user.
Equation (3) is solved using a least-squares algorithm that iteratively minimizes the quantity Q (Eq. 4), defined as the sum of the squared residuals weighted by their respective uncertainties, where the uncertainty may contain the measurements and model uncertainty:
Here, eij represents the residuals (elements of E), with i and j denoting respectively the time and m∕z indices, and σij is the corresponding measurement uncertainty. Rotations are explored by using the a value approach, here implemented by constraining one or more output factor profiles to resemble a selected source, improving source separation (Crippa et al., 2014; Canonaco et al., 2013). The a value (ranging from 0 to 1) determines how much the constrained factor (fj, solution) is allowed to vary from its anchor (fj), as defined in Eq. (5).
Execution of PMF analysis on separated AMS and EESI-TOF-MS datasets minimizes the complexity of the analysis, while maximizing the factor resolution ability of the EESI-TOF-MS. The factor related to traffic was constrained for the AMS analysis, while a factor related to cigarette smoke was constrained for the EESI-TOF-MS. Details are presented in Sect. 3.1 and 3.2. Different factors were constrained in the two datasets due to the fundamental differences between the AMS and EESI-TOF-MS measurements. Specifically, the absence of fragmentation in the EESI-TOF-MS allowed clear separation of cooking without the need for constraints, while separation of a cigarette smoke factor was only achieved for the EESI-TOF-MS. Constraining an AMS cigarette smoke factor was attempted but failed.
2.4 Wind regression analysis
Wind regression analysis has been developed as a means of using meteorological and pollutant data to estimate the percent of a given pollutant originating from a specific wind sector. This study utilizes the sustained wind incidence method (SWIM), a quantitative model that estimates the weighted pollutant concentrations and uncertainties from a given wind direction and speed (Henry et al., 2009; Olson et al., 2012). The expected concentration (E) of a pollutant for each wind direction–wind speed pair (θ, u) is calculated as a weighted average of the concentration data in a window around (θ, u) represented by smoothing parameters σ and h using a weighting function , given by Eq. (6):
where Ci, Ui, and Wi are the observed concentrations of a particular pollutant, resultant wind speed, and directional standard deviation, respectively; N is the total number of observations; K1 (Eq. 7) and K2 (Eq. 8) are smoothing Gaussian kernel and the Epanechnikov kernel; and σ and h are smoothing parameters for wind direction and wind speed, respectively. The conditional probability of a pollutant concentration (Eq. 6) is then weighted by the frequency of the wind using a joint probability of wind speed and wind direction, resulting in the following expression for the mean value of the pollutant concentration associated with winds from the sector defined by the intervals U () and Θ ().
The joint probability of wind speed and wind direction (f) is calculated by using a kernel density, estimated as
Calculations have been performed on Igor Pro with the ZeFir package (Petit et al., 2017).
2.5 Identification of source-specific ions
To determine ions characteristic of individual factors (or groups of related factors), agglomerative hierarchical clustering was conducted on the EESI-TOF-MS matrix of PMF profiles and standardizing data along the ions, clustering first along the columns (producing row-clustered groups of factors), and then along the rows (producing the clustered ions for each group) in the matrix data. In hierarchical cluster analysis, a dendrogram, used to show relationships between members of a group, i.e., a family tree with the oldest common ancestor at the base and branches for various divisions of lineage, was generated with the following steps (MATLAB R2017b). (1) Calculate the distance by using Euclidean distance to find the similarity or dissimilarity between every ion and every pair of factors in our dataset. (2) Link pairs of ions and factors that are in close proximity using the average linkage function. (3) Use the cluster function to prune branches off the bottom of hierarchical tree, and assign all the objects below each cut to a single cluster. Here, the clustergram function transforms the standardized values so that the mean is 0.
Results of AMS and EESI-TOF-MS PMF analyses are presented in Sect. 3.1 and 3.2, respectively. Section 3.3 focuses on the EESI-TOF-MS. PMF results are then exploited to assess the apportionment of specific ions related to key marker compounds (Sect. 3.3) and to identify groups of molecules uniquely characteristic of the retrieved factors (Sect. 3.4). However, quantitative interpretation of the EESI-TOF-MS PMF results is complicated by differences in the relative sensitivity of the EESI-TOF-MS to different molecules. Therefore Sect. 3.5 presents a comparison of the EESI-TOF-MS and AMS results in terms of total signal, bulk atomic composition, and relative apportionment to the different factors.
3.1 AMS source apportionment
The AMS PMF analysis yielded seven OA factors: hydrocarbon-like OA (HOAAMS), cooking-related OA (COAAMS), biomass burning OA (BBOAAMS), two oxygenated OA factors (less oxygenated, LO-OOAAMS, and more oxygenated, MO-OOAAMS), nitrogen-containing OA (NOAAMS), and a factor due to an isolated local event (EVENTAMS). The factor mass spectra are shown in Fig. 1, while Fig. S1 in the Supplement shows the factor time series, together with selected external tracers, and diurnal cycles, which may be less convincing due to the short period of the measurement. Salient characteristics of these factors are discussed below; HOAAMS, COAAMS, BBOAAMS, LO-OOAAMS, and MO-OOAAMS are similar to factors frequently observed in other studies (Crippa et al., 2013a; Zhang et al., 2011; Young et al., 2016).

Figure 1Factor profiles for the seven-factor AMS PMF solution. HOAAMS is constrained by an a value of 0.1. The total signal of each factor is normalized to unity (HOAAMS: hydrocarbon OA; COAAMS: cooking-related OA; BBOAAMS: biomass burning OA; OOAAMS: oxygenated OA; NOAAMS: nitrogen-containing OA; EVENTAMS, an isolated local event).
HOAAMS was constrained using a factor mass spectrum from Paris (Crippa et al., 2013b) and an a value of 0.1 (the a value was selected according to the correlations between the time series of HOA with the traffic species NOx), yielding a factor with a low O:C ratio (0.04) and high H:C ratio (1.8), consistent with a dominant contribution from aliphatic hydrocarbons. Strong signals from ions are evident, especially , , , and ions. Consistent with previous studies, the HOA mass spectrum is similar to vehicle emission studies (Zhang et al., 2005; Sun et al., 2012; Young et al., 2016).
The COAAMS mass spectrum is similar to primary cooking emissions (Crippa et al., 2013b) and exhibits a unique diurnal pattern peaking during lunch- and dinnertime. The COAAMS spectrum is characterized by a ratio and a high fraction of C3H3O+ and , consistent with COAAMS factors previously identified at urban locations (Crippa et al., 2013a; Ge et al., 2012; Mohr et al., 2012).
BBOAAMS has been identified as a significant source of aerosol in previous wintertime source apportionment studies in Switzerland and central Europe (Lanz et al., 2008; Daellenbach et al., 2017). Similar to previous studies, BBOAAMS shows a high fraction at m∕z 60 and at m∕z 73 and explains most of the variation in these ions (77 %, 65 %, respectively). A strong diurnal trend is evident, with concentrations peaking overnight and decreasing during the day.
LO-OOAAMS and MO-OOAAMS mass spectra are characterized by dominant peaks at m∕z 28 (CO+) and 44 (), similar to OOAAMS factors observed at other sites (Sun et al., 2011; Ng et al., 2010). The main difference between the LO-OOAAMS and MO-OOAAMS mass spectra is the relative contribution of C2H3O+ compared to , with C2H3O+ enhanced in LO-OOAAMS. Also enhanced in LO-OOA are ions at m∕z 39 (), 41 (), and 55 (). Further insight into the OOAAMS factors is obtained through the EESI analysis (Sect. 3.2).
NOAAMS exhibits a significantly higher N:C ratio (0.04) than the other factors and explains most of the organic nitrogen signal. This factor includes a strong signal from C5H10N+ signal (m∕z 84), which is consistent with N-methyl-pyrrolidine, which has previously been identified in AMS spectra as a tracer for cigarette smoke (Struckmeier et al., 2016). This ion is also observed in the EI mass spectra of nicotine (NIST, https://webbook.nist.gov/cgi/cbook.cgi?ID=C54115&Mask=200\#Mass-Spec, last access: May 2018). However, other spectral features (e.g., the high signal) are not typical of primary cigarette smoke and suggest a contribution from secondary formation processes. This interpretation is consistent with correlations of NOAAMS with EESI-TOF-MS factors, suggesting NOAAMS to be a mixed factor, as discussed in Sect. 3.2 and 3.4.
The EVENTAMS factor is a special case in our study as the mass spectrum is dominated by m∕z 15 (), 27 (), 31 (CH3O+), and 43 (C2H3O+). The time series only contributes during two nights (28 and 29 January) from 00:00 to 07:00 UTC+2 with the concentrations peaking at 3.8 µg m−3 but being below 0.2 µg m−3 for the rest of the study. No associations with any markers are evident.
3.2 EESI-TOF-MS source apportionment
An 11-factor solution was selected as the best representation of the EESI-TOF-MS data, with five factors attributed mostly to POA and six to SOA. The POA factors include cooking-related OA (COAEESI), two less aged biomass burning factors (LABB1EESI and LABB2EESI), which are mostly dominated by primary organic aerosol compounds, cigarette-smoke-influenced OA (CS-OAEESI), and a factor related to an isolated special event (EVENTEESI). The SOA factors consist of three more aged biomass burning factors dominated by secondary organic aerosol compounds and distinguished by mean daily temperature (MABB_LOWEESI, MABB_HIGHEESI, and MABB_TRANSEESI, corresponding to low temperature, high temperature, and transition periods, respectively), two additional SOA factors lacking a clear attribution to biomass burning (SOA1EESI and SOA2EESI), and nitrogen-containing SOA (NSOAEESI). This solution was obtained by constraining the CS-OAEESI factor with an a value of 0.1, and all other factors unconstrained. This constraining approach and the solution selection criteria are discussed in Sect. 3.2.1, while the POA and SOA factors are discussed in Sect. 3.2.2 and 3.2.3, respectively. A detailed investigation of the factor mass spectra is presented in Sect. 3.4.
3.2.1 Selection of PMF solution
In selecting the PMF solution that best represents the EESI-TOF-MS dataset, we considered both mathematical diagnostics (e.g., Q∕Qexp and residuals) as a function of the number of factors, as well as the interpretability of the retrieved factors. Interpretability was judged according to
-
correlation of the time series and diurnal patterns between the AMS and EESI factors
-
comparison of factor profiles with mass spectra retrieved from less and more aged biomass burning exhaust from simulation chamber experiments at PSI (Bertrand et al., 2018)
-
similarities to EESI-TOF-MS factor mass spectra retrieved from summer measurements at the same site in Zurich (Stefenelli et al., 2019b)
-
identification of key ions in the factor profiles, including ions contributing a major fraction of the total factor signal, ions apportioned predominantly to a certain factor or related to a set of factors, and ions established in the literature as known tracers for specific sources/processes
-
interpretation of the temporal behavior in terms of meteorological data, including temperature, solar radiation, and wind speed/direction.
For the EESI-TOF-MS source apportionment, we considered unconstrained solutions from 7 to 20 factors (see Fig. S2a). Of these solutions, a 10-factor solution was found to best explain the data at a preliminary stage. This was preferred to lower-order solutions because all factors were interpretable according to the above criteria. Solutions with more factors lead to additional factors related to more aged biomass burning without obvious additional information. In addition, the investigation of Q∕Qexp as a function of the number of factors (Fig. S2b) did not show any significant change with the increase in the a value from seven factors. Figures S3 and S4 show the mass spectra and time series of the 8- to 11-factor solutions.
Nonetheless, the unconstrained 10-factor solution revealed evidence of factor mixing, as the cooking-related (COAEESI) factor mass spectrum had a strong contribution from m∕z 163 (C10H15N2, nicotine), which should rather be associated with cigarette smoke (Fig. S5). This suggests that at least one more factor remains to be resolved. The difficulty in separating these factors, despite their expected chemical differences, is likely due to strong temporal correlation between cooking and cigarette-smoking emissions due to the proximity of local restaurants (Fig. S6, the diurnal patterns of nicotine and COAEESI factors), where people gather outside to smoke during mealtimes. We therefore attempted to obtain a clean cigarette smoking signature from the dataset to serve as an anchor profile with which to constrain this source. For solutions with 15 to 20 factors, a factor was retrieved with a mass spectrum dominated by nicotine and to which >90 % of nicotine was apportioned. We therefore constructed a profile (average from 15 to 20 factors) for this nicotine-containing factor (apportioned to cigarette smoke, i.e., CS-OAEESI). This profile was then constrained in an 11-factor solution (based on the selection of a 10-factor unconstrained solution, as discussed above) using an a value approach (from 0 to 1 with steps of 0.1, 0.1 was chosen finally). The main criterion of the constraint was the fraction of nicotine apportioned to the constrained factor. Also in our case, the R (Pearson) for the correlations between the time series of the solutions was constructed with the final 11-factor solution. Based on these considerations, we concluded that the source apportionment solution with 11 factors was the optimal solution.
3.2.2 EESI-TOF-MS factors: primary organic aerosols (POAs)
Figure 2a shows the time series of the five EESI-TOF-MS factors attributed to primary organic aerosol: COAEESI, LABB1EESI, LABB2EESI, CS-OAEESI, and EVENTEESI. Also shown are relevant ancillary measurements, including AMS PMF factors and meteorological parameters. Figure 2b shows the corresponding factor mass spectra, colored by the number of nitrogen atoms. A discussion of each factor follows. Figure 3a shows the diurnal patterns of the LABBEESI factors, as well as COAEESI and COAAMS.
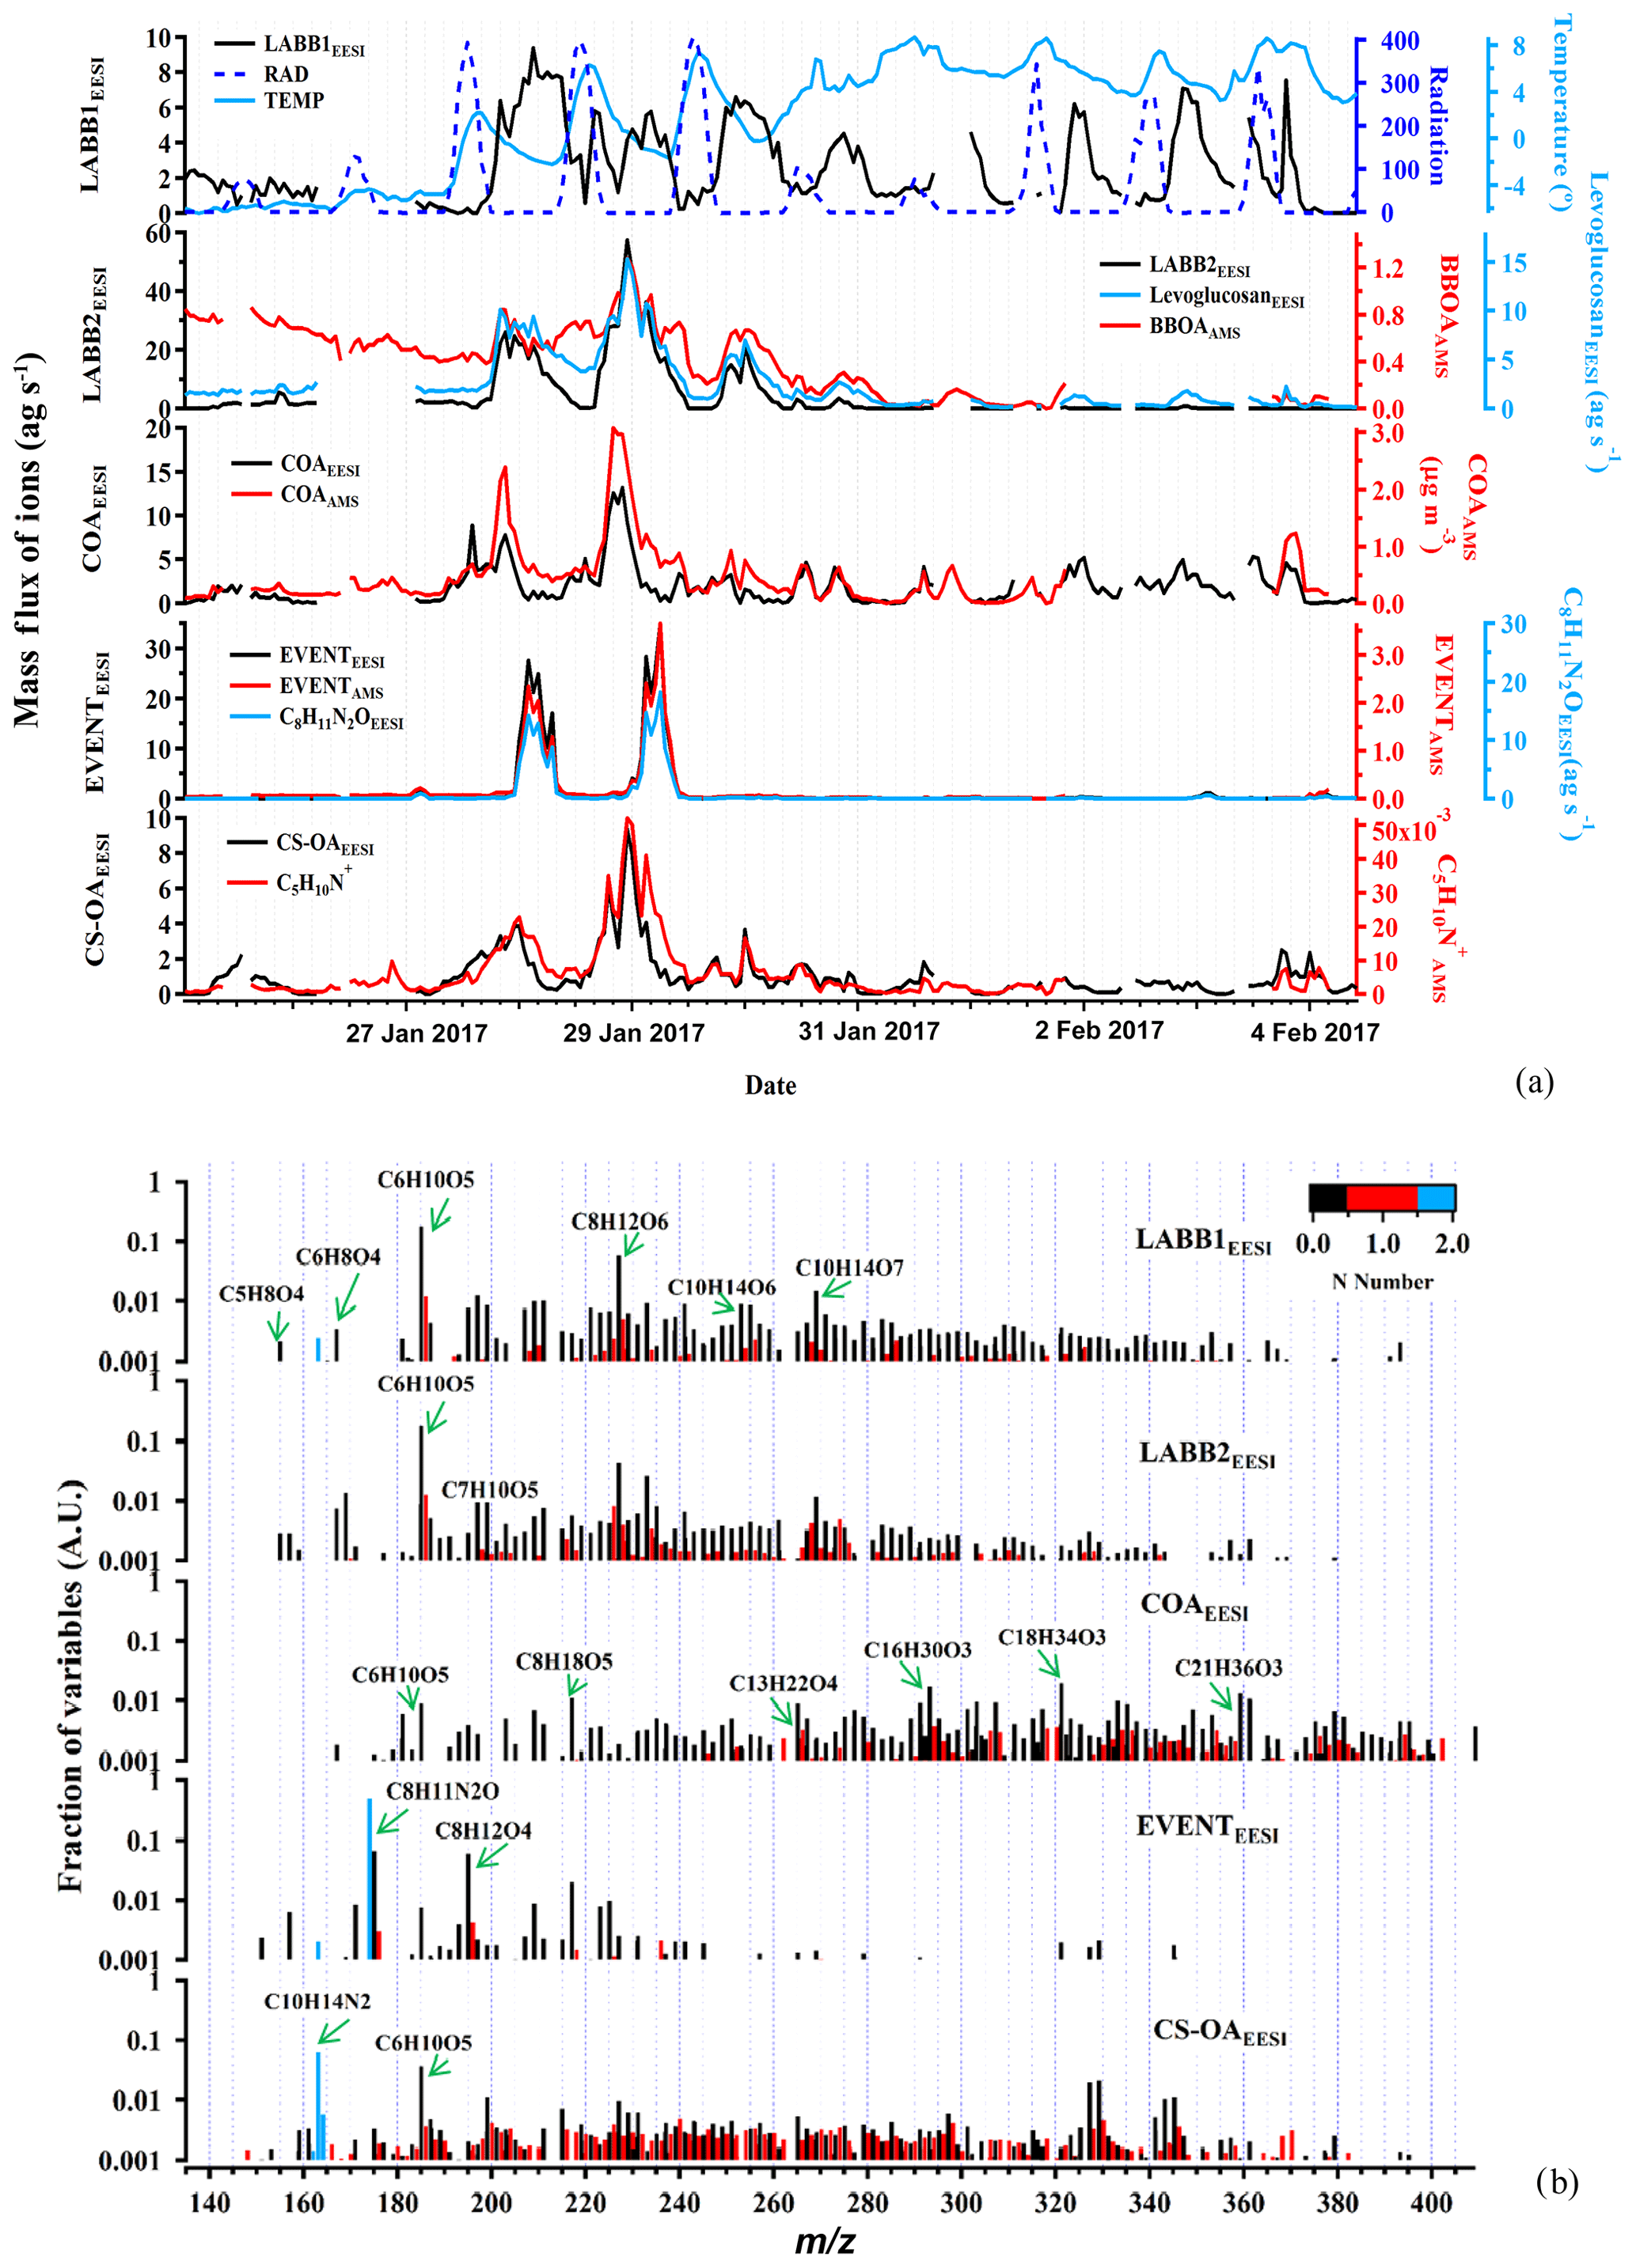
Figure 2Time series of the POA factors retrieved from EESI-TOF-MS PMF analysis, along with ancillary data (a), and corresponding factor profiles (b). For all y axes, EESI-TOF-MS data are shown in mass flux (ag s−1), AMS data are shown in micrograms per cubic meter, and other units are given. Factor profiles are molecular weighted and are normalized such that the sum of each profile is 1.
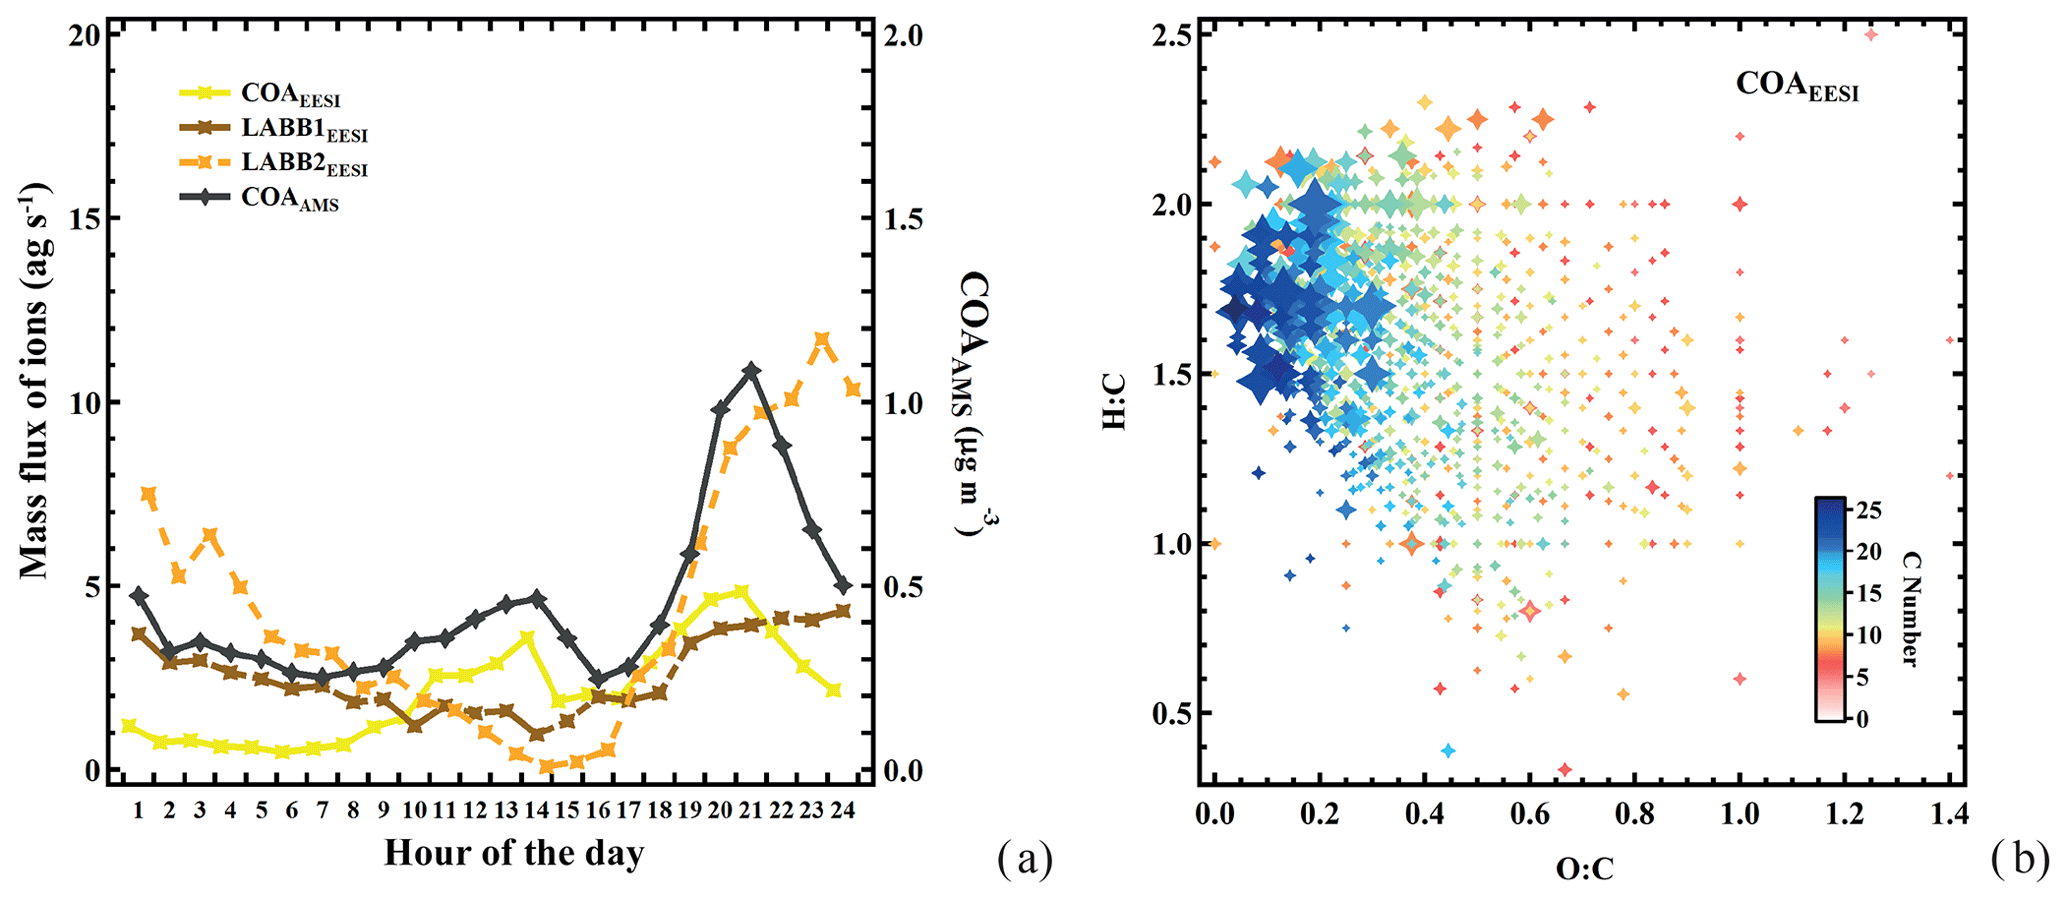
Figure 3(a) Diurnal cycles of the EESI-TOF-MS less aged biomass burning and cooking factors, together with AMS cooking. (b) Van Krevelen plot (atomic H:C vs. O:C of each neutral compound) for the COAEESI factor mass spectrum, with points sized by the fraction of each neutral compound apportioned to COAEESI and colored by number of carbon atoms.
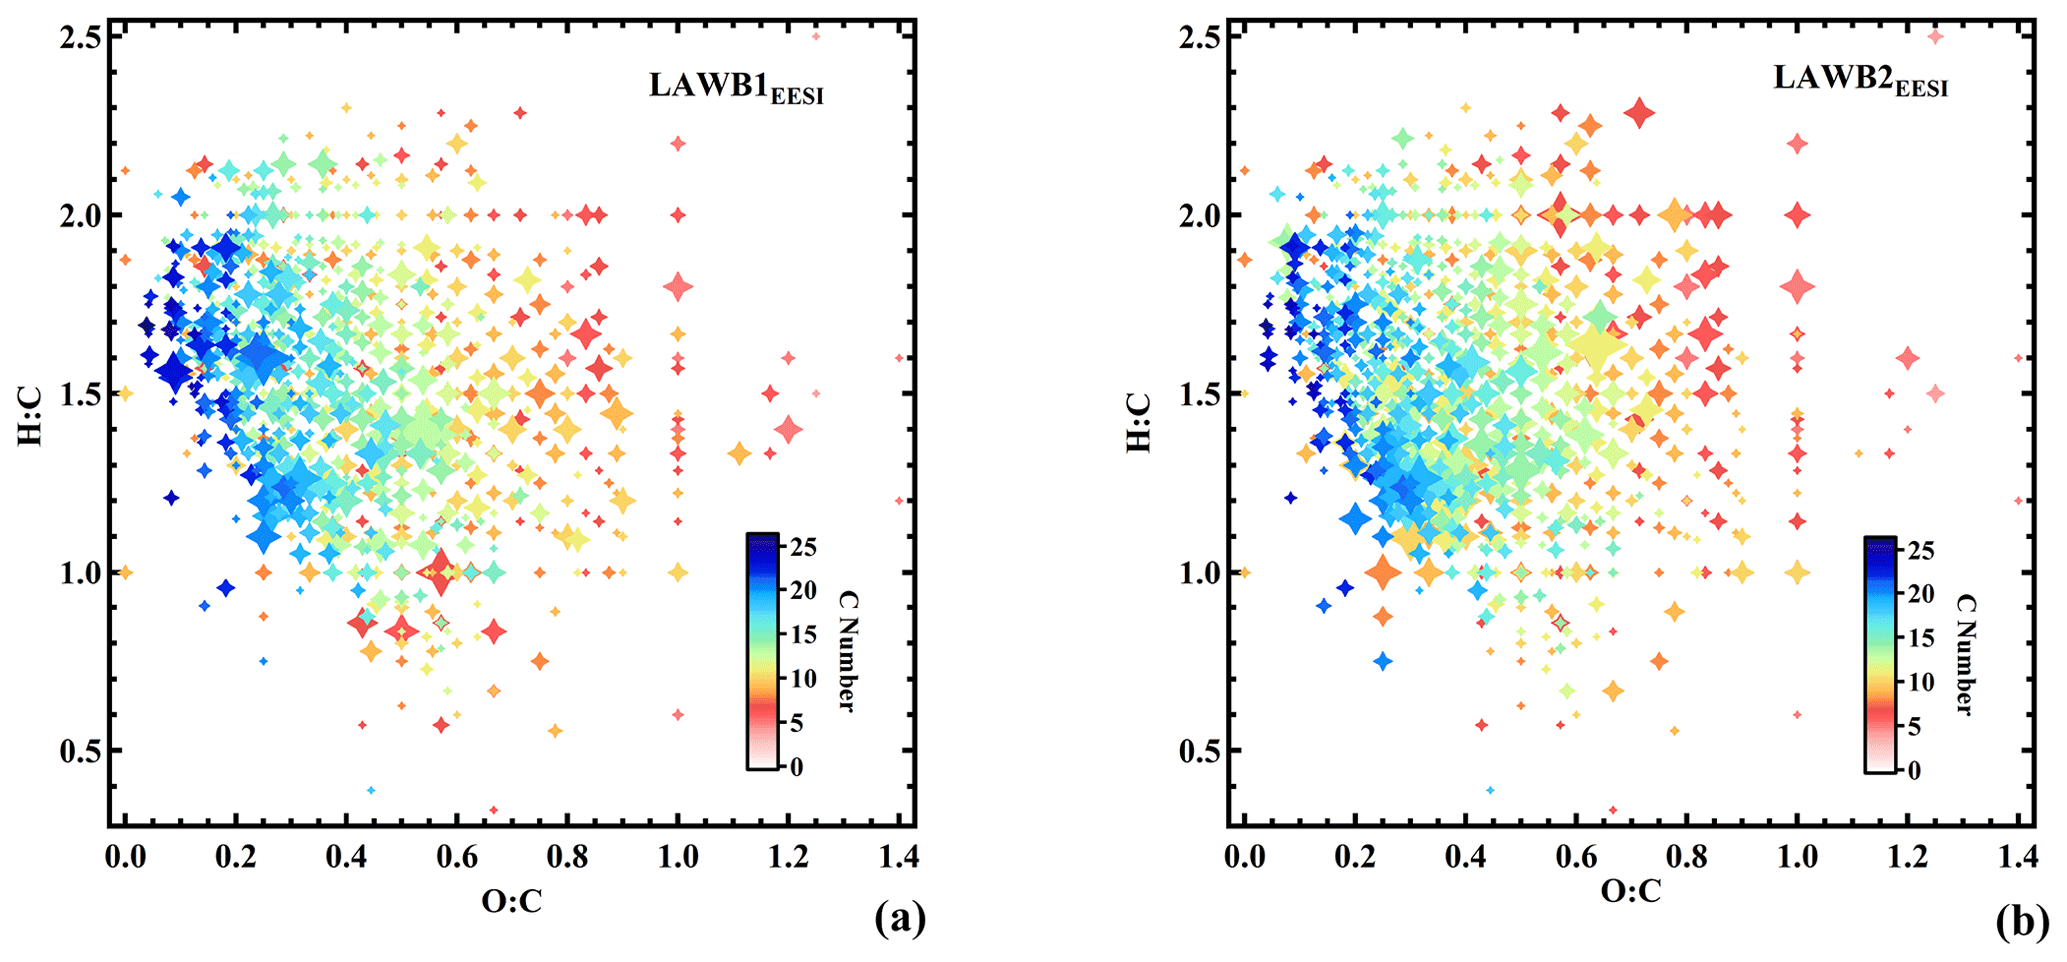
Figure 4(a, b) Van Krevelen plot (atomic H:C vs. O:C ratio) of the LABB1EESI and LABB2EESI factor mass spectra. Points are sized by the fraction of each neutral compound apportioned to LABB1EESI and LABB2EESI and colored by number of carbon atoms.
Less aged biomass burning (LABB1EESI and LABB2EESI)
The LABB factors are both enhanced at night, consistent with domestic heating activities. Considering the full campaign time series (Fig. 2a), this repeating pattern, opposed to solar radiation, is evident for LABB1EESI, while the time series of LABB2EESI is driven by intense events (∼6.5 times higher than LABB1EESI) during two nights: from 18:00 on 27 January to 08:00 on 28 January, and from 18:00 on 28 January to 08:00 on 29 January. As shown in Fig. 2b, both factor profiles are dominated by C6H10O5 and C8H12O6. C6H10O5 is attributed primarily to levoglucosan, which is a well-established tracer for biomass burning. The mass spectrum features of both factors are very similar to less aged biomass burning emissions measured directly from a domestic biomass combustion appliance in the PSI smog chamber (Bertrand et al., 2018). Figure 4a and b show Van Krevelen plots (i.e., atomic ratios H:C as a function of O:C) for LABB1EESI and LABB2EESI, respectively, with points colored by the number of carbon atoms and sized by the fraction of each neutral compound apportioned to the respective factor. Both LABB1EESI and LABB2EESI are dominated by compounds with low H:C (1.04) and low O:C (0.35, excluding the sugars C6H10O5 and C8H12O6, which exhibit high variability; Table S1 in the Supplement), suggesting a strong contribution from primary or slightly aged aromatics. The wind regression of these two factors is shown in Fig. S7. LABB1EESI does not correspond to a specific wind direction, in contrast, LABB2EESI originates predominantly from a single wind direction, excluding the smaller sources to the SE on the third day. Figure S8 compares the BBOAAMS factor (Fig. 2a) with LABB1EESI, LABB2EESI, and the sum of LABB1EESI+LABB2EESI, with R values of 0.59, 0.79, and 0.82, respectively. The correlation is generally good except during the first part of the campaign (25 to 27 January), which as discussed later, relates to the complexity of wood burning classification between the EESI-TOF-MS and AMS. The correlation of BBOAAMS with either LABB2EESI or LABB1EESI+LABB2EESI is rather high at night (R=0.59 to 0.82), while the concentrations of the LABBEESI factors are consistently lower than the one of BBOAAMS during the day. We assign the high correlation of LABB2EESI with BBOAAMS to the high abundance of levoglucosan, which drives the variation in f60 in the AMS. Some specific features of BBOAAMS do not appear in any LABB factor because less aged and more aged biomass burning OA are not unambiguously separated in the AMS.
Cooking-related OA (COAEESI)
The COAEESI and COAAMS factor time series are strongly correlated (R=0.88), as shown in Fig. 2a. The diurnal variation in the COAEESI is also similar to COAAMS, with strong peaks at lunch- and dinnertime (Fig. 3a). In addition to this diurnal pattern, both COAEESI and COAAMS are significantly elevated during two periods: from 18:00 on 27 January to 01:00 on 28 January (Friday night), and from 18:00 on 28 January to 01:00 on 29 January (Saturday night). These periods occur on the same evening as the unknown special event giving rise to the EVENTAMS and EVENTEESI factors, but are slightly offset in time, with the COA factors peaking approximately 4 h earlier. The distinct contribution from the COAEESI factor is due in part to the location of several restaurants within a 100 m radius, including one adjacent to the site.
As shown in Fig. 2b, the COAEESI mass spectrum is unique in having most of the mass at ions with higher m∕z. Several of the dominant ions can be attributed to fatty acids and alcohols, which are associated with cooking emissions and oils. For example, C13H22O4 (dibutyl itaconate), C16H30O3 (2-oxo-tetradecanoic acid), and C18H34O3 (ricinoleic acid) are prominent, and contribute 0.89 %, 1.7 %, and 2.0 %, respectively, of the total mass spectrum. Figure 3b shows a Van Krevelen plot of the COAEESI factor mass spectrum, with points sized by the fraction of each neutral compound apportioned to COAEESI and colored by the number of carbon atoms. The dominant contribution of ions with higher carbon number (C13–C25) and high H:C ratio (greater than 1.5) but low O:C ratio (below 0.2) indicates that these compounds are consistent with fatty acids or alcohols rather than aromatic-derived compounds.
Special event (EventEESI)
The time series of EVENTEESI is highly correlated with EVENTAMS (R=0.99, Fig. 2a). Both factors are near zero except for two intense events beginning at approximately midnight and lasting till the early morning on 28 and 29 January, supporting the hypothesis of a unique event as opposed to variation in BBOA. The Zurich game festival was taking place on the weekend (the event is apparently held in a building on the SW side of the courtyard), though no human activities in the immediate vicinity of the sampling inlet were evident by inspection of the on-site camera. The EESI-TOF-MS factor mass spectrum is dominated by an ion at m∕z 174.08, tentatively assigned to C8H11N2O. However, the EESI-TOF-MS does not provide structural information and to our knowledge no compound with this formula has been reported as a major constituent of an atmospheric emission source, preventing its use as a diagnostic tracer. Other significant ions are C8H12O4 and C8H18O5. The C8H12O4 ion likely represents 1,2-cyclohexane dicarboxylic acid diisononyl ester, a plasticizer for the manufacture of food packaging, belonging to the group of aliphatic esters from a chemical point of view. This indicates that the source may be from food plastic burning in a nearby restaurant.
Cigarette-smoke-influenced OA (CS-OAEESI)
Cigarette-smoke-influenced OA (CS-OAEESI) is a constrained factor, based on a reference profile retrieved from higher-order PMF solutions as described in Sect. 3.2.1. The mass spectrum of CS-OAEESI is dominated by the C10H14N2H+ ion (Fig. 2b). This ion is the only ion (out of 892 ions) that does not appear as an adduct with Na+. Instead, the observed molecular formula corresponds to that of nicotine with an extra hydrogen. As a reduced nitrogen compound, nicotine likely forms a stable ion by abstracting a hydrogen from water, leading to the observed cation. However, the time series and the mass flux of this ion should be interpreted with caution: because it is formed by a different ionization pathway than the majority of the spectrum, its relative sensitivity may be significantly different from that of the other ions. Additionally, we have not characterized such non-Na adducts in terms of ion suppression or matrix effects and cannot rule out a nonlinear response to mass. However, the comparison of the CS-OAEESI factor with AMS PMF results and individual ions discussed below suggests that such nonlinear effects are not significant.
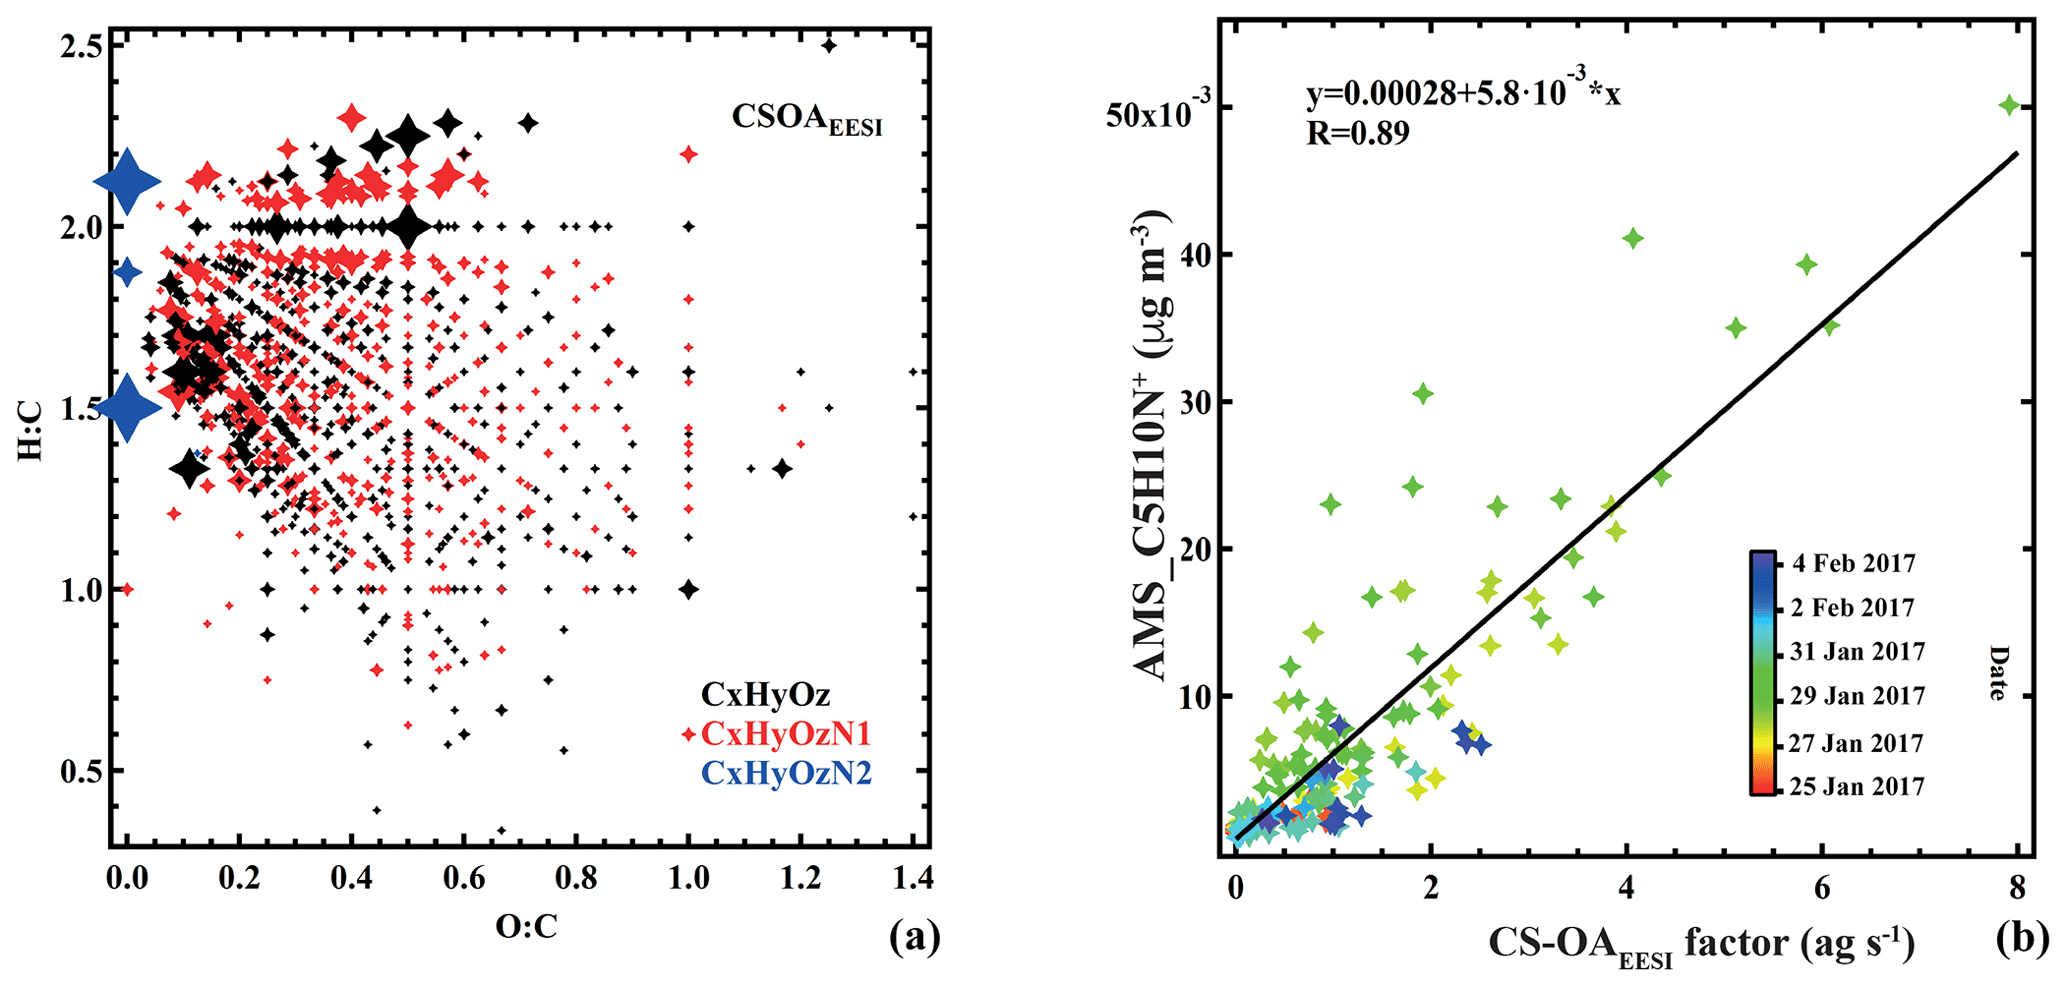
Figure 5(a) Van Krevelen plot (atomic H:C vs. O:C ratio) of the cigarette smoking (CS-OAEESI) factor mass spectrum. Points are sized by the fraction of each neutral compound apportioned to CS-OAEESI. Colors denote CxHyOz, CxHyN1Oz, and CxHyN2Oz groups. (b) Comparison of CS-OAEESI and , colored by time.
Oxidized organic nitrogen species such as CxHyN1Oz (34.9 %) and CxHyN2Oz (6.8 %) are also significant in the CS-OAEESI factor, as shown in Figs. 2b and 5a. CS-OAEESI is only slightly oxygenated () and has an H:C ratio of approximately 1.51 (Table S1). The CS-OAEESI time series exhibits two large evening peaks (27 and 28 January). These peaks are likely associated with cigarette smoking outside the nearby restaurants. A high correlation is observed between the time series of CS-OAEESI and the AMS C5H10N+ ion (R=0.91, Fig. 5b), which has been proposed as a tracer for nicotine (Struckmeier et al., 2016).
3.2.3 EESI-TOF-MS factors: secondary organic aerosols
Here we discuss the EESI-TOF-MS SOA factors in three groups: (1) more aged wood-burning-related OA (MABB_LOWEESI, MABB_TRANSEESI, and MABB_HIGHEESI); (2) non-source-specific SOA (SOA1EESI and SOA2EESI); and (3) high-nitrogen-content SOA (NSOAEESI). Factor mass spectra for these factors are shown in Fig. 6a, with the spectra colored by the number of N atoms and normalized such that the sum of the peaks in each spectrum is 1. Figure 6b shows a stacked time series of all six EESI-TOF-MS SOA factors, such that the sum of the stacked plot represents the total EESI-TOF-MS mass flux attributed to SOA. For comparison, the time series of the estimated AMS SOA is shown, calculated as LO-OOAAMS+MO-OOAAMS. NOAAMS is excluded from this calculation due to the contribution from primary cigarette smoke as discussed above. The total EESI-TOF-MS SOA and AMS SOA estimates are in general well-correlated (R=0.90), even though the EESI-TOF-MS mass flux is proportionally lower during the first few days of the study.
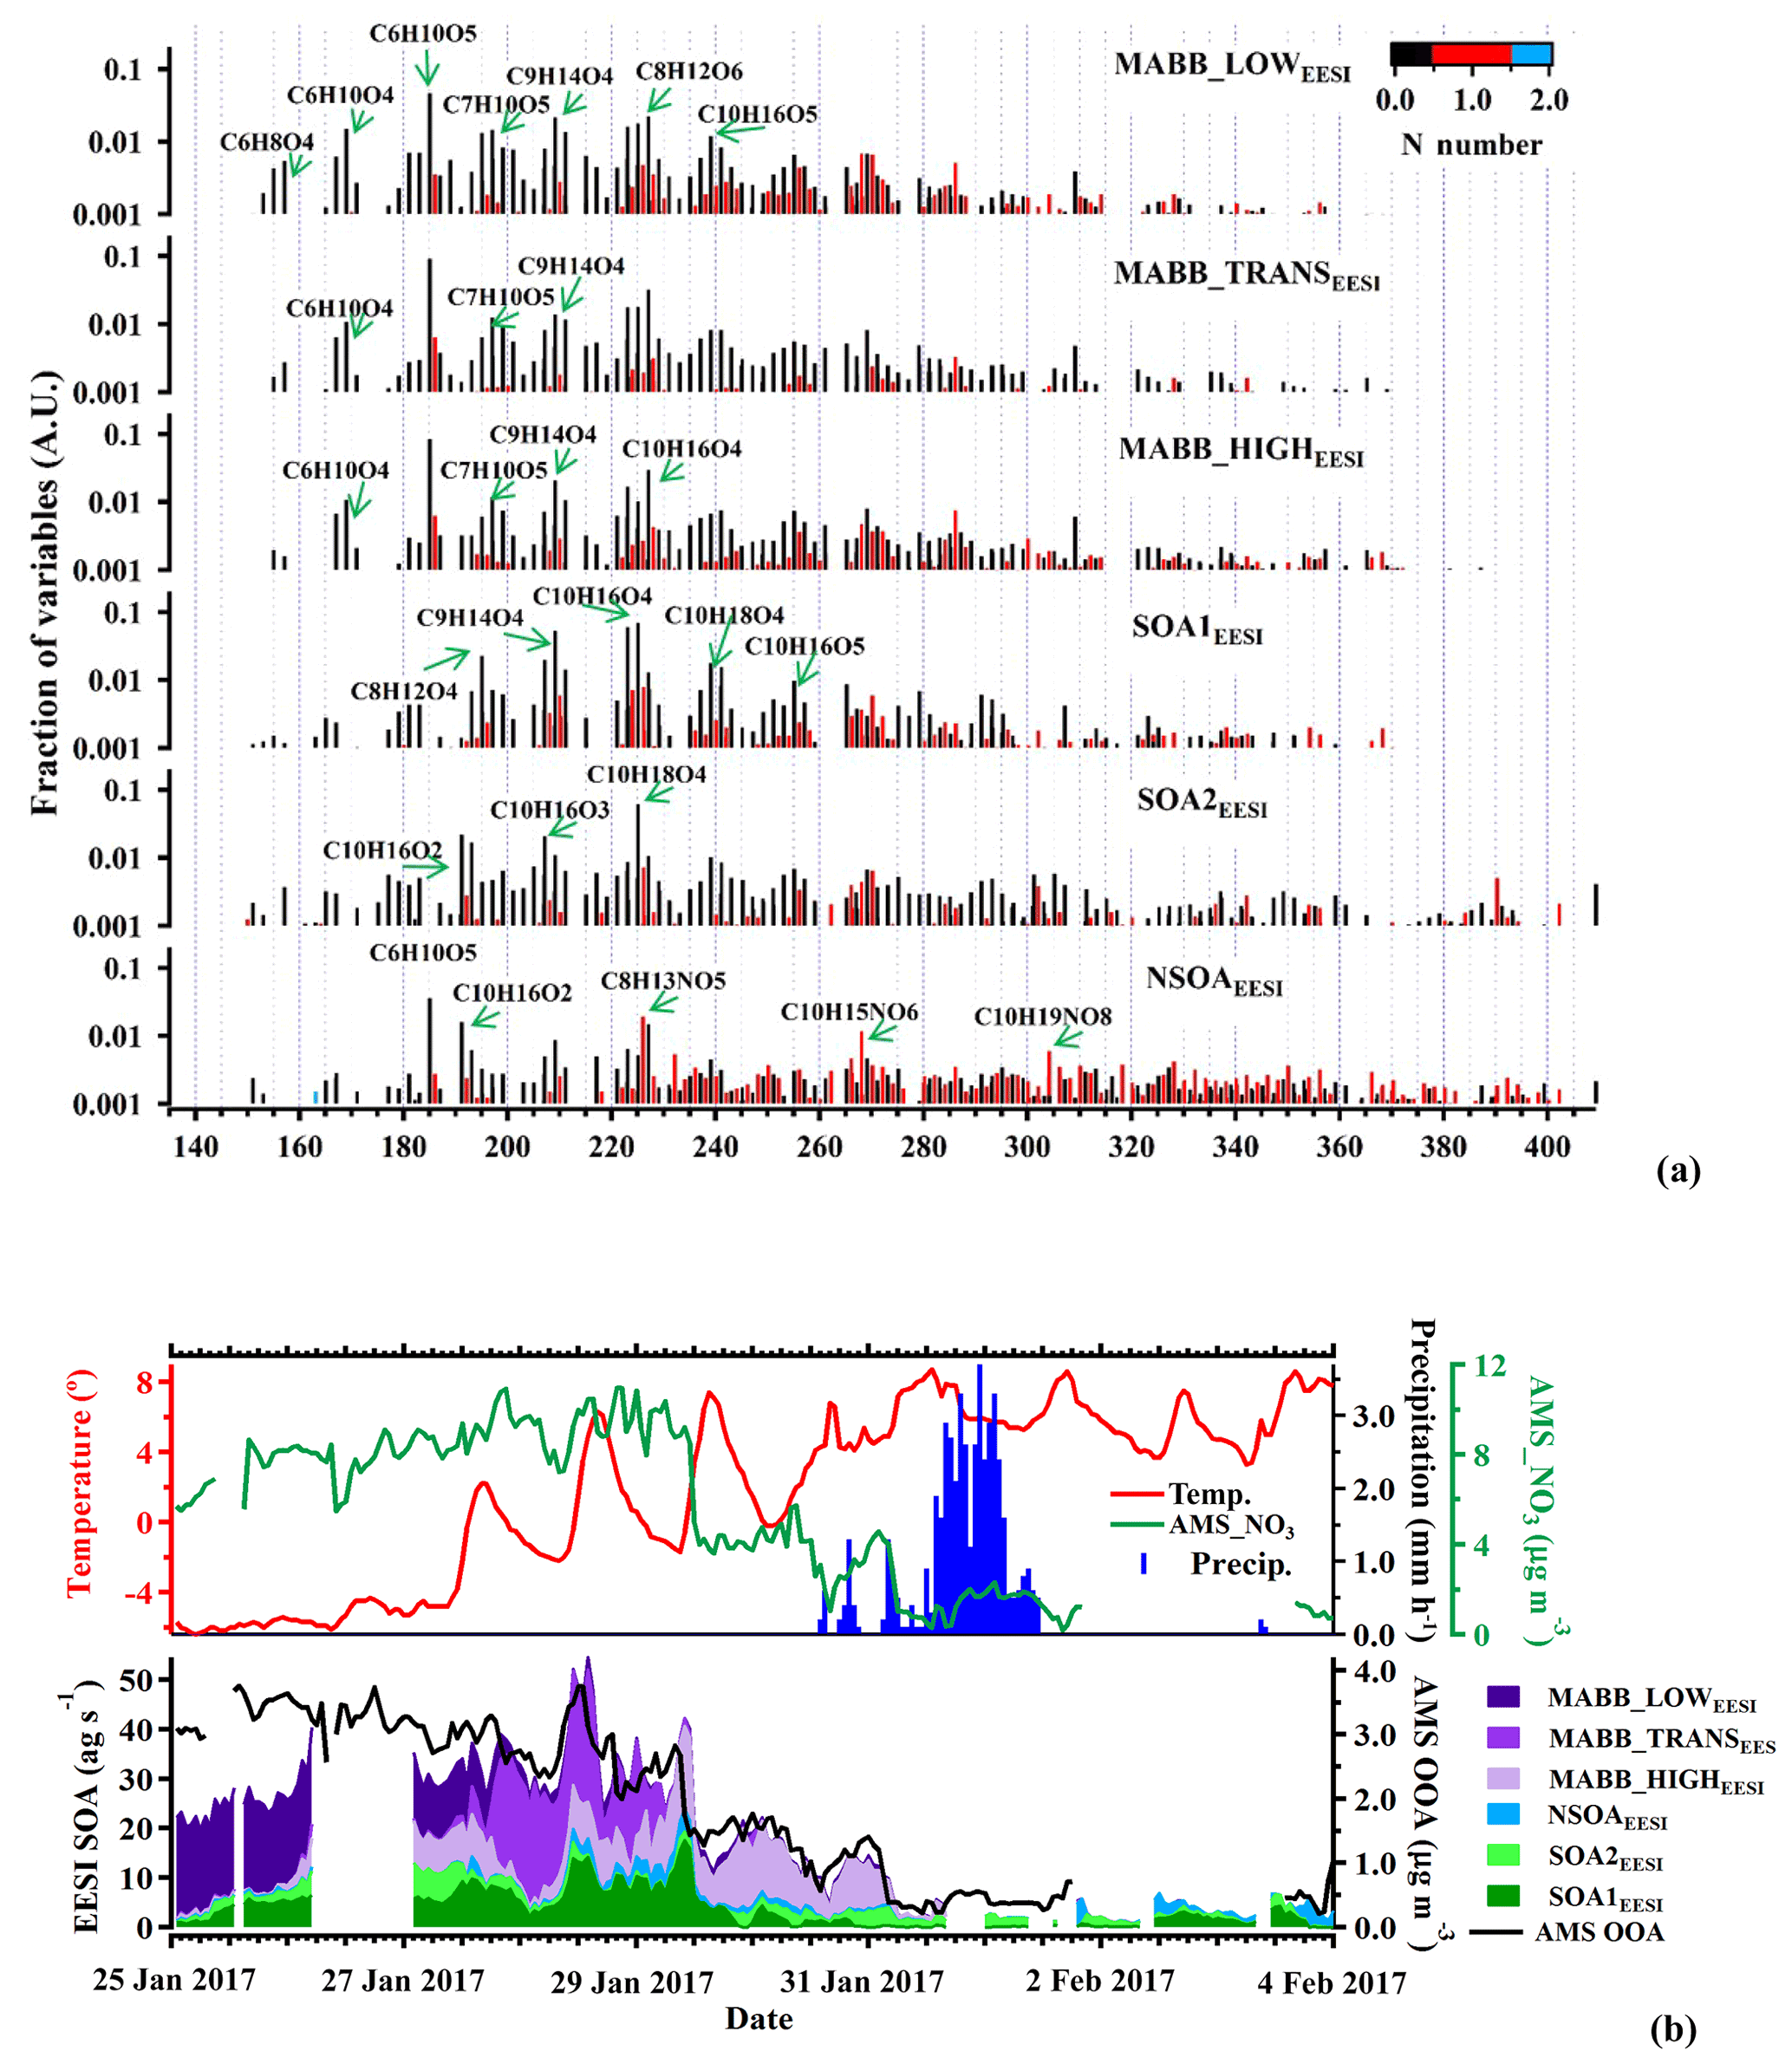
Figure 6Factor profiles (a) and stacked time series (b) of the six EESI-TOF-MS SOA PMF factors, together with AMS OOA. Panel (b) also shows meteorological data. All EESI-TOF-MS data are plotted in mass flux (ag s−1), AMS data are in micrograms per cubic meter, and other units are included. Factor profiles (b) are molecular weighted and are normalized such that the sum of each profile is 1.
More aged biomass-burning-related factors (MABB_LOWEESI, MABB_TRANSEESI, and MABB_HIGHEESI)
Three more aged biomass burning (MABB) factors are identified in this study: MABB_LOWEESI, MABB_TRANSEESI, and MABB_HIGHEESI. Each MABBEESI factor is enhanced relative to the others during different parts of the campaign, which correspond to changes in both the daily temperature cycle and wind direction. As shown in Fig. 6b, the coldest part of the study, period 1, occurs from 25 to 27 January (mean −5.4 ∘C, min −6.4 ∘C, max −2.2 ∘C). During this period, MABB_LOWEESI contributes 84 % of the total MABB (MABB_LOW). From 27 to 29 January, period 2, temperature increases (mean 1.4 ∘C, min −2.2 ∘C, max 7.4 ∘C), and the MABB_TRANSEESI factor constitutes the dominant MABBEESI fraction (65 %). Period 3, from 29 January to the campaign end on 4 February, corresponds to higher temperatures (mean 5.7 ∘C, min 0.8 ∘C, max 8.7 ∘C), and the MABBEESI fraction is dominated by MABB_HIGHEESI (90 %) until a substantial precipitation event beginning on 31 January, after which relatively clean air is observed for the remainder of the campaign. Figure 7 shows the source-specific wind sectors determined by SWIM (see Sect. 2.4) for the three MABB factors. This analysis assigns the three factors to distinct wind vectors: NNE for MABB_LOWEESI, NNW for MABB_TRANSEESI, and SE for MABB_HIGHEESI. Because each factor is predominantly observed during a single time period, it is difficult to assess the relative importance of temperature vs. source region for these three factors.

Figure 7Wind analysis results using the SWIM model on the concentrations of MABB_LOWEESI, MABB_TRANSEESI, and MABB_HIGHEESI. (a) Wind direction combined with frequency; wind speed is in meters per second. (b) The wind speed and wind direction.
As shown in Fig. 6a, all three MABBEESI factor mass spectra are qualitatively similar, with many of the same ions enhanced. These spectra are also similar to the mass spectrum of aged biomass burning emissions retrieved from a smog chamber experiment (Bertrand et al., 2018). For both the MABBEESI and chamber spectra, the major ions, C7H10O5, C9H14O4, and C8H12O6, are common. The main difference between the EESI-TOF-MS factors and the chamber mass spectrum is that the chamber data show a higher fraction of signal at lower m∕z. This is likely due to the higher concentrations used during the chamber experiments, causing increased partitioning of semi-volatile compounds to the particle phase. MABB_LOWEESI also exhibits somehow enhanced intensities at lower m∕z compared to the other MABBEESI factors. As MABB_LOWEESI is dominant during the coldest period 1, the MABB_LOWEESI factor is possibly separated from the other MABBEESI factors due to partitioning of semi-volatile material to the particle phase due to colder temperatures.
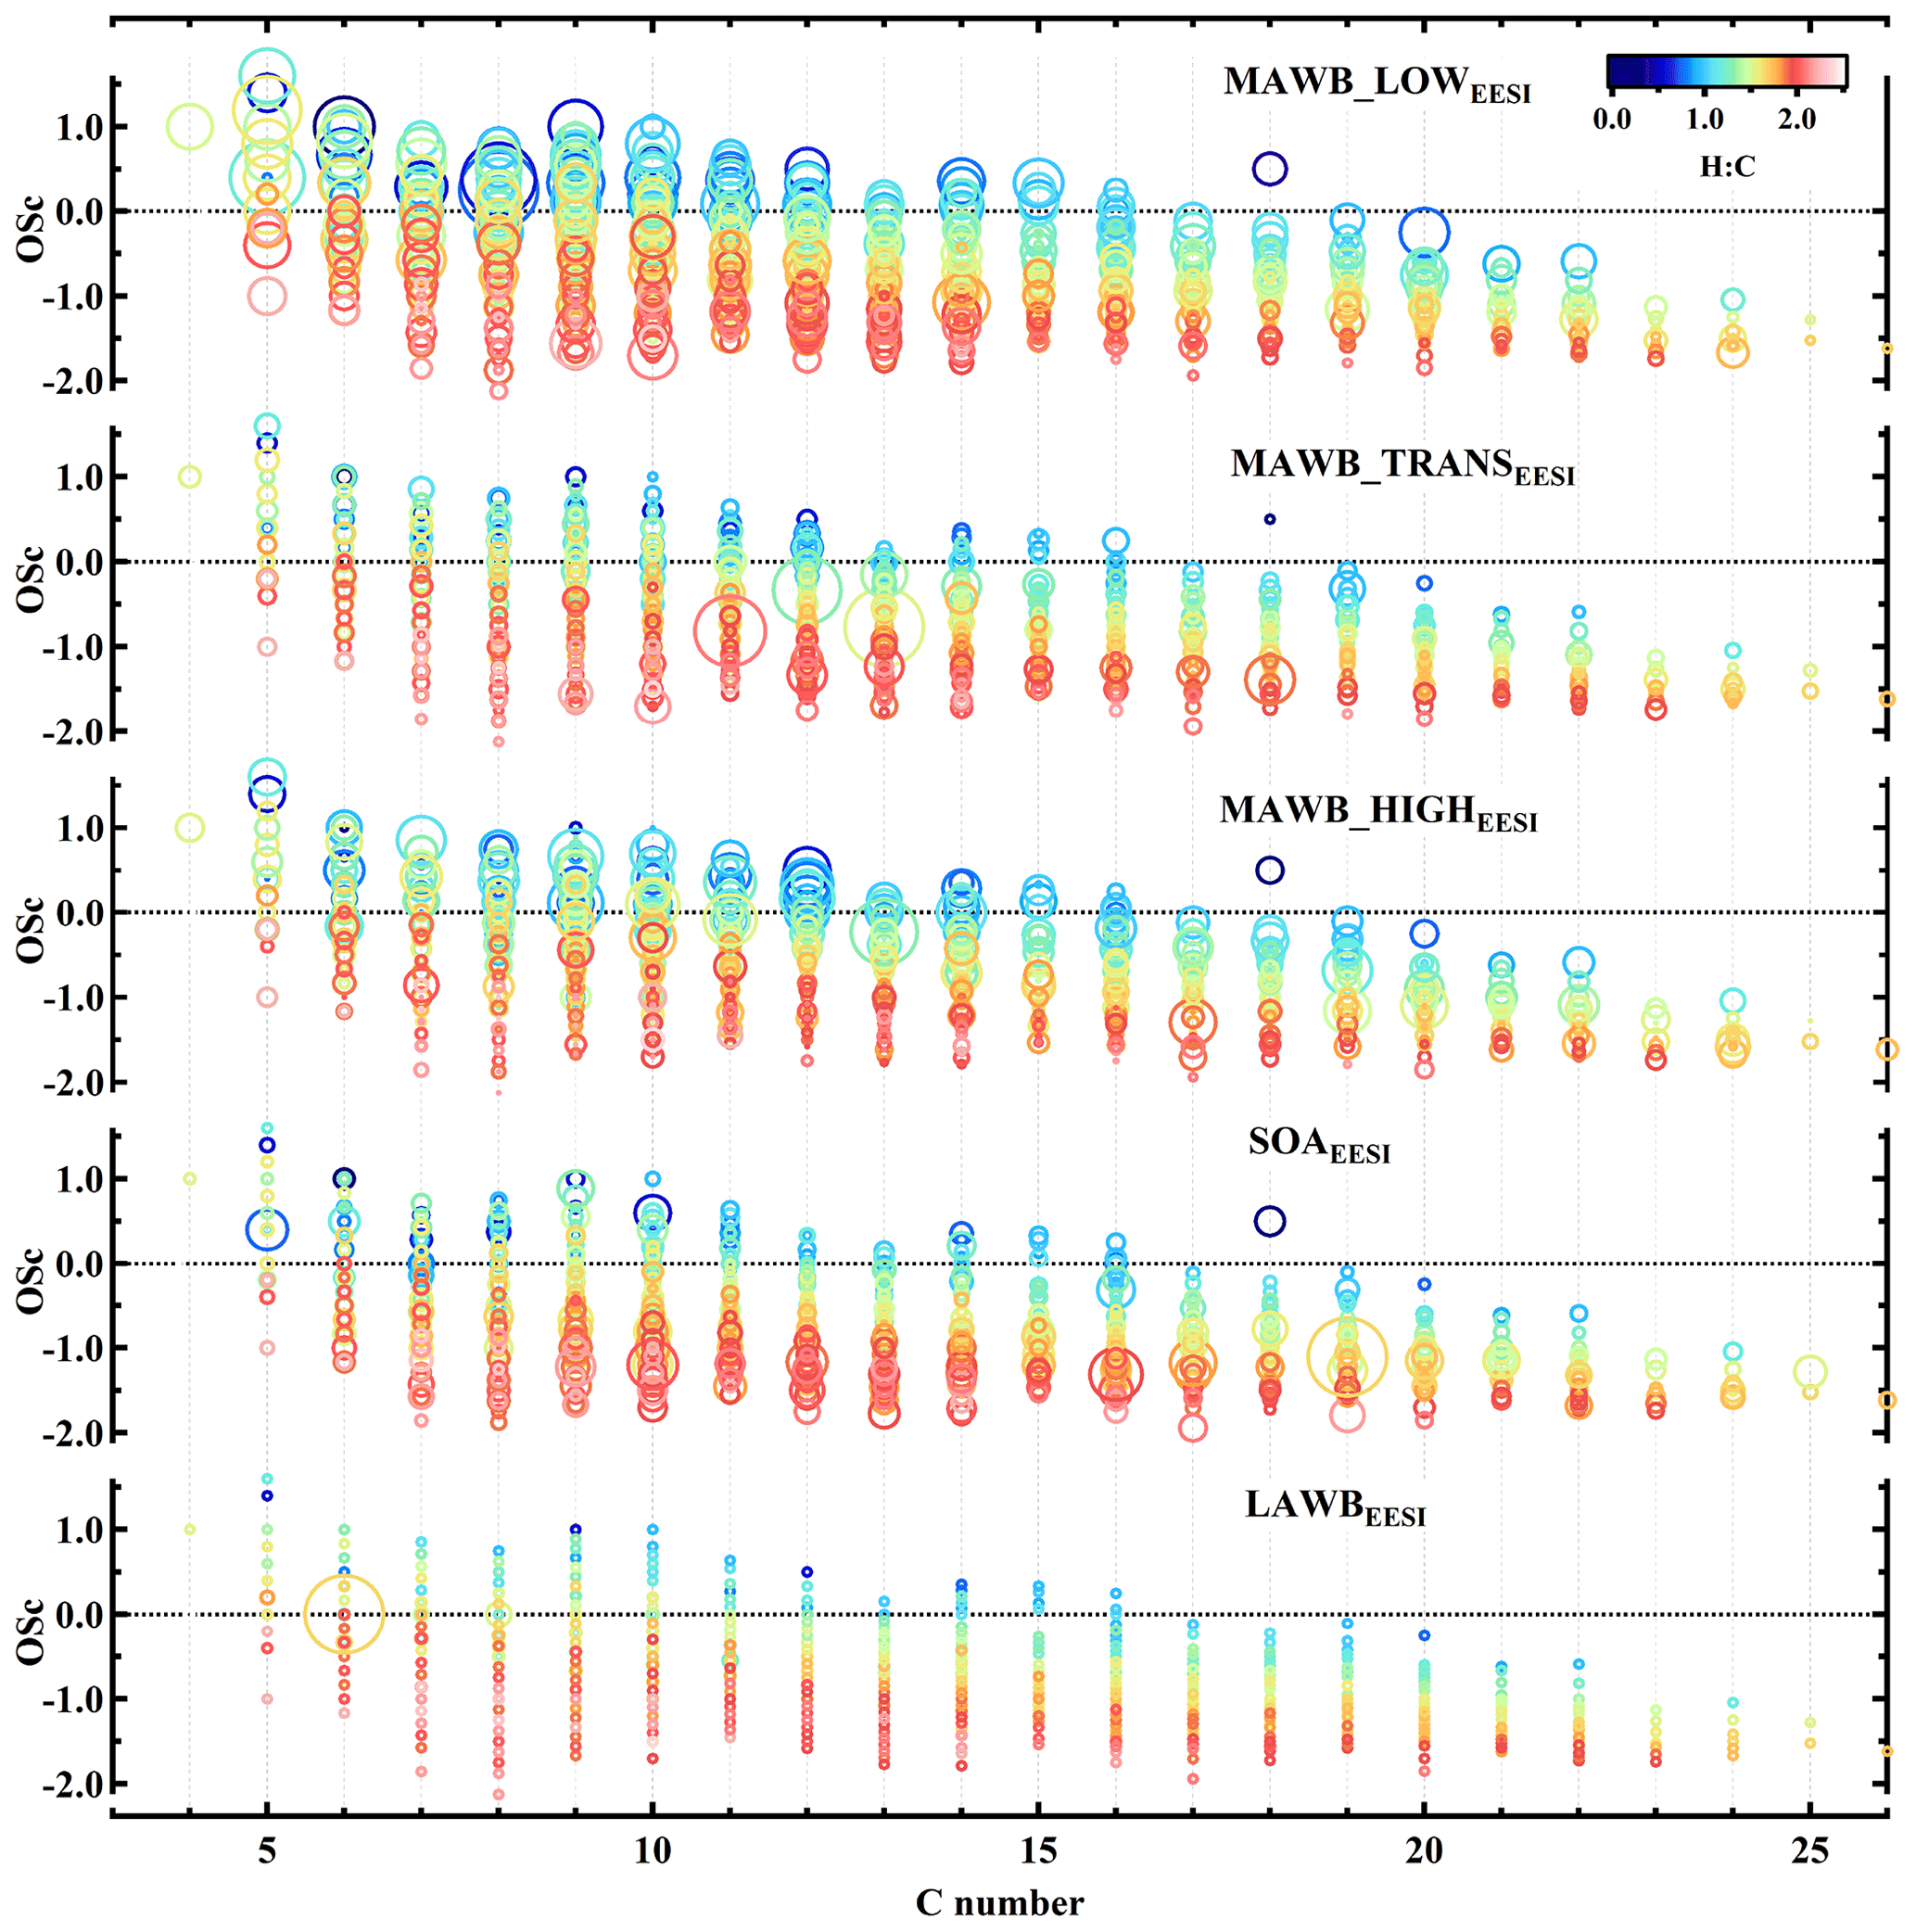
Figure 8Carbon oxidation state (OSc) as a function of number of carbon atoms for the factors, more aged biomass burning_low temperature, more aged biomass burning_transition, more aged biomass burning_high temperature, secondary organic aerosol, and less aged biomass burning. Points are colored by atomic H:C ratio and sized by the fraction of each ion apportioned to the designated factor.
Further insight into the composition trends across the MABBEESI factors is obtained through Fig. 8, which represents the three MABBEESI mass spectra as the carbon oxidation state (OSc) (Kroll et al., 2011) of each ion as a function of the carbon number (nc). Data points are colored by the H:C ratio and sized by the fraction of each ion apportioned to the designated factor. The figure shows that MABB_LOWEESI is enhanced in ions with low nc, consistent with condensation of semi-volatile OA (C5H6O4, C8H6O4, C5H8O7) at low temperature. Otherwise, all three MABBEESI factors are rather similar. Figure 8 also shows the OSc of non-MABBEESI (weighted average of SOA1EESI+SOA2EESI) and LABBEESI (weighted average of LABB1EESI and LABB2EESI) factors. Obviously, the non-MABBEESI and LABBEESI factors are less oxidized than the MABB factors, with lower OSc.
Other SOA factors (SOA1EESI and SOA2EESI)
The mass spectra of SOA1EESI and SOA2EESI are qualitatively similar to factors retrieved from PMF analysis of EESI-TOF-MS data from Zurich during summer, when monoterpenes are the dominant SOA precursors (Stefenelli et al., 2019b, Fig. S9). Major ions include C8H12O4, C9H14O4, C10H16O4, C10H18O4, C10H16O5, C10H16O2, C10H16O3, and C10H18O4, separately. In contrast to the MABBEESI factors, the SOAEESI factors have a negligible contribution from levoglucosan (C6H10O5). Approximately 57 % of the total C10 ion signal is apportioned to the SOAEESI factors. Figure 9a and b show the atomic ratio of H:C as a function of O:C for the two SOAEESI factors. These H:C ratios are higher than typically observed from the oxidation of aromatic emissions and are instead consistent with monoterpene oxidation. The Van Krevelen plots show clear differences between these two factors: SOA2EESI is less oxygenated than SOA1EESI with a lower O:C ratio and lower H:C ratio. The time series of SOA1EESI shows a higher contribution during the periods 1 and 2, while SOA2EESI has a more regular cycle contribution during daytime (Fig. 6b). Since we have clear evidence that these EESI-retrieved factors are related to secondary organic aerosol, we call them SOAEESI, in contrast to the OOAAMS factors, where this evidence is less clear. A more detailed comparison between the EESI-TOF_SOA factors and the AMS_OOA factors is found in Sect. 3.5.
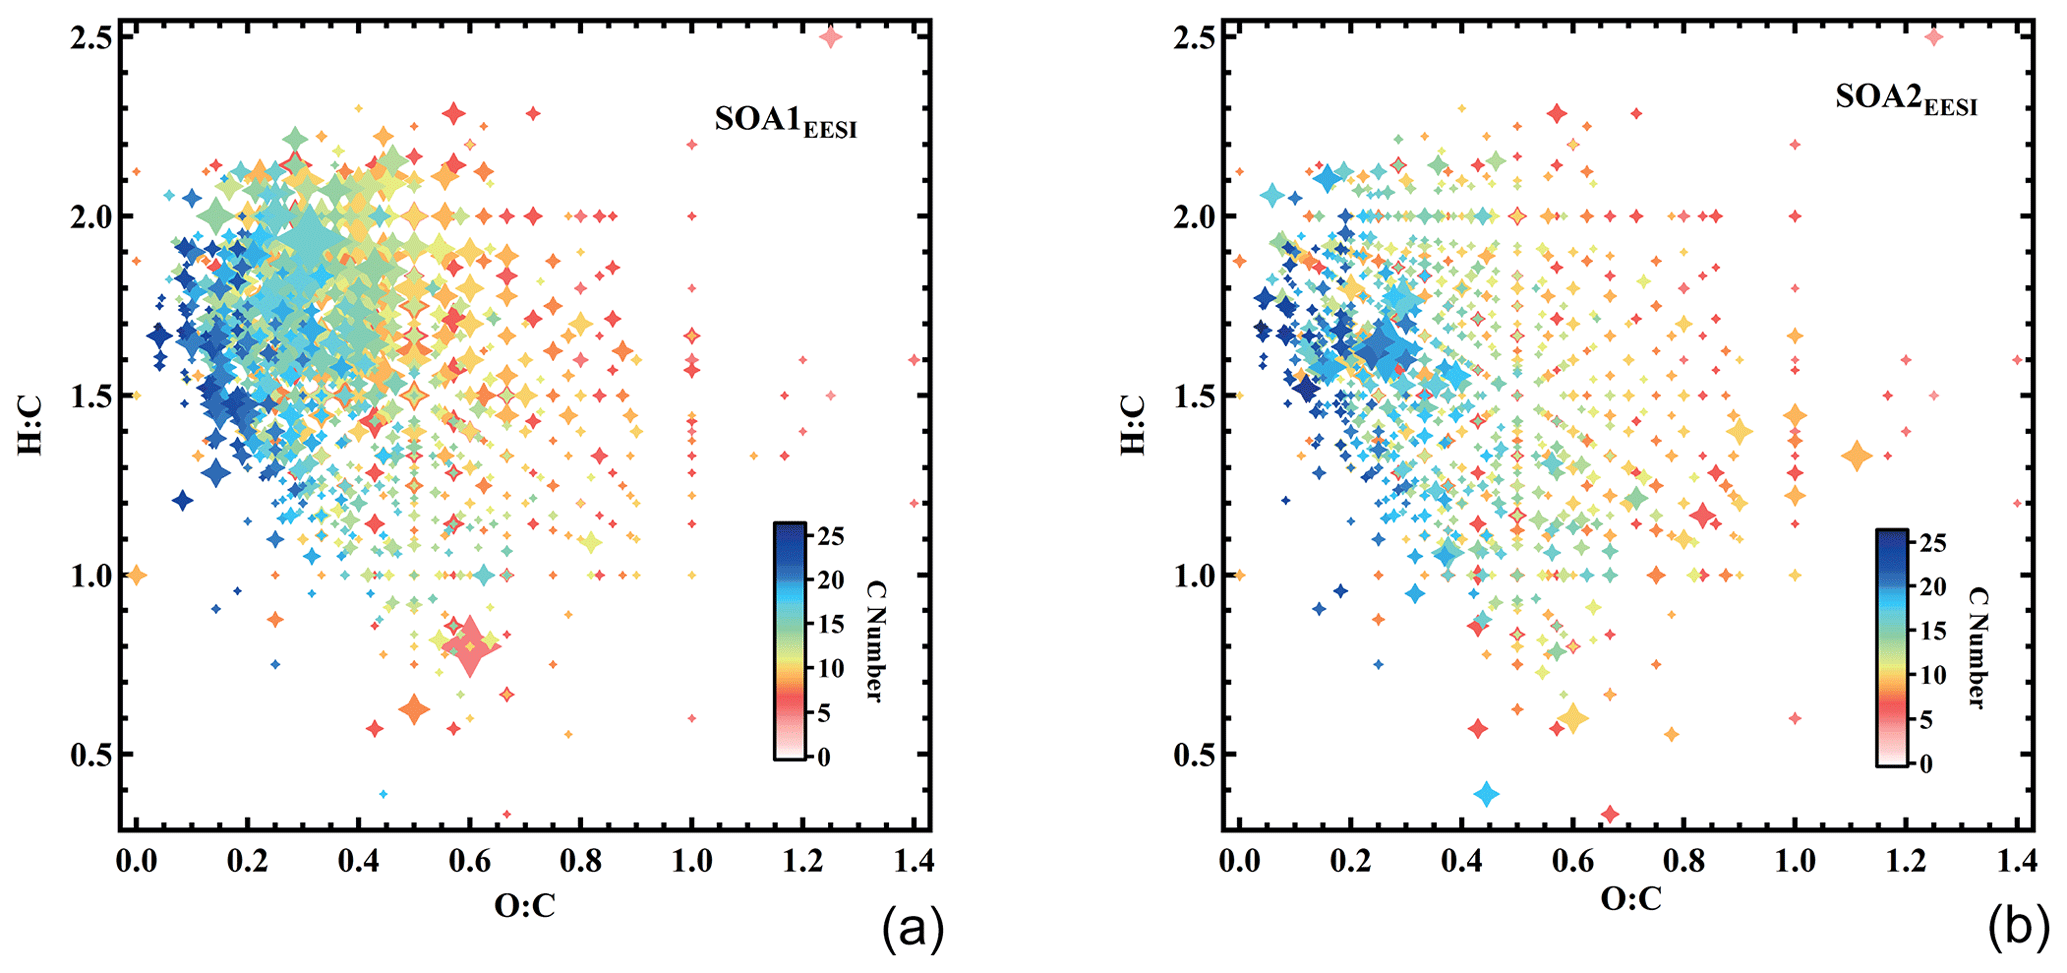
Figure 9Van Krevelen plots (atomic H:C vs. O:C) for the SOA1EESI and SOA2EESI factor mass spectra. The points are sized by the fraction of each neutral compound apportioned to SOA1EESI and SOA2EESI and colored by the number of carbon atoms.
Nitrogen-containing SOA factor (NSOAEESI)
As mentioned in Sect. 3.1, the EESI-TOF-MS source apportionment also resolves a nitrogen-containing SOA factor (NSOAEESI). NSOAEESI is dominated by highly oxygenated organonitrate molecules, including C8H13NO5, C10H15NO6, and C10H19NO8. Ions like C6H10O5, C10H16O2, and C8H12O6 are comprising another fraction of the NSOAEESI signal, but are not unique to the NSOAEESI factor and rather spread over many other factors. The significant contribution of organonitrates results in an N:C ratio of 0.04 and suggests a secondary origin for this factor. Therefore, we call it NSOAEESI, in contrast to NOAAMS for which the primary/secondary origin is less certain. The time series of the factor is quite unique, showing maximum mass flux at the end of this campaign with the highest peak in the night of 3 to 4 February and a smaller peak during the night of 28 to 29 February.
Figure S10 shows a comparison of the NSOAEESI and CS-OAEESI time series with the CHON ions from the EESI and CHN ions from the AMS, respectively. The group of EESI_CHON ions shows the same temporal variation as the NSOAEESI factor (Fig. S10) while the AMS_CHN group is more correlated to the primary organic group.
3.3 Analysis of marker ions
Laboratory, as well as offline and semicontinuous field studies have identified a number of tracer molecules that are useful for the investigation of primary and secondary OA from various sources, including biomass burning. The real-time and in situ measurement of these compounds is a novel feature of the EESI-TOF-MS, and their apportionment gives further insight into the nature of the factors described above. Here we investigate the apportionment of eight ions associated with compounds of interest: C6H10O5 (approximately assigned to levoglucosan), C7H7NO4 (methyl-nitrocatechol), C9H10O5 (syringic acid), C8H8O4 (vanillic acid), C8H6O4 (phthalic acid), C5H6O4 (glutaconic acid), C7H8O4 (tetrahydroxy toluene), and C7H10O5 (pentahydroxy toluene). Note that because the EESI-TOF-MS can provide only a molecular formula, we cannot establish for certain the identity of a compound or assess the relative isomeric abundances. For example, C6H10O5 is likely to consist not only of levoglucosan, but also other sugars such as mannosan and galactosan. The named compounds are thus provided for reference, but their identification should not be considered conclusive and the ions cannot be assumed to be isomerically pure. Nevertheless, as these assignments are based on molecular investigations of wood-burning-related emissions they are likely to be qualitatively correct and provide a useful framework for interpreting molecular aspects of the source apportionment results.
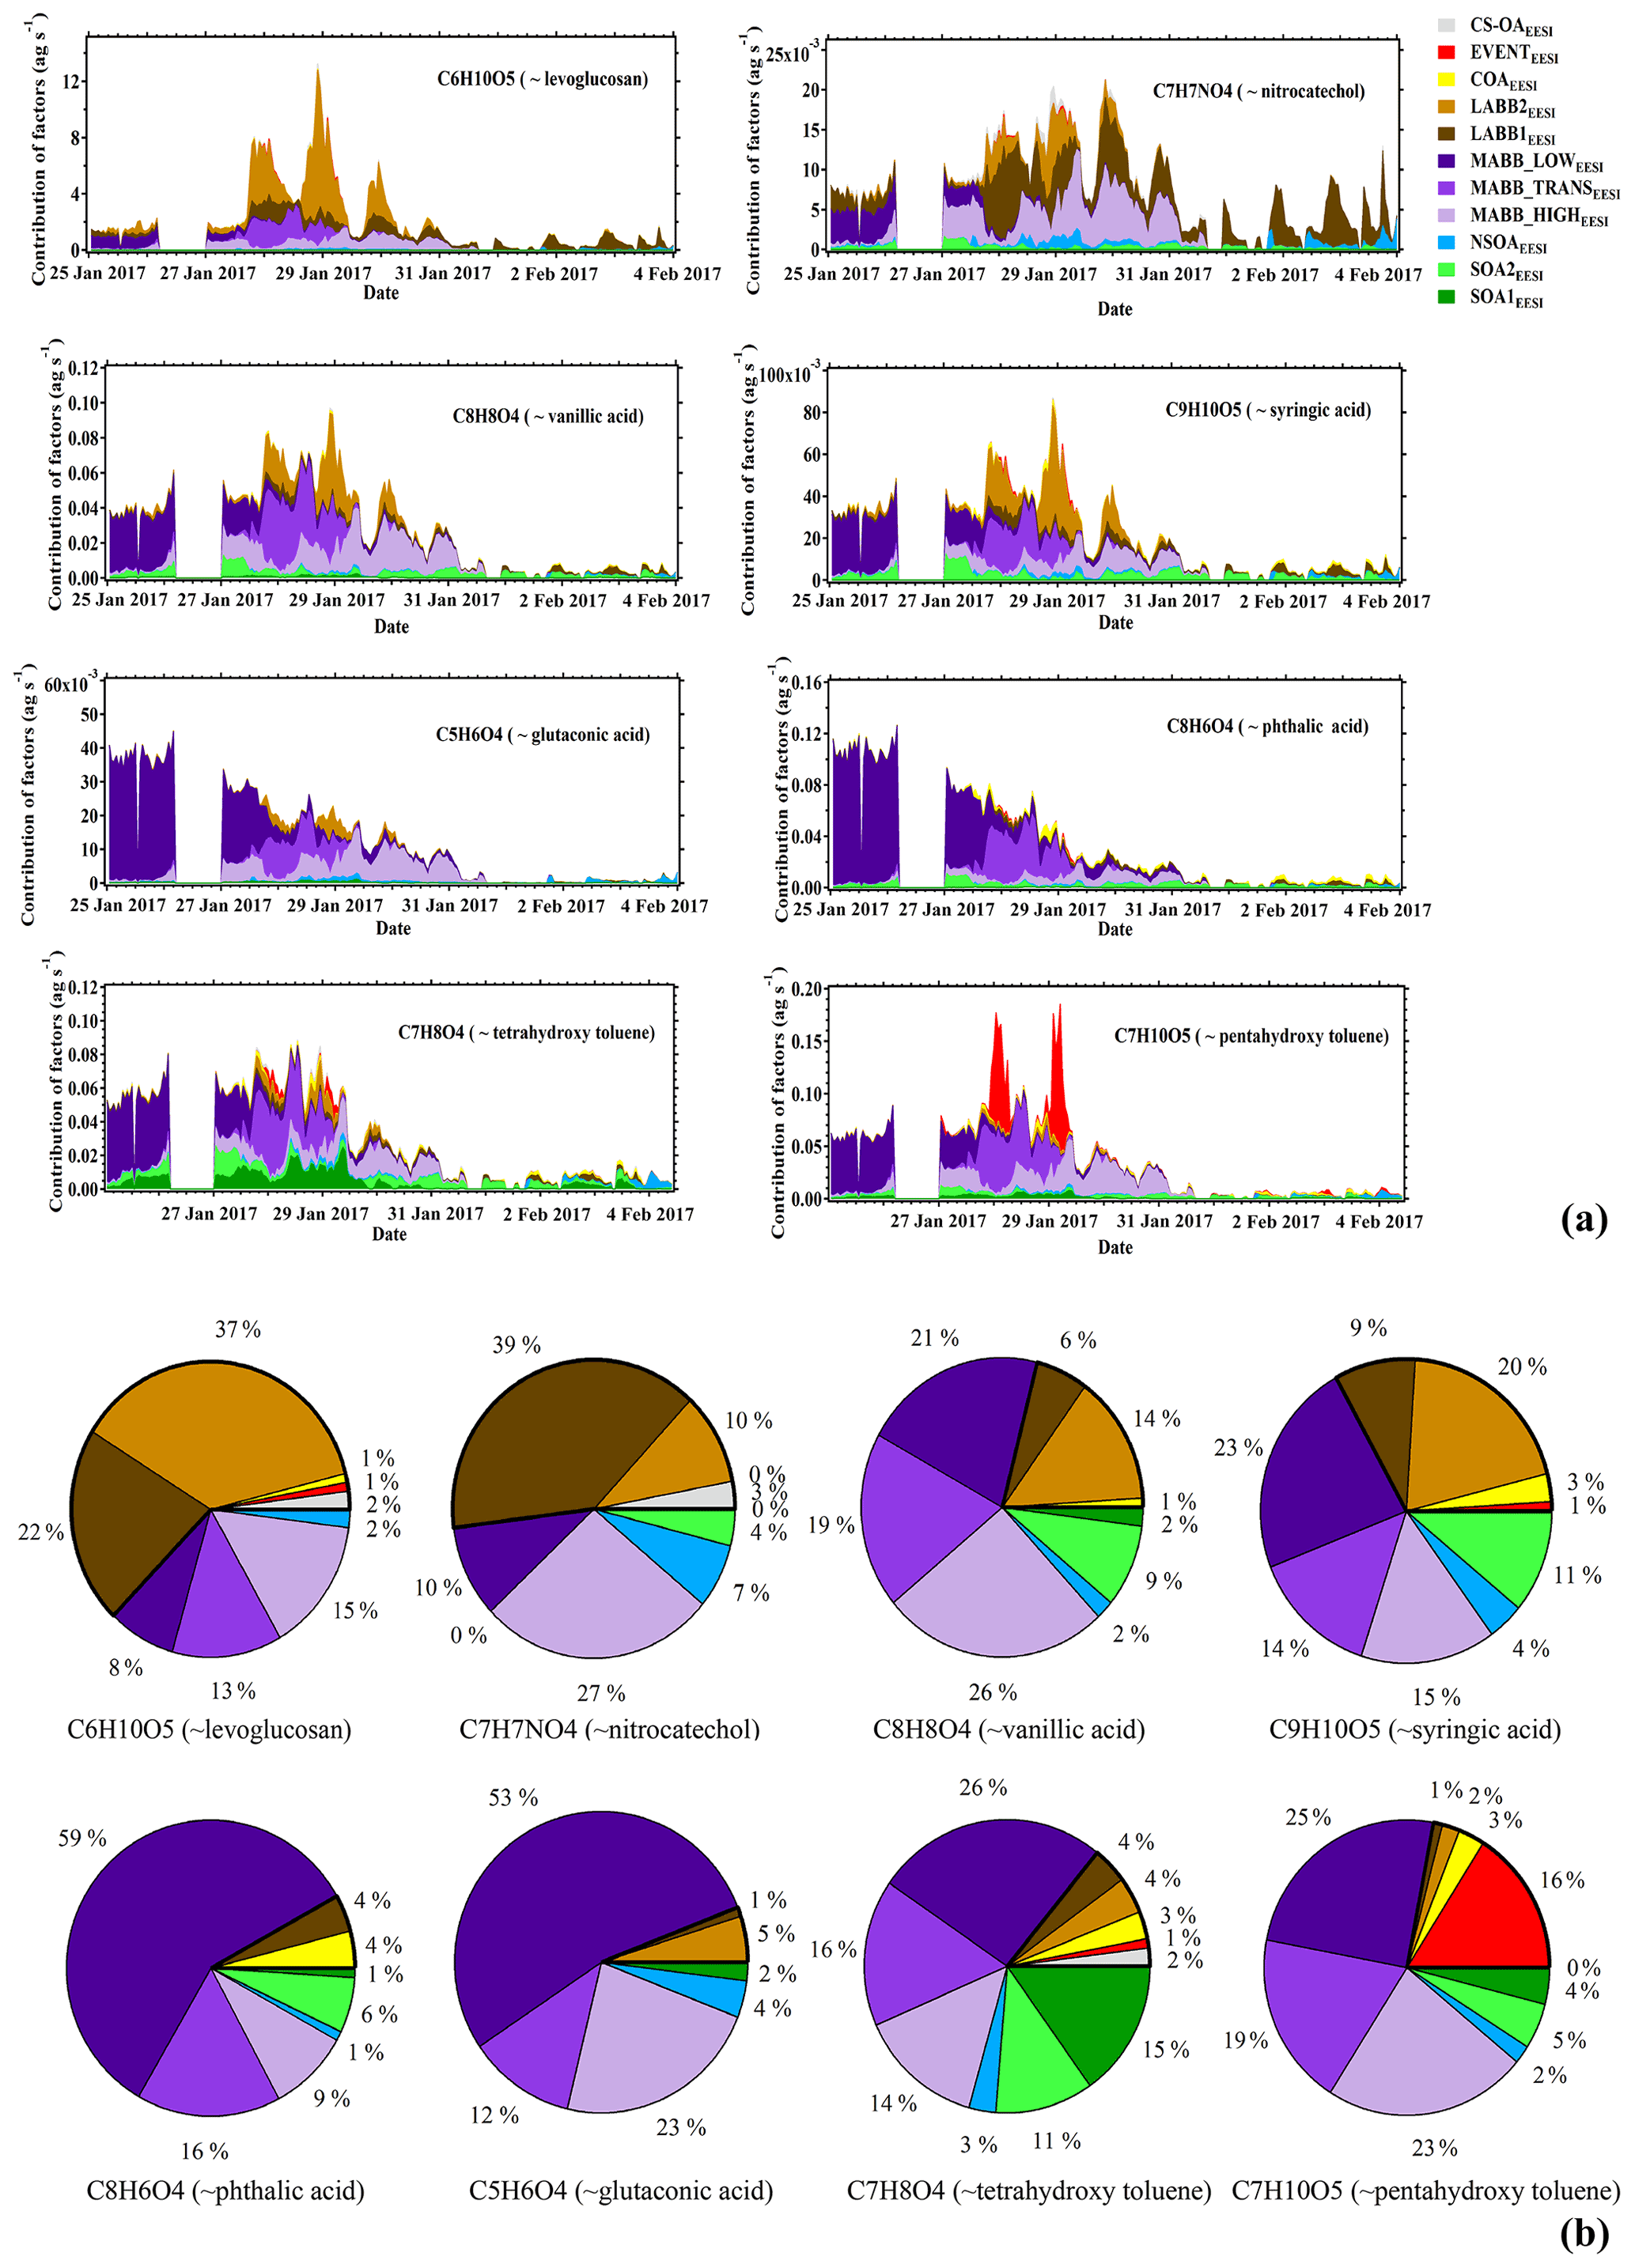
Figure 10Apportionment of selected ions by EESI-TOF-MS PMF. (a) Time series of the mass flux (ag s−1) and (b) mean fraction apportioned to each factor. Each ion is associated with a compound of interest having this molecular formula; however, the relative isomeric abundance of this compound cannot be confirmed by the EESI-TOF-MS.
Figure 10a shows a stacked time series of the mass flux of these compounds representing the contribution of each EESI-TOF-MS PMF factor to the total mass flux (assuming no significant conformational isomers). Levoglucosan, which is derived from the pyrolysis of cellulose and hemicellulose, is commonly used as an indicator for the presence of primary aerosols originating from biomass combustion (Fine et al., 2001). Figure 10b shows that levoglucosan appears in both POA (total contribution of 62 %, mostly from LABB1EESI (22 %) and LABB2EESI (37 %), and minor contributions by COAEESI, CS-OAEESI, and EVENTEESI) and SOA (total contribution of 38 %, of which 36 % is related to the sum of MABB_HIGHEESI, MABB_TRANSEESI, and MABB_LOWEESI, plus minor contributions from NSOAEESI). Due to the high biomass burning emission background and the lifetime of levoglucosan, it is inevitable to find a contribution of levoglucosan in the MABB factor, which is consistent with our aged biomass burning discussion above. In contrast, nitrocatechol (C7H7NO4) has been established as a secondary species originating from the oxidation of biomass burning (Iinuma et al., 2010; Finewax et al., 2018). Here 86 % of nitrocatechol is apportioned to the less aged (49 %) and more aged (37 %) biomass burning factors. Syringic acid and vanillic acid are phenolic acids derived from the oxidation of lignin decomposition products (He et al., 2018), which in turn are a major component of biomass combustion emissions, and are apportioned primarily to the MABBEESI factors (52 % for syringic acid and 66 % for vanillic acid).
Phthalic acid (C8H6O4) and glutaconic acid (C5H6O4) are apportioned to the SOA factors (91 % and 94 % in total, respectively), with the main contributions from the MABBEESI factors and in particular the MABB_LOWEESI factor (53 % and 59 %, respectively). These dicarboxylic acids are ubiquitous water-soluble organic compounds which have been detected in a variety of aerosol samples, and originate from the combustion of biomass burning and fossil fuels, as well as from biogenic emission and photooxidation of organic gases. For example, phthalic acid has been identified based on field measurements, as a tracer of naphthalene oxidation (Kleindienst et al., 2012) or oxidation products from PAHs (Chan et al., 2009), and is also consistently found in combustion products of lignin, which is likely to explain the contribution in the MABB factors (Fu et al., 2010; Wang et al., 2007).
Tetrahydroxy toluene (C7H8O4) and pentahydroxy toluene (C7H8O5) are apportioned mainly to secondary factors (85 % and 78 %, respectively). Tetrahydroxy toluene and pentahydroxy toluene have been detected as dominant products in both the particle phase and gas phase under low-NO oxidation of toluene (Nakao et al., 2012; Schwantes et al., 2017). The o-cresol oxidation mechanism for tetrahydroxy toluene and pentahydroxy toluene is found in MCM v3.3.1, based on Olariu et al. (2002). This formation indicates that these two low-volatility ions are indeed secondary organic compounds, consistent with our results shown in Fig. 10. In addition, the temporal variation in the pentahydroxy toluene contribution is consistent with the one of tetrahydroxy toluene except for the EVENTEESI factor, which may indicate that during this night event an isomer of pentahydroxy toluene was present.
3.4 EESI-TOF-MS cluster analysis
As evidenced from the previous section and Figs. 2 and 6, many of the dominant ions in the EESI-TOF-MS PMF analysis are shared by multiple factors. Here, we utilize a cluster analysis to identify ions unique or nearly unique to a single factor or group of factors. As discussed in Sect. 2.5, hierarchical agglomerative clustering is performed separately on the set of all EESI-TOF-MS ions and all EESI-TOF-MS factor time series. Figure 11 shows the resulting dendrogram of the ions and factors along the vertical and horizontal axes, respectively; the ion dendrogram is colored subjectively to guide the eye. Comparison of the ions to the factors yields a matrix, also shown in Fig. 11, which is colored by the z score, with shades of dark red denoting high correlation. In this representation, an ion unique to a given factor is brown for one and only one rectangle in the horizontal dimension.
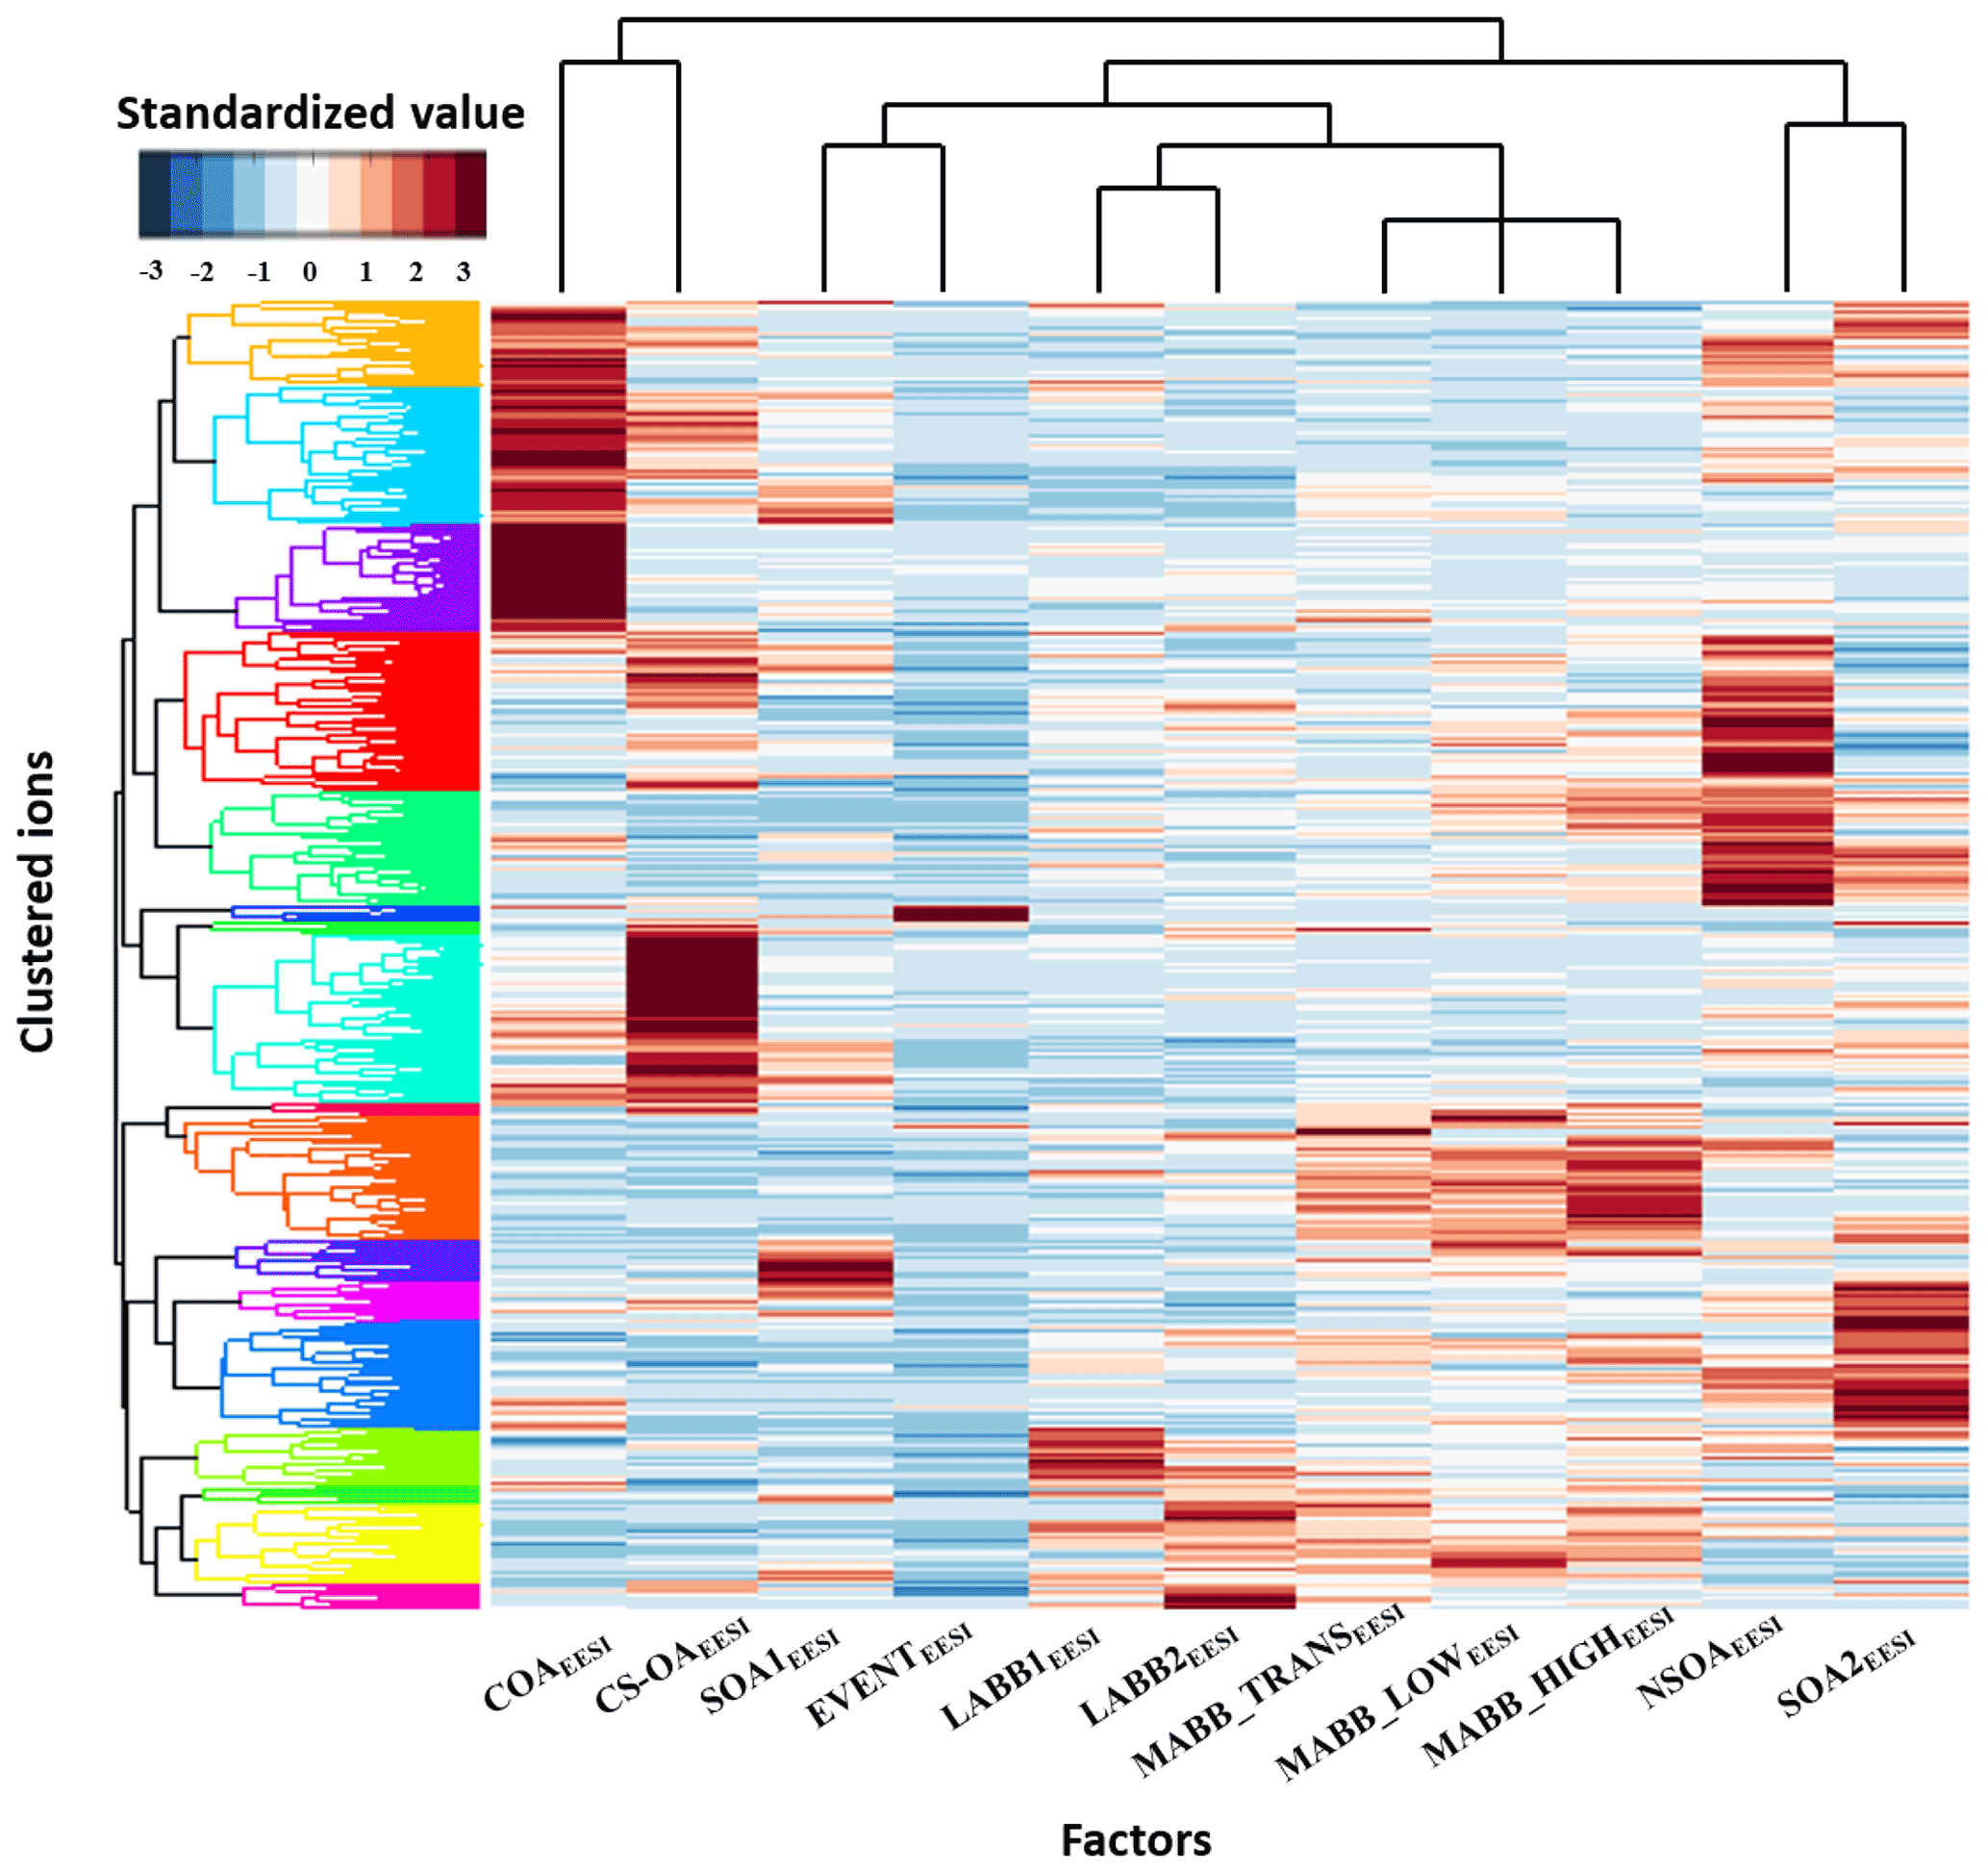
Figure 11Standardized matrix of individual EESI-TOF-MS ions vs. EESI-TOF-MS PMF factors. Ions and factors are sorted according to the results of their respective hierarchical clustering analysis; the resulting dendrograms are shown on the respective axes. The color of the compounds' groups in the dendrogram are chosen to make groupings convenient to read (color is random).
The factor dendrogram identifies several groups of EESI-TOF-MS PMF factors consistent with the interpretations provided above: (1) more aged biomass burning factors (MABB_LOWEESI, MABB_TRANSEESI and MABB_HIGHEESI), (2) less aged biomass burning factors (LABB1EESI and LABB2EESI), and (3) the cooking-related OA and cigarette smoking OA factors. The more aged and less aged biomass burning factor groups are themselves likewise grouped. This clustering is consistent with our interpretation of these factors, as discussed in the previous section. Ions are clustered to different groups using the standardized values. In each factor, there are distinguished molecules (lists of the specific ions (standardized value above 1.5) for each factor are shown in Table S2). The other two resolved groups, one group including the SOA1 and EVENT factors, one group containing the SOA2 and NSOA factors, apparently do not retrieve the common ions, which make less sense for the current study.
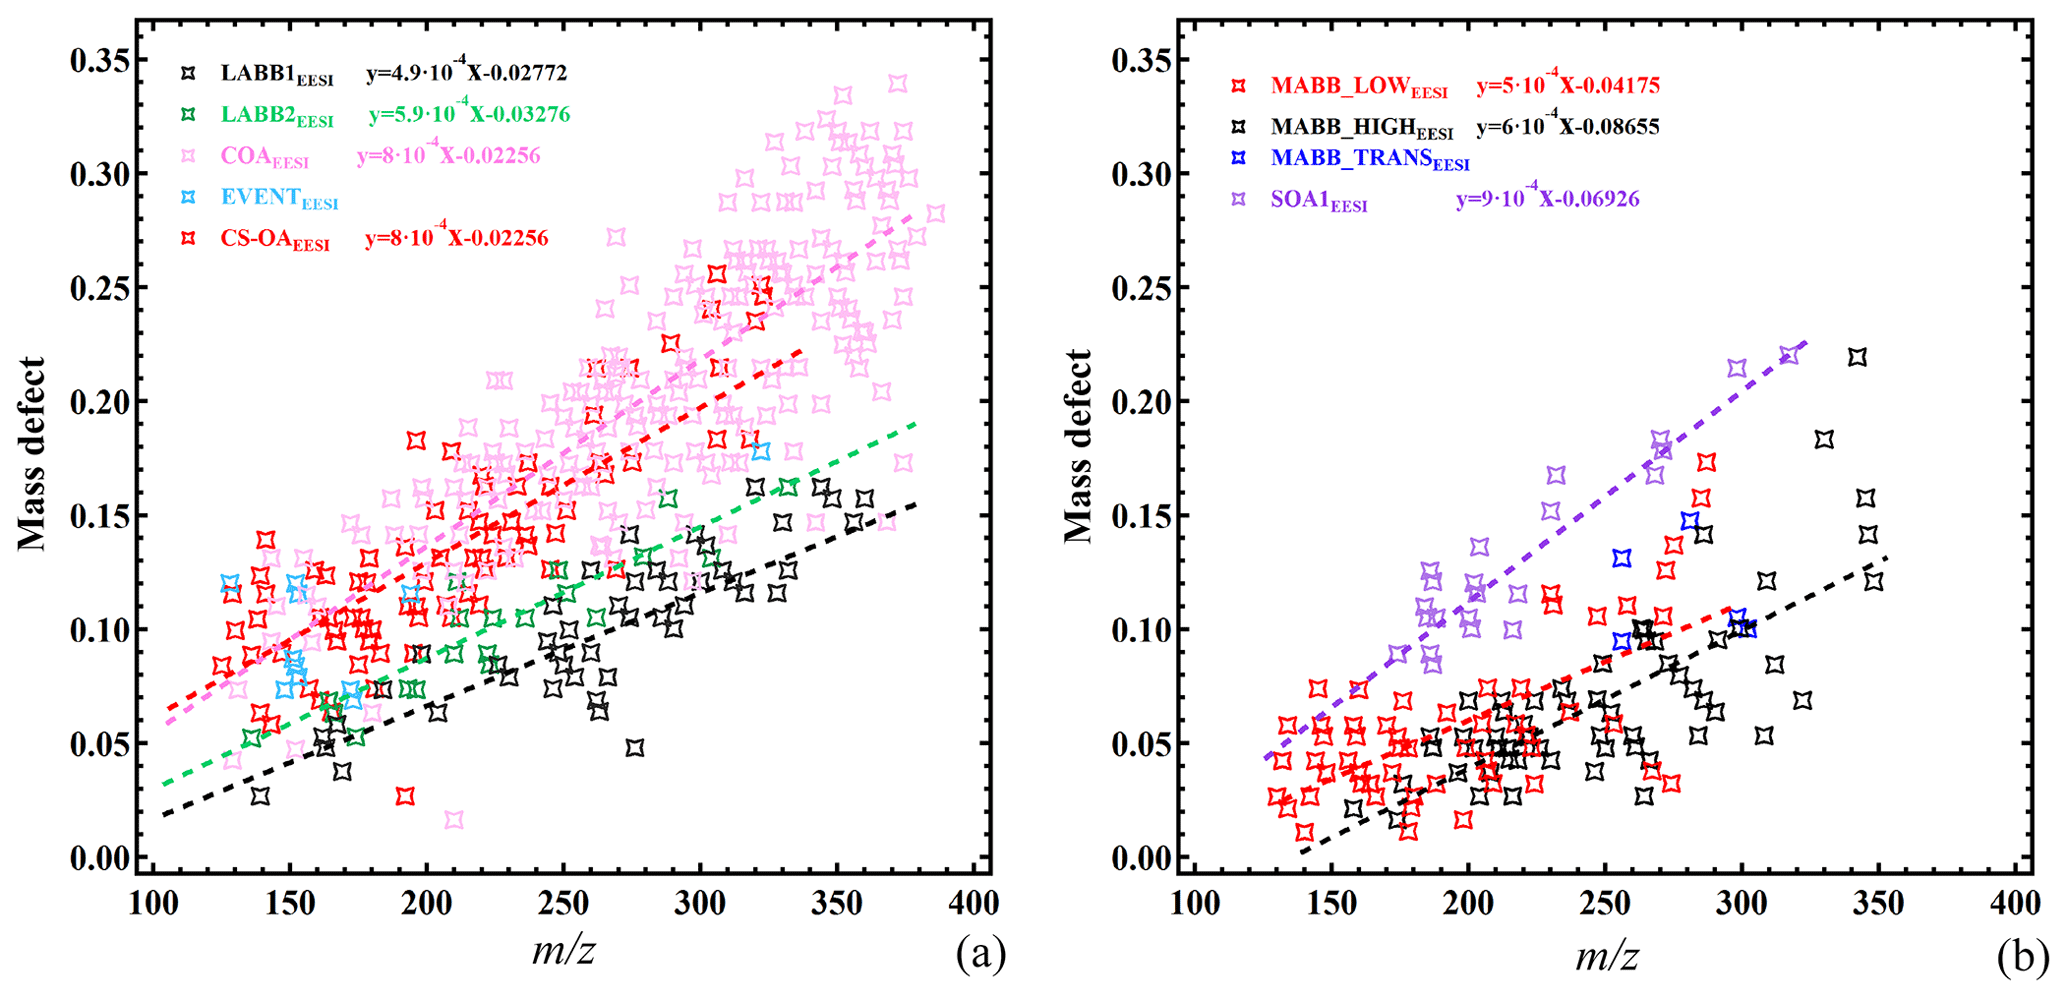
Figure 12Mass defect filtering plot of factor-specific ions (identified from the cluster analysis) for selected EESI-TOF-MS POA (a) and SOA (b) factors.
For several of the factors, the uniquely assigned ions exhibit systematic patterns contributing to the identification or deconvolution of the factors. Figure 12a shows the mass defect, defined as the exact m∕z minus the nearest-integer m∕z, as a function of m∕z for the uniquely assigned ions for the five POAEESI factors. Figure 12b shows the equivalent plot for the three MABBEESI factors and SOA1EESI (SOA2EESI and NSOAEESI have a high degree of scatter and are omitted to avoid masking trends in the other secondary factors). The displayed factors exhibit linear correlations or tight clusters of points; all factors are shown independently in Fig. S11. LABB1EESI and LABB2EESI have a lower mass defect and shallower slope than COAEESI and CS-OAEESI, consistent with increased aromaticity. The slopes are , , , and for LABB1EESI, LABB2EESI, COAEESI, and CS-OAEESI, respectively. The slopes of the two LABB factors as well as those of COAEESI and CS-OAEESI are very similar to each other and have a high possibility to be consistent with CH addition for the former (i.e., , theoretical slope ), and CH2 addition for the latter (i.e., for COAEESI and for CS-OAEESI as nearly every CS-OA-specific ion contains a single N atom, theoretical slope ).
The MABB and LABB factors have similar slopes, despite different ion lists. The slopes of two of the MABB factors (), as shown in Fig. 12b, are consistent with the addition of CHO functionality (theoretical slope ). Due to the high variability of the slopes of the MABB factors, they may also contain other functionalities. Both mass defect and slope are higher for MABB_LOWEESI than for MABB_HIGHEESI, which is consistent with our discussion in Sect. 3.2.3, assuming that the organics of the MABB_LOWEESI factor are more oxidized than those of the MABB_HIGHEESI factors. In addition, the MABB intercepts are more positive than those of LABB, consistent with the higher oxidation state shown above.
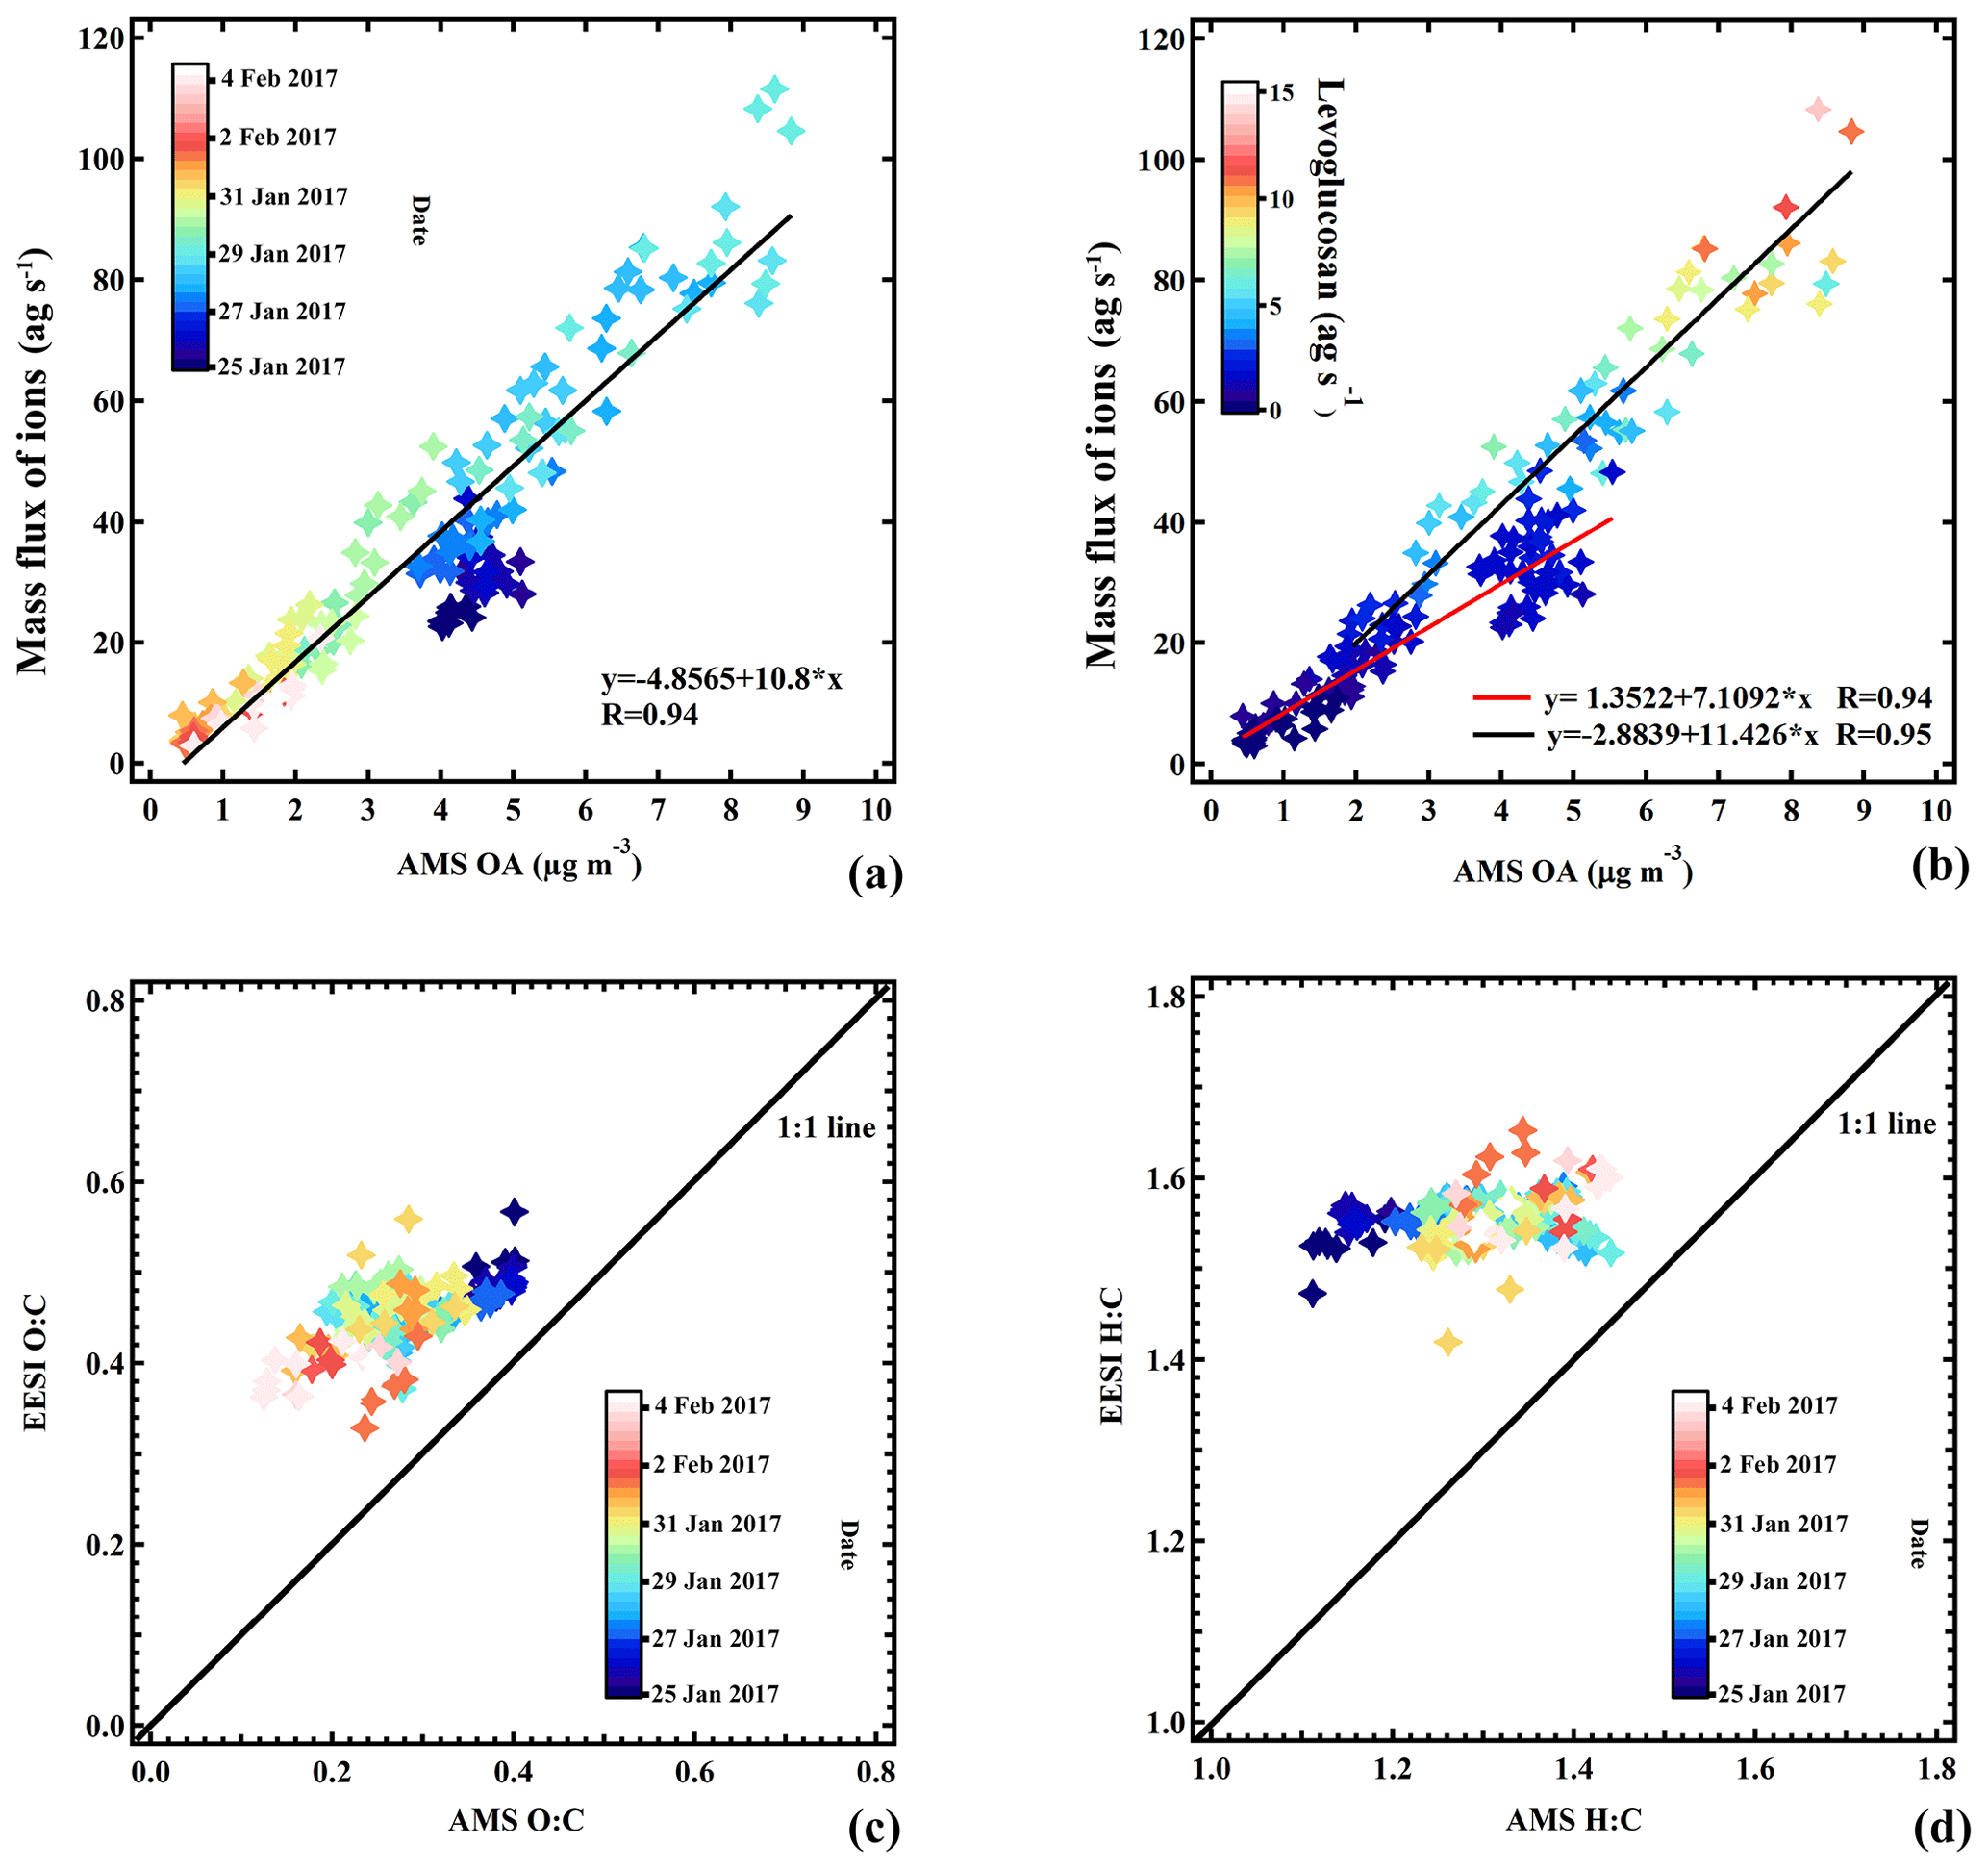
Figure 13Comparison of EESI-TOF-MS and AMS. Total EESI-TOF-MS mass flux (ag s−1) as a function of AMS OA, points are colored by date (a) and the fraction of levoglucosan (b). The EESI-TOF-MS and AMS comparison in terms of H:C (c) and O:C (d); points are colored by date.
3.5 Comparison of AMS and EESI-TOF-MS
Figure 13a shows the sum of the mass flux of the ions measured by the EESI-TOF-MS as a function of the OA concentration measured by the AMS, with the points colored by date and time. We apply no ion-dependent sensitivity corrections for the EESI-TOF-MS, although ion-by-ion differences are known to exist (Lopez-Hilfiker et al., 2019). Note that the AMS signal includes the minor OA source, HOAAMS, which is mostly insoluble in the electrospray droplets and thus expected to be basically undetectable by the EESI-TOF-MS. Nevertheless, the two instruments are well-correlated (R=0.94). The strong correlation in Fig. 13a suggests that the overall EESI-TOF-MS sensitivity to OA does not vary significantly throughout the study, and therefore it is unlikely that the major individual EESI-TOF-MS PMF factors (which describe the compositional variability) have dramatically different response factors. We therefore interpret the EESI-TOF-MS PMF results without correction of the data for factor-specific sensitivities. Several features are evident from the dependence of the sensitivity on the mass flux of levoglucosan (Fig. 13b), which may explain the discrepancy in the first part of the campaign (period 1) vs. the rest of the campaign. An SOA-dominated period with low levoglucosan concentration (red line) toward the beginning of the campaign exhibits a lower sensitivity than during a period with higher levoglucosan concentrations (black line), which includes the events on 28 and 29 January 2017 characteristic of EVENTEESI (Lopez-Hilfiker et al., 2019). Figure 13c and d show the O:C and H:C atomic ratios for the EESI-TOF-MS, respectively, as a function of those for the AMS. Here again no ion-dependent sensitivity corrections are applied. The EESI-TOF-MS and AMS O:C ratios are correlated (R=0.62); however, the O:C ratios estimated by the EESI-TOF-MS are systematically higher than those measured by the AMS. For the H:C ratios, we do not observe a correlation. The EESI-TOF-MS values are scattered around approximately 1.56, independent of the AMS H:C ratios, which vary between 1.11 and 1.44. The cause for this discrepancy is not yet understood but may be related to differences in ion relative sensitivity (Bertrand et al., 2018).
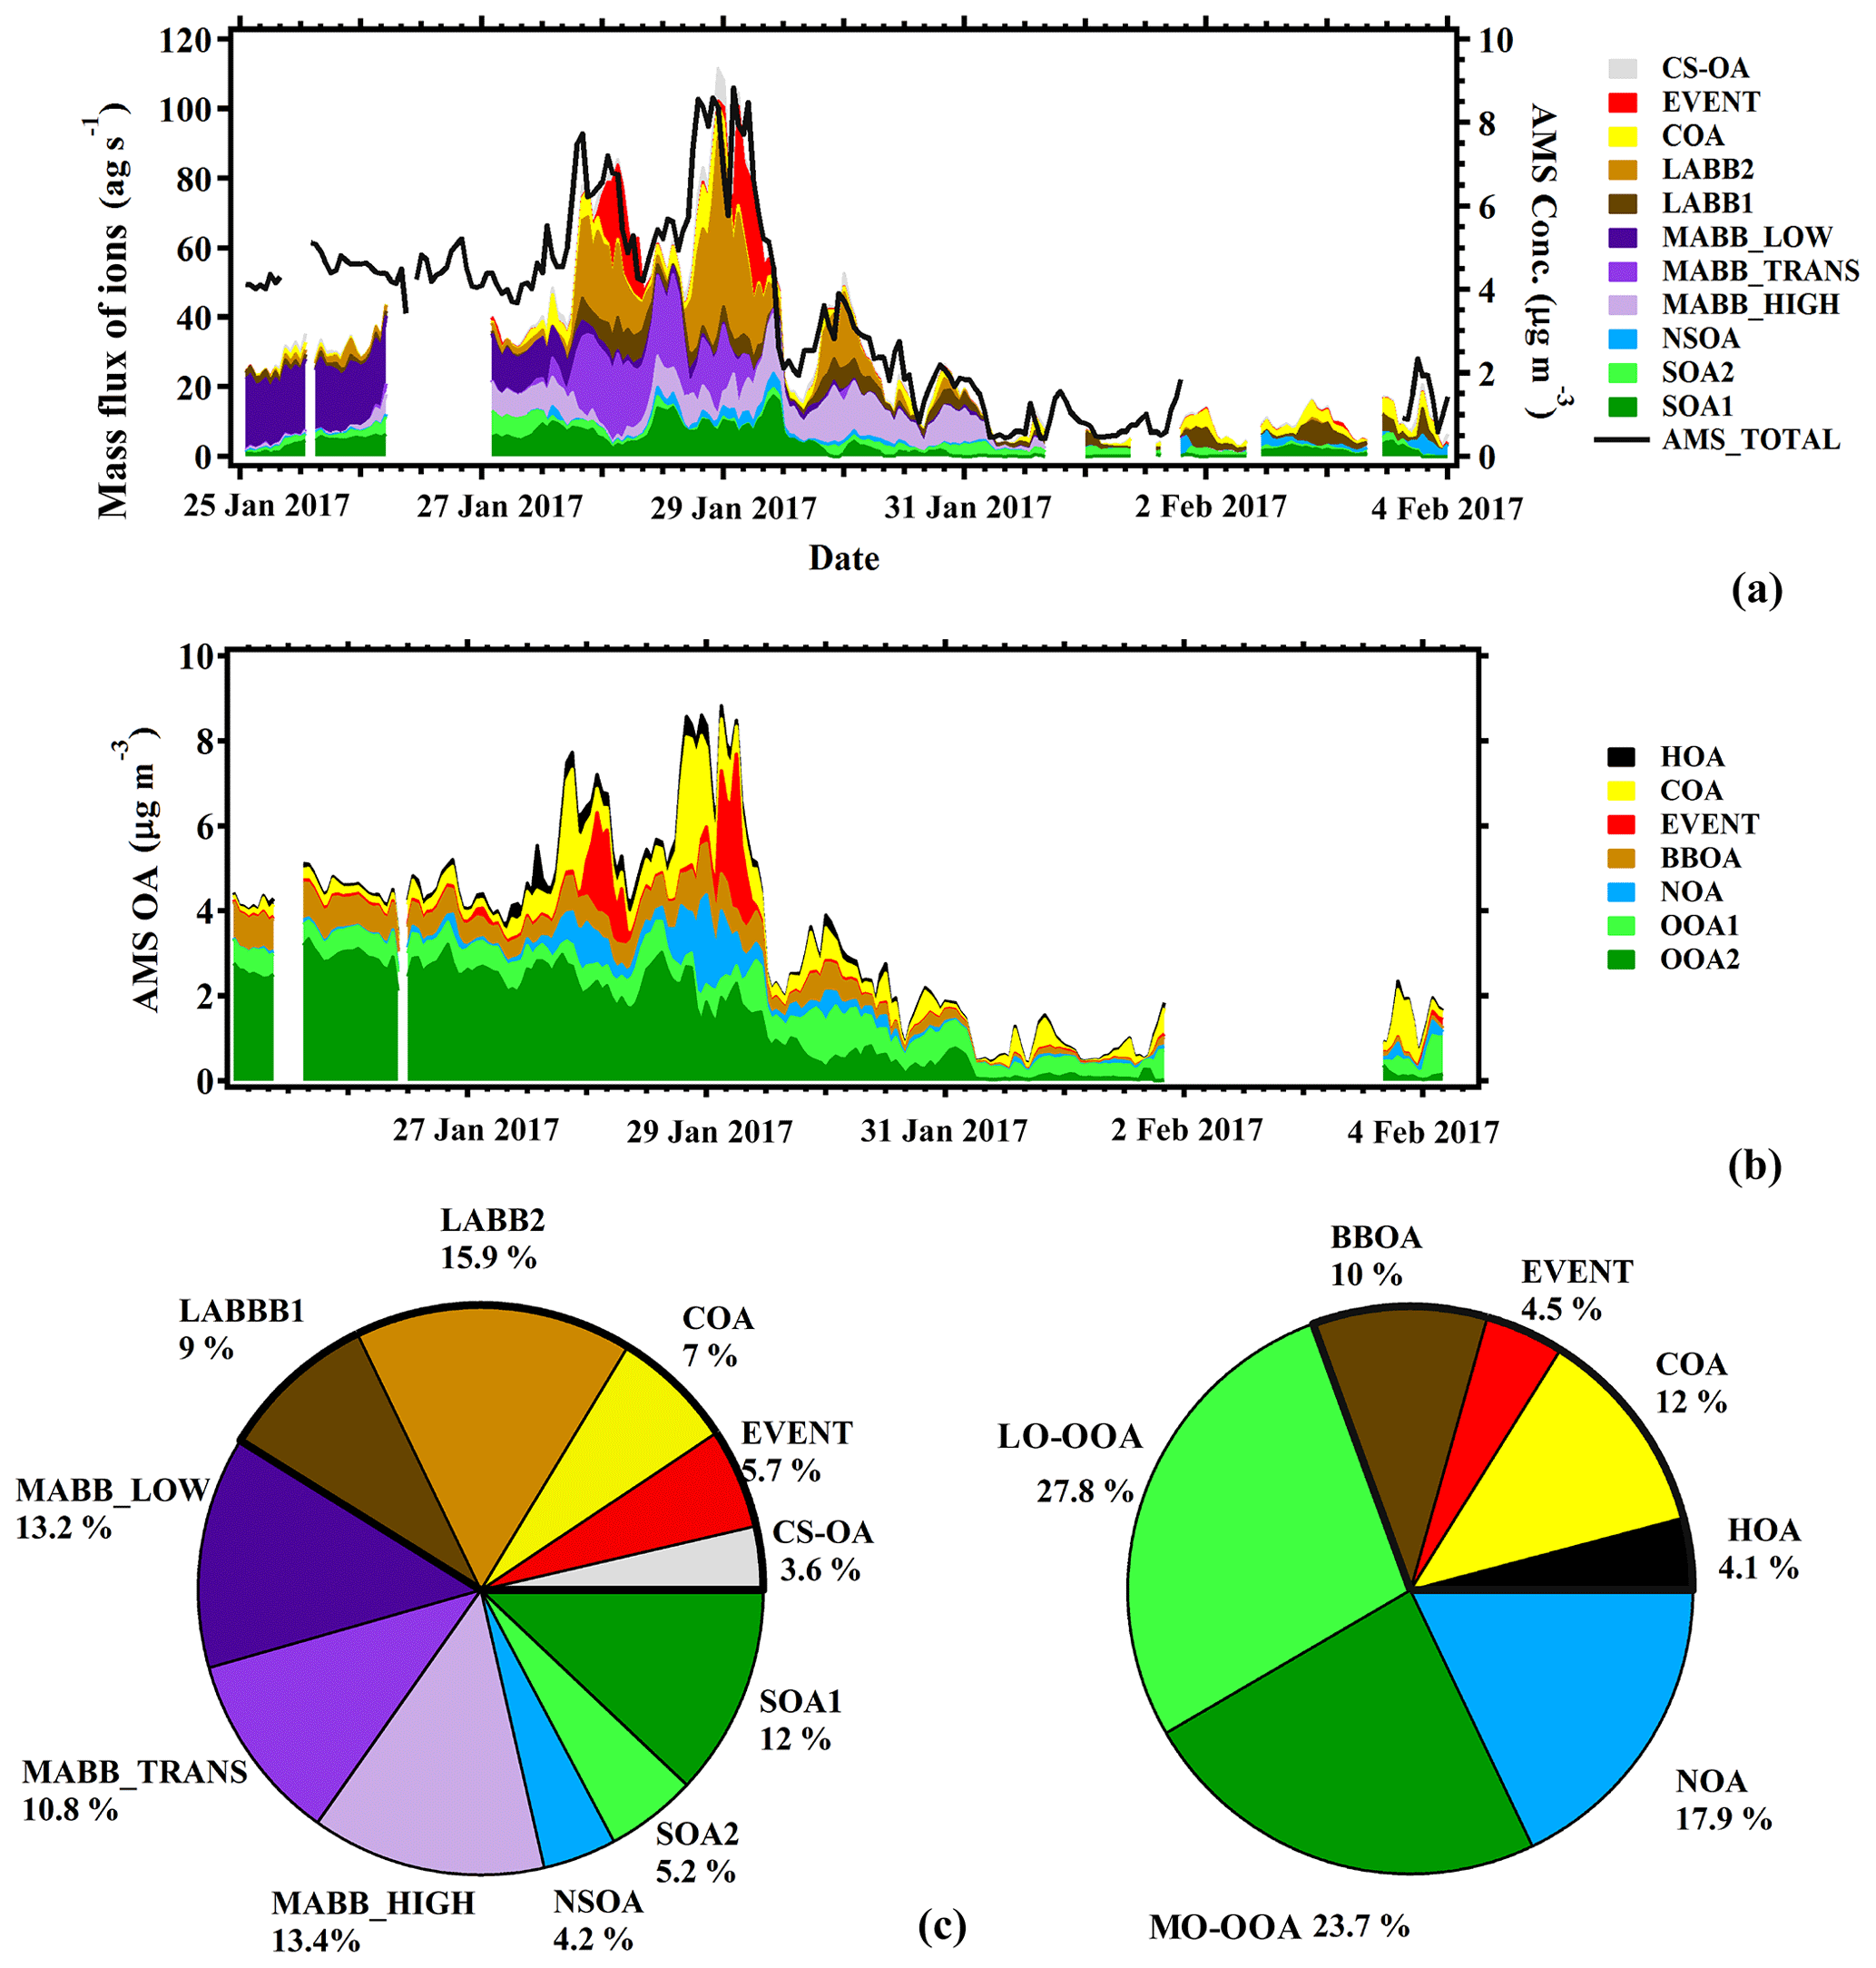
Figure 14Comparison between EESI factors and AMS factors: time series of the mass flux of each EESI PMF factor (a) and time series of concentrations of each AMS PMF factor (b). Pie charts of source apportionment results from the EESI (left) and AMS (right) (c). The thick block frame denotes the sum of the primary OA for both datasets.
Figure 14 shows the stacked time series of the EESI-TOF-MS PMF factors (together with total AMS OA concentration) and of the AMS PMF factors. Also shown are pie charts denoting the mean OA PMF composition over the entire campaign from the EESI-TOF-MS and AMS data. Despite uncertainties in the definition and resolution of primary vs. more aged biomass burning, the AMS and EESI-TOF-MS are in relatively good agreement with respect to the total POA and SOA fractions. The SOA factors comprise 58.8 % of the mass flux for the EESI-TOF-MS and 69.4 % of the mass for the AMS. The agreement may in fact be better than these values indicate: as noted above, the NOAAMS factor, comprising 17.9 % of the mass and fully associated with SOA in our solution, is likely composed of both POA (derived from cigarette smoke, as resolved in CS-OAEESI) and SOA (from organonitrate-containing SOA, as resolved in NSOAEESI), resulting in a low total POA fraction in the AMS solution. Since both CS-OAEESI and NSOAEESI are enriched with the nitrogen-containing ions, we compare in Fig. 15 the O:C and N:C ratios for these two factors, where the size of the colored stars and circles corresponds to the H:C ratio. A distinct separation between CS-OAEESI and NSOAEESI is evident due to a significantly higher O:C ratio for a given N:C ratio, i.e., higher degree of oxygenation for the NSOAEESI factor and a higher abundance of organic nitrate molecules in the NSOAEESI factor. Moreover, this separation was not possible for AMS PMF.
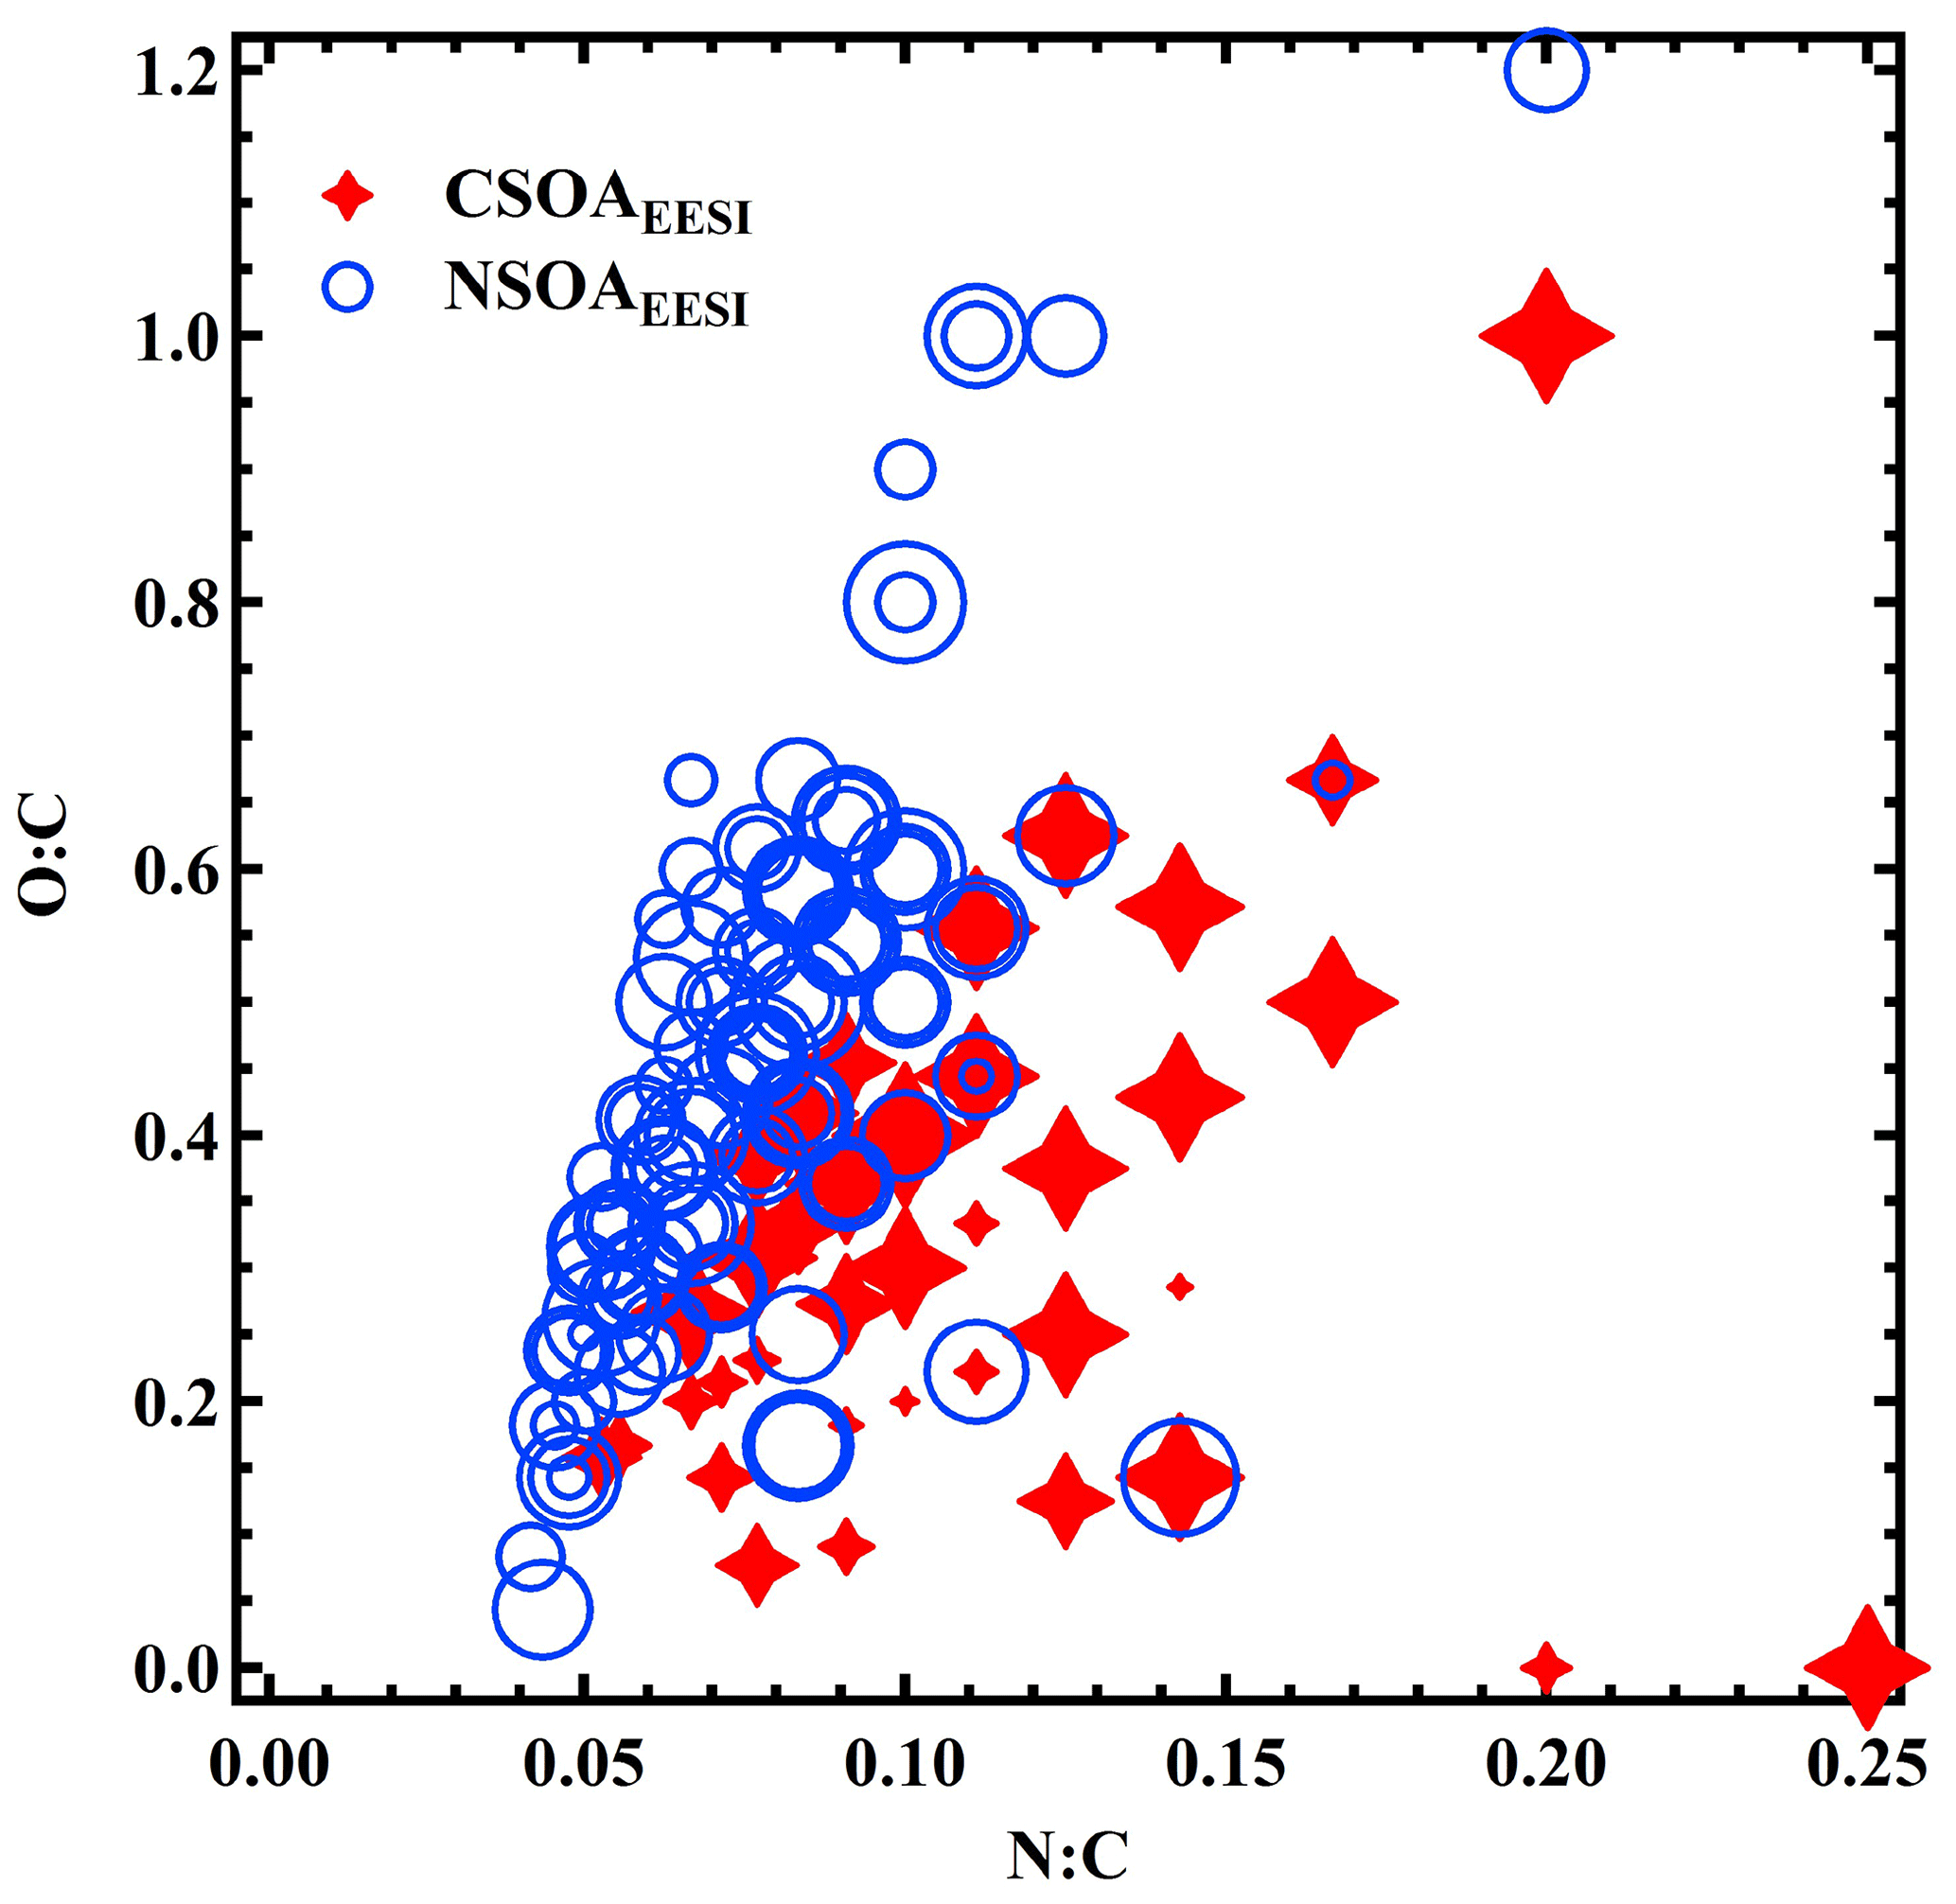
Figure 15The atomic O:C vs. N:C plot of the CS-OAEESI and NSOAEESI factors' mass spectra. Points are sized by the H:C value of each distinguished ion of CS-OAEESI and NSOAEESI.
Both AMS and EESI-TOF-MS factor stacked time series (Fig. 14) show clearly that biomass burning is dominated by secondary fractions early in the campaign, mixed fractions in the middle of the campaign, and a primary fraction late in the campaign. As discussed in Sect. 3.2.2, BBOAAMS is a mixture of primary and secondary ions, and OOAAMS is a mixture of biomass burning fragments and background SOA fragments from photochemistry production ions. Although the fraction of OOA comprises more than 50 % percent of total OA (Fig. 14), it is hard to define how much of AMS OOA is related to biomass burning as a function of time. The EESI-TOF-MS separates the biomass burning factors into LABBEESI and MABBEESI and splits the background SOA factors into separate factors, which provides evidence that biomass burning is the single most important contributor to the organic aerosol at the measurement site during winter.
Real-time, near-molecular-level measurements of OA composition were performed during winter in Zurich using a novel extractive electrospray ionization time-of-flight mass spectrometer (EESI-TOF-MS). The lack of thermal decomposition or ionization-induced fragmentation in the EESI-TOF-MS provides an improved description of SOA in particular, facilitating SOA source identification by PMF. We retrieve 11 factors, of which five are dominated by POA and six by SOA. The POA factors include cooking-influenced OA (COAEESI, which strongly correlates with an equivalent AMS factor), cigarette-smoke-influenced OA (CS-OAEESI, characterized by a strong contribution from nicotine), and a special event also captured by the AMS. Two less aged biomass burning factors are also resolved. Of the six SOA factors, three are clearly related to biomass burning and are distinguished by temperature and possibly wind direction. We also observe two SOA factors with no clear biomass burning signatures, one of which closely resembles monoterpene oxidation. Finally, we observe a minor factor with a high organonitrate fraction.
We performed cluster analysis of the EESI-TOF-MS ions followed by correlation with the resolved factors, which identifies groups of ions characteristic of each factor. These characteristic ions represent potential tracers for future studies; they indicate strong aromatic influence in both less aged and more aged biomass burning, and support the primary/secondary assignment of biomass-burning-influenced factors.
The increased chemical specificity of the EESI-TOF-MS allows for additional, meaningful factors to be resolved relative to the AMS. Comparisons of bulk measurements, as well as of individual factors or groups of factors between the EESI-TOF-MS and AMS, indicate good agreement, but with differences in elemental ratios. This suggests that, despite significant uncertainties in the relative response factors of individual ions measured by the EESI-TOF-MS, responses at the level of the PMF factors are relatively similar, with the main differences resulting from the high sensitivity to levoglucosan in the EESI. Furthermore, source apportionment of EESI-TOF-MS provides more classification of SOA factors, separating EESI biomass burning factors as more or less aged instead of primary or secondary, and identifying organic-nitrogen-containing factors as a primary-dominated nitrogen factor or organonitrate-containing secondary factor, which are not possible for AMS PMF. As a result, the EESI-TOF-MS represents a promising new approach for source apportionment and atmospheric composition studies.
The data are available from the corresponding author upon request.
The supplement related to this article is available online at: https://doi.org/10.5194/acp-19-8037-2019-supplement.
LQ was the main author. LQ, GS, VP, YT, and CH conducted the field campaign. MC, XG, JGS, ASHP, and UB were the supervisors. All contributed to the corrections of the paper.
The authors declare that they have no conflict of interest.
We acknowledge the support by the Federal Office for the Environment. Mao Xiao is acknowledged for useful discussions. The authors gratefully acknowledge technical and logistical support from Rene Richter (PSI).
This research has been supported by the Swiss National Science Foundation (grant no. BSSGI0_155846) and the National Natural Science Foundation of China (grant nos. 91543115, 21577065).
This paper was edited by Sergey A. Nizkorodov and reviewed by three anonymous referees.
Allan, J. D., Rami Alfarra, M., Bower, K. N., Williams, P. I., Gallagher, M. W., Jimenez, J. L., McDonald, A. G., Nemitz, E., Canagaratna, M. R., Jayne, J. T., Coe, H., and Worsnop, D. R.: Quantitative sampling using an Aerodyne aerosol mass spectrometer, 2, Measurements of fine particulate chemical composition in two U.K. cities, J. Geophys. Res., 108, 4091, https://doi.org/10.1029/2002JD002359, 2003.
Bertrand, A., Stefenelli, G., Jen, C. N., Pieber, S. M., Bruns, E. A., Ni, H., Temime-Roussel, B., Slowik, J. G., Goldstein, A. H., El Haddad, I., Baltensperger, U., Prévôt, A. S. H., Wortham, H., and Marchand, N.: Evolution of the chemical fingerprint of biomass burning organic aerosol during aging, Atmos. Chem. Phys., 18, 7607–7624, https://doi.org/10.5194/acp-18-7607-2018, 2018.
Bianchi, F., Garmash, O., He, X., Yan, C., Iyer, S., Rosendahl, I., Xu, Z., Rissanen, M. P., Riva, M., Taipale, R., Sarnela, N., Petäjä, T., Worsnop, D. R., Kulmala, M., Ehn, M., and Junninen, H.: The role of highly oxygenated molecules (HOMs) in determining the composition of ambient ions in the boreal forest, Atmos. Chem. Phys., 17, 13819–13831, https://doi.org/10.5194/acp-17-13819-2017, 2017.
Bozzetti, C., Sosedova, Y., Xiao, M., Daellenbach, K. R., Ulevicius, V., Dudoitis, V., Mordas, G., Byčenkienė, S., Plauškaitė, K., Vlachou, A., Golly, B., Chazeau, B., Besombes, J.-L., Baltensperger, U., Jaffrezo, J.-L., Slowik, J. G., El Haddad, I., and Prévôt, A. S. H.: Argon offline-AMS source apportionment of organic aerosol over yearly cycles for an urban, rural, and marine site in northern Europe, Atmos. Chem. Phys., 17, 117–141, https://doi.org/10.5194/acp-17-117-2017, 2017.
Bruns, E. A., El Haddad, I., Slowik, J. G., Kilic, D., Klein, F., Baltensperger, U., and Prevot, A. S.: Identification of significant precursor gases of secondary organic aerosols from residential wood combustion, Sci. Rep.-UK, 6, 27881, https://doi.org/10.1038/srep27881, 2016.
Bruns, E. A., Slowik, J. G., El Haddad, I., Kilic, D., Klein, F., Dommen, J., Temime-Roussel, B., Marchand, N., Baltensperger, U., and Prévôt, A. S. H.: Characterization of gas-phase organics using proton transfer reaction time-of-flight mass spectrometry: fresh and aged residential wood combustion emissions, Atmos. Chem. Phys., 17, 705–720, https://doi.org/10.5194/acp-17-705-2017, 2017.
Canonaco, F., Crippa, M., Slowik, J. G., Baltensperger, U., and Prévôt, A. S. H.: SoFi, an IGOR-based interface for the efficient use of the generalized multilinear engine (ME-2) for the source apportionment: ME-2 application to aerosol mass spectrometer data, Atmos. Meas. Tech., 6, 3649–3661, https://doi.org/10.5194/amt-6-3649-2013, 2013.
Chan, A. W. H., Kautzman, K. E., Chhabra, P. S., Surratt, J. D., Chan, M. N., Crounse, J. D., Kürten, A., Wennberg, P. O., Flagan, R. C., and Seinfeld, J. H.: Secondary organic aerosol formation from photooxidation of naphthalene and alkylnaphthalenes: implications for oxidation of intermediate volatility organic compounds (IVOCs), Atmos. Chem. Phys., 9, 3049–3060, https://doi.org/10.5194/acp-9-3049-2009, 2009.
Chan, M. N., Choi, M. Y., Ng, N. L., and Chan, C. K.: Hygroscopicity of water-soluble organic compounds in atmospheric aerosols: Amino acids and biomass burning derived organic species, Environ. Sci. Technol., 39, 1555–1562, https://doi.org/10.1021/Es049584l, 2005.
Coeur-Tourneur, C., Tomas, A., Guilloteau, A., Henry, F., Ledoux, F., Visez, N., Riffault, V., Wenger, J. C., and Bedjanian, Y.: Aerosol formation yields from the reaction of catechol with ozone, Atmos. Environ., 43, 2360–2365, https://doi.org/10.1016/j.atmosenv.2008.12.054, 2009.
Crippa, M., DeCarlo, P. F., Slowik, J. G., Mohr, C., Heringa, M. F., Chirico, R., Poulain, L., Freutel, F., Sciare, J., Cozic, J., Di Marco, C. F., Elsasser, M., Nicolas, J. B., Marchand, N., Abidi, E., Wiedensohler, A., Drewnick, F., Schneider, J., Borrmann, S., Nemitz, E., Zimmermann, R., Jaffrezo, J.-L., Prévôt, A. S. H., and Baltensperger, U.: Wintertime aerosol chemical composition and source apportionment of the organic fraction in the metropolitan area of Paris, Atmos. Chem. Phys., 13, 961–981, https://doi.org/10.5194/acp-13-961-2013, 2013a.
Crippa, M., El Haddad, I., Slowik, J. G., DeCarlo, P. F., Mohr, C., Heringa, M. F., Chirico, R., Marchand, N., Sciare, J., Baltensperger, U., and Prevot, A. S. H.: Identification of marine and continental aerosol sources in Paris using high resolution aerosol mass spectrometry, J. Geophys. Res., 118, 1950–1963, https://doi.org/10.1002/jgrd.50151, 2013b.
Crippa, M., Canonaco, F., Lanz, V. A., Äijälá, M., Allan, J. D., Carbone, S., Capes, G., Ceburnis, D., Dall'Osto, M., Day, D. A., DeCarlo, P. F., Ehn, M., Eriksson, A., Freney, E., Hildebrandt Ruiz, L., Hillamo, R., Jimenez, J. L., Junninen, H., Kiendler-Scharr, A., Kortelainen, A.-M., Kulmala, M., Laaksonen, A., Mensah, A. A., Mohr, C., Nemitz, E., O'Dowd, C., Ovadnevaite, J., Pandis, S. N., Petäjä, T., Poulain, L., Saarikoski, S., Sellegri, K., Swietlicki, E., Tiitta, P., Worsnop, D. R., Baltensperger, U., and Prévôt, A. S. H.: Organic aerosol components derived from 25 AMS data sets across Europe using a consistent ME-2 based source apportionment approach, Atmos. Chem. Phys., 14, 6159–6176, https://doi.org/10.5194/acp-14-6159-2014, 2014.
Daellenbach, K. R., Bozzetti, C., Křepelová, A., Canonaco, F., Wolf, R., Zotter, P., Fermo, P., Crippa, M., Slowik, J. G., Sosedova, Y., Zhang, Y., Huang, R.-J., Poulain, L., Szidat, S., Baltensperger, U., El Haddad, I., and Prévôt, A. S. H.: Characterization and source apportionment of organic aerosol using offline aerosol mass spectrometry, Atmos. Meas. Tech., 9, 23–39, https://doi.org/10.5194/amt-9-23-2016, 2016.
Daellenbach, K. R., Stefenelli, G., Bozzetti, C., Vlachou, A., Fermo, P., Gonzalez, R., Piazzalunga, A., Colombi, C., Canonaco, F., Hueglin, C., Kasper-Giebl, A., Jaffrezo, J.-L., Bianchi, F., Slowik, J. G., Baltensperger, U., El-Haddad, I., and Prévôt, A. S. H.: Long-term chemical analysis and organic aerosol source apportionment at nine sites in central Europe: source identification and uncertainty assessment, Atmos. Chem. Phys., 17, 13265–13282, https://doi.org/10.5194/acp-17-13265-2017, 2017.
DeCarlo, P. F., Kimmel, J. R., Trimborn, A., Northway, M. J., Jayne, J. T., Aiken, A. C., Gonin, M., Fuhrer, K., Horvath, T., Docherty, K. S., Worsnop, D. R., and Jimenez, J. L.: Field-deployable, high-resolution, time-of-flight aerosol mass spectrometer, Anal. Chem., 78, 8281–8289, https://doi.org/10.1021/Ac061249n, 2006.
Docherty, K. S., Stone, E. A., Ulbrich, I. M., DeCarlo, P. F., Snyder, D. C., Schauer, J. J., Peltier, R. E., Weber, R. J., Murphy, S. M., Seinfeld, J. H., Grover, B. D., Eatough, D. J., and Jimenez, J. L.: Apportionment of primary and secondary organic aerosols in southern california during the 2005 study of organic aerosols in riverside (SOAR-1), Environ. Sci. Technol., 42, 7655–7662, https://doi.org/10.1021/Es8008166, 2008.
Eichler, P., Müller, M., D'Anna, B., and Wisthaler, A.: A novel inlet system for online chemical analysis of semi-volatile submicron particulate matter, Atmos. Meas. Tech., 8, 1353–1360, https://doi.org/10.5194/amt-8-1353-2015, 2015.
Fine, P. M., Cass, G. R., and Simoneit, B. R. T.: Chemical characterization of fine particle emissions from fireplace combustion of woods grown in the northeastern United States, Environ. Sci. Technol., 35, 2665–2675, https://doi.org/10.1021/es001466k, 2001.
Finewax, Z., de Gouw, J. A., and Ziemann, P. J.: Identification and quantification of 4-nitrocatechol formed from OH and NO3 radical-initiated reactions of catechol in air in the presence of NOx: implications for secondary organic aerosol formation from biomass burning, Environ. Sci. Technol., 52, 1981–1989, https://doi.org/10.1021/acs.est.7b05864, 2018.
Fu, P. Q., Kawamura, K., Pavuluri, C. M., Swaminathan, T., and Chen, J.: Molecular characterization of urban organic aerosol in tropical India: contributions of primary emissions and secondary photooxidation, Atmos. Chem. Phys., 10, 2663–2689, https://doi.org/10.5194/acp-10-2663-2010, 2010.
Ge, X. L., Setyan, A., Sun, Y., and Zhang, Q.: Primary and secondary organic aerosols in Fresno, California during wintertime: Results from high resolution aerosol mass spectrometry, J. Geophys. Res., 117, D19301, https://doi.org/10.1029/2012jd018026, 2012.
Hallquist, M., Wenger, J. C., Baltensperger, U., Rudich, Y., Simpson, D., Claeys, M., Dommen, J., Donahue, N. M., George, C., Goldstein, A. H., Hamilton, J. F., Herrmann, H., Hoffmann, T., Iinuma, Y., Jang, M., Jenkin, M. E., Jimenez, J. L., Kiendler-Scharr, A., Maenhaut, W., McFiggans, G., Mentel, Th. F., Monod, A., Prévôt, A. S. H., Seinfeld, J. H., Surratt, J. D., Szmigielski, R., and Wildt, J.: The formation, properties and impact of secondary organic aerosol: current and emerging issues, Atmos. Chem. Phys., 9, 5155–5236, https://doi.org/10.5194/acp-9-5155-2009, 2009.
Hayes, P. L., Ortega, A. M., Cubison, M. J., Froyd, K. D., Zhao, Y., Cliff, S. S., Hu, W. W., Toohey, D. W., Flynn, J. H., Lefer, B. L., Grossberg, N., Alvarez, S., Rappenglueck, B., Taylor, J. W., Allan, J. D., Holloway, J. S., Gilman, J. B., Kuster, W. C., De Gouw, J. A., Massoli, P., Zhang, X., Liu, J., Weber, R. J., Corrigan, A. L., Russell, L. M., Isaacman, G., Worton, D. R., Kreisberg, N. M., Goldstein, A. H., Thalman, R., Waxman, E. M., Volkamer, R., Lin, Y. H., Surratt, J. D., Kleindienst, T. E., Offenberg, J. H., Dusanter, S., Griffith, S., Stevens, P. S., Brioude, J., Angevine, W. M., and Jimenez, J. L.: Organic aerosol composition and sources in Pasadena, California, during the 2010 CalNex campaign, J. Geophys. Res., 118, 9233–9257, https://doi.org/10.1002/jgrd.50530, 2013.
He, X., Huang, X. H. H., Chow, K. S., Wang, Q., Zhang, T., Wu, D., and Yu, J. Z.: Abundance and sources of phthalic acids, benzene-tricarboxylic acids and phenolic acids in PM2.5, Earth Space Chem., 2, 147–158, https://doi.org/10.1021/acsearthspacechem.7b00131, 2018.
Henry, R., Norris, G., Vedantham, R., and Turner, J. R.: Source region identification using Kernel smoothing, Environ. Sci. Technol., 43, 4090–4097, 2009.
Herich, H., Gianini, M. F. D., Piot, C., Močnik, G., Jaffrezo, J. L., Besombes, J. L., Prévôt, A. S. H., and Hueglin, C.: Overview of the impact of wood burning emissions on carbonaceous aerosols and PM in large parts of the Alpine region, Atmos. Environ., 89, 64–75, https://doi.org/10.1016/j.atmosenv.2014.02.008, 2014.
Iinuma, Y., Boge, O., Grafe, R., and Herrmann, H.: Methyl-nitrocatechols: atmospheric tracer compounds for biomass burning secondary organic aerosols, Environ. Sci. Technol., 44, 8453–8459, https://doi.org/10.1021/es102938a, 2010.
Jayne, J. T., Leard, D. C., Zhang, X., Davidovits, P., Smith, K. A., Kolb, C. E., and Worsnop, D. R.: Development of an aerosol mass spectrometer for size and composition analysis of submicron particles, Aerosol Sci. Technol., 33, 49–70, https://doi.org/10.1016/S0021-8502(98)00158-X, 2000.
Jimenez, J. L., Canagaratna, M. R., Donahue, N. M., Prevot, A. S. H., Zhang, Q., Kroll, J. H., DeCarlo, P. F., Allan, J. D., Coe, H., Ng, N. L., Aiken, A. C., Docherty, K. S., Ulbrich, I. M., Grieshop, A. P., Robinson, A. L., Duplissy, J., Smith, J. D., Wilson, K. R., Lanz, V. A., Hueglin, C., Sun, Y. L., Tian, J., Laaksonen, A., Raatikainen, T., Rautiainen, J., Vaattovaara, P., Ehn, M., Kulmala, M., Tomlinson, J. M., Collins, D. R., Cubison, M. J., Dunlea, E. J., Huffman, J. A., Onasch, T. B., Alfarra, M. R., Williams, P. I., Bower, K., Kondo, Y., Schneider, J., Drewnick, F., Borrmann, S., Weimer, S., Demerjian, K., Salcedo, D., Cottrell, L., Griffin, R., Takami, A., Miyoshi, T., Hatakeyama, S., Shimono, A., Sun, J. Y., Zhang, Y. M., Dzepina, K., Kimmel, J. R., Sueper, D., Jayne, J. T., Herndon, S. C., Trimborn, A. M., Williams, L. R., Wood, E. C., Middlebrook, A. M., Kolb, C. E., Baltensperger, U., and Worsnop, D. R.: Evolution of organic aerosols in the atmosphere, Science, 326, 1525–1529, https://doi.org/10.1126/science.1180353, 2009.
Kleindienst, T. E., Jaoui, M., Lewandowski, M., Offenberg, J. H., and Docherty, K. S.: The formation of SOA and chemical tracer compounds from the photooxidation of naphthalene and its methyl analogs in the presence and absence of nitrogen oxides, Atmos. Chem. Phys., 12, 8711–8726, https://doi.org/10.5194/acp-12-8711-2012, 2012.
Kroll, J. H., Donahue, N. M., Jimenez, J. L., Kessler, S. H., Canagaratna, M. R., Wilson, K. R., Altieri, K. E., Mazzoleni, L. R., Wozniak, A. S., Bluhm, H., Mysak, E. R., Smith, J. D., Kolb, C. E., and Worsnop, D. R.: Carbon oxidation state as a metric for describing the chemistry of atmospheric organic aerosol, Nat. Chem., 3, 133–139, https://doi.org/10.1038/nchem.948, 2011.
Lanz, V. A., Alfarra, M. R., Baltensperger, U., Buchmann, B., Hueglin, C., and Prévôt, A. S. H.: Source apportionment of submicron organic aerosols at an urban site by factor analytical modelling of aerosol mass spectra, Atmos. Chem. Phys., 7, 1503–1522, https://doi.org/10.5194/acp-7-1503-2007, 2007.
Lanz, V. A., Alfarra, M. R., Baltensperger, U., Buchmann, B., Hueglin, C., Szidat, S., Wehrli, M. N., Wacker, L., Weimer, S., Caseiro, A., Puxbaum, H., and Prevot, A. S. H.: Source attribution of submicron organic aerosols during wintertime inversions by advanced factor analysis of aerosol mass spectra, Environ. Sci. Technol., 42, 214–220, https://doi.org/10.1021/es0707207, 2008.
Lanz, V. A., Prévôt, A. S. H., Alfarra, M. R., Weimer, S., Mohr, C., DeCarlo, P. F., Gianini, M. F. D., Hueglin, C., Schneider, J., Favez, O., D'Anna, B., George, C., and Baltensperger, U.: Characterization of aerosol chemical composition with aerosol mass spectrometry in Central Europe: an overview, Atmos. Chem. Phys., 10, 10453–10471, https://doi.org/10.5194/acp-10-10453-2010, 2010.
Lopez-Hilfiker, F. D., Mohr, C., Ehn, M., Rubach, F., Kleist, E., Wildt, J., Mentel, Th. F., Lutz, A., Hallquist, M., Worsnop, D., and Thornton, J. A.: A novel method for online analysis of gas and particle composition: description and evaluation of a Filter Inlet for Gases and AEROsols (FIGAERO), Atmos. Meas. Tech., 7, 983–1001, https://doi.org/10.5194/amt-7-983-2014, 2014.
Lopez-Hilfiker, F. D., Pospisilova, V., Huang, W., Kalberer, M., Mohr, C., Stefenelli, G., Thornton, J. A., Baltensperger, U., Prevot, A. S. H., and Slowik, J. G.: An Extractive Electrospray Ionization Time-of-Flight Mass Spectrometer (EESI-TOF) for online measurement of atmospheric aerosol particles, Atmos. Meas. Tech. Discuss., https://doi.org/10.5194/amt-2019-45, in review, 2019.
Middlebrook, A. M., Bahreini, R., Jimenez, J. L., and Canagaratna, M. R.: Evaluation of composition-dependent collection efficiencies for the Aerodyne aerosol mass spectrometer using field data, Aerosol Sci. Technol., 46, 258–271, https://doi.org/10.1080/02786826.2011.620041, 2012.
Mohr, C., DeCarlo, P. F., Heringa, M. F., Chirico, R., Slowik, J. G., Richter, R., Reche, C., Alastuey, A., Querol, X., Seco, R., Peñuelas, J., Jiménez, J. L., Crippa, M., Zimmermann, R., Baltensperger, U., and Prévôt, A. S. H.: Identification and quantification of organic aerosol from cooking and other sources in Barcelona using aerosol mass spectrometer data, Atmos. Chem. Phys., 12, 1649–1665, https://doi.org/10.5194/acp-12-1649-2012, 2012.
Muller, M., Eichler, P., D'Anna, B., Tan, W., and Wisthaler, A.: Direct Sampling and Analysis of Atmospheric Particulate Organic Matter by Proton-Transfer-Reaction Mass Spectrometry, Anal. Chem., 89, 10889–10897, https://doi.org/10.1021/acs.analchem.7b02582, 2017.
Nah, T., Sanchez, J., Boyd, C. M., and Ng, N. L.: Photochemical aging of alpha-pinene and beta-pinene secondary organic aerosol formed from nitrate radical oxidation, Environ. Sci. Technol., 50, 222–231, https://doi.org/10.1021/acs.est.5b04594, 2016.
Nakao, S., Clark, C., Tang, P., Sato, K., and Cocker III, D.: Secondary organic aerosol formation from phenolic compounds in the absence of NOx, Atmos. Chem. Phys., 11, 10649–10660, https://doi.org/10.5194/acp-11-10649-2011, 2011.
Nakao, S., Liu, Y., Tang, P., Chen, C.-L., Zhang, J., and Cocker III, D. R.: Chamber studies of SOA formation from aromatic hydrocarbons: observation of limited glyoxal uptake, Atmos. Chem. Phys., 12, 3927–3937, https://doi.org/10.5194/acp-12-3927-2012, 2012.
Nel, A.: Air pollution-related illness: Effects of particles, Science, 308, 804–806, https://doi.org/10.1126/science.1108752, 2005.
Ng, N. L., Canagaratna, M. R., Zhang, Q., Jimenez, J. L., Tian, J., Ulbrich, I. M., Kroll, J. H., Docherty, K. S., Chhabra, P. S., Bahreini, R., Murphy, S. M., Seinfeld, J. H., Hildebrandt, L., Donahue, N. M., DeCarlo, P. F., Lanz, V. A., Prévôt, A. S. H., Dinar, E., Rudich, Y., and Worsnop, D. R.: Organic aerosol components observed in Northern Hemispheric datasets from Aerosol Mass Spectrometry, Atmos. Chem. Phys., 10, 4625–4641, https://doi.org/10.5194/acp-10-4625-2010, 2010.
Ofner, J., Krüger, H.-U., Grothe, H., Schmitt-Kopplin, P., Whitmore, K., and Zetzsch, C.: Physico-chemical characterization of SOA derived from catechol and guaiacol – a model substance for the aromatic fraction of atmospheric HULIS, Atmos. Chem. Phys., 11, 1–15, https://doi.org/10.5194/acp-11-1-2011, 2011.
Olariu, R. I., Klotz, B., Barnes, I., Becker, K. H., and Mocanu, R.: FT-IR study of the ring-retaining products from the reaction of OH radicals with phenol, o-, m-, and p-cresol, Atmos. Environ., 36, 3685–3697, https://doi.org/10.1007/1-4020-4232-9_12, 2002.
Olson, D. A., Vedantham, R., Norris, G. A., Brown, S. G., and Roberts, P.: Determining source impacts near roadways using wind regression and organic source markers, Atmos. Environ., 47, 261–268, https://doi.org/10.1016/j.atmosenv.2011.11.003, 2012.
Paatero, P.: Least squares formulation of robust non-negative factor analysis, Chemo. Intell. Lab. Syst., 37, 23–35, https://doi.org/10.1016/s0169-7439(96)00044-5, 1997.
Petit, J. E., Favez, O., Albinet, A., and Canonaco, F.: A user-friendly tool for comprehensive evaluation of the geographical origins of atmospheric pollution: Wind and trajectory analyses, Environ. Model. Soft., 88, 183–187, https://doi.org/10.1016/j.envsoft.2016.11.022, 2017.
Quan, J., Tie, X., Zhang, Q., Liu, Q., Li, X., Gao, Y., and Zhao, D.: Characteristics of heavy aerosol pollution during the 2012–2013 winter in Beijing, China, Atmos. Environ., 88, 83–89, https://doi.org/10.1016/j.atmosenv.2014.01.058, 2014.
Richard, A., Gianini, M. F. D., Mohr, C., Furger, M., Bukowiecki, N., Minguillón, M. C., Lienemann, P., Flechsig, U., Appel, K., DeCarlo, P. F., Heringa, M. F., Chirico, R., Baltensperger, U., and Prévôt, A. S. H.: Source apportionment of size and time resolved trace elements and organic aerosols from an urban courtyard site in Switzerland, Atmos. Chem. Phys., 11, 8945–8963, https://doi.org/10.5194/acp-11-8945-2011, 2011.
Samy, S., Robinson, J., and Hays, M. D.: An advanced LC-MS (Q-TOF) technique for the detection of amino acids in atmospheric aerosols, Anal. Bioanal. Chem., 401, 3103–3113, https://doi.org/10.1007/s00216-011-5238-2, 2011.
Sasaki, T. A., Wilkins, J. M., Forehand, J. B., and Moldoveanu, S. C.: Analysis of heterocyclic amines in mainstream cigarette smoke using a new NCI GC-MS technique, Anal. Lett., 34, 1749–1761, https://doi.org/10.1081/al-100105358, 2001.
Schwantes, R. H., Schilling, K. A., McVay, R. C., Lignell, H., Coggon, M. M., Zhang, X., Wennberg, P. O., and Seinfeld, J. H.: Formation of highly oxygenated low-volatility products from cresol oxidation, Atmos. Chem. Phys., 17, 3453–3474, https://doi.org/10.5194/acp-17-3453-2017, 2017.
Stefenelli, G., Jiang, J., Bertrand, A., Bruns, E. A., Pieber, S. M., Baltensperger, U., Marchand, N., Aksoyoglu, S., Prévôt, A. S. H., Slowik, J. G., and El Haddad, I.: Secondary organic aerosol formation from smoldering and flaming combustion of biomass: a box model parametrization based on volatility basis set, Atmos. Chem. Phys. Discuss., https://doi.org/10.5194/acp-2018-1308, in review, 2019a.
Stefenelli, G., Pospisilova, V., Lopez-Hilfiker, F. D., Daellenbach, K. R., Hüglin, C., Tong, Y., Baltensperger, U., Prevot, A. S. H., and Slowik, J. G.: Organic aerosol source apportionment in Zurich using extractive electrospray ionization time-of-flight mass spectrometry (EESI-TOF): Part I, biogenic influences and day/night chemistry in summer, Atmos. Chem. Phys. Discuss., https://doi.org/10.5194/acp-2019-361, in review, 2019b.
Stocker, T. F., Qin, D., Plattner, G.-K., Tignor, M., Allen, S. K., Boschung, J., Nauels , A., Xia, Y., Bex, V., and Midgley, P. M.: IPCC: Climate Change 2013: the Physical Science Basis. Contribution of Working Group to the Fifth Assessment Report of the Intergovernmental Panel on Climate Change, Cambridge University Press, Cambridge, UK, and NY, USA, 2013.
Struckmeier, C., Drewnick, F., Fachinger, F., Gobbi, G. P., and Borrmann, S.: Atmospheric aerosols in Rome, Italy: sources, dynamics and spatial variations during two seasons, Atmos. Chem. Phys., 16, 15277–15299, https://doi.org/10.5194/acp-16-15277-2016, 2016.
Sun, Y.-L., Zhang, Q., Schwab, J. J., Demerjian, K. L., Chen, W.-N., Bae, M.-S., Hung, H.-M., Hogrefe, O., Frank, B., Rattigan, O. V., and Lin, Y.-C.: Characterization of the sources and processes of organic and inorganic aerosols in New York city with a high-resolution time-of-flight aerosol mass apectrometer, Atmos. Chem. Phys., 11, 1581–1602, https://doi.org/10.5194/acp-11-1581-2011, 2011.
Sun, Y. L., Zhang, Q., Schwab, J. J., Chen, W.-N., Bae, M.-S., Hung, H.-M., Lin, Y.-C., Ng, N. L., Jayne, J., Massoli, P., Williams, L. R., and Demerjian, K. L.: Characterization of near-highway submicron aerosols in New York City with a high-resolution aerosol mass spectrometer, Atmos. Chem. Phys., 12, 2215–2227, https://doi.org/10.5194/acp-12-2215-2012, 2012.
Sun, Y. L., Wang, Z. F., Fu, P. Q., Yang, T., Jiang, Q., Dong, H. B., Li, J., and Jia, J. J.: Aerosol composition, sources and processes during wintertime in Beijing, China, Atmos. Chem. Phys., 13, 4577–4592, https://doi.org/10.5194/acp-13-4577-2013, 2013.
Timkovsky, J., Chan, A. W. H., Dorst, T., Goldstein, A. H., Oyama, B., and Holzinger, R.: Comparison of advanced offline and in situ techniques of organic aerosol composition measurement during the CalNex campaign, Atmos. Meas. Tech., 8, 5177–5187, https://doi.org/10.5194/amt-8-5177-2015, 2015.
Ulbrich, I. M., Canagaratna, M. R., Zhang, Q., Worsnop, D. R., and Jimenez, J. L.: Interpretation of organic components from Positive Matrix Factorization of aerosol mass spectrometric data, Atmos. Chem. Phys., 9, 2891–2918, https://doi.org/10.5194/acp-9-2891-2009, 2009.
Veres, P., Roberts, J. M., Burling, I. R., Warneke, C., de Gouw, J., and Yokelson, R. J.: Measurements of gas-phase inorganic and organic acids from biomass fires by negative-ion proton-transfer chemical-ionization mass spectrometry, J. Geophys. Res., 115, D23302, https://doi.org/10.1029/2010jd014033, 2010.
Wang, G., Kawamura, K., Xie, M., Hu, S., Cao, J., An, Z., Waston, J. G., and Chow, J. C.: Organic molecular compositions and size distributions of Chinese summer and autumn aerosols from Nanjing: Characteristic haze event caused by wheat straw burning, Environ. Sci. Technol., 43, 6493–6499, https://doi.org/10.1021/es204322c, 2009.
Wang, L., Atkinson, R., and Arey, J.: Dicarbonyl products of the OH radical-initiated reactions of naphthalene and the C1- and C2-alkylnaphthalenes, Environ. Sci. Technol., 41, 2803–2810, https://doi.org/10.1021/es0628102, 2007.
Wang, X., Hayeck, N., Brüggemann, M., Yao, L., Chen, H., Zhang, C., Emmelin, C., Chen, J., George, C., and Wang, L.: Chemical characteristics of organic aerosols in Shanghai: A study by ultrahigh-performance liquid chromatography coupled with orbitrap mass spectrometry, J. Geophys. Res., 122, 11703–11722, https://doi.org/10.1002/2017jd026930, 2017.
Williams, B. J., Goldstein, A. H., Kreisberg, N. M., and Hering, S. V.: An in-situ instrument for speciated organic composition of atmospheric aerosols: Thermal DesorptionAerosolGC/MS-FID (TAG), Aerosol Sci. Technol., 40, 627–638, https://doi.org/10.1080/02786820600754631, 2006.
Williams, L. R., Gonzalez, L. A., Peck, J., Trimborn, D., McInnis, J., Farrar, M. R., Moore, K. D., Jayne, J. T., Robinson, W. A., Lewis, D. K., Onasch, T. B., Canagaratna, M. R., Trimborn, A., Timko, M. T., Magoon, G., Deng, R., Tang, D., de la Rosa Blanco, E., Prévôt, A. S. H., Smith, K. A., and Worsnop, D. R.: Characterization of an aerodynamic lens for transmitting particles greater than 1 micrometer in diameter into the Aerodyne aerosol mass spectrometer, Atmos. Meas. Tech., 6, 3271–3280, https://doi.org/10.5194/amt-6-3271-2013, 2013.
Xu, L., Guo, H., Boyd, C. M., Klein, M., Bougiatioti, A., Cerully, K. M., Hite, J. R., Isaacman-VanWertz, G., Kreisberg, N. M., Knote, C., Olson, K., Koss, A., Hering, S. V., de Gouw, J., Baumann, K., Lee, S.-H., Nenes, A., Weber, R. J., and Ng, N. L.: Effects of anthropogenic emissions on aerosol formation from isoprene and monoterpenes in the southeastern United States, P. Natl. Acad. Sci. USA, 112, E4506–4507, https://doi.org/10.1073/pnas.1512277112, 2015.
Yee, L. D., Kautzman, K. E., Loza, C. L., Schilling, K. A., Coggon, M. M., Chhabra, P. S., Chan, M. N., Chan, A. W. H., Hersey, S. P., Crounse, J. D., Wennberg, P. O., Flagan, R. C., and Seinfeld, J. H.: Secondary organic aerosol formation from biomass burning intermediates: phenol and methoxyphenols, Atmos. Chem. Phys., 13, 8019–8043, https://doi.org/10.5194/acp-13-8019-2013, 2013.
Young, D. E., Kim, H., Parworth, C., Zhou, S., Zhang, X., Cappa, C. D., Seco, R., Kim, S., and Zhang, Q.: Influences of emission sources and meteorology on aerosol chemistry in a polluted urban environment: results from DISCOVER-AQ California, Atmos. Chem. Phys., 16, 5427–5451, https://doi.org/10.5194/acp-16-5427-2016, 2016.
Zhang, H., Worton, D. R., Shen, S., Nah, T., Isaacman-VanWertz, G., Wilson, K. R., and Goldstein, A. H.: Fundamental time scales governing organic aerosol multiphase partitioning and oxidative aging, Environ. Sci. Technol., 49, 9768–9777, https://doi.org/10.1021/acs.est.5b02115, 2015.
Zhang, H., Yee, L. D., Lee, B. H., Curtis, M. P., Worton, D. R., Isaacman-VanWertz, G., Offenberg, J. H., Lewandowski, M., Kleindienst, T. E., Beaver, M. R., Holder, A. L., Lonneman, W. A., Docherty, K. S., Jaoui, M., Pye, H. O. T., Hu, W., Day, D. A., Campuzano-Jost, P., Jimenez, J. L., Guo, H., Weber, R. J., de Gouw, J., Koss, A. R., Edgerton, E. S., Brune, W., Mohr, C., Lopez-Hilfiker, F. D., Lutz, A., Kreisberg, N. M., Spielman, S. R., Hering, S. V., Wilson, K. R., Thornton, J. A., and Goldstein, A. H.: Monoterpenes are the largest source of summertime organic aerosol in the southeastern United States, P. Natl. Acad. Sci. USA, 115, 2038–2043, https://doi.org/10.1073/pnas.1717513115, 2018.
Zhang, Q., Worsnop, D. R., Canagaratna, M. R., and Jimenez, J. L.: Hydrocarbon-like and oxygenated organic aerosols in Pittsburgh: insights into sources and processes of organic aerosols, Atmos. Chem. Phys., 5, 3289–3311, https://doi.org/10.5194/acp-5-3289-2005, 2005.
Zhang, Q., Jimenez, J., Canagaratna, M., Ulbrich, I., Ng, N., Worsnop, D., and Sun, Y.: Understanding atmospheric organic aerosols via factor analysis of aerosol mass spectrometry: a review, Anal. Bioanal. Chem., 401, 3045–3067, https://doi.org/10.1007/s00216-011-5355-y, 2011.
Zhang, X., Lambe, A. T., Upshur, M. A., Brooks, W. A., Gray Be, A., Thomson, R. J., Geiger, F. M., Surratt, J. D., Zhang, Z., Gold, A., Graf, S., Cubison, M. J., Groessl, M., Jayne, J. T., Worsnop, D. R., and Canagaratna, M. R.: Highly oxygenated multifunctional compounds in alpha-pinene secondary organic aerosol, Environ. Sci. Technol., 51, 5932–5940, https://doi.org/10.1021/acs.est.6b06588, 2017.
Zhang, Y., Tang, L., Sun, Y., Favez, O., Canonaco, F., Albinet, A., Couvidat, F., Liu, D., Jayne, J. T., Wang, Z., Croteau, P. L., Canagaratna, M. R., Zhou, H.-c., Prévôt, A. S. H., and Worsnop, D. R.: Limited formation of isoprene epoxydiols-derived secondary organic aerosol under NOx-rich environments in Eastern China, Geophys. Res. Lett., 2035–2043, https://doi.org/10.1002/2016gl072368, 2017.