the Creative Commons Attribution 4.0 License.
the Creative Commons Attribution 4.0 License.
 | 19 Jun 2019
Characteristics of wintertime VOCs in suburban and urban Beijing: concentrations, emission ratios, and festival effects
Junling Li
Shengrui Tong
Weigang Wang
Ru-Jin Huang
Measurements of volatile organic compounds (VOCs) were performed at a suburban site and an urban site in Beijing during the winter of 2014–2015. The VOC concentrations and emission ratios (ERs) to CO were compared at these two sites. It is found that though the VOC concentrations at the urban site are 2.67±1.15 times of those at the suburban site, the ERs are similar (within a factor of 1.5). It is indicated that (1) the VOCs at suburban areas are mainly from the transportation from the urban areas and (2) the ERs measured at the urban areas are also valid for the surrounding suburban areas. By comparing the diurnal variations and the contribution of anthropogenic emissions at both sites, we find that the photochemical processes are very active at the urban site, and these processes play an important role in the daytime oxygenated VOC (OVOC) formation. The methanol at the urban site and the formic acid at the suburban site probably have additional sources, which are attributed to be solvent use and soil/agriculture, respectively. The festival effects from the Chinese New Year (CNY) were investigated. The VOC concentrations decreased ∼60 % during CNY holidays, probably due to the population migration during festival holidays. In addition, fireworks are found to be an important source of acetonitrile, aromatics, and some OVOCs during the CNY festival and should be controlled more strictly. This study provides key characteristics of wintertime VOCs in suburban and urban Beijing and has implications for better understanding the atmospheric chemistry of VOCs in and around this megacity.
- Article
(2638 KB) -
Supplement
(989 KB) - BibTeX
- EndNote


Volatile organic compounds (VOCs) play important roles in air quality as they can form secondary pollutants such as ozone and secondary organic aerosol (SOA) during their oxidation processes in the atmosphere (Atkinson and Arey, 2003; Seinfeld and Pandis, 2016). Atmospheric VOCs have diverse primary emission sources including both anthropogenic and biogenic sources. While biogenic emissions dominate over anthropogenic emissions on a global scale (Guenther et al., 2006; Park et al., 2013), anthropogenic emissions play a more important role in urban and surrounding areas (Warneke et al., 2007; de Gouw et al., 2009; Ait-Helal et al., 2014; Wu and Xie, 2018). Urban anthropogenic emissions are complex; for example, recent studies found that the use of volatile chemical products (VCPs) constituted half of fossil fuel VOC emissions in industrialized cities in North America (McDonald et al., 2018; Coggon et al., 2018); however, transportation and industrial emissions are still the main sources in developing countries, e.g., China (Guo et al., 2017). Besides primary emissions, some oxygenated VOCs (OVOCs), such as aldehydes, ketones, and carboxylic acids, can be formed in the atmosphere through oxidation processes (Chen et al., 2014; Millet et al., 2015; Friedman et al., 2017), which makes their sources more complex. Separation of primary emission and secondary formation contributions of OVOCs remains challenging, especially for megacities with various anthropogenic emissions and chemical processes (Parrish et al., 2012; Yuan et al., 2012).
As anthropogenic emissions dominate the VOCs sources in megacities and surrounding areas, accurate estimation of the amount of anthropogenic emissions is of great significance for better understanding the role of VOCs in atmospheric chemical processes. In general, there are two approaches to estimate the anthropogenic emissions: the bottom-up method and top-down method (Borbon et al., 2013; Wang et al., 2014). The bottom-up approach is achieved by summing up emissions from all known individual activities, while the top-down approach is a measurement-based method providing emission rates of individual compounds. The top-down approach is usually more accurate and is used to evaluate the accuracy of the bottom-up emission inventory (Wang et al., 2014; S.-M. Li et al., 2017). Using the VOC emission ratios (ERs) relative to inert species, e.g., carbon monoxide (CO) is a good top-down approach. CO has good correlations with most anthropogenic VOCs, and the emission of CO is simple and well understood (Warneke et al., 2007; Bon et al., 2011; Borbon et al., 2013; Wang et al., 2014). Hence, characterization of these emission ratios is essential for better understanding the anthropogenic emissions of VOCs in megacities and to formulate effective control policies.
Beijing, the capital and one of the largest megacities in China, has suffered from severe air pollution in the past few decades (Chan and Yao, 2008; Zhang et al., 2009; Huang et al., 2014; Fu and Chen, 2017). Understanding the characteristics of VOCs (such as concentrations, diurnal variations, and emission features) in urban and suburban Beijing has great significance for understanding their atmospheric chemistry and mitigating these air pollutants. The severe haze pollution in Beijing often occurs during winter (Sun et al., 2013; Zhang et al., 2015; Zheng et al., 2015; Elser et al., 2016). However, the data of wintertime VOCs at urban and/or suburban Beijing is still very scarce (Guo et al., 2017; Liu et al., 2017), leading to difficulties in quantifying the VOC levels and emissions in Beijing and surrounding areas. In addition, during the Chinese New Year (CNY), two factors may dramatically influence the VOC concentrations and emission features in Beijing: population migration and fireworks. First, the population in Beijing drastically decreased by more than 50 % and most industrial activities were closed during CNY, because many people in this megacity move back to their hometown for the festival. Hence, CNY is a good time to investigate the effects of human activities on the pollutant levels and emission features of megacities. Second, the fireworks and firecrackers during CNY have an important impact on the air quality (Zhang et al., 2010; Li et al., 2013; J. Li et al., 2017; Cheng et al., 2014; Jiang et al., 2015). However, most of the previous studies focus on aerosols from fireworks, leaving the VOC emissions from CNY fireworks poorly understood.
In this study, we conducted online measurements of 14 VOC species (including both hydrocarbons and OVOCs) at suburban and urban Beijing during the winter of 2014–2015. The VOC concentrations at suburban and urban sites are reported and compared with each other and with previous studies. The diurnal patterns of VOCs at both sites are shown, from which the effects of primary emissions and photochemical processes on individual species are discussed. The emission ratios of these VOCs to CO at both sites are estimated. Using these ERs, the contribution of primary anthropogenic emission to each OVOC is evaluated. In addition, the effects of human activities during the Chinese New Year holidays on VOC emissions are investigated. The aim of this study is to better understanding the characteristics of wintertime VOCs at urban and suburban Beijing, especially the VOC concentrations, diurnal variations, emission features, and the effects of human activities.
2.1 Sampling sites and sampling time
The measurements were conducted at a suburban site and an urban site (Fig. 1) during the winter of 2014–2015. The suburban site (40∘24′30′′ N, 116∘40′29′′ E) is on the fourth floor of the teaching building no. 1 at the University of Chinese Academy of Sciences (UCAS), which is about 50 km away from downtown (the North 5th Ring Road). This site has been described in detail in a previous study (K. Li et al., 2017). Briefly, this is a typical suburban site, with a residential area about 500 m away at the northeast and a road with sparse traffic about 100 m away at the east. The sampling period at this site is from 24 November to 24 December 2014. The urban site (39∘59′12′′ N, 116∘19′06′′ E) is on the rooftop of a five-story building at the National Center for Nanoscience and Technology of China (NCNST). This site is close to the North 4th Ring Road (∼200 m), a road with heavy traffic. The sampling time at this site is from 31 January to 1 March 2015. This sampling time is divided into two periods: the first period is from 31 January to 15 February, which is the normal days; the second period is from 17 to 28 February, which is roughly the holidays of the Chinese New Year. The two periods are shown in Fig. 2. Based on the concentrations of CO, SO2, NOx, and VOCs, we conclude that 16 February and 1 March are the transition time between these two conditions; hence they are not included in both periods.
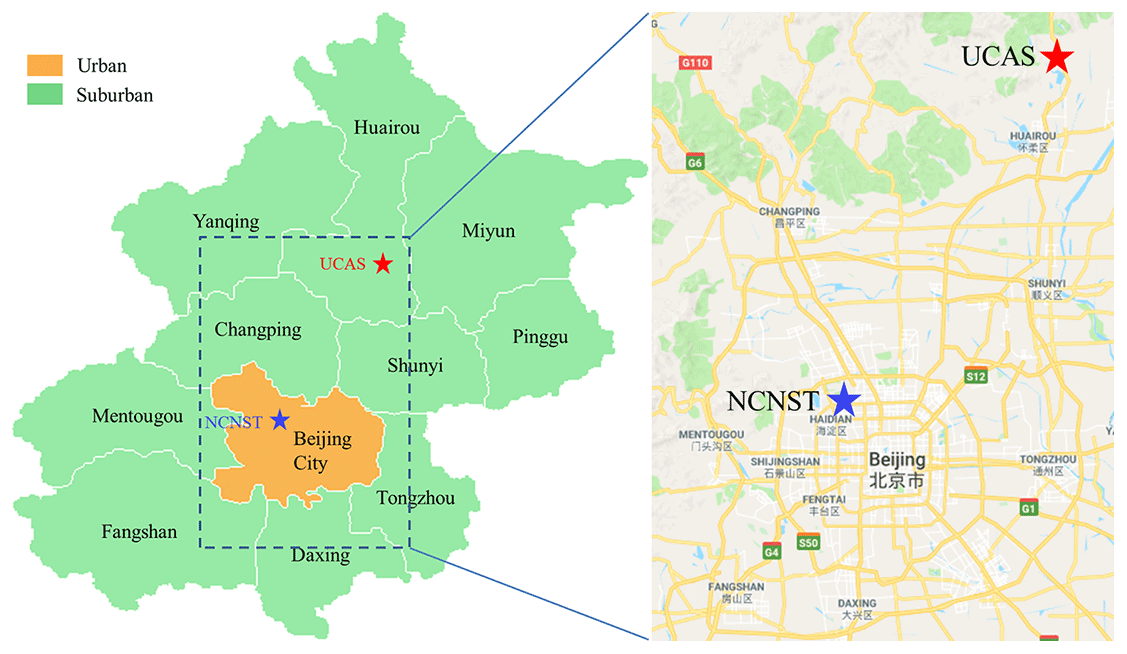
Figure 1Locations of the sampling sites. The red star is the suburban site at UCAS; the blue star is the urban site at NCNST (from Google Maps).
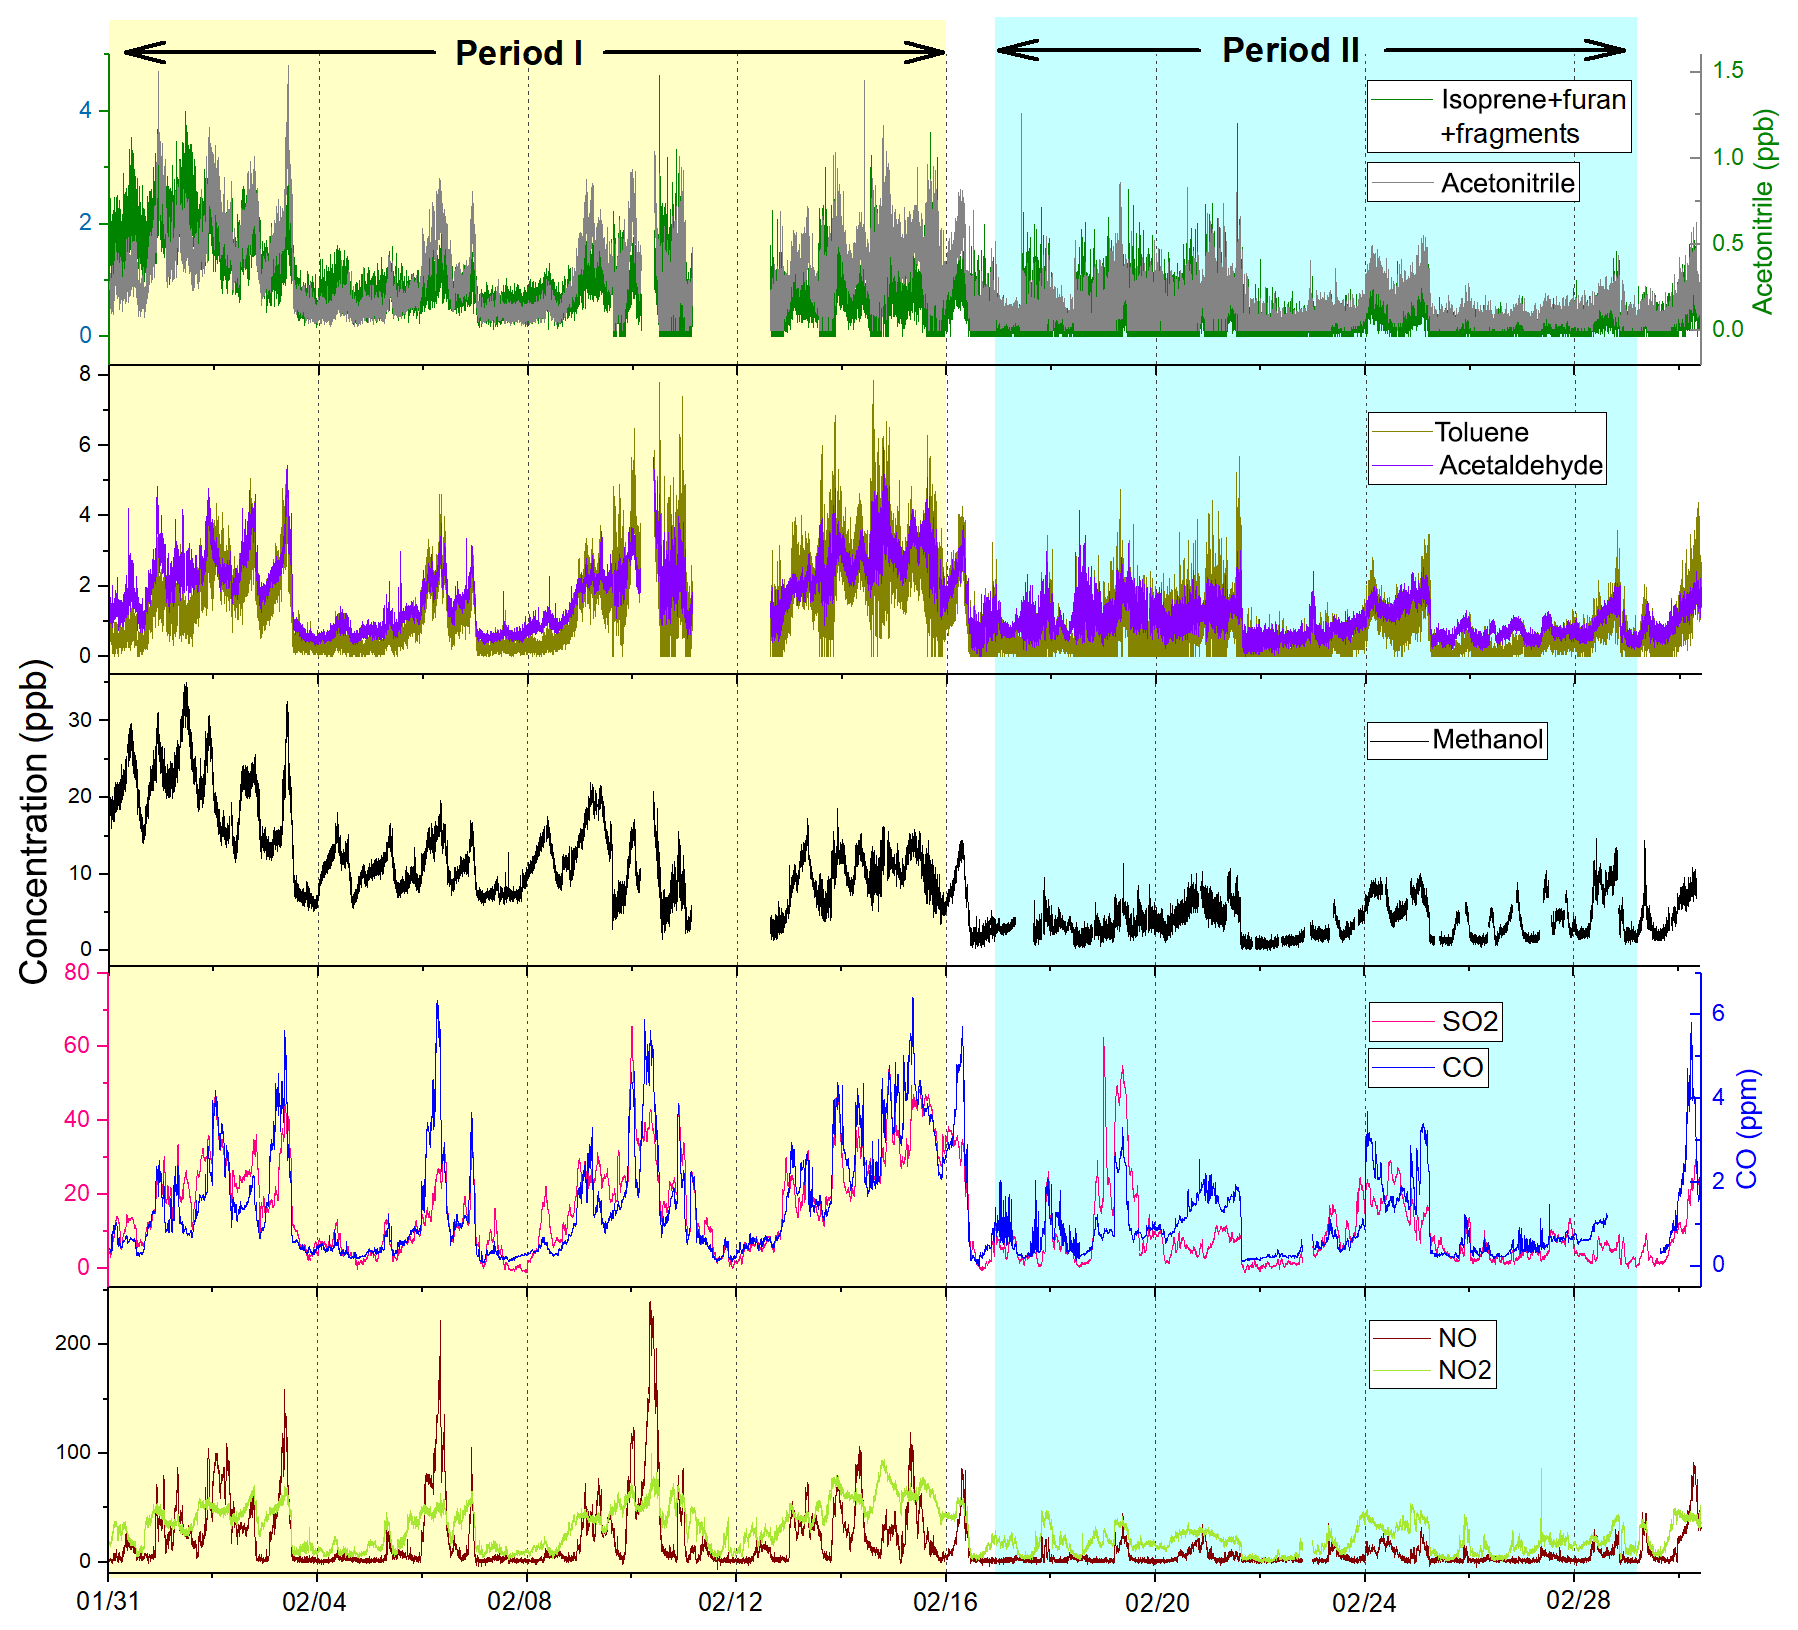
Figure 2Time series of representative VOCs, CO, SO2, and NOx at the NCNST urban site. The two periods are shown: period I is the normal days, while period II is the CNY holidays.
2.2 Measurements
VOC concentrations were online measured with quadrupole proton transfer reaction mass spectrometry (PTR-MS, Ionicon Analytik) (Lindinger et al., 1998). The CO, SO2, and NOx concentrations were measured by corresponding gas analyzers (Ecotech). The operation principle and the deployment of the PTR-MS have been described in a previous study (K. Li et al., 2017). Briefly, VOC molecules react with hydronium ions (H3O+) in a drift tube reactor and generate VOC•H+ ions (i.e., protonation). These ions are then selected by a quadrupole mass filter and detected by an electron multiplier. Using PTR-MS, only the species with a proton affinity greater than H2O (691 kJ mol−1) can be protonated and detected. During the measurements, the pressure of the drift tube was maintained at 2.2 mbar, and the reduced electric field parameter (E∕N, where E is the electric field and N is the gas number density) was 130 Td. The temperatures of the inlet line and the drift tube were both kept at 60 ∘C. The time resolution of the PTR-MS is 15 s, using the MID (multiple ion detection) mode. The sampling flow of the PTR-MS is about 110 mL min−1, and a side pump with a flow rate of 5.5 L min−1 was used for sampling.
The measured VOC•H+ ions and corresponding VOC species are listed below: (1) m∕z 42 (acetonitrile); (2) hydrocarbons including m∕z 69 (isoprene+others; see next paragraph), m∕z 137 (monoterpenes), m∕z 79 (benzene), m∕z 93 (toluene), m∕z 105 (styrene), and m∕z 107 (C8 aromatics, including ethylbenzene and xylenes); (3) oxygenated VOCs (OVOCs) including m∕z 33 (methanol), m∕z 45 (acetaldehyde), m∕z 47 (formic acid), m∕z 59 (acetone), m∕z 61 (acetic acid), m∕z 71 (methyl vinyl ketone and methacrolein, MVK+MACR,), and m∕z 73 (methyl ethyl ketone, MEK). Two background measurements were performed daily by sampling air through a Supelpure hydrocarbon trap (Supelco). The data are processed with the PTR-MS Viewer software (version 3.1). The raw counts are normalized by the signal of the H3O+ isotope, m∕z 21, and are corrected by background subtraction.
Although the quadrupole detector of the PTR-MS only detects the integer masses, previous comparison studies showed that most of these ions were influenced little by other species in the atmosphere (de Gouw and Warneke, 2007; Yuan et al., 2017). The most significant interferences are at m∕z 69, which were previously found mainly from furan and fragmentations of cycloalkanes in urban environments and 2-methyl-3-buten-2-ol (MBO) emitted from pine trees (Kaser et al., 2013; Valach et al., 2014; Yuan et al., 2017). Unfortunately, we cannot distinguish any of these compounds using the technique in this study; hence the m∕z 69 ion is considered to be isoprene+furan+fragments. There is also interference at m∕z 47, which is mainly from ethanol emitted from solvent or gasoline evaporation. However, the influence of ethanol to formic acid is likely small because the sensitivity of ethanol at m∕z 47 is very low as a result of fragmentation (Yuan et al., 2017). More details about interferences are discussed in the Results section.
The PTR-MS was calibrated with a dynamic calibrator (Thermo 146i) and a standard gas cylinder containing 65 VOCs with a mixing ratio of 1 ppm for each species (TO 15, Linde). The calibration factors were found to be within ±5 % before and after each campaign. Ten measured VOC species are in the calibration gas cylinder except acetonitrile, formic acid, acetic acid, and monoterpenes. For these four species, the transmission curve (which was calibrated using the 10 species in the calibration gas) and the reaction rates with H3O+ were used to calculate the concentration (Taipale et al., 2008; Zhao and Zhang, 2004). The sensitivities calculated by this method were compared with the permeation tubes of these four species (VICI, Valco Instruments Co. Inc.), and the differences were less than 20 %. As 20 % is the uncertainty of the permeation tube, we use the calculated sensitivities of the four species in this study.
3.1 Urban and suburban VOC concentrations
The VOC concentrations at the urban and suburban sites are shown in Table 1 and illustrated in Fig. 3. The VOC concentrations in autumn 2014 of both the urban and suburban site (Li et al., 2015; K. Li et al., 2017) are also shown in Fig. 3 for comparison. As we mentioned in Sect. 2.2, isoprene at m∕z 69 may be interfered by furan and fragments from cycloalkanes and MBO. Hence, when the isoprene concentrations are compared with other studies, a factor is applied to the m∕z 69 signal. A previous study found that ∼22 % of the signal at m∕z 69 was isoprene in urban London during winter by comparing PTR-MS and gas chromatography (GC) data (Valach et al., 2014). Here we use the same fraction to calculate the isoprene concentrations at both sites and find that the calculated concentrations are comparable to other studies (Table 1). The MVK+MACR data are also used to constrain the isoprene concentration (see Sect. S1 in the Supplement), and the results are similar to those applying this factor.
Table 1VOC concentrations at urban and suburban sites and comparison to previous studies.
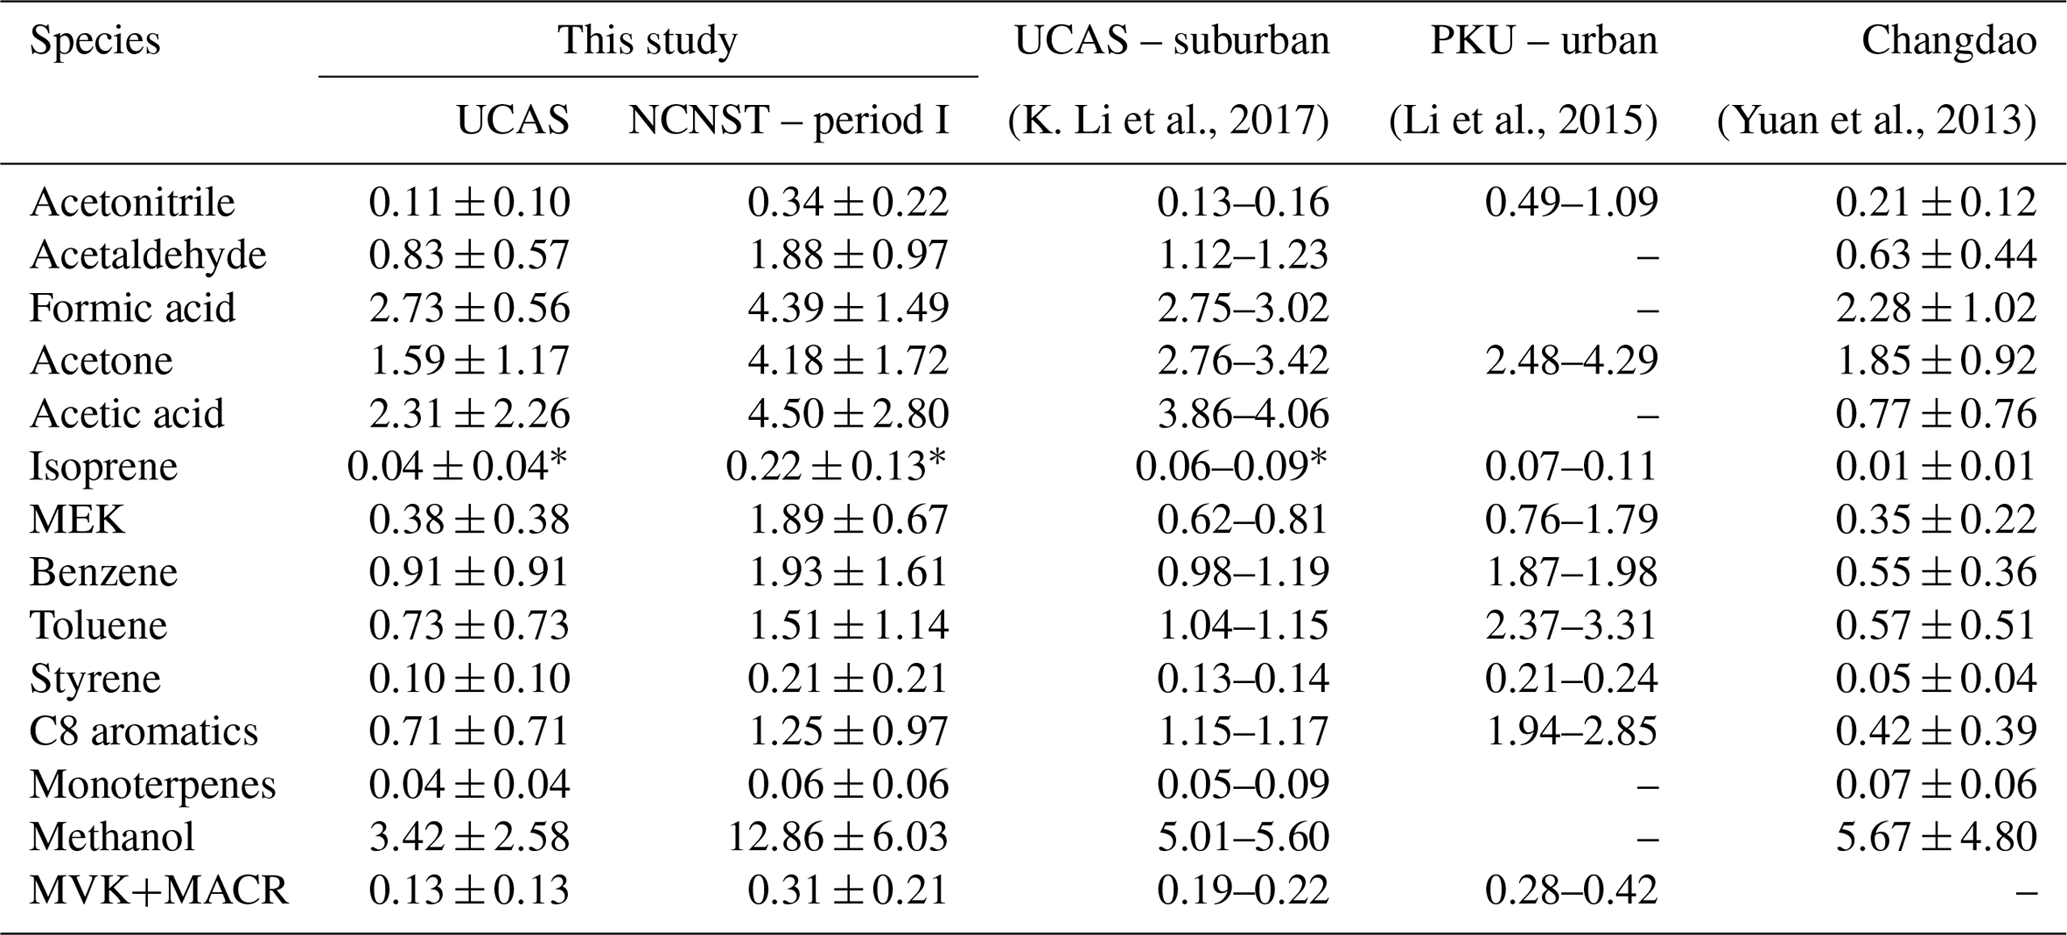
∗ A factor of 0.22 was applied to calculate the isoprene concentration from m∕z 69 (see text for details).
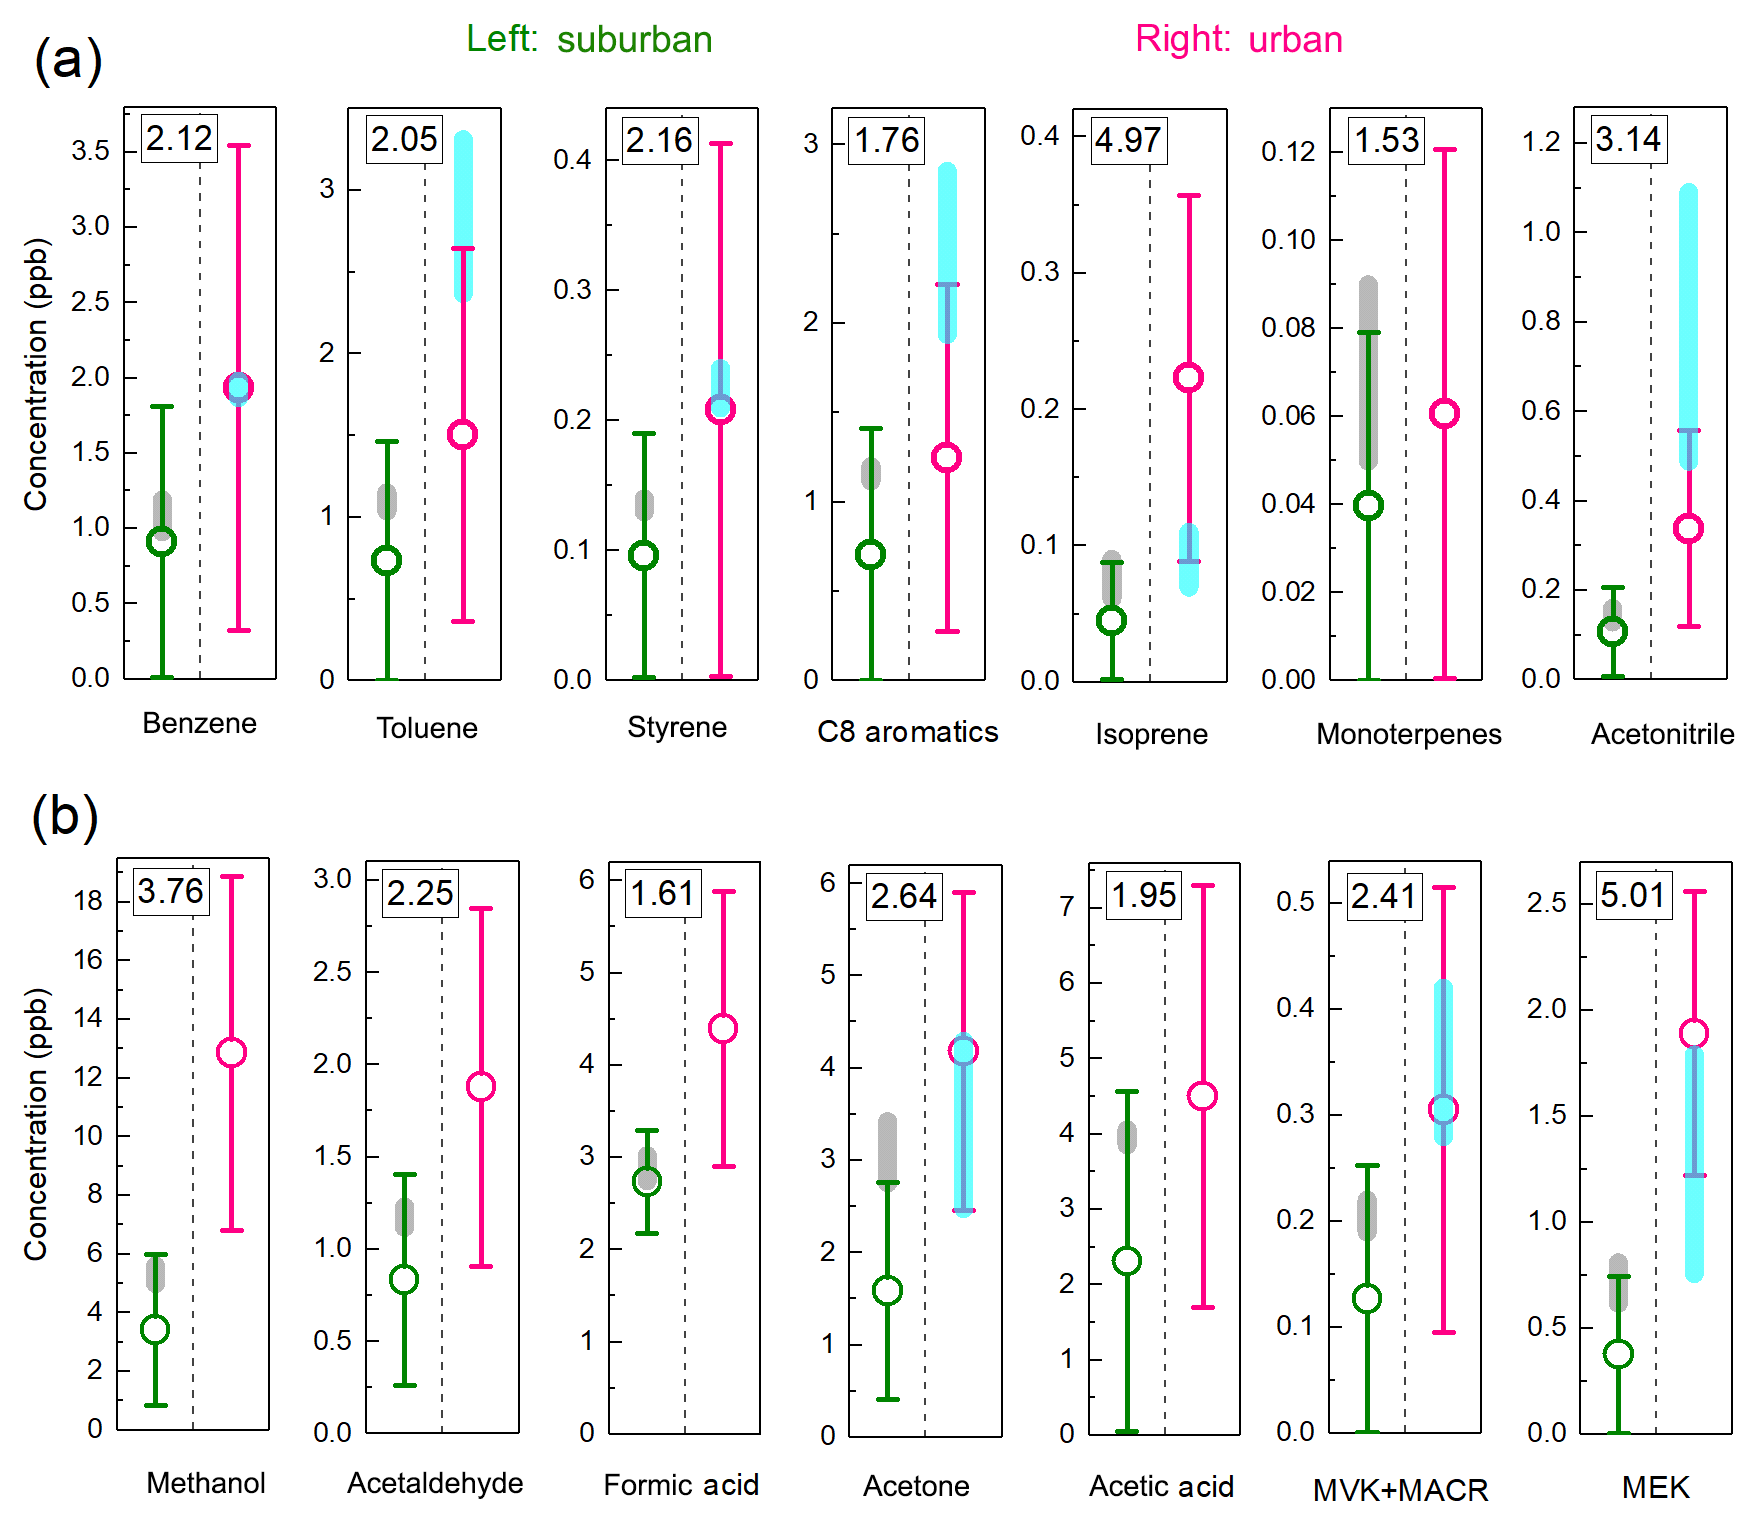
Figure 3Suburban and urban VOC average concentrations: (a) hydrocarbons and acetonitrile; (b) OVOCs. The circles are VOC concentrations of this work, of which the urban concentration is from the period I data to avoid any holiday effects. The number at the top is the ratio between urban and suburban average concentrations. The shaded areas are non-APEC average concentrations from previous studies carried out in 2014 autumn at suburban (K. Li et al., 2017) and urban (Li et al., 2015) sites. Note that a factor of 0.22 is applied to m∕z 69 for isoprene in this study and in a previous study by PTR-MS (K. Li et al., 2017).
At the suburban site, all VOC concentrations measured in this study are slightly lower compared to the VOC concentrations in autumn 2014 (K. Li et al., 2017). The possible explanation for this decrease is the change in meteorological factors. The weaker solar radiation of winter compared with autumn can cause less formation of biogenic VOCs and secondary OVOCs; the decreased temperature (about 10 ∘C lower, Fig. S1) leads to less emission of hydrocarbons from evaporation, such as gasoline evaporation, painting, and printing. For the urban site, we use only the period I data to avoid any influence from CNY holidays (Fig. 2). Compared with the concentrations at Peking University (PKU) during autumn 2014 (Li et al., 2015), the OVOC concentrations of this study are similar, but the concentrations of acetonitrile, toluene, and C8 aromatics are lower. As these species are all the main component of biomass burning emissions (Warneke et al., 2011; K. Li et al., 2017), the decrease in these species may be a result of the decrease in biomass burning emissions from autumn to winter.
As shown in Fig. 3, the concentrations of all VOCs at the urban site are higher than those at the suburban site. The ratios of urban to suburban average concentrations for each compound are marked in Fig. 3 and summarized in Fig. 4. The average ratio is 2.67±1.15. The concentrations of MEK and isoprene at the urban site are about 5 times of those at the suburban site, which are the highest factors. As will be discussed in Sect. 3.2, the difference in MEK is likely caused by the secondary source, while the differences in isoprene may have several possible explanations. The concentration of methanol at the urban site is 3.8 times of that at the suburban site, and this difference is probably from the solvent use from chemistry research institutes close to the urban site, which will be discussed in Sect. 3.3. As listed in Table 1, the VOC concentrations at the UCAS site are basically higher than those at Changdao (Yuan et al., 2013), a typical rural site, indicating that the VOC levels at UCAS are influenced by transportation from urban areas, such as urban Beijing and the city groups at the Beijing–Tianjin–Hebei area (K. Li et al., 2017).
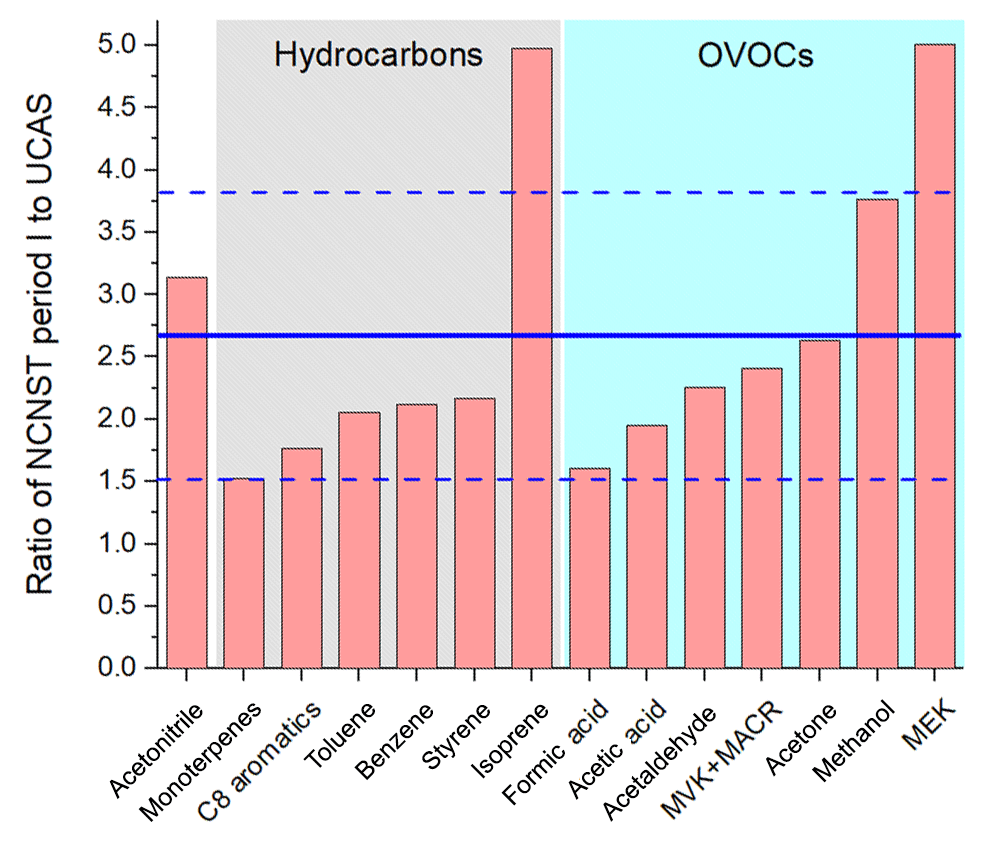
Figure 4Ratio of urban site concentration (period I) to suburban site concentration. The blue lines are average value and standard deviations.
3.2 Diurnal variations
The diurnal variations of VOCs at urban and suburban sites are shown in Fig. 5. As acetonitrile reacts very slowly with OH ( cm3 molec.−1 s−1) (Atkinson et al., 2006), it is usually considered to be a good tracer for primary emissions. As can be seen from Fig. 5a, the concentration of acetonitrile decreases at daytime, which is due to the change in boundary layer height (de Gouw et al., 2009; Bon et al., 2011; Yuan et al., 2012). The peaks of acetonitrile at 08:00–10:00 local time (LT) are due to the pollutant accumulation with a shallow boundary layer height. The patterns of acetonitrile at both sites are considered to be combinations of primary emissions and variation of boundary layer height.
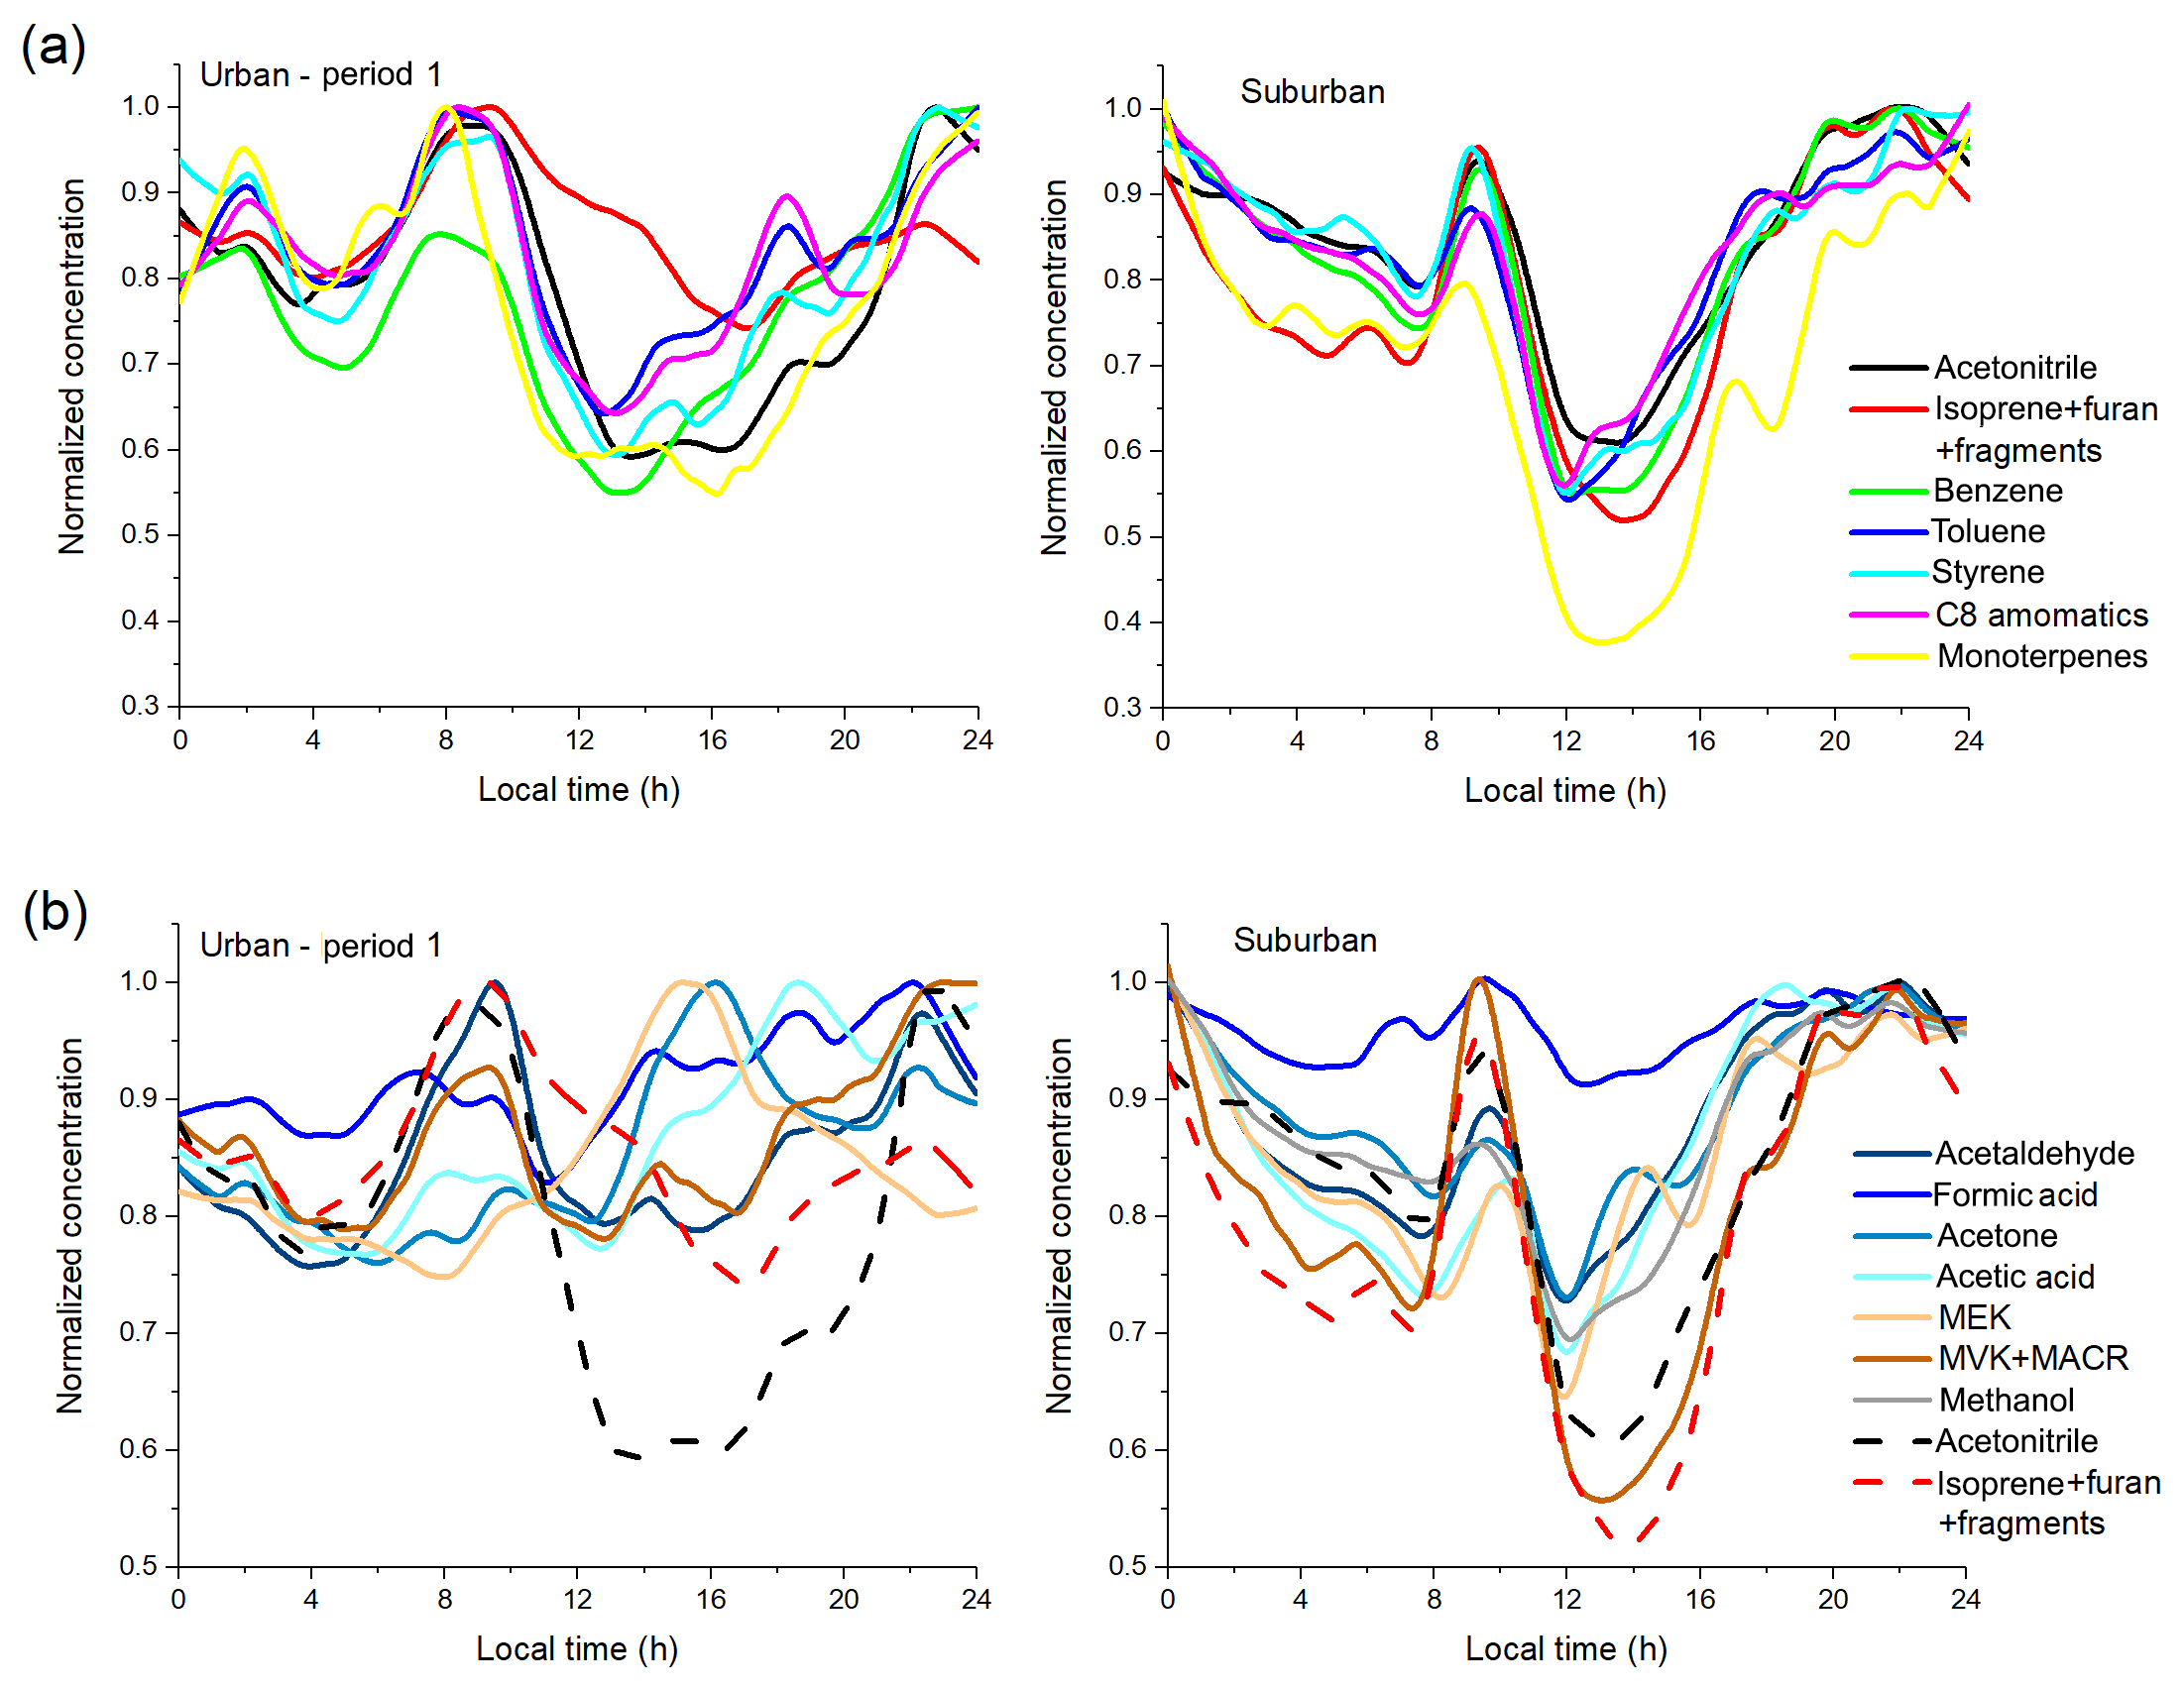
Figure 5Diurnal variations of VOCs at urban and suburban sites: (a) hydrocarbons and acetonitrile; (b) OVOCs (with acetonitrile and isoprene for comparison). Note that methanol at the urban site is not shown because of the dramatic influence of solvent use.
As shown in Fig. 5a, the hydrocarbons at the urban site have several minor peaks (e.g., 02:00 and 18:30 LT) that are not observed at the suburban site. These peaks are suggested to be vehicle emissions. The 02:00 LT peak is mainly from the freight trucks as they are not allowed to enter urban areas of Beijing before 00:00 LT and during daytime; the 18:30 LT peak is most likely from traffic rush-hour emissions. At the suburban site, the daytime decrease ratios of all hydrocarbons are higher than acetonitrile, which is due to their higher reaction rate constants with OH. At the urban site, some hydrocarbons, such as aromatics, have lower daytime decrease compared with acetonitrile, which is likely due to strong local emissions. The daytime reduction of urban m∕z 69 (isoprene+furan+fragments) is much lower than other VOCs, and also lower than suburban m∕z 69, which may be caused by two reasons. First, the signals at m∕z 69 are mainly not from isoprene; instead they are likely from furan and fragments of cycloalkanes (discussed in detail in Sect. S1 of the Supplement). Furan and cycloalkanes at m∕z 69 are mainly from anthropogenic sources such as the combustion and evaporation of fossil fuels (de Gouw and Warneke, 2007; Valach et al., 2014; Yuan et al., 2017). Hence, the emissions of these compounds may be higher in urban areas. Second, this may also be a result of higher isoprene emission at the urban site, as there are some anthropogenic sources of isoprene, e.g., motor vehicles (Borbon et al., 2001; Barletta et al., 2002; K. Li et al., 2017). This higher urban isoprene emission is further supported by the diurnal variations of MVK+MACR, as discussed below.
As shown in Fig. 5b, OVOCs have additional sources at daytime compared to inert species (e.g., acetonitrile); they are mainly attributed to secondary productions. The daytime OVOC levels are lower than nighttime at the suburban site. However, at the urban site, the secondary productions of OVOCs are so strong that they almost offset the daytime “valley” caused by boundary layer height variations. This indicates that the photochemical reactions are more active at the urban site. The diurnal variations of suburban formic acid are quite different from other suburban OVOCs, with little change during the whole day. We speculate that there are large formic acid sources in suburban areas, such as soil and agriculture (Sanhueza and Andreae, 1991; Millet et al., 2015). There is a remarkable enhancement in MVK+MACR concentration during daytime compared with the pattern of acetonitrile at the urban site, which is not observed at the suburban site. As the oxidation of isoprene is the main source of MVK+MACR, we suggest that the observed m∕z 69 enhancement in Fig. 5a at the urban site is not totally from furan and cycloalkanes. In other words, there are indeed more daytime isoprene emissions at the urban site compared to the suburban site. MEK is the OVOC with the most different concentrations at suburban and urban sites (Fig. 4), and it has complex atmospheric sources including biogenic, anthropogenic, and secondary sources (Yáñez-Serrano et al., 2016). It is shown in Fig. 5b that the urban MEK has no obvious peak at rush hours. Instead, the MEK concentration follows the variations of solar radiation, indicating its biogenic/secondary sources. It is more likely from secondary sources, as the urban average MEK concentration (1.89 ppb) is much higher than that of typical biogenic-emission-dominant sites, which is typically <0.5 ppb (Yáñez-Serrano et al., 2016). Suburban MEK also shows a peak at 14:00–15:00 LT but much lower than that at the urban site.
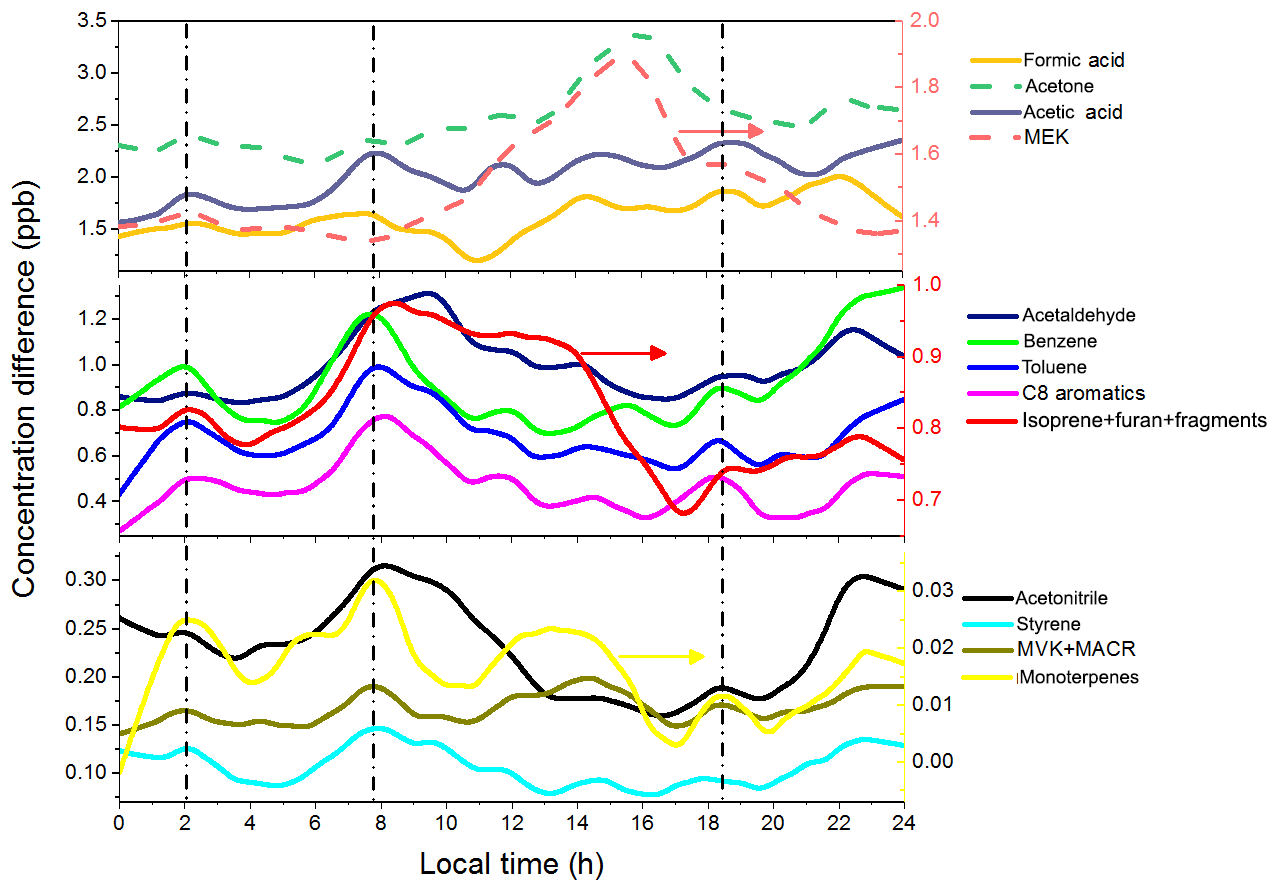
Figure 6Diurnal variations of the differences in VOC concentrations at urban and suburban sites. The vertical dashed lines indicate the rush hours related to vehicle emissions.
To better shown the difference in VOC emissions at urban and suburban sites, the diurnal variations of differences in VOC concentrations are shown in Fig. 6. Clearly, there are three rush-hour peaks from vehicle emission at about 02:00, 07:40, and 18:30 LT, respectively. Two of these peaks have been shown in Fig. 5a. From these three peaks, we know that there is a lot of VOC species related to vehicle emission. First, all aromatics show obvious peaks at rush hours, indicating that vehicle emission is their main source. Second, acetonitrile has minor peaks at rush hours, indicating that vehicle emission is one of the sources, but there are still other primary sources (e.g., biomass burning). Third, vehicle emission is a source of some OVOCs such as acetone, acetaldehyde, formic acid, and acetic acid. At last, vehicle emission is also a contributor of m∕z 69 (isoprene+furan+fragments) and monoterpenes. The most obvious secondary production at the urban site is from acetone and MEK. They both have a broad peak from 12:00 to 17:00 LT, which is most likely from photooxidation. There are probably secondary productions of other OVOCs as well, though they are not obviously shown in the diurnal variations of Fig. 6. The contribution of the secondary source on the production of OVOCs will be discussed in Sect. 3.4.
3.3 Emission ratios
VOC emission ratios to inert species such as CO are important parameters that can be used to quantify anthropogenic emissions. Generally, there are two approaches to estimate the emission ratios of VOCs to CO (Borbon et al., 2013). The first one is the photochemical-age-based method, which is described in details by de Gouw et al. (2005) and Warneke et al. (2007). However, this method is quite dependent on the accurate estimation of the ratio of a VOC pair when these species are freshly emitted, and the errors of this ratio will lead to deviations in ERs (Warneke et al., 2007). The second one is the linear regression fit of the VOC–CO scattering plot. The key to this method is to prevent photochemical influence on the regression. In this study, we use the linear regression method because (1) it is more commonly used and the photochemical influence can be avoided by using the nighttime dataset (Bon et al., 2011; Borbon et al., 2013) and (2) the estimation of the ratio of a freshly emitted VOC pair may have large uncertainties due to the limited choices of VOC species measured in this study.
Table 2VOC emission ratios to CO at the urban and suburban sites and comparison with other studies.
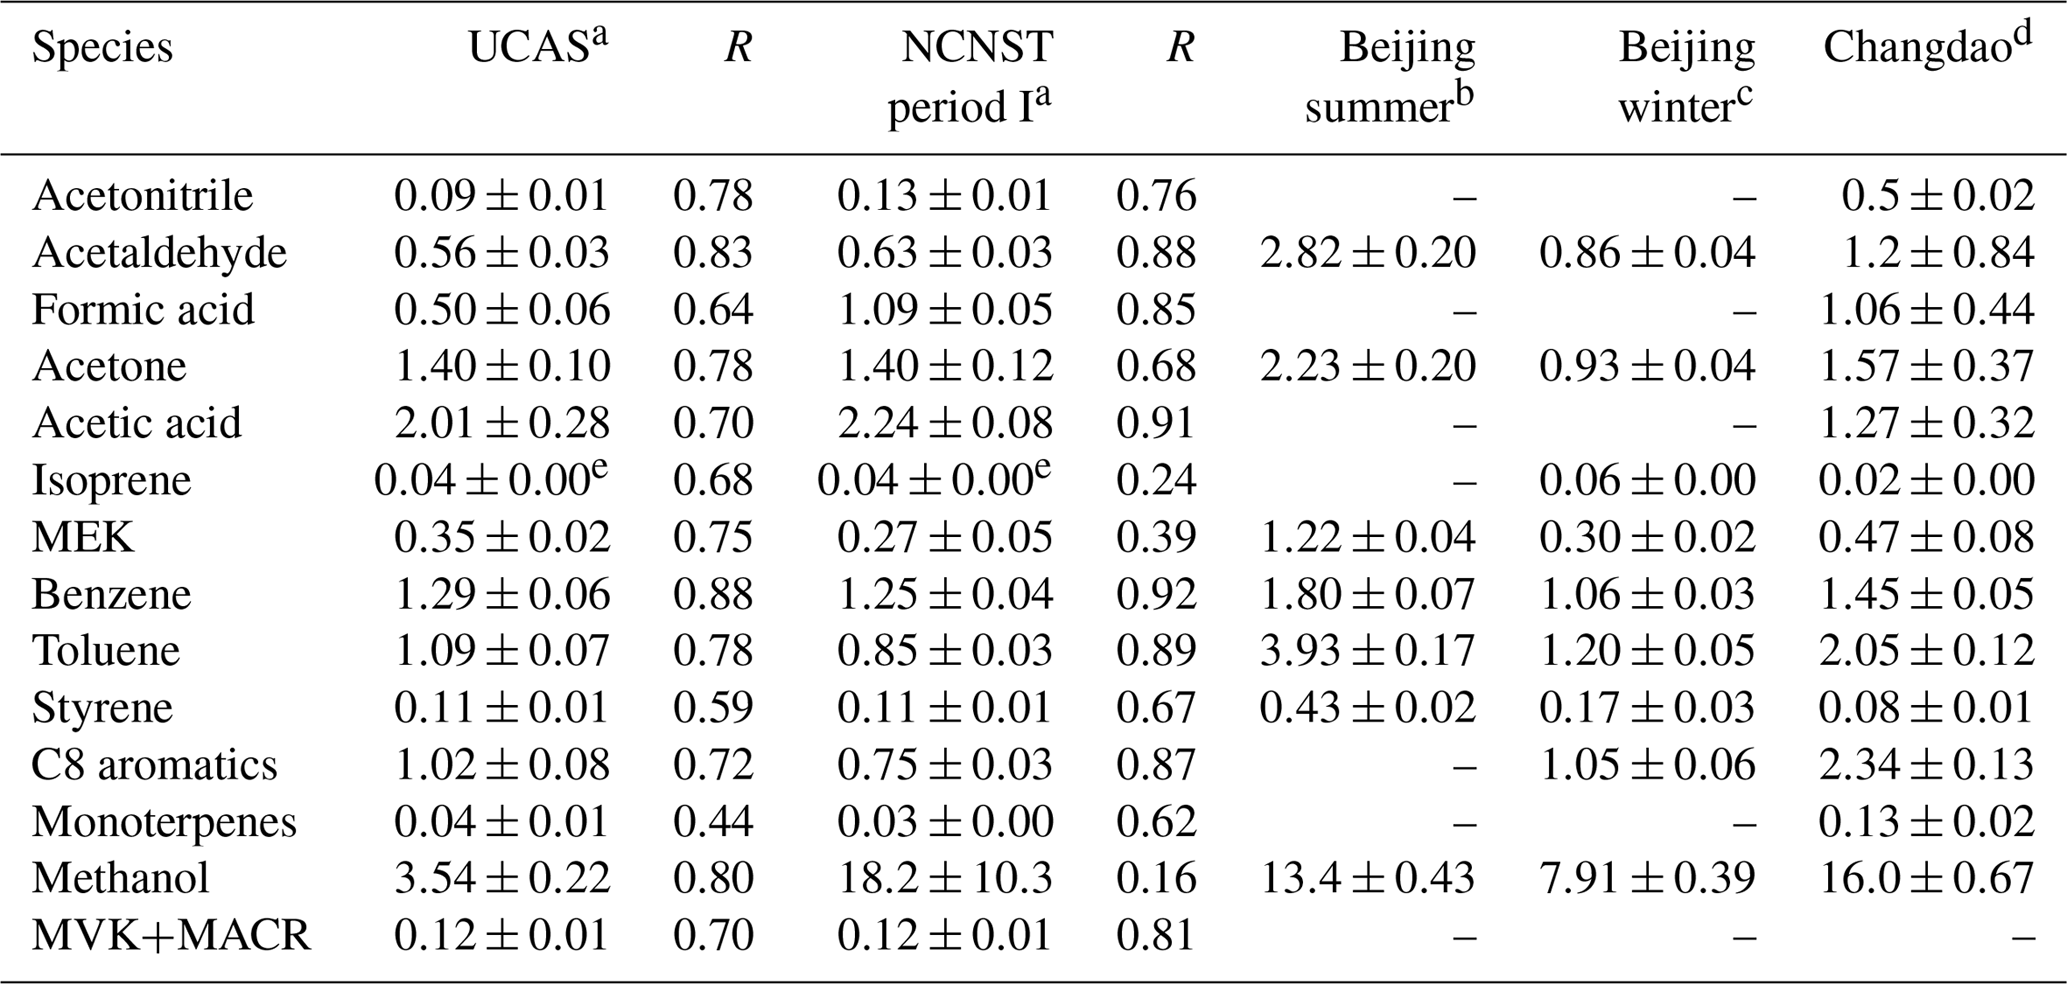
a This study. b Yuan et al. (2012). c Wang et al. (2014). d Yuan et al. (2013). e A factor of 0.22 was applied to calculate the isoprene emission ratios from m∕z 69 (see text for details).
The ERs for both urban and suburban sites are estimated by the linear orthogonal distance regressions (ODR) (Bon et al., 2011; Wang et al., 2014) using the data of 00:00–04:00 LT and are listed in Table 2. ERs from some related studies are also shown for comparison. Although only the nighttime data are used for the regression, it is shown in previous studies that the daytime ERs are very similar to nighttime ERs (Bon et al., 2011; Borbon et al., 2013). To verify this, we plot VOCs versus CO in Figs. S2 and S3 using all-day data and data of 00:00–04:00 LT. Primary VOCs with slow reaction rates with OH (e.g., acetonitrile) are good indicators to compare nighttime and daytime emissions, because the influences of consumption and production from the reactions with OH during the day are minimized. As shown in Figs. S2 and S3, the ERs of acetonitrile retrieved from 00:00–04:00 LT data are still valid when extended to all-day data, indicating similar daytime and nighttime VOC emission ratios.

Figure 7Comparison of VOC emission ratios relative to CO. (a) NCNST site vs. UCAS site of this study; (b) this study vs. urban Beijing winter (Wang et al., 2014); (c) this study vs. Changdao (Yuan et al., 2013); (d) this study vs. urban Beijing summer (Yuan et al., 2012).
It is shown in Fig. 7a that the ERs between the urban and suburban site agree very well, mostly within a factor of 1.5. The exceptions are formic acid and methanol, which have higher emission ratios at the urban site. The higher emission ratios of formic acid and methanol may be a result of the influence of solvent use from chemistry research institutes close to the sampling site. There are three chemistry institutes within the distance of 1 km from the sampling site that may influence the signal of formic acid (from interference of ethanol) and methanol: NCNST itself; the Institute of Chemistry, Chinese Academy of Sciences; and the College of Chemistry and Molecular Engineering, Peking University. The high concentrations of ethanol and methanol from the plumes of these institutes may enhance the measured ERs of formic acid and methanol. Because the sensitivity of PTR-MS to ethanol at m∕z 47 is much lower than formic acid (Yuan et al., 2017), the influence of ethanol on formic acid is relatively minor, which could be proved by the high correlation coefficient of formic acid to CO (R=0.85). However, the solvent may greatly influence the ER of methanol, as the correlation coefficient to CO is very low at the urban site (R=0.16) but high at the suburban site (R=0.80). The previous studies conducted at the PKU site (Yuan et al., 2012; Wang et al., 2014) may also be influenced by solvent use, as the PKU site is close to the NCNST site.
The comparison of this study to the wintertime ERs of a previous study conducted at urban Beijing (Wang et al., 2014) is shown in Fig. 7b. The ERs at NCNST and UCAS generally agree with those at the PKU site (within a factor of 2 except for methanol). The methanol ER at PKU is between the urban and suburban ERs of this study, which is speculated to be a result of lower influence from solvent use compared with NCNST. The comparison of this study to a previous study conducted at a rural site (Changdao, Fig. 7c) shows larger discrepancies. ERs of acetonitrile and monoterpenes are higher at Changdao (Yuan et al., 2013) compared to both sites in this study, which could be a result of the higher contribution of biomass burning at this site compared with Beijing. The higher ER of methanol at Changdao compared with UCAS might also associate with enhanced biomass burning at the rural site. When comparing these ERs with the data of summer Beijing (Yuan et al., 2012), the discrepancy is even larger. As shown in Fig. 7d, the plots are mostly below the 1 : 1 line, which means that ERs of summertime urban Beijing are larger than ERs of both sites of this study. For most of the VOCs, the summertime ERs are 2–4 times higher than those of wintertime, indicating a large seasonal difference in emissions. The same level of methanol ERs in summer and winter indicates a relative constant emission from chemical use.
3.4 Anthropogenic and biogenic/secondary contribution to OVOCs
The sources of OVOCs are very complex; hence understanding their anthropogenic and biogenic/secondary contributions is of great significance. Using the emission ratios above and the concentrations of CO, one can estimate the primary anthropogenic emission of individual OVOC species. The amount of other sources (mainly biogenic/secondary) for each OVOC can be estimated by
where PA and VMR are the primary anthropogenic component and the total volume mixing ratio of a given VOC (Brito et al., 2015; Sheng et al., 2018). As discussed in Sect. 3.3, the ERs derived from nighttime data are still applicable during the whole day.
The contributions of anthropogenic and biogenic/secondary emissions of OVOC species at the urban site are shown in Fig. 8a. During the day, the contribution of biogenic/secondary emissions (mostly secondary) increased significantly for all OVOCs, and the maximum secondary contribution appeared at 14:00–16:00 LT. The maximum secondary contribution of MEK is the highest, which is nearly 90 %. The second highest is formic acid (∼75 %) and acetone (∼70 %). The high secondary contributions of MEK and acetone agree well with the diurnal variations shown in Fig. 6. The maximum secondary contribution of acetaldehyde, acetic acid, and MVK+MACR is 50 %–60 %. These high secondary contributions indicate the strong photochemical process during the day at the urban site, despite the low temperature (about 0–10 ∘C) during the sampling period. This can be further proved by the ozone diurnal variations at the urban (period I only) and suburban sites (Fig. S5). The daytime increment of ozone at the urban site (∼15 ppb) is ∼1.5 times of that at the suburban site (∼10 ppb), which indicates stronger daytime photochemical processes at the urban site. The high secondary contributions of OVOCs agree well with previous studies during Beijing winter. For example, Chen et al. (2014) found that the secondary contribution of carbonyls during winter is 51.2 %, which is similar to the secondary contribution during summer (46 %).
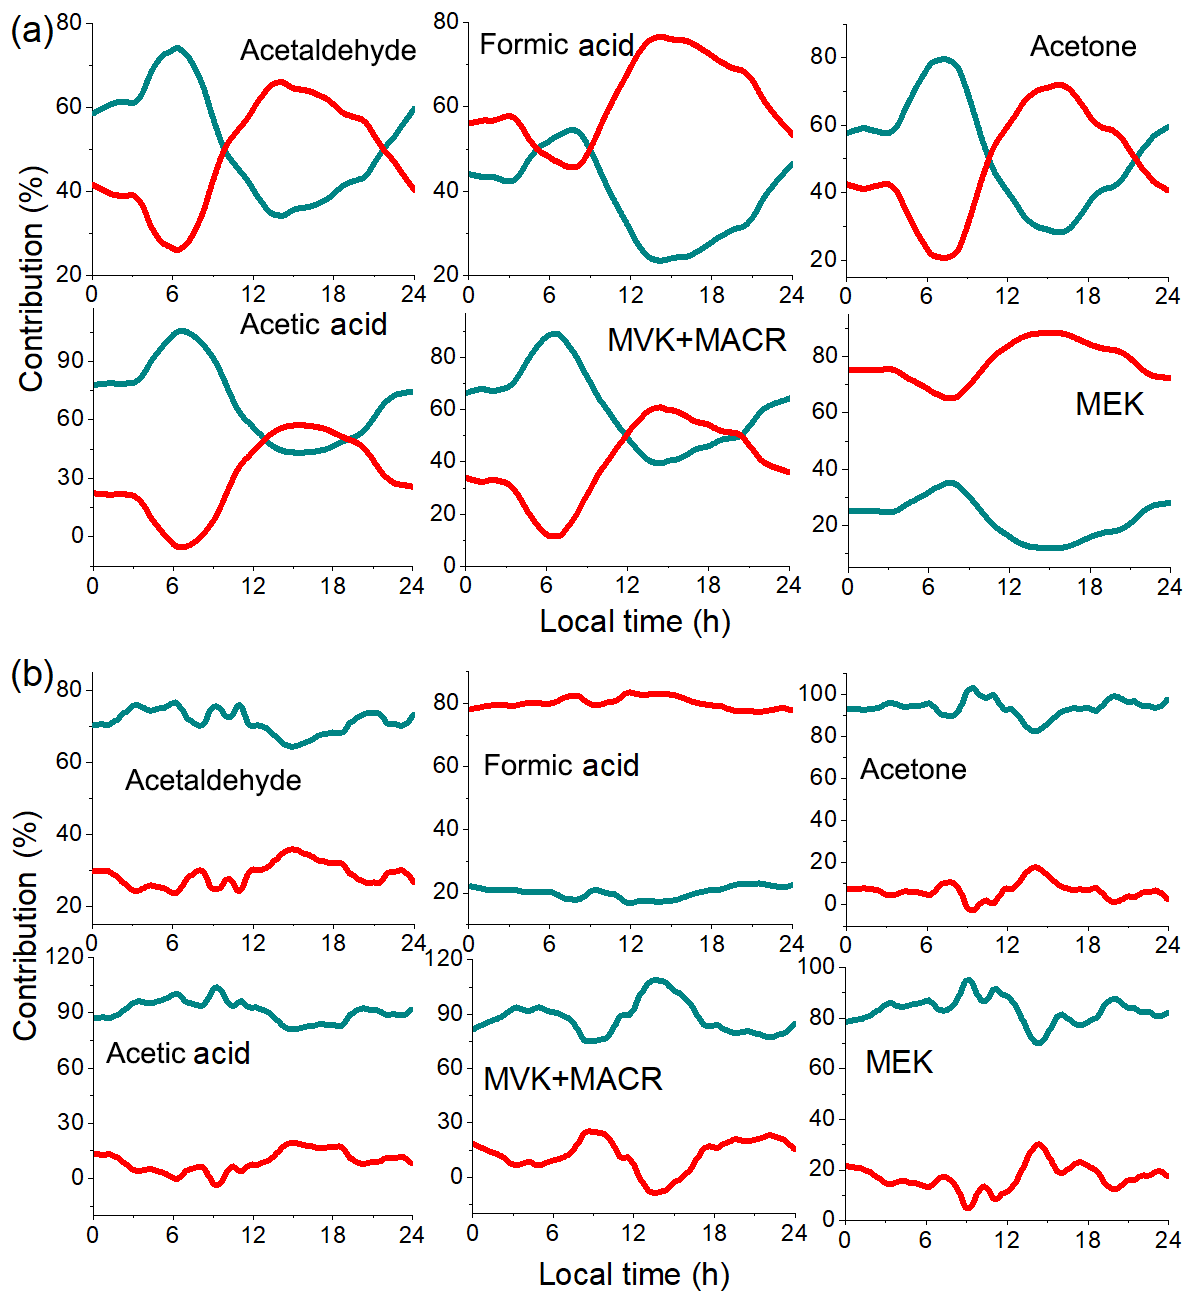
Figure 8Contributions of anthropogenic (cyan) and biogenic/secondary (red) sources to OVOC concentrations at the urban site (a) and the suburban site (b).
As shown in Fig. 8b, the local biogenic/secondary emissions of formic acid contribute ∼80 % of the total sources at the suburban site, which verifies the assumption in Sect. 3.2. For other OVOCs, the anthropogenic emissions dominate the sources at the suburban site. There are two possible explanations for this. First, the suburban VOC and oxidant (such as OH, O3) concentrations are much lower than at the urban site, leading to the weak secondary production of OVOCs, which is shown in the diurnal trends in Fig. 5b. Second, regional transportation plays a more important role than local emissions at the suburban site. During transportation, oxidation processes produce some secondary OVOCs. However, as these secondary OVOCs arrive at the suburban site at the same time as CO during transport, they are classified as “primary anthropogenic”. Hence, we conclude that one should be careful when applying this method to sites with weak local emission and strong regional transportation.
3.5 CNY festival effects
3.5.1 Concentrations and emission ratios
The population migration during CNY holidays is large. According to the data from the Beijing Municipal Bureau of Statistics (http://www.bjstats.gov.cn/tjsj/, last access: 20 July 2018), the resident population in Beijing was 21 million, and the floating population was about 8 million during 2014–2015. During CNY holidays, about 40 % of the resident population and more than 90 % of the floating population left Beijing. In other words, the Beijing population during CNY was about 45 % (40 %–50 %) of that during normal time. The effects of this large amount of population migration on VOC concentrations and ERs are discussed in this section.
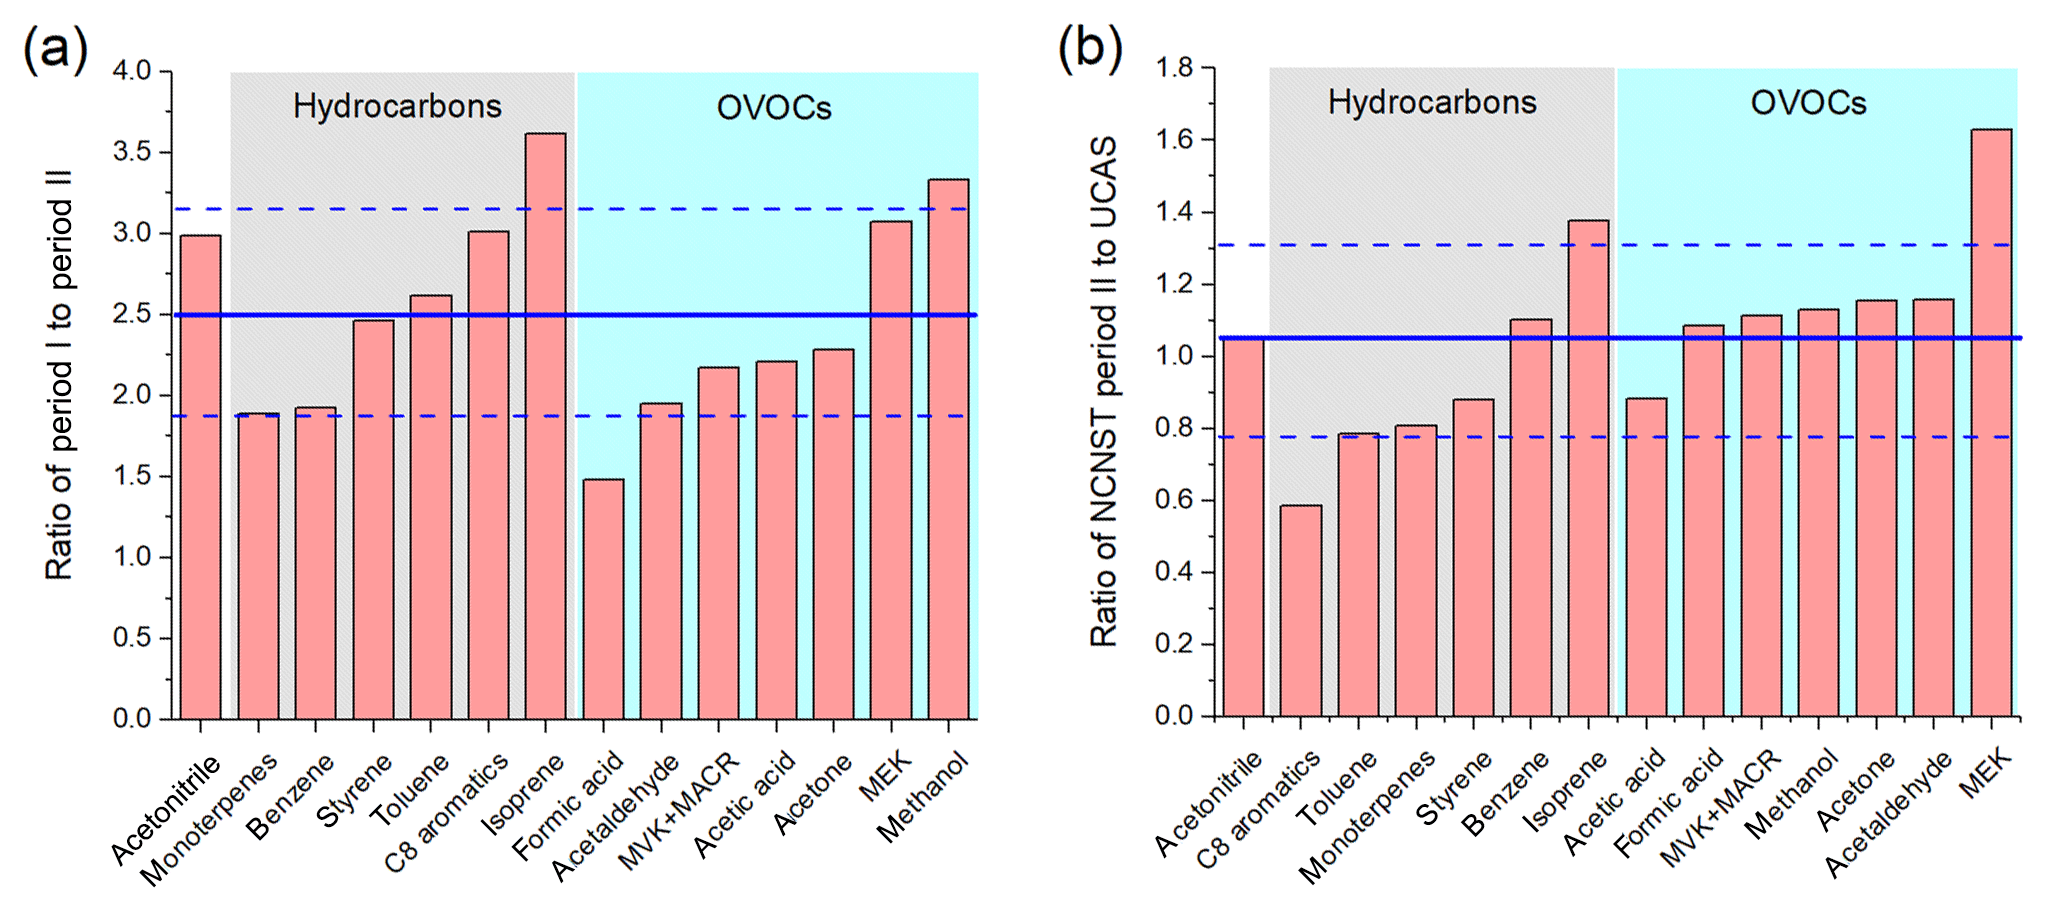
Figure 9Ratio of (a) concentrations of urban period I to concentrations of urban period II; (b) concentrations of urban period II to concentrations of the suburban site. Blue lines are average value of the ratios and standard deviations.
The comparison of average concentrations at the urban site during the non-CNY time (period I) and CNY holidays (period II) is shown in Fig. 9a. It is shown that the concentrations of all VOC species during the non-CNY period are higher than those during the CNY period, with an average ratio of 2.5±0.63. In other words, the VOC concentrations during CNY holidays are only 40 % (32 %–53 %) of those during the non-CNY period. This percentage is similar to the percentage of the population that stay in Beijing during CNY, which is about 40 %–50 %. As shown in Fig. 2, the NO concentration decreased drastically during CNY holidays, which is likely a result of the reduction of vehicles. The severe decline of aromatics, acetonitrile, and isoprene may also be from vehicle reduction. The SO2 concentration decreased as well (except for several peaks from fireworks), indicating the emissions from coal burning also decreased during CNY holidays. The emission reductions from vehicles and coal burning are all related to the population migration. In addition, other population-related anthropogenic emissions would decrease as well, such as cooking, solvent use, and construction. The drastic decrease in methanol is very likely a result of reduced solvent use. Another interesting finding is that the VOC concentrations during CNY holidays at the urban site are very similar to those of the suburban site (Fig. 9b). The average ratio of concentrations of urban period II to the suburban period is 1.05±0.26. It indicates that the population migration during CNY holidays can reduce the urban VOC concentrations to suburban levels.
Table 3 shows the VOC emission ratios at the CNY period and their change percentage compared with the non-CNY period. A total of 11 out of the 14 ERs decrease, and most of the emission ratios changed less than 30 %, except methanol. This indicates that the VOC emission features did not change too much, though the emission intensity decreased drastically. The dramatic decrease in methanol ER (86 %) indicates its strong emission during the nonholiday period, which is very likely to be due to solvent use.
Table 3Comparison of ERs of the urban site during different periods.
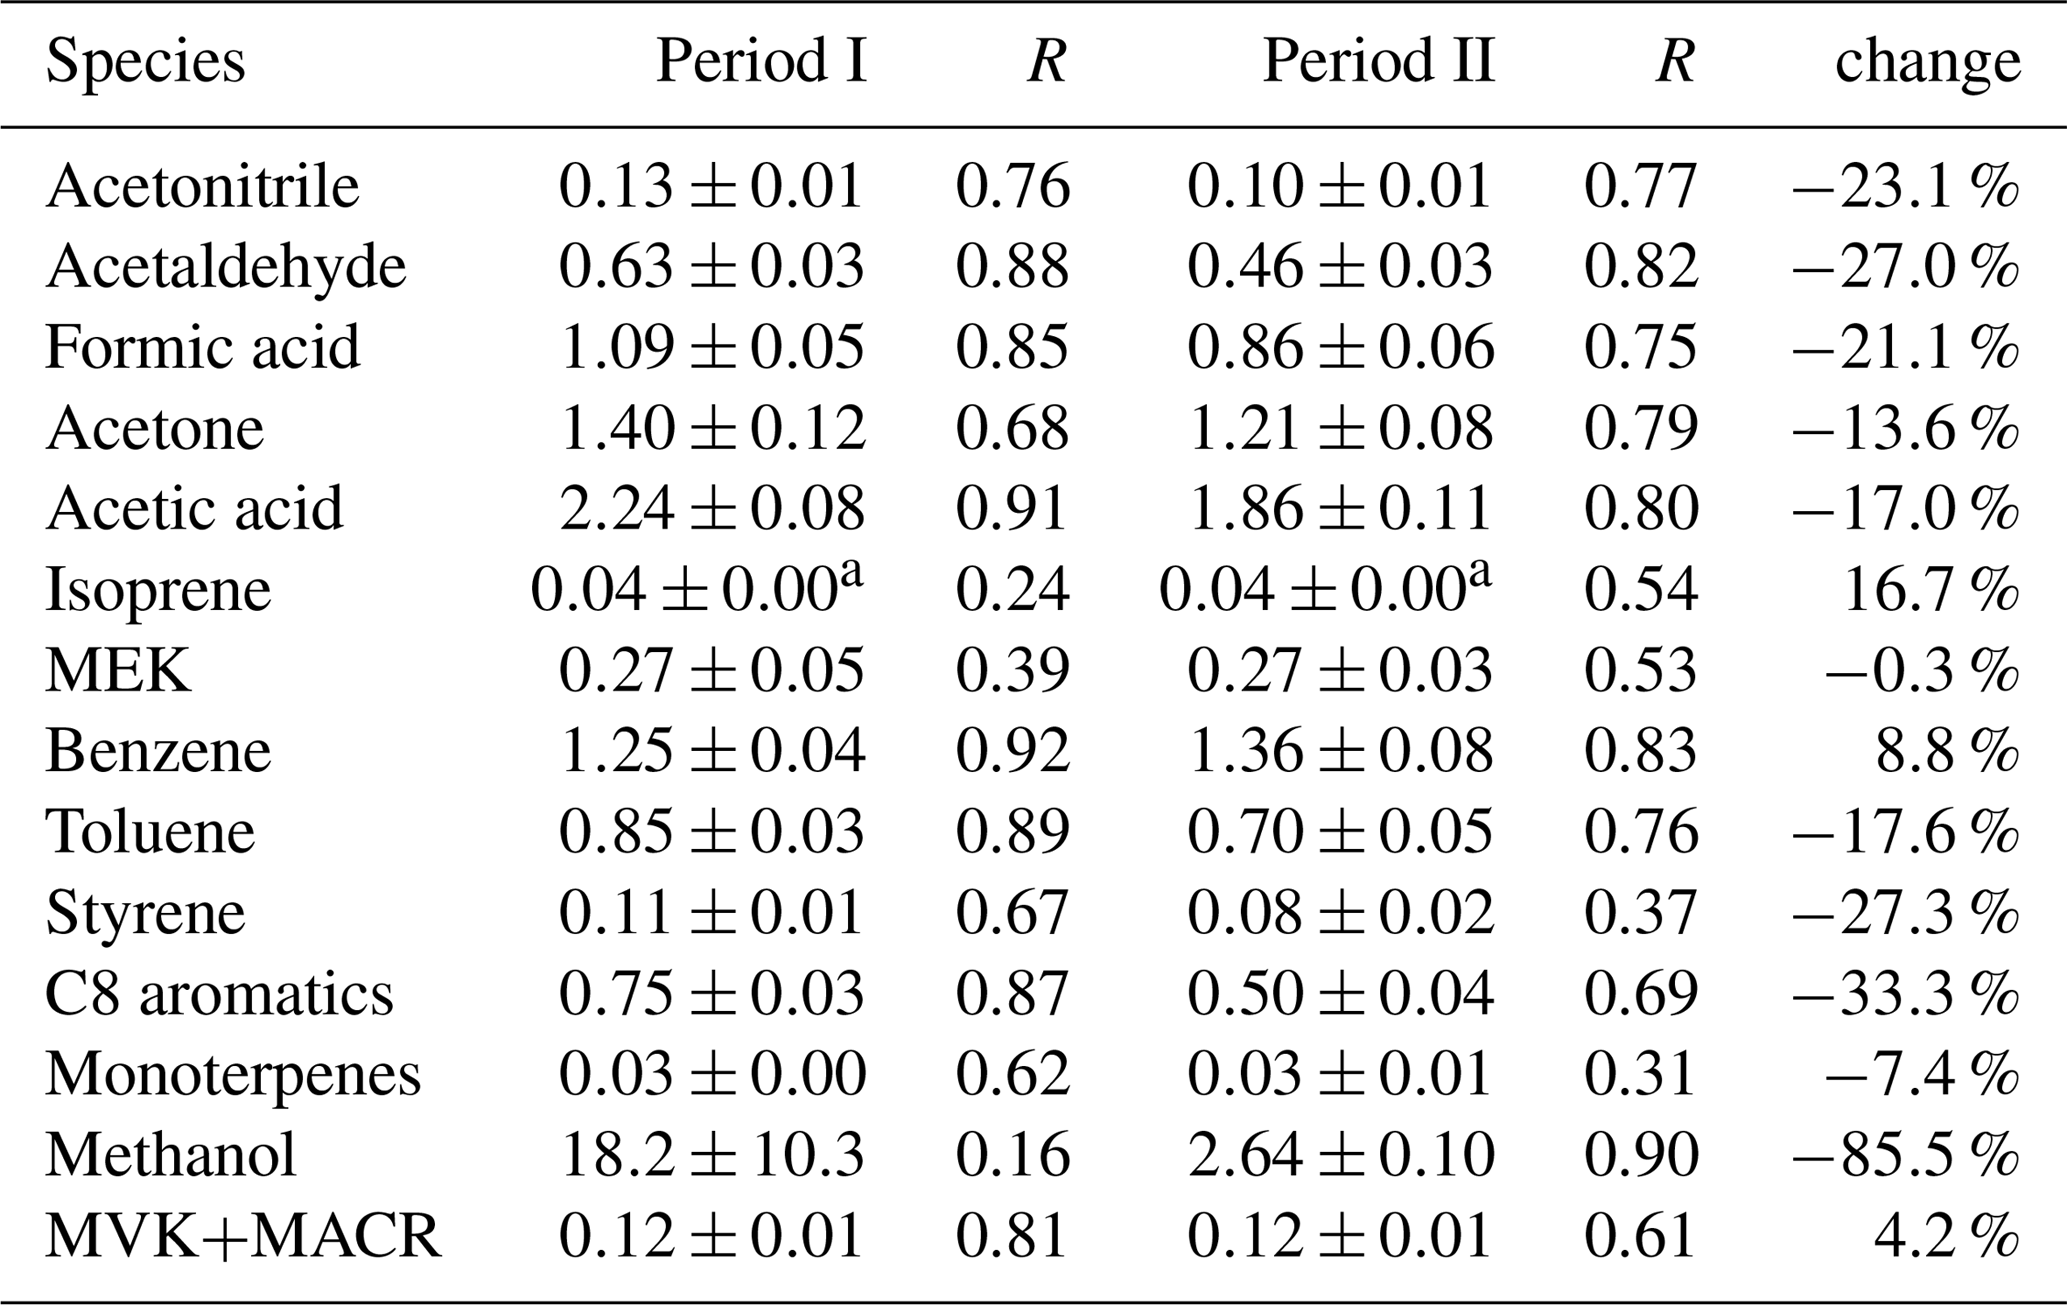
∗ A factor of 0.22 was applied to calculate the isoprene emission ratios from m∕z 69
(see text for details).
3.5.2 Fireworks
As shown in Fig. 2, the SO2 concentration increased drastically on 18–19 February (the CNY eve and festival), which was likely caused by fireworks (Chang et al., 2011). The time series of representative VOCs, CO, and SO2 from 18 February 10:00 to 19 February 18:00 are shown in Fig. 10. According to the SO2 concentration, there were three firework episodes on the night of 18 February (F1), at midnight (F2), and on the morning (F3) of 19 February. Among these episodes, F1 and F3 are similar: VOCs and CO increased with the increasing SO2. F2 is much different, with a high SO2 peak but no obvious change in VOCs and CO. F2 is at 00:00 on 19 February, which is the most important moment of the CNY festival celebration. Hence, the fireworks displayed at this time mostly have high energy (e.g., display shells). Though this kind of high-energy firework emission contains high concentration of SO2 and aerosols, the VOC emission is very low according to a recent study (Xu et al., 2018). However, during F1 and F3, more low-energy fireworks (e.g., firecrackers) were used. The use of low-energy fireworks can emit a large amount of VOCs such as aromatic hydrocarbons and phenols (Xu et al., 2018); hence the VOCs enhancements were observed during F1 and F3. The different emission features of high-energy and low-energy fireworks are likely due to the difference in combustion efficiency. The VOC species from fireworks reported in previous studies also have large differences. For example, Chang et al. (2011) found that the benzene, toluene, ethylbenzene, and xylenes (BTEX) concentrations all increased during a firework episode in Taiwan, China. However, Drewnick et al. (2006) found that the concentrations of methanol, acetonitrile, acetone, and acetaldehyde increased, while BTEX did not change significantly during a firework episode in Mainz, Germany. The different emission feature of various types of fireworks is a possible explanation of these discrepancies.
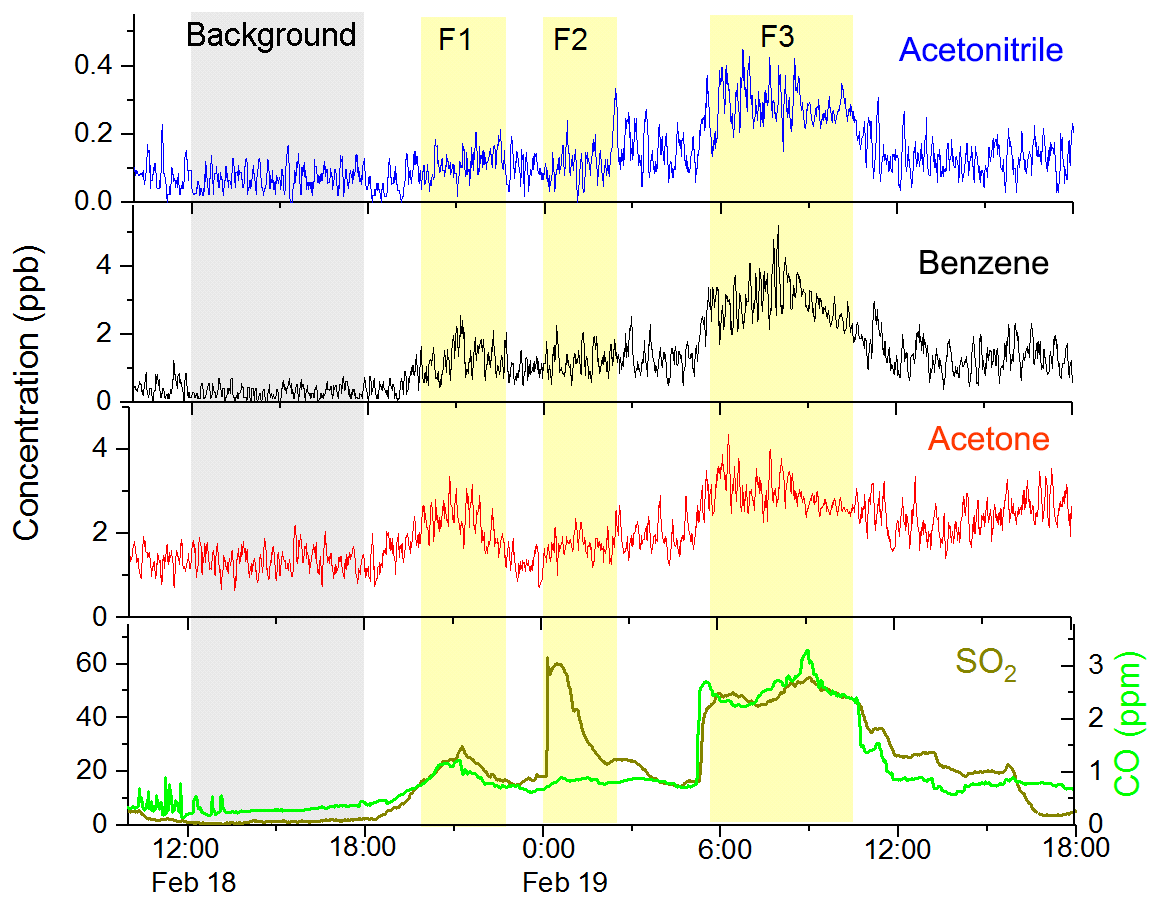
Figure 10Time series of acetonitrile, benzene, acetone, SO2, and CO during the CNY festival. F1, F2, and F3 represent three firework episodes.
The average concentrations of VOCs, CO, SO2 and NOx at a background period (12:00–18:00 of 18 February) and a firework episode (F3, 06:00–10:00 of 19 February) are listed in Table 4, along with their ratios at these two periods. During the firework episode, acetonitrile, aromatics, and four OVOCs (acetaldehyde, acetone, acetic acid, and methanol) enhanced obviously. The enhancement ratio for SO2 is the highest, nearly 40. The enhancement ratios for other species are in the range of 2.2–10. For aromatics, these ratios are in the range of 5–10, which agrees well with Chang et al. (2011). For acetaldehyde, acetone, acetic acid, and methanol, these ratios are in the range of 2.2–3.1. In addition, acetonitrile, CO, and NOx enhanced several times as well. The overall enhancement from fireworks indicates that it is a major emission source of gas-phase pollutants during the CNY festival. Hence, more strict control policy on fireworks should be conducted to reduce the concentrations of VOCs and other gas pollutants. From 2005 to 2017, fireworks were allowed in Beijing in specified areas and at specified time. The new policy conducted from 2018 is that fireworks are all prohibited in urban Beijing (within the 5th Ring Road), which may reduce the VOC emission from fireworks. The effectiveness of this new policy in cleaning the air during the CNY festival needs to be investigated in future studies.
Table 4Average concentrations of VOCs, CO, SO2, and NOx at a background period and a firework episode.
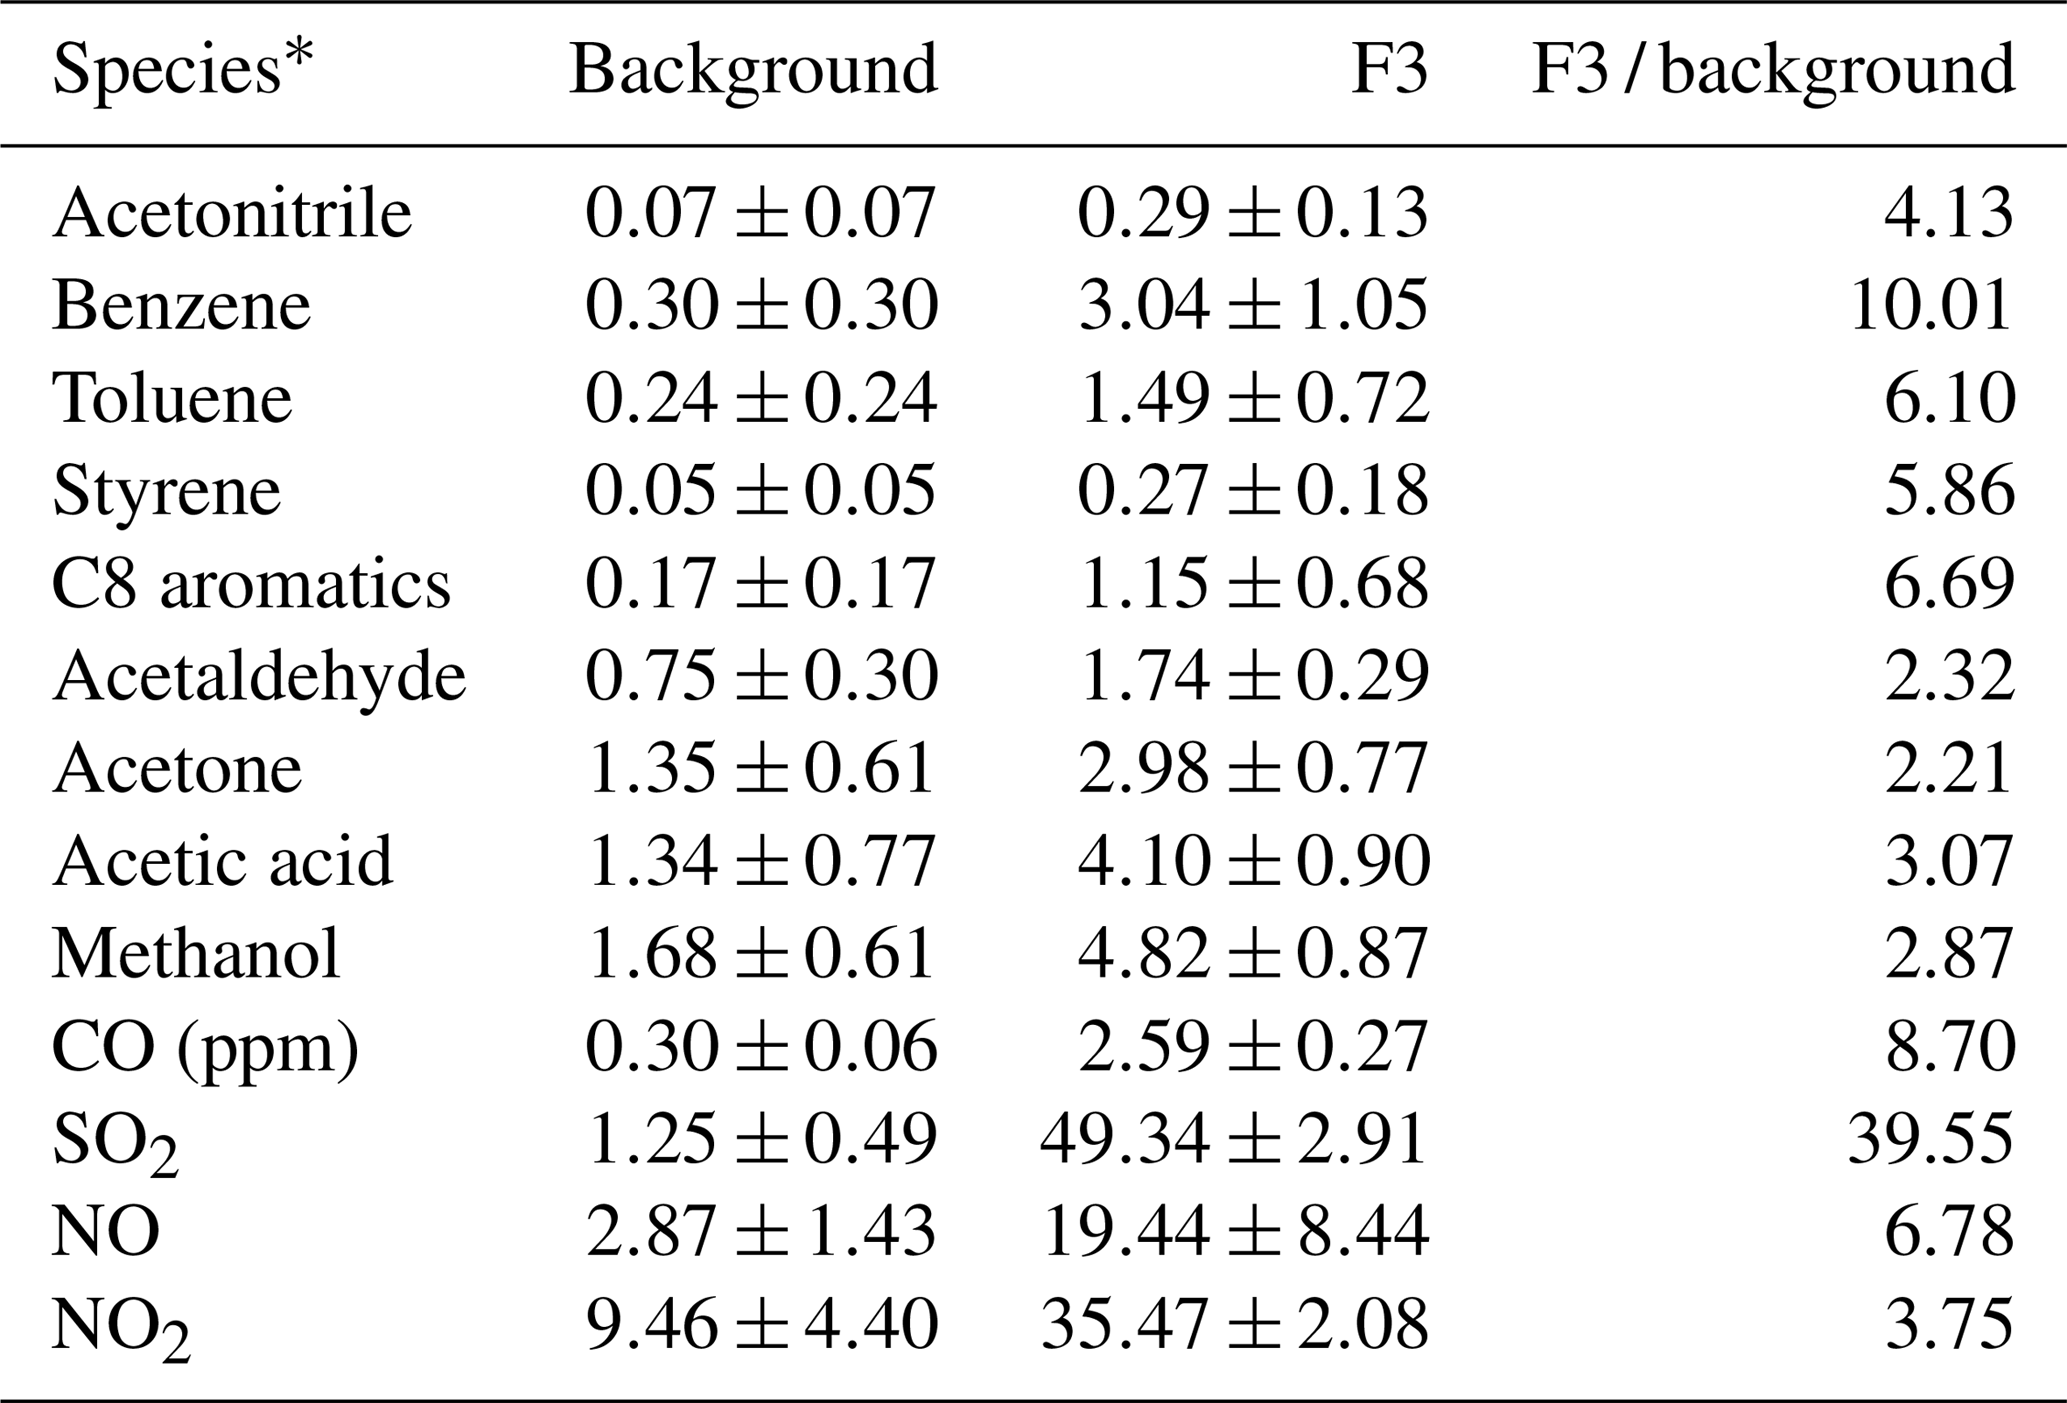
∗ The units of these concentrations are ppb, except CO.
Wintertime VOCs were online measured by a PTR-MS at suburban and urban Beijing in December 2014 and February 2015, respectively. It is found that the urban VOC concentrations are higher than the suburban ones for all the 14 measured VOCs, with a factor of 2.67±1.15. However, the VOC concentrations at the suburban site are higher than rural levels, indicating it is influenced by the transportation from urban Beijing and the city groups at the Beijing–Tianjin–Hebei area. VOC diurnal variations are different at these two sites, likely due to the stronger local emission (e.g., vehicles) and photochemical processes at the urban site. The emission ratios of VOCs to CO are estimated for both sites, and they are within a factor of 1.5 (except methanol and formic acid), indicating similar anthropogenic emission features. It is also found that the wintertime ERs are much smaller than those in summer, indicating very different emission features in different seasons.
Using emission ratios and CO, we estimated the contributions of primary anthropogenic emission and biogenic/secondary sources for OVOC species. It is found that the photochemical processes play an important role in the secondary formation of OVOCs at the urban site, with the maximum secondary contribution of 50 %–90 % during the day. Combining the data of diurnal variations, ERs, and anthropogenic contributions, we conclude that there are additional sources for methanol at the urban site and formic acid at the suburban site, which are suggested to be solvent use and soil/agriculture, respectively.
The effects of the Chinese New Year on VOC characteristics are studied. During CNY holidays, the VOC concentrations decreased ∼60 %, but the ERs are similar (except for methanol), indicating that the emission intensity decreased drastically because of the population migration, without too much change in the contributions of different anthropogenic emission sources. The emission ratio of methanol decreased by 86 % during CNY, verifying its solvent source during the nonholiday period. It is also found that the fireworks are an important source of acetonitrile, aromatics, OVOCs (acetaldehyde, acetone, acetic acid, and methanol), CO, SO2, and NOx during the CNY festival, highlighting the importance of strict emission control of fireworks.
The data used in this study are available from the corresponding author upon request (gemaofa@iccas.ac.cn).
The supplement related to this article is available online at: https://doi.org/10.5194/acp-19-8021-2019-supplement.
MG, KL, and ST designed the research. KL and JL performed the VOCs measurements. RJH provided the CO, SO2, and NOx data. KL analyzed the data and prepared the manuscript. JL, ST, WW, RJH, and MG commented on the manuscript.
The authors declare that they have no conflict of interest.
This article is part of the special issue “Regional transport and transformation of air pollution in eastern China”. It is not associated with a conference.
We thank Samar G. Moussa for helpful discussions.
This research has been supported by the National Key Research and Development Program of China (grant nos. 2016YFC0202202 and 2017YFC0212701) and the National Natural Science Foundation of China (grant nos. 91544227, 21477134, and 91644219).
This paper was edited by Renyi Zhang and reviewed by two anonymous referees.
Ait-Helal, W., Borbon, A., Sauvage, S., de Gouw, J. A., Colomb, A., Gros, V., Freutel, F., Crippa, M., Afif, C., Baltensperger, U., Beekmann, M., Doussin, J.-F., Durand-Jolibois, R., Fronval, I., Grand, N., Leonardis, T., Lopez, M., Michoud, V., Miet, K., Perrier, S., Prévôt, A. S. H., Schneider, J., Siour, G., Zapf, P., and Locoge, N.: Volatile and intermediate volatility organic compounds in suburban Paris: variability, origin and importance for SOA formation, Atmos. Chem. Phys., 14, 10439–10464, https://doi.org/10.5194/acp-14-10439-2014, 2014.
Atkinson, R. and Arey, J.: Atmospheric Degradation of Volatile Organic Compounds, Chem. Rev., 103, 4605-04638, https://doi.org/10.1021/cr0206420, 2003.
Atkinson, R., Baulch, D. L., Cox, R. A., Crowley, J. N., Hampson, R. F., Hynes, R. G., Jenkin, M. E., Rossi, M. J., Troe, J., and IUPAC Subcommittee: Evaluated kinetic and photochemical data for atmospheric chemistry: Volume II – gas phase reactions of organic species, Atmos. Chem. Phys., 6, 3625–4055, https://doi.org/10.5194/acp-6-3625-2006, 2006.
Barletta, B., Meinardi, S., Simpson, I. J., Khwaja, H. A., Blake, D. R., and Rowland, F. S.: Mixing ratios of volatile organic compounds (VOCs) in the atmosphere of Karachi, Pakistan, Atmos. Environ., 36, 3429–3443, https://doi.org/10.1016/S1352-2310(02)00302-3, 2002.
Bon, D. M., Ulbrich, I. M., de Gouw, J. A., Warneke, C., Kuster, W. C., Alexander, M. L., Baker, A., Beyersdorf, A. J., Blake, D., Fall, R., Jimenez, J. L., Herndon, S. C., Huey, L. G., Knighton, W. B., Ortega, J., Springston, S., and Vargas, O.: Measurements of volatile organic compounds at a suburban ground site (T1) in Mexico City during the MILAGRO 2006 campaign: measurement comparison, emission ratios, and source attribution, Atmos. Chem. Phys., 11, 2399–2421, https://doi.org/10.5194/acp-11-2399-2011, 2011.
Borbon, A., Fontaine, H., Veillerot, M., Locoge, N., Galloo, J. C., and Guillermo, R.: An investigation into the traffic-related fraction of isoprene at an urban location, Atmos. Environ., 35, 3749–3760, https://doi.org/10.1016/S1352-2310(01)00170-4, 2001.
Borbon, A., Gilman, J. B., Kuster, W. C., Grand, N., Chevaillier, S., Colomb, A., Dolgorouky, C., Gros, V., Lopez, M., Sarda-Esteve, R., Holloway, J., Stutz, J., Petetin, H., McKeen, S., Beekmann, M., Warneke, C., Parrish, D. D., and de Gouw, J. A.: Emission ratios of anthropogenic volatile organic compounds in northern mid-latitude megacities: Observations versus emission inventories in Los Angeles and Paris, J. Geophys. Res.-Atmos., 118, 2041–2057, https://doi.org/10.1002/jgrd.50059, 2013.
Brito, J., Wurm, F., Yanez-Serrano, A. M., de Assuncao, J. V., Godoy, J. M., and Artaxo, P.: Vehicular Emission Ratios of VOCs in a Megacity Impacted by Extensive Ethanol Use: Results of Ambient Measurements in Sao Paulo, Brazil, Environ. Sci. Technol., 49, 11381–11387, https://doi.org/10.1021/acs.est.5b03281, 2015.
Chan, C. K. and Yao, X.: Air pollution in mega cities in China, Atmos. Environ., 42, 1–42, https://doi.org/10.1016/j.atmosenv.2007.09.003, 2008.
Chang, S. C., Lin, T. H., Young, C. Y., and Lee, C. T.: The impact of ground-level fireworks (13 km long) display on the air quality during the traditional Yanshui Lantern Festival in Taiwan, Environ. Monit. Assess., 172, 463–479, https://doi.org/10.1007/s10661-010-1347-1, 2011.
Chen, W. T., Shao, M., Lu, S. H., Wang, M., Zeng, L. M., Yuan, B., and Liu, Y.: Understanding primary and secondary sources of ambient carbonyl compounds in Beijing using the PMF model, Atmos. Chem. Phys., 14, 3047–3062, https://doi.org/10.5194/acp-14-3047-2014, 2014.
Cheng, Y., Engling, G., He, K.-B., Duan, F.-K., Du, Z.-Y., Ma, Y.-L., Liang, L.-L., Lu, Z.-F., Liu, J.-M., Zheng, M., And Weber, R. J.: The characteristics of Beijing aerosol during two distinct episodes: Impacts of biomass burning and fireworks, Environ. Pollut., 185, 149–157, https://doi.org/10.1016/j.envpol.2013.10.037, 2014.
Coggon, M. M., McDonald, B. C., Vlasenko, A., Veres, P. R., Bernard, F., Koss, A. R., Yuan, B., Gilman, J. B., Peischl, J., Aikin, K. C., DuRant, J., Warneke, C., Li, S. M., and de Gouw, J. A.: Diurnal Variability and Emission Pattern of Decamethylcyclopentasiloxane (D5) from the Application of Personal Care Products in Two North American Cities, Environ. Sci. Technol., 52, 5610–5618, https://doi.org/10.1021/acs.est.8b00506, 2018.
de Gouw, J. and Warneke, C.: Measurements of volatile organic compounds in the earths atmosphere using proton-transfer-reaction mass spectrometry, Mass Spectrom. Rev., 26, 223–257, https://doi.org/10.1002/mas.20119, 2007.
de Gouw, J. A., Middlebrook, A. M., Warneke, C., Goldan, P. D., Kuster, W. C., Roberts, J. M., Fehsenfeld, F. C., Worsnop, D. R., Canagaratna, M. R., Pszenny, A. A. P., Keene, W. C., Marchewka, M., Bertman, S. B., and Bates, T. S.: Budget of organic carbon in a polluted atmosphere: Results from the New England Air Quality Study in 2002, J. Geophys. Res.-Atmos., 110, D16305, https://doi.org/10.1029/2004jd005623, 2005.
de Gouw, J. A., Welsh-Bon, D., Warneke, C., Kuster, W. C., Alexander, L., Baker, A. K., Beyersdorf, A. J., Blake, D. R., Canagaratna, M., Celada, A. T., Huey, L. G., Junkermann, W., Onasch, T. B., Salcido, A., Sjostedt, S. J., Sullivan, A. P., Tanner, D. J., Vargas, O., Weber, R. J., Worsnop, D. R., Yu, X. Y., and Zaveri, R.: Emission and chemistry of organic carbon in the gas and aerosol phase at a sub-urban site near Mexico City in March 2006 during the MILAGRO study, Atmos. Chem. Phys., 9, 3425–3442, https://doi.org/10.5194/acp-9-3425-2009, 2009.
Drewnick, F., Hings, S. S., Curtius, J., Eerdekens, G., and Williams, J.: Measurement of fine particulate and gas-phase species during the New Year's fireworks 2005 in Mainz, Germany, Atmos. Environ., 40, 4316–4327, https://doi.org/10.1016/j.atmosenv.2006.03.040, 2006.
Elser, M., Huang, R.-J., Wolf, R., Slowik, J. G., Wang, Q., Canonaco, F., Li, G., Bozzetti, C., Daellenbach, K. R., Huang, Y., Zhang, R., Li, Z., Cao, J., Baltensperger, U., El-Haddad, I., and Prévôt, A. S. H.: New insights into PM2.5 chemical composition and sources in two major cities in China during extreme haze events using aerosol mass spectrometry, Atmos. Chem. Phys., 16, 3207–3225, https://doi.org/10.5194/acp-16-3207-2016, 2016.
Friedman, B., Link, M. F., Fulgham, S. R., Brophy, P., Galang, A., Brune, W. H., Jathar, S. H., and Farmer, D. K.: Primary and Secondary Sources of Gas-Phase Organic Acids from Diesel Exhaust, Environ. Sci. Technol., 51, 10872–10880, https://doi.org/10.1021/acs.est.7b01169, 2017.
Fu, H. and Chen, J.: Formation, features and controlling strategies of severe haze-fog pollutions in China, Science Total Environ., 578, 121–138, https://doi.org/10.1016/j.scitotenv.2016.10.201, 2017.
Guenther, A., Karl, T., Harley, P., Wiedinmyer, C., Palmer, P. I., and Geron, C.: Estimates of global terrestrial isoprene emissions using MEGAN (Model of Emissions of Gases and Aerosols from Nature), Atmos. Chem. Phys., 6, 3181–3210, https://doi.org/10.5194/acp-6-3181-2006, 2006.
Guo, H., Ling, Z. H., Cheng, H. R., Simpson, I. J., Lyu, X. P., Wang, X. M., Shao, M., Lu, H. X., Ayoko, G., Zhang, Y. L., Saunders, S. M., Lam, S. H. M., Wang, J. L., and Blake, D. R.: Tropospheric volatile organic compounds in China, Science Total Environ., 574, 1021–1043, https://doi.org/10.1016/j.scitotenv.2016.09.116, 2017.
Huang, R. J., Zhang, Y., Bozzetti, C., Ho, K. F., Cao, J. J., Han, Y., Daellenbach, K. R., Slowik, J. G., Platt, S. M., Canonaco, F., Zotter, P., Wolf, R., Pieber, S. M., Bruns, E. A., Crippa, M., Ciarelli, G., Piazzalunga, A., Schwikowski, M., Abbaszade, G., Schnelle-Kreis, J., Zimmermann, R., An, Z., Szidat, S., Baltensperger, U., El Haddad, I., and Prevot, A. S.: High secondary aerosol contribution to particulate pollution during haze events in China, Nature, 514, 218–222, https://doi.org/10.1038/nature13774, 2014.
Jiang, Q., Sun, Y. L., Wang, Z., and Yin, Y.: Aerosol composition and sources during the Chinese Spring Festival: fireworks, secondary aerosol, and holiday effects, Atmos. Chem. Phys., 15, 6023–6034, https://doi.org/10.5194/acp-15-6023-2015, 2015.
Kaser, L., Karl, T., Schnitzhofer, R., Graus, M., Herdlinger-Blatt, I. S., DiGangi, J. P., Sive, B., Turnipseed, A., Hornbrook, R. S., Zheng, W., Flocke, F. M., Guenther, A., Keutsch, F. N., Apel, E., and Hansel, A.: Comparison of different real time VOC measurement techniques in a ponderosa pine forest, Atmos. Chem. Phys., 13, 2893–2906, https://doi.org/10.5194/acp-13-2893-2013, 2013.
Li, J., Xie, S. D., Zeng, L. M., Li, L. Y., Li, Y. Q., and Wu, R. R.: Characterization of ambient volatile organic compounds and their sources in Beijing, before, during, and after Asia-Pacific Economic Cooperation China 2014, Atmos. Chem. Phys., 15, 7945–7959, https://doi.org/10.5194/acp-15-7945-2015, 2015.
Li, J., Xu, T., Lu, X., Chen, H., Nizkorodov, S. A., Chen, J., Yang, X., Mo, Z., Chen, Z., Liu, H., Mao, J., and Liang, G.: Online single particle measurement of fireworks pollution during Chinese New Year in Nanning, J Environ Sci (China), 53, 184–195, https://doi.org/10.1016/j.jes.2016.04.021, 2017.
Li, K., Li, J., Wang, W., Tong, S., Liggio, J., and Ge, M.: Evaluating the effectiveness of joint emission control policies on the reduction of ambient VOCs: Implications from observation during the 2014 APEC summit in suburban Beijing, Atmos. Environ., 164, 117–127, https://doi.org/10.1016/j.atmosenv.2017.05.050, 2017.
Li, S.-M., Leithead, A., Moussa, S. G., Liggio, J., Moran, M. D., Wang, D., Hayden, K., Darlington, A., Gordon, M., Staebler, R., Makar, P. A., Stroud, C. A., McLaren, R., Liu, P. S. K., O'Brien, J., Mittermeier, R. L., Zhang, J., Marson, G., Cober, S. G., Wolde, M., and Wentzell, J. J. B.: Differences between measured and reported volatile organic compound emissions from oil sands facilities in Alberta, Canada, P. Natl. Acad. Sci. USA, 114, E3756–E3765, https://doi.org/10.1073/pnas.1617862114, 2017.
Li, W., Shi, Z., Yan, C., Yang, L., Dong, C., and Wang, W.: Individual metal-bearing particles in a regional haze caused by firecracker and firework emissions, Sci. Total Environ., 443, 464–469, https://doi.org/10.1016/j.scitotenv.2012.10.109, 2013.
Lindinger, W., Hansel, A., and Jordan, A.: On-line monitoring of volatile organic compounds at pptv levels by means of proton-transfer-reaction mass spectrometry (PTR-MS) medical applications, food control and environmental research, Int. J. Mass Spectrom., 173, 191–241, https://doi.org/10.1016/S0168-1176(97)00281-4, 1998.
Liu, C., Ma, Z., Mu, Y., Liu, J., Zhang, C., Zhang, Y., Liu, P., and Zhang, H.: The levels, variation characteristics, and sources of atmospheric non-methane hydrocarbon compounds during wintertime in Beijing, China, Atmos. Chem. Phys., 17, 10633–10649, https://doi.org/10.5194/acp-17-10633-2017, 2017.
McDonald, B. C., de Gouw, J. A., Gilman, J. B., Jathar, S. H., Akherati, A., Cappa, C. D., Jimenez, J. L., Lee-Taylor, J., Hayes, P. L., McKeen, S. A., Cui, Y. Y., Kim, S.-W., Gentner, D. R., Isaacman-VanWertz, G., Goldstein, A. H., Harley, R. A., Frost, G. J., Roberts, J. M., Ryerson, T. B., and Trainer, M.: Volatile chemical products emerging as largest petrochemical source of urban organic emissions, Science, 359, 760–764, https://doi.org/10.1126/science.aaq0524, 2018.
Millet, D. B., Baasandorj, M., Farmer, D. K., Thornton, J. A., Baumann, K., Brophy, P., Chaliyakunnel, S., de Gouw, J. A., Graus, M., Hu, L., Koss, A., Lee, B. H., Lopez-Hilfiker, F. D., Neuman, J. A., Paulot, F., Peischl, J., Pollack, I. B., Ryerson, T. B., Warneke, C., Williams, B. J., and Xu, J.: A large and ubiquitous source of atmospheric formic acid, Atmos. Chem. Phys., 15, 6283–6304, https://doi.org/10.5194/acp-15-6283-2015, 2015.
Park, J.-H., Goldstein, A. H., Timkovsky, J., Fares, S., Weber, R., Karlik, J., and Holzinger, R.: Active Atmosphere-Ecosystem Exchange of the Vast Majority of Detected Volatile Organic Compounds, Science, 341, 643–647, https://doi.org/10.1126/science.1235053, 2013.
Parrish, D. D., Ryerson, T. B., Mellqvist, J., Johansson, J., Fried, A., Richter, D., Walega, J. G., Washenfelder, R. A., de Gouw, J. A., Peischl, J., Aikin, K. C., McKeen, S. A., Frost, G. J., Fehsenfeld, F. C., and Herndon, S. C.: Primary and secondary sources of formaldehyde in urban atmospheres: Houston Texas region, Atmos. Chem. Phys., 12, 3273–3288, https://doi.org/10.5194/acp-12-3273-2012, 2012.
Sanhueza, E. and Andreae, M. O.: Emission of formic and acetic acids from tropical Savanna soils, Geophys. Res. Lett., 18, 1707–1710, https://doi.org/10.1029/91GL01565, 1991.
Seinfeld, J. H. and Pandis, S. N.: Atmospheric Chemistry and Physics: From Air Pollution to Climate Change, 3rd edn., John Wiley & Sons, Inc., Hoboken, New Jersey, USA, 2016.
Sheng, J., Zhao, D., Ding, D., Li, X., Huang, M., Gao, Y., Quan, J., and Zhang, Q.: Characterizing the level, photochemical reactivity, emission, and source contribution of the volatile organic compounds based on PTR-TOF-MS during winter haze period in Beijing, China, Atmos. Res., 212, 54–63, https://doi.org/10.1016/j.atmosres.2018.05.005, 2018.
Sun, Y. L., Wang, Z. F., Fu, P. Q., Yang, T., Jiang, Q., Dong, H. B., Li, J., and Jia, J. J.: Aerosol composition, sources and processes during wintertime in Beijing, China, Atmos. Chem. Phys., 13, 4577–4592, https://doi.org/10.5194/acp-13-4577-2013, 2013.
Taipale, R., Ruuskanen, T. M., Rinne, J., Kajos, M. K., Hakola, H., Pohja, T., and Kulmala, M.: Technical Note: Quantitative long-term measurements of VOC concentrations by PTR-MS – measurement, calibration, and volume mixing ratio calculation methods, Atmos. Chem. Phys., 8, 6681–6698, https://doi.org/10.5194/acp-8-6681-2008, 2008.
Valach, A. C., Langford, B., Nemitz, E., MacKenzie, A. R., and Hewitt, C. N.: Concentrations of selected volatile organic compounds at kerbside and background sites in central London, Atmos. Environ., 95, 456–467, https://doi.org/10.1016/j.atmosenv.2014.06.052, 2014.
Wang, M., Shao, M., Chen, W., Yuan, B., Lu, S., Zhang, Q., Zeng, L., and Wang, Q.: A temporally and spatially resolved validation of emission inventories by measurements of ambient volatile organic compounds in Beijing, China, Atmos. Chem. Phys., 14, 5871–5891, https://doi.org/10.5194/acp-14-5871-2014, 2014.
Warneke, C., McKeen, S. A., de Gouw, J. A., Goldan, P. D., Kuster, W. C., Holloway, J. S., Williams, E. J., Lerner, B. M., Parrish, D. D., Trainer, M., Fehsenfeld, F. C., Kato, S., Atlas, E. L., Baker, A., and Blake, D. R.: Determination of urban volatile organic compound emission ratios and comparison with an emissions database, J. Geophys. Res., 112, D10S47, https://doi.org/10.1029/2006jd007930, 2007.
Warneke, C., Roberts, J. M., Veres, P., Gilman, J., Kuster, W. C., Burling, I., Yokelson, R., and de Gouw, J. A.: VOC identification and inter-comparison from laboratory biomass burning using PTR-MS and PIT-MS, Int. J. Mass Spectrom., 303, 6–14, https://doi.org/10.1016/j.ijms.2010.12.002, 2011.
Wu, R. and Xie, S.: Spatial Distribution of Secondary Organic Aerosol Formation Potential in China Derived from Speciated Anthropogenic Volatile Organic Compound Emissions, Environ. Sci. Technol., 52, 8146–8156, https://doi.org/10.1021/acs.est.8b01269, 2018.
Xu, Z., Nie, W., Chi, X., Huang, X., Zheng, L., Xu, Z., Wang, J., Xie, Y., Qi, X., Wang, X., Xue, L., and Ding, A.: Ozone from fireworks: Chemical processes or measurement interference?, Sci. Total Environ., 633, 1007–1011, https://doi.org/10.1016/j.scitotenv.2018.03.203, 2018.
Yáñez-Serrano, A. M., Nölscher, A. C., Bourtsoukidis, E., Derstroff, B., Zannoni, N., Gros, V., Lanza, M., Brito, J., Noe, S. M., House, E., Hewitt, C. N., Langford, B., Nemitz, E., Behrendt, T., Williams, J., Artaxo, P., Andreae, M. O., and Kesselmeier, J.: Atmospheric mixing ratios of methyl ethyl ketone (2-butanone) in tropical, boreal, temperate and marine environments, Atmos. Chem. Phys., 16, 10965–10984, https://doi.org/10.5194/acp-16-10965-2016, 2016.
Yuan, B., Shao, M., de Gouw, J., Parrish, D. D., Lu, S., Wang, M., Zeng, L., Zhang, Q., Song, Y., Zhang, J., and Hu, M.: Volatile organic compounds (VOCs) in urban air: How chemistry affects the interpretation of positive matrix factorization (PMF) analysis, J. Geophys. Res.-Atmos., 117, D24302, https://doi.org/10.1029/2012jd018236, 2012.
Yuan, B., Hu, W. W., Shao, M., Wang, M., Chen, W. T., Lu, S. H., Zeng, L. M., and Hu, M.: VOC emissions, evolutions and contributions to SOA formation at a receptor site in eastern China, Atmos. Chem. Phys., 13, 8815–8832, https://doi.org/10.5194/acp-13-8815-2013, 2013.
Yuan, B., Koss, A. R., Warneke, C., Coggon, M., Sekimoto, K., and de Gouw, J. A.: Proton-Transfer-Reaction Mass Spectrometry: Applications in Atmospheric Sciences, Chem. Rev., 117, 13187–13229, https://doi.org/10.1021/acs.chemrev.7b00325, 2017.
Zhang, M., Wang, X., Chen, J., Cheng, T., Wang, T., Yang, X., Gong, Y., Geng, F., and Chen, C.: Physical characterization of aerosol particles during the Chinese New Year's firework events, Atmos. Environ., 44, 5191–5198, https://doi.org/10.1016/j.atmosenv.2010.08.048, 2010.
Zhang, Q., Streets, D. G., Carmichael, G. R., He, K. B., Huo, H., Kannari, A., Klimont, Z., Park, I. S., Reddy, S., Fu, J. S., Chen, D., Duan, L., Lei, Y., Wang, L. T., and Yao, Z. L.: Asian emissions in 2006 for the NASA INTEX-B mission, Atmos. Chem. Phys., 9, 5131–5153, https://doi.org/10.5194/acp-9-5131-2009, 2009.
Zhang, R., Wang, G., Guo, S., Zamora, M. L., Ying, Q., Lin, Y., Wang, W., Hu, M., and Wang, Y.: Formation of Urban Fine Particulate Matter, Chem. Rev., 115, 3803–3855, https://doi.org/10.1021/acs.chemrev.5b00067, 2015.
Zhao, J. and Zhang, R. Y.: Proton transfer reaction rate constants between hydronium ion (H3O(+)) and volatile organic compounds, Atmos. Environ., 38, 2177–2185, https://doi.org/10.1016/j.atmosenv.2004.01.019, 2004.
Zheng, G. J., Duan, F. K., Su, H., Ma, Y. L., Cheng, Y., Zheng, B., Zhang, Q., Huang, T., Kimoto, T., Chang, D., Pöschl, U., Cheng, Y. F., and He, K. B.: Exploring the severe winter haze in Beijing: the impact of synoptic weather, regional transport and heterogeneous reactions, Atmos. Chem. Phys., 15, 2969–2983, https://doi.org/10.5194/acp-15-2969-2015, 2015.