the Creative Commons Attribution 4.0 License.
the Creative Commons Attribution 4.0 License.
 | 22 Jan 2019
Impact of wildfires on particulate matter in the Euro-Mediterranean in 2007: sensitivity to some parameterizations of emissions in air quality models
Solene Turquety
Karine Sartelet
Carole Legorgeu
Laurent Menut
Youngseob Kim
This study examines the uncertainties on air quality modeling associated with the integration of wildfire emissions in chemistry-transport models (CTMs). To do so, aerosol concentrations during the summer of 2007, which was marked by severe fire episodes in the Euro-Mediterranean region especially in the Balkans (20–31 July, 24–30 August 2007) and Greece (24–30 August 2007), are analyzed. Through comparisons to observations from surface networks and satellite remote sensing, we evaluate the abilities of two CTMs, Polyphemus/Polair3D and CHIMERE, to simulate the impact of fires on the regional particulate matter (PM) concentrations and optical properties. During the two main fire events, fire emissions may contribute up to 90 % of surface PM2.5 concentrations in the fire regions (Balkans and Greece), with a significant regional impact associated with long-range transport. Good general performances of the models and a clear improvement of PM2.5 and aerosol optical depth (AOD) are shown when fires are taken into account in the models with high correlation coefficients.
Two sources of uncertainties are specifically analyzed in terms of surface PM2.5 concentrations and AOD using sensitivity simulations: secondary organic aerosol (SOA) formation from intermediate and semi-volatile organic compounds (I/S-VOCs) and emissions' injection heights. The analysis highlights that surface PM2.5 concentrations are highly sensitive to injection heights (with a sensitivity that can be as high as 50 % compared to the sensitivity to I/S-VOC emissions which is lower than 30 %). However, AOD which is vertically integrated is less sensitive to the injection heights (mostly below 20 %) but highly sensitive to I/S-VOC emissions (with sensitivity that can be as high as 40 %). The maximum statistical dispersion, which quantifies uncertainties related to fire emission modeling, is up to 75 % for PM2.5 in the Balkans and Greece, and varies between 36 % and 45 % for AOD above fire regions.
The simulated number of daily exceedance of World Health Organization (WHO) recommendations for PM2.5 over the considered region reaches 30 days in regions affected by fires and ∼10 days in fire plumes, which is slightly underestimated compared to available observations. The maximum statistical dispersion (σ) on this indicator is also large (with σ reaching 15 days), showing the need for better understanding of the transport and evolution of fire plumes in addition to fire emissions.


The Mediterranean area is directly affected by large aerosol sources leading to a European maximum in aerosol loading (Nabat et al., 2013; Putaud et al., 2010; Rea et al., 2015). Observations show the influence of a complex mixture of different sources (Boselli et al., 2012; Dall'Osto et al., 2010; Gerasopoulos et al., 2011). The pollution transport pathways in the region are controlled by the very specific orography of this closed sea, but also by the influence of the large circulation patterns (Lelieveld et al., 2002; Lionello et al., 2006) due to its location between the subtropical high-pressure systems, the mid-latitude westerlies and low-pressure systems. Mineral dust contributes significantly to pollution episodes in the Euro-Mediterranean area, further increasing aerosol loads associated with local anthropogenic sources (Gobbi et al., 2007; Kaskaoutis et al., 2008; Nabat et al., 2013; Querol et al., 2009; Rea et al., 2015). During summer, high concentrations of organic aerosols, mostly of biogenic origin, are observed in the western Mediterranean (Chrit et al., 2017; El Haddad et al., 2013). Although the precursors are biogenic volatile organic compounds, the formation of organic aerosols is partly explained by the influence of anthropogenic emissions (Carlton et al., 2010; Kanakidou and Tsigaridis, 2000; Sartelet et al., 2012).
Vegetation fires are another sizable sporadic source that needs to be accounted for, especially during summer when the hydrological and meteorological conditions favor their occurrence and spread. Depending on the severity of the fire season, their contribution to the atmospheric aerosol loading and thus to the impairment of the local and regional air quality can be significant (Barnaba et al., 2011; Rea et al., 2015). However, quantifying their contribution remains a challenge due to large uncertainty in emissions and transport.
Most fire episodes in Europe occur in southern countries (Portugal, Spain, France, Italy, Greece), with ha burned every year (Barbosa et al., 2009; Turquety et al., 2014). On average, only ∼ 2 % of fires contribute ∼ 80 % of the area burned due to clusters of fires that merge into “mega-fires” (San-Miguel Ayanz et al., 2013). Although ignitions are mainly of anthropogenic origin (negligence, arson, agricultural practices) according to San-Miguel Ayanz et al. (2013) and the European Forest Fire Information System (EFFIS) of the European Joint Research Center (JRC) (JRC, 2008), fire spread depends on meteorological conditions. It is favored by hot and dry conditions (heat waves and associated droughts), especially if they are preceded by a wet winter and spring (fuel accumulation) (Hernandez et al., 2015; Pereira et al., 2005). Fires are also important in eastern Europe, Ukraine, western Russia and Turkey. They are usually smaller and associated with agricultural practices like waste burning and land clearing (Korontzi et al., 2006; Stohl et al., 2007; Turquety et al., 2014).
Turquety et al. (2014) estimate that, on average for the 2003–2010 time period and the Euro-Mediterranean region, total yearly fire emissions amount to ∼30 % of anthropogenic emissions for PM2.5 (particulate matter with diameter ≤2.5 µm). It is all the more critical as the fire episodes are concentrated during the summer and usually last less than 10 days (so that emissions are very concentrated in time, resulting in dense plumes). However, the uncertainty associated with fire emissions is also very large, estimated to ∼100 % to 200 % (e.g., Turquety et al., 2014; Urbanski et al., 2011). Uncertainties are also linked to the modeling of the temporal variability of emissions. Improving the diurnal cycle may for instance be critical for some fire events (Rea et al., 2016). In addition to emissions, the modeling of wildfires' impact on atmospheric chemistry using chemistry-transport models (CTMs) requires a good knowledge of the emissions' injection height. Indeed, the energy released by fires can trigger or enhance convection (pyroconvection), thereby injecting emissions at high altitude. Several parameterizations have been developed in recent years (Freitas et al., 2007; Rio et al., 2010; Sofiev et al., 2012) and are increasingly implemented in CTMs. However, comparisons to observations of fire plume's height highlight the difficulty in correctly capturing the vertical shape of fire emissions (Rémy et al., 2017; Sofiev et al., 2012; Val Martin et al., 2012). This will then influence the simulated transport pathways and their regional impact. Injecting above the boundary layer will lower the local impact but result in larger-scale transport. The chemical evolution of fire plumes is still not well understood and not well represented. Primary organic aerosols (POA) are directly emitted by biomass burning into the atmosphere. However, secondary organic aerosols (SOA) are produced through gas-to-particle partitioning of oxidation products of volatile organic compounds (VOCs) (with saturation concentration C* higher than 3.2×10⁶ µg m−3), intermediate organic compounds (I-VOCs) (with saturation concentration C* in the range of 320–3.2×10⁶ µg m−3), semi-volatile organic compounds (S-VOCs) (with saturation concentration C* in the range of 0.32–320 µg m−3), and low-volatility organic compounds (L-VOCs) (with saturation concentration C* lower than 0.32 µg m−3) (Cappa and Jimenez, 2010; Ciarelli et al., 2017; Fountoukis et al., 2014; Grieshop et al., 2009; Huffman et al., 2009; Lipsky and Robinson, 2006; Murphy et al., 2014; Tsimpidi et al., 2010; Woody et al., 2016). The formation of secondary organic aerosols (SOA) from the ageing of biomass burning organic precursors is likely to strongly affect aerosol loading and properties in biomass burning plumes. The major organic precursors are thought to be intermediate, semi- and low-volatility organic compounds (I/S/L-VOCs), (Ciarelli et al., 2017; Konovalov et al., 2015; Koo et al., 2014; May et al., 2013a). However, I/S/L-VOC emissions are not well characterized and their gas-phase emission is often missing from emission inventories (Robinson et al., 2007). Their emissions are often estimated from particulate matter emissions (Ciarelli et al., 2017; Couvidat et al., 2012). The chamber experiments of May et al. (2013a) characterized the volatility distribution of I/S/L-VOC emissions into different volatility classes. Recent studies have proven that considering I/S-VOCs emitted from biomass burning shows a major improvement in the agreement between the simulated and observed organic aerosol (OA) (Ciarelli et al., 2017; Konovalov et al., 2015; Koo et al., 2014). Konovalov et al. (2015) find that ignoring I/S-VOCs from biomass burning underestimates strongly the ratio of ΔPM10∕ΔCO (by a factor of 2) in the city of Kuopio (Finland) and thus leads to an underestimation of the OA concentrations.
The objective of this study is to evaluate the capabilities of two CTMs to simulate the impact of wildfires on the regional particulate matter budget. In the Mediterranean region, surface PM10 is dominated by the contribution from dust (Rea et al., 2015). Since the focus of this study is on biomass burning, the discussion is centered on the simulation of surface PM2.5. The total loading of aerosols over the region is evaluated using comparisons of AOD to observations. After an evaluation of two CTMs (CHIMERE and Polyphemus/Polair3D) through comparisons to observations from surface networks and remote sensing, a sensitivity analysis of the injection heights and I/S-VOC emissions is conducted in order to quantify the uncertainties associated with these two parameterizations, in terms of AOD and surface PM concentrations. This analysis is focused on the summer of 2007 which was marked by extreme meteorological conditions (consecutive heat waves and drought) and severe fire episodes in the eastern Mediterranean and Europe. According to the European Forest Fire Information System (EFFIS), 2007 was well above the average of the previous 3 decades in terms of burned area (574 361 against 495 471 ha burned, respectively) (JRC, 2008). The burning season was particularly severe for Greece, where the burned area reached extreme values. This case study is particularly interesting since it was well captured by satellite sensors as the resulting smoke plumes, fanned by northeasterly winds, were transported over the sea, crossing the southern Ionian Sea and reaching the northern part of the African continent. Several studies have highlighted the important enhancements in atmospheric gases (Coheur et al., 2009; Hodnebrog et al., 2012; Turquety et al., 2009) and aerosols (Kaskaoutis et al., 2011; Liu et al., 2009) due to these fire episodes. Modeling analyses have investigated secondary production in the fire plumes. While Hodnebrog et al. (2012) showed limited ozone impact on average during the summer, Poukpou et al. (2014) investigated more precisely the fire event in the Peloponnese (Greece) at the end of August 2007. They found enhancements of CO and NOx concentrations mainly over the burnt areas due to the biomass burning. Due to the nonlinear dependence of O3 on NOx levels, the near-surface O3 values were reduced (−34 %) over the Peloponnese, but increased (+52 %) over the sea at 500 km downwind. Here, the sensitivities of regional aerosol loadings, both primary and secondary, to modeling configurations are analyzed.
This paper is structured as follows. In the second section, a brief description of the chemistry-transport models and the different tools and methodology used in this work are given. Then, Sect. 3 presents statistics for model-to-data comparison to assess the models' performance during the summer of 2007 and more specifically during the main fire events. Then, uncertainties related to the integration of wildfires in CTMs (injection height, I/S-VOC emissions) are discussed in Sect. 4. Finally, Sect. 5 describes the contribution of wildfires to air quality threshold exceedances as well as the associated uncertainties.
2.1 Chemistry-transport models
Two CTMs are used for this study. CHIMERE simulations (Menut et al., 2013) allow us to perform inter-model comparison and to evaluate the capability of other current CTMs to simulate the impact of wildfires on the regional particulate matter budget and to quantify the uncertainties on air quality modeling related to the integration of fire emissions in CTMs. The sensitivity analysis is undertaken using the Polyphemus modeling platform of air quality (Mallet et al., 2007) with chemistry-transport model Polair3D (Sartelet et al., 2012).
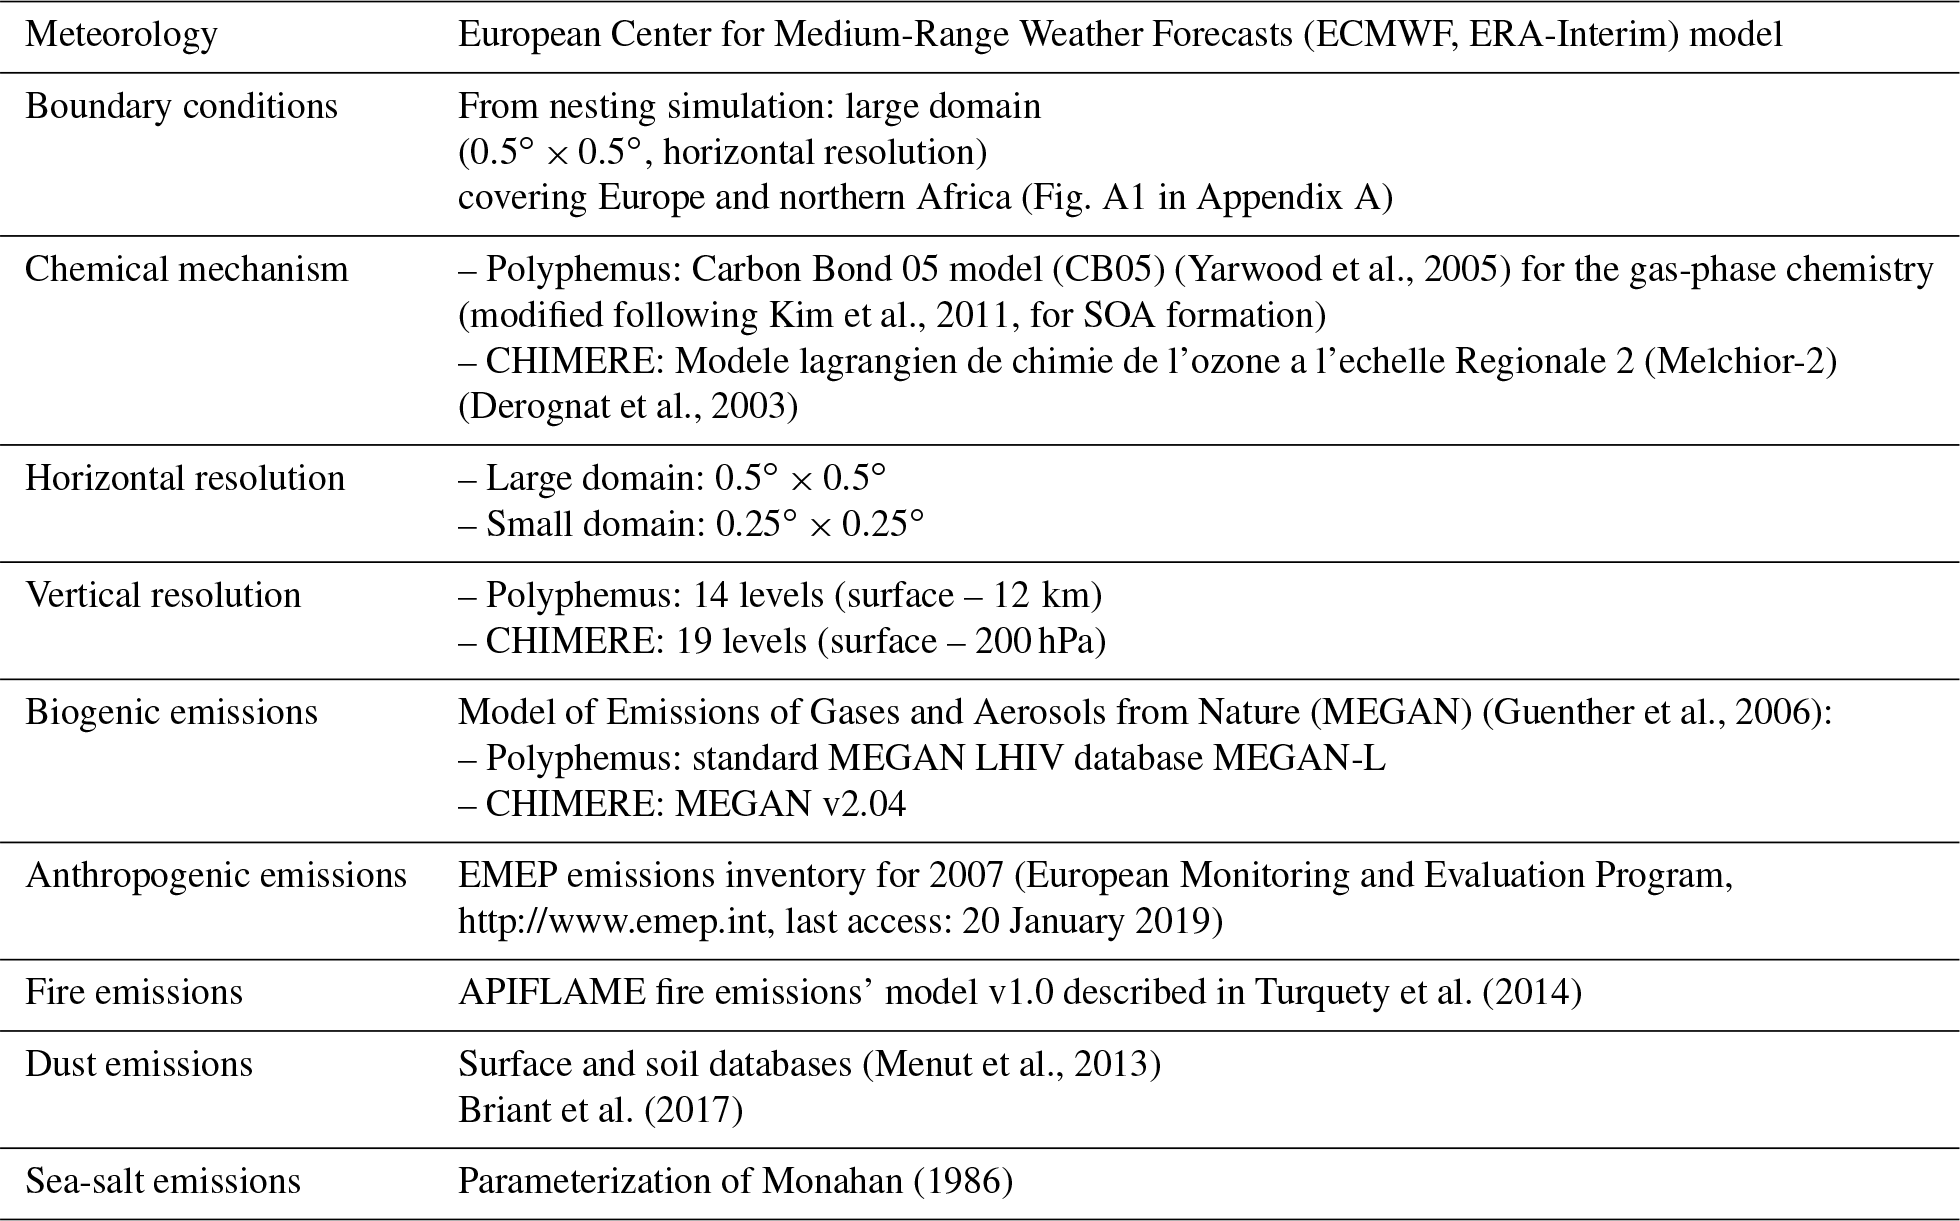
Table 1 summarizes the main characteristics of the simulations.
(Yarwood et al., 2005)Kim et al., 2011(Derognat et al., 2003)(Guenther et al., 2006)Turquety et al. (2014)(Menut et al., 2013)Briant et al. (2017)Monahan (1986)Table 1Main characteristics of the Polyphemus and CHIMERE simulations.
For the simulations presented in this work, Polyphemus is used with the Carbon Bond 05 model (CB05) (Yarwood et al., 2005) for the gas-phase chemistry (modified following Kim et al., 2011 for SOA formation) and with the SIze resolved Aerosol Model (SIREAM) (Debry et al., 2007) for aerosol dynamics (coagulation, condensation/evaporation). SIREAM uses a sectional approach and the dry particle diameter is discretized with five sections between 0.01 µm and 10 µm. The simulations are performed on 14 vertical levels extending from the ground to 12 km.
Version 2016 of regional CTM CHIMERE is used for this work (Mailler et al., 2017; Menut et al., 2013). Simulations were conducted using reduced chemical mechanism Modele Lagrangien de Chimie de l'Ozone a l'echelle Regionale 2 (MELCHIOR2), which includes 44 species and 120 reactions, and the aerosol module described in Bessagnet et al. (2004) (nucleation, coagulation, absorption). This module is also based on a sectional representation of the size distribution. For this simulation, 10 bins from 40 nm to 40 µm are used and simulations are performed on 19 vertical levels extending from the surface to 250 hPa (σ-pressure coordinates).
Both models include wet and dry deposition. Deposition in Polyphemus is described in Sartelet et al. (2007) and in CHIMERE in Menut et al. (2013) and Mailler et al. (2017). Thermodynamics of inorganic aerosols are modeled using ISORROPIA (Nenes et al., 1999) with a bulk equilibrium approach. Bulk equilibrium is also used for SOA formation, and the partitioning between the gas and particle phases is done with the Secondary Organic Aerosol Processor (SOAP) (Couvidat and Sartelet, 2015) in Polyphemus. Photolysis rates are calculated using the FastJX model (version7.0b for CHIMERE) (Wild et al., 2000). Their online calculation in CHIMERE allows us to represent the attenuation by clouds and aerosols, while the attenuation by clouds in Polyphemus is modeled by multiplying the clear-sky photolysis rates by a correction factor (Real and Sartelet, 2011).
Both models (Polyphemus and CHIMERE) are driven by meteorological conditions simulated by the European Center for Medium-Range Weather Forecasts (ECMWF, ERA-Interim) model. Initial and boundary conditions from MOZART4-GEOS5 6-hourly simulation outputs are used (Emmons et al., 2010). Simulations are undertaken using two nested domains (Fig. A1 in Appendix A). One large domain ( horizontal resolution) covers Europe and northern Africa to provide realistic dust sources and a smaller domain at horizontal resolution over the Mediterranean area (presented in Fig. 1).
Anthropogenic emissions are derived from the EMEP emissions inventory for 2007 (European Monitoring and Evaluation Program, http://www.emep.int, last access: 20 January 2019). The inventory species are disaggregated into real species using speciation coefficients (Passant, 2002). The aggregation into model species is done following Middleton et al. (1990). Primary particulate matter emissions are given in total mass by the EMEP emission inventory. They are speciated into dust, primary organic emissions (POA) and black carbon (BC), and distributed into five diameter bins (Sartelet et al., 2007).
Biogenic emissions of isoprene and terpenes (α-pinene, β-pinene, limonene and humulene) are calculated using the Model of Emissions of Gases and Aerosols from Nature with the standard MEGAN LHIV database MEGAN-L for Polyphemus and MEGAN v2.04 for CHIMERE (Guenther et al., 2006). Sea-salt emissions are parameterized following Monahan (1986). The mineral dust emissions are calculated using soil and surface databases (Menut et al., 2013) and with a spatial extension of potentially emitting area in Europe as described in Briant et al. (2017). The daily fire emissions are detailed in Sect. 2.2.
In Polyphemus, I/S/L-VOC emissions are estimated by multiplying the primary organic emissions (POA) by a factor of 1.5, following the chamber measurements (Kim et al., 2016; Robinson et al., 2007; Zhu et al., 2016). The factor of 1.5 is used for both anthropogenic and fire emissions to estimate the gas-phase I/S/L-VOCs that are not included in the inventories. I/S/L-VOC emissions are assigned to three surrogate species: POAlP, POAmP and POAhP (for compounds of low, medium and high volatilities, respectively), of saturation concentration C*: log10(, 1.93, 3.5, respectively. The volatility distribution at emissions of I/S/L-VOCs is detailed in Couvidat et al. (2012) (25 %, 32 %, and 43 % of I/S/L-VOCs are assigned to POAlP, POAmP, and POAhP, respectively). It corresponds to the volatility distribution measured by May et al. (2013a) for biomass burning aerosol emissions. Each primary I/S/L-VOC undergoes one OH-oxidation reaction in the gas phase with a kinetic rate constant equal to 2.10−11 molecule−1 cm3 s−1, leading to the formation of secondary surrogates: SOAlP, SOAmP and SOAhP. The ageing of the primary aerosols reduces the volatility of the secondary product by a factor of 100 and increases the molecular weight by 40 % (Couvidat et al., 2012).
2.2 Fire emissions
Daily fire emissions are calculated using the APIFLAME fire emissions' model v1.0 described in Turquety et al. (2014). The carbon emission associated with a specific fire is calculated using the MODIS burned area product at 500 m resolution (MCD64 product) (Giglio et al., 2009), multiplied by the consumed fuel load specific to the vegetation burned. The CORINE Land Cover (CLC) is used for vegetation attribution, and the biomass density is estimated based on simulations by the ORCHIDEE vegetation dynamics and carbon cycle model (Maignan et al., 2009).
Turquety et al. (2014) estimated an uncertainty of ∼100 % on daily carbon emissions using an ensemble approach. This is in agreement with estimates for other daily inventories (e.g., GFED Van der Werf et al., 2010).
Emissions for each species are derived from the carbon emissions using the emission factors from Akagi et al. (2011). These emission factors are provided in terms of gram species per kilogram dry matter (DM) burned (g kg−1) for all relevant species observed in biomass burning plumes and for different standard vegetation types that match Mediterranean landscapes (chaparral, temperate forest, crop residue, pasture maintenance and savanna). The contribution of these vegetation types to the burned area detection over the Mediterranean region during the time period studied is 37.2 % for temperate forest, 32.7 % for savanna, 9.6 % for chaparral and 19.9 % for crop residue. Emissions for inventory species are then converted into emissions for model species using model-specific aggregation matrices (Yarwood et al., 2005). For aerosols, the difference between emissions factors provided for the total PM2.5 and for the main primary emissions (organic and black carbon, small amounts of inorganics) is modeled as a specific, inert and unidentified species grouping the remaining mass of PM2.5 (REM-PM2.5). REM-PM2.5 corresponds to all the unidentified fine particles emitted by wildfires which are incorporated to consider the differences between PM2.5 emissions and the total of all PM2.5-speciated emissions. The difference between PM10 and PM2.5 emission factors is attributed to emissions of coarse-mode PM (PPMcoarse).
Figure 1 shows a map of total primary organic carbon emissions (OC) from fires in the Euro-Mediterranean region during the summer of 2007. Four main areas are affected by wildfires: Balkans (sub-region MedReg1), Greece (sub-region MedReg2), southern Italy (sub-region MedReg3) and Algeria (sub-region MedReg4).
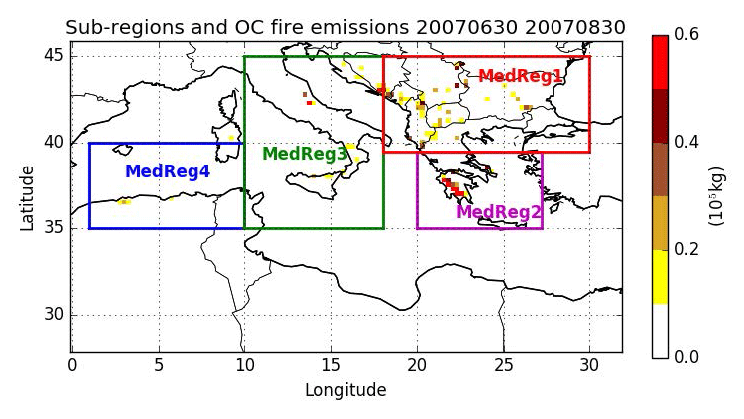
Figure 1Map of the nested domain over the Mediterranean area with a spatial resolution of . The total organic carbon emissions (kg (grid cell)−1) from fires during the summer of 2007 are presented. The sub-regions used in this study are also indicated in colored boxes: MedReg1 (Balkans + eastern Europe), MedReg2 (Greece), MedReg3 (Italy) and MedReg4 (Algeria).
Total daily fire emissions for the four studied areas are plotted in Fig. 2. In all regions, fire emissions are occasional but very intense. The largest fires in the simulated domain occur in the Balkans (sub-region MedReg1) between 20 July and 31 July 2007, and in Greece (sub-region MedReg2) between 24 and 30 August. In Algeria (sub-region MedReg4), fires mainly occur at the end of August and beginning of September (28 August–1 September). In southern Italy (sub-region MedReg3), fires are observed between 9 and 31 July 2007.

2.3 Model sensitivity experiments
Two different parameters, considered critical for modeling fire events, are tested using sensitivity simulations with the Polyphemus CTM: fire emissions of I/S-VOCs and emissions' injection heights. Another simulation is also conducted to evaluate the impact of REM-PM2.5 emissions. In the simulations discussed here, four different configurations of the model are used.
-
Simulation Poly-ref: fire emissions are homogeneously mixed in the planetary boundary layer (PBL), but no lower than 1 km. The percentage of fire emissions' injection is divided homogeneously depending on the layers' thickness (I/S/L-VOCs included).
-
Simulation Poly-noI/S-VOCs: fire emissions in the PBL but without I/S-VOC emissions in the gas phase. In this sensitivity study, the semi-volatile properties of POA are not considered, and POA emissions are modeled as LVOCs.
-
Simulation Poly-NoREM-PM2.5: fire emissions in the PBL, with I/S/L-VOCs but without REM-PM2.5.
-
Simulation Poly-3 km: fire emissions injected up to 3 km with: 20 % under 1 km, 80 % between 1 and 3 km. Note that, in this case, 78 % of fire emissions are injected above the PBL. This choice of sensitivity study may be viewed as conservative since, for example, injection heights are limited to 3 km. But it is also extreme since maximum injection at 3 km is imposed to all fires, resulting in injection above the boundary layer. This could be realistic, since based on the Multi-angle Imaging SpectroRadiometer (MISR) observations, Mims et al. (2010) estimated that 26 % of the fire plumes exceed the boundary layer.
In addition, a simulation with the CHIMERE model (without I/S-VOCs and with fires in the PBL) (CHIMERE-ref) allows an inter-model comparison. Simulations without fires are also computed with both models (Poly-Nofires and CHIMERE-Nofires). The setup of the different simulations is summarized in Table 2.
Table 2Summary of the configurations used in different simulations. n/a – not applicable.

3.1 Observations
Daily observations from European network AIRBASE 5 are used for PM concentrations. Due to the relatively coarse horizontal resolution, only background stations are included in the present paper. The investigated stations are indicated in Fig. 3. PM10 concentrations in the Mediterranean area are strongly affected by dust, which are difficult to simulate due to their sporadic nature and the fact that their main sources are located out of the model domain. Although dust emission is modeled with state-of-the-art parameterization in this study, the analysis focuses on PM2.5 in order to evaluate more specifically the uncertainties associated with wildfires and to minimize the contribution from dust.
Surface observations are complemented by remote sensing observations of aerosol optical properties. AOD level 2.0 data (at 550 nm) and Angstrom coefficient α (derived from AOD at 500 and 870 nm) from the AERONET (AErosol RObotic NETwork) ground-based network of sun photometers (Holben et al., 1998) are used. The uncertainty on AOD is estimated to less than 0.02 (Holben et al., 2001). AOD level 2.0 observations are missing in Lecce University (in Italy) during the first event, and in Blida (in Algeria) during the second one. Since AOD Level 1.5 observations at 500 nm (before filtering) are available for the latter, we have chosen to include these observations for comparison in the next sections. The considered stations are indicated in Fig. 3.
AOD observations at 550 nm from the MODIS instrument on board the Terra (Equator crossing time at 10:30, ascending node) and Aqua (Equator crossing time at 13:30, ascending node) satellites are also used in order to get a more complete regional view. The MOD04 and MYD04 (for Terra and Aqua, respectively) from collection 5.2 data, available at 10×10 km2, are used (Remer et al., 2005). The expected uncertainty on AOD is (τ is the optical thickness) over land (Chu et al., 1998; King et al., 1999) and over the ocean (King et al., 1999), with a good agreement with ground-based measurements (Remer et al., 2005). Deep Blue AOD (Sayer et al., 2013) is used when available (over bright areas).
3.2 Comparison method
A set of statistical indicators are used for the comparison of model simulations to surface measurements: the root mean square error (RMSE), the correlation coefficient (R), the mean fractional bias (MFB) and the mean fractional error (MFE). These are defined as
with oi the observed concentration at time and location i, ci the modeled concentration at time and location i, and n the number of data. Boylan and Russel (2006) proposed for PM that a model performance criterion (level of accuracy acceptable for standard modeling applications) is met when MFE % and MFB is within ±60 %, and a model performance goal (level of accuracy considered to be close to the best a model can be expected to achieve) is met when MFE ≤50 % and MFB is within ±30 %. In the following, the MFB and MFE are computed at each station and averaged.
3.3 Overview of the 3-month period
The statistical evaluation of the simulations during the summer of 2007 (from 15 July to 30 August 2007) is presented in Table 3 for PM2.5 concentrations and Table 4 for AOD at 550 nm. Globally, the PM2.5 concentrations and AOD are well reproduced by the models, although they are slightly underestimated compared to measurements. For AOD, the model performance and goal are always met. For PM2.5 concentrations, the model performance is always met, and the model goal is met for the model errors' MFEs. The models-to-measurements correlations range between 46 % and 83 % for all the simulations when fires are included. The model errors' MFEs are similar for outputs from CHIMERE and Polyphemus. However, CHIMERE outputs have lower bias (higher concentrations are AOD values), while Polyphemus outputs have higher correlations. The models-to-measurements comparisons tend to improve when fires are taken into account, with lower MFEs and higher correlations. The improvement is stronger for AOD than for PM2.5 concentrations, because the stations used for AOD models-to-measurements comparisons are closer to regions affected by wildfires than the stations used for PM2.5 models-to-measurements comparisons, as discussed below.
Figure 3 shows the mean surface concentrations of PM2.5 simulated by Polyphemus (Poly-ref) over the Euro-Mediterranean domain, from 15 July to 30 August 2007. The eight AIRBASE stations used for the models-to-measurements comparison are also presented in Fig. 3. The mean simulated PM2.5 concentrations can reach 60 µg m−3 in regions affected by wildfires (Balkans, sub-region MedReg1, and Greece, sub-region MedReg2). Only two AIRBASE stations, GR0039A in Greece and IT0459A in Italy, are close to regions affected by wildfires. Figure B1 in Appendix B shows that conclusions for CHIMERE are similar to those for Polyphemus.
Figure 3 also shows the mean modeled AOD, which can be as high as 0.72 on average in the Balkans and in Greece, and the six AERONET stations used for the models-to-measurements comparisons. Five out of the six stations are located in regions affected by wildfires.
This evaluation shows good general performance of the models and a clear improvement of PM2.5 and AOD when fires are included, allowing a more precise analysis of the model's behavior during the strongest fire events.
Table 3Statistics of models-to-measurements comparisons for the mean daily PM2.5 concentrations during the summer of 2007 (AIRBASE station number =8).
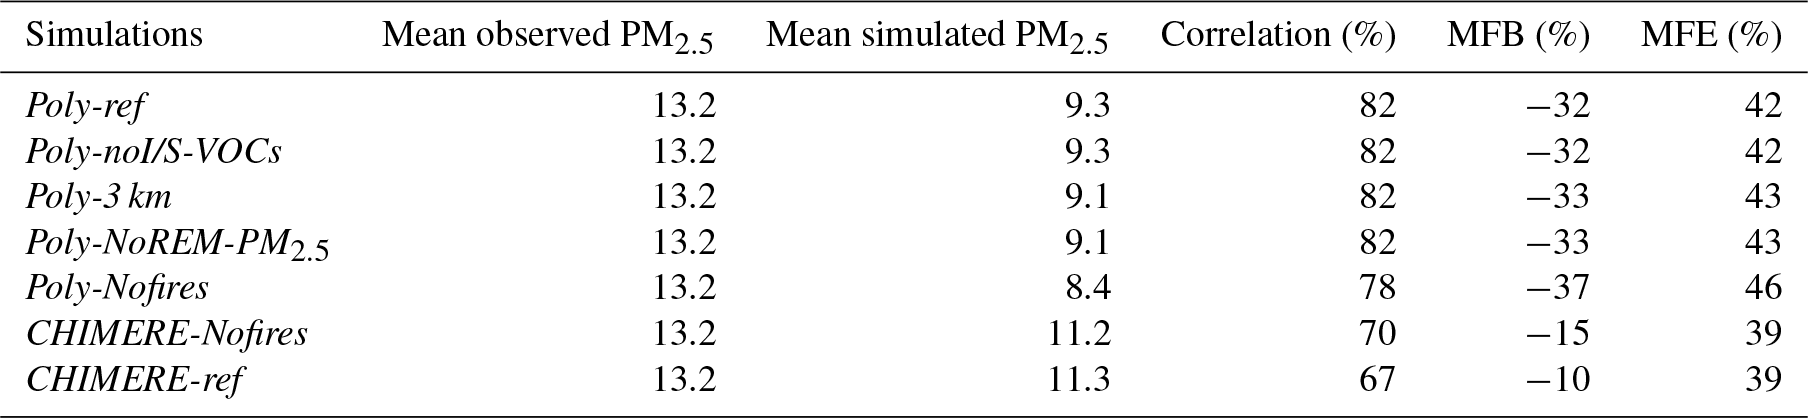
Table 4Statistics of models-to-measurements comparisons for mean daily AOD at 550 nm during the summer of 2007 (AERONET station number =6).
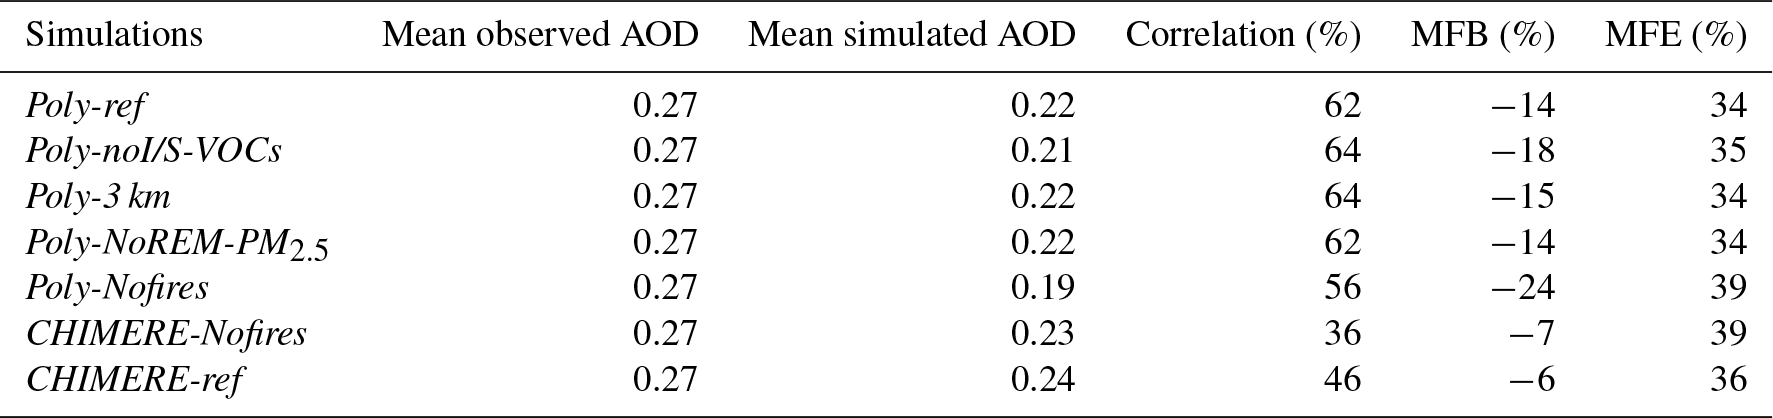
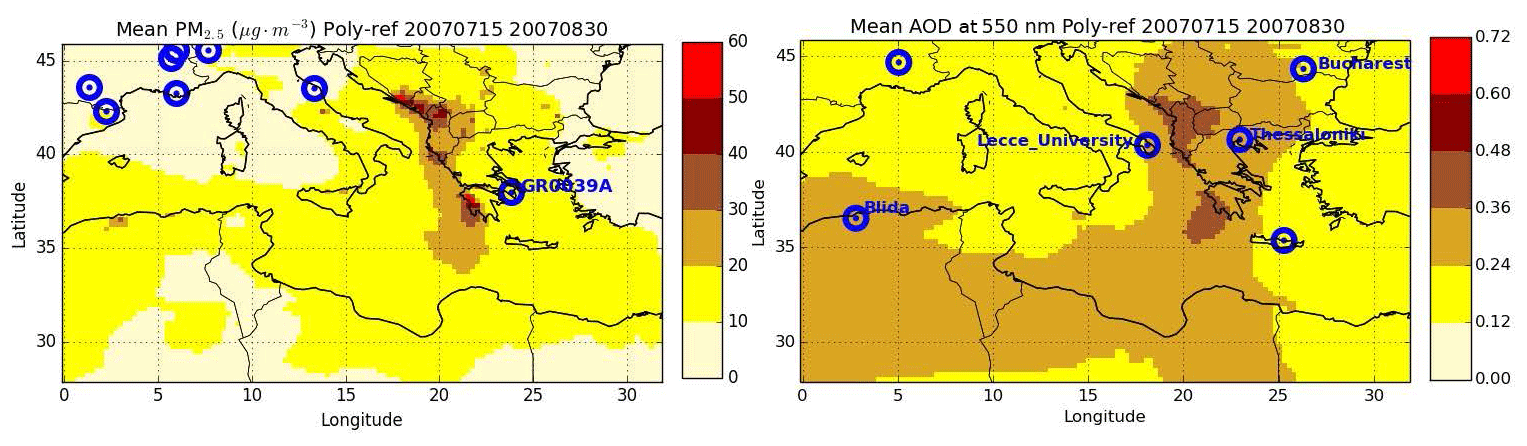
Figure 3Daily mean surface PM2.5 and AOD at 550 nm from the Poly-ref simulation averaged over the summer of 2007 (the eight AIRBASE and six AERONET stations, used in this work, are represented here in blue dots).
3.4 Fire events
To better understand the sensitivity of PM2.5 concentrations and AOD to I/S-VOC emissions and the fire injection heights during the fire events, the composition of PM during fire peaks and the evaluation of fire contribution are examined. The locations of the fire peaks during the two main fire events are first detailed.
3.4.1 Locations of the fire peaks
The contribution of fires to PM2.5 concentrations simulated by Polyphemus during the two main fire events (20–31 July and 24–30 August) is presented in Fig. 4 as the relative difference between the reference simulation (Poly-ref) and the simulation without fire emissions (Poly-Nofires). The largest contribution is simulated over the Balkans and eastern Europe during the first period (sub-region MedReg1) and Greece (sub-region MedReg2) and Algeria (sub-region MedReg4) during the second period. The impact reaches up to 90 % locally on average during each fire event. The contribution of fires remains large (>60 %) over most of the eastern Mediterranean basin and part of the western basin at the end of August due to long-range transport of fire plumes. Figure C1 in Appendix C shows that the contribution of fire for CHIMERE is similar to that for Polyphemus. Only the closest AIRBASE and AERONET stations to fire regions (where fire contribution is higher than 50 %) are used in models-to-measurements comparisons in the next sections. During the first fire event, the most affected stations are GR0039A in Greece (sub-region MedReg2) and Bucharest in Romania (sub-region MedReg1), while during the second fire event, stations in Greece (Thessaloniki in sub-region MedReg2), Italy (Lecce University in sub-region MedReg3) and Algeria (Blida in sub-region MedReg4) are the most influenced. However, since the models show the same behavior during the second fire event over stations GR0039A and Thessaloniki, we choose to focus only on GR0039A.
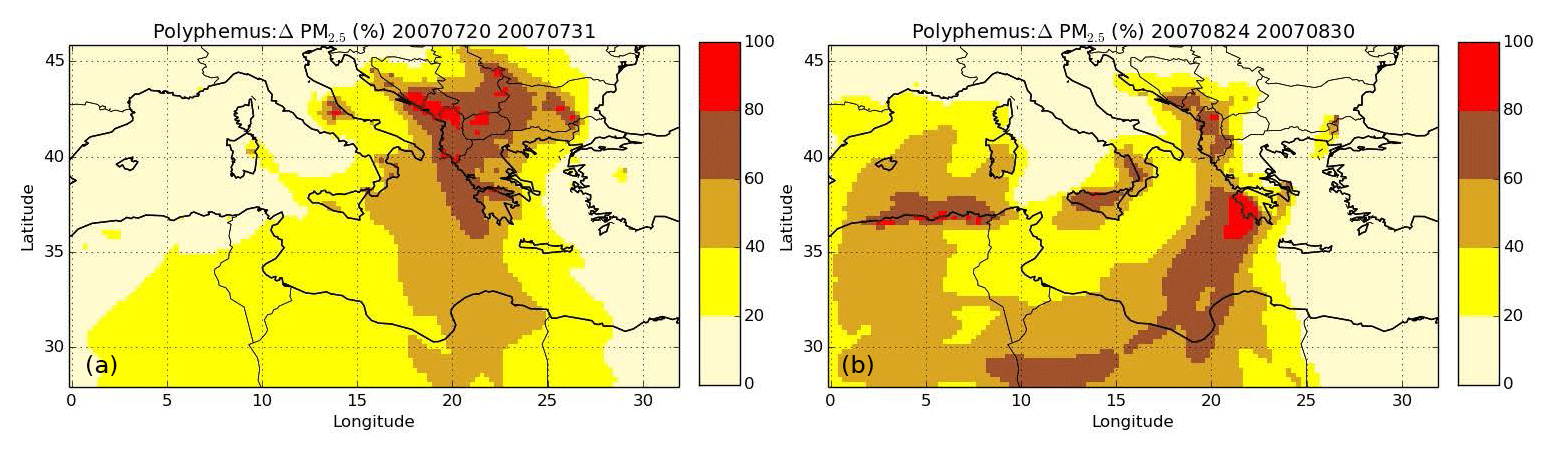
Figure 4(a) Relative difference of surface PM2.5 concentrations between simulations Poly-ref and Poly-Nofires during the first fire event. (b) Relative difference of surface PM2.5 concentrations between simulations Poly-ref and Poly-Nofires during the second fire event.
3.4.2 Aerosol composition during fire peaks
The compositions of surface PM2.5 concentrations simulated during the first fire event over MedReg1 and during the second one over MedReg2 are shown in Figs. 5 and 6, respectively. These two subregions are the areas most affected by fires (high fire emissions (Fig. 1) especially during the first fire event for MedReg1 and during the second fire event for MedReg2). The upper left panel shows the composition of surface PM2.5 concentrations for the simulation without fire Poly-Nofires (background surface PM2.5 concentrations), while the upper right panel shows the composition of surface PM2.5 concentrations due to fires (differences between simulations Poly-ref and Poly-Nofires). If wildfires are not taken into account (simulation without fire) and during the first fire event over MedReg1, organic and inorganic aerosols contribute equally (42.6 %, 40.5 %) to the surface PM2.5 concentrations. The contributions of REM-PM2.5 (dust) black carbon are lower (15 %, 1 %). As noted by Chrit et al. (2017), most of the summer organic aerosols are from biogenic sources in this region. If wildfires are not taken into account during the second fire event over MedReg2, inorganics and REM-PM2.5 are the predominant component in the composition of PM2.5 concentrations (56.5 % and 27.9 %). Lower contributions are simulated for black carbon (1.2 %) and organic aerosol (14.3 %). Figures 5 and 6 also show the composition of surface PM2.5 concentrations due to fires for simulations Poly-ref (differences between simulations Poly-ref and Poly-Nofires), Poly-noI/S-VOCs (differences between simulations Poly-noI/S-VOCs and Poly-Nofires), and Poly-NoREM-PM2.5 (differences between simulations Poly-NoREM-PM2.5 and Poly-Nofires). During the first fire event over MedReg1, organic aerosol is predominant in the contribution of fires (between 47 % and 85 % of the contribution). Organic aerosol is mostly composed of POA and SOA from I/S/L-VOCs (46 % to 80 %). Note that POA and SOA from L-VOCs (low volatile organic compounds) are important even in the simulation when I/S-VOCs are not taken into account in fire emissions (46 %), because POA are then assigned to L-VOCs. The contributions from inorganics (8 % to 13 %) and black carbon (3 % to 6 %) are low. During the second fire event over MedReg2, a similar PM2.5 composition is found. Organic aerosol (mainly the POA and SOA from I/S/L-VOCs) is the most important component contributing to PM2.5 from fires (between 46 % and 81 % of the contribution). The contributions from inorganics (9 % to 12 %) and black carbon (5 % to 6 %) are lower. The contribution of REM-PM2.5 from fires (if it is included) is very significant: 27 % for the simulations with I/S-VOCs and 36 % otherwise. Because REM-PM2.5 emissions are incorporated to consider the difference between PM2.5 emission factors and the total of all PM included in specific species, the contribution of REM-PM2.5 may be overestimated (double counting with I/S-VOCs for instance).
In our study, inorganics (mainly sulfate, sea salt and ammonium) contribute highly to PM2.5 composition, if fire emissions are not considered. Similar results are found in Fountoukis et al. (2011) who showed the high contribution of sulfate, sea salt and ammonium to PM over Europe during May 2008. However, when fire emissions are taken into account, the contribution of inorganics becomes lower than the contribution of organics (8 % to 9 % of inorganics against 40 % to 80 % of organics). Focusing on the contribution from fires, sulfate, ammonium and nitrate are the predominant components in the composition of inorganics from fires: between 55.7 % and 67.6 % for sulfate, between 26.8 % and 38.7 % for ammonium and 5.6 % to 13.6 % for nitrate.
Similar PM2.5 composition is found during the second fire peak, and in the concentrations simulated by CHIMERE (not shown here). Surface PM2.5 concentrations from fire simulated by CHIMERE are composed in the first and second events mainly of organic aerosols, mostly composed by primary organic carbon (OCAR) (46 %) which corresponds to I/S/L-VOCs in Polyphemus, and of REM-PM2.5 (39 %). The contributions from inorganics (9 %), black carbon (5.2 %) and SOA (2.7 %) are low.

Figure 5Composition of surface PM2.5 concentration over MedReg1 during the first fire event (a simulation Poly-Nofires). Composition of surface PM2.5 concentration due to fires (b simulation Poly-ref; c simulation Poly-noI/S-VOCs; d simulation Poly-NoREM-PM2.5).
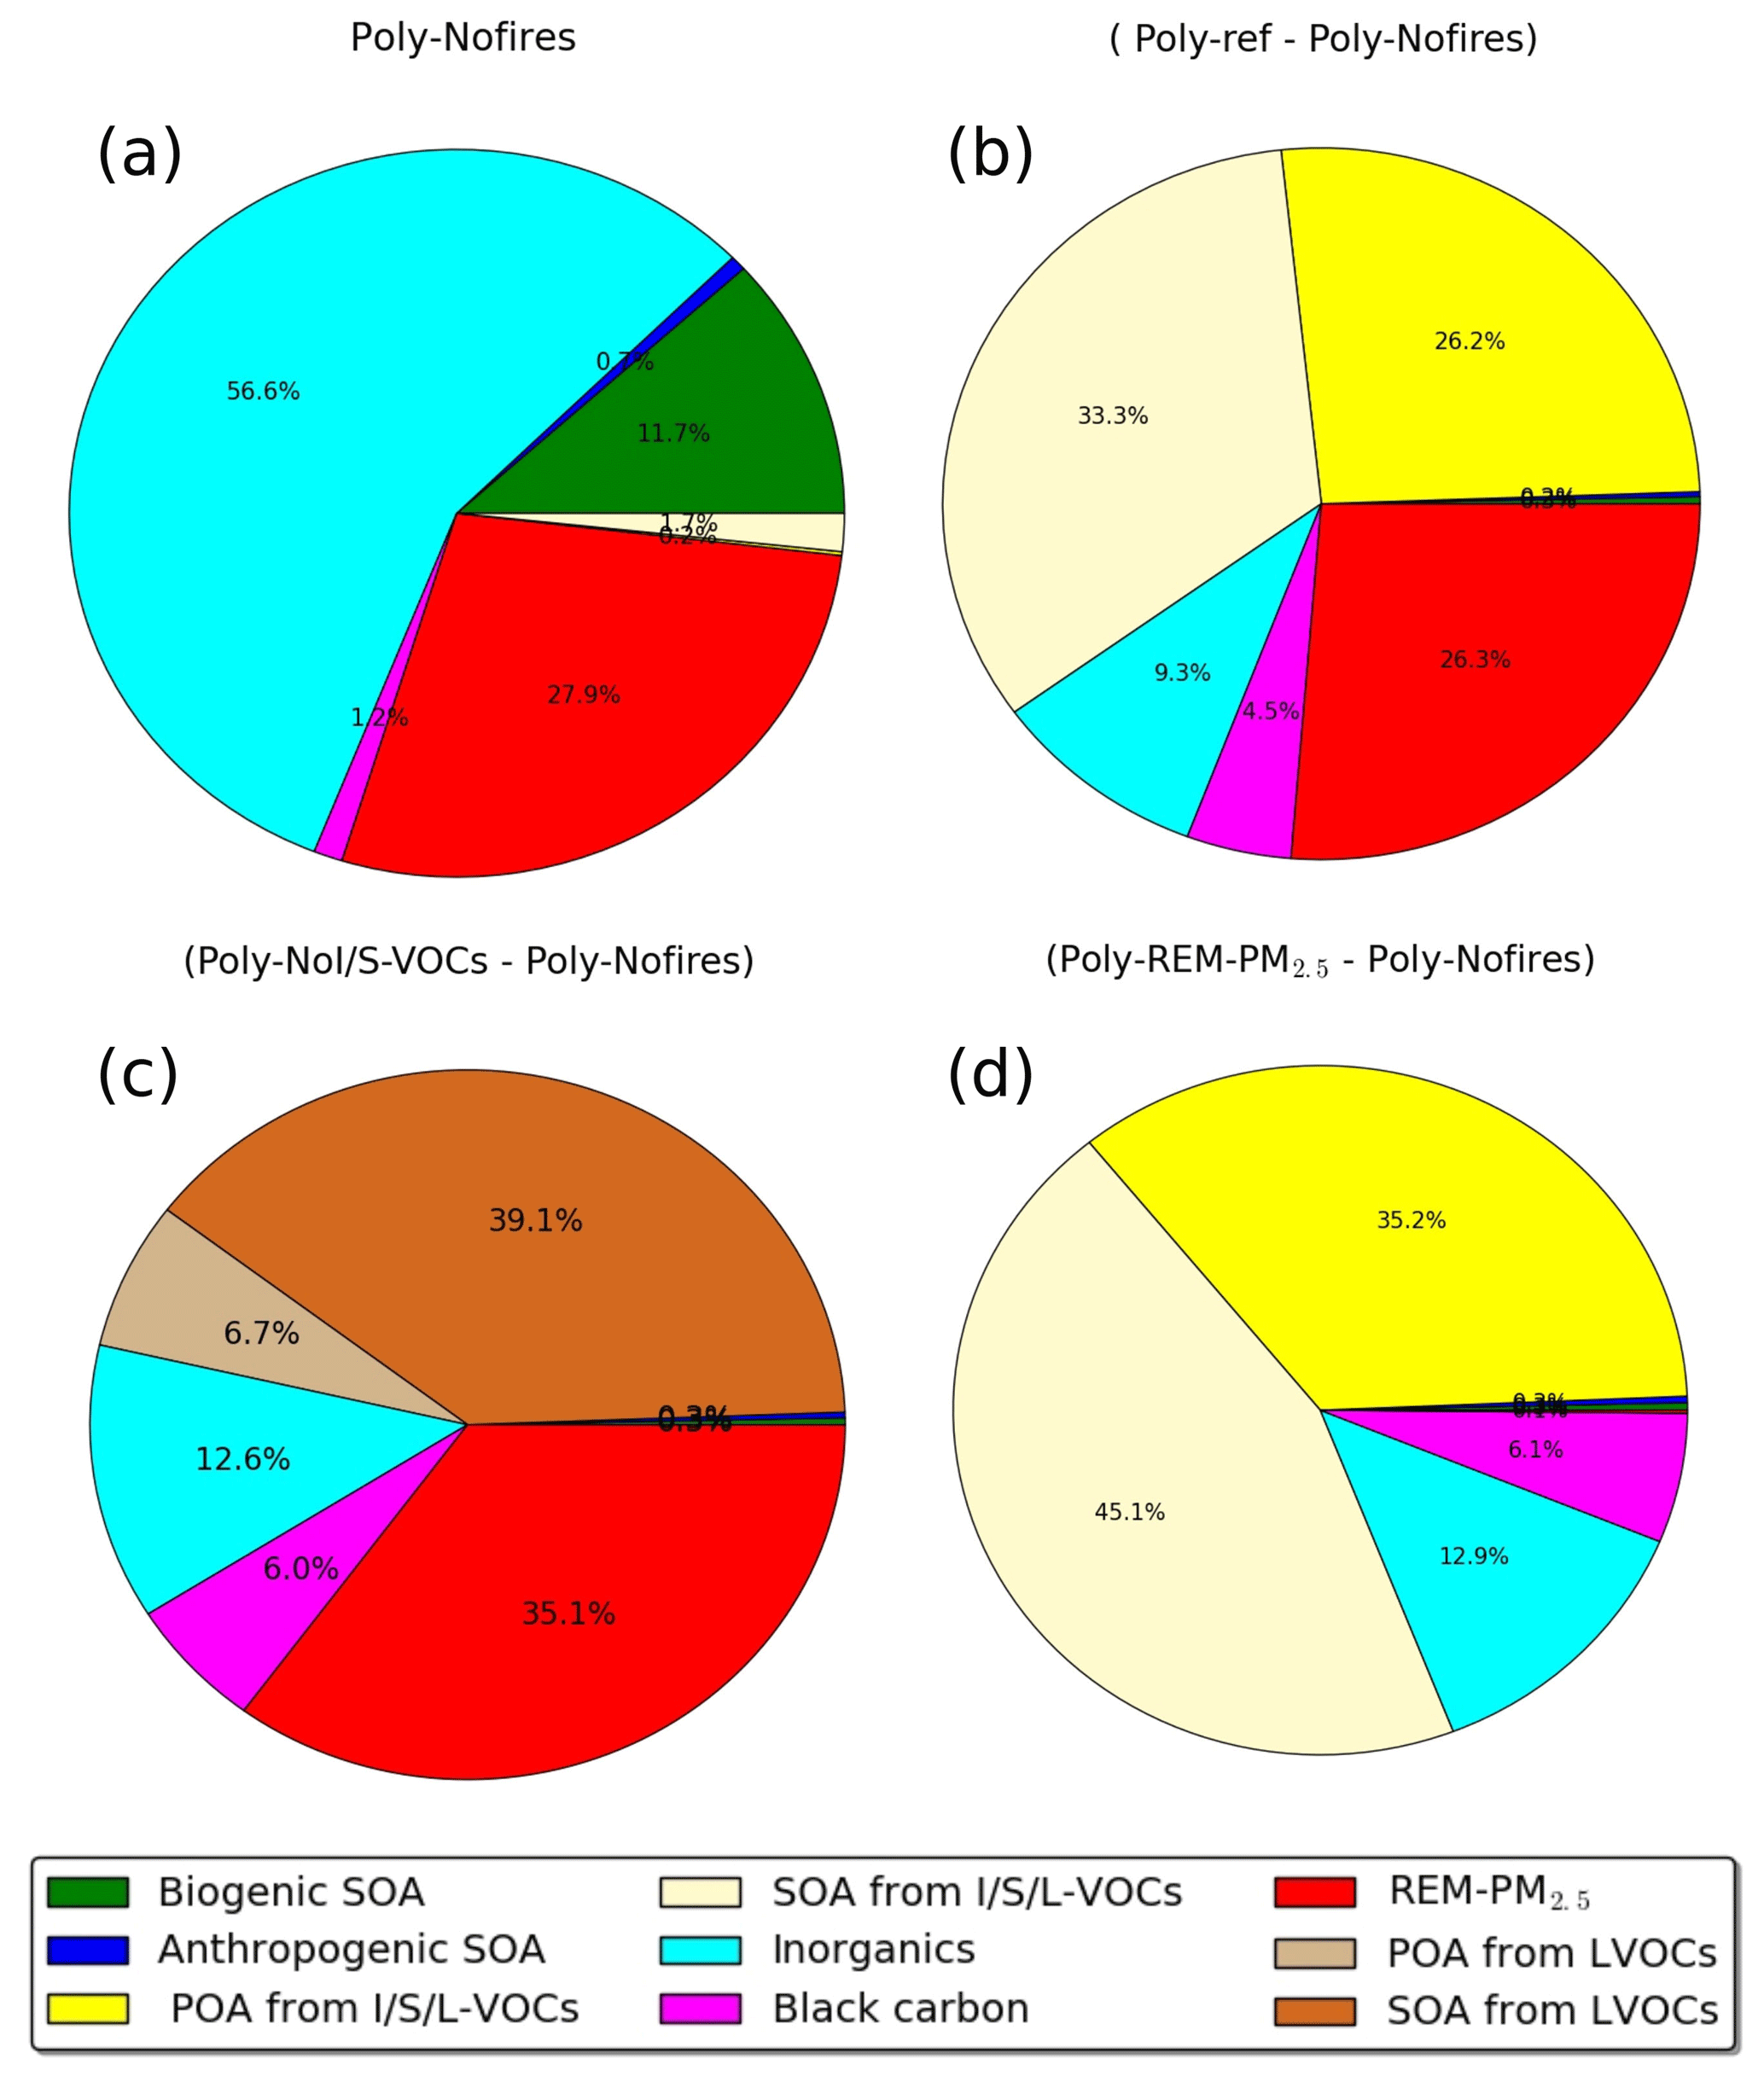
Figure 6Composition of surface PM2.5 concentration over MedReg2 during the second fire event (a simulation Poly-Nofires). Composition of surface PM2.5 concentration due to fires (b simulation Poly-ref; c simulation Poly-noI/S-VOCs; d simulation Poly-NoREM-PM2.5).
3.4.3 Evaluation of fire contribution
Figure 7 shows time series of daily observed and simulated aerosols at background suburban and background rural stations with available data during fire events and with a fire contribution higher than 10 % (PM2.5 in Greece (sub-region MedReg2), AOD at 550 nm in Italy (sub-region MedReg3), Romania (sub-region MedReg1) and Algeria (sub-region MedReg4). A significant increase in AOD and PM2.5 concentration is observed during the major fire episodes on 20–28 July and 24–30 August, associated with large contributions from fires. The daily average AOD, observed by MODIS and simulated for the sub-regions of Fig. 1, are shown in Fig. 8. Background AOD and daily variability are consistent with MODIS for both models in the sub-regions of Fig. 1, with high correlation coefficients (∼90 % on average for Polyphemus, 80 % for CHIMERE).
As shown in Figs. 7 and 8, injecting emissions higher (simulation Poly-3 km) significantly lowers surface PM concentrations (compared to simulation Poly-ref), even if the maximum injection height remains conservative. Not taking into account SOA from I/S-VOCs directly reduces emissions, thus having a strong influence on PM concentrations (−20 % compared to Poly-ref). A reduction of the same order of magnitude is obtained when REM-PM2.5 is not accounted for (Poly-NoREM-PM2.5), suggesting that the incorporation of this species into APIFLAME could compensate for the missing I/S-VOC emissions.
Compared to MODIS AOD (Fig. 8), the simulations including I/S-VOCs (Poly-ref, Poly-3 km and Poly-NoREM-PM2.5) overestimate AOD during the fire events, while simulations without I/S-VOCs underestimate AOD. This is more pronounced in the two sub-regions MedReg1 and MedReg2, where the mean modeled AOD values are overestimated by about 30 % for Poly-ref and Poly-3 km and 10 % for Poly-NoREM-PM2.5. Compared to AIRBASE ground measurements (Fig. 7), the peak corresponding to the first event (25 July) is well modeled in simulation Poly-ref compared to PM2.5 observations at GR0039A (Athens suburbs, Greece, sub-region MedReg2). The temporal variations of the mean simulated PM2.5 concentrations are consistent with observations, with high correlation coefficients (>88 %). Background levels of PM2.5 are slightly underestimated compared to observations. This can be explained by an underestimation of dust long-range transport or an underestimation of local emissions. The peak of PM2.5 concentration is slightly underestimated in all the other simulations. At the GR0035A station, the temporal tendencies of the simulated PM2.5 concentrations are consistent with the observations. However, the first PM2.5 peak is underestimated since PM22.5 levels are strongly underestimated (bias %). The observed background levels are significantly higher than those at the GR0035A station. This suggests the influence of local emissions that are missing in the model or limitations due to the coarse model resolutions which can not represent this station. At Bucharest, two high AOD peaks are modeled (Fig. 7). Compared to AERONET ground observations, the first peak is well modeled on 23 July (0.46 against measurements 0.5) and underestimated on 30 July (0.51 against measurements 0.82 but simulated 1 day after the observations, probably due to uncertainty in the MODIS fire detection). The observed values of the Ångström exponent are lower on 23 July (α∼ 0.57), indicating a large fraction of coarse-mode particles (probably dust transport), than on 30 July (α∼ 1.6, large fraction of fine-mode particles from fires). These underestimations or overestimations of the model's AOD, depending on the data set used for the evaluation (AERONET vs. MODIS), underline uncertainties in AOD retrievals from measurements, which have already been observed by numerous studies (Boiyo et al., 2017; Li et al., 2009; Wu et al., 2017).
During the second fire event, the contribution from fires becomes predominant on 24 August (beginning of the event according to MODIS fire observations). The best agreement with PM2.5 in Greece is obtained for simulations Poly-3 km and CHIMERE, although the latter overestimates surface concentrations on the following days. At the GR0035A station, the second observed peak during the second fire event is more than twice as high as the observed peak at GR0039A and is measured 1 day earlier. In the simulations, the enhancement due to fires is similar in shape and magnitude, clearly highlighting the difficulty in simulating the exact temporal variability of emissions and transport of fire plumes in CTMs. Moreover, station GR0035A is probably affected by a dust episode during the second fire event. For AOD at Lecce University, all simulations show good agreement with observations. According to AERONET level 1.5 measurements in Blida (in Algeria, sub-region MedReg5), an AOD peak (0.55) is observed on 27 August. The AOD simulated by CHIMERE and Polypohemus is consistent with the measurements mainly for Poly-ref, Poly-3 km, Poly-NoREM-PM2.5 and CHIMERE-ref. Poly-noI/S-VOCs shows the lowest AOD values at Lecce University (0.38) and Blida (0.33). This suggests that taking into account I/S-VOC emissions leads to higher and more realistic AOD at these stations.
In Blida, three peaks are simulated for 2, 6 and 16 August. The observed values of the Ångström exponent are equal to α∼1.18 and α∼1.14 for the first and third peaks, respectively, which indicates fine-mode particles. Therefore, the first and third peaks are attributed mostly to fires in Algeria on 2 and 16 August. However, emissions are probably underestimated, as all the models underestimate the AOD fire peaks. Since a lower value of the Ångström exponent is observed on 6 August (α∼ 0.91), this second peak is probably attributed to dust.
This analysis highlights the strong regional impact during intense events on both AOD and PM2.5 concentrations but also the difficulties in representing their amplitudes and variability. Considering the uncertainty on fire data and emissions (∼100 %) and on the observations (1 %–2 % for AERONET observations, Eck et al., 1999, and ∼34 % for AIRBASE observations, Bovchaliuk, 2013), the performance obtained is considered very reasonable. The spread in the different model configurations tested shows the additional uncertainty on the modeling of fire impact. Observations generally lie within the simulated variability, but it is difficult to extract the best model configuration (it depends on the event and on the station). For the first fire event, Fig. 9 shows maps of the daily mean AOD at 550 nm from MODIS, modeled by Polyphemus (Poly-ref) and CHIMERE (CHIMERE-ref). The simulated AOD is generally in good agreement with the observations in terms of localization. The AOD calculated from Poly-ref and CHIMERE-ref simulations is close to observations in the Balkans. However, it seems overestimated in the fresh plume and further downwind (reaching ∼0.65 for Poly-ref and 0.52 for CHIMERE-ref). Results of Poly-noI/S-VOCs are close to those of the CHIMERE model, which does not include I/S-VOC emissions. During the second fire event in Greece, the simulated AOD for Poly-ref and for CHIMERE-ref is about 1 and 0.9, respectively, as shown in Fig. D1 in Appendix D. The observed AOD can reach 0.9. However, both models overestimate AOD values in the fire plume (reaching 0.98 for Poly-ref and 0.88 for CHIMERE-ref against 0.7–0.8 in Greece and 0.5 from MODIS). The fire plume is less pronounced in observations than in simulations.
Day-to-day comparisons for 4 selected days (24, 25, 27 and 29 August 2007) are shown in Fig. E1 in Appendix E. The simulated AOD is consistent with the observations in terms of localization and general transport pathways. However, the simulated AOD is much higher in the Greek fires' plume compared with MODIS observations during the peak of emissions (25–29 August). This probably reflects too low a temporal variability in the emissions. In the simulations, emissions are assumed constant during the day, but comparisons suggest shorter temporal variability. This is also apparent in the time series of Fig. 8, over MedReg2: the peak for the second fire event is twice as long in the simulations (double peak starting on 25 August 2007) as in the observations. This peak over 2 days instead of 1 in the simulations suggests an overestimate of emissions during this event which is also observed with respect to surface observations in Greece. The first peak corresponds better to observations. This shows that uncertainties are related not only to total emissions, but also to their temporal variability and the associated transport pathways.
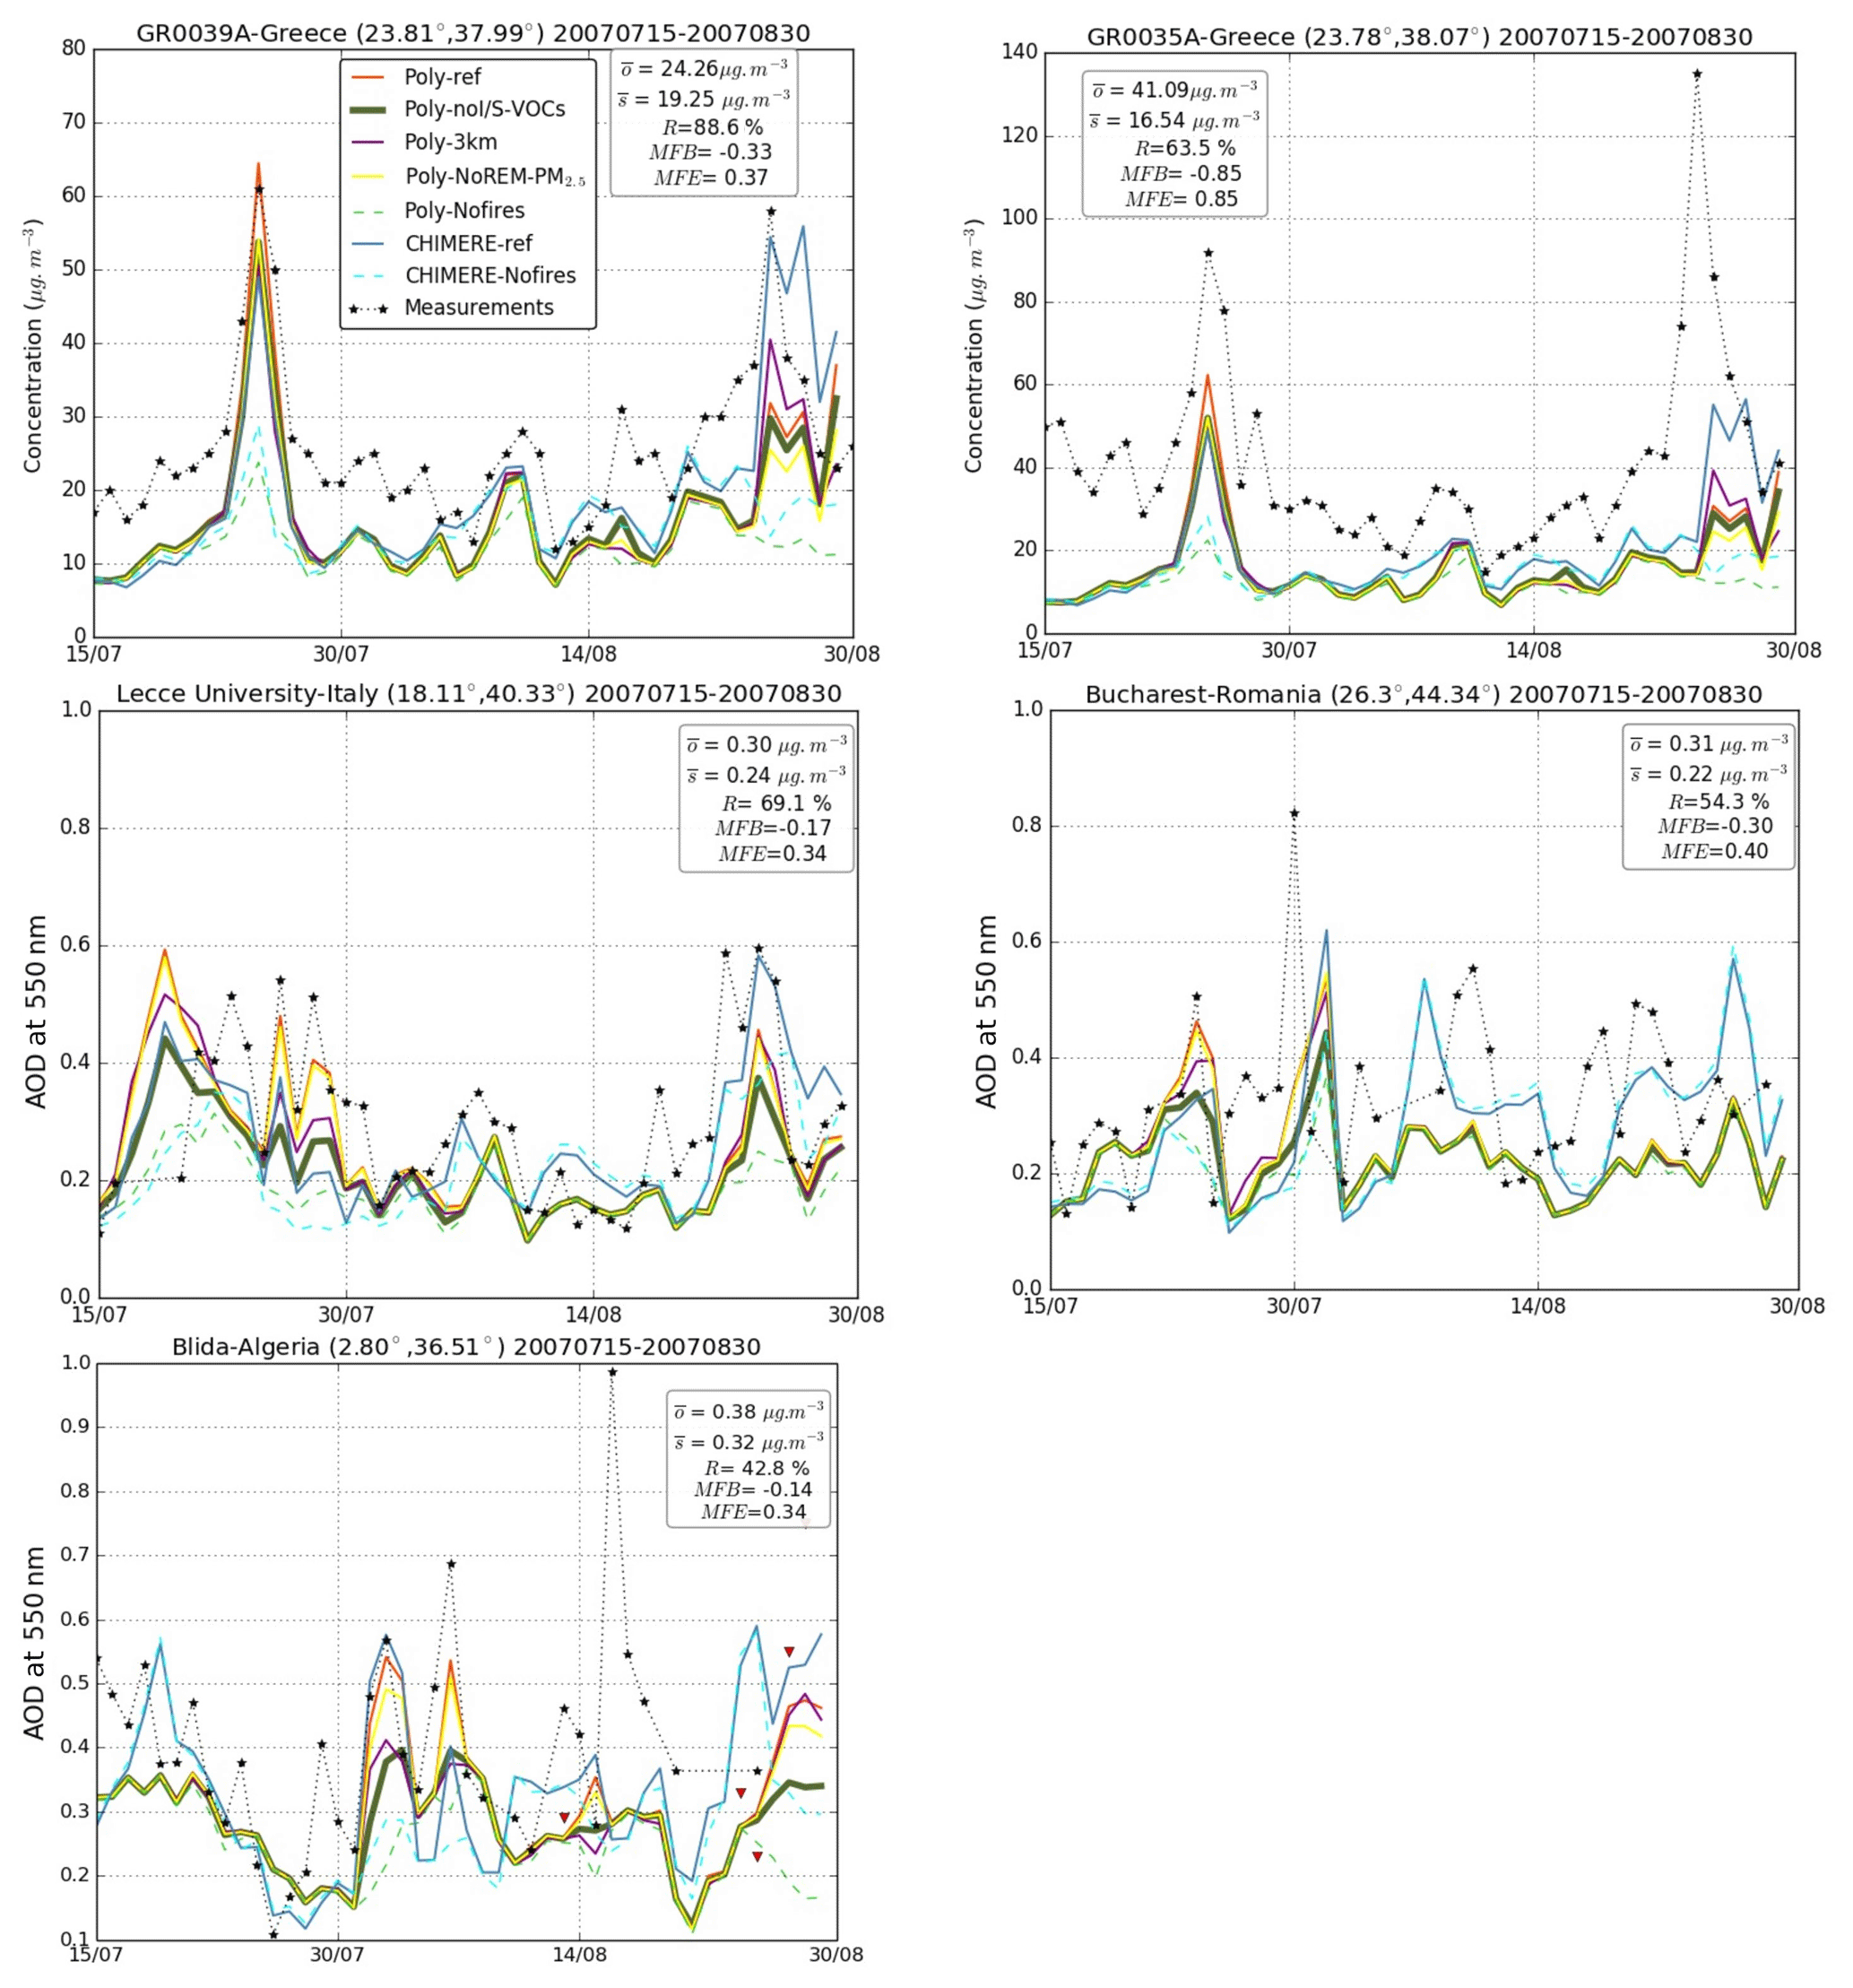
Figure 7Time series from 15 July to 30 August of daily mean surface PM2.5 concentrations at AIRBASE station GR0039A and GR0035A daily mean AOD at 550 nm at three AERONET stations (Lecce University, Bucharest, Blida). The red triangles in Blida station correspond to AERONET measurements using AOD level 1.5 AOD data at 500 nm. Statistics for simulation Poly-ref are shown at each station.
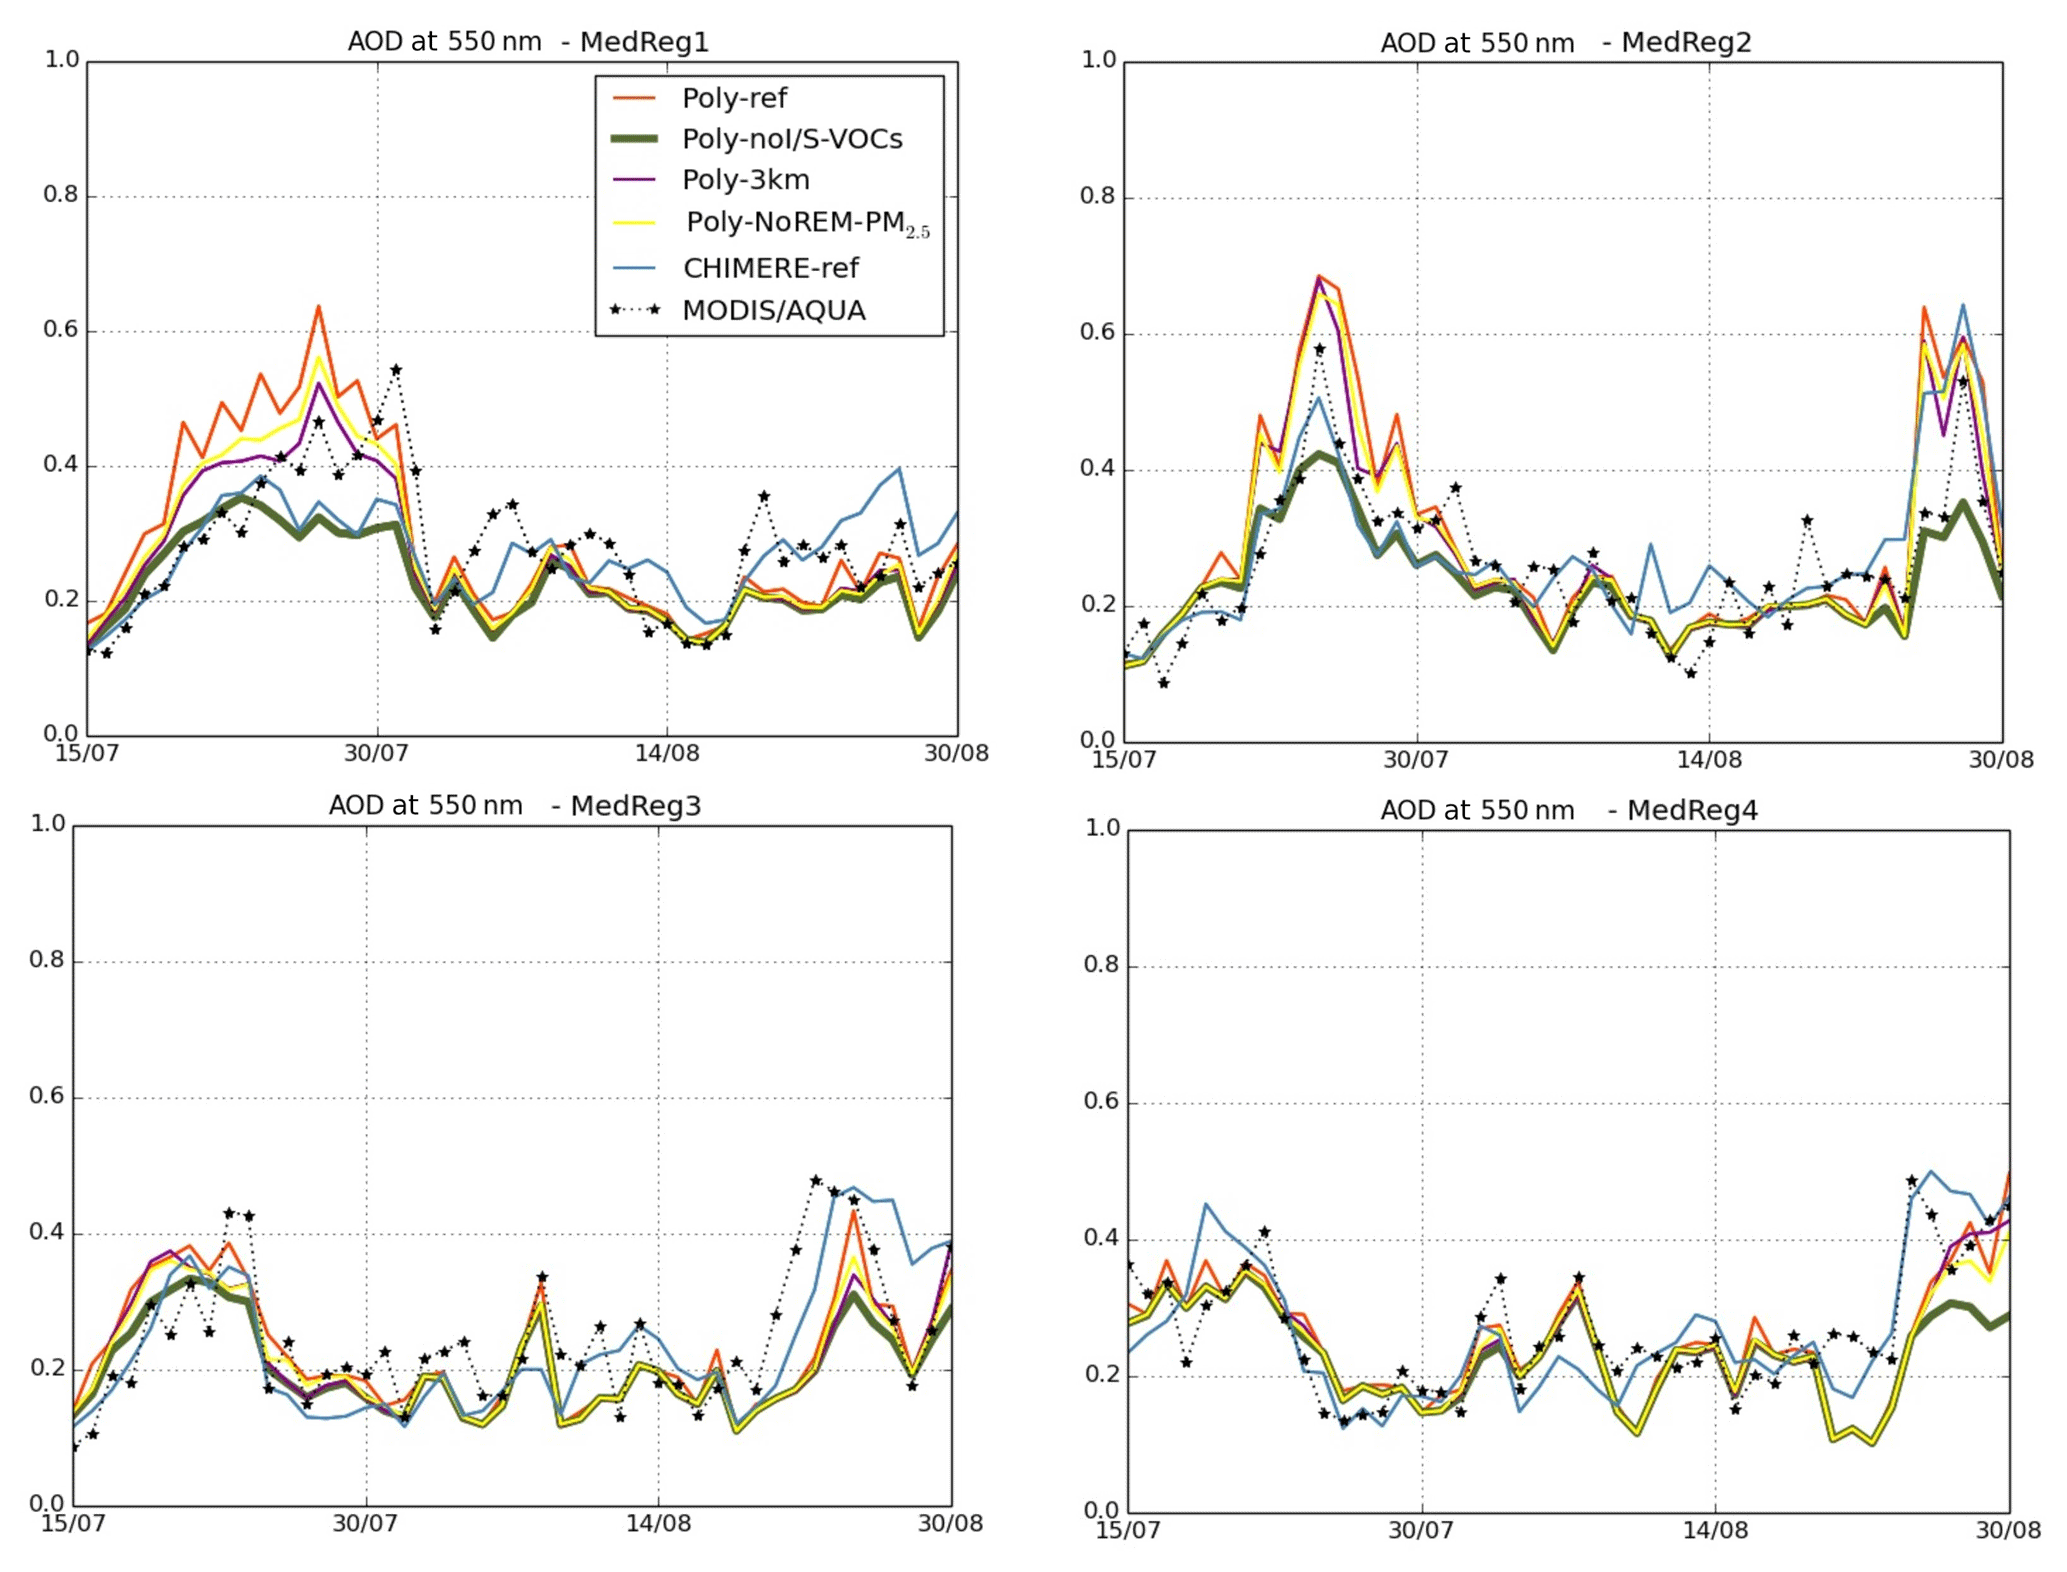
Figure 8Daily mean AOD at 550 nm observed by MODIS and simulated by Polyphemus and CHIMERE from 15 July to 30 August 2007, in the sub-regions of Fig. 1.
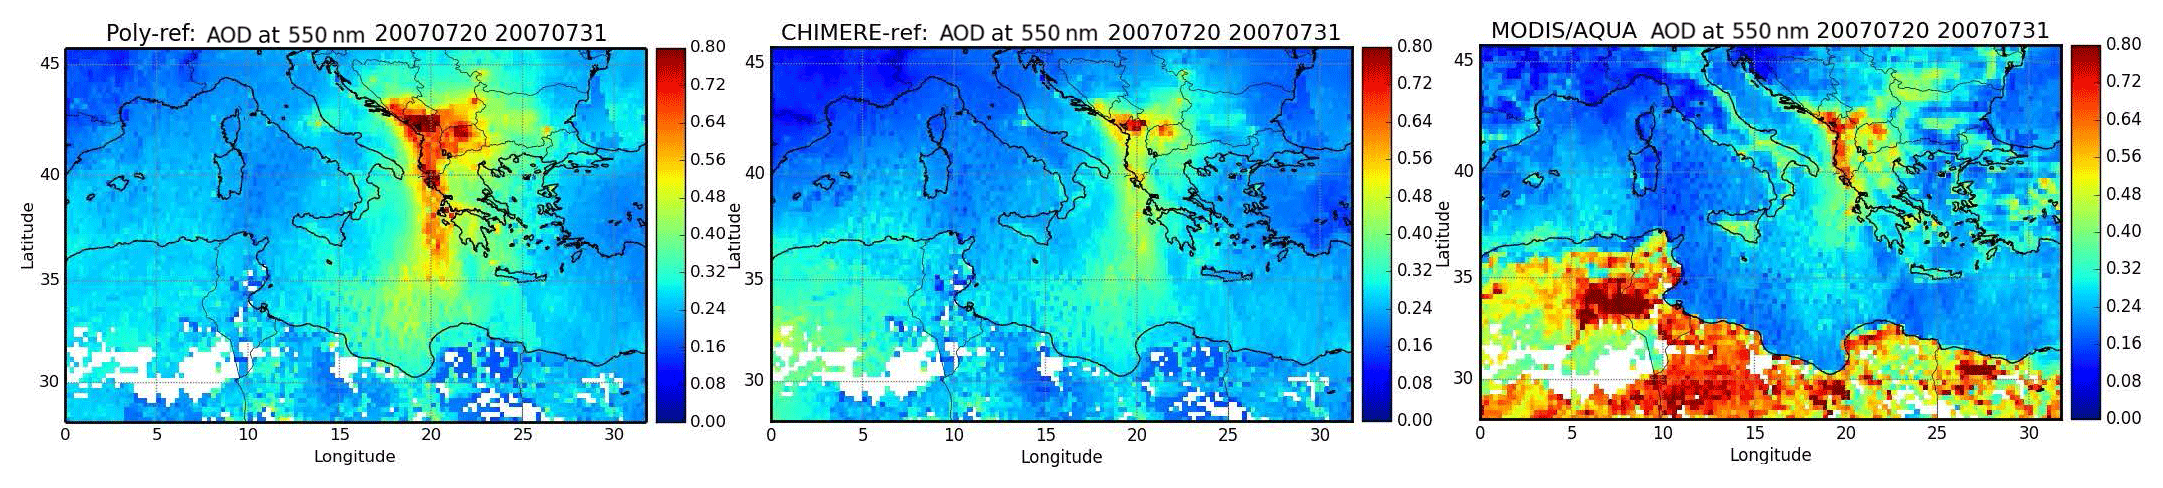
Figure 9Mean total AOD (at 550 nm) from MODIS/AQUA, Poly-ref and CHIMERE-ref during the first fire event (20–31 July 2007).
The sensitivity of the modeling of I/S-VOC emissions and injection heights on simulated surface PM2.5 concentrations and AOD is now evaluated regionally over the Mediterranean domain.
The sensitivity of the model results to the I/S-VOC emissions and injection heights is compared to the inter-model sensitivity presented in Fig. 10, which shows the relative differences between a sensitivity simulation (CHIMERE-ref, Poly-noI/S-VOCs, Poly-3 km) and the reference simulation Poly-ref. To focus on fire impact, only the PM2.5 concentrations and AOD exceeding 15 µg m−3 and 0.25, respectively, are taken into account when computing the relative differences between the simulations. It is worth noting that the arbitrary choice made in this work (injecting between 1 and 3 km) may overestimate the impact of injection height on surface PM2.5 concentrations and underestimate it on long-range transport (injecting fire emissions at or below 3 km remains conservatively low).
The inter-model sensitivity is low (relative differences below 20 %) for both surface PM2.5 concentrations and AOD, except in the Balkans (sub-region MedReg1), where it can reach 50 % locally. The high inter-model differences are slightly more spread horizontally for surface PM2.5 concentrations than for AOD. Furthermore, this region of high inter-model sensitivity corresponds to the region where the sensitivity to the injection height is highest for PM2.5 concentrations. It may therefore be linked to differences in the models' vertical discretization. The models use different vertical coordinates and different numbers of vertical levels. The vertical resolution of the models is rather low as Polyphemus uses 14 vertical levels and CHIMERE uses 19 vertical levels.
Neglecting I/S-VOC emissions leads to a decrease in surface PM2.5 concentrations. The impact of I/S-VOC emissions on surface PM2.5 concentrations over the fire regions is mostly under 20 %, but reaches 30 % locally. The impact of I/S-VOC emissions is spread over larger areas than the inter-model difference.
I/S-VOC emissions have a higher impact on AOD than on surface PM2.5 concentrations, since adding I/S-VOCs increases the total integrated PM2.5 concentrations: the increase can be as high as 40 % in the Balkans and 30 % in Greece and the fire plume.
As previously discussed, a surrogate species may be considered to represent a missing mass in the model fire emissions, REM-PM2.5 in this study (emissions factors of PM2.5 minus primary aerosol emissions of OM, BC and sulfate). This missing mass may be used to fill a gap in current evaluation of emissions. However, considering REM-PM2.5 emissions and I/S/L-VOC emissions may be redundant. While a fraction of REM-PM2.5 can be due to the low diameter of dust particles, several models partly treat this missing mass by deducing I/S/L-VOC contribution from particulate matter emissions (Konovalov et al., 2015; Koo et al., 2014). For example, several studies estimated the contribution from I/S/L-VOC emissions by multiplying the primary organic aerosols (POA) by a factor of 1.5 following chamber measurements (Kim et al., 2016; Robinson et al., 2007; Zhu et al., 2016). Some studies/models do not consider specific species/surrogates to treat these missing emissions, but simply use a ratio to reduce uncertainties related to the estimation of PM emissions. For example, Kaiser et al. (2012) use a factor of 3.4 for PM emissions based on the comparison between simulations and AOD observations.
Injecting above the boundary layer results in larger-scale transport for PM2.5 concentrations that leads to the highest impact on surface PM2.5 concentrations (40 % to 50 % near the fire regions and 30 % in the fresh plume and further downwind). However, the impact of the injection height on AOD is lower but still significant (mostly under 20 %, but reaching 30 % locally). Similar results are found in Turquety et al. (2007), Chen et al. (2009), Stein (2009), Daskalakis et al. (2015), and Gonzi et al. (2015). In fact, previous studies highlighted the high sensitivity of long-range transport of carbon monoxide (CO) to wildfire injection height (Gonzi et al., 2015; Turquety et al., 2007). It also leads to a reduction of concentrations at the surface Chen et al. (2009). The sensitivity analysis of Stein (2009) estimates a strong reduction in the surface PM2.5 concentrations (>10 µg m−3) caused by fire emission injection height over the United States. According to Daskalakis et al. (2015), assumptions about the injection heights of fire emissions can also result regionally in up to 30 % differences in the calculated tropospheric lifetime of pollutants. This can lead to significant interactions between isoprene and fire emissions. Daskalakis et al. (2015) showed that these interactions affect the effectiveness of isoprene in producing secondary aerosols (up to 18 %).
This analysis highlights that injecting above the boundary layer is more critical for surface PM2.5 concentrations than integrating I/S-VOC emissions, since 78 % of fire emissions are emitted above the boundary layer. However, for AOD and vertically integrated concentrations, integrating I/S-VOC emissions is more critical than the injection heights.
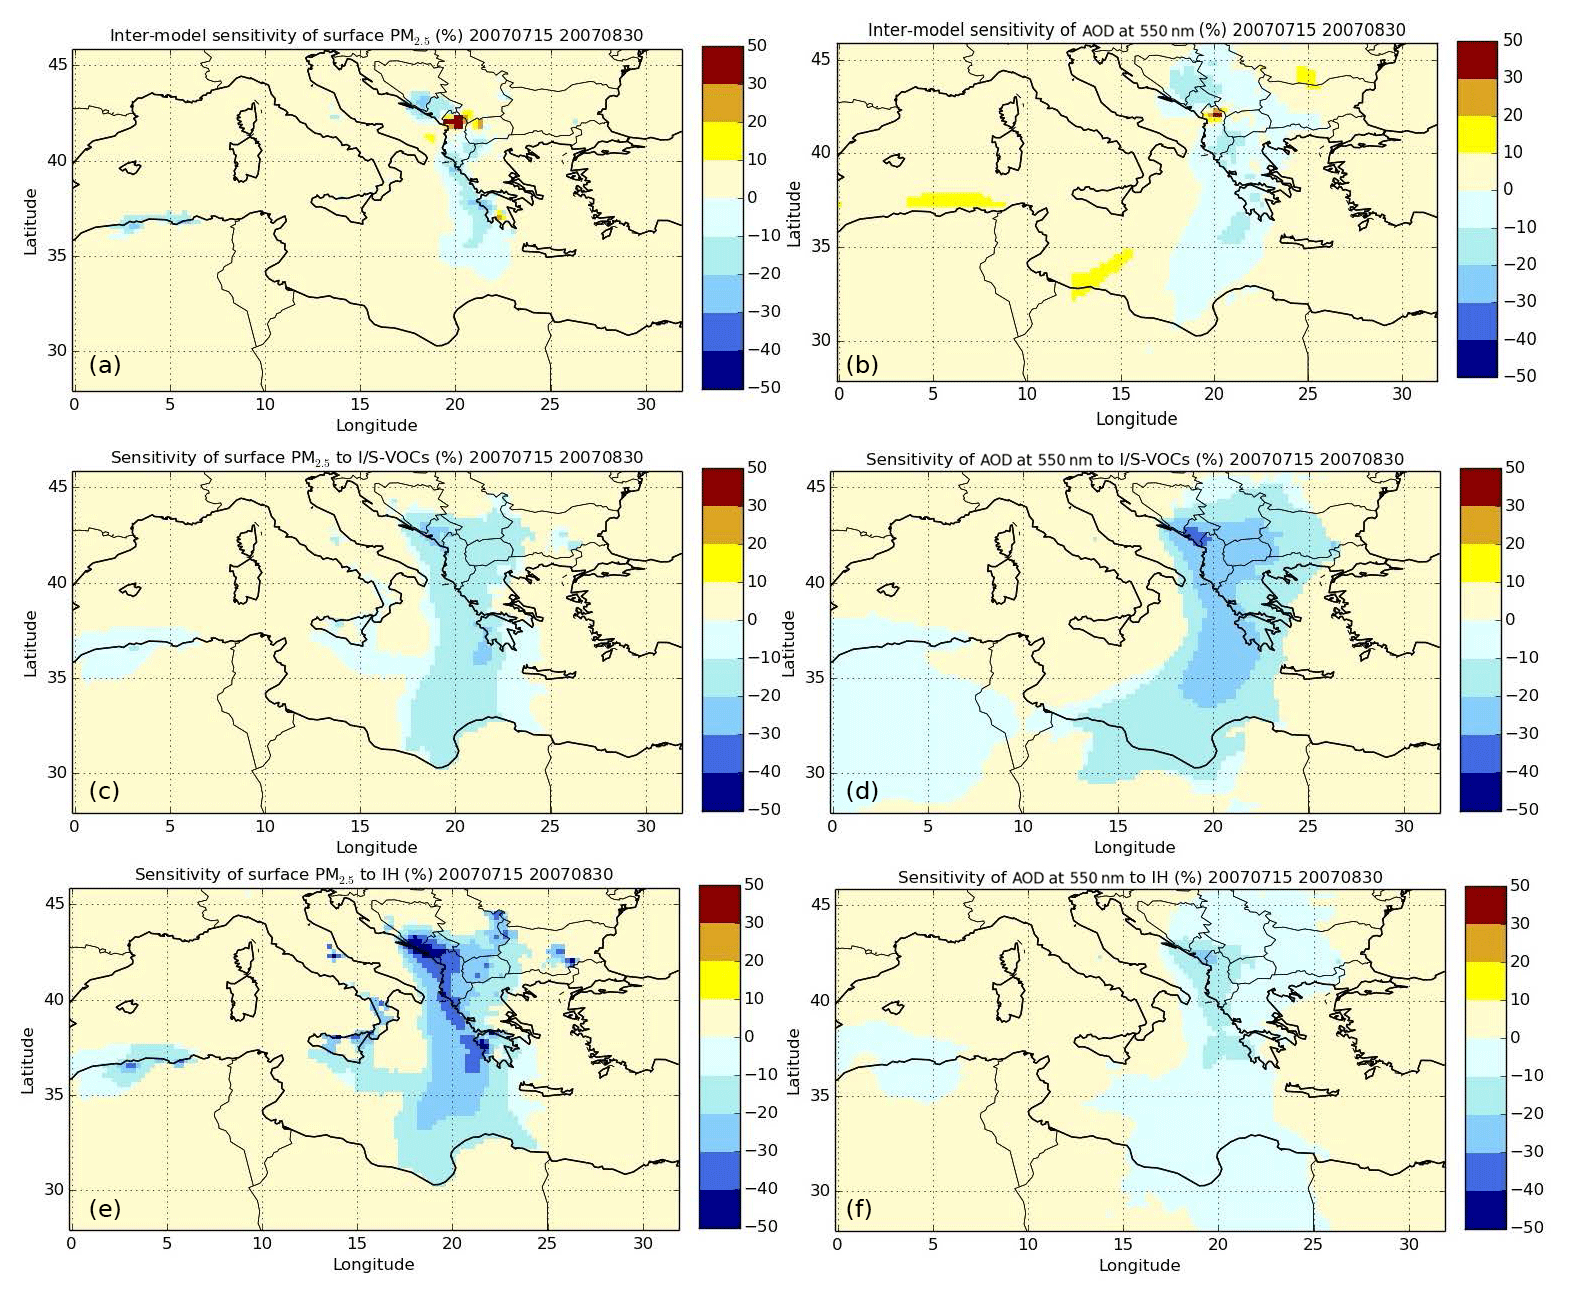
Figure 10Sensitivity of surface PM2.5 concentrations (a, c, e) and AOD at 550 nm (b, d, f) to the CTM used (CHIMERE-ref or Poly-ref, upper panels), the modeling of I/S-VOC emissions (Poly-noI/S-VOCs or Poly-ref, middle panels) and the injection height (IH) (Poly-3 km or Poly-ref, lower panels) during the summer of 2007 (15 July to 30 August). Simulation Poly-ref is used in all panels to estimate the relative differences.
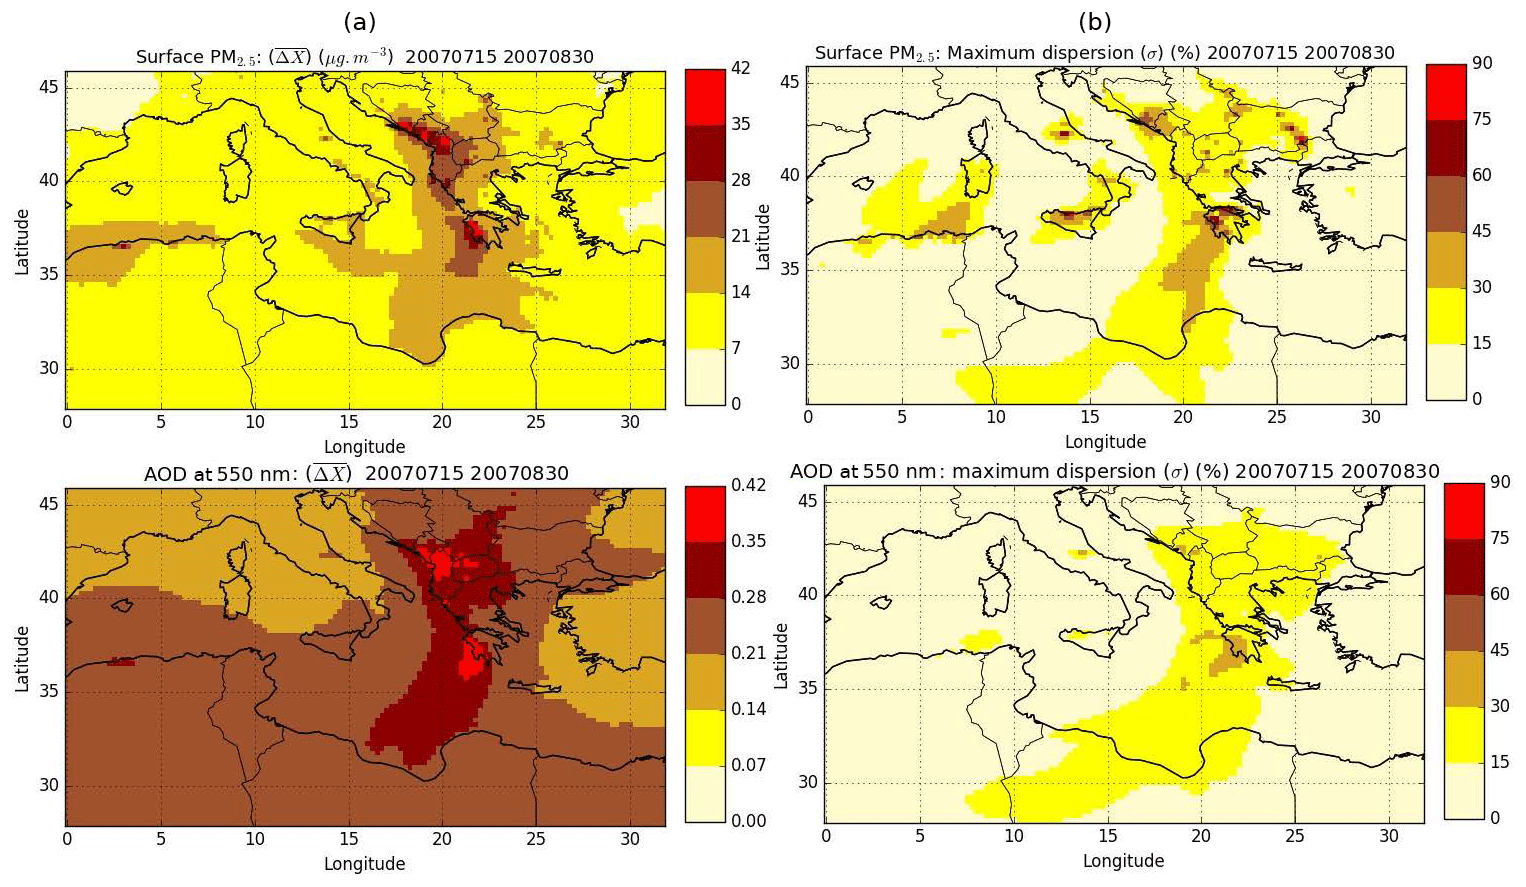
Figure 11Mean surface PM2.5 concentrations and AOD (estimated using four Polyphemus sensitivity simulations) (a) and their relative maximum statistical dispersion (σ) (b) during the summer of 2007.
The ensemble of the sensitivity simulations provides an estimate of the uncertainty of the modeling of fire plumes. To quantify uncertainties related to fire emissions modeling, the maximum statistical dispersion (σ) is used as a statistical estimator. The maximum statistical dispersion (σ) for surface PM2.5 and AOD calculated as
with X refers to either surface PM2.5 concentrations or AOD; N is the total number of the simulations with fire emissions included (N is equal to 4).
Figure 11 shows the average surface PM2.5 concentrations and AOD estimated using four Polyphemus simulations and the maximum statistical dispersion (σ) for surface PM2.5 concentrations and AOD. The maximum statistical dispersion related to simulated surface PM2.5 concentrations and AOD is higher near the fire regions. The mean surface PM2.5 concentrations estimated from the four Polyphemus simulations can reach 42 µg m−3 in the Balkans and Greece, with a statistical dispersion that can be as high as 75 %. Lower mean surface PM2.5 concentrations are calculated for Algeria, in the fresh fire plume and further downwind (28 µg m−3 with a maximum statistical dispersion reaching 45 %). The mean AOD estimated as the average of four Polyphemus simulations can reach 0.42 in the Balkans and Greece, and 0.36 in the fire plume with a statistical dispersion that can reach 45 % and 36 %, respectively.
Although these uncertainties are quite high, they are probably still underestimated since several other sources of uncertainties should be considered. First of all, uncertainty in the initial emissions is important. Uncertainty in the burned area and the associated temporal evolution (used as input to the calculation of emissions) is also high. Giglio et al. (2010) found that uncertainties on MODIS observation can reach about 5 days mainly due to cloud cover.
Although the contribution from organic aerosols is dominant, biomass burning is also a source of inorganics. Over Europe, inorganics (mainly sulfate, sea salt and ammonium) contribute highly to PM2.5 composition, when fire emissions are not considered (e.g., Fountoukis et al., 2011; Chrit et al., 2018). However, during fire events the contribution of inorganics is lower than the contribution of organics (8 % to 9 % from inorganics against 40 % to 80 % from organics). Focusing on this inorganic contribution from fires, sulfate, ammonium and nitrate are the predominant inorganic components. The formation of inorganics due to wildfires is found to be low compared to the formation of organics. However, our simulation takes into account emissions of inorganic precursors such as ammoniac (NH3) with emission factors from Akagi et al. (2011). Several studies (R'honi et al., 2013; Van Damme et al., 2014; Whitburn et al., 2017) show that large emissions of NH3 are released by biomass burning. Whitburn et al. (2017) studied the enhancement ratios NH3∕CO for biomass burning emissions in the tropics using observations from the IASI satellite-based instrument. They found a significant variability due to fire contribution. According to Whitburn et al. (2017), the emission ratios NH3∕CO in the tropics derived from IASI observations (as in Van Damme et al., 2014) are rather on the lower end of those reported in Akagi et al. (2011) that are used here. If fire emissions are important for the regional budget of organics, more observations are required to provide emission factors of NH3 and concentrations of inorganics should be evaluated close to fire regions.
Deposition can be considered a source of uncertainty on PM and AOD over the Euro-Mediterranean region during the summer of 2007. Roustan et al. (2010) pointed out the importance of dry and wet deposition over Europe while studying the sensitivity of Polyphemus to input data over Europe with a focus on aerosols. They found that PM is sensitive to options influencing deposition such as wet diameter and aerosol density. They found that during both summer and winter, the uncertainties on wet diameter and aerosol density can reach 19 % and 9 %, respectively. Several studies also highlight the importance of the gas-phase deposition of I/S/L-VOCs (Bessagnet et al., 2010; Hallquist et al., 2009; Hodzic et al., 2016; Karl et al., 2010; Knote et al., 2015). Hallquist et al. (2009) highlighted the importance of the vapor deposition which is higher than the particle deposition (800 vs. 150 TgC yr−1). Knote et al. (2015) showed that the gas-phase I/S/L-VOCs that are highly water soluble (Henry's law constants H∗ between 105 and 1010 M atm−1) are very susceptible to removal processes in the atmosphere (wet deposition and dry deposition). Ignoring the removal of gas-phase I/S/L-VOCs (dry/wet deposition) in the models can lead to uncertainties on SOA concentrations, AOD and PM2.5 concentrations.
Meteorological conditions also play an important role in pollution dispersion and the capabilities of models to reproduce observed pollution plumes. Garcia-Menendez et al. (2014) found that simulated PM2.5 concentrations at urban sites displayed large sensitivities to wind perturbations within the error range of meteorological inputs. Rea et al. (2016) added that special attention must be paid to the PBL height, which can have a considerable impact on the fire emissions' injection heights. Therefore an assessment of uncertainties related to meteorological data should be investigated.
Air quality impact is evaluated by analyzing the number of threshold exceedances during the summer of 2007. It corresponds to the number of times daily averaged PM2.5 surface concentrations exceed 25 µg m−3 (World Health Organisation recommendation, Krzyzanowski and Cohen, 2008).
The number of exceedances predicted by the model is first compared to exceedances observed by AIRBASE stations. Table F1 in Appendix F presents the modeled and observed PM2.5 exceedances at each AIRBASE station during the whole summer of 2007 and during fire events. Generally, the models (Polyphemus and CHIMERE) underestimate PM2.5 air quality exceedances because the horizontal resolution used here does not allow the representation of local pollution (especially for station GR0035A). Better performance is observed during fire events than the whole period. Near fire regions, at station GR0039A, the number of exceedances is well modeled, in spite of the slight underestimation during both fire events compared to the observed PM2.5 exceedances. However, at the GR0035A station, the underestimation of PM2.5 exceedances is sharp. This can be explained by the strong underestimation of the background PM2.5 levels as shown in Fig. 7. Far from fire regions, the PM2.5 exceedances modeled by Polyphemus are in good agreement with the observed ones, especially during the two fire events. The simulated PM2.5 exceedances by CHIMERE in the fire plume are overestimated at some stations. Figure 12 shows the additional days with PM2.5 exceedances due to fires simulated by Polyphemus (difference between Poly-ref and Poly-Nofires). Most are concentrated around fire sources, mainly in the Balkans (30 days). Figure G1 in Appendix G shows that conclusions for CHIMERE are similar to those for Polyphemus. Fires cause up to 49.5 % of the total simulated exceedances from 15 July to 30 August 2007.
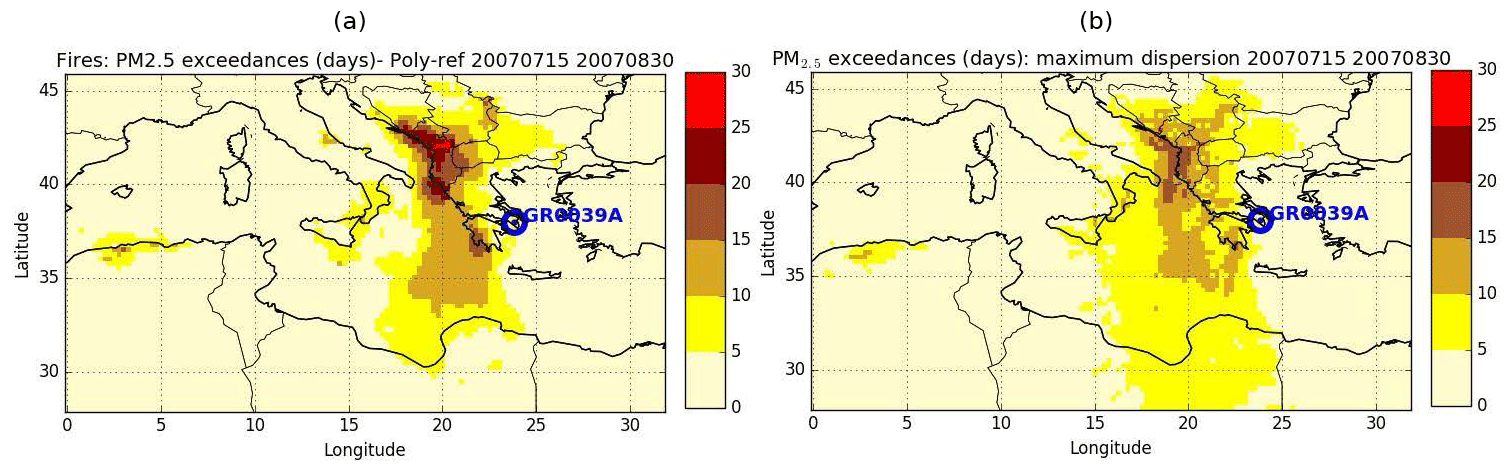
Figure 12The additional days with PM2.5 exceedances due to fires simulated by Polyphemus (difference between Poly-ref and Poly-Nofires) (a) and the maximum statistical dispersion (σ) related to fire emissions for additional days of PM2.5 exceedances due to fires (b) during the summer of 2007 (from 15 July to 30 August 2007).
During the fire periods, surface PM2.5 concentrations simulated in Poly-ref in the MedReg1 and MedReg2 sub-regions are composed mainly of OM (54 % with 61.6 % due to fire for MedReg1 and 52.3 % with 60.1 % due to fires for MedReg2), and inorganics (27 % with 8 % due to fires for MedReg1 and 15 % with 9 % due to fires for MedReg2).
Figure 12 shows that the maximum statistical dispersion on the simulation of PM2.5 exceedances can reach 15 days in regions affected by fires, particularly 5 days in GR0039A, 12 days in the fire plume and 6 days further downwind, based on our ensemble of sensitivity simulations.
A sensitivity analysis was undertaken to estimate the uncertainty of the parameterization of wildfire emissions into air quality models over the Euro-Mediterranean region during the summer of 2007. The ability of Polyphemus/Polair3D and CHIMERE to simulate regional surface PM2.5 concentrations and aerosol optical depth (AOD) was evaluated based on comparisons to available measurements. The comparison of surface PM2.5 concentrations and AOD at 550 nm to available surface measurements (background suburban and rural stations only) shows that both models meet the performance criteria. A clear improvement is noticed when biomass burning emissions are taken into account.
The contribution of biomass burning is large in the Balkans and eastern Europe during the first fire period (20–31 July) and Greece and Algeria during the second period (24–30 August). According to the simulations, PM2.5 close to regions affected by fires is mostly composed of organic aerosol (47 % to 85 %), with a strong contribution from I/S/L-VOCs (46 % to 80 %). However, only two AIRBASE stations (GR0039A and GR0035A in Greece) and three AERONET stations (Lecce University in Italy, Blida in Algeria and Bucharest in Romania) show a fire contribution higher than 10 % according to the model simulations. The lack of surface observations strongly limits this evaluation, but it is partly complemented by comparisons to MODIS satellite-based observations of AOD. Comparisons to satellite observations over subregions show a good simulation of the daily variability of AOD, with high correlation coefficients for Polyphemus (∼90 % on average) and CHIMERE (80 % on average). Comparisons to surface and remote sensing observations show that the models can simulate enhancements of a good order of magnitude and ±1-day uncertainty in the timing.
Two critical parameters, SOA formation from I/S-VOCs and injection heights, are considered as the two main sources of uncertainties in the calculation of wildfire impact on surface PM2.5 concentrations and AOD. Sensitivities to these key parameters are computed using simulations performed with different configurations of Polyphemus. These configurations are chosen to maximize the sensitivities.
Compared to satellite observations, the AOD modeled in simulations including I/S-VOCs is overestimated during the fire events, by about 30 % for Poly-ref and Poly-3 km and 10 % for Poly-NoREM-PM2.5, mainly in the two sub-regions MedReg1 and MedReg2, closest to fire emissions. Since unidentified primary particles (REM-PM2.5) emitted from biomass burning are not considered in Poly-NoREM-PM2.5, the simulated AOD values are closer to MODIS observations. This suggests that REM-PM2.5 could correspond to I/S-VOCs.
Comparisons to AIRBASE measurements show a good simulation of the surface PM2.5 concentrations during the first fire event (at GR0039A in Greece, sub-region MedReg2). The reference simulation (Poly-ref) shows closest comparisons (with a high correlation coefficient, >88 %, and a low bias), while PM2.5 peaks are slightly underestimated by all the other simulations. However, the measured AOD tends to be underestimated by all model simulations at Bucharest (Romania, sub-region MedReg1). During the second fire event, surface PM2.5 concentrations in simulations Poly-3 km and CHIMERE-ref are in good agreement with AIRBASE measurements, but are underestimated in other simulations. The modeled AOD is well simulated compared to AERONET observations at Lecce University and Blida by CHIMERE-ref and all the Polyphemus simulations except for Poly-noI/S-VOCs, which shows low AOD values at these stations. This suggests that taking into account I/S-VOCs improves the simulated AOD values at these stations. In spite of the uncertainty on fire emissions (>100 %) and on observations, this analysis shows that the models succeed to reproduce the PM2.5 concentrations and AOD during such large wildfire event.
Further analysis of uncertainties is conducted at the regional scale based solely on the set of sensitivity simulations conducted with the Polyphemus model. AOD is particularly sensitive to I/S-VOC emissions (up to 40 % sensitivity), while surface PM2.5 concentrations are particularly sensitive to the injection heights (up to 50 % sensitivity). These sensitivities are most of the time higher than inter-model sensitivities, which are mostly linked to the model vertical discretization close to fire emissions. The statistical dispersion of the ensemble of simulations based on different configurations of Polyphemus is used to evaluate the maximum uncertainty on surface PM2.5 concentrations and AOD associated with these two parameters. During the summer of 2007, the maximum statistical dispersion (σ) is as high as 75 % for surface PM2.5 in the Balkans and Greece and varies between 36 % and 45 % for AOD above fire regions. The number of daily exceedances of the WHO recommendation of 25 µg m−3 for the PM2.5 24 h mean reaches 30 days for the fire region and 10–15 days for the fire plume over the simulated period of 46 days. The maximum statistical dispersion on this indicator is large, reaching 15 days close to fires and 5–10 in the fire plume.
Although relatively high, this estimate of uncertainty is very conservative since many other parameters may alter the quality of the simulations of wildfire impact on atmospheric composition. In addition to uncertainty on emissions (initial fire characteristics, vegetation type and fraction burned, emission factors, etc.) and SOA formation, the formation of inorganic aerosols and the uncertainty on meteorological conditions (pyroconvection but also general stability in the region) and on deposition are a few examples of processes that may alter the simulated aerosol budgets. More integrated surface and in situ observations would be necessary for a precise evaluation of emissions, the simulated long-range transport from fire emissions, the aerosol speciation within the plumes and the resulting impact on air quality.
Data can be requested from the corresponding author (marwa.majdi@enpc.fr).
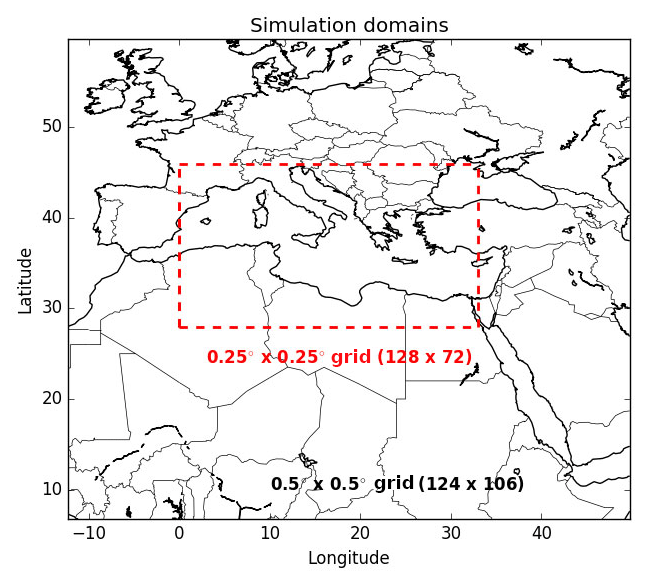
Figure A1Simulation domains including one large domain (with a horizontal resolution) and a smaller domain (at a horizontal resolution) delimited by the dotted red box.

Figure B1Daily mean surface PM2.5 and AOD at 550 nm from the CHIMERE-ref simulation averaged over the summer of 2007 (the eight AIRBASE and six AERONET stations, used in this work, are represented here by blue dots).
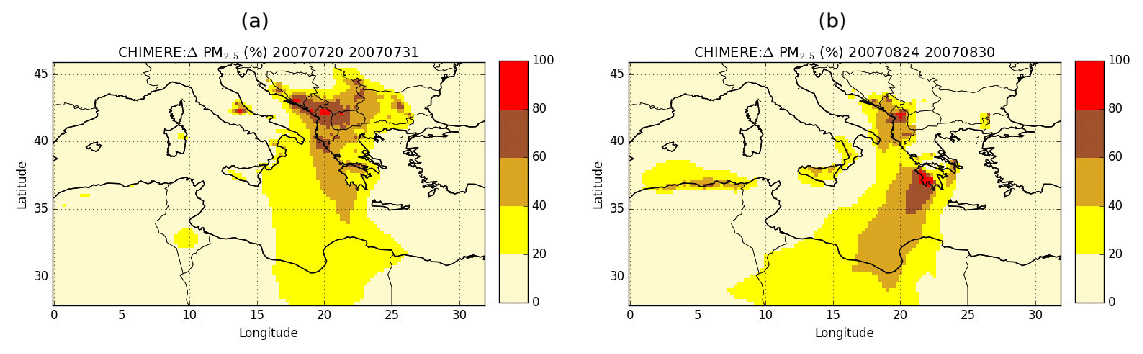
Figure C1(a) Relative difference of surface PM2.5 concentrations between simulations CHIMERE-ref and CHIMERE-Nofires during the first fire event. (b) Relative difference of surface PM2.5 concentrations between simulations CHIMERE-ref and CHIMERE-Nofires during the second fire event.
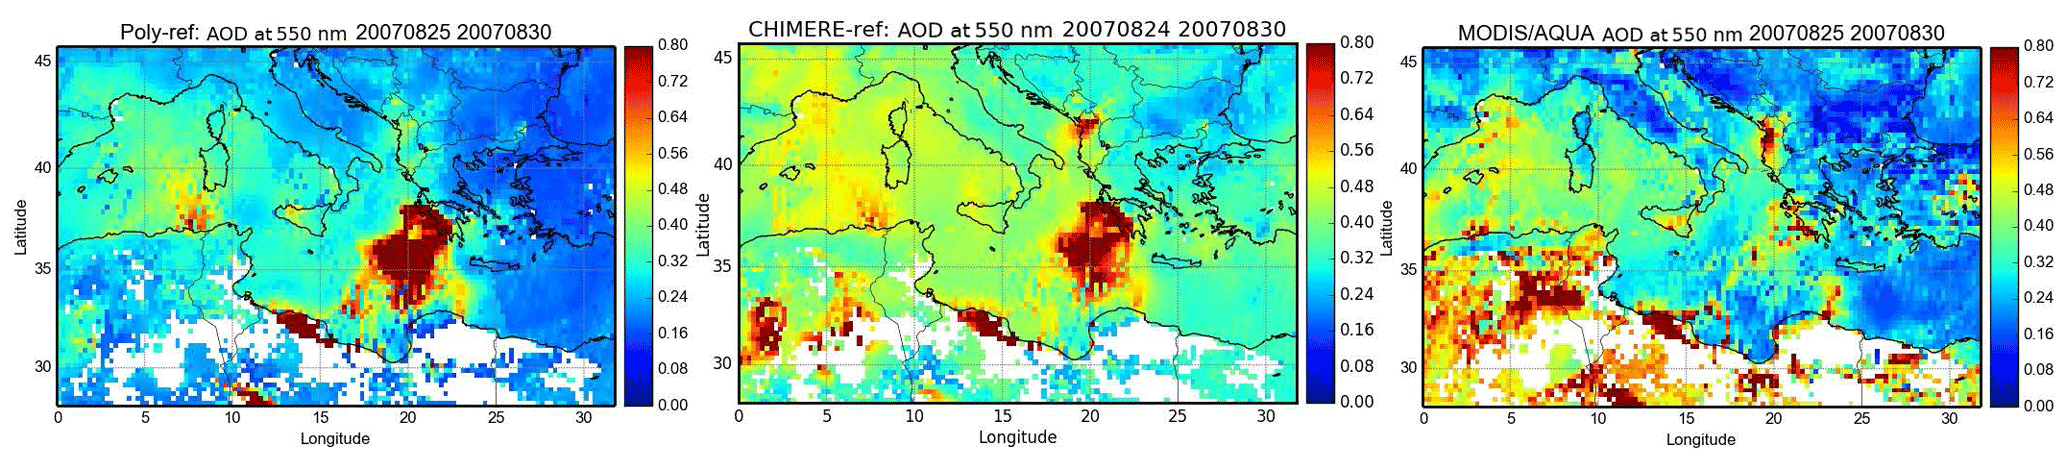
Figure D1Mean total AOD (at 550 nm) from MODIS/AQUA, Poly-ref and CHIMERE-ref during the second fire event (24–30 August 2007).
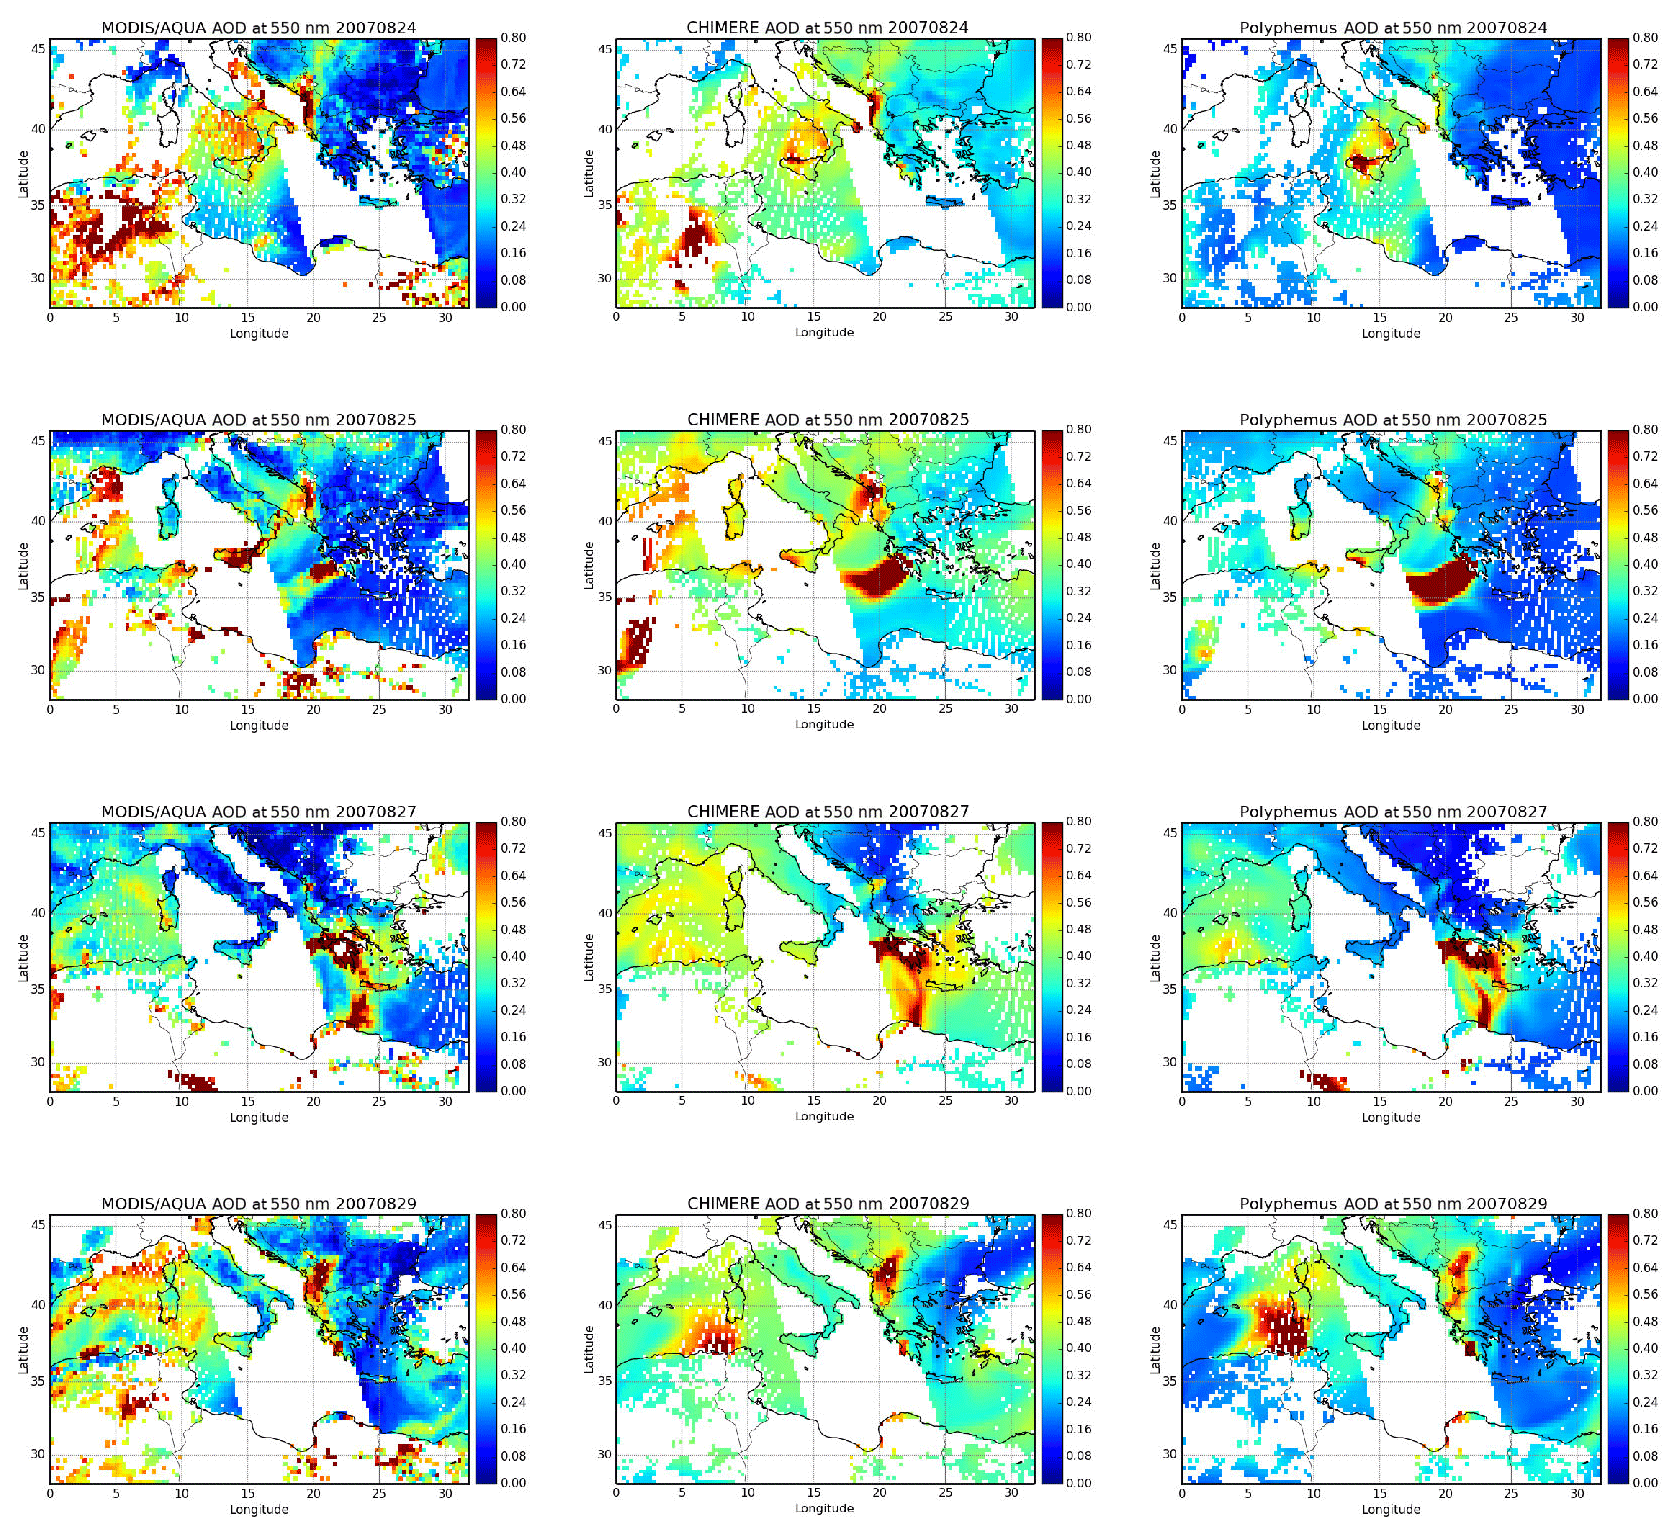
Figure E1Total AOD (at 550 nm) from MODIS/AQUA and the corresponding Polyphemus AOD (Poly-ref) and CHIMERE AOD (CHIMERE-ref) for four selected days (24, 25, 27 and 29 August 2007).
Table F1Modeled and observed PM2.5 exceedances at each AIRBASE station. Values between brackets correspond to modeled PM2.5 exceedances for simulations without fire emissions (Poly-Nofires and CHIMERE-Nofires).
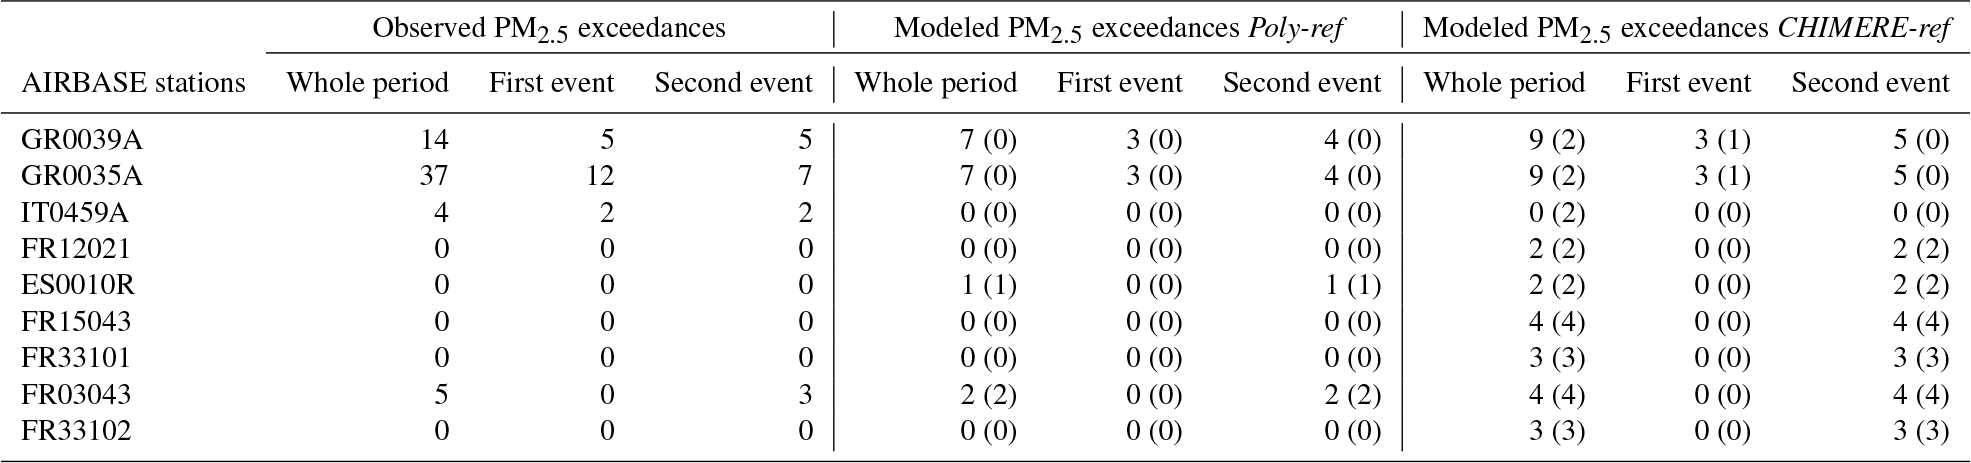
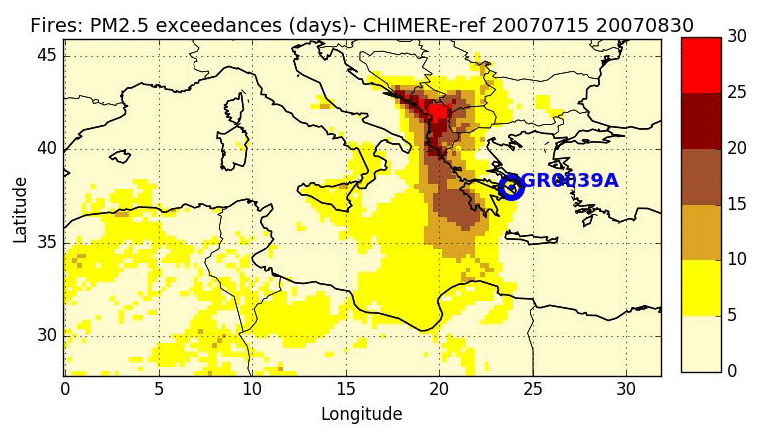
Figure G1The additional days with PM2.5 exceedances due to fires simulated by CHIMERE (difference between CHIMERE-ref and CHIMERE-Nofires) during the summer of 2007 (from 15 July to 30 August 2007).
MM, ST and KS performed the simulations with help from CL and YK for the preprocessing and post-processing. MM and ST prepared emissions from fires. MM, KS and ST prepared the manuscript with contributions from all the co-authors.
The authors declare that they have no conflict of interest.
This article is part of the special issue “CHemistry and AeRosols Mediterranean EXperiments (ChArMEx) (ACP/AMT inter-journal SI)”. It is not associated with a conference.
CEREA and LMD are members of the Institut Pierre-Simon Laplace (IPSL). This
research was partially funded by a PhD grant from École des Ponts
ParisTech, and by the French ministry of ecology, by CNRS-INSU (GMES-MDD
program, NATORGA project). This study also received financial support from
MISTRALS by ADEME, CEA, INSU, and Meteo-France, as part of the ChArMEx
project. We are grateful to the EEA for maintaining and providing the AirBase
database (more particularly for the GR0039A station). We thank the principal
investigators and their staff for establishing and maintaining the AERONET
sites used in this study: Brent Holben for Blida, Maria Rita Perrone for
Lecce University and Doina Nicolae for Bucharest Inoe. We wish to thank the
National Aeronautics and Space Agency (NASA) for the availability of the
MODIS data. Finally, we thank the anonymous reviewers and editors for their
comments which have helped improve the manuscript.
Edited by: Maria Kanakidou
Reviewed by: three
anonymous referees
Akagi, S. K., Yokelson, R. J., Wiedinmyer, C., Alvarado, M. J., Reid, J. S., Karl, T., Crounse, J. D., and Wennberg, P. O.: Emission factors for open and domestic biomass burning for use in atmospheric models, Atmos. Chem. Phys., 11, 4039–4072, https://doi.org/10.5194/acp-11-4039-2011, 2011. a, b, c
Barbosa, P., Camia, A., Kucera, J., Liberta, G., Palumbo, I., San-Miguel-Ayanz, J., and Schmuck, G.: Assessment of forest fire impacts and emissions in the European Union based on the European Forest Fire Information System, in: Developments in Environmental Science, edited by: Bytnerowicz, A., Arbaugh, M., Riebau, A., and Andersen, C., 8, 197–208, https://doi.org/10.1016/S1474-8177(08)00008-9, 2009. a
Barnaba, F., Angelini, F., Curci, G., and Gobbi, G. P.: An important fingerprint of wildfires on the European aerosol load, Atmos. Chem. Phys., 11, 10487–10501, https://doi.org/10.5194/acp-11-10487-2011, 2011. a
Bessagnet, B., Hodzic, A., Vautard, R., Beekmann, M., Cheinet, S., Honore, C., Liousse, C., and Rouil, L.: Aerosol modeling with CHIMERE – Preliminary evaluation at the continental scale, Atmos. Environ., 38, 2803–2817, https://doi.org/10.1016/j.atmosenv.2004.02.034, 2004. a
Bessagnet, B., Seigneur, C., and Menut, L.: Impact of dry deposition of semi-volatile organic compounds on secondary organic aerosols, Atmos. Environ., 44, 1781–1787, https://doi.org/10.1016/j.atmosenv.2010.01.027, 2010. a
Boiyo, R., Kumar, K. R., and Zhao, T.: Statistical intercomparison and validation of multisensory aerosol optical depth retrievals over three AERONET sites in Kenya, Atmos. Res., 197, 277–288, https://doi.org/10.1016/j.atmosres.2017.07.012, 2017. a
Boselli, A., Caggiano, R., Cornacchia, C., Madonna, F., Macchiato, M., Mona, L., Pappalardo, G., and Trippetta, S.: Multiyear sun-photometer measurements for aerosol characterization in a Central Mediterranean site, Atmos. Res., 104, 98–110, https://doi.org/10.1016/j.atmosres.2011.08.002, 2012. a
Bovchaliuk, A.: The spatial variability of PM2.5 over Europe using satellite POLDER-3/PARASOL data, Adv. Astron. Space Phys., 3, 102–108, 2013. a
Boylan, J. and Russel, A.: PM and light extinction model performance metrics, goals, and criteria for three dimensional air quality models, Atmos. Environ., 40, 4946–4959, https://doi.org/10.1016/j.atmosenv.2005.09.087, 2006. a
Briant, R., Tuccella, P., Deroubaix, A., Khvorostyanov, D., Menut, L., Mailler, S., and Turquety, S.: Aerosol-radiation interaction modelling using online coupling between the WRF 3.7.1 meteorological model and the CHIMERE 2016 chemistry-transport model, through the OASIS3-MCT coupler, Geosci. Model Dev., 10, 927–944, https://doi.org/10.5194/gmd-10-927-2017, 2017. a, b
Cappa, C. D. and Jimenez, J. L.: Quantitative estimates of the volatility of ambient organic aerosol, Atmos. Chem. Phys., 10, 5409–5424, https://doi.org/10.5194/acp-10-5409-2010, 2010. a
Carlton, A. G., Bhave, P. V., Napelenok, S. L., Edney, E. O., Sarwar, G., Pinder, R. W., Pouliot, G. A., and Houyoux, M.: Model representation of secondary organic aerosol in CMAQv4.7, Environ. Sci. Technol., 44, 8553–8560, https://doi.org/10.1021/es100636q, 2010. a
Chen, Y., Li, Q., Randerson, J. T., Lyons, E. A., Kahn, R. A., Nelson, D. L., and Diner, D. J.: The sensitivity of CO and aerosol transport to the temporal and vertical distribution of North American boreal fire emissions, Atmos. Chem. Phys., 9, 6559–6580, https://doi.org/10.5194/acp-9-6559-2009, 2009. a, b
Chrit, M., Sartelet, K., Sciare, J., Pey, J., Marchand, N., Couvidat, F., Sellegri, K., and Beekmann, M.: Modelling organic aerosol concentrations and properties during ChArMEx summer campaigns of 2012 and 2013 in the western Mediterranean region, Atmos. Chem. Phys., 17, 12509–12531, https://doi.org/10.5194/acp-17-12509-2017, 2017. a, b
Chrit, M., Sartelet, K., Sciare, J., Pey, J., Nicolas, J. B., Marchand, N., Freney, E., Sellegri, K., Beekmann, M., and Dulac, F.: Aerosol sources in the western Mediterranean during summertime: a model-based approach, Atmos. Chem. Phys., 18, 9631–9659, https://doi.org/10.5194/acp-18-9631-2018, 2018. a
Chu, D. A., Kaufman, Y. J., Remer, L. A., and Holben, B. N.: Remote sensing of smoke from MODIS airborne simulator during the SCAR-B experiment, J. Geophys. Res., 103, 31979–31988, https://doi.org/10.1029/98JD01148, 1998. a
Ciarelli, G., El Haddad, I., Bruns, E., Aksoyoglu, S., Möhler, O., Baltensperger, U., and Prévôt, A. S. H.: Constraining a hybrid volatility basis-set model for aging of wood-burning emissions using smog chamber experiments: a box-model study based on the VBS scheme of the CAMx model (v5.40), Geosci. Model Dev., 10, 2303–2320, https://doi.org/10.5194/gmd-10-2303-2017, 2017. a, b, c, d
Coheur, P.-F., Clarisse, L., Turquety, S., Hurtmans, D., and Clerbaux, C.: IASI measurements of reactive trace species in biomass burning plumes, Atmos. Chem. Phys., 9, 5655–5667, https://doi.org/10.5194/acp-9-5655-2009, 2009. a
Couvidat, F. and Sartelet, K.: The Secondary Organic Aerosol Processor (SOAP v1.0) model: a unified model with different ranges of complexity based on the molecular surrogate approach, Geosci. Model Dev., 8, 1111–1138, https://doi.org/10.5194/gmd-8-1111-2015, 2015. a
Couvidat, F., Debry, E., Sartelet, K., and Seigneur, C.: A hydrophilic/hydrophobic organic (H2O) aerosol model: Development,evaluation and sensitivity analysis, J. Geophys. Res., 117, D10304, https://doi.org/10.1029/2011JD017214, 2012. a, b, c
Dall'Osto, M., Harrison, R. M., Highwood, E. J., O'Dowd, C., Ceburnis, D., Querol, X., and Achterberg, E. P.: Variation of the mixing state of Saharan dust particles with atmospheric transport, Atmos. Environ., 44, 3135–3146, https://doi.org/10.1016/j.atmosenv.2010.05.030, 2010. a
Daskalakis, N., Myriokefalitakis, S., and Kanakidou, M.: Sensitivity of tropospheric loads and lifetimes of short lived pollutants to fire emissions, Atmos. Chem. Phys., 15, 3543–3563, https://doi.org/10.5194/acp-15-3543-2015, 2015. a, b, c
Debry, E., Fahey, K., Sartelet, K., Sportisse, B., and Tombette, M.: Technical Note: A new SIze REsolved Aerosol Model (SIREAM), Atmos. Chem. Phys., 7, 1537–1547, https://doi.org/10.5194/acp-7-1537-2007, 2007. a
Derognat, C., Beekmann, M., Baeumle, M., Martin, D., and Schmidt, H.: Effect of biogenic volatile organic compound emissions on tropospheric chemistry during the Atmospheric Pollution Over the Paris Area (ESQUIF) campaign in the Ile-de-France region, J. Geophys. Res., 108, 8560, https://doi.org/10.1029/2001JD001421, 2003. a
Eck, T. F., Holben, B. N., Reid, J. S., Dubovik, O., Smirnov, A., O'Neill, N. T., Slutsker, I., and Kinne, S.: Wavelength dependence of the optical depth of biomassburning urban, and desert dust aerosols, J. Geophys. Res., 104, 31333–31349, https://doi.org/10.1029/1999JD900923, 1999. a
El Haddad, I., D'Anna, B., Temime-Roussel, B., Nicolas, M., Boreave, A., Favez, O., Voisin, D., Sciare, J., George, C., Jaffrezo, J.-L., Wortham, H., and Marchand, N.: Towards a better understanding of the origins, chemical composition and aging of oxygenated organic aerosols: case study of a Mediterranean industrialized environment, Marseille, Atmos. Chem. Phys., 13, 7875–7894, https://doi.org/10.5194/acp-13-7875-2013, 2013. a
Emmons, L. K., Walters, S., Hess, P. G., Lamarque, J.-F., Pfister, G. G., Fillmore, D., Granier, C., Guenther, A., Kinnison, D., Laepple, T., Orlando, J., Tie, X., Tyndall, G., Wiedinmyer, C., Baughcum, S. L., and Kloster, S.: Description and evaluation of the Model for Ozone and Related chemical Tracers, version 4 (MOZART-4), Geosci. Model Dev., 3, 43–67, https://doi.org/10.5194/gmd-3-43-2010, 2010. a
Fountoukis, C., Racherla, P. N., Denier van der Gon, H. A. C., Polymeneas, P., Charalampidis, P. E., Pilinis, C., Wiedensohler, A., Dall'Osto, M., O'Dowd, C., and Pandis, S. N.: Evaluation of a three-dimensional chemical transport model (PMCAMx) in the European domain during the EUCAARI May 2008 campaign, Atmos. Chem. Phys., 11, 10331–10347, https://doi.org/10.5194/acp-11-10331-2011, 2011. a, b
Fountoukis, C., Megaritis, A. G., Skyllakou, K., Charalampidis, P. E., Pilinis, C., Denier van der Gon, H. A. C., Crippa, M., Canonaco, F., Mohr, C., Prévôt, A. S. H., Allan, J. D., Poulain, L., Petäjä, T., Tiitta, P., Carbone, S., Kiendler-Scharr, A., Nemitz, E., O'Dowd, C., Swietlicki, E., and Pandis, S. N.: Organic aerosol concentration and composition over Europe: insights from comparison of regional model predictions with aerosol mass spectrometer factor analysis, Atmos. Chem. Phys., 14, 9061–9076, https://doi.org/10.5194/acp-14-9061-2014, 2014. a
Freitas, S. R., Longo, K. M., Chatfield, R., Latham, D., Silva Dias, M. A. F., Andreae, M. O., Prins, E., Santos, J. C., Gielow, R., and Carvalho Jr., J. A.: Including the sub-grid scale plume rise of vegetation fires in low resolution atmospheric transport models, Atmos. Chem. Phys., 7, 3385–3398, https://doi.org/10.5194/acp-7-3385-2007, 2007. a
Garcia-Menendez, F., Hu, Y., and Odman, M.: Simulating smoke transport from wildland fires with a regional-scale air quality model: Sensitivity to spatiotemporal allocation of fixre emissions, Sci. Total Environ., 493, 544–553, https://doi.org/10.1016/j.scitotenv.2014.05.108, 2014. a
Gerasopoulos, E., Amiridis, V., Kazadzis, S., Kokkalis, P., Eleftheratos, K., Andreae, M. O., Andreae, T. W., El-Askary, H., and Zerefos, C. S.: Three-year ground based measurements of aerosol optical depth over the Eastern Mediterranean: the urban environment of Athens, Atmos. Chem. Phys., 11, 2145–2159, https://doi.org/10.5194/acp-11-2145-2011, 2011. a
Giglio, L., Loboda, T., Roy, D. P., Quayle, B., and Justice, C. O.: An active-fire based burned area mapping algorithm for the MODIS sensor An active-fire based burned area mapping algorithm for the MODIS sensor, Remote Sens. Environ., 113, 408–420, https://doi.org/10.1016/j.rse.2008.10.006, 2009. a
Giglio, L., Randerson, J. T., van der Werf, G. R., Kasibhatla, P. S., Collatz, G. J., Morton, D. C., and DeFries, R. S.: Assessing variability and long-term trends in burned area by merging multiple satellite fire products, Biogeosciences, 7, 1171–1186, https://doi.org/10.5194/bg-7-1171-2010, 2010. a
Gobbi, G., Barnaba, F., and Ammannat, L.: Estimating the impact of Saharan dust on the year 2001 PM10 record of Rome, Italy, Atmos. Environ., 41, 261–275, https://doi.org/10.1016/j.atmosenv.2006.08.036, 2007. a
Gonzi, S., Palmer, P. I., Paugam, R., Wooster, M., and Deeter, M. N.: Quantifying pyroconvective injection heights using observations of fire energy: sensitivity of spaceborne observations of carbon monoxide, Atmos. Chem. Phys., 15, 4339–4355, https://doi.org/10.5194/acp-15-4339-2015, 2015. a, b
Grieshop, A. P., Logue, J. M., Donahue, N. M., and Robinson, A. L.: Laboratory investigation of photochemical oxidation of organic aerosol from wood fires 1: measurement and simulation of organic aerosol evolution, Atmos. Chem. Phys., 9, 1263–1277, https://doi.org/10.5194/acp-9-1263-2009, 2009. a
Guenther, A., Karl, T., Harley, P., Wiedinmyer, C., Palmer, P. I., and Geron, C.: Estimates of global terrestrial isoprene emissions using MEGAN (Model of Emissions of Gases and Aerosols from Nature), Atmos. Chem. Phys., 6, 3181–3210, https://doi.org/10.5194/acp-6-3181-2006, 2006. a, b
Hallquist, M., Wenger, J. C., Baltensperger, U., Rudich, Y., Simpson, D., Claeys, M., Dommen, J., Donahue, N. M., George, C., Goldstein, A. H., Hamilton, J. F., Herrmann, H., Hoffmann, T., Iinuma, Y., Jang, M., Jenkin, M. E., Jimenez, J. L., Kiendler-Scharr, A., Maenhaut, W., McFiggans, G., Mentel, Th. F., Monod, A., Prévôt, A. S. H., Seinfeld, J. H., Surratt, J. D., Szmigielski, R., and Wildt, J.: The formation, properties and impact of secondary organic aerosol: current and emerging issues, Atmos. Chem. Phys., 9, 5155–5236, https://doi.org/10.5194/acp-9-5155-2009, 2009. a, b
Hernandez, C., Drobinski, P., and Turquety, S.: How much does weather control fire size and intensity in the Mediterranean region?, Ann. Geophys., 33, 931–939, https://doi.org/10.5194/angeo-33-931-2015, 2015. a
Hodnebrog, Ø., Solberg, S., Stordal, F., Svendby, T. M., Simpson, D., Gauss, M., Hilboll, A., Pfister, G. G., Turquety, S., Richter, A., Burrows, J. P., and Denier van der Gon, H. A. C.: Impact of forest fires, biogenic emissions and high temperatures on the elevated Eastern Mediterranean ozone levels during the hot summer of 2007, Atmos. Chem. Phys., 12, 8727–8750, https://doi.org/10.5194/acp-12-8727-2012, 2012. a, b
Hodzic, A., Kasibhatla, P. S., Jo, D. S., Cappa, C. D., Jimenez, J. L., Madronich, S., and Park, R. J.: Rethinking the global secondary organic aerosol (SOA) budget: stronger production, faster removal, shorter lifetime, Atmos. Chem. Phys., 16, 7917–7941, https://doi.org/10.5194/acp-16-7917-2016, 2016. a
Holben, B., Eck, T., Slutsker, I., Tanré, D., Buis, J., Setzer, A., Vermote, E., Reagan, J., Kaufman, Y., Nakajima, T., Lavenu, F., Jankowiak, I., and Smirnov, A.: AERONET: A federated instrument network and data archive for aerosol characterization, Remote Sens. Environ., 66, 1–16, https://doi.org/10.1016/S0034-4257(98)00031-5, 1998. a
Holben, B., Tanre, D., Smirnov, A., Eck, T. F., Slutsker, I., Abuhassan, N., Newcomb, W. W., Schafer, J., Chatenet, B., Lavenu, F., Kaufman, Y. J., Vande Castle, J., Setzer, A., Markham, B., Clark, D., Frouin, R., Halthore, R., Karnieli, A., O'Neill, N. T., Pietras, C., Pinker, R. T., Voss, K., and Zibordi, G.: An emerging ground-based aerosol climatology: Aerosol Optical Depth from AERONET, J. Geophys. Res., 106, 12067–12097, https://doi.org/10.1029/2001JD900014, 2001. a
Huffman, J., Docherty, K., Mohr, C., Cubison, M., Ulbrich, I., Ziedmann, P., Onach, T. B., and Jimenez, J. L.: Chemically resolved volatility measurements of organic aerosol from different sources, Environ. Sci. Technol., 14, 5351–5357, https://doi.org/10.1021/Es803539d, 2009. a
JRC: Forest fires in Europe 2007. Report No 8, Tech. rep., EC Joint Research Centre, Institute for Environment and Sustainability, Ispra, Italy, 2008. a, b
Kaiser, J. W., Heil, A., Andreae, M. O., Benedetti, A., Chubarova, N., Jones, L., Morcrette, J.-J., Razinger, M., Schultz, M. G., Suttie, M., and van der Werf, G. R.: Biomass burning emissions estimated with a global fire assimilation system based on observed fire radiative power, Biogeosciences, 9, 527–554, https://doi.org/10.5194/bg-9-527-2012, 2012. a
Kanakidou, M. and Tsigaridis, K.: Human-activity-enhanced formation of organic aerosols by biogenic hydrocarbon oxidation, J. Geophys. Res., 5, 9243–9254, https://doi.org/10.1029/1999JD901148, 2000. a
Karl, T., Harley, P., Emmons, L., Thornton, B., Guenther, A., Basu, C., and Turnipseed, A., and Jardine, K.: Efficient atmospheric cleansing of oxidized organic trace gases by vegetation, Science, 330, 816–819, https://doi.org/10.1126/science.1192534, 2010. a
Kaskaoutis, D., Kambezidis, H., Nastos, P., and Kosmopoulos, P.: Study on an intense dust storm over Greece, Atmos. Environ., 42, 6884–6896, https://doi.org/10.1016/j.atmosenv.2008.05.017, 2008. a
Kaskaoutis, D., Kharol, S. K., Sifakis, N., Nastos, P., Sharma, A. R., Badarinath, K., and Kambezidis, H.: Satellite monitoring of the biomass-burning aerosols during the wildfires of August 2007 in Greece: Climate implications, Atmos. Environ., 45, 716–726, https://doi.org/10.1016/j.atmosenv.2010.09.043, 2011. a
Kim, Y., Couvidat, F., Sartelet, K., and Seigneur, C.: Comparison of different gas-phase mechanisms and aerosol modules for simulating particulate matter formation, J. Air Waste Manage., 61, 1218–1226, 2011. a, b
Kim, Y., Sartelet, K., Seigneur, C., Charron, A., Besombes, J. L., and Jaffrezo, J. L.: Effect of measurement protocol on organic aerosol measurements of exhaust emissions from gasoline and diesel vehicles., Atmos. Environ., 140, 176–187, https://doi.org/10.1016/j.atmosenv.2016.05.045, 2016. a, b
King, M., Kaufman, Y., Tanré, D., and Nakajim, T.: Remote Sensing of Tropospheric Aerosols from Space: Past, Present, and Future, B. Am. Meteorol. Soc., 80, 2229–2259, 1999. a, b
Knote, C., Hodzic, A., and Jimenez, J. L.: The effect of dry and wet deposition of condensable vapors on secondary organic aerosols concentrations over the continental US, Atmos. Chem. Phys., 15, 1–18, https://doi.org/10.5194/acp-15-1-2015, 2015. a, b
Konovalov, I. B., Beekmann, M., Berezin, E. V., Petetin, H., Mielonen, T., Kuznetsova, I. N., and Andreae, M. O.: The role of semi-volatile organic compounds in the mesoscale evolution of biomass burning aerosol: a modeling case study of the 2010 mega-fire event in Russia, Atmos. Chem. Phys., 15, 13269–13297, https://doi.org/10.5194/acp-15-13269-2015, 2015. a, b, c, d
Koo, B., Knipping, E., and Yarwood, G.: 1.5-Dimensional volatility basis set approach for modeling organic aerosol in CAMx and CMAQ, Atmos. Environ., 95, 158–164, https://doi.org/10.1016/j.atmosenv.2014.06.031, 2014. a, b, c
Korontzi, S., McCarty, J., Loboda, T., Kumar, S., and Justice, C.: Global distribution of agricultural fires in croplands from 3 years of Moderate Resolution Imaging Spectroradiometer (MODIS) data, Global Biogeochem. Cy., 20, GB2021, https://doi.org/10.1029/2005GB002529, 2006. a
Krzyzanowski, M. and Cohen, A.: Update of WHO air quality guidelines, Air. Qual. Atmos. Health., 1, 7–13, https://doi.org/10.1007/s11869-008-0008-9, 2008. a
Lelieveld, J., Berresheim, H., Borrmann, S., Crutzen, P. J., Dentener, F. J., Fischer, H., Feichter, J., Flatau, P. J., Heland, J., Holzinger, R., Korrmann, R., Lawrence, M. G., Levin, Z., Markowicz, K. M., Mihalopoulos, N., Minikin, A., Ramanathan, V., de Reus, M., Roelofs, G. J., Scheeren, H. A., Sciare, J., Schlager, H., Schultz, M., Siegmund, P., Steil, B., Stephanou, E. G., Stier, P., Traub, M., Warneke, C., Williams, J., and Ziereis, H.: Global Air Pollution Crossroads over the Mediterranean, Science, 298, 794–799, https://doi.org/10.1126/science.1075457, 2002. a
Li, B., Yuan, H., Feng, N., and Tao, S.: Comparing MODIS and AERONET aerosol optical depth over China, Int. J. Remote Sens., 30, 6519–6529, https://doi.org/10.1080/01431160903111069, 2009. a
Lionello, P., Malanotte-Rizzoli, P., and Boscolo, R. (Eds.): Mediterranean Climate Variability, chap. I: The Mediterranean Climate: An overview of the main characteristics and issues, 1–26, Elsevier, 2006. a
Lipsky, E. and Robinson, A.: Effects of dilution on fine particle mass and partitioning of semivolatile organics in diesel exhaust and wood smoke, Environ. Sci. Technol., 40, 155–162, https://doi.org/10.1021/Es050319P, 2006. a
Liu, Z., Vaughan, M., Winker, D., Kittaka, C., Getzewich, B., Kuehn, R., Omar, A., Powell, K., Trepte, C., and Hostetler, C.: The CALIPSO lidar cloud and aerosol discrimination: Version 2 algorithm and initial assessment of performance, J. Atmos. Ocean. Tech., 26, 1198–1213, https://doi.org/10.1175/2009JTECHA1229.1, 2009. a
Maignan, F., Bréon, F., Fédèle, E., and Bouvier, M.: Polarized reflectances of natural surfaces: Spaceborne measurements and analytical modeling, Remote Sens. Environ., 113, 2642–2650, https://doi.org/10.1016/j.rse.2009.07.022, 2009. a
Mailler, S., Menut, L., Khvorostyanov, D., Valari, M., Couvidat, F., Siour, G., Turquety, S., Briant, R., Tuccella, P., Bessagnet, B., Colette, A., Létinois, L., Markakis, K., and Meleux, F.: CHIMERE-2017: from urban to hemispheric chemistry-transport modeling, Geosci. Model Dev., 10, 2397-2423, https://doi.org/10.5194/gmd-10-2397-2017, 2017. a
Mailler, S., Menut, L., Khvorostyanov, D., Valari, M., Couvidat, F., Siour, G., Turquety, S., Briant, R., Tuccella, P., Bessagnet, B., Colette, A., Létinois, L., Markakis, K., and Meleux, F.: CHIMERE-2017: from urban to hemispheric chemistry-transport modeling, Geosci. Model Dev., 10, 2397–2423, https://doi.org/10.5194/gmd-10-2397-2017, 2017. a
Mallet, V., Quélo, D., Sportisse, B., Ahmed de Biasi, M., Debry, É., Korsakissok, I., Wu, L., Roustan, Y., Sartelet, K., Tombette, M., and Foudhil, H.: Technical Note: The air quality modeling system Polyphemus, Atmos. Chem. Phys., 7, 5479–5487, https://doi.org/10.5194/acp-7-5479-2007, 2007. a
May, A. A., Levin, E. J. T., Hennigan, C. J., Riipinen, I., Lee, T., Collett Jr., J. L., Jimenez, J. L., Kreidenweis, S. M., and Robinson, A. L.: Gas-particle partitioning of primary organic aerosol emissions: 3. Biomass burning, J. Geophys. Res.-Atmos., 118, 327–338, https://doi.org/10.1002/jgrd.50828, 2013a. a, b, c
Menut, L., Perez Garcia-Pando, C., Haustein, K., Bessagnet, B., Prigent, C., and Alfaro, S.: Impact of surface roughness and soil texture on mineral dust emission fluxes modeling , J. Geophys. Res., 118, 6505–6520, https://doi.org/10.1002/jgrd.50313, 2013. a, b, c, d, e
Middleton, P., Stockwell, W. R., and Carter, W. P. L.: Aggregation and analysis of volatile organic compound emissions for regional modeling, Atmos. Environ., 24, 1107–1133, 1990. a
Mims, S., Kahn, R., Moroney, C., Gaitley, B., Nelson, D., and Garay, M.: MISR stereo heights of grassland fire smoke plumes in AustraliA, IEEE T. Geosci. Remote, 48, 25–35, https://doi.org/10.1109/TGRS.2009.2027114, 2010. a
Monahan, E. C.: In The Role of Air-Sea Exchange in Geochemical Cycling, chap. The ocean as a source of atmospheric particles, 129–163, Kluwer Academic Publishers, Dordrecht, Holland, 1986. a, b
Murphy, B. N., Donahue, N. M., Robinson, A. L., and Pandis, S. N.: A naming convention for atmospheric organic aerosol, Atmos. Chem. Phys., 14, 5825–5839, https://doi.org/10.5194/acp-14-5825-2014, 2014. a
Nabat, P., Somot, S., Mallet, M., Chiapello, I., Morcrette, J. J., Solmon, F., Szopa, S., Dulac, F., Collins, W., Ghan, S., Horowitz, L. W., Lamarque, J. F., Lee, Y. H., Naik, V., Nagashima, T., Shindell, D., and Skeie, R.: A 4-D climatology (1979–2009) of the monthly tropospheric aerosol optical depth distribution over the Mediterranean region from a comparative evaluation and blending of remote sensing and model products, Atmos. Meas. Tech., 6, 1287–1314, https://doi.org/10.5194/amt-6-1287-2013, 2013. a, b
Nenes, A., Pandis, S., and Pilinis, C.: Continued development and testing of a new thermodynamic aerosol module for urbban and regional air quality models, Atmos. Environ., 33, 1553–1560, https://doi.org/10.1016/S1352-2310(98)00352-5, 1999. a
Passant, N.: Speciation of UK emissions of non-methane volatile organic compounds, aEA Technology, AEAT/ENV/0545, available at: https://uk-air.defra.gov.uk/reports/empire/AEAT_ENV_0545_final_v2.pdf (last access: 20 January 2019), 2002. a
Pereira, M., Trigo, R. M., da Camara, C. C., Pereira, J., and Leite, S. M.: Synoptic patterns associated with large summer forest fires in Portugal, Agr. Forest Meteorol., 129, 11–25, https://doi.org/10.1016/j.agrformet.2004.12.007, 2005. a
Poukpou, A., Markakis, K., Liora, N., Giannaros, T., Zanis, P., Im, U., Daskalakis, N., Myriokefalitakis, S., Kaiser, J., Melas, D., Kanakidou, M., Karacostas, T., and Zerefos, C.: A modeling study of the impact of the 2007 Greek forest fires on the gaseous polluant levels in the Eastern Mediterranean, Atmos. Res., 149, 1–17, https://doi.org/10.1016/j.atmosres.2014.05.015, 2014. a
Putaud, J.-P., Dingenen, R. V., Alastuey, A., Bauer, H., Birmili, W., Cyrys, J., Flentje, H., Fuzzi, S., Gehrig, R., Hansson, H., Harrison, R., Herrmann, H., Hitzenberger, R., Hüglin, C., Jones, A., Kasper-Giebl, A., Kiss, G., Kousam, A., Kuhlbusch, T., Löschau, G., Maenhaut, W., Molnar, A., Moreno, T., Pekkanen, J., Perrino, C., Pitz, M., Puxbaumc, H., Querol, X., Rodriguez, S., Salma, I., Schwarz, J., Smolik, J., Schneider, J., Spindler, G., ten Brink, H., Tursic, J., Viana, M., Wiedensohler, A., and Raes, F.: A European aerosol phenomenology – 3: Physical and chemical characteristics of particulate matter from 60 rural, urban, and kerbside sites across Europe, Atmos. Environ., 44, 1308–1320, https://doi.org/10.1016/j.atmosenv.2009.12.011, 2010. a
Querol, X., Pey, J., Pandolfi, M., Alastuey, A., Cusack, M., Pereza, N., Moreno, T., Viana, M., Mihalopoulos, N., Kallo, G., and Kleanthous, S.: African dust contributions to mean ambient PM10 mass-levels across the Mediterranean Basin, Atmos. Environ., 43, 4266–4277, https://doi.org/10.1016/j.atmosenv.2009.06.013, 2009. a
Rea, G., Turquety, S., Menut, L., Briant, R., Mailler, S., and Siour, G.: Source contributions to 2012 summertime aerosols in the Euro-Mediterranean region, Atmos. Chem. Phys., 15, 8013–8036, https://doi.org/10.5194/acp-15-8013-2015, 2015. a, b, c, d
Rea, G., Paton-Walsh, C., Turquety, S., Cope, M., and Griffith, D.: Impact of the New South Wales fires during October 2013 on regional air quality in eastern Australia, Atmos. Environ., 131, 150–163, https://doi.org/10.1016/j.atmosenv.2016.01.034, 2016. a, b
Real, E. and Sartelet, K.: Modeling of photolysis rates over Europe: impact on chemical gaseous species and aerosols, Atmos. Chem. Phys., 11, 1711–1727, https://doi.org/10.5194/acp-11-1711-2011, 2011. a
Remer, L. A., Kaufman, Y. J., Tanré, D., Mattoo, S., Chu, D. A., Martins, J. V., Li, R.-R., Ichoku, C., Levy, R. C., Kleidman, R. G., Eck, T. F., Vermote, E., and Holben, B. N.: The MODIS Aerosol Algorithm, Products and Validation, Special Section, J. Atmos. Sci., 62, 947–973, https://doi.org/10.1175/JAS3385.1, 2005. a, b
Rémy, S., Veira, A., Paugam, R., Sofiev, M., Kaiser, J. W., Marenco, F., Burton, S. P., Benedetti, A., Engelen, R. J., Ferrare, R., and Hair, J. W.: Two global data sets of daily fire emission injection heights since 2003, Atmos. Chem. Phys., 17, 2921–2942, https://doi.org/10.5194/acp-17-2921-2017, 2017. a
R'Honi, Y., Clarisse, L., Clerbaux, C., Hurtmans, D., Duflot, V., Turquety, S., Ngadi, Y., and Coheur, P.-F.: Exceptional emissions of NH3 and HCOOH in the 2010 Russian wildfires, Atmos. Chem. Phys., 13, 4171–4181, https://doi.org/10.5194/acp-13-4171-2013, 2013. a
Rio, C., Hourdin, F., and Chédin, A.: Numerical simulation of tropospheric injection of biomass burning products by pyro-thermal plumes, Atmos. Chem. Phys., 10, 3463–3478, https://doi.org/10.5194/acp-10-3463-2010, 2010. a
Robinson, A. L., Donahue, N., Shrivastava, M., Weitkamp, E., Sage, A., Grieshop, A., Lane, T., Pierce, J., and Pandis, S.: Rethinking organic aerosols; Semivolatile emissions and photochemical ageing, Science, 315, 1259–1262, https://doi.org/10.1126/science.1133061, 2007. a, b, c
Roustan, Y., Sartelet, K., Tombette, M., Debry, E., and Sportisse, B.: Simulation of aerosols and gas-phase species over Europe with the Polyphemus system. Part II: Model sensitivity analysis for 2001, Atmos. Environ., 44, 4219–4229, https://doi.org/10.1016/j.atmosenv.2010.07.005, 2010. a
San-Miguel Ayanz, J., Moreno, J. M., and Camia, A.: Analysis of large fires in European Mediterranean landscapes, Forest Ecol. Manag., 294, 11–22, https://doi.org/10.1016/j.foreco.2012.10.050, 2013. a, b
Sartelet, K., Debry, É., Fahey, K., Roustan, Y., Tombette, M., and Sportisse, B.: Impact of biogenic emissions on air quality over Europe and North America, Atmos. Environ., 41, 6116–6131, https://doi.org/10.1016/j.atmosenv.2007.04.024, 2007. a, b
Sartelet, K., Couvidat, F., Seigneur, C., and Roustan, Y.: Impact of biogenic emissions on air quality over Europe and North America, Atmos. Environ., 53, 131–141, https://doi.org/10.1016/j.atmosenv.2011.10.046, 2012. a, b
Sayer, A., Hsu, N., Bettenhausen, C., and Jeong, M.: Validation and uncertainty estimates for MODIS Collection: “Deep Blue” aerosol data, J. Geophys. Res.-Atmos., 118, 7864–7873, https://doi.org/10.1002/jgrd.50600, 2013. a
Sofiev, M., Ermakova, T., and Vankevich, R.: Evaluation of the smoke-injection height from wild-land fires using remote-sensing data, Atmos. Chem. Phys., 12, 1995–2006, https://doi.org/10.5194/acp-12-1995-2012, 2012. a, b
Stein, A. F.: Verification of the NOAA Smoke Forecasting System: Model Sensitivity to the Injection Height, Weather Forecast., 24, 379–394, https://doi.org/10.1175/2008WAF2222166.1, 2009. a, b
Stohl, A., Berg, T., Burkhart, J. F., Fjæraa, A. M., Forster, C., Herber, A., Hov, Ø., Lunder, C., McMillan, W. W., Oltmans, S., Shiobara, M., Simpson, D., Solberg, S., Stebel, K., Ström, J., Tørseth, K., Treffeisen, R., Virkkunen, K., and Yttri, K. E.: Arctic smoke – record high air pollution levels in the European Arctic due to agricultural fires in Eastern Europe in spring 2006, Atmos. Chem. Phys., 7, 511–534, https://doi.org/10.5194/acp-7-511-2007, 2007. a
Tsimpidi, A. P., Karydis, V. A., Zavala, M., Lei, W., Molina, L., Ulbrich, I. M., Jimenez, J. L., and Pandis, S. N.: Evaluation of the volatility basis-set approach for the simulation of organic aerosol formation in the Mexico City metropolitan area, Atmos. Chem. Phys., 10, 525–546, https://doi.org/10.5194/acp-10-525-2010, 2010. a
Turquety, S., Logan, J., Jacob, D., Hudman, R., Leung, F., Heald, C., Yantosca, R. M., Wu, S., Emmons, L. K., Edwards, D., and Sachse, G.: Inventory of boreal fire emissions for North America in 2004: the importance of peat burning and pyro-convective injection, J. Geophys. Res., 112, D12S03, https://doi.org/10.1029/2006JD007281, 2007. a, b
Turquety, S., Hurtmans, D., Hadji-Lazaro, J., Coheur, P.-F., Clerbaux, C., Josset, D., and Tsamalis, C.: Tracking the emission and transport of pollution from wildfires using the IASI CO retrievals: analysis of the summer 2007 Greek fires, Atmos. Chem. Phys., 9, 4897–4913, https://doi.org/10.5194/acp-9-4897-2009, 2009. a
Turquety, S., Menut, L., Bessagnet, B., Anav, A., Viovy, N., Maignan, F., and Wooster, M.: APIFLAME v1.0: high-resolution fire emission model and application to the Euro-Mediterranean region, Geosci. Model Dev., 7, 587–612, https://doi.org/10.5194/gmd-7-587-2014, 2014. a, b, c, d, e, f, g
Urbanski, S. P., Hao, W. M., and Nordgren, B.: The wildland fire emission inventory: western United States emission estimates and an evaluation of uncertainty, Atmos. Chem. Phys., 11, 12973–13000, https://doi.org/10.5194/acp-11-12973-2011, 2011. a
Val Martin, M., Kahn, R. A., Logan, J. A., Paugam, R., Wooster, M., and Ichoku, C.: Space-based observational constraints for 1-D fire smoke plume-rise models, J. Geophys. Res.-Atmos., 117, D22204, https://doi.org/10.1029/2012JD018370, 2012. a
Van Damme, M., Clarisse, L., Heald, C. L., Hurtmans, D., Ngadi, Y., Clerbaux, C., Dolman, A. J., Erisman, J. W., and Coheur, P. F.: Global distributions, time series and error characterization of atmospheric ammonia (NH3) from IASI satellite observations, Atmos. Chem. Phys., 14, 2905–2922, https://doi.org/10.5194/acp-14-2905-2014, 2014. a, b
van der Werf, G. R., Randerson, J. T., Giglio, L., Collatz, G. J., Mu, M., Kasibhatla, P. S., Morton, D. C., DeFries, R. S., Jin, Y., and van Leeuwen, T. T.: Global fire emissions and the contribution of deforestation, savanna, forest, agricultural, and peat fires (1997–2009), Atmos. Chem. Phys., 10, 11707–11735, https://doi.org/10.5194/acp-10-11707-2010, 2010. a
Whitburn, S., Van Damme, M., Clarisse, L., Hurtmans, D., Clerbaux, C., and Coheur, P.-F.: IASI-derived NH3 enhancement ratios relative to CO for the tropical biomass burning regions, Atmos. Chem. Phys., 17, 12239–12252, https://doi.org/10.5194/acp-17-12239-2017, 2017. a, b, c
Wild, O., Zhu, X., and Prather, M.: Accurate simulation of in- and below-cloud photolysis in tropospheric chemical models, J. Atmos. Chem., 37, 245–282, https://doi.org/10.1023/A:1006415919030, 2000. a
Woody, M. C., Baker, K. R., Hayes, P. L., Jimenez, J. L., Koo, B., and Pye, H. O. T.: Understanding sources of organic aerosol during CalNex-2010 using the CMAQ-VBS, Atmos. Chem. Phys., 16, 4081–4100, https://doi.org/10.5194/acp-16-4081-2016, 2016. a
Wu, Y., de Graaf, M., and Menenti, M.: The impact of aerosol vertical distribution on aerosol optical depth retrieval using CALIPSO and MODIS data: Case study over dust and smoke regions, J. Geophys. Res.-Atmos., 122, 8801–8815, https://doi.org/10.1002/2016JD026355, 2017. a
Yarwood, G., Rao, S., Yocke, M., and Whitten, G.: Updates to the carbon bond chemical mechanism: CB05 Final report to the US EPA, available at: http://www.camx.com/files/cb05_final_report_120805.aspx (last access: 27 March 2017), 2005. a, b, c
Zhu, S., Sartelet, K., Healy, R., and Wenger, J.: Simulation of particle diversity and mixing state over Greater Paris: A model- measurement inter-comparison, Faraday Discuss., 189, 547–566, https://doi.org/10.1039/C5fd00175g, 2016. a, b
- Abstract
- Introduction
- Simulation experiments
- Model evaluation
- Uncertainty and sensitivity analysis
- Air quality exceedances
- Conclusions
- Data availability
- Appendix A
- Appendix B
- Appendix C
- Appendix D
- Appendix E
- Appendix F
- Appendix G
- Author contributions
- Competing interests
- Special issue statement
- Acknowledgements
- References