the Creative Commons Attribution 4.0 License.
the Creative Commons Attribution 4.0 License.
 | 12 Jun 2019
Quantifying the aerosol effect on droplet size distribution at cloud top
Lianet Hernández Pardo
Luiz Augusto Toledo Machado
Micael Amore Cecchini
Madeleine Sánchez Gácita
This work uses the number concentration-effective diameter phase-space to test cloud sensitivity to variations in the aerosol population characteristics, such as the aerosol size distribution, number concentration and hygroscopicity. It is based on the information from the top of a cloud simulated by a bin-microphysics single-column model, for initial conditions typical of the Amazon, using different assumptions regarding the entrainment and the aerosol size distribution. It is shown that the cloud-top evolution can be very sensitive to aerosol properties, but the relative importance of each parameter is variable. The sensitivity to each aerosol characteristic varies as a function of the parameter tested and is conditioned by the base values of the other parameters, showing a specific dependence for each configuration of the model. When both the entrainment and the bin treatment of the aerosol are allowed, the largest influence on the droplet size distribution sensitivity was obtained for the median radius of the aerosols and not for the total number concentration of aerosols. Our results reinforce that the cloud condensation nuclei activity can not be predicted solely on the basis of the w∕Na supersaturation-based regimes.


Because of their role as cloud condensation nuclei (CCN) and ice nucleating particles, aerosols can affect the cloud optical properties (Twomey, 1974) and determine the onset of precipitation (Albrecht, 1989; Braga et al., 2017; Rosenfeld et al., 2008; Seifert and Beheng, 2006) and ice formation (Andreae et al., 2004; Fan et al., 2007; Gonçalves et al., 2015; Khain et al., 2005; Koren et al., 2010; Lee et al., 2008; Li et al., 2011). Aerosols also play an indirect role in the thermodynamics of local cloud fields via the suppression of cold pools and the enhancement of atmospheric instability (Heiblum et al., 2016). However, knowledge about the characteristics of the effects of atmospheric aerosols on clouds and precipitation is still lacking and remains an important source of uncertainty in meteorological models.
Many studies have been dedicated to quantifying the effect of aerosols on clouds via sensitivity calculations, using both modeling and observational approaches. Knowing the real values of each parameter that characterize the aerosol is difficult. Furthermore, detailed modeling of droplet nucleation implies a high computational cost. Thus, sensitivity studies intend to determine whether the variability of some characteristics of the aerosol population can be neglected without introducing significant errors in the description of clouds.
A major debate refers to the relative importance of aerosol composition with respect to size distribution and total number concentration (McFiggans et al., 2006). Several studies have suggested that accurate measures of aerosol size and number concentration are more important to obtain a relatively accurate description of cloud droplet populations (Feingold, 2003; Dusek et al., 2006; Ervens et al., 2007; Gunthe et al., 2009; Rose et al., 2010; Reutter et al., 2009). However, other observations/simulations have shown that, under certain circumstances, neglecting the variability of the aerosol composition prevents realistic estimations of the aerosol effect on clouds (Hudson, 2007; Quinn et al., 2008; Cubison et al., 2008; Roesler and Penner, 2010; Sánchez Gácita et al., 2017). This circumstantial sensitivity is commonly found in the literature and it refers not only to aerosol composition, but also to other meteorological/aerosol conditions (McFiggans et al., 2006). For instance, Feingold (2003) showed that the influence of aerosol parameters on the droplet effective radius (re) varies as a function of aerosol loading. Under clean conditions, re is mostly determined by the liquid water content and the aerosol number concentration (Na), with decreasing dependence on the aerosol size distribution (PSD), aerosol composition and vertical velocity (w). However, under polluted conditions, all of them contribute significantly to the re. Reutter et al. (2009) reported that the variability of the initial cloud droplet number concentration (Nd) in convective clouds is mostly dominated by the variability of w and Na. They found that the hygroscopicity parameter (κ) appears to play important roles at very low supersaturations in the updraft-limited regime of CCN activation. Moreover, a significant sensitivity of Nd on the PSD parameters was found for all w−Na regimes under certain conditions. Karydis et al. (2012) used a global meteorological model to obtain the sensitivity field of Nd to w, uptake coefficient, κ and Na. They state that, overall, Nd is predicted to be less sensitive to changes in κ than to changes in Na, although there are regions and times where they result in comparable sensitivities.
To further evidence the importance of aerosol composition on clouds, Ward et al. (2010) consider the Reutter et al. (2009) environmental regimes but vary the log-normal median aerosol radius () to examine the behavior of the sensitivity to κ. Their results compare well with the Reutter et al. (2009) regime designation when using the same value of . However, they show that w∕Na, or supersaturation-based regimes, cannot fully predict the compositional dependence of CCN activity, because, in their tests, it also varies significantly as a function of . It is remarkable that for small aerosols ( µm), the composition even affects CCN activity in the aerosol-limited regime.
Previous research investigating the aerosol effect on clouds has employed adiabatic parcel models to perform multiple sensitivity calculations (Feingold, 2003; Reutter et al., 2009; Ward et al., 2010). While that approach can capture the pure response of the cloud-base droplet size distribution (DSD) to aerosols through droplet nucleation and activation, it lacks the representation of the complex interactions that govern the evolution of DSDs in real clouds. Allowing for the representation of turbulent mixing in the models can introduce a significant departure from the results obtained under an adiabatic assumption. For instance, the entrained air is expected to decrease the buoyancy of the parcel via the transfer of both sensitive and latent heat, therefore reducing w. The consequent reduction of the supersaturation, as well as the increased availability of unactivated aerosols can enhance the water vapor competition in the cloud. Hence, the responses of the system to changes in the aerosol properties can suffer notable variations when turbulence and mixing are considered.
Moreover, most previous studies are based on the information from cloud base. However, given the possibility of the occurrence of cloud-top nucleation (Sun et al., 2012), it would be useful to assess the evolution of the cloud-top DSD, along with the cloud-base DSD, with respect to exploring the aerosol first indirect effect. In a growing cumulus, the cloud top represents the beginning of the cloud development at each level, including cloud base (because, in the initial stage of the cloud life-cycle, both the base and the top coincide in space). Thus, the characteristics of the DSD at cloud top will strongly impact the evolution of the cloud, modulating the rates of microphysical process onward and, therefore, determining the structure of the cloud. As Cecchini et al. (2017) pointed out, studies should take the altitude above cloud base into account. The authors showed that, on average, droplet growth with cloud evolution is comparable in absolute value and is opposite to the aerosol effect. They determined that the aerosol effect on the DSD shape inverts in sign with altitude, favoring broader droplet distributions close to cloud base but narrower DSDs higher in the clouds.
Another feature that is relatively common in cloud physics modeling studies is the treatment of aerosol species as a single-moment bulk variable, i.e., considering only one bin for the Na, which is log-normally distributed at each grid point and time step. Thus, the growth of wet aerosols is not resolved, and aerosols with dry sizes larger than the critical size defined by the Köhler equation are immediately added to the first bin of the DSD. By fixing the shape of the PSD, those models guarantee a continuous supply of larger aerosols for activation. Although the Na decreases according to the amount of activated droplets, the assumed log-normal shape implies the continuous presence of particles in the right tail of the PSD. Furthermore, by always assigning the activated droplets to the smallest bin of the DSD, a very narrow shape is induced, which requires longer to grow by diffusion until the collision–coalescence rate increases.
With an ample water vapor supply, high temperatures and a wide spectrum of aerosol conditions, the troposphere over the Amazon constitutes an ideal scenario for the study of aerosol–cloud–precipitation interactions. The Amazonian clouds that form during the wet and transition seasons are found to be very sensitive to aerosols (Andreae et al., 2004; Cecchini et al., 2016; Braga et al., 2017; Cecchini et al., 2017; Fan et al., 2018; Reid et al., 1999). Recent experimental campaigns in the Amazon have highlighted another layer of complexity in the aerosol–cloud interactions. During the wet season when the atmosphere is at background aerosol conditions, the clouds control both the removal and production of atmospheric particles over the Amazon Basin. According to Andreae et al. (2018), the production of new aerosol particles from biogenic volatile organic material, brought up to the upper troposphere by deep convection, is the dominant process supplying secondary aerosol particles in the pristine atmosphere. Following this, these particles can be transported from the free troposphere into the boundary layer by strong convective downdrafts or even weaker downward motions in the trailing stratiform region of convective systems (Wang et al., 2016). During the transition or dry seasons, frequent biomass burning events change the aerosol population characteristics as a whole, not only their number concentrations. Therefore, it is important to infer the pollution effect on cloud properties and how they can interact with the natural cycle in the region.
Here we propose to explore the cloud sensitivities to several aerosol properties, by simulating some characteristics of Amazon clouds. We focus on the information from cloud top, during the warm stages of cloud life-cycle, using a sample strategy that also includes the information from the cloud base at the initial stage of development of the cloud. Our approach is similar to Ward et al. (2010), but it is not limited to analyzing the hygroscopicity sensitivity. Instead, we also extended the discussion to the sensitivity to the aerosol median size and number concentration, and consider their effects on both droplet size and concentration. This analysis is performed using three different model configurations that allow us to investigate the importance of representing the entrainment and mixing, as well as the evolution of the PSD, in modeling studies related to the aerosol effect.
The simulations performed here employs variations of the Tel Aviv University (TAU) bin microphysics parameterization (Feingold et al., 1988; Tzivion et al., 1987, 1989) coupled to a single-column Eulerian framework. The 1-D model is based on the Kinematic Driver (KiD) model (Shipway and Hill, 2012), but instead of prescribing w for each time t and height z, it is calculated from the simplified vertical momentum equation, considering the buoyancy of the parcel and the weight of the liquid water, as well as the reaction force on the parcel resulting from the acceleration of the air in the neighborhood (Pruppacher and Klett, 2012):
where , with m and m′ being the mass of the parcel and the mass of the air displaced by the parcel, respectively; g is the gravity acceleration; θ and θ′ are the potential temperature of the ascending parcel and the environment, respectively; and ql is the liquid water mixing ratio. The entrainment rate considers the lateral mass flux along the axis of a vertical plume of radius R(t,z). It is assumed to follow the inverse radius dependence: , where C≈0.2 is the entrainment parameter. The equation for the radius of the plume is
where ρ represents the density of the air.
In our simulations, a 1 s time step was used for both dynamics and microphysics algorithms during an integration time of 1800 s (30 min). For the vertical domain, a 120-level grid was defined with a 50 m grid spacing from an altitude of 0 to 6000 m.
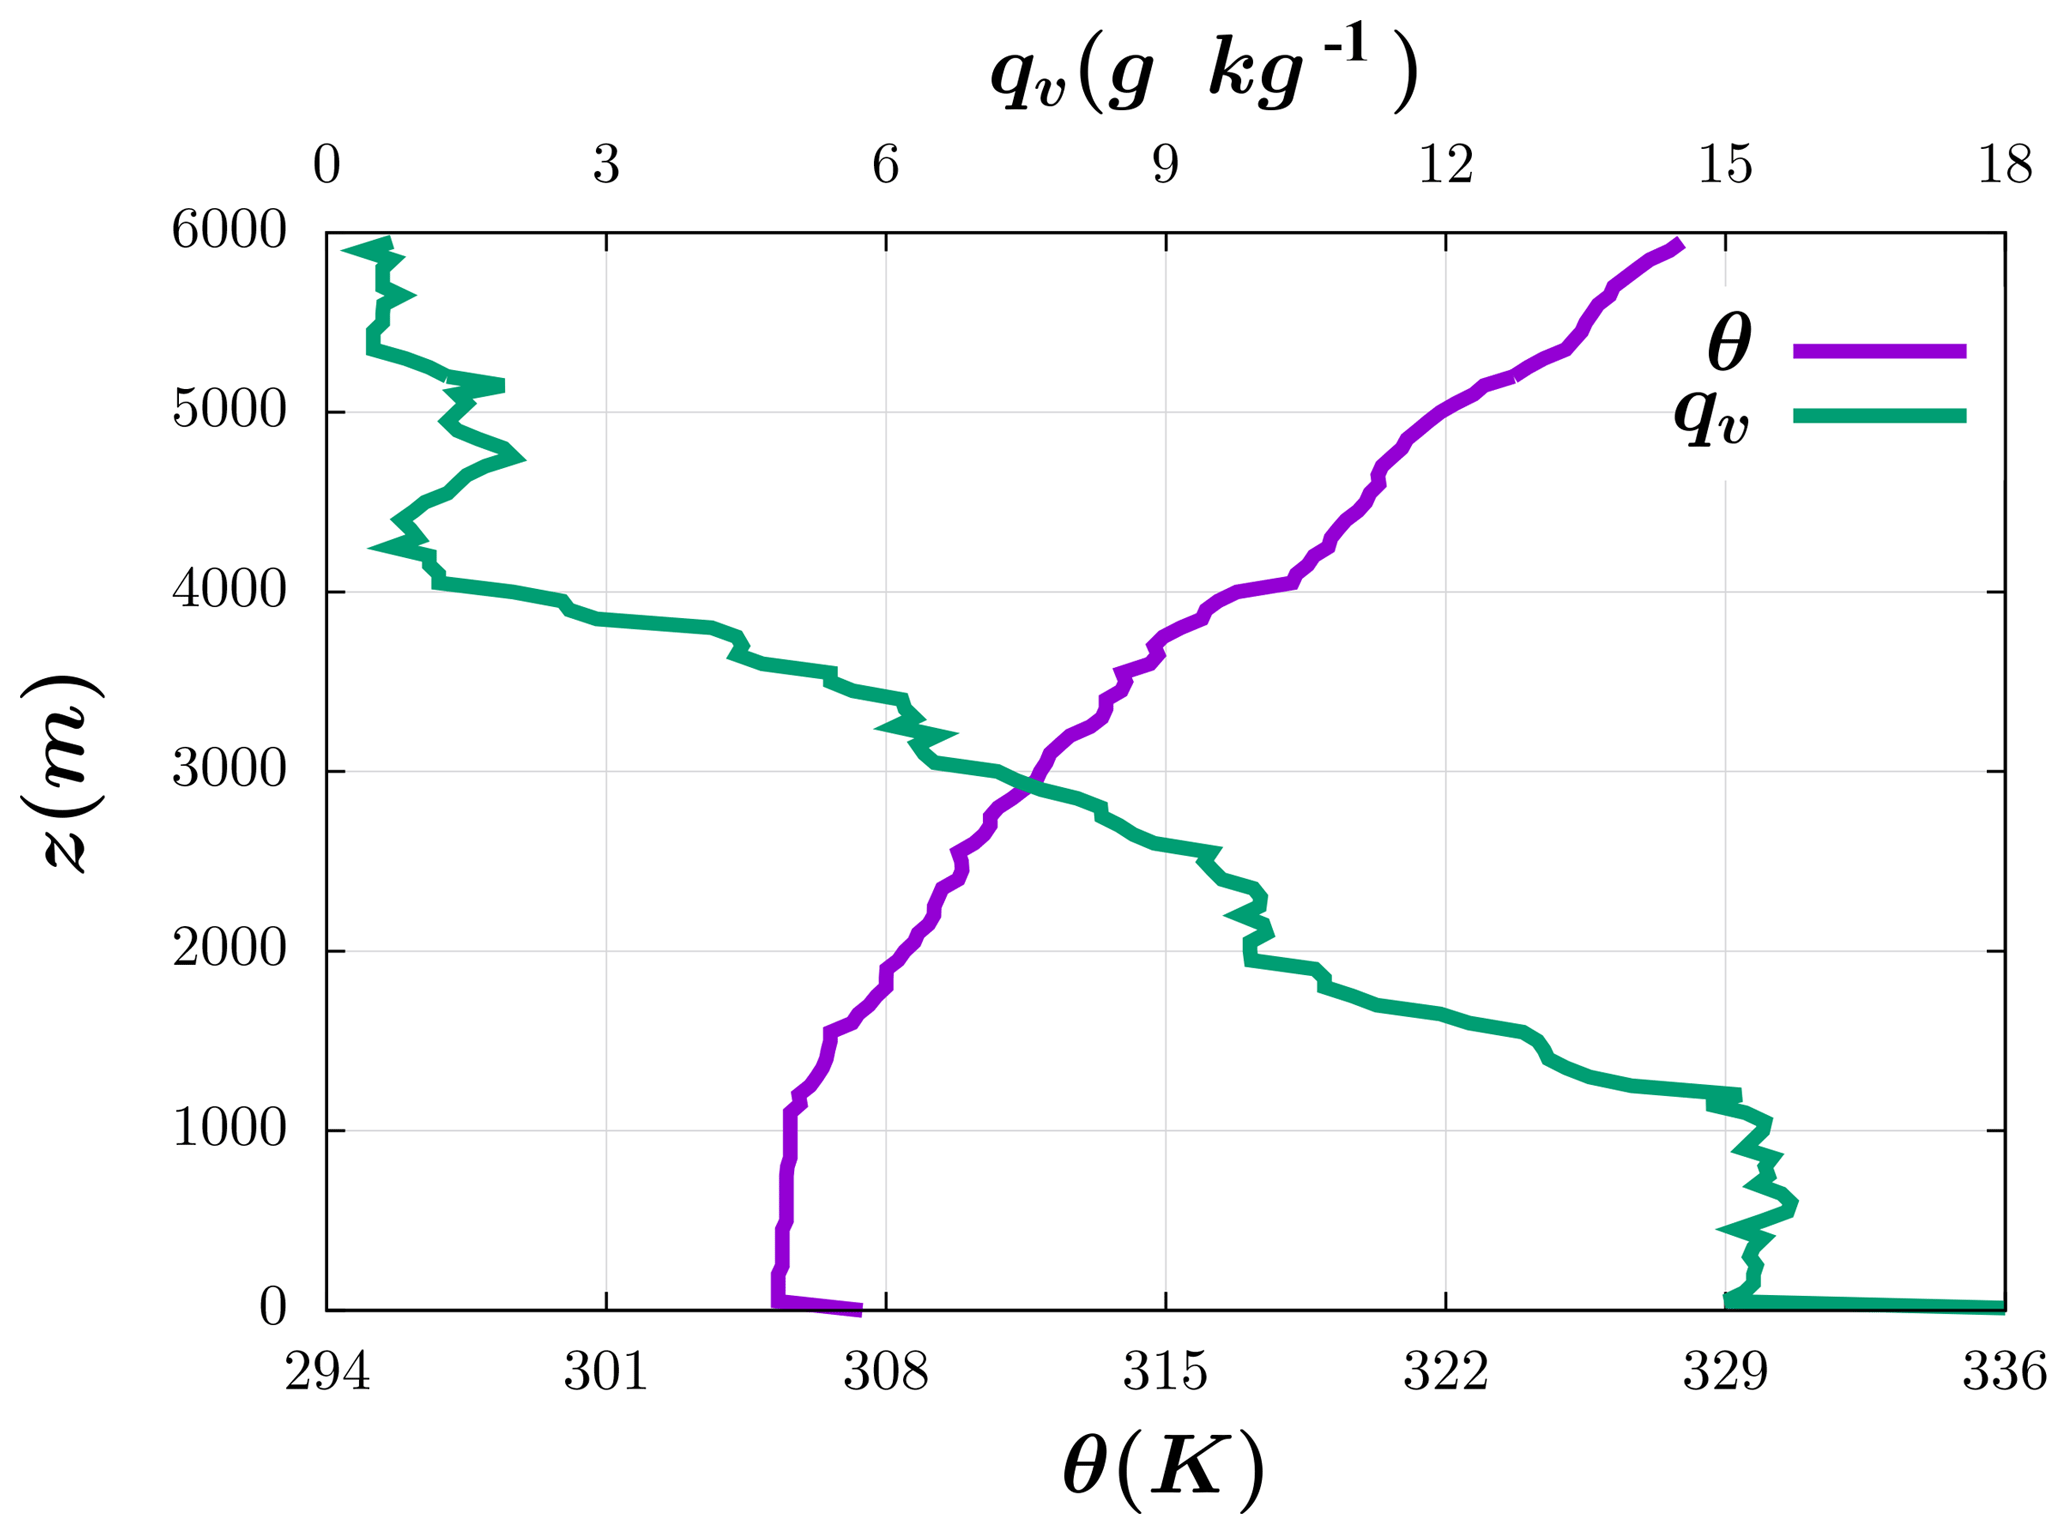
As initial conditions, vertical profiles of potential temperature and water vapor mixing ratio (qv) from an in situ atmospheric sounding corresponding to 17:30 Z on 11 September 2014, from Manacapuru, Brazil (Fig. 1), were provided. A constant temperature perturbation of 2.5 K was introduced at the surface to force the convection.
The contribution of the entrainment in the equations for the evolution of θ, qv and Na is expressed as , where X and X′ represent the in-cloud and environmental values for each of the magnitudes mentioned, respectively.
2.1 Microphysics representation
For the simulations performed in this work, we used the TAU size-bin-resolved microphysics scheme that was first developed by Tzivion et al. (1987, 1989) and Feingold et al. (1988) with later applications and development documented in Stevens et al. (1996), Reisin et al. (1998), Yin et al. (2000a), Yin et al. (2000b) and Rotach and Zardi (2007). TAU differs from other bin microphysical codes because it solves for two moments of the DSD in each of the bins rather than solving the equations for the explicit size distribution at each mass/size point, which allows for a more accurate transfer of mass between bins and alleviates anomalous drop growth.
In this version of the TAU microphysics (available at: https://www.esrl.noaa.gov/csd/staff/graham.feingold/code/, last access: 4 November 2017), the cloud drop size distribution is divided into 34 mass-doubling bins with radii ranging between 1.56 and 3200 µm. The method of moments (Tzivion et al., 1987) is used to compute mass and number concentrations in each size bin resulting from diffusional growth (Tzivion et al., 1989), collision–coalescence and collisional breakup (Tzivion et al., 1987; Feingold et al., 1988). Sedimentation is performed with a first-order upwind scheme.
To account for changes in the PSD, we introduced a set of 19 bins for dry aerosols, with radii (r) between 0.0076 and 7.6 µm, according to Kogan (1991). We consider that Na is log-normally distributed through these bins, at the beginning of the simulation, and can vary by advection, entrainment, activation and regeneration after droplet evaporation.
At a given temperature and supersaturation, the critical dry size (rc) for droplet activation is computed from the Köhler equation (Pruppacher and Klett, 2012). The initial bin for newly nucleated droplets is assigned according to its equilibrium size at 100 % relative humidity, if . For larger aerosols, the initial radius of the droplet will exceed r by a factor of , due to the time these particles take to reach its equilibrium size (Ivanova, 1977). The consumption of water vapor by unactivated aerosols is not considered in the model. We assume that aerosols smaller than the activation size do not represent a significant sink of water vapor, given the great availability of humidity over the Amazon.
The aerosol regeneration is included here following the approach of Kogan et al. (1995) and Hill et al. (2008). It considers that large CCN particles grow to large cloud drops, which evaporate less efficiently than small droplets. Thus, small CCN will be released before larger CCN. As a result, the regenerated CCN are replenished to the aerosol bins starting with the smallest activated size, until the original number concentration in each bin is attained. If the number concentration of regenerated CCN is larger than the number concentration of “missing” aerosols (considering the initial PSD), which can occur due to the advection of droplets to levels different from those where they were nucleated, the “excess” CCN will be log-normally distributed according to the initially defined ra and geometric standard deviation (σa). A constraint is added to this scheme to conserve the domain-averaged PSD.
This scheme provides a reasonable way to parameterize the aerosol regeneration without using a 2-D probability density function to track the aerosols. It does not consider the processing of the aerosols inside the cloud; therefore, it could induce errors in the activation rate in situations where the collision–coalescence process is a significant sink of small aerosols and a source of larger aerosols (Lebo and Seinfeld, 2011). However, its use is justified in our case owing to the occurrence of only low rates of evaporation. This evaporation takes place right above cloud top, due to the advection of droplets to upper, unsaturated levels. Hence, even if collision–coalescence significantly modifies the size of the aerosol particles, when partial evaporation occurs, only the smallest droplets will deactivate. The collision–coalescence effect on the PSD would have to be considered in cases with large evaporation rates, where even large droplets, containing the largest original or processed aerosols, deactivate.
We employ a phase space defined by two bulk properties of the DSD (hereafter “bulk phase space”): Nd (cm−3), which coincides with the zeroth moment of the DSD, and Deff, the droplet effective diameter (µm), which is the ratio between the third and second moments.
Sensitivity tests in the bulk phase space provide a very efficient means of evaluating how a specific parameter variability can affect the evolution of cloud-top DSDs. Here, we test the sensitivity of Nd and Deff at the cloud top to variations in Na, , σa and κ, using ranges normally found in the Amazonian atmosphere (Gunthe et al., 2009; Martin et al., 2010; Pöhlker et al., 2016) (Table 1). Two sets of parameters are tested: set 1 applies to the tests employing bins for the aerosol, whereas set 2 is used for the simulations with a bulk treatment of the aerosol.
The choice of the intervals of values for the aerosol properties was made in a way that allowed for the exploration of the largest subset of realizable values of the parameters, while maintaining a reasonable computation time. For certain combinations of the size distributions parameters, the PSD can be very narrow, with a very small concentration of aerosols larger than the activation threshold. This configuration, along with a small Na, generates clouds with a very low water content and unrealistically high supersaturations, when a bin treatment of the aerosol is used. To prevent this kind of situation, ranges were chosen as to produce averaged Nd at cloud top >10 cm−3, while maintaining the largest possible variety for each parameter. In order to test the response to µm, for instance, we needed to use values of Na larger than 800 cm−3, and σa larger than 1.6. We did obtain realistic outputs from simulations with lower Na, such as 200 cm−3, but only when using PSDs with larger and σa. As we needed a fully applicable parameter-space, this explains the choice of the intervals described.
Due to a deficient treatment of the activation scavenging, when a bulk treatment of the aerosol is used, the lower values of the aerosol parameters at which a reasonably dense cloud can be generated are much smaller. By not allowing the PSD to freely evolve, there is a continuous, spurious source of large aerosols that induces unrealistically high values of Nd and can destabilize the model if some thresholds for Na, and σa (900 cm−3, 0.08 µm and 1.9, respectively) are exceeded. Therefore, in this case, the upper and lower limits for each parameter had to be decreased.
Table 1Aerosol parameters used for the sensitivity tests using bin and bulk approaches for the aerosol: intervals for values and steps between them. For additional details, the reader is referred to the text.

The sensitivities were calculated as the slope of the linear fit between Y and Xi in logarithmic scale for normalization:
where Y represents either Nd or Deff, and Xi is the aerosol property affecting Y. SY(Xi) represents the relative change in Y for a relative change in Xi and places less reliance on the absolute measures of parameters (Feingold, 2003; Reutter et al., 2009; Ward et al., 2010). The subscript Xk indicates that when calculating the sensitivity to Xi, the other aerosol parameters are held constant. For each value at which Xk is fixed, we will obtain a new value of SY(Xi), i.e., we can also calculate SY(Xi) as a function of Xk, SY(Xi,Xk).
The latter differentiates our approach from previous studies. Feingold (2003) included the variability of all X≠Xi when calculating the linear regression between ln Y and ln Xi, only distinguishing the results for two subsets of Na. Similarly, Reutter et al. (2009) analyzed the sensitivities to , σa and κ for three combinations of Na and w, but all values of Y calculated at a given value of Xi were averaged prior to fitting. This analysis was then expanded by Ward et al. (2010), who calculated for different values of and σa used to initialize the parcel model. Now, we use a more general approach that allows us to study the responses of both Nd and Deff to changes in each aerosol characteristic, as a function of the other aerosol parameters used to initialize the model.
The control run of the model produced a shallow cumulus that grew to a depth of 4000 m in about 30 min. Figure 2 shows the evolution of w, Nd and Deff, characterized by the following aerosol initial parameters: Na=800 cm−3, µm, σa=1.9 and κ=0.1. The cloud top is defined as the last model level, from the surface to the top, where the Nd was larger than 1 cm−3. Note that there is a maximum of Nd at cloud top for all times. As droplets ascend and mix with new droplets, they grow by diffusion of vapor and collision–coalescence. As a consequence, Deff is larger in upper levels.

The bulk phase space view is introduced in Fig. 3 to discuss the isolated effect of each parameter, when keeping the other aerosol PSD properties constant. Overall, following the cloud top in the phase space, two local maximums of Nd are found. The first one corresponds to the smallest Deff (<5 µm) and is related to the maximum in the nucleation rate. This represents the first steps in cloud formation, where the droplets are very small and there is no significant vertical cloud development. The second one, which is also the global maximum, is reached when the cloud is deeper, as a consequence of the accumulation of droplets advected by the updraft. Regardless of the Nd fluctuations, the cloud-top Deff shows an overall monotonic increase with altitude, except at the end of the simulation where the updraft decelerates.
Figure 3a shows the sensitivity of cloud-top DSDs to the initial concentration of aerosols. Note that an increase of Na increases Nd for the most part, as expected. The nucleation enhancement induces a smaller Deff due to water vapor competition, for the same liquid water content (not shown). Thus, if the water vapor amount is kept constant, the diffusional growth for each droplet is slowed. The latter manifests as a trend to the horizontal orientation in the lower portion of the trajectories in the bulk phase space, corresponding to the smallest sizes (<10 µm), where the diffusion of water vapor is the predominant droplet growth mechanism. It is interesting to note that all profiles evolve towards similar values in their maximum Nd and Deff. This is related to a buffering effect of the entrainment. Note that the entrainment term, in the temperature, water vapor and aerosol tendency equations, is proportional to the difference of the values of those variables between the cloud and the environment. The larger aerosol content will induce the strongest modifications in the fields, thus increasing the contribution of the entrainment term. This feedback effect decreases the sensitivity of the maximum Nd and Deff attained in the cloud to the aerosol loading. Also notable are the Nd>Na values in the control run, which result from the vertical gradient of w shown in Fig. 2. Because the updrafts are stronger below cloud top, there is a tendency to accumulate droplets in the layers analyzed here.
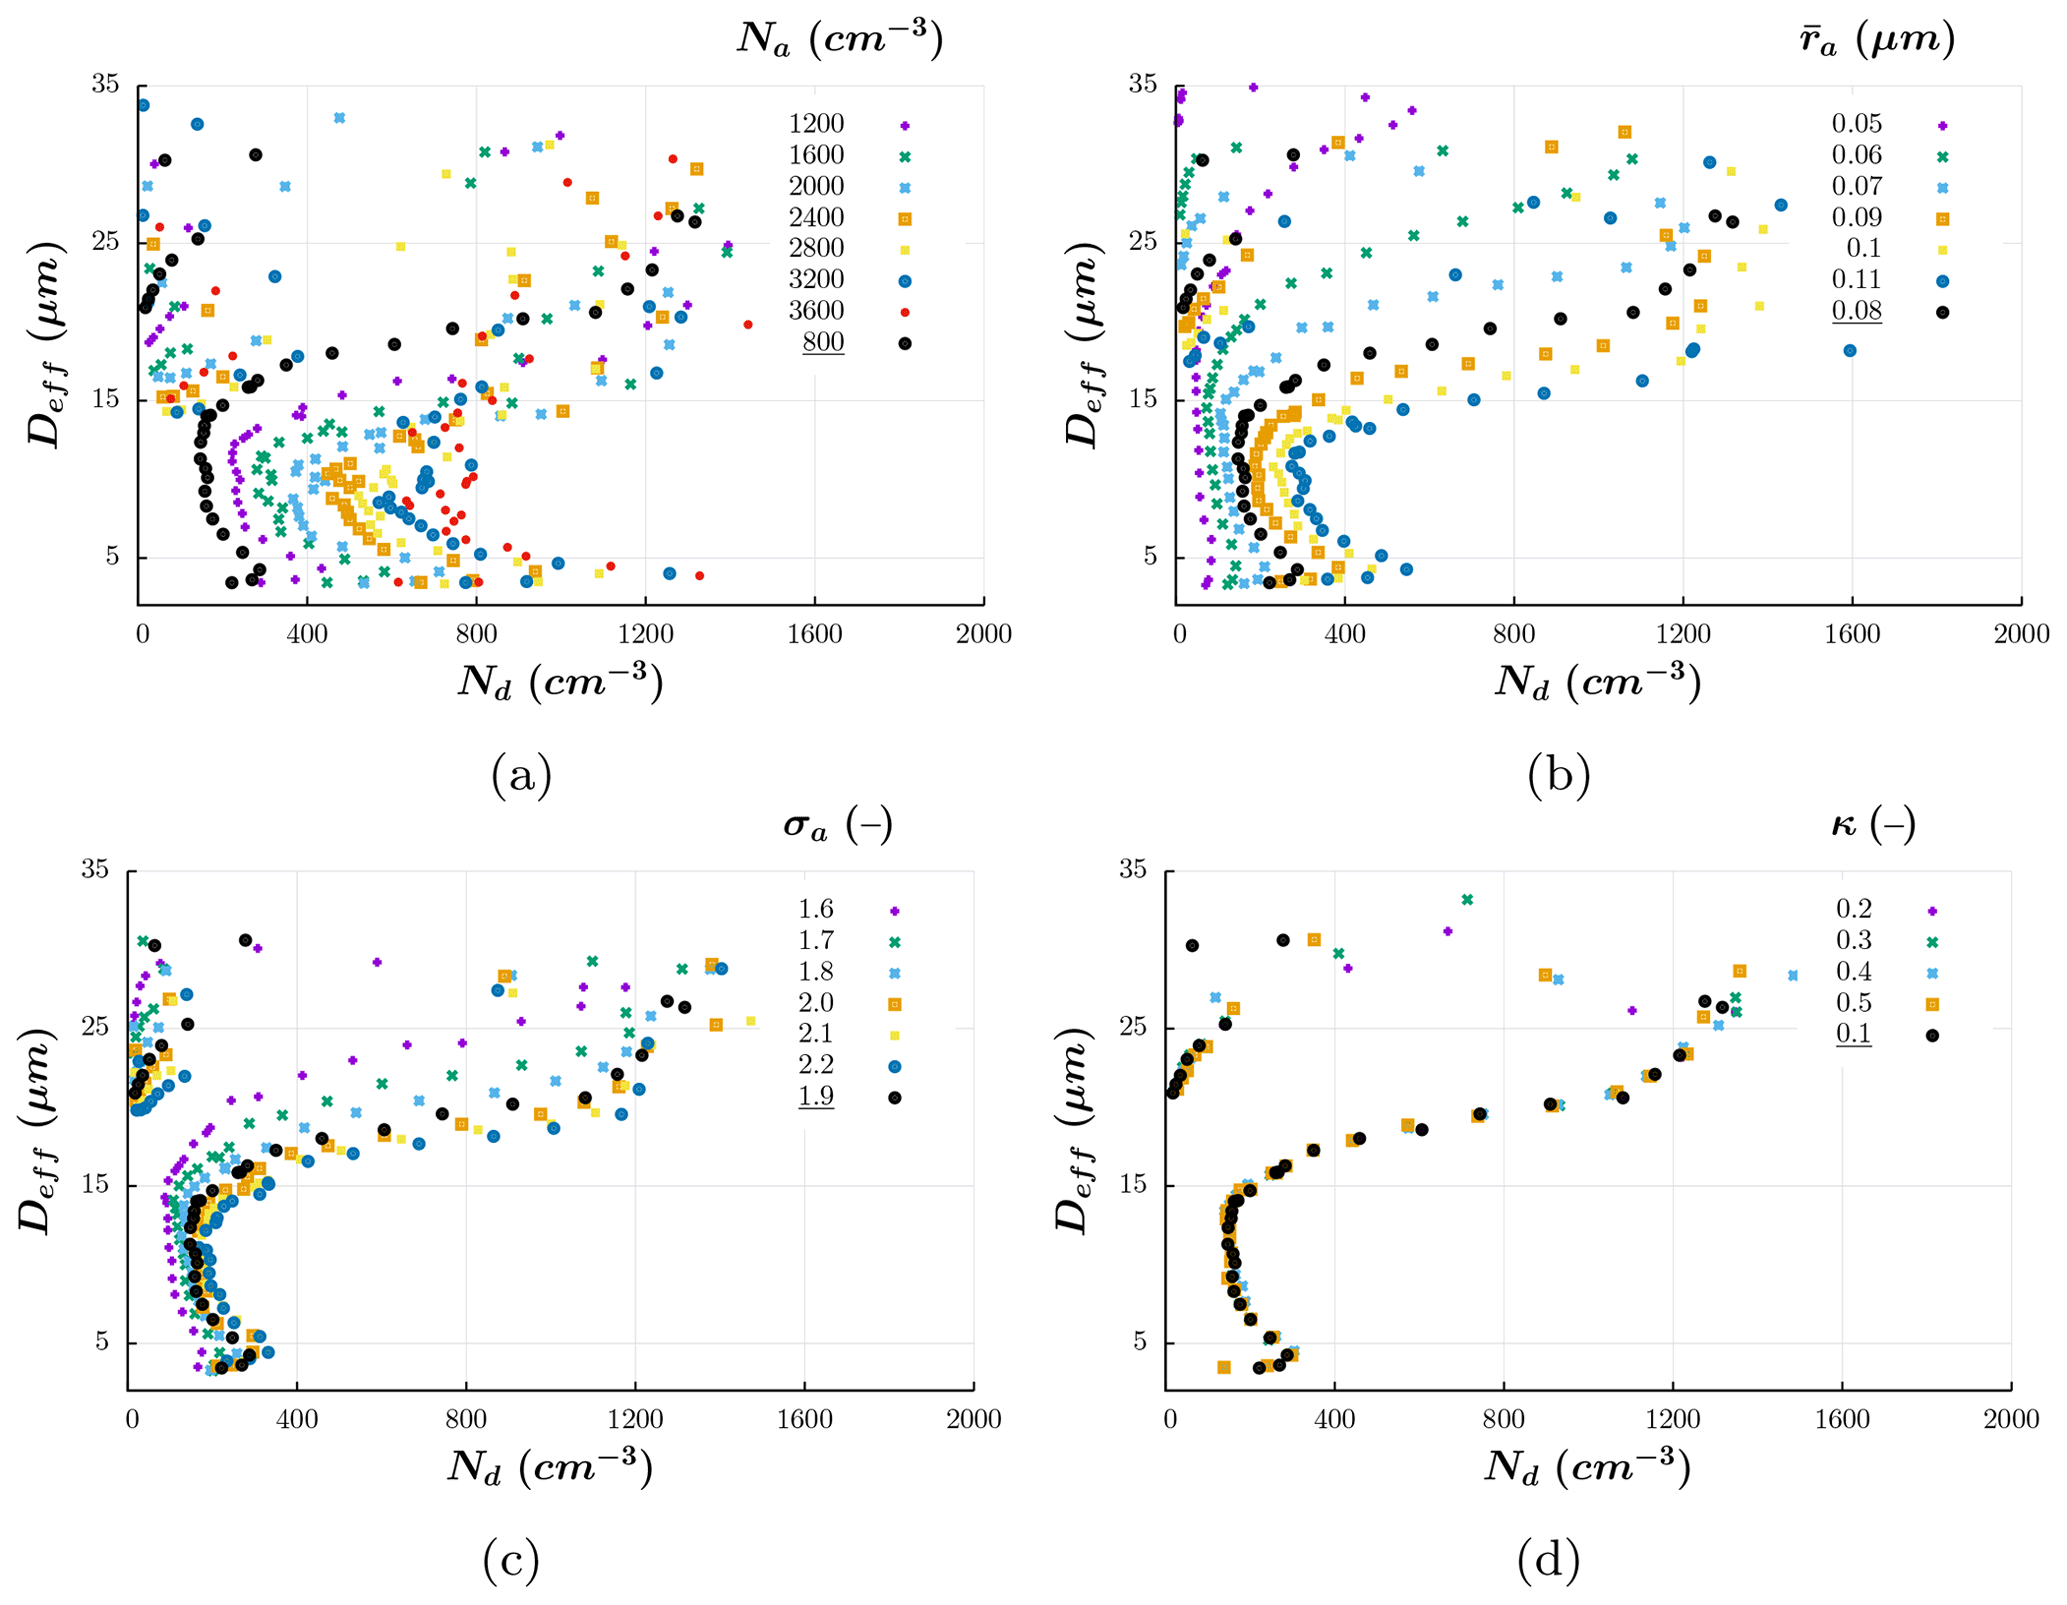
Figure 3Illustration of the sensitivity of cloud top bulk properties to (a) the aerosol number concentration (cm−3), (b) the median radius of the PSD (μm), (c) the geometric standard deviation of the PSD (–) and (d) the aerosol hygroscopicity (–). The markers represent the averaged DSDs for the time steps when the cloud top remains at the same model level during its growth. The colors distinguish between simulations using different values of the parameter specified at the top of the graphs. The control simulation is represented by black markers in the figures.
Note that the fraction of activated droplets in the first level is similar among all simulations in Fig. 3a (close to one-third of Na), which is a consequence of all of the other aerosol PSD parameters being kept constant. In reality, increased pollution in the Amazon is usually followed by changes in the aerosol PSD shape, given the different properties of background and biomass burning or urban particles. Therefore, it is important to analyze the effects of every aerosol PSD parameter separately to fully understand the pollution effect in Amazonian clouds.
Figure 3b and c show the sensitivity of cloud-top DSDs to and σa while keeping the other parameters at their control standards. The effects of increasing aerosol size and PSD width are similar to the consequences of increasing Na. By increasing or σa, more droplets are activated due to the larger availability of aerosols with sizes above the activation threshold. Thus, nucleation increases, whereas diffusional growth decreases. The latter is visible throughout the trajectories in Fig. 3b and c.
The tests in Fig. 3 evidence a type of saturation effect for the larger values of Na, and σa tested, i.e., the sensitivity decreases as these parameters increase. This behavior is mainly explained by the consumption of water vapor supersaturation. Even if continuous water vapor supply from the surface occurs, the supersaturation can be completely consumed, depending on the aerosol availability and the diffusional growth rate. If the number of activated aerosols is able to consume all of the supersaturation, given certain z and t, an increase of its quantity will not introduce differences in the DSD.
Finally, Fig. 3d shows that the effects of varying κ are very small. Nevertheless, this is a result for one single combination of Na, and σa, i.e., the control values of the parameters; according to Ward et al. (2010), the sensitivity to κ can vary as a function of Na and . Additionally, it is known that the sensitivity to κ increases substantially as κ decreases (Petters and Kreidenweis, 2007). However, this effect is more or less evident depending on the values of the other parameters. Hence, to characterize the sensitivity of DSDs to aerosol properties, we should explore the multiparameter space composed by all combinations of discrete values of the parameters from its interval of realizable values.
To illustrate this sensitivity variation, we calculated and , with Xi being Na, , σa or κ. and are the time averages of Nd and Deff at cloud top for each simulation, respectively. From Eq. (3), , for example, is the slope of the linear fit between the values of and Na in logarithmic scale, for a given combination of , σa and κ. The sensitivity to one aerosol parameter can then be calculated a number of times equivalent to all possible combinations of the values of the other parameters in Table 1.
Figures 4, 5, 6 and 7 show SY(Xi) as a function of all values of Na, , σa and κ considered. Generally, can be almost 3 times more sensitive to changes in the aerosol parameters than , which stems from the mathematical definition of these physical magnitudes. For each value on the x axes of Figs. 4, 5, 6 and 7, there are several combinations of the other two parameters; as a result, there are several points for each value on the x axes in the figures.

Figure 4Sensitivities of the droplet number concentration and effective diameter to the aerosol number concentration, SY(Na), as a function of (a) the median radius of the PSD (µm), (b) the geometric standard deviation of the PSD (–) and (c) the aerosol hygroscopicity (–).
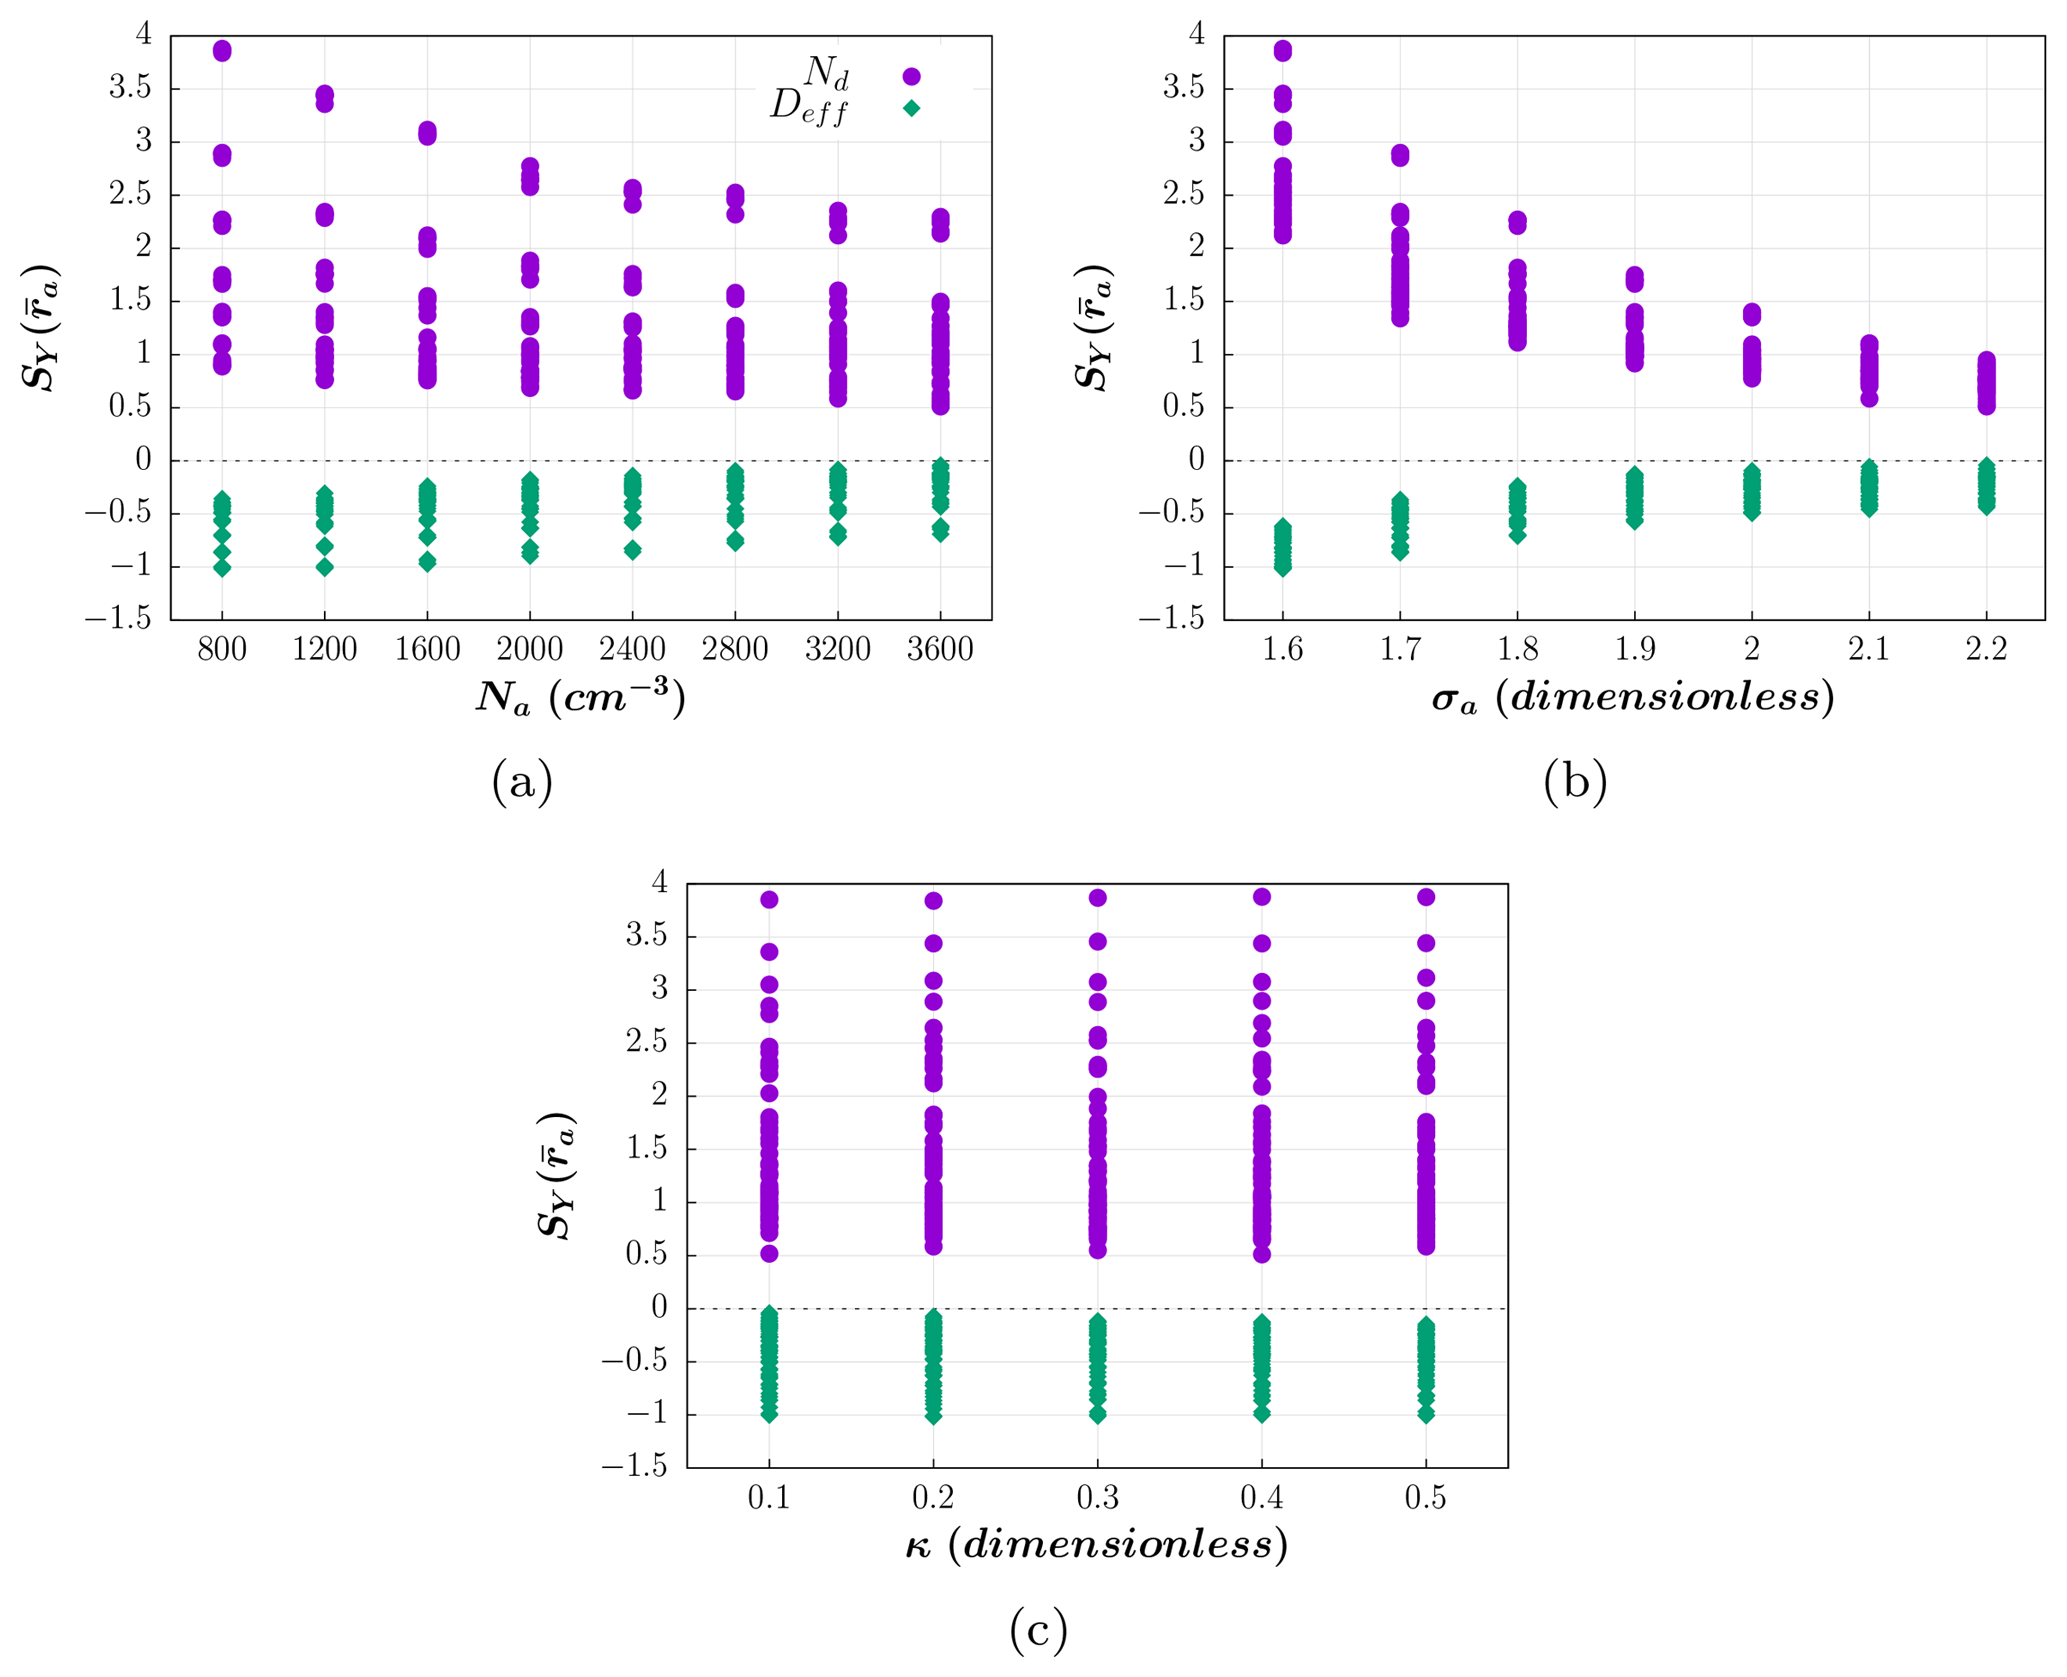
Figure 5Sensitivities of the droplet number concentration and effective diameter to the median radius of the PSD, , as a function of (a) the aerosol number concentration (cm−3), (b) the geometric standard deviation of the PSD (–) and (c) the aerosol hygroscopicity (–).
The impact of Na on cloud droplets depends on the values of and σa, but does not vary with κ, as can be seen in Fig. 4. For smaller values of and σa, SY(Na) reaches its maximum and presents a large dispersion. Conversely, it tends to be concentrated around a minimum sensitivity value as these parameters increase. Hence, for smaller aerosols, the relative importance of the aerosol properties can be very different from that at larger sizes.
Figure 5a shows that the sensitivity to decreases for higher values of Na and σa. Similar to the behavior of SY(Na), the lower variability in corresponds to the values of Na and σa where the absolute value of the mean sensitivity is the lowest. Conversely, the effects of κ on the sensitivity to are negligible (Fig. 5c).
The same applies to the sensitivity to σa (Fig. 6), substituting σa with as the independent variable in Fig. 6b. It is remarkable that the maximum absolute values of SY(σa) are higher than SY(Na), and SY(κ) obtained here. Nevertheless, even when the values of SY(σa) indicate that σa has a high relative impact on and for certain circumstances, we should keep in mind that the effect of varying a parameter is determined by its range of realizable values. For example, assuming that the maximum and minimum values specified in Table 1 determine the entire variation of the parameters in a given situation, it follows that a 0.6 change in σa (an increase ratio of 1.38) could induce a 10.6-fold increase in , whereas a variation of 0.06 µm in (a 2.2 increase ratio) could increase 21.6 times, if we consider the maximum values of and , respectively. In turn, a 2800 cm−3 change in Na (corresponding to a 4.5 increase ratio), would only increase by a factor of 6.1 at most.
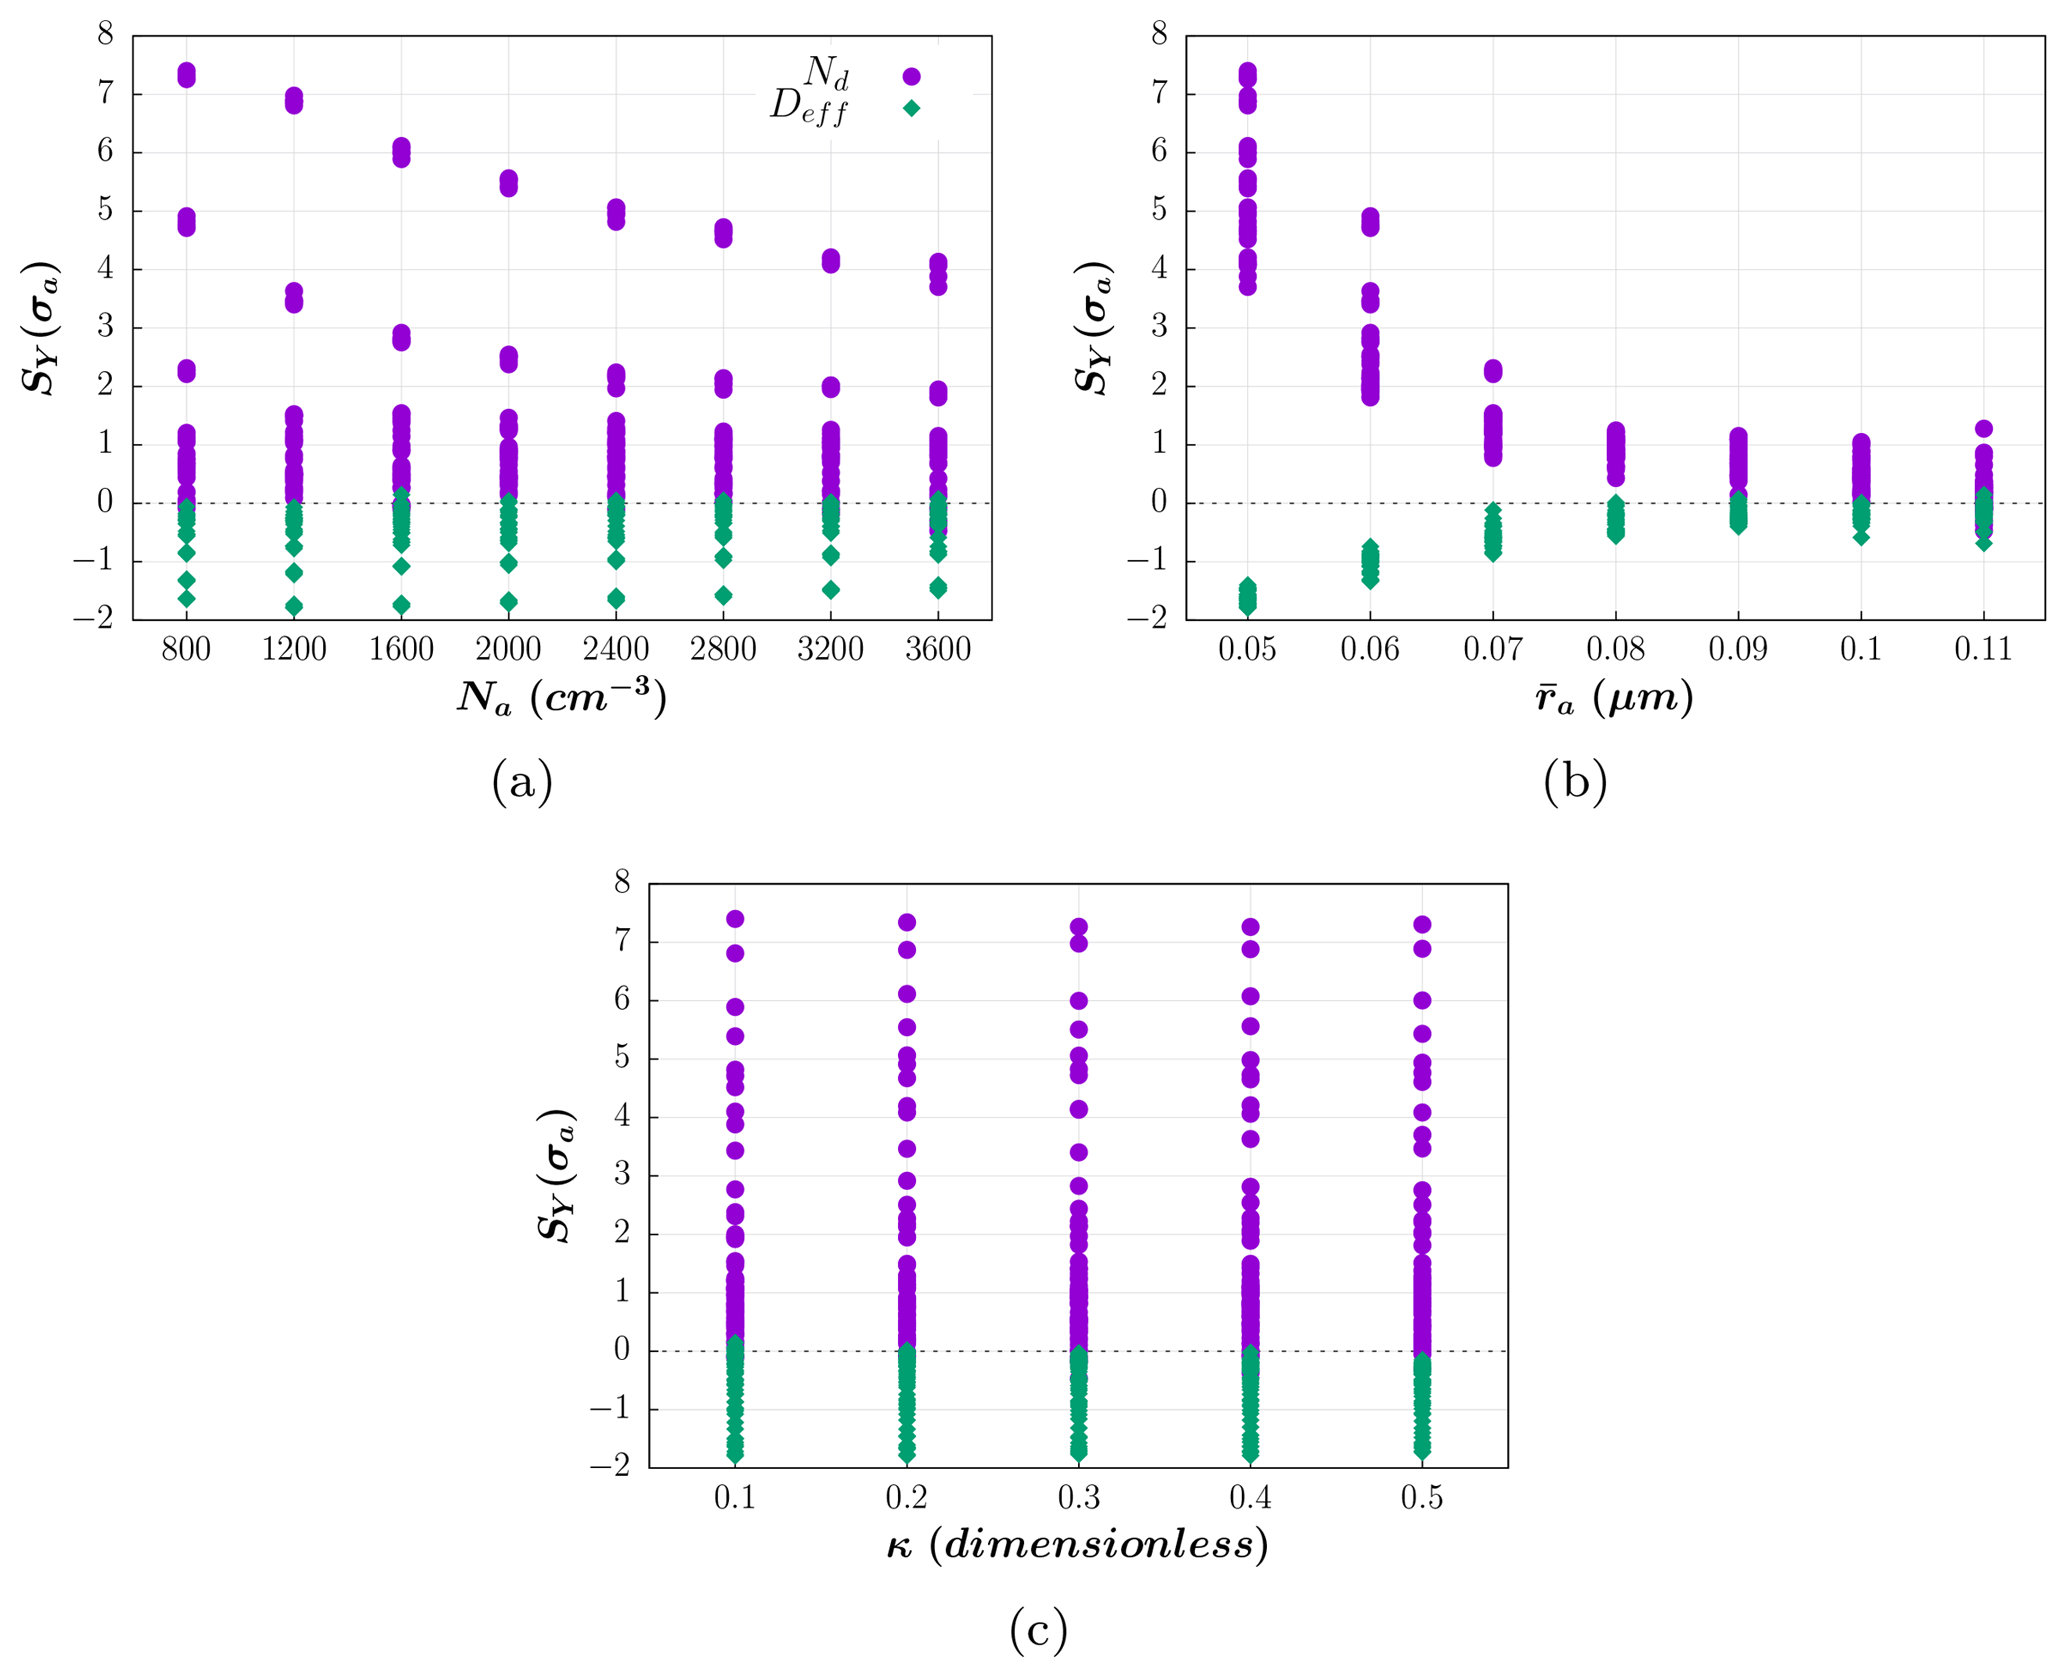
Figure 6Sensitivities of the droplet number concentration and effective diameter to the geometric standard deviation of the PSD, SY(σa), as a function of (a) the aerosol number concentration (cm−3), (b) the median radius of the PSD (µm) and (c) the aerosol hygroscopicity (–).
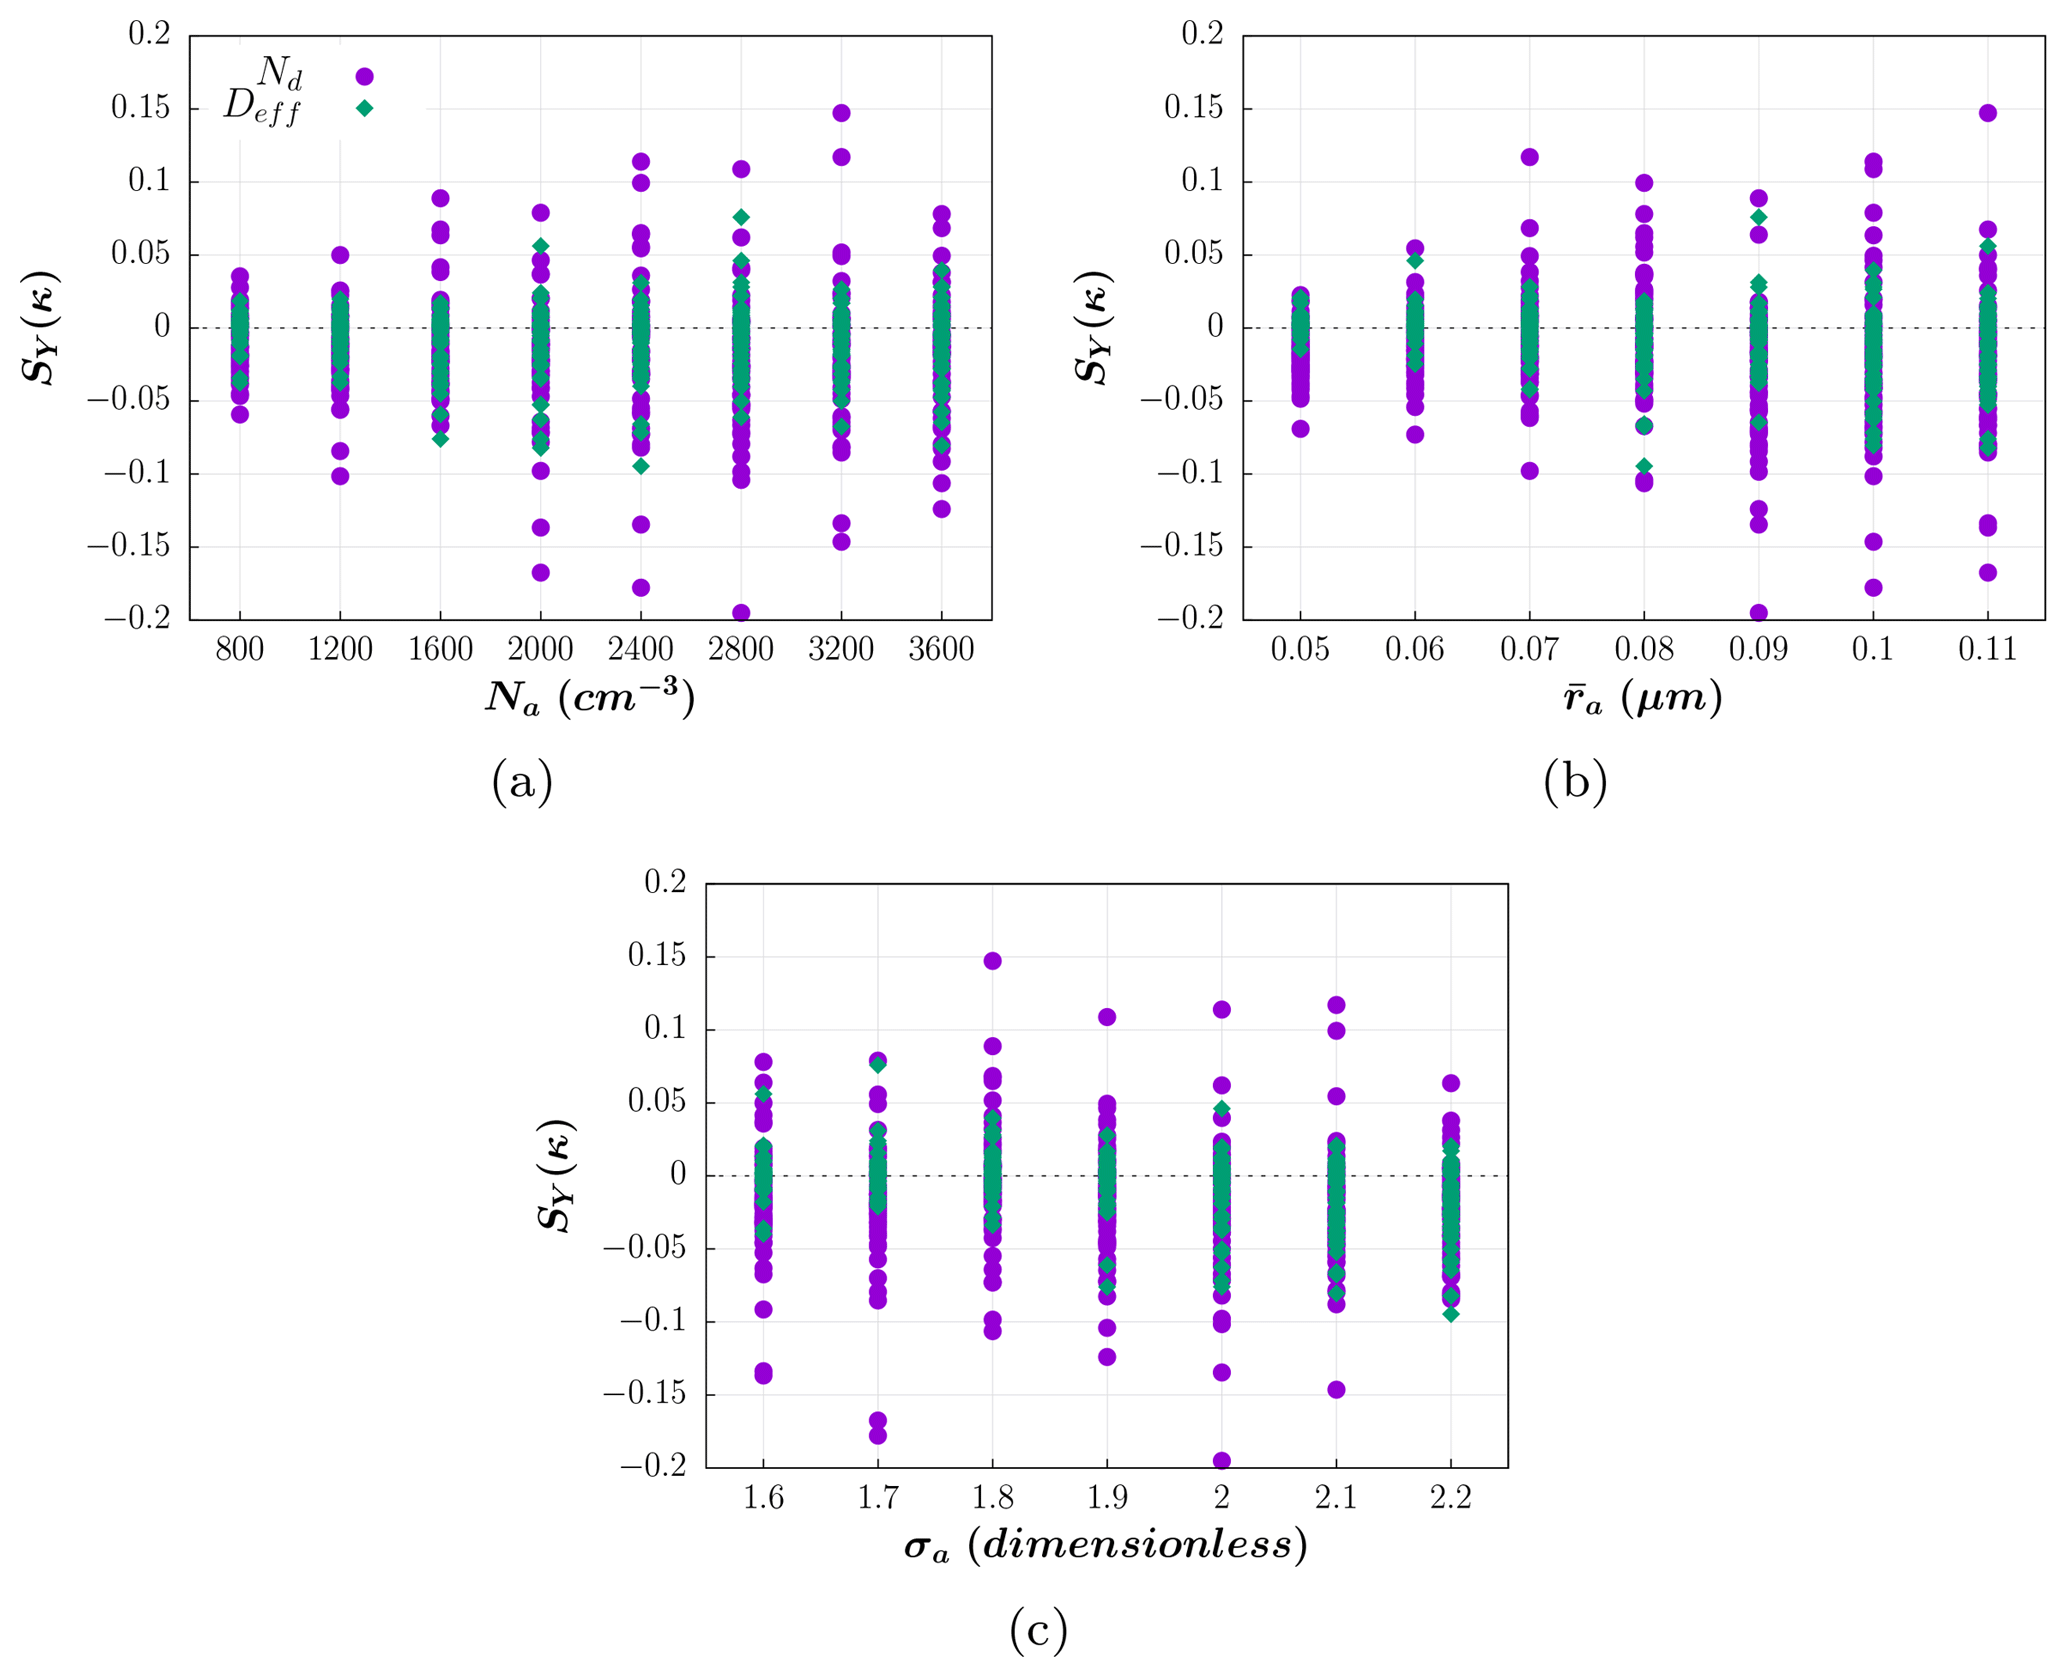
Figure 7Sensitivities of the droplet number concentration and effective diameter to the aerosol hygroscopicity, SY(κ), as a function of (a) the aerosol number concentration (cm−3), (b) the median radius of the PSD (µm) and (c) the geometric standard deviation of the PSD (–).
Note that SY(σa) changes its sign as increases (Fig. 6b). This is related to variations in the effect of σa depending on the relation . Considering a log-normal PSD, the number of aerosols for which r>rc, i.e., the number of activated droplets, is positively correlated with σa if , and negatively correlated otherwise. If , the number of activated droplets does not depend on σa. The positive values obtained by Feingold (2003) for the sensitivity of droplet size on σa, as well as the negative values reported by Reutter et al. (2009) for the sensitivity of the Nd on σa should be due to the inclusion of larger aerosols, favoring the diminution of the rc-to- ratio.
Finally, the sensitivity to κ is the lowest of those analyzed here (Fig. 7). Note that an increase ratio of 5 in the value of κ modifies by a factor of 1.38 at most. This is also consistent with its small influence on the sensitivities of the other parameters, as mentioned above. The symmetric distribution of the sensitivity with respect to the abscissas axis evidences a random impact of κ on the cloud-top DSDs here. This randomness results from the uncertainties involved in the determination of the cloud-top location, the calculation of and , and in the fitting procedure employed to obtain SY(κ), which predominates in the presence of such low values of SY(κ). However, it should be considered that the effects of the aerosol composition can be significantly increased in weak updraft conditions (Ervens et al., 2005; Anttila and Kerminen, 2007; Reutter et al., 2009).
Despite the limited dynamical capabilities of our 1-D framework, here we adopted a simplified approach to consider the mixing between the in-cloud and environmental properties. We considered that the column in the model is located in the center of a plume with radius R(t,z), which mixes homogeneously with the radially entrained air at each z. The entrainment affects w, the temperature, the humidity and the amount of aerosols in the column. Past studies in the Amazon have assumed that the entrainment mixing in Amazonian clouds is close to the extreme inhomogeneous case, given that the Deff remains relatively constant horizontally (Freud et al., 2011). However, the recent studies of Pinsky et al. (2016) and Pinsky and Khain (2018) indicate that homogeneous and inhomogeneous mixing can be indistinguishable for polydisperse DSDs, especially for wide distributions. Additionally, these studies show the inadequacy of previous in situ techniques to identify the mixing type (the so-called mixing diagrams). Based on this finding, we will stick to the homogeneous case in the present study as a first approximation. Further studies would be needed to assess the effects of inhomogeneous mixing, and this comparison is beyond the scope of this paper.
Some cloud-top mixing is resolved in the model grid. However, it can be affected by the numerical diffusion and dispersion introduced by the scheme that solves the advective terms. The representativeness of the mixing induced by such an advection at cloud top must be analyzed carefully, and is outside the scope of this paper. For now, we limit our analysis to the results with and without the inclusion of some lateral entrainment rates, as a proxy for the effect of the dilution caused by mixing with the air in the neighborhood of the clouds.
By using bins for the aerosol, we allow the PSD to evolve freely. This way, after activation, the tail of the PSD can only be filled again if new particles are advected, entrained or replenished due to droplet evaporation. Furthermore, as the newly activated droplets fill several bins of the DSD, the development of wider DSDs is favored, accelerating collection processes. This method has been extensively employed (Yin et al., 2000a, b, 2005; Altaratz et al., 2008; Hill et al., 2008; Mechem and Kogan, 2008) to substitute the explicit calculation of the diffusional growth of the aerosol from its dry sizes, which has a much higher computational demand. Leroy et al. (2007) analyzed the influence of a similar assumption on the liquid and ice water content and the aerosol particles, drops and ice crystal spectra simulated by a 1.5-D model; he found notable consistency between both approaches, even when the bin resolution was strongly decreased, as well as a reasonable sensitivity to the initial aerosol spectra. We use this approach here to test the importance of including a more detailed treatment of the PSD in the model, when investigating the aerosol effect on cloud-top DSDs.
Figures 8 and 9 illustrate the behavior of the sensitivity to each aerosol parameter in three different hypothetical situations. The first column shows the results from the simulations described in the previous section, the results without entrainment are shown in the second column, and the simulations using a bulk approach for the aerosol (with entrainment) are represented in the third column. For the plots shown in the first three rows in Figs. 8 and 9, the value of κ is fixed to 0.1. The response of the sensitivities to changes in κ are not shown due to its smaller influence compared with the other parameters. The panels in the last row in Figs. 8 and 9 show SY(κ) at σa=1.9 and σa=1.5, for the cases with a bin and bulk treatment of the aerosol, respectively. The variations of SY(κ) due to changes in σa are similar to the variations due to , which is represented on the y axes of the figures.
The values of the aerosol parameters in the tests without bins for the aerosols (third column in Figs. 8 and 9) are usually lower than in the previously discussed tests. The reason for this is that, with this configuration, when the original values of the parameters are used, there is a very high nucleation rate that leads to unrealistic values of Nd and ends up destabilizing the model. This is reasonable, considering that once the aerosol is removed from activation, the remaining unactivated aerosols are spread over all sizes, perpetuating the conditions for droplet formation. At the same time, this permits clouds to develop under conditions where there would be a negligible nucleation rate if a bin treatment of the aerosol were employed.
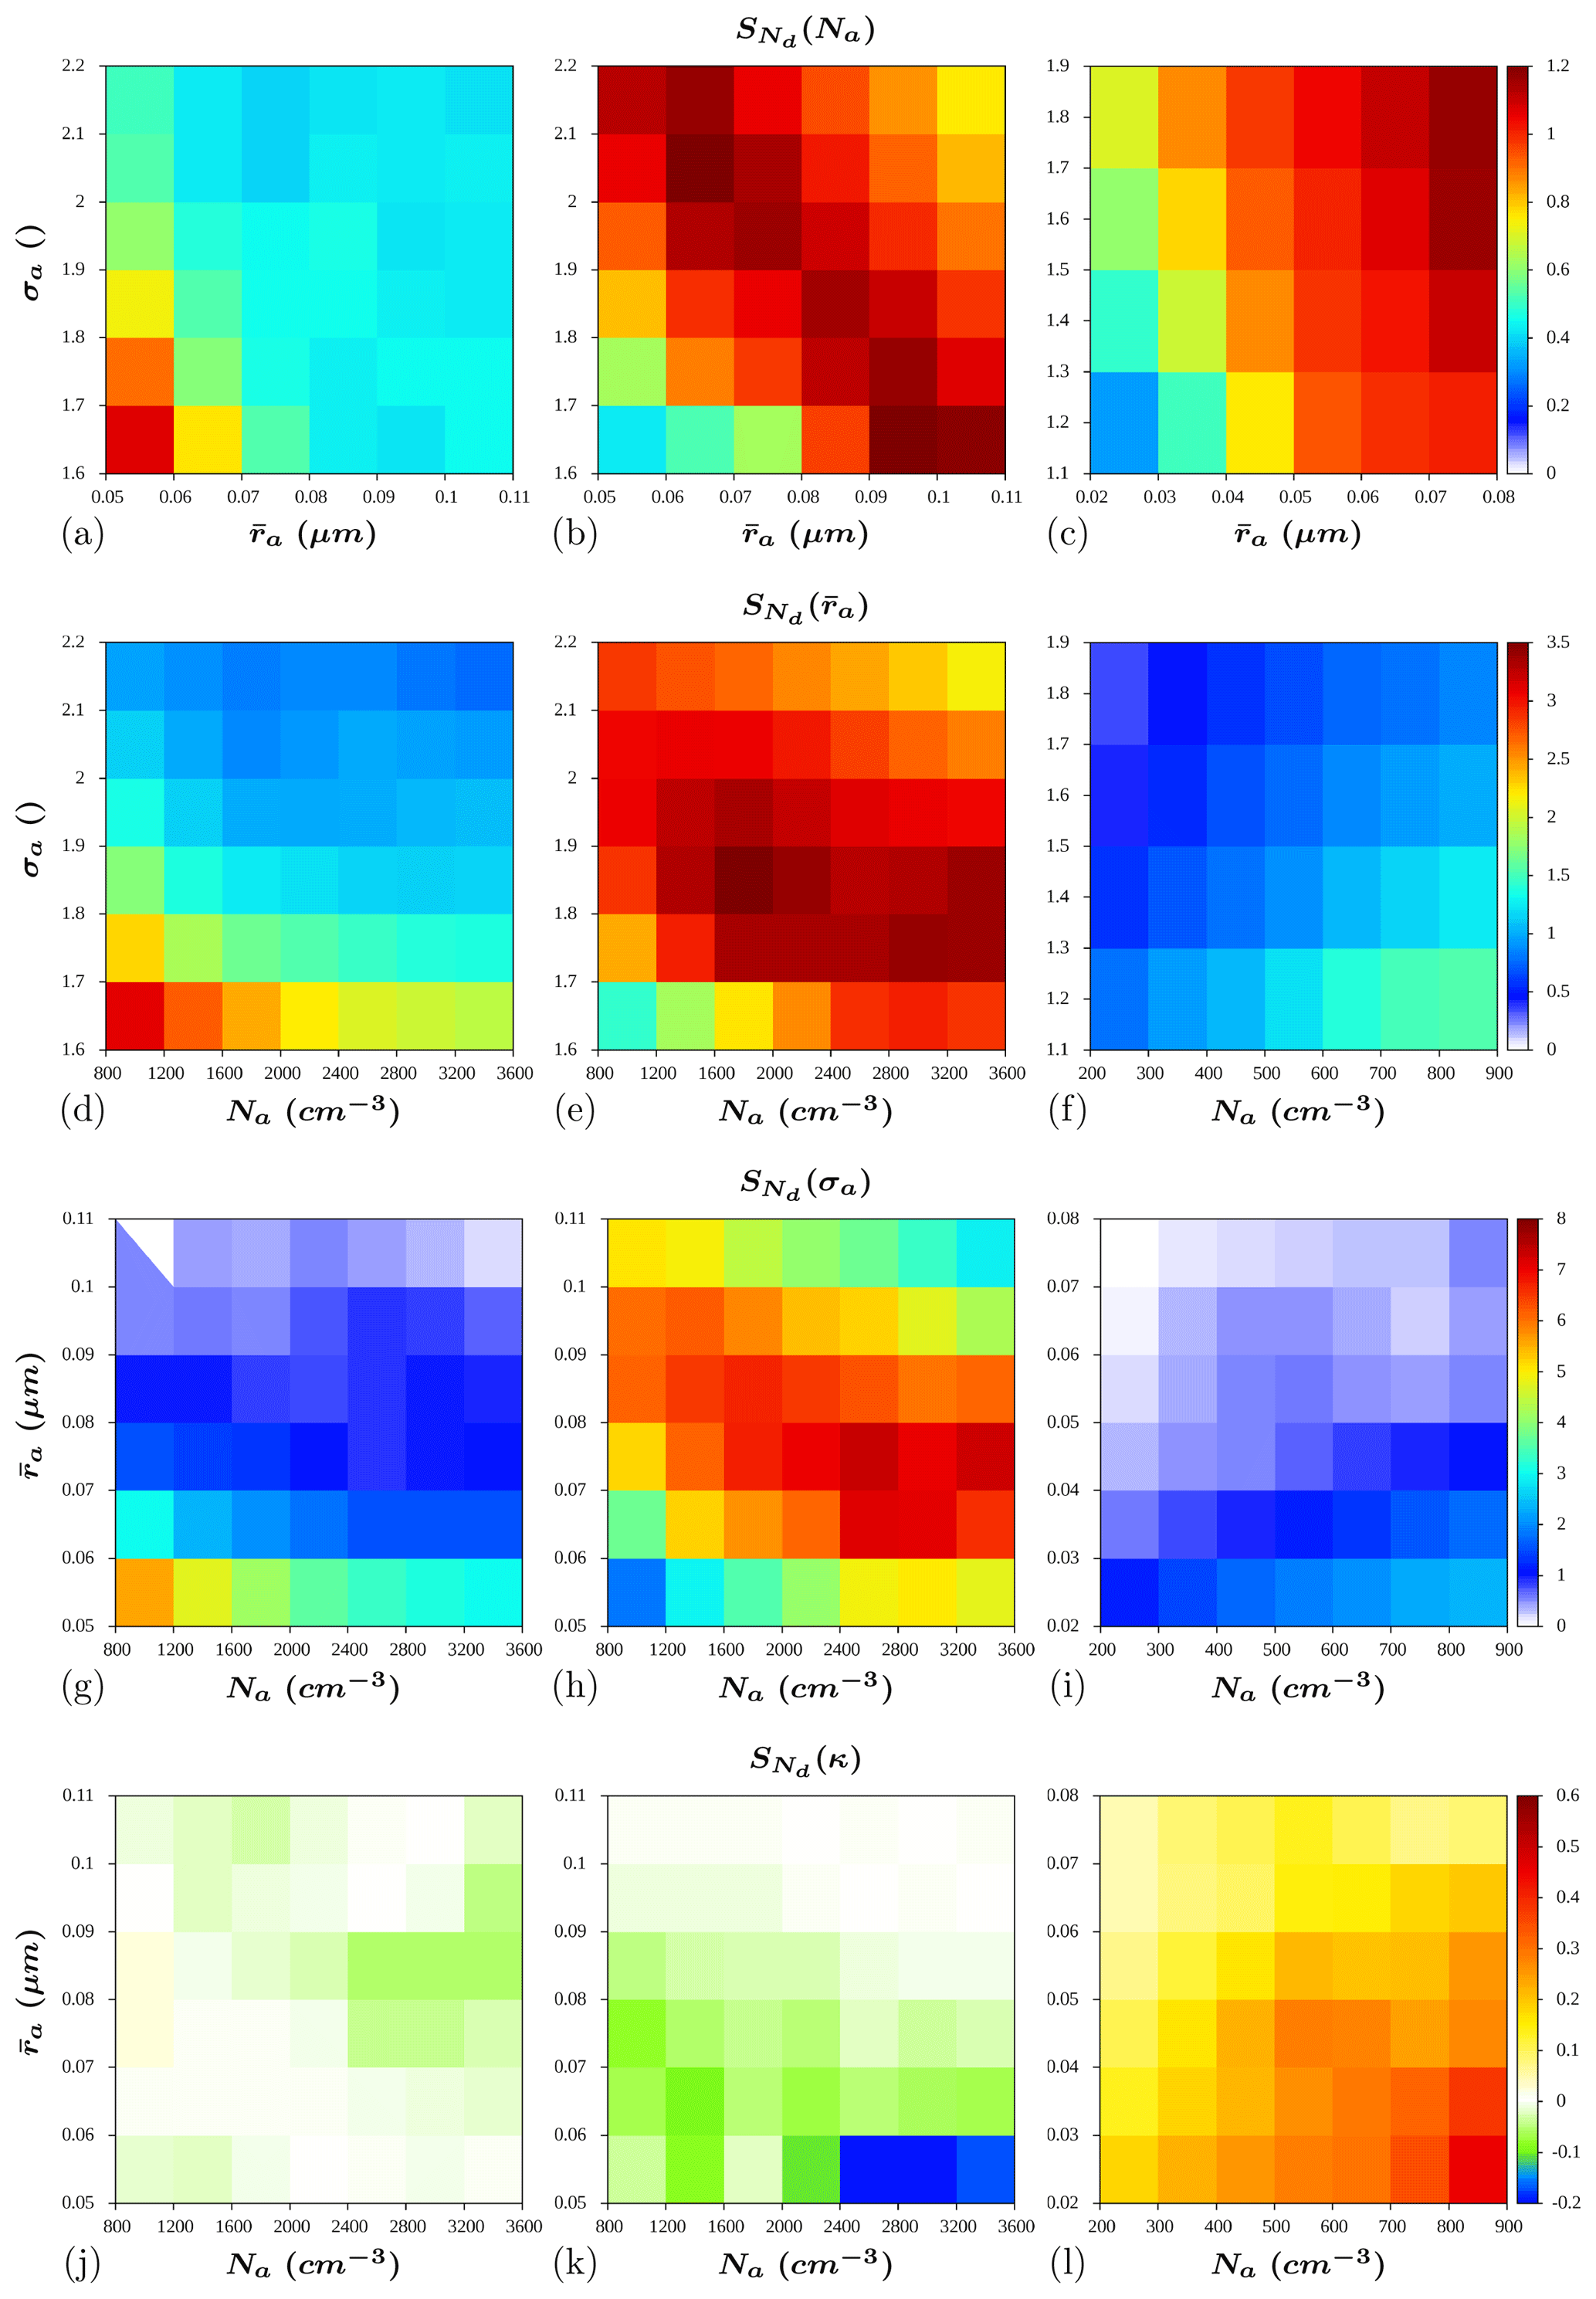
Figure 8Sensitivity of to the aerosol properties in three different configurations of the model: with entrainment and bins for the aerosols (a, d, g, j), without entrainment (b, e, h, k) and without bins for the aerosol (c, f, i, l).
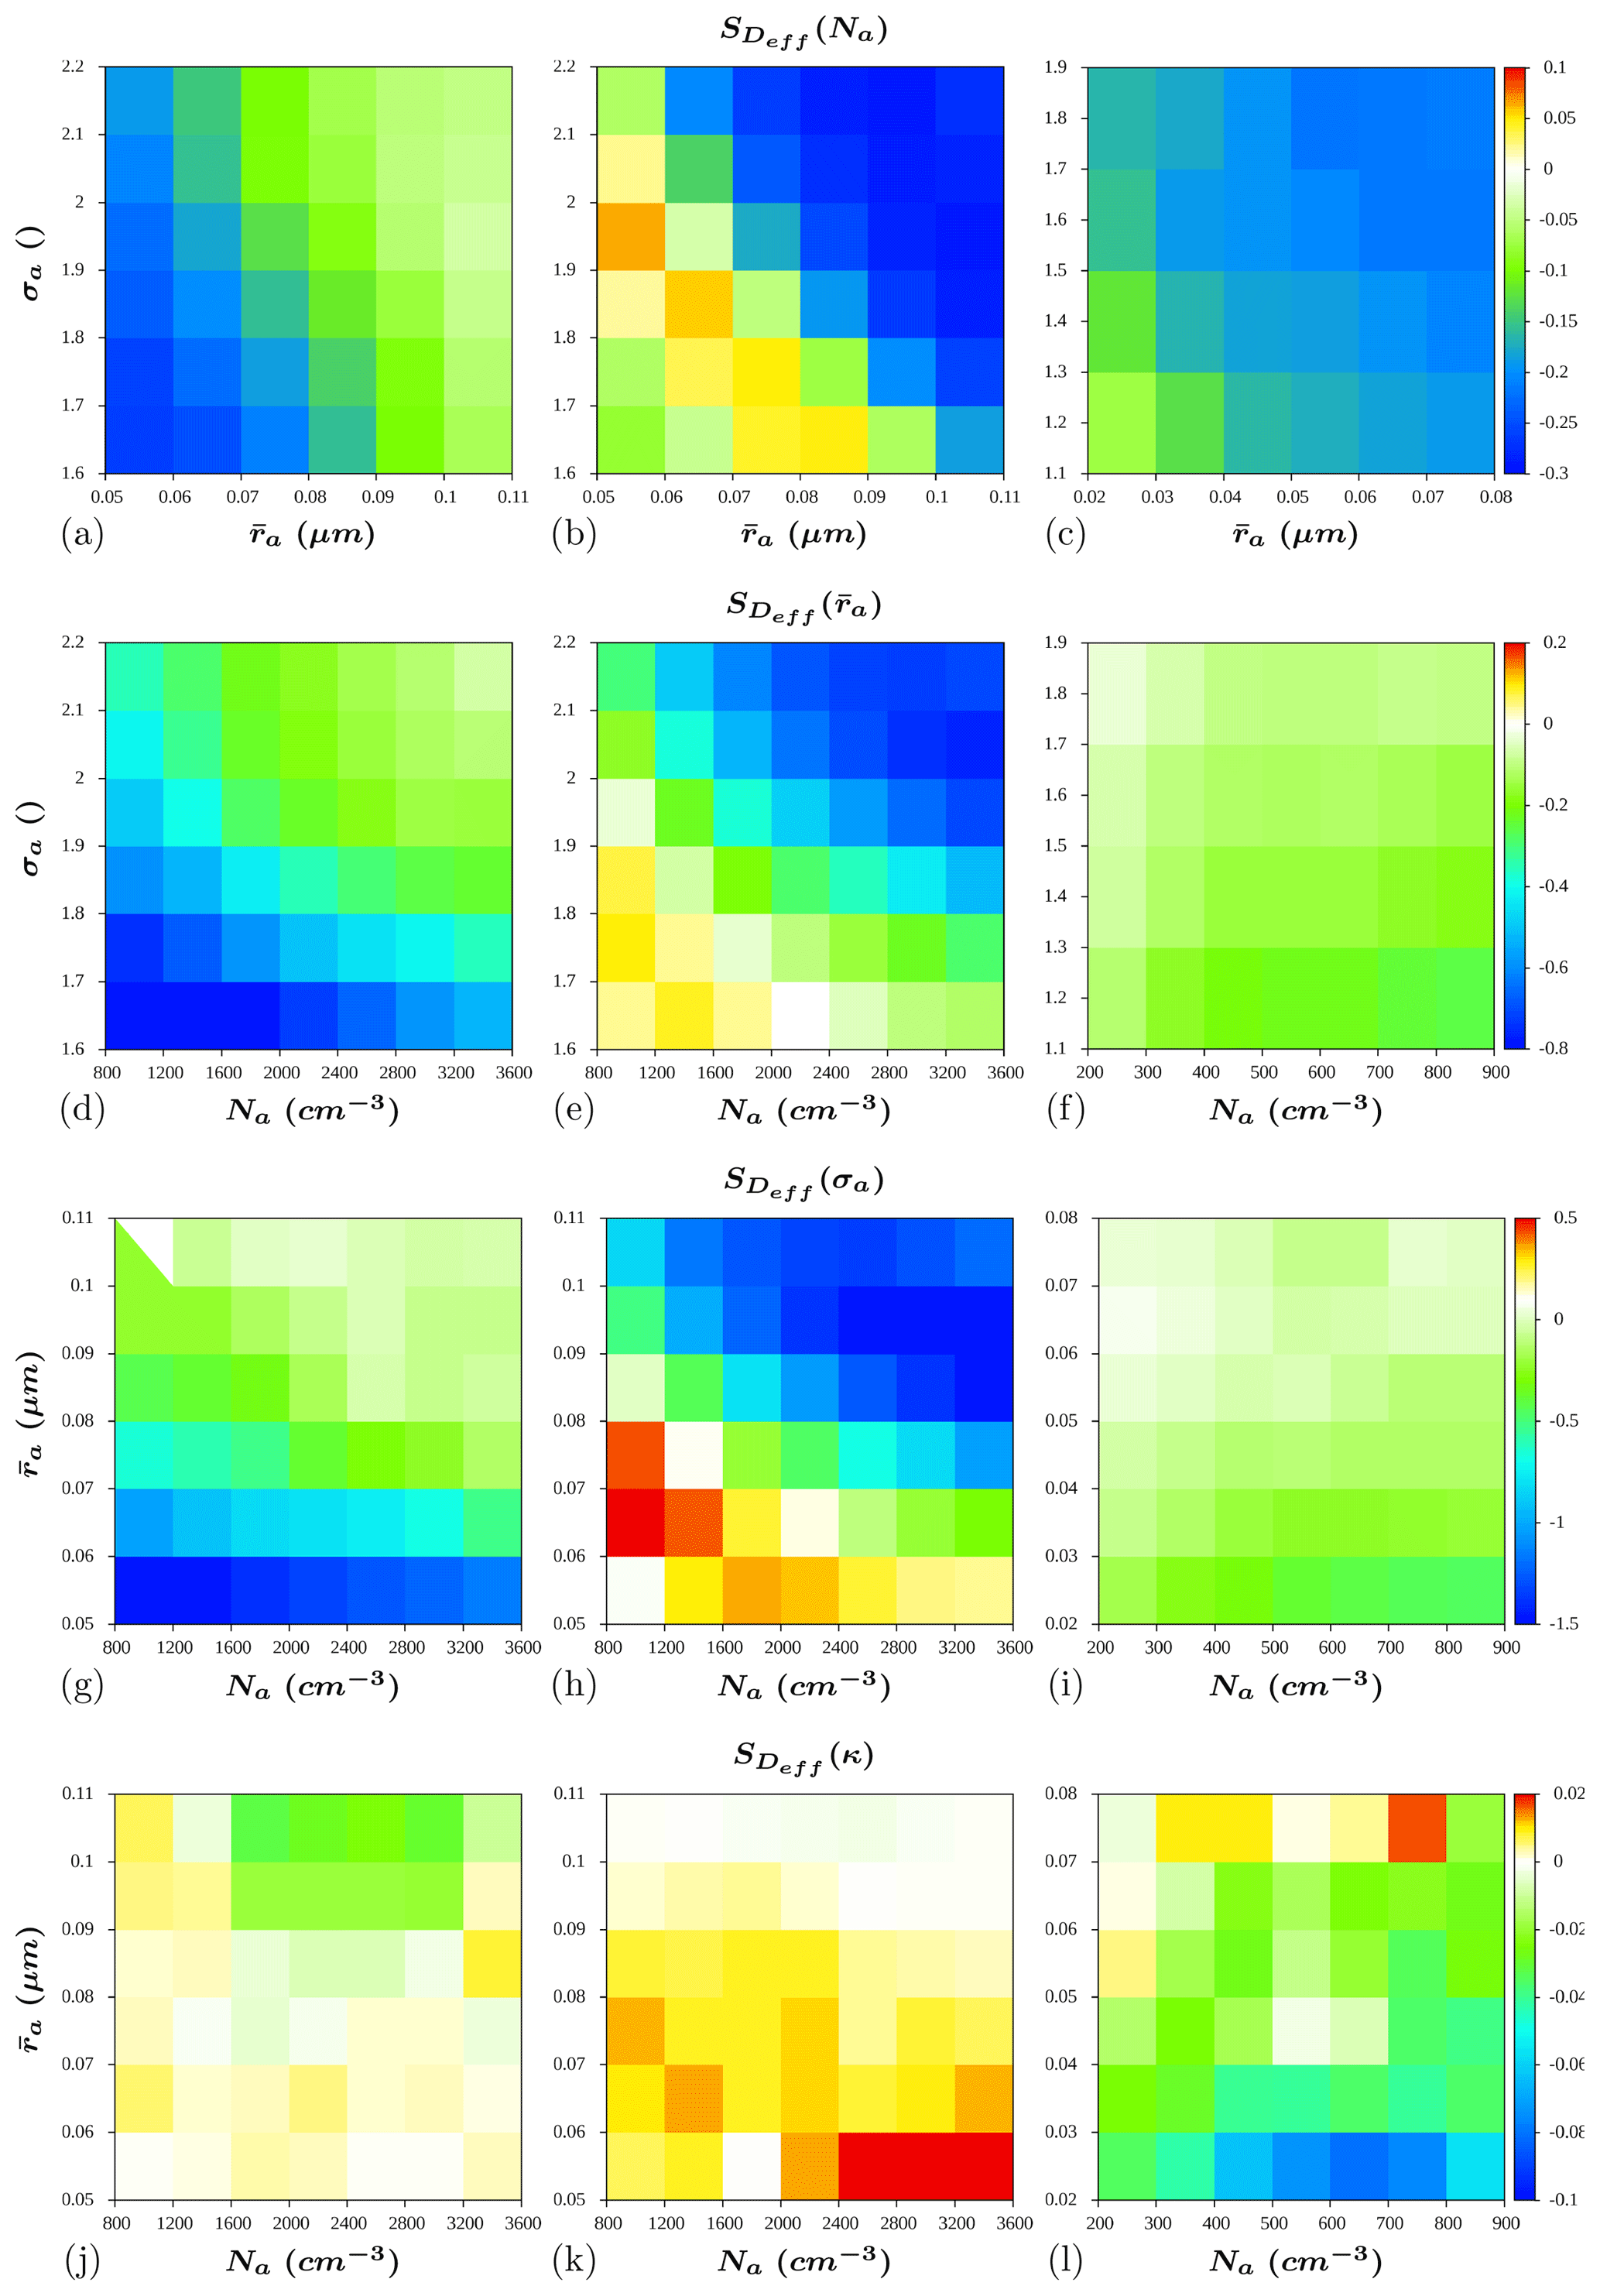
Figure 9Sensitivity of to the aerosol properties in three different configurations of the model: with entrainment and bins for the aerosols (a, d, g, j), without entrainment (b, e, h, k) and without bins for the aerosol (c, f, i, l).
Figure 8b, e, h and k show that, without entrainment, is lower for low values of Na, and σa, due to a faster depletion of the aerosols of suitable sizes for activation. A secondary decrease in the sensitivity is found in more polluted situations, with larger aerosols and wider sizes distributions. The latter effect is caused by the supersaturation depletion related to an increase in the amount of activating aerosols. This behavior contrasts with the responses in the entrainment case, where the lower supersaturations and the supply of additional aerosols from the environment enhance the water vapor depletion and inhibit the aerosol depletion effects.
When the entrainment is not considered, reaches very low absolute values or even positive values for an intermediate interval of the independent variables, and increases its absolute value otherwise (Fig. 9b). The same behavior is shown for and (Fig. 9e, h). The positive sensitivity evidences a less intense water vapor competition. At these points, increasing the Na, and/or σa will create more droplets, given the positive values of , and discussed above, increasing w by latent heat release, and in turn the supersaturation. Thus, if the increment in the number of droplets is not as intense as required to cause a significant water vapor depletion, all of the droplets will grow in the presence of such high supersaturations, thereby increasing Deff. Conversely, for the smallest values of Na, and σa, the sensitivity decreases its absolute value again or even becomes negative. In this situation, only the largest aerosols in the right tail of the PSD are activated. Larger drops have a slower rate of growth by condensation, and the collision–coalescence rate may also be decreased due to a lower variety of fall speeds. Thus, even at high supersaturations, the growth of these droplets can be slower. In addition, when Na is increased and the shape of the distribution is maintained, the largest increments in the amount of aerosol occur near the center of the PSD (mode values). Therefore, the leftmost sizes in the right tail will be favored, leading to a decrease in Deff after activation. If the droplet growth rate is not intense enough to balance this trend, it will result in negative sensitivity.
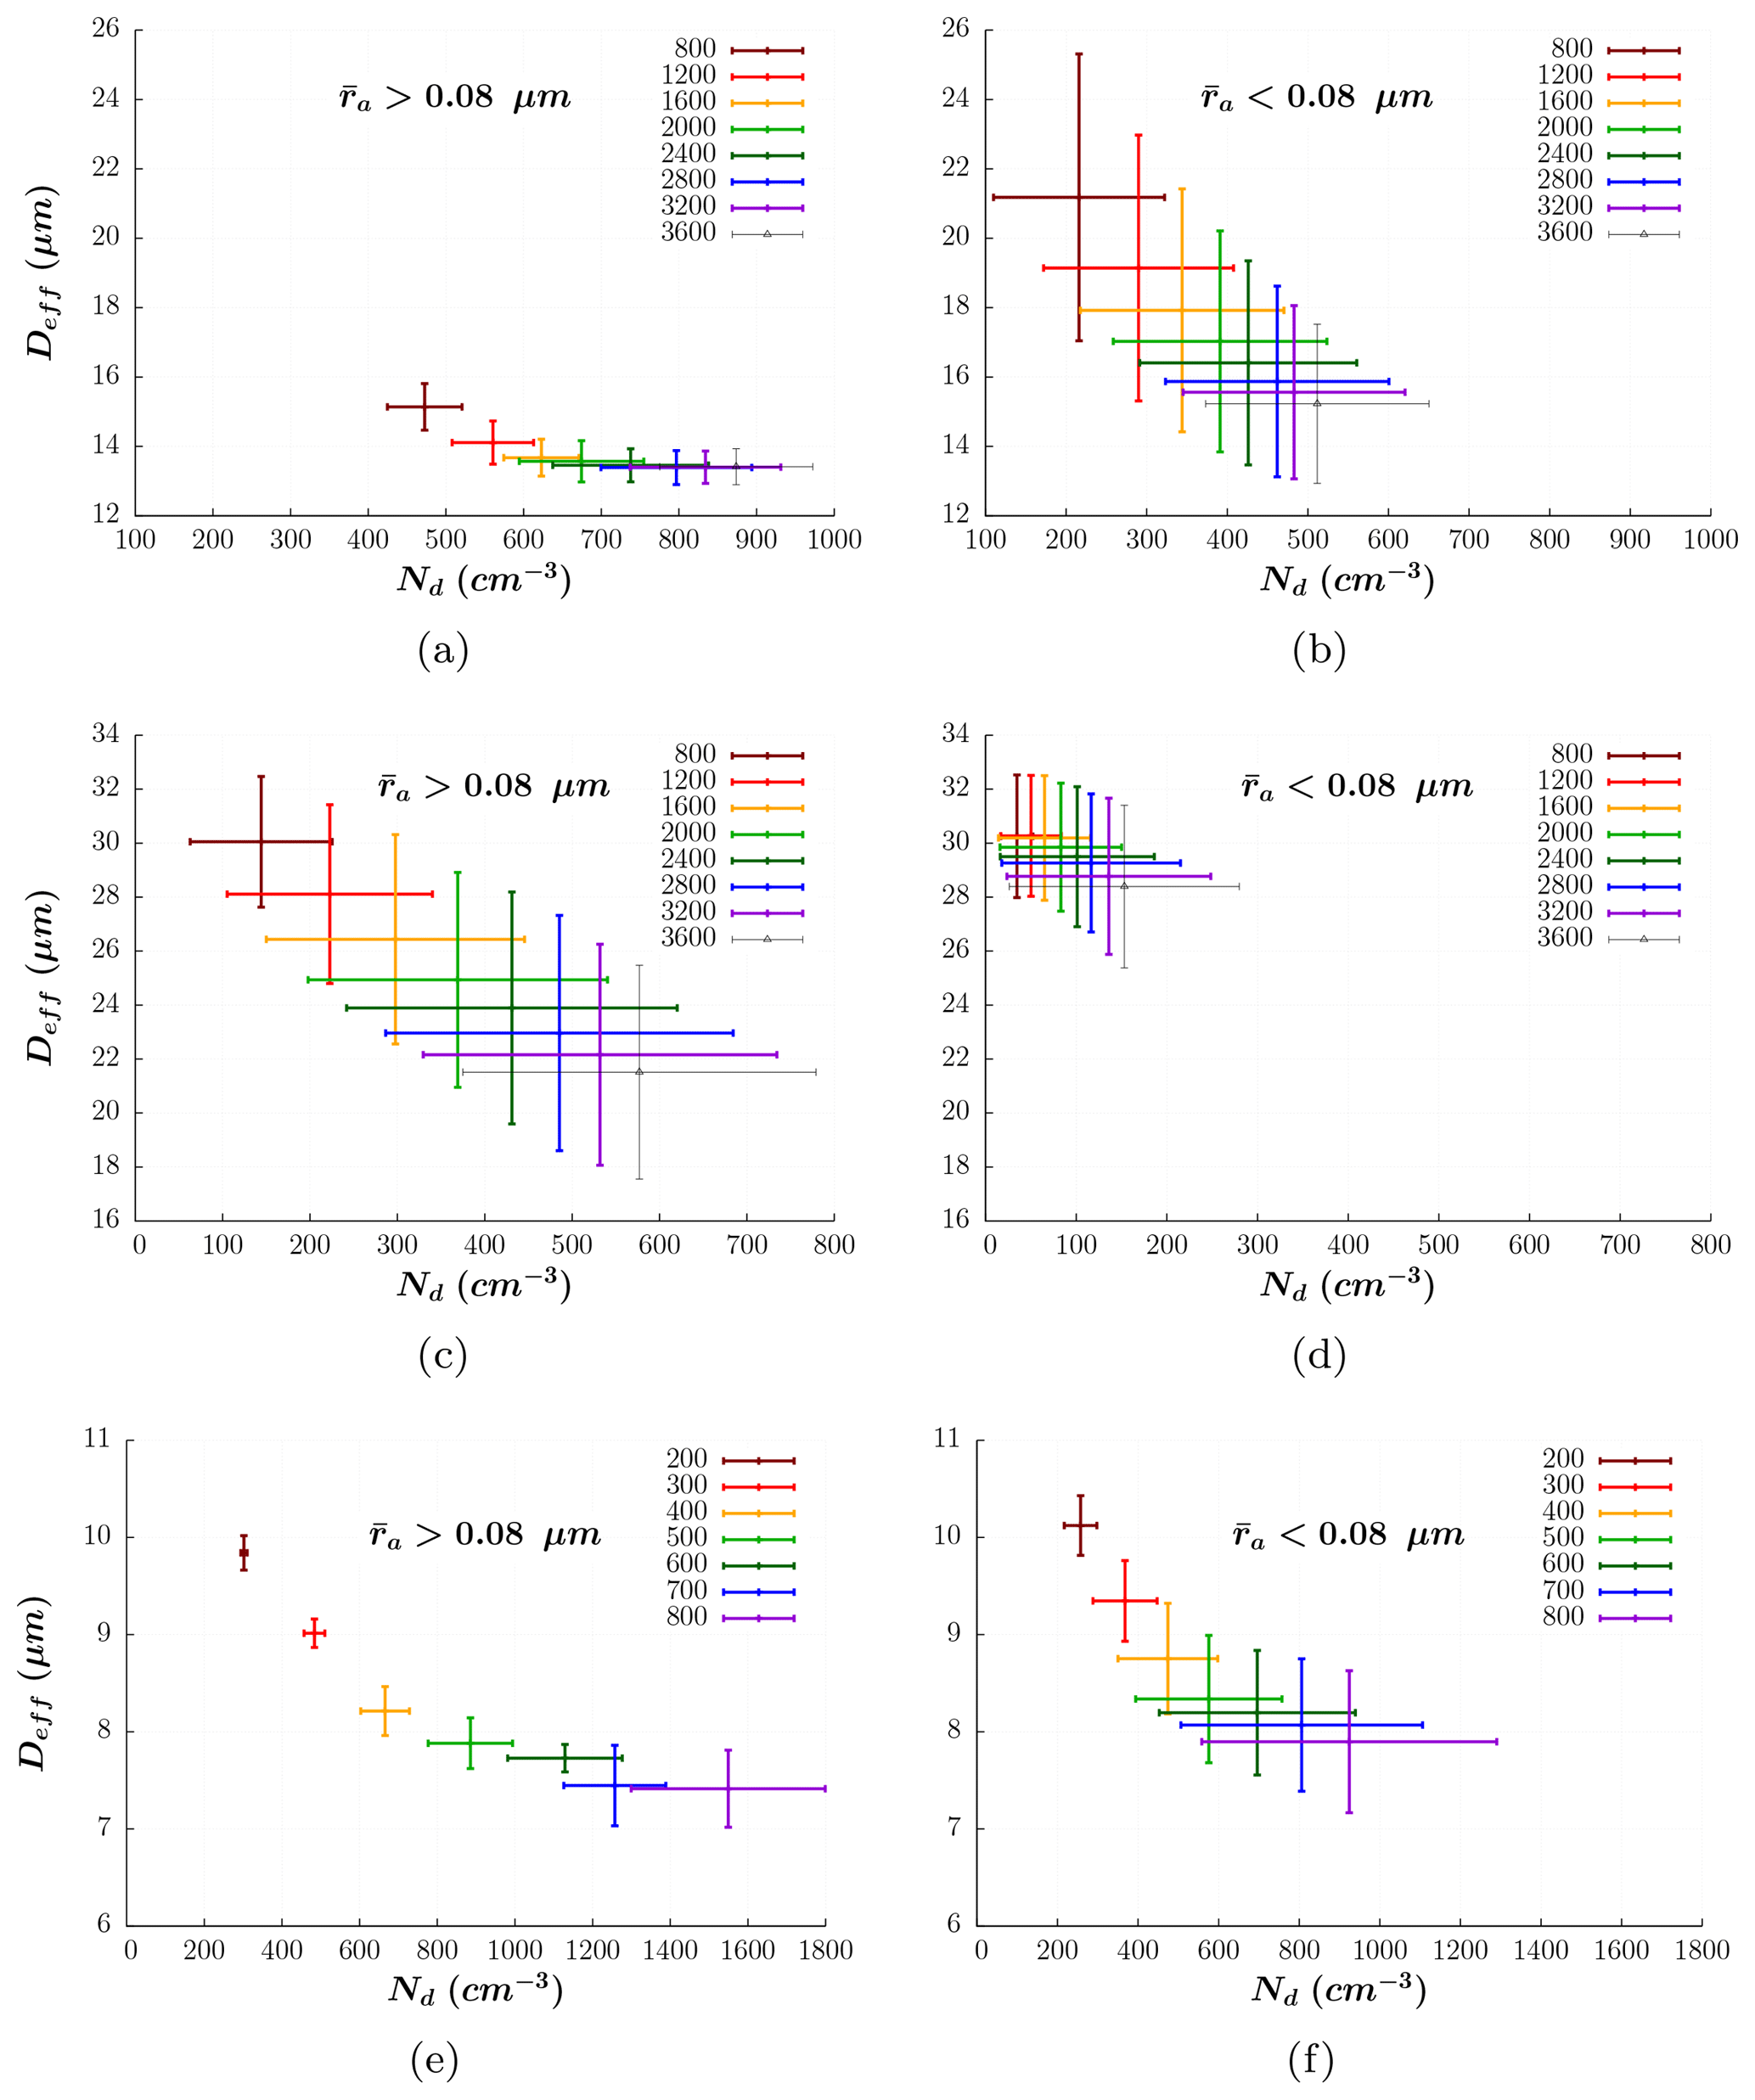
Figure 10Mean and standard deviation of and at cloud top from the simulations with entrainment and bins for the aerosols (a, b), without entrainment (c, d) and without bins for the aerosol (e, f).
In Figs. 8c and 9c it can be seen that, when a bulk approach is used for aerosols, the absolute value of SY(Na) increases monotonically as and σa increase and is not affected by the supersaturation depletion; this is due to that fact that independently of rc, there will always be a certain amount of aerosol such that r>rc.
Furthermore, the absolute value of increases for higher values of Na, which coincides with the results of Feingold (2003) and Rissman et al. (2004), and for lower values of σa (Figs. 8f, 9f). The same applies to SY(σa) (Figs. 8i, 9i), substituting σa by as the independent variable. However, the maximum value of the sensitivity to the size-related parameters is significantly decreased compared with the simulations with a bin treatment of the aerosol. even reaches slightly negatives values for the larger in these tests (not shown), which is related to the previously mentioned variations in the effect of σa depending on the position of rc with respect to the size distribution function.
Finally, it can be observed in Figs. 8l and 9l that, when the model uses a bulk approach for aerosol species, SY(κ) is larger for higher Na and smaller , which is in agreement with the results of Ward et al. (2010). The figures evidence that and are much more sensitive to κ when considering a bulk approach for the aerosols than when its size distribution is explicitly represented in the model. Note that, in the former case, SY(κ) can be about 50 % of SY(Na), which is a significant influence. However, perhaps the most relevant difference between these simulations and those using bins for the aerosol is the change in the sign of SY(κ). Although, at first, higher values of κ would determine a smaller rc, it also contributes to a faster depletion of the larger aerosols, leading to a reduction in the nucleation rate afterward. That is the cause of the negative (positive) values of () obtained in the tests using bins for the aerosol (Figs. 8k, 9k). Conversely, the latter has no effect on the results when the PSD is fixed, and, therefore, positive (negative) values of () are obtained.
Overall, our analysis shows that increases in Na, and σa produce higher (positive sensitivity) and smaller (negative sensitivity) when both entrainment and aerosol bins are included in the simulations. This coincides with the results of Cecchini et al. (2017), who found cloud-top averages of and of 0.84 and −0.25, respectively, from aircraft measurements over the Amazon forest.
The values of sensitivities reported by Feingold (2003), Reutter et al. (2009), and Ward et al. (2010) are included in the range of sensitivities obtained here, in addition to the variability added by the diverse universe of situations found over the aerosol parameter space. However, comparisons between our results and previous research are not straightforward, considering the influence of the cloud evolution here. For example, the rate of depletion of the aerosol and the water vapor will determine how much nucleation will occur above cloud base. A large supersaturation can initially cause a fast activation rate, but will decrease the intensity of this process afterwards. The response to changes in the aerosol properties in this case might be different from a case with a moderate and more spatially distributed activation rate. In the simulations with a bulk treatment of the aerosol, the aerosol depletion is slower. Thus, for a certain time interval, each cloud-top level behaves like an independent cloud base regarding the intensity of the nucleation. This explains the similarities between the sensitivities obtained from the simulations using a bulk approach for the aerosols and those from previous research.
From our analysis, it turns out that is the most influential parameter that determines the sensitivity to aerosols at cloud top, in contrast with the importance that has been conventionally attributed to the Na. To further illustrate this, Fig. 10 shows the mean and standard deviation of and for each value of Na tested, in each of the above referenced situations: with entrainment and bins for aerosols (a–b), without entrainment (c–d) and without bins for aerosols (e–f). The length of the standard deviation bars reflects the changes in , σa and κ.
For the first (and most complete) situation considered, it can be seen that the state of the system is not sufficiently determined by Na, especially if the PSD is displaced to smaller radii (Fig. 10b). For instance, when increasing Na by a factor of 3 in Fig. 10b, from 800 to 2400 cm−3, there is still some overlapping between the corresponding standard deviation bars in the phase space. However, the bars are significantly smaller if larger aerosols are considered (Fig. 10a), indicating a tendency to approach the generally accepted knowledge, i.e., increasing the importance of Na in determining the characteristics of the DSDs. These results highlight the importance of including the PSD characteristics in aerosol–cloud interaction studies, especially when µm. These parameters can produce changes in the DSD as large as those caused by changes in the Na. These findings are also relevant given the current discussion about the importance of ultrafine aerosol particles in the development of deep convective clouds over the Amazon (Wang et al., 2016; Fan et al., 2018).
In turn, Fig. 10c–d show that, when the entrainment is not considered in the model, the variability of and does not present a significant dependence on the aerosol size; it is a function of and on their own. In other words, the location of the points in the phase space determines their standard deviation. Points located in the upper left corner in Fig. 10c, for instance, have approximately the same standard deviation as points in the same location in Fig. 10d. The difference between both graphics resides in the position of the points: for smaller aerosols (Fig. 10d), will be lower and will be higher, than for large aerosols (Fig. 10c).
Conversely, the results indicate that the importance of Na may be overestimated if a bulk treatment of the aerosol is employed (Fig. 10e–f). In this case, it can be seen that there is a reduction of the overlap between the standard deviation bars, especially for larger and sparser aerosols.
The simulations performed here represent an idealized cloud resulting from observed humidity and temperature profiles. However, even if we assume that it represents a realizable situation, corresponding to an average behavior, it does not include the variety of possibilities existing in real cases. Important processes such as turbulent entrainment and dynamic feedbacks can introduce a significant departure from the idealization we are considering. Full dynamical models account for dynamics feedbacks and several subgrid processes that could enhance or reduce the range of sensitivities that are demonstrated here. Nevertheless, the qualitative behavior of our main results, i.e., the dependency of the DSD sensitivity to the aerosol properties according to its position in the full parameter space, might not change. For example, Gettelman (2015) simulated several warm rain cases using the KiD model and climatological cases with a global model, utilizing a double-moment microphysics scheme, in order to analyze the sensitivity of the aerosol–cloud interaction to cloud microphysics. They found that the tests in the KiD model were consistent with the global sensitivity tests. This is an aspect we intend to study in a following work, in order to build on the present results.
We illustrated the influence of the aerosol number concentration, the median radius and geometric standard deviation of the PSD, in addition to the hygroscopicity of the aerosols on the number concentration and effective diameter of droplets at the top of warm-phase clouds for initial conditions typical of the Amazon. The sensitivities behaved in according to the relation between the supersaturation and the aerosol availability, which determine the rate of aerosol activation, as described by Reutter et al. (2009). Nevertheless, in our analysis, the intensity of the droplet activation is mostly determined by the amount of suitable-sized aerosols, i.e., the shape and median radius of the PSD, rather than on the total number concentration of aerosols.
We showed that the sensitivity to each aerosol characteristic varies as a function of the parameter tested and its value depends on the base value of the other parameters. The median radius of the aerosols is the most important parameter, of those analyzed, which influences the sensitivity to the other parameters. This expands on the result of Ward et al. (2010) and states that w∕Na, or supersaturation-based regimes (Reutter et al., 2009), cannot fully predict the dependence of CCN activity, not only on the aerosol composition, but on all aerosol characteristics.
Given the tested variations in the aerosol properties, the responses of the DSDs depend on the model assumptions regarding the entrainment and the treatment of the aerosol size distribution. This reinforces the importance of carefully considering the characteristics of the model when analyzing the responses to changes in aerosol loading in global or regional studies.
Overall, when nucleation is favored, an increase in the droplet number concentration is accompanied by a decrease in the droplet effective diameter. However, as our sensitivity analysis involves the evolution of the cloud top with time and height, the results are not directly comparable with previously reported sensitivity calculations at cloud base. When a series of consecutive nucleation events is considered, such as those during the evolution of the cloud top, the intensity of the nucleation at a certain time can modulate its intensity afterwards. The simulation with a bulk treatment of the aerosols constitutes an extreme case of slow aerosol depletion, where the responses of the nucleation to changes in the aerosol properties can impact the cloud top in a more homogeneous way. That is the reason for the agreement in the sensitivity obtained from those simulations and previous cloud-base sensitivity calculations.
The code for the modifications introduced in the KiD model, as well as in the TAU scheme, can be made available upon request from the corresponding author.
LHP performed the model simulations, the model–data analysis and prepared the paper. LATM and MAC provided guidance regarding the definition of the model initial conditions. LATM, MAC and MSG provided guidance regarding the choice of the variables and the interval of values and the model–data analysis. All authors contributed to the design of the study and the preparation of the paper.
The authors declare that they have no conflict of interest.
This research has been supported by the São Paulo Research Foundation (grant nos. 2015/14497-0, 2016/24562-6, and 2017/04654-6).
This paper was edited by Barbara Ervens and reviewed by two anonymous referees.
Albrecht, B. A.: Aerosols, Cloud Microphysics, and Fractional Cloudiness, Science, 245, 1227–1230, https://doi.org/10.1126/science.245.4923.1227, 1989. a
Altaratz, O., Koren, I., Reisin, T., Kostinski, A., Feingold, G., Levin, Z., and Yin, Y.: Aerosols' influence on the interplay between condensation, evaporation and rain in warm cumulus cloud, Atmos. Chem. Phys., 8, 15–24, https://doi.org/10.5194/acp-8-15-2008, 2008. a
Andreae, M. O., Rosenfeld, D., Artaxo, P., Costa, A. A., Frank, G. P., Longo, K. M., and Silva-Dias, M. A. F.: Smoking Rain Clouds over the Amazon, Science, 303, 1337–1342, https://doi.org/10.1126/science.1092779, 2004. a, b
Andreae, M. O., Afchine, A., Albrecht, R., Holanda, B. A., Artaxo, P., Barbosa, H. M. J., Borrmann, S., Cecchini, M. A., Costa, A., Dollner, M., Fütterer, D., Järvinen, E., Jurkat, T., Klimach, T., Konemann, T., Knote, C., Krämer, M., Krisna, T., Machado, L. A. T., Mertes, S., Minikin, A., Pöhlker, C., Pöhlker, M. L., Pöschl, U., Rosenfeld, D., Sauer, D., Schlager, H., Schnaiter, M., Schneider, J., Schulz, C., Spanu, A., Sperling, V. B., Voigt, C., Walser, A., Wang, J., Weinzierl, B., Wendisch, M., and Ziereis, H.: Aerosol characteristics and particle production in the upper troposphere over the Amazon Basin, Atmos. Chem. Phys., 18, 921–961, https://doi.org/10.5194/acp-18-921-2018, 2018. a
Anttila, T. and Kerminen, V.-M.: On the contribution of Aitken mode particles to cloud droplet populations at continental background areas – a parametric sensitivity study, Atmos. Chem. Phys., 7, 4625–4637, https://doi.org/10.5194/acp-7-4625-2007, 2007. a
Braga, R. C., Rosenfeld, D., Weigel, R., Jurkat, T., Andreae, M. O., Wendisch, M., Pöschl, U., Voigt, C., Mahnke, C., Borrmann, S., Albrecht, R. I., Molleker, S., Vila, D. A., Machado, L. A. T., and Grulich, L.: Further evidence for CCN aerosol concentrations determining the height of warm rain and ice initiation in convective clouds over the Amazon basin, Atmos. Chem. Phys., 17, 14433–14456, https://doi.org/10.5194/acp-17-14433-2017, 2017. a, b
Cecchini, M. A., Machado, L. A. T., Comstock, J. M., Mei, F., Wang, J., Fan, J., Tomlinson, J. M., Schmid, B., Albrecht, R., Martin, S. T., and Artaxo, P.: Impacts of the Manaus pollution plume on the microphysical properties of Amazonian warm-phase clouds in the wet season, Atmos. Chem. Phys., 16, 7029–7041, https://doi.org/10.5194/acp-16-7029-2016, 2016. a
Cecchini, M. A., Machado, L. A. T., Andreae, M. O., Martin, S. T., Albrecht, R. I., Artaxo, P., Barbosa, H. M. J., Borrmann, S., Fütterer, D., Jurkat, T., Mahnke, C., Minikin, A., Molleker, S., Pöhlker, M. L., Pöschl, U., Rosenfeld, D., Voigt, C., Weinzierl, B., and Wendisch, M.: Sensitivities of Amazonian clouds to aerosols and updraft speed, Atmos. Chem. Phys., 17, 10037–10050, https://doi.org/10.5194/acp-17-10037-2017, 2017. a, b, c
Cubison, M. J., Ervens, B., Feingold, G., Docherty, K. S., Ulbrich, I. M., Shields, L., Prather, K., Hering, S., and Jimenez, J. L.: The influence of chemical composition and mixing state of Los Angeles urban aerosol on CCN number and cloud properties, Atmos. Chem. Phys., 8, 5649–5667, https://doi.org/10.5194/acp-8-5649-2008, 2008. a
Dusek, U., Frank, G. P., Hildebrandt, L., Curtius, J., Schneider, J., Walter, S., Chand, D., Drewnick, F., Hings, S., Jung, D., Borrmann, S., and Andreae, M. O.: Size Matters More Than Chemistry for Cloud-Nucleating Ability of Aerosol Particles, Science, 312, 1375–1378, https://doi.org/10.1126/science.1125261, 2006. a
Ervens, B., Feingold, G., and Kreidenweis, S. M.: Influence of water-soluble organic carbon on cloud drop number concentration, J. Geophys. Res.-Atmos., 110, 1–14, https://doi.org/10.1029/2004JD005634, 2005. a
Ervens, B., Cubison, M., Andrews, E., Feingold, G., Ogren, J. A., Jimenez, J. L., DeCarlo, P., and Nenes, A.: Prediction of cloud condensation nucleus number concentration using measurements of aerosol size distributions and composition and light scattering enhancement due to humidity, J. Geophys. Res.-Atmos., 112, 1–15, https://doi.org/10.1029/2006JD007426, 2007. a
Fan, J., Zhang, R., Li, G., Tao, W.-K., and Li, X.: Simulations of cumulus clouds using a spectral microphysics cloud-resolving model, J. Geophys. Res.-Atmos., 112, 1–14, https://doi.org/10.1029/2006JD007688, 2007. a
Fan, J., Rosenfeld, D., Zhang, Y., Giangrande, S. E., Li, Z., Machado, L. A. T., Martin, S. T., Yang, Y., Wang, J., Artaxo, P., Barbosa, H. M. J., Braga, R. C., Comstock, J. M., Feng, Z., Gao, W., Gomes, H. B., Mei, F., Pöhlker, C., Pöhlker, M. L., Pöschl, U., and de Souza, R. A. F.: Substantial convection and precipitation enhancements by ultrafine aerosol particles, Science, 359, 411–418, https://doi.org/10.1126/science.aan8461, 2018. a, b
Feingold, G.: Modeling of the first indirect effect: Analysis of measurement requirements, Geophys. Res. Lett., 30, 1–4, https://doi.org/10.1029/2003GL017967, 2003. a, b, c, d, e, f, g, h
Feingold, G., Tzivion, S., and Leviv, Z.: Evolution of Raindrop Spectra. Part I: Solution to the Stochastic Collection/Breakup Equation Using the Method of Moments, J. Atmos. Sci., 45, 3387–3399, https://doi.org/10.1175/1520-0469(1988)045<3387:EORSPI>2.0.CO;2, 1988. a, b, c
Freud, E., Rosenfeld, D., and Kulkarni, J. R.: Resolving both entrainment-mixing and number of activated CCN in deep convective clouds, Atmos. Chem. Phys., 11, 12887–12900, https://doi.org/10.5194/acp-11-12887-2011, 2011. a
Gettelman, A.: Putting the clouds back in aerosol–cloud interactions, Atmos. Chem. Phys., 15, 12397–12411, https://doi.org/10.5194/acp-15-12397-2015, 2015. a
Gonçalves, W. A., Machado, L. A. T., and Kirstetter, P.-E.: Influence of biomass aerosol on precipitation over the Central Amazon: an observational study, Atmos. Chem. Phys., 15, 6789–6800, https://doi.org/10.5194/acp-15-6789-2015, 2015. a
Gunthe, S. S., King, S. M., Rose, D., Chen, Q., Roldin, P., Farmer, D. K., Jimenez, J. L., Artaxo, P., Andreae, M. O., Martin, S. T., and Pöschl, U.: Cloud condensation nuclei in pristine tropical rainforest air of Amazonia: size-resolved measurements and modeling of atmospheric aerosol composition and CCN activity, Atmos. Chem. Phys., 9, 7551–7575, https://doi.org/10.5194/acp-9-7551-2009, 2009. a, b
Heiblum, R. H., Altaratz, O., Koren, I., Feingold, G., Kostinski, A. B., Khain, A. P., Ovchinnikov, M., Fredj, E., Dagan, G., Pinto, L., Yaish, R., and Chen, Q.: Characterization of cumulus cloud fields using trajectories in the center of gravity versus water mass phase space: 2. Aerosol effects on warm convective clouds, J. Geophys. Res.-Atmos., 121, 6356–6373, https://doi.org/10.1002/2015JD024193, 2016. a
Hill, A., Dobbie, S., and Yin, Y.: The impact of aerosols on non-precipitating marine stratocumulus. I: Model description and prediction of the indirect effect, Quarterly Journal of the Royal Meteorological Society: A journal of the atmospheric sciences, Appl. Meteorol. Phys. Oceanogr., 134, 1143–1154, 2008. a, b
Hudson, J. G.: Variability of the relationship between particle size and cloud-nucleating ability, Geophys. Res. Lett., 34, 1–5 https://doi.org/10.1029/2006GL028850, 2007. a
Ivanova, E. T.: Method of parameterizing the condensation process of droplet growth in numerical models, Izv. Akad. Sci. USSR Atmos. Ocean Phys., 13, 821–826, 1977. a
Karydis, V. A., Capps, S. L., Russell, A. G., and Nenes, A.: Adjoint sensitivity of global cloud droplet number to aerosol and dynamical parameters, Atmos. Chem. Phys., 12, 9041–9055, https://doi.org/10.5194/acp-12-9041-2012, 2012. a
Khain, A., Rosenfeld, D., and Pokrovsky, A.: Aerosol impact on the dynamics and microphysics of deep convective clouds, Q. J. Roy. Meteor. Soc., 131, 2639–2663, https://doi.org/10.1256/qj.04.62, 2005. a
Kogan, Y., Khairoutdinov, M., Lilly, D., Kogan, Z., and Liu, Q.: Modeling of stratocumulus cloud layers in a large eddy simulation model with explicit microphysics, J. Atmos. Sci., 52, 2923–2940, 1995. a
Kogan, Y. L.: The simulation of a convective cloud in a 3-D model with explicit microphysics, Part I: Model description and sensitivity experiments, J. Atmos. Sci., 48, 1160–1189, 1991. a
Koren, I., Feingold, G., and Remer, L. A.: The invigoration of deep convective clouds over the Atlantic: aerosol effect, meteorology or retrieval artifact?, Atmos. Chem. Phys., 10, 8855–8872, https://doi.org/10.5194/acp-10-8855-2010, 2010. a
Lebo, Z. J. and Seinfeld, J. H.: A continuous spectral aerosol-droplet microphysics model, Atmos. Chem. Phys., 11, 12297–12316, https://doi.org/10.5194/acp-11-12297-2011, 2011. a
Lee, S. S., Donner, L. J., Phillips, V. T. J., and Ming, Y.: Examination of aerosol effects on precipitation in deep convective clouds during the 1997 ARM summer experiment, Q. J. Roy. Meteor. Soc., 134, 1201–1220, https://doi.org/10.1002/qj.287, 2008. a
Leroy, D., Wobrock, W., and Flossmann, A. I.: On the influence of the treatment of aerosol particles in different bin microphysical models: A comparison between two different schemes, Atmos. Res., 85, 269–287, https://doi.org/10.1016/j.atmosres.2007.01.003, 2007. a
Li, Z., Niu, F., Fan, J., Liu, Y., Rosenfeld, D., and Ding, Y.: Long-term impacts of aerosols on the vertical development of clouds and precipitation, Nat. Geosci., 4, 888–894, https://doi.org/10.1038/NGEO1313, 2011. a
Martin, S. T., Andreae, M. O., Artaxo, P., Baumgardner, D., Chen, Q., Goldstein, A. H., Guenther, A., Heald, C. L., Mayol-Bracero, O. L., McMurry, P. H., Pauliquevis, T., Pöschl, U., Prather, K. A., Roberts, G. C., Saleska, S. R., Silva Dias, M. A., Spracklen, D. V., Swietlicki, E., and Trebs, I.: Sources and properties of Amazonian aerosol particles, Rev. Geophys., 48, 1–42, https://doi.org/10.1029/2008RG000280, 2010. a
McFiggans, G., Artaxo, P., Baltensperger, U., Coe, H., Facchini, M. C., Feingold, G., Fuzzi, S., Gysel, M., Laaksonen, A., Lohmann, U., Mentel, T. F., Murphy, D. M., O'Dowd, C. D., Snider, J. R., and Weingartner, E.: The effect of physical and chemical aerosol properties on warm cloud droplet activation, Atmos. Chem. Phys., 6, 2593–2649, https://doi.org/10.5194/acp-6-2593-2006, 2006. a, b
Mechem, D. B. and Kogan, Y. L.: A Bulk Parameterization of Giant CCN, J. Atmos. Sci., 65, 2458–2466, https://doi.org/10.1175/2007JAS2502.1, 2008. a
Petters, M. D. and Kreidenweis, S. M.: A single parameter representation of hygroscopic growth and cloud condensation nucleus activity, Atmos. Chem. Phys., 7, 1961–1971, https://doi.org/10.5194/acp-7-1961-2007, 2007. a
Pinsky, M. and Khain, A.: Theoretical analysis of mixing in liquid clouds – Part IV: DSD evolution and mixing diagrams, Atmos. Chem. Phys., 18, 3659–3676, https://doi.org/10.5194/acp-18-3659-2018, 2018. a
Pinsky, M., Khain, A., Korolev, A., and Magaritz-Ronen, L.: Theoretical investigation of mixing in warm clouds – Part 2: Homogeneous mixing, Atmos. Chem. Phys., 16, 9255–9272, https://doi.org/10.5194/acp-16-9255-2016, 2016. a
Pöhlker, M. L., Pöhlker, C., Ditas, F., Klimach, T., Hrabe de Angelis, I., Araújo, A., Brito, J., Carbone, S., Cheng, Y., Chi, X., Ditz, R., Gunthe, S. S., Kesselmeier, J., Könemann, T., Lavrič, J. V., Martin, S. T., Mikhailov, E., Moran-Zuloaga, D., Rose, D., Saturno, J., Su, H., Thalman, R., Walter, D., Wang, J., Wolff, S., Barbosa, H. M. J., Artaxo, P., Andreae, M. O., and Pöschl, U.: Long-term observations of cloud condensation nuclei in the Amazon rain forest – Part 1: Aerosol size distribution, hygroscopicity, and new model parametrizations for CCN prediction, Atmos. Chem. Phys., 16, 15709–15740, https://doi.org/10.5194/acp-16-15709-2016, 2016. a
Pruppacher, H. R. and Klett, J. D.: Microphysics of Clouds and Precipitation: Reprinted 1980, Springer Science & Business Media, 2012. a, b
Quinn, P. K., Bates, T. S., Coffman, D. J., and Covert, D. S.: Influence of particle size and chemistry on the cloud nucleating properties of aerosols, Atmos. Chem. Phys., 8, 1029–1042, https://doi.org/10.5194/acp-8-1029-2008, 2008. a
Reid, J. S., Hobbs, P. V., Rangno, A. L., and Hegg, D. A.: Relationships between cloud droplet effective radius, liquid water content, and droplet concentration for warm clouds in Brazil embedded in biomass smoke, J. Geophys. Res.-Atmos., 104, 6145–6153, https://doi.org/10.1029/1998JD200119, 1999. a
Reisin, T. G., Yin, Y., Levin, Z., and Tzivion, S.: Development of giant drops and high-reflectivity cores in Hawaiian clouds: numerical simulations using a kinematic model with detailed microphysics, Atmos. Res., 45, 275–297, https://doi.org/10.1016/S0169-8095(97)00081-1, 1998. a
Reutter, P., Su, H., Trentmann, J., Simmel, M., Rose, D., Gunthe, S. S., Wernli, H., Andreae, M. O., and Pöschl, U.: Aerosol- and updraft-limited regimes of cloud droplet formation: influence of particle number, size and hygroscopicity on the activation of cloud condensation nuclei (CCN), Atmos. Chem. Phys., 9, 7067–7080, https://doi.org/10.5194/acp-9-7067-2009, 2009. a, b, c, d, e, f, g, h, i, j, k, l
Rissman, T. A., Nenes, A., and Seinfeld, J. H.: Chemical Amplification (or Dampening) of the Twomey Effect: Conditions Derived from Droplet Activation Theory, J. Atmos. Sci., 61, 919–930, https://doi.org/10.1175/1520-0469(2004)061<0919:CAODOT>2.0.CO;2, 2004. a
Roesler, E. L. and Penner, J. E.: Can global models ignore the chemical composition of aerosols?, Geophys. Res. Lett., 37, 1–5, https://doi.org/10.1029/2010GL044282, 2010. a
Rose, D., Nowak, A., Achtert, P., Wiedensohler, A., Hu, M., Shao, M., Zhang, Y., Andreae, M. O., and Pöschl, U.: Cloud condensation nuclei in polluted air and biomass burning smoke near the mega-city Guangzhou, China – Part 1: Size-resolved measurements and implications for the modeling of aerosol particle hygroscopicity and CCN activity, Atmos. Chem. Phys., 10, 3365–3383, https://doi.org/10.5194/acp-10-3365-2010, 2010. a
Rosenfeld, D., Lohmann, U., Raga, G. B., O'Dowd, C. D., Kulmala, M., Fuzzi, S., Reissell, A., and Andreae, M. O.: Flood or Drought: How Do Aerosols Affect Precipitation?, Science, 321, 1309–1313, https://doi.org/10.1126/science.1160606, 2008. a
Rotach, M. W. and Zardi, D.: On the boundary-layer structure over highly complex terrain: Key findings from MAP, Q. J. Roy. Meteor. Soc., 133, 937–948, https://doi.org/10.1002/qj.71, 2007. a
Sánchez Gácita, M., Longo, K. M., Freire, J. L. M., Freitas, S. R., and Martin, S. T.: Impact of mixing state and hygroscopicity on CCN activity of biomass burning aerosol in Amazonia, Atmos. Chem. Phys., 17, 2373–2392, https://doi.org/10.5194/acp-17-2373-2017, 2017. a
Seifert, A. and Beheng, K. D.: A two-moment cloud microphysics parameterization for mixed-phase clouds, Part 2: Maritime vs. continental deep convective storms, Meteorol. Atmos. Phys., 92, 67–82, https://doi.org/10.1007/s00703-005-0113-3, 2006. a
Shipway, B. J. and Hill, A. A.: Diagnosis of systematic differences between multiple parametrizations of warm rain microphysics using a kinematic framework, Q. J. Roy. Meteor. Soc., 138, 2196–2211, https://doi.org/10.1002/qj.1913, 2012. a
Stevens, B., Feingold, G., Cotton, W. R., and Walko, R. L.: Elements of the Microphysical Structure of Numerically Simulated Nonprecipitating Stratocumulus, J. Atmos. Sci., 53, 980–1006, https://doi.org/10.1175/1520-0469(1996)053<0980:EOTMSO>2.0.CO;2, 1996. a
Sun, J., Leighton, H., Yau, M. K., and Ariya, P.: Numerical evidence for cloud droplet nucleation at the cloud-environment interface, Atmos. Chem. Phys., 12, 12155–12164, https://doi.org/10.5194/acp-12-12155-2012, 2012. a
Twomey, S.: Pollution and the planetary albedo, Atmos. Enviro., 8, 1251–1256, https://doi.org/10.1016/0004-6981(74)90004-3, 1974. a
Tzivion, S., Feingold, G., and Levin, Z.: An Efficient Numerical Solution to the Stochastic Collection Equation, J. Atmos. Sci., 44, 3139–3149, https://doi.org/10.1175/1520-0469(1987)044<3139:AENSTT>2.0.CO;2, 1987. a, b, c, d
Tzivion, S., Feingold, G., and Levin, Z.: The Evolution of Raindrop Spectra, Part II: Collisional Collection/Breakup and Evaporation in a Rainshaft, J. Atmos. Sci., 46, 3312–3328, https://doi.org/10.1175/1520-0469(1989)046<3312:TEORSP>2.0.CO;2, 1989. a, b, c
Wang, J., Krejci, R., Giangrande, S., Kuang, C., Barbosa, H. M. J., Brito, J., Carbone, S., Chi, X., Comstock, J., Ditas, F., Lavric, J., Manninen, H. E., Mei, F., Moran-Zuloaga, D., Pöhlker, C., Pöhlker, M. L., Saturno, J., Schmid, B., Souza, R. A. F., Springston, S. R., Tomlinson, J. M., Toto, T., Walter, D., Wimmer, D., Smith, J. N., Kulmala, M., Machado, L. A. T., Artaxo, P., Andreae, M. O., Petäjä, T., and Martin, S. T.: Amazon boundary layer aerosol concentration sustained by vertical transport during rainfall, Nature, 539, 416–419, https://doi.org/10.1038/nature19819, 2016. a, b
Ward, D. S., Eidhammer, T., Cotton, W. R., and Kreidenweis, S. M.: The role of the particle size distribution in assessing aerosol composition effects on simulated droplet activation, Atmos. Chem. Phys., 10, 5435–5447, https://doi.org/10.5194/acp-10-5435-2010, 2010. a, b, c, d, e, f, g, h, i
Yin, Y., Levin, Z., Reisin, T., and Tzivion, S.: Seeding Convective Clouds with Hygroscopic Flares: Numerical Simulations Using a Cloud Model with Detailed Microphysics, J. Appl. Meteorol., 39, 1460–1472, https://doi.org/10.1175/1520-0450(2000)039<1460:SCCWHF>2.0.CO;2, 2000a. a, b
Yin, Y., Levin, Z., Reisin, T. G., and Tzivion, S.: The effects of giant cloud condensation nuclei on the development of precipitation in convective clouds – a numerical study, Atmos. Res., 53, 91–116, https://doi.org/10.1016/S0169-8095(99)00046-0, 2000b. a, b
Yin, Y., Carslaw, K. S., and Feingold, G.: Vertical transport and processing of aerosols in a mixed-phase convective cloud and the feedback on cloud development, Q. J. Roy. Meteor. Soc., 131, 221–245, https://doi.org/10.1256/qj.03.186, 2005. a