the Creative Commons Attribution 4.0 License.
the Creative Commons Attribution 4.0 License.
 | 06 Jun 2019
New particle formation events observed at King Sejong Station, Antarctic Peninsula – Part 1: Physical characteristics and contribution to cloud condensation nuclei
Jaeseok Kim
Young Jun Yoon
Yeontae Gim
Jin Hee Choi
Hyo Jin Kang
Ki-Tae Park
Jiyeon Park
Bang Yong Lee
The physical characteristics of aerosol particles during particle bursts observed at King Sejong Station in the Antarctic Peninsula from March 2009 to December 2016 were analyzed. This study focuses on the seasonal variation in parameters related to particle formation such as the occurrence, formation rate (FR) and growth rate (GR), condensation sink (CS) and source rate of condensable vapor. The number concentrations during new particle formation (NPF) events varied from 1707 to 83 120 cm−3, with an average of 20 649 ± 9290 cm−3, and the duration of the NPF events ranged from 0.6 to 14.4 h, with a mean of 4.6±1.5 h. The NPF event dominantly occurred during austral summer period (∼72 %). The measured mean values of FR and GR of the aerosol particles were 2.79±1.05 cm−3 s−1 and 0.68±0.27 nm h−1, respectively, showing enhanced rates in the summer season. The mean value of FR at King Sejong Station was higher than that at other sites in Antarctica, at 0.002–0.3 cm−3 s−1, while those of growth rates were relatively similar to the results observed by previous studies, at 0.4–4.3 nm h−1. The derived average values of CS and source rate of condensable vapor were s−1 and cm−3 s−1, respectively. The contribution of particle formation to cloud condensation nuclei (CCN) concentration was also investigated. The CCN concentration during the NPF period increased by approximately 11 % compared with the background concentration. In addition, the effects of the origin and pathway of air masses on the characteristics of aerosol particles during a NPF event were determined. The FRs were similar regardless of the origin and pathway, whereas the GRs of particles originating from the Antarctic Peninsula and the Bellingshausen Sea, at 0.77±0.25 and 0.76±0.30 nm h−1, respectively, were higher than those of particles originating from the Weddell Sea (0.41±0.15 nm h−1).
- Article
(3016 KB) -
Supplement
(584 KB) - BibTeX
- EndNote


Understanding the effect of atmospheric aerosol particles on climate change is an important issue in atmospheric science. These particles are highly significant substances in the radiation transfer process in the atmosphere, with direct effects through scattering and absorption of solar radiation and indirect effects by acting as cloud condensation nuclei (CCN) for cloud droplets (Anttila et al., 2012). These particles also influence the properties and life time of clouds (Twomey, 1977; Albrecht, 1989). Although aerosol particles play an important role in global and regional climates, large uncertainties remain owing to a lack of knowledge on their formation and physicochemical characteristics (Carslaw et al., 2013; IPCC, 2013).
New particle formation (NPF) frequently occurs in the atmosphere and leads to enhancement of the total number concentrations of aerosol particles due to high numbers of nucleation mode particles (Spracklen et al., 2006; Dall'Osto et al., 2017). The modeling study of Pierce and Adams (2007) indicates that ultrafine particles of < 100 nm in diameter can contribute to maximum CCN generations of 40 % and 90 % at the boundary layer and in the remote free troposphere, respectively. In order to understand the characteristics of the NPF, studies have been conducted in various regions including coastal, forest, mountainous, rural and urban sites (O'Dowd et al., 2002; Komppula et al., 2003; Kulmala et al., 2004; Yoon et al., 2006; Park et al., 2009; Kim et al., 2011; Rose et al., 2015; Bianchi et al., 2016; Kontkanen et al., 2017). In addition, studies on the NPF phenomenon have recently been conducted at various sites in the polar regions (Asmi et al., 2010; Järvinen et al., 2013; Kyrö et al., 2013; Park et al., 2004; Weller et al., 2015; Humphries et al., 2016; Nguyen et al., 2016; Willis et al., 2016; Barbaro et al., 2017; Dall'Osto et al., 2017). A NPF event occurring in the period between December 1998 and December 2000 at the South Pole was reported by Park et al. (2004). Kyrö et al. (2013) showed that oxidized organics derived from the oxidation of biogenic precursors originating from local melting ponds might have contributed to particle growth at the Finnish research station Aboa (73.50∘ S, 13.42∘ W). Although CCN concentrations were indirectly estimated at Aboa, Asmi et al. (2010) also showed and discussed hygroscopic growth factor and CCN activity. In addition, studies on the NPF were conducted at the Concordia station Dome C (75.10∘ S, 123.38∘ E; Järvinen et al., 2013) and at the coastal Antarctic station Neumayer (70.65∘ S, 8.25∘ W; Weller et al., 2015). Although studies on NPF events have been conducted at various stations in Antarctica, no results are available for the station in the Antarctic Peninsula. Also, the contribution of NPF to CCN concentration is not well understood in this area. Furthermore, results of the general long-term characteristics of aerosol particles during the period of NPF observation in Antarctica are rare compared with those in other continents.
In the present study, the frequency of NPF events was determined on the basis of total aerosol number concentration. We investigated the physical characteristics such as formation rate (FR) and growth rate (GR), condensation sink (CS) and source of condensation vapor as well as the seasonality of atmospheric aerosols during NPF events at King Sejong Station in the Antarctic Peninsula. The effect of particle formation on CCN concentrations was also examined. Furthermore, the air mass back trajectories were analyzed by using the Hybrid Single-Particle Lagrangian Integrated Trajectory (HYSPLIT) model to understand physical properties of NPF events depending on the origins and pathway of the air masses.
2.1 Site description and instrumentation
The data analyzed in this study were obtained from March 2009 to December 2012 at the King Sejong Station in the Antarctic Peninsula (62.22∘ S, 58.78∘ W). Further details on the sampling site as well as the instrumental specification and operation were introduced in the previous study (Kim et al., 2017). In brief, two condensation particle counters (CPCs; TSI 3776 and TSI 3772) were used to measure the total particle number concentrations. The aerosol size distributions of particles ranging from 10 to 300 nm were measured every 3 min with a scanning mobility particle sizer (SMPS) consisting of a differential mobility analyzer (DMA; HCT Inc., LDMA 4210) and a CPC (TSI 3772). The flow rate of sheath air and aerosol flow of DMA were 10 and 1 L min−1, respectively. The CCN concentrations were simultaneously measured by using a CCN counter (DMT CCN-100) with five different supersaturation values (i.e., 0.2 %, 0.4 %, 0.6 %, 0.8 % and 1.0 %). The sampling duration was set to be 5 min for each supersaturation value (except for 0.2 %). For the 0.2 % supersaturation value, the CCN concentration was measured for 10 min because of stability after measurements at 1 % supersaturation value. In the present work, only results of CCN concentration for a 0.4 % supersaturation value were used. In addition, meteorological parameters including temperature, relative humidity, wind speed, wind direction, pressure and solar radiation intensity were continuously monitored by using an automatic weather station (AWS; Vaisala HMP45 for measuring temperature and relative humidity, WeatherTronics 2102 for measuring wind speed and direction, WeatherTronics 7100 for measuring pressure and Eppley Precision Spectral Pyranometer (PSP) for measuring solar radiation intensity) system.
2.2 Data analysis
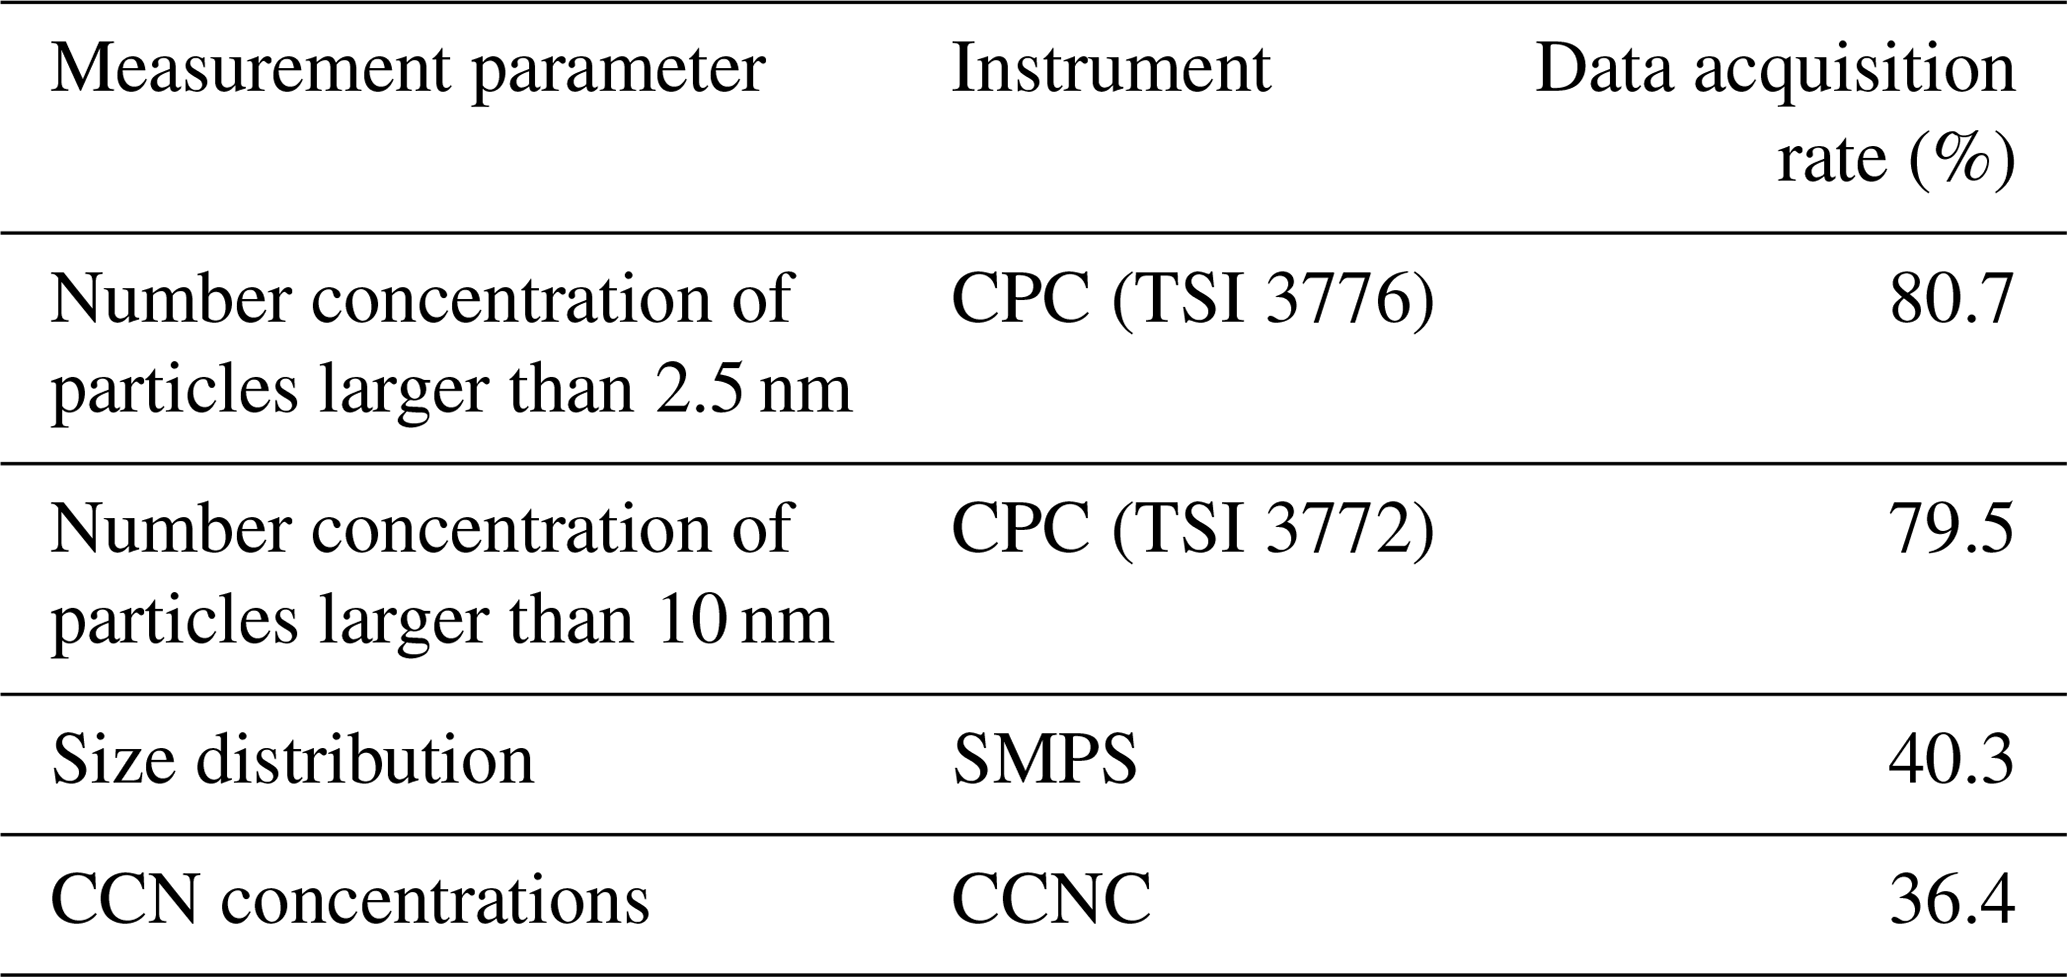
To ensure data quality, raw data were discarded if one of the following conditions was satisfied: (i) wind direction between 355∘ and 55∘ (local pollution sector), (ii) concentration of black carbon higher than 100 ng m−3, (iii) wind speed less than 2 m s−1 and (iv) instrument malfunction based on the logbook. If valid data for one day were less than 50 % after discarding the raw data, such days were excluded. The acquisition rate for each instrument is summarized in Table 1. Here, the acquisition rate indicates the value of the analyzed days divided by the total measurement days. Because the acquisition rate from the SMPS was lower than that of the CPC in this study, the value difference between the concentrations of particles larger than 2.5 nm (CN2.5) and 10 nm (CN10) observed from two CPCs was used to identify the NPF events.
Table 1Summary of data acquisition rate for each instrument during the analysis periods.
2.2.1 Definition of NPF events
As mentioned in the previous section, the difference between CN2.5 and CN10 concentrations was used to define days for NPF events or non-NPF events (Yoon et al., 2006). The CN2.5−10 represents the number concentrations of newly formed particles produced from gas-to-particle conversion. The NPF days were defined in this study according to the following conditions: (i) The CN2.5−10 is higher than 500 cm−3, (ii) the CN ratio is higher than 10 and (iii) the NPF duration is longer than 30 min. The CN ratio is the parameter used to distinguish between particles newly formed from gas-to-particle conversion and background particles (Warren and Seinfeld, 1985; Humphries et al., 2015). Humphries et al. (2016) also used the CN ratio to distinguish the NPF days during a 52 d voyage in the East Antarctic sea-ice region because the number concentration data were more reliable than the size distribution data.
2.2.2 Classification of NPF events using SMPS data
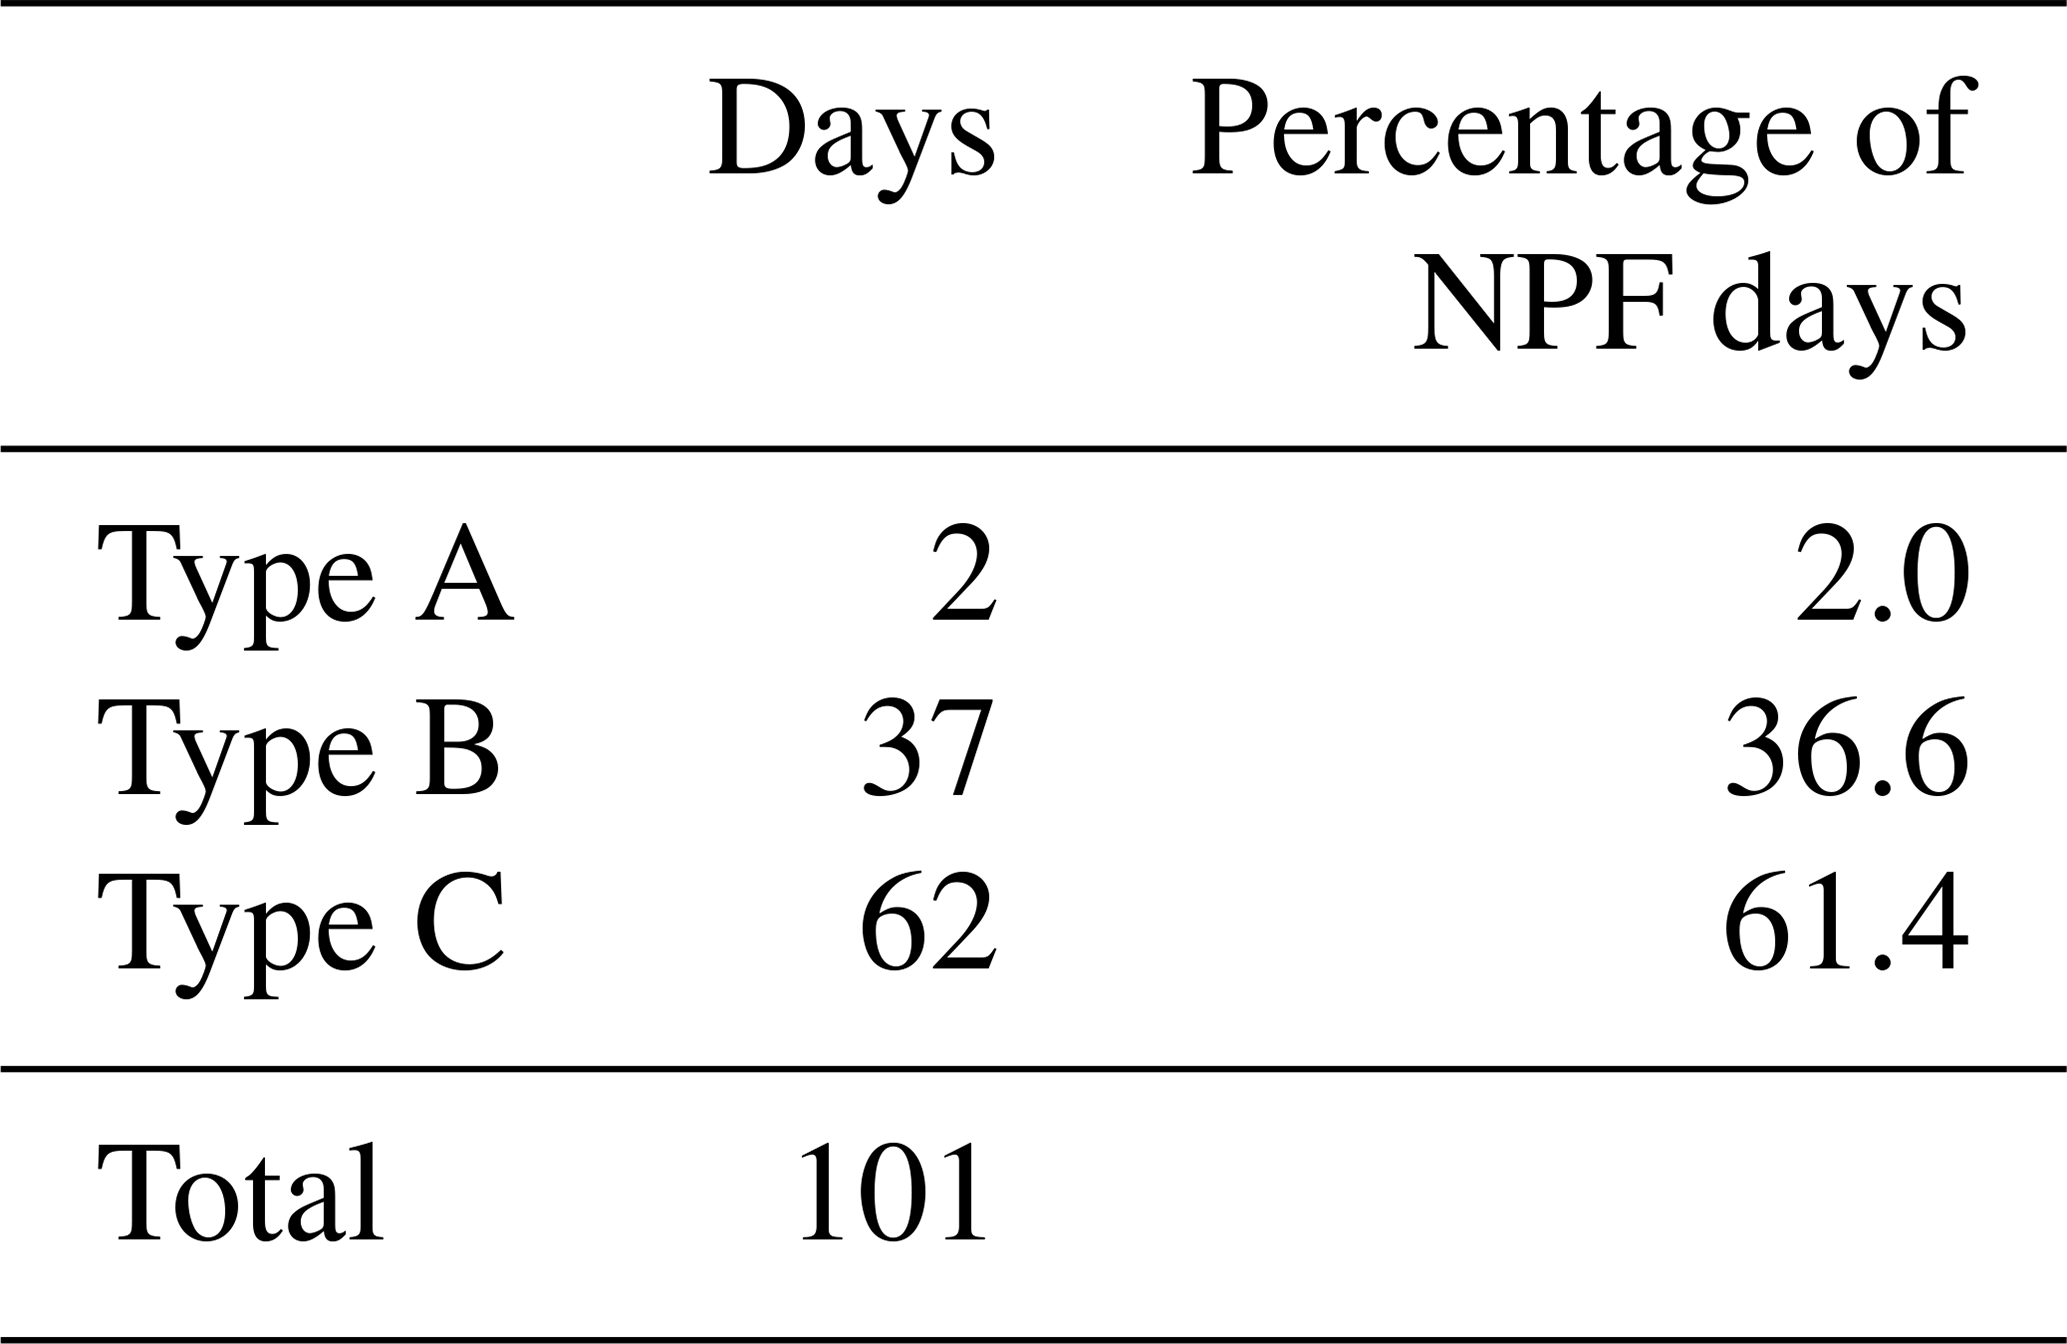
After identification of the NPF event days, classification of the NPF events was conducted by using size distributions from a SMPS. The NPF events were classified into three types of A, B and C according to the classification by Dal Maso et al. (2005) and Yli-Juuti et al. (2009) as shown in Fig. 1. Type A describes days in which the formation and growth of particles were clear. Type B describes days in which the formation occurred but growth was not clear. Type C describes days in which the event occurrence was not distinct.
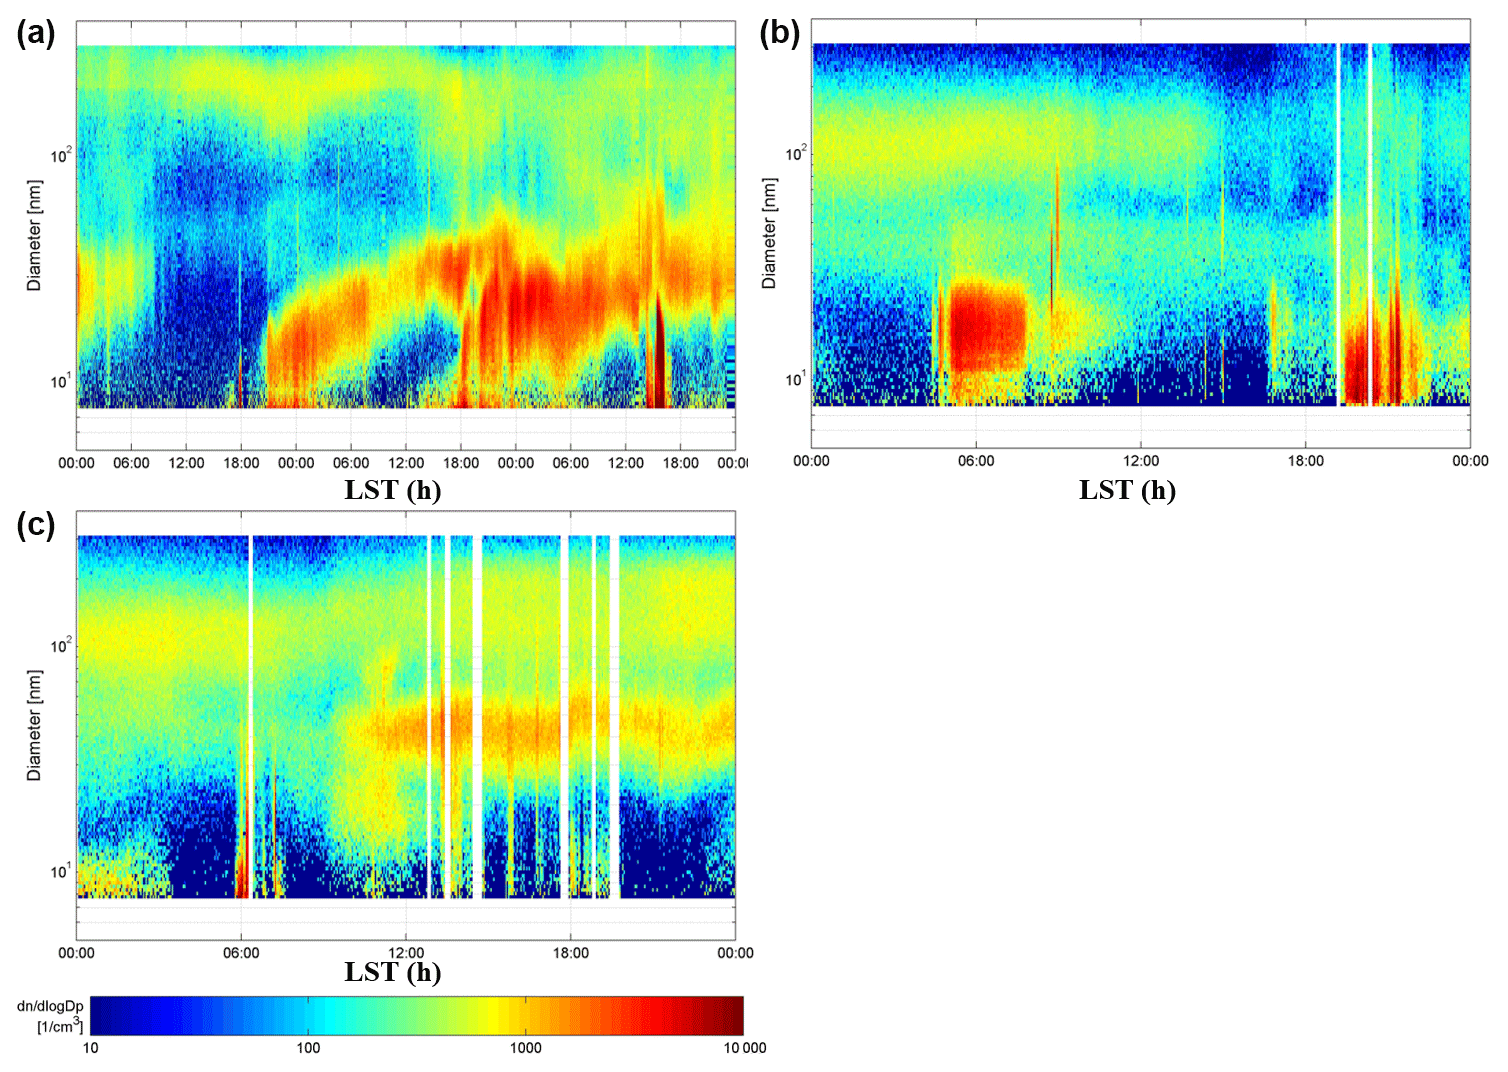
Figure 1Example of types of the NPF based on the SMPS data. (a) Type A (18 January 2011–20 January 2011), (b) type B (13 January 2015) and (c) type C (9 January 2015). Type A is days when the formation and growth of nanoparticles should be clear. Type B is days when the formation occurred but growth was not clear. Type C is days when it cannot be said whether there is an event or not.
2.2.3 Estimation of parameters for NPF characteristics
On the basis of the average number concentration data with 1 min time resolution, the FR was calculated for cases in which CN values and CN2.5−10 concentrations sharply increased (Fig. S1 in the Supplement). The FR of new particles ranging from 2.5 to 10 nm was determined according to variation in the number concentrations of CN2.5−10 based on the following equation (Dal Maso et al., 2005):
Here, Nnuc is the particle number concentrations of nucleation mode. In this study, the CN2.5−10 concentrations obtained by two particle counters were used for the term Nnuc. Fcoag is the particle loss in accordance with coagulation, and Fgrowth represents the flux of particles growing from the nucleation mode. Because the CN2.5−10 concentrations were predominant in the total number concentration and the particles rarely grew over the nucleation mode during the formation period, the Fcoag and Fgrowth terms in Eq. (1) were neglected in this study (Dal Maso et al., 2005; Shen et al., 2016).
The GRs were calculated by using the size distributions measured by a SMPS. Based on the hourly mean aerosol size distribution data, the geometric mean diameter (GMD) of particles, which is limited to the size range of 10–25 nm, was used. Here, the GMD was calculated from lognormal fitting analysis (Hinds, 1999). According to these method, the growth rate of particles ranging from 10 to 25 nm was estimated regardless of the NPF event types (Fig. S2 in the Supplement). The GR was determined by rate of change in the GMD by using the following equation (Kulmala et al., 2004; Dal Maso et al., 2005):
The CS is an important parameter governing the NPF because it indicates the loss rate at which gaseous molecules condense onto preexisting aerosols. It can be estimated from the size distribution data according to the following equation (Dal Maso et al., 2005; Kulmala et al., 2005; Shen et al., 2016):
where D is the diffusion coefficient of the condensable vapor (0.1 cm2 s−1), β is the transitional regime correction factor from Fuchs and Sutugin (1970), and dp and Ndp are the particle size and number concentration, respectively. It is assumed that condensable vapor is gaseous sulfuric acid, which has been reported to play an important role in the nucleation process (Dal Maso et al., 2005).
According to the GR and the CS, it is possible to estimate condensable vapor concentration, Cv (unit: molecules cm−3), and its source rate, Q (unit: molecules cm−3 s−1; Kulmala et al., 2001; Dal Maso, 2002), assuming that the particle growth is caused by condensation of a low-volatility vapor to the particle surface. In the nucleation mode, the relationship between Cv and GR is estimated by the following equation:
where A is a constant, specifically 1.37×10⁷ h cm−3 for a vapor with the molecular properties of sulfuric acid. It assumed that Cv is constant during the growth process.
Assuming no other sink terms for the condensing vapor, the source rate of condensable vapor is estimated under the steady-state condition:
2.3 Backward trajectory analysis
To understand characteristics of NPF events depending on the origin and pathway of air masses, air mass backward trajectory analysis was performed by using the HYSPLIT model (Stein et al., 2015; https://www.ready.noaa.gov/HYSPLIT.php, last access: 21 May 2019). The origin of air masses arriving at the observation site during the NPF events (a total of 101 event days) was manually categorized into four cases by analyzing 48 h backward trajectory data ending at a height of 100, 500 and 1500 m a.g.l. The results with similar air mass origins and pathways during the NPF event periods at three different heights were used for the analysis in this study, as shown in Fig. 2. Accordingly, the air mass was categorized into four cases according to its origin and pathway: two affected continents including South America (Case I) and the Antarctic Peninsula (Case III) and two affected marine cases including the Weddell (Case II) and Bellingshausen Sea (Case IV).
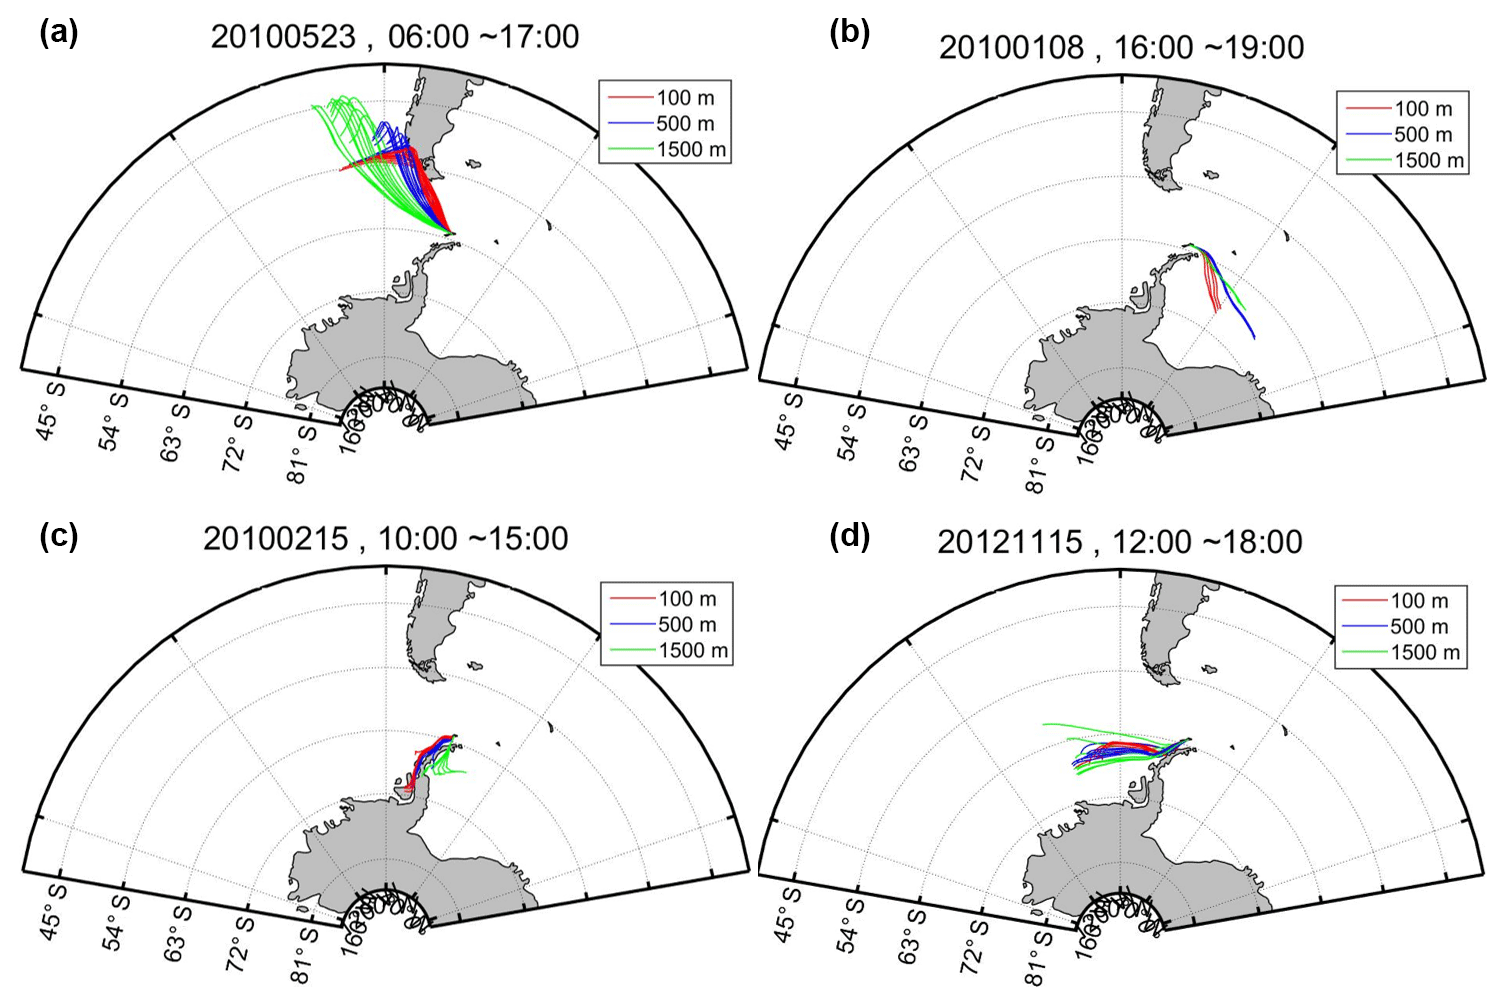
Figure 2Example of the four cases considering the air mass origin and pathway: (a) South America, (b) Weddell Sea, (c) Antarctic Peninsula and (d) Bellingshausen Sea. Typical 48 h air mass backward trajectories were analyzed, ending at heights of 100 m (red line), 500 m (blue line) and 1500 m (green line) above the ground level of the sampling site.
3.1 Characteristics of the NPF events
3.1.1 Occurrence frequency and FR of NPF events
After data screening as mentioned in the previous section, 1655 days of data recorded during the observation periods from March 2009 to December 2016 were analyzed. The data including valid data were classified into two groups, NPF event days and nonevent days, by using CN2.5−10 concentrations measured by two CPCs. The duration of the NPF ranged from 0.6 to 14.4 h, with a mean of 4.6±1.5 h. Only 6.1 % (101 days) of the results were defined as NPF events, whereas 93.9 % (1554 days) were classified as the non-NPF events (Table 2). This NPF frequency at King Sejong Station in the Antarctic Peninsula is quite low compared with those in previous studies at other midlatitude sites (Kulmala et al., 2004; Dal Maso et al., 2005; Pierce et al., 2014; Rose et al., 2015); comparison with other sites in the Antarctic is difficult, owing to the lack of long-term observed results. In addition, the monthly variation of the NPF frequency was compared as shown in Fig. 3. It is clear that the NPF number was highest during the austral summer, from December to February, whereas nonevents were observed in the austral winter period from June to August. Approximately 72 % of the NPF occurred during the summer period, showing the highest value of 38 % in January. The clear difference in the frequency of the NPF events in austral summer and winter periods indicates that solar intensity and temperature play important roles in the formation and growth of aerosol particles, along with precursor vapors derived from marine biota activities in Antarctica (Virkkula et al., 2009; Weller et al., 2015; Jang et al., 2019).

The FR of particles ranging from 2.5 to 10 nm varied from 0.16 to 9.88 cm−3 s−1, with an average of 2.79±1.05 cm−3 s−1. Figure 4a shows the monthly variations in the FR over whole observation periods. The seasonal trend in the FR shows a pattern similar to that of the NPF event frequency. The FRs were the highest during the austral summer (December–February, 3.20±1.09 cm−3 s−1). Those in the austral autumn period (March–May, 1.71±0.56 cm−3 s−1) were similar to those of the spring period (September–November, 1.71±0.79 cm−3 s−1). Although the FR was 0.20 cm−3 s−1 and air masses originated from South America (Case I) in May, only one NPF event occurred. In particular, the monthly maximum FR in December and the minimum in October were 3.52 and 0.84 cm−3 s−1, respectively. The FRs measured at various stations in the Antarctic and other continents are summarized in Table 3. The average level of the FR observed in this study was more than 10 times higher than that of other stations in Antarctica. Although it is difficult to directly explain the causes of the higher FR, it is likely that the method used in this study to derive the FR influenced the results. The FRs were estimated in the previous studies on the basis of the size distribution data with time resolution of a few minutes, whereas the FR in this study was calculated by using the variation in total number concentration (CN2.5−10) data with a time resolution of 1 s. Another possible reason is the location. As shown in Table 3, the FR at a coastal region, specifically Mace Head located approximately 500 m from the coast, is higher than that reported at other sites due to the high biological activity of marine algae, which produce gaseous precursors from tidal zone and open oceans. Previous modeling research showed that the dimethyl sulfide emission in the Antarctic Peninsula during the austral summer period is higher than that in other regions in Antarctica (Yu and Luo, 2010). Thus, the characteristics of the sampling site might have caused the FR to be higher than that at other site in Antarctica. Besides, human activities should be one of the possible reasons of high aerosol FR and concentrations. Although a strict data filtering procedure was applied to the raw dataset to minimize the effect of local contamination as mentioned in Sect. 2.2, previous study showed that BC concentrations at King Sejong Station were higher than those at other stations in Antarctica (Kim et al., 2017). In fact, other studies (Shirsat and Graf, 2009; Graf et al., 2010) also reported that there were local pollution sources from tourist ships and emissions associated with scientific activities in the Antarctic Peninsula, especially during austral summer seasons. These periodic human activities around the Antarctic Peninsula cannot be ruled out as a potential factor contributing the higher aerosol FR and concentrations.
Table 2Event statistics classified by using total concentration data obtained from two CPCs.
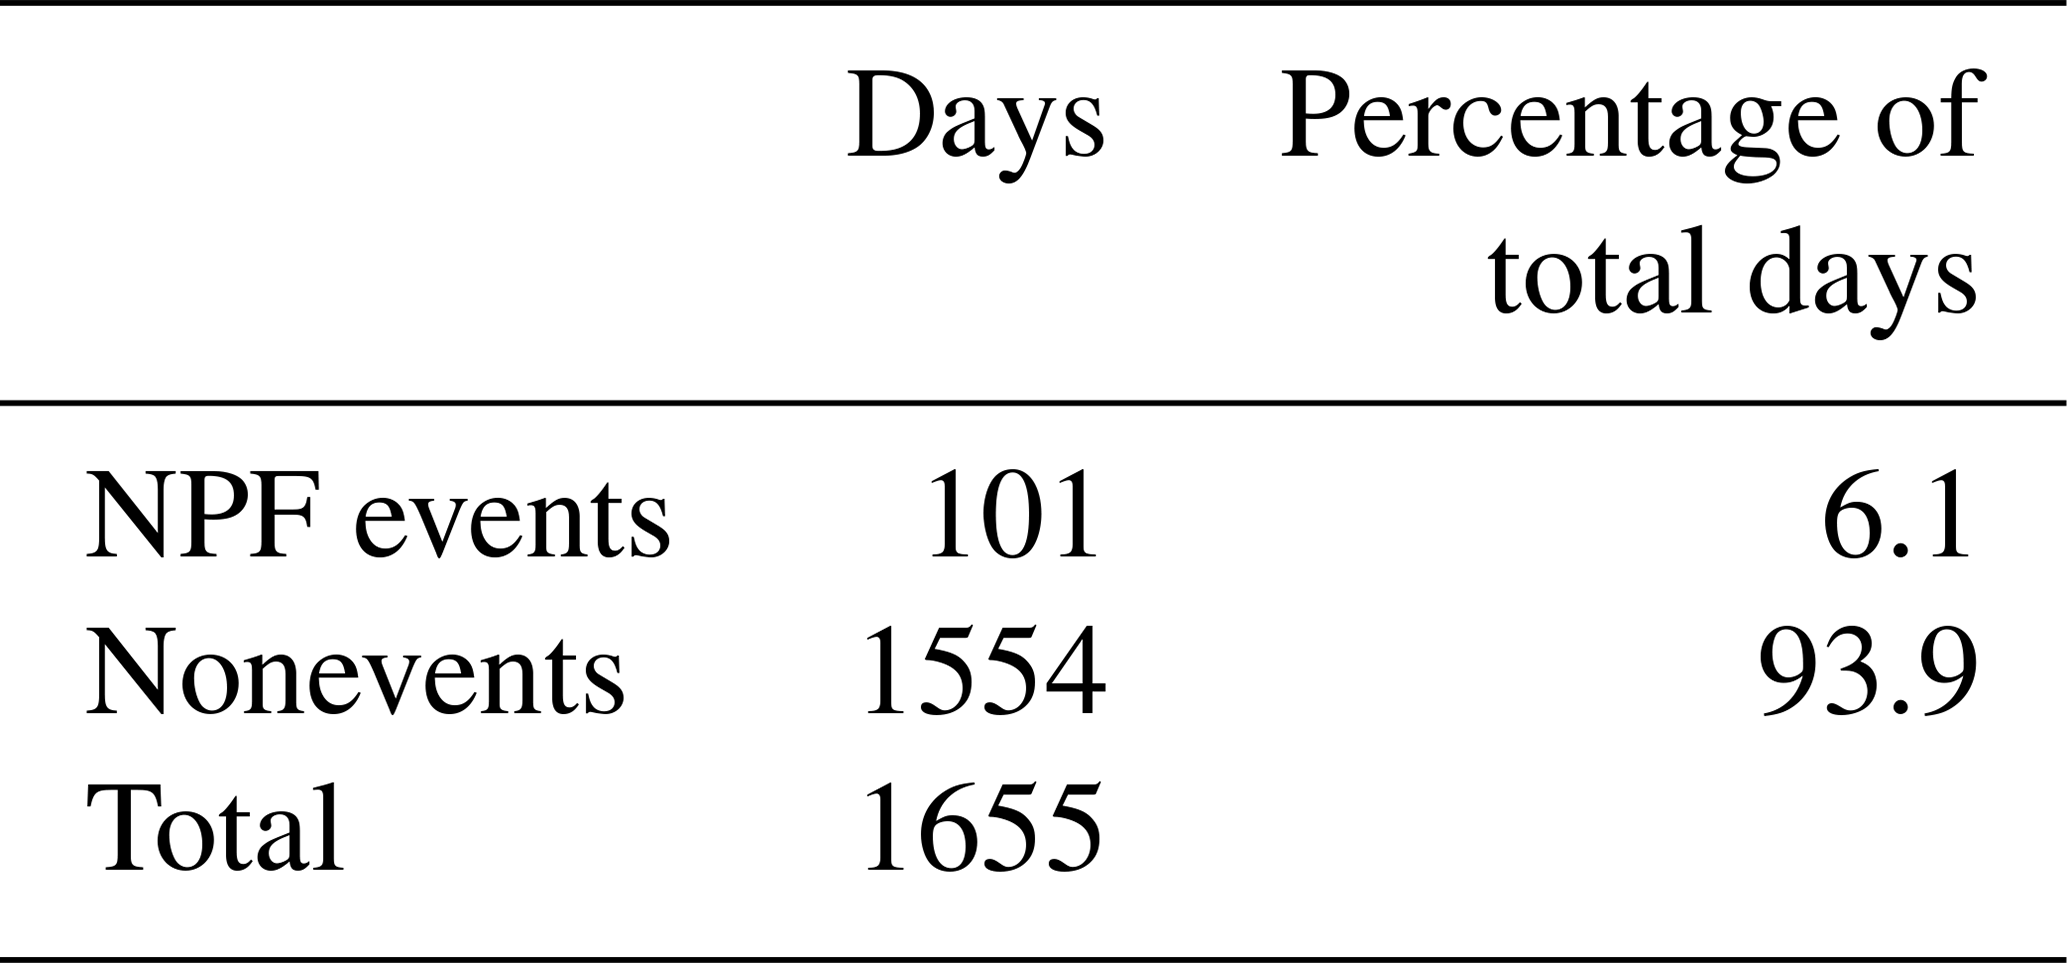
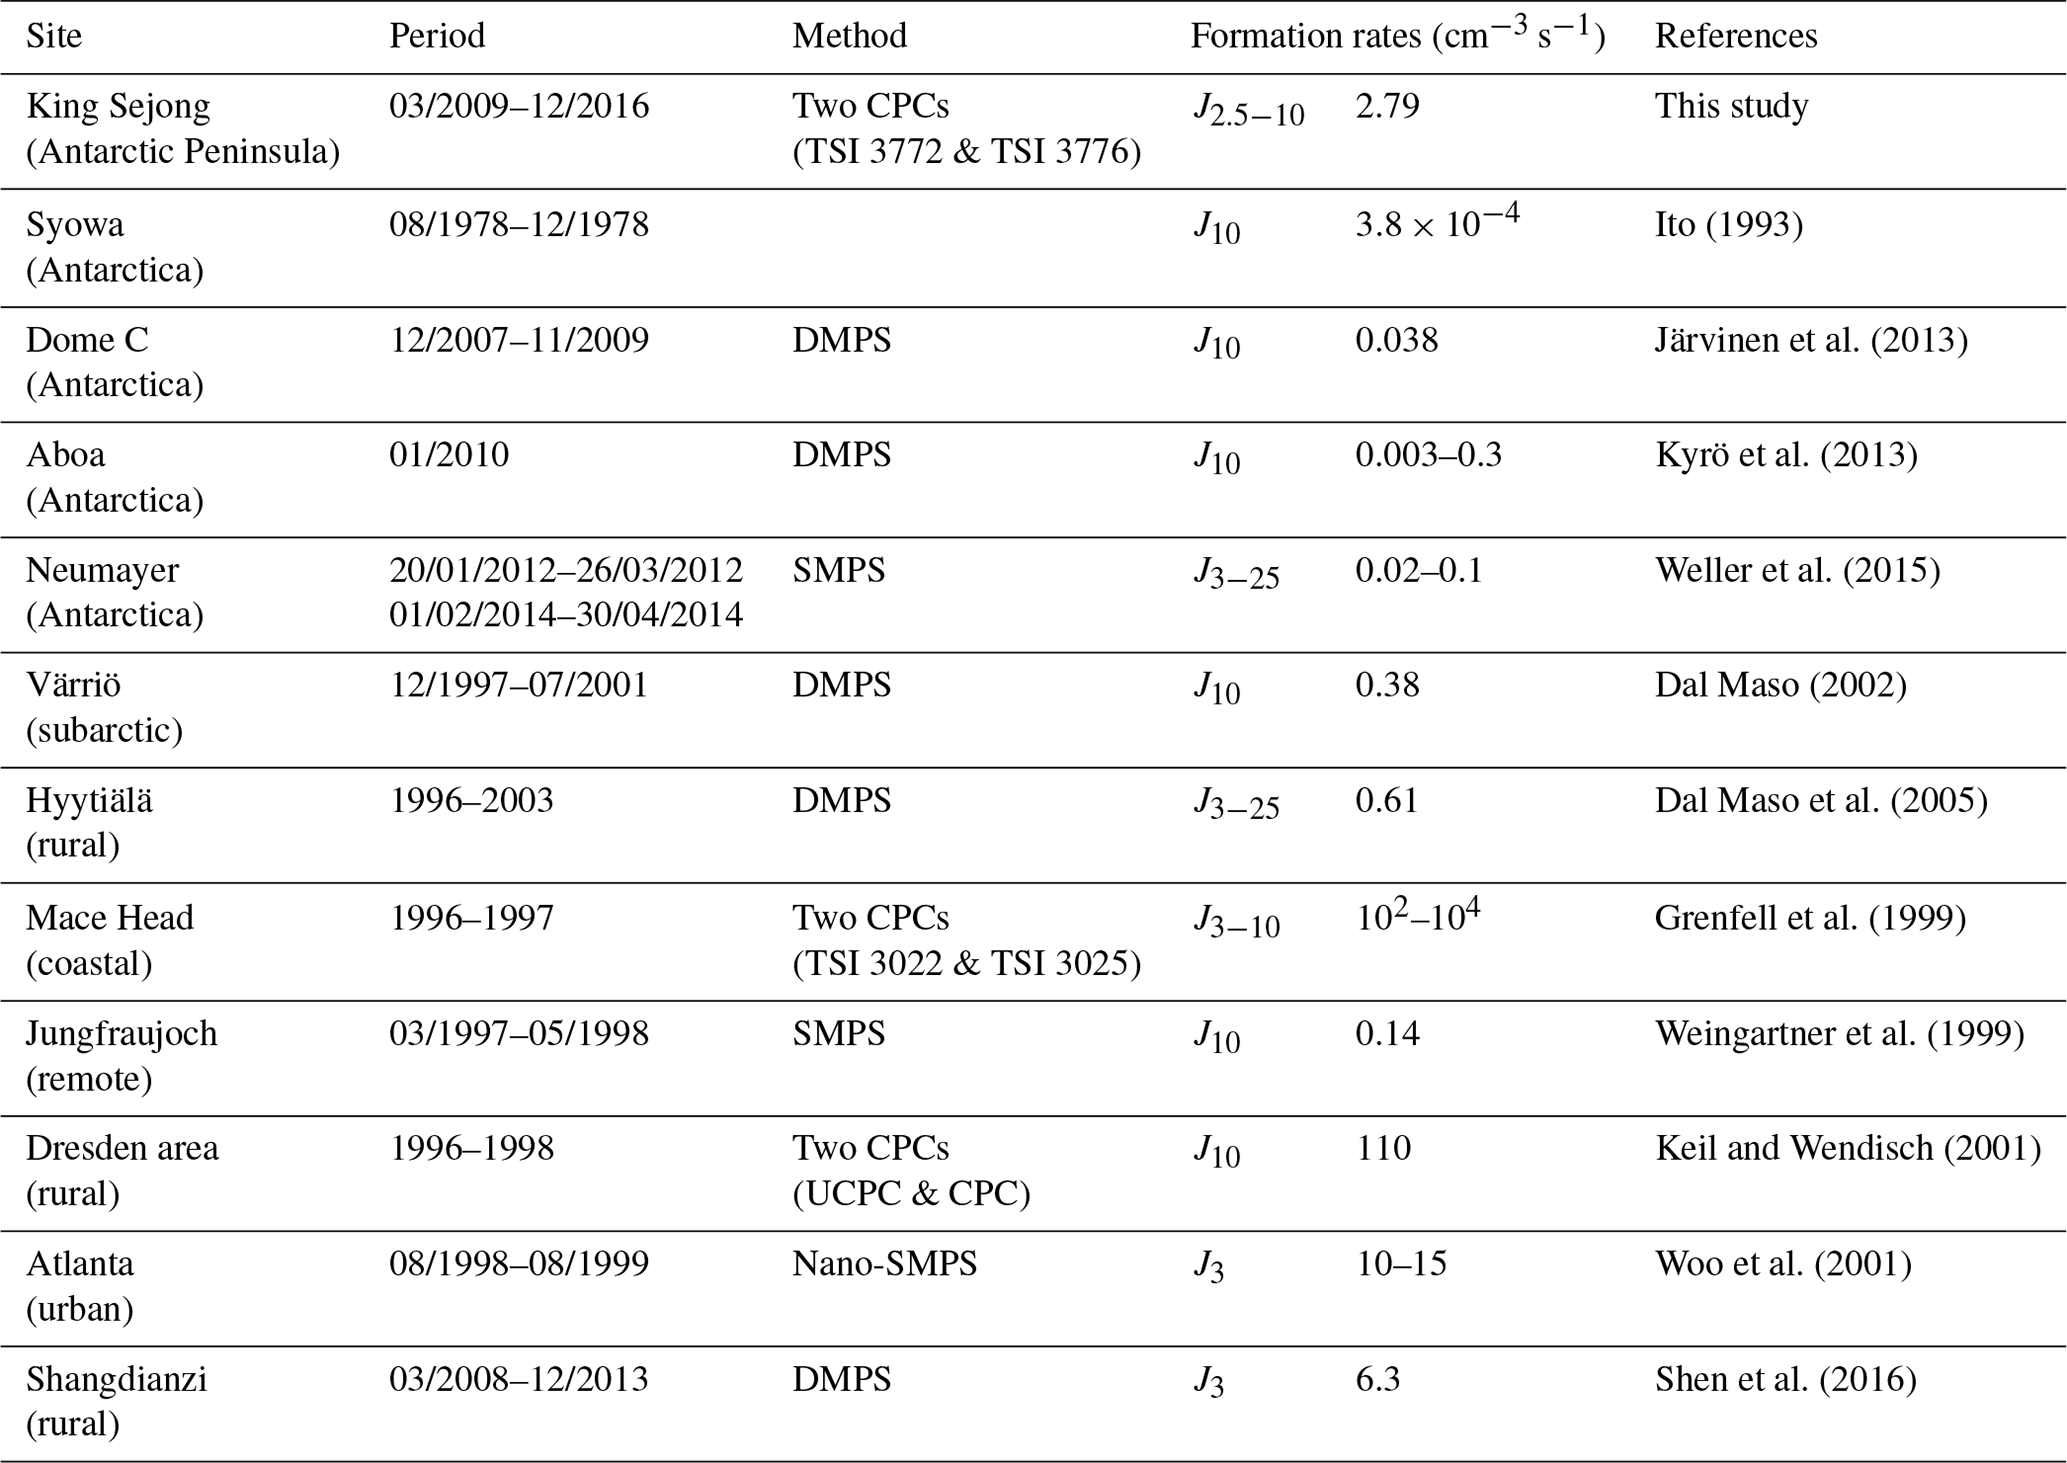
Table 3Summary of the formation rates observed at different sampling sites in Antarctica and in other continents. DMPS, SMPS and CPC mean differential mobility particle sizer, scanning mobility particle sizer and condensation particle counter, respectively.
3.1.2 Calculation of other parameters based on size distribution data
On the basis of the size distribution results measured with a SMPS, NPF events were categorized into three NPF types, as mentioned as Sect. 2.2.2. Type C was dominant, as shown in Table 4; among all NPF event days, only two days (2.0 %) were considered as Type A events. The GRs of nucleation mode particles ranged between 0.02 and 3.09 nm h−1, with a mean of 0.68±0.27 nm h−1. Figure 4b presents the monthly variation in the GR from March 2009 to December 2016. A seasonal trend in the GR is apparent, in which the maximum occurred in the summer. The GR gradually began to decrease in February and increase again in November, as shown in Fig. 4b. The GR in January was 0.76±0.26 nm h−1, whereas that in November was 0.40±0.15 nm h−1. The GRs in September and October were not shown due to mechanical trouble of the instruments. The GR in this study is similar to the values reported in previous studies conducted in Antarctica. For instance, Weller et al. (2015) reported that the GR at the Neumayer station varied between 0.4 and 1.9 nm h−1, with an average of 0.90±0.46 nm h−1. However, our results are lower than those reported by Järvinen et al. (2013), who studied NPF events at the Concordia station Dome C from December 2007 to November 2009 and showed a GR of 4.3 nm h−1. This discrepancy is likely attributed to the number of analyzed days. In the present study, we analyzed 86 of 101 NPF days, whereas the previous study analyzed 15 NPF days.
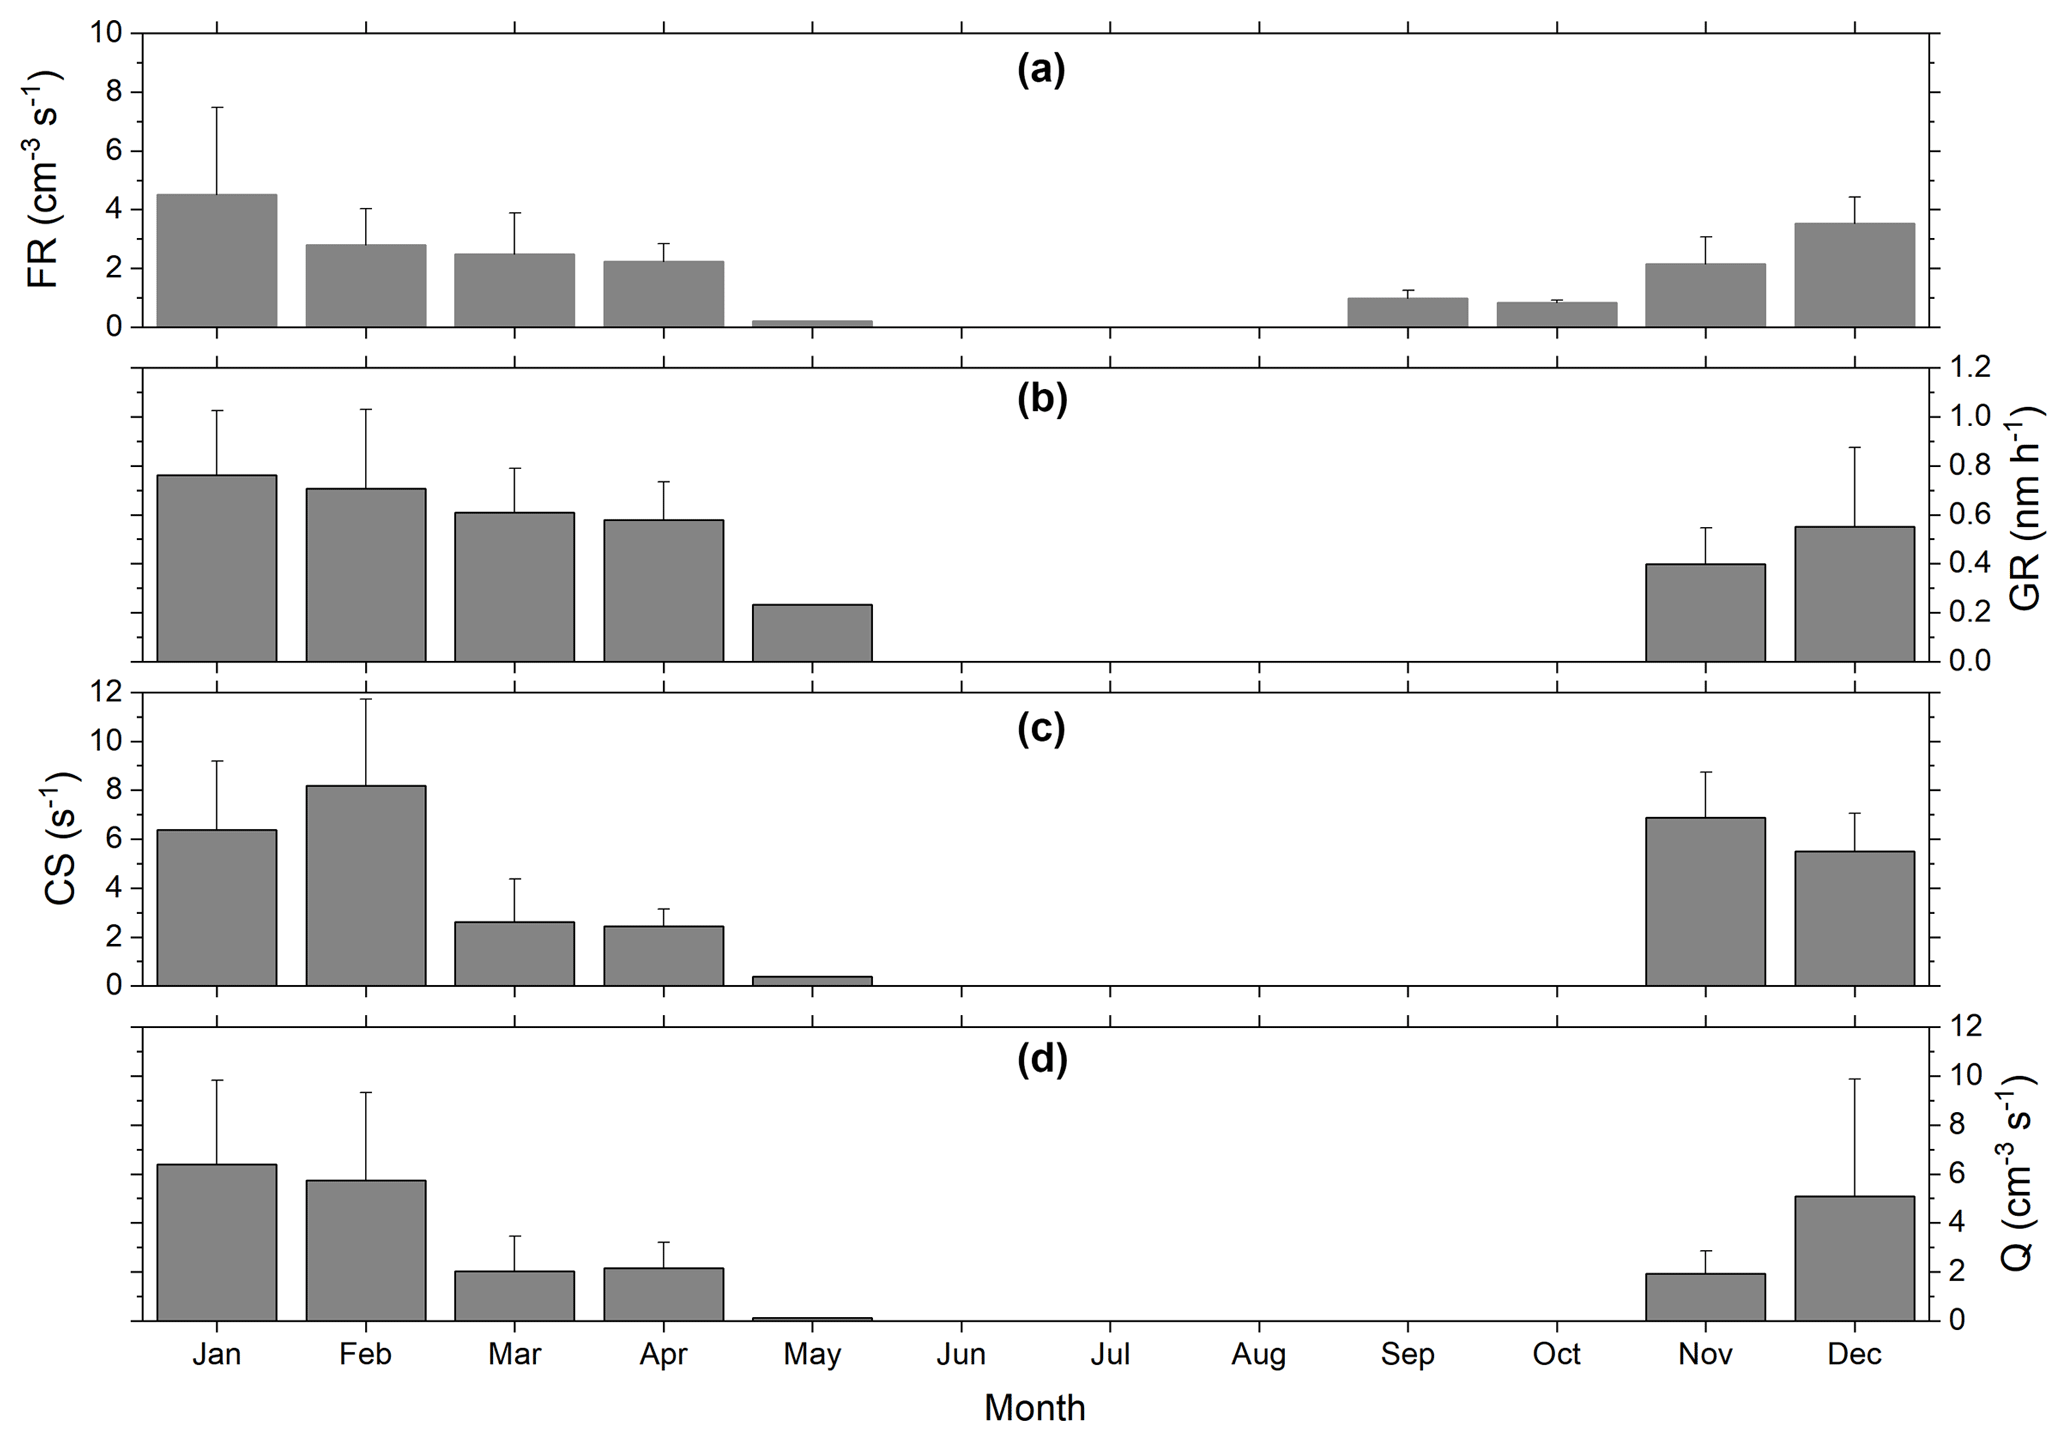
Figure 4Monthly variations of (a) the formation rates (FR), (b) the growth rates (GR) of nucleation mode particles ranging from 10 to 25 nm, (c) the condensation sink (CS) and (d) the source rate of condensable vapor (Q). The error bars represent a standard deviation. No NPF events were observed in June, July and August. The GRs, CSs and Q values in September and October were not shown due to mechanical troubles of the instruments.
Figure 4c shows a monthly variation in CS during NPF events. The CS varied from s−1 to s−1, with an average of s−1. The value was high in February ( s−1) and low in April ( s−1), as shown in Fig. 4c. The CS measured in this study was approximately 5–10 times higher than that observed at the other Antarctic station. Weller et al. (2015), who estimated the CS using light scattering data measured from Neumayer station, indicated a CS value of about 10−3 s−1. A median CS value of s−1 in a 47 d observation period at Aboa station was reported by Kyrö et al. (2013). Järvinen et al. (2013) also showed a CS value of s−1 using data of 15 days.
Table 4NPF event classification statistics using size distribution results. Type A refers to days in which the formation and growth of particles were clear. Type B refer to days in which the formation occurred but the growth was not clear. Type C refers to days in which the event occurrence was unclear.
The monthly variation in the condensable vapor source rate during a NPF event is displayed in Fig. 4d. The source rates derived were between 0.03×10³ and 3.74×105 cm−3 s−1, with a mean source rate of cm−3 s−1. The source rate of condensable vapor was at a maximum during the austral summer months. In particular, the maximum and minimum average values of the source rate were cm−3 s−1 in January and cm−3 s−1 in November, respectively. This source rate was higher than that measured at a coastal Antarctic station. Kulmala et al. (2005) reported that the value of source rate varied from 0.9×10³ to 2.0×104 cm−3 s−1 at the Aboa station.
3.2 CCN concentration during NPF events
In this section, the contribution of particle formation to the variation in CCN concentration is investigated. Although recent studies reported that number concentrations of climate-relevant particles increased during NPF events (Pierce et al., 2014; Shen et al., 2016; Rose et al., 2017), the contribution of NPF to CCN concentration was estimated by using an indirect method. The number concentrations of particles larger than 50, 80 and 100 nm were estimated by using size distribution data. That value was considered as potential CCN concentration at a different supersaturation value. In the present study, CCN concentrations at a supersaturation value of 0.4 % were directly measured using a CCN counter. Hourly mean CCN concentrations were compared with CN concentrations measured by CPC and size distribution results measured by SMPS (Fig. S3 in the Supplement). Data for only 27 days, when all the three datasets (CPC, CCN counter and SMPS) were available, were analyzed. Figure 5 shows the variation in CN2.5−10 concentrations, CCN concentrations and number concentrations as a function of time elapsed after the NPF event. The zero in the x axis means the start time of the NPF event. As shown in Fig. 5a and b, the CN2.5−10 concentrations sharply increased at NPF start time and the peak concentration occurred 2 h afterward, whereas the CCN concentrations gradually increased for 8 h. Indeed, the maximum CCN concentrations rose from 191.4±16.3 to 213.2±17.7 cm−3 before and after the NPF events, respectively, showing an increase of 11 %. Figure 5b also shows the variation in number concentrations (N50, N80, and N100) of particles larger than 50, 80 and 100 nm, respectively. Number concentrations were calculated from aerosol size distribution data. Variation trends of the number concentrations were similar to those of CCN concentrations, increasing approximately 15 % before and after the NPF events.
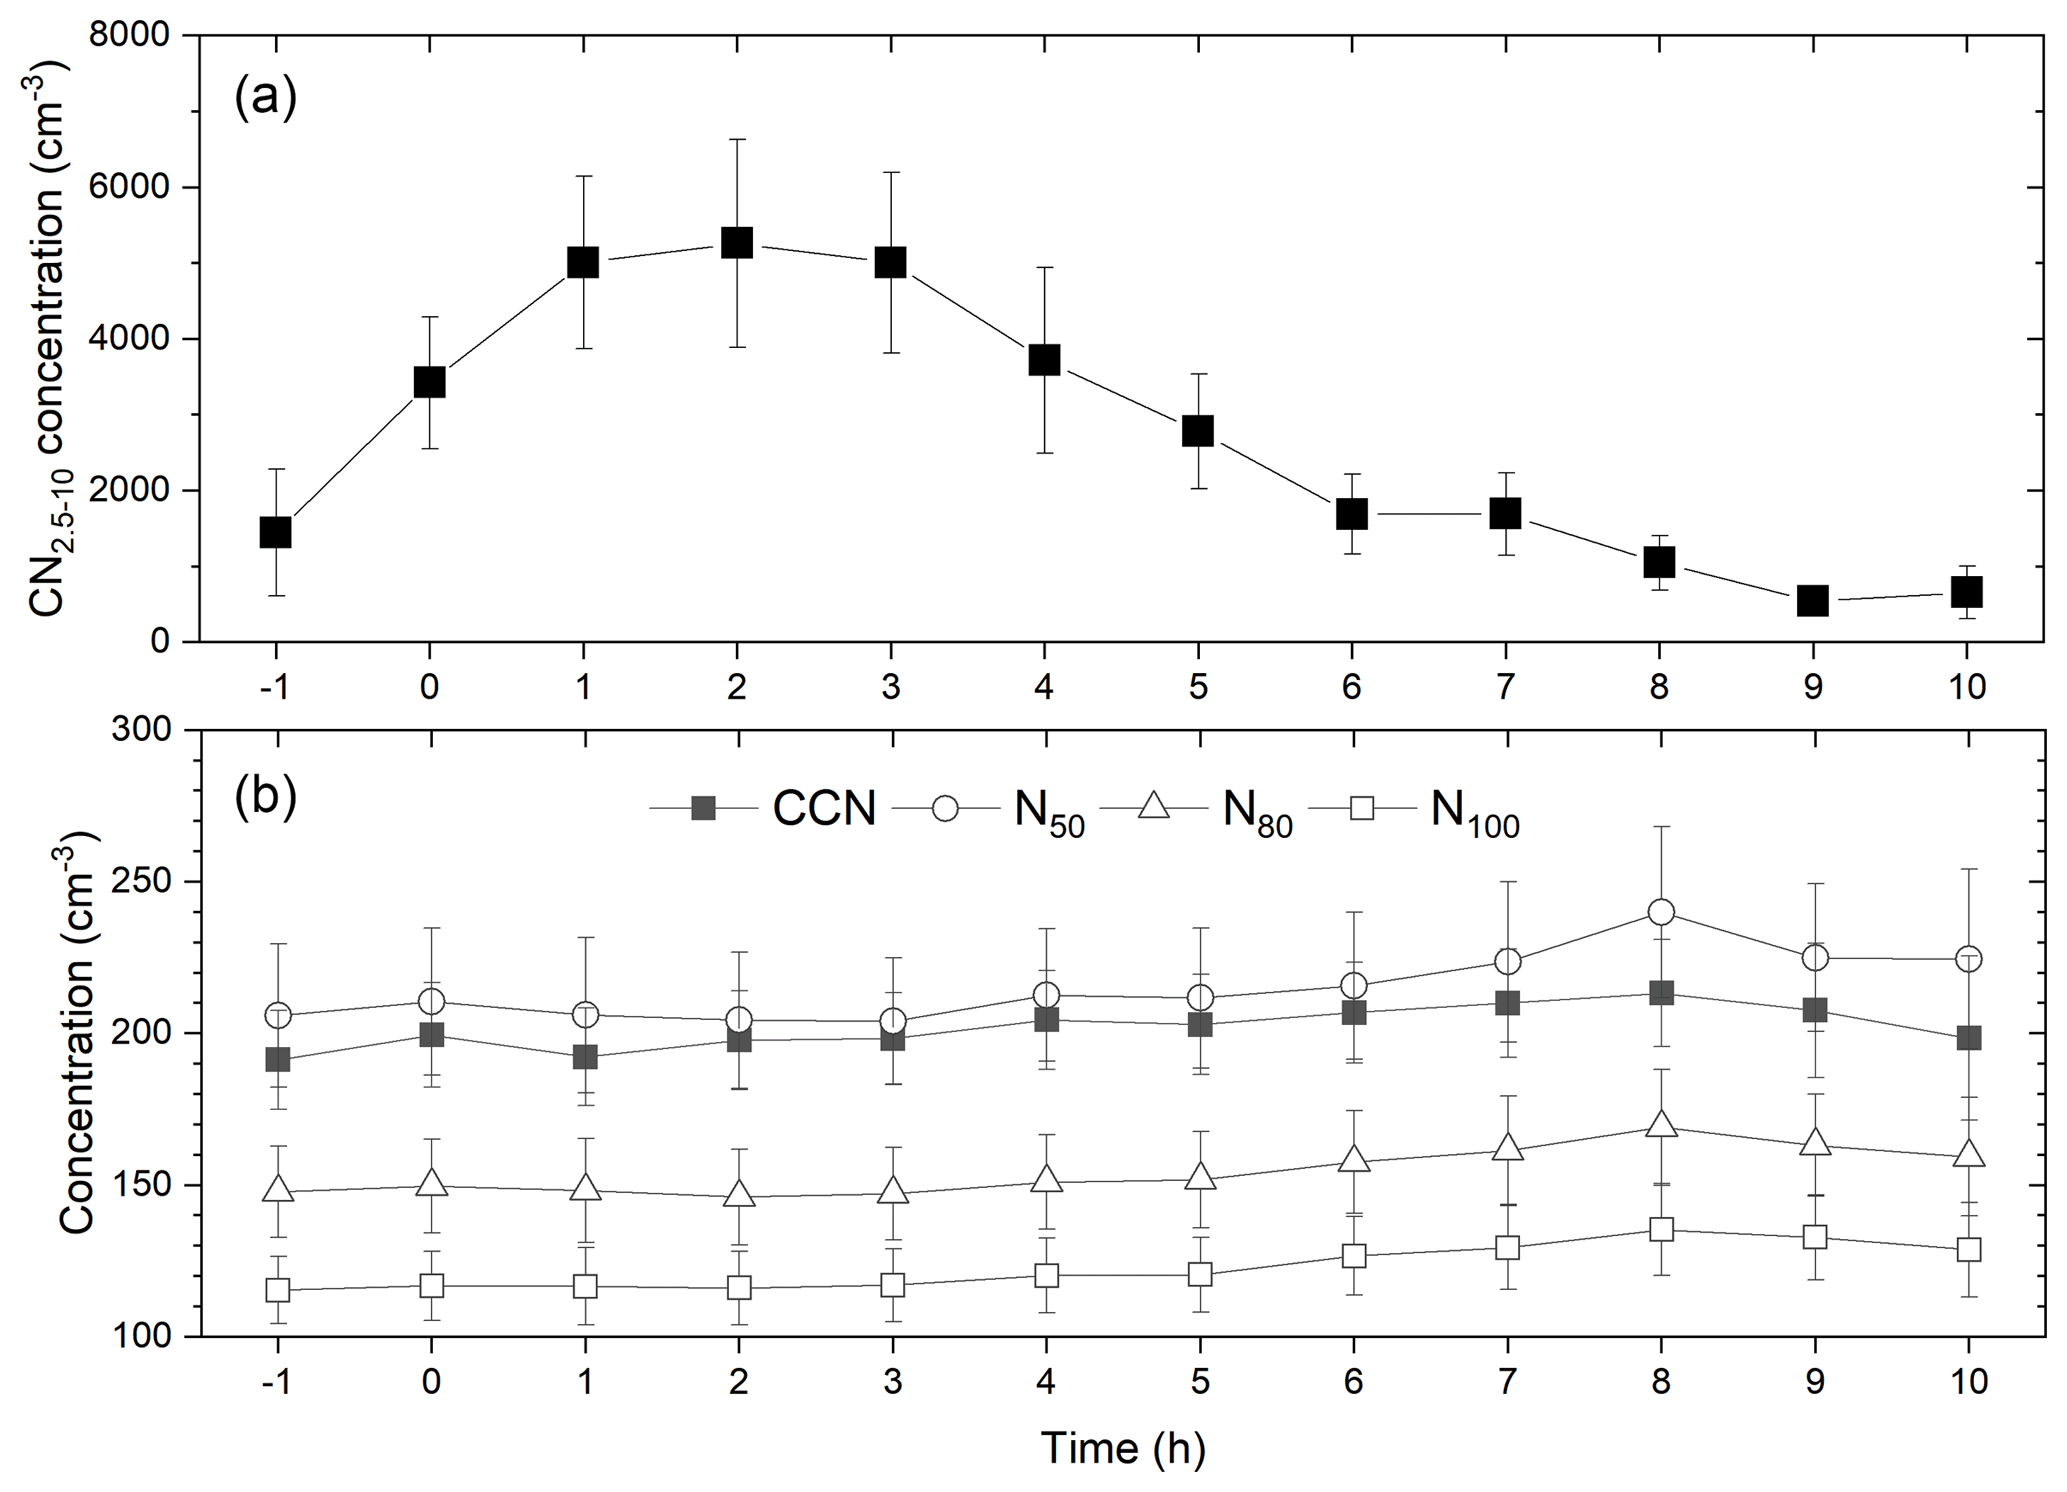
Figure 5Variation in (a) CN2.5−10 concentrations measured using CPC and (b) CCN concentrations measured with a CCN counter and number concentrations calculated using SMPS data with time. N50, N80 and N100 represent number concentrations of particles lager than 50, 80 and 100 nm in diameter, respectively. The zero in the x axis indicates the start time of the NPF events.
3.3 Effects of air mass origin on NPF events
The effects of air mass origin on the NPF characteristics were also investigated by 48 h air mass back trajectory analysis. Each trajectory according to four cases can be shown in Fig. S4 in the Supplement. The frequencies of NPF, FR, GR, CS and the source rate of condensable vapor over the whole observation period are listed in Table 5. Here, the analysis results of the NPF characteristics of air masses originating from South America (Case I) are not shown, owing to low frequencies. The air masses originating from the sea (Case II and IV) were dominant during NPF events at King Sejong Station. The FRs were analogous regardless of the air mass origin and pathway, while the GR of Case III and Case IV was significantly higher than that of Case II. The lower GR should be related to the CS and the source rate of condensable vapor. In the case of the air mass originating from the Weddell Sea (Case II), the CS was higher than that of other cases, whereas the source rate of condensing vapor was lowest. The higher CS and lower source rate might indicate a decline in condensing vapor and hence a decrease in GR. Our results for the source rate of condensable vapor agree with those of a previous study by Yu and Luo (2010), discussing the role of dimethyl sulfide (DMS) emission in the NPF process in remote oceans. In their model study, the concentrations of DMS and sulfuric acid in the Bellingshausen Sea and the Antarctic Peninsula area during the austral summer season were higher than those in the Weddell Sea region. In satellite-derived estimates of the biological activities, DMS produced from phytoplankton was found to be more dominant in the Bellingshausen Sea than in the Weddell Sea (Jang et al., 2019). Sulfuric acid is derived from oxidation of DMS emitted from oceans (Virkkula et al., 2009). In this study, the condensable vapor was assumed to be sulfuric acid in the source rate calculations, as mentioned in Sect. 2.2.3.
Table 5Summary of NPF characteristic statistics depending on the air mass origin. FR is the formation rate, GR is the growth rate, CS is the condensation sink and Q is the source rate of condensable vapor. Case I, Case II, Case III and Case IV refer to the origin and pathway of air masses from South America, the Weddell Sea, the Antarctic Peninsula and the Bellingshausen Sea, respectively.
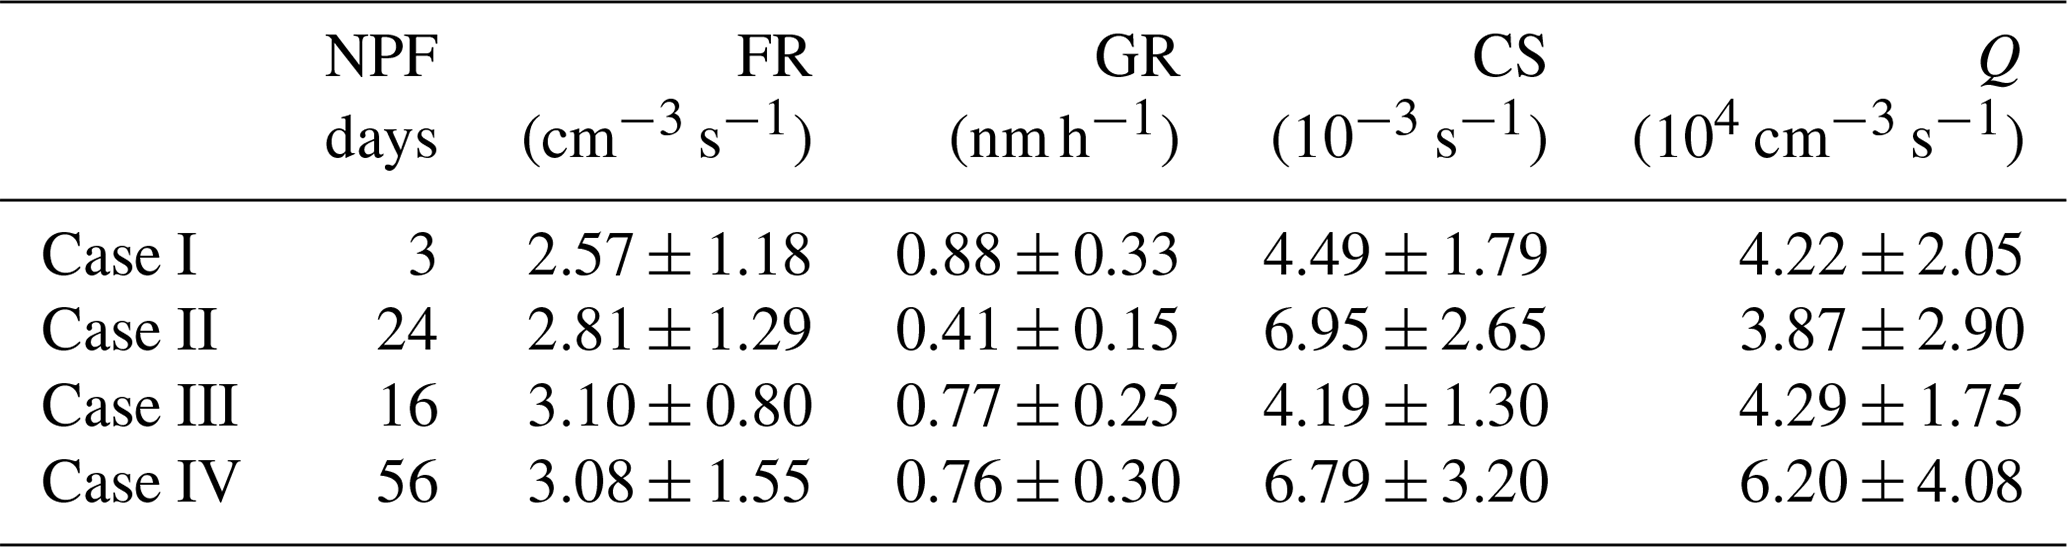
Figure 6 shows a comparison of the NPF characteristics depending on the origin and pathway of the air mass during the summer season. The mean CS value was high. However, in the case of the air mass originating from the Bellingshausen Sea (Case IV), the GR was relatively higher than the values of air masses that originated from other regions. The mean value of this source rate for the air mass originating from the Weddell Sea (Case II) was similar to that from the Antarctic Peninsula (Case III), while the CS mean value was 1.7 times higher. This resulted in a low GR.

Figure 6Comparison of NPF characteristics including the formation rate (FR), growth rate (GR), condensation sink (CS) and source rate of condensable vapors (Q) depending on the origins and pathway of air masses during the austral summer period. The error bars represent standard deviation.
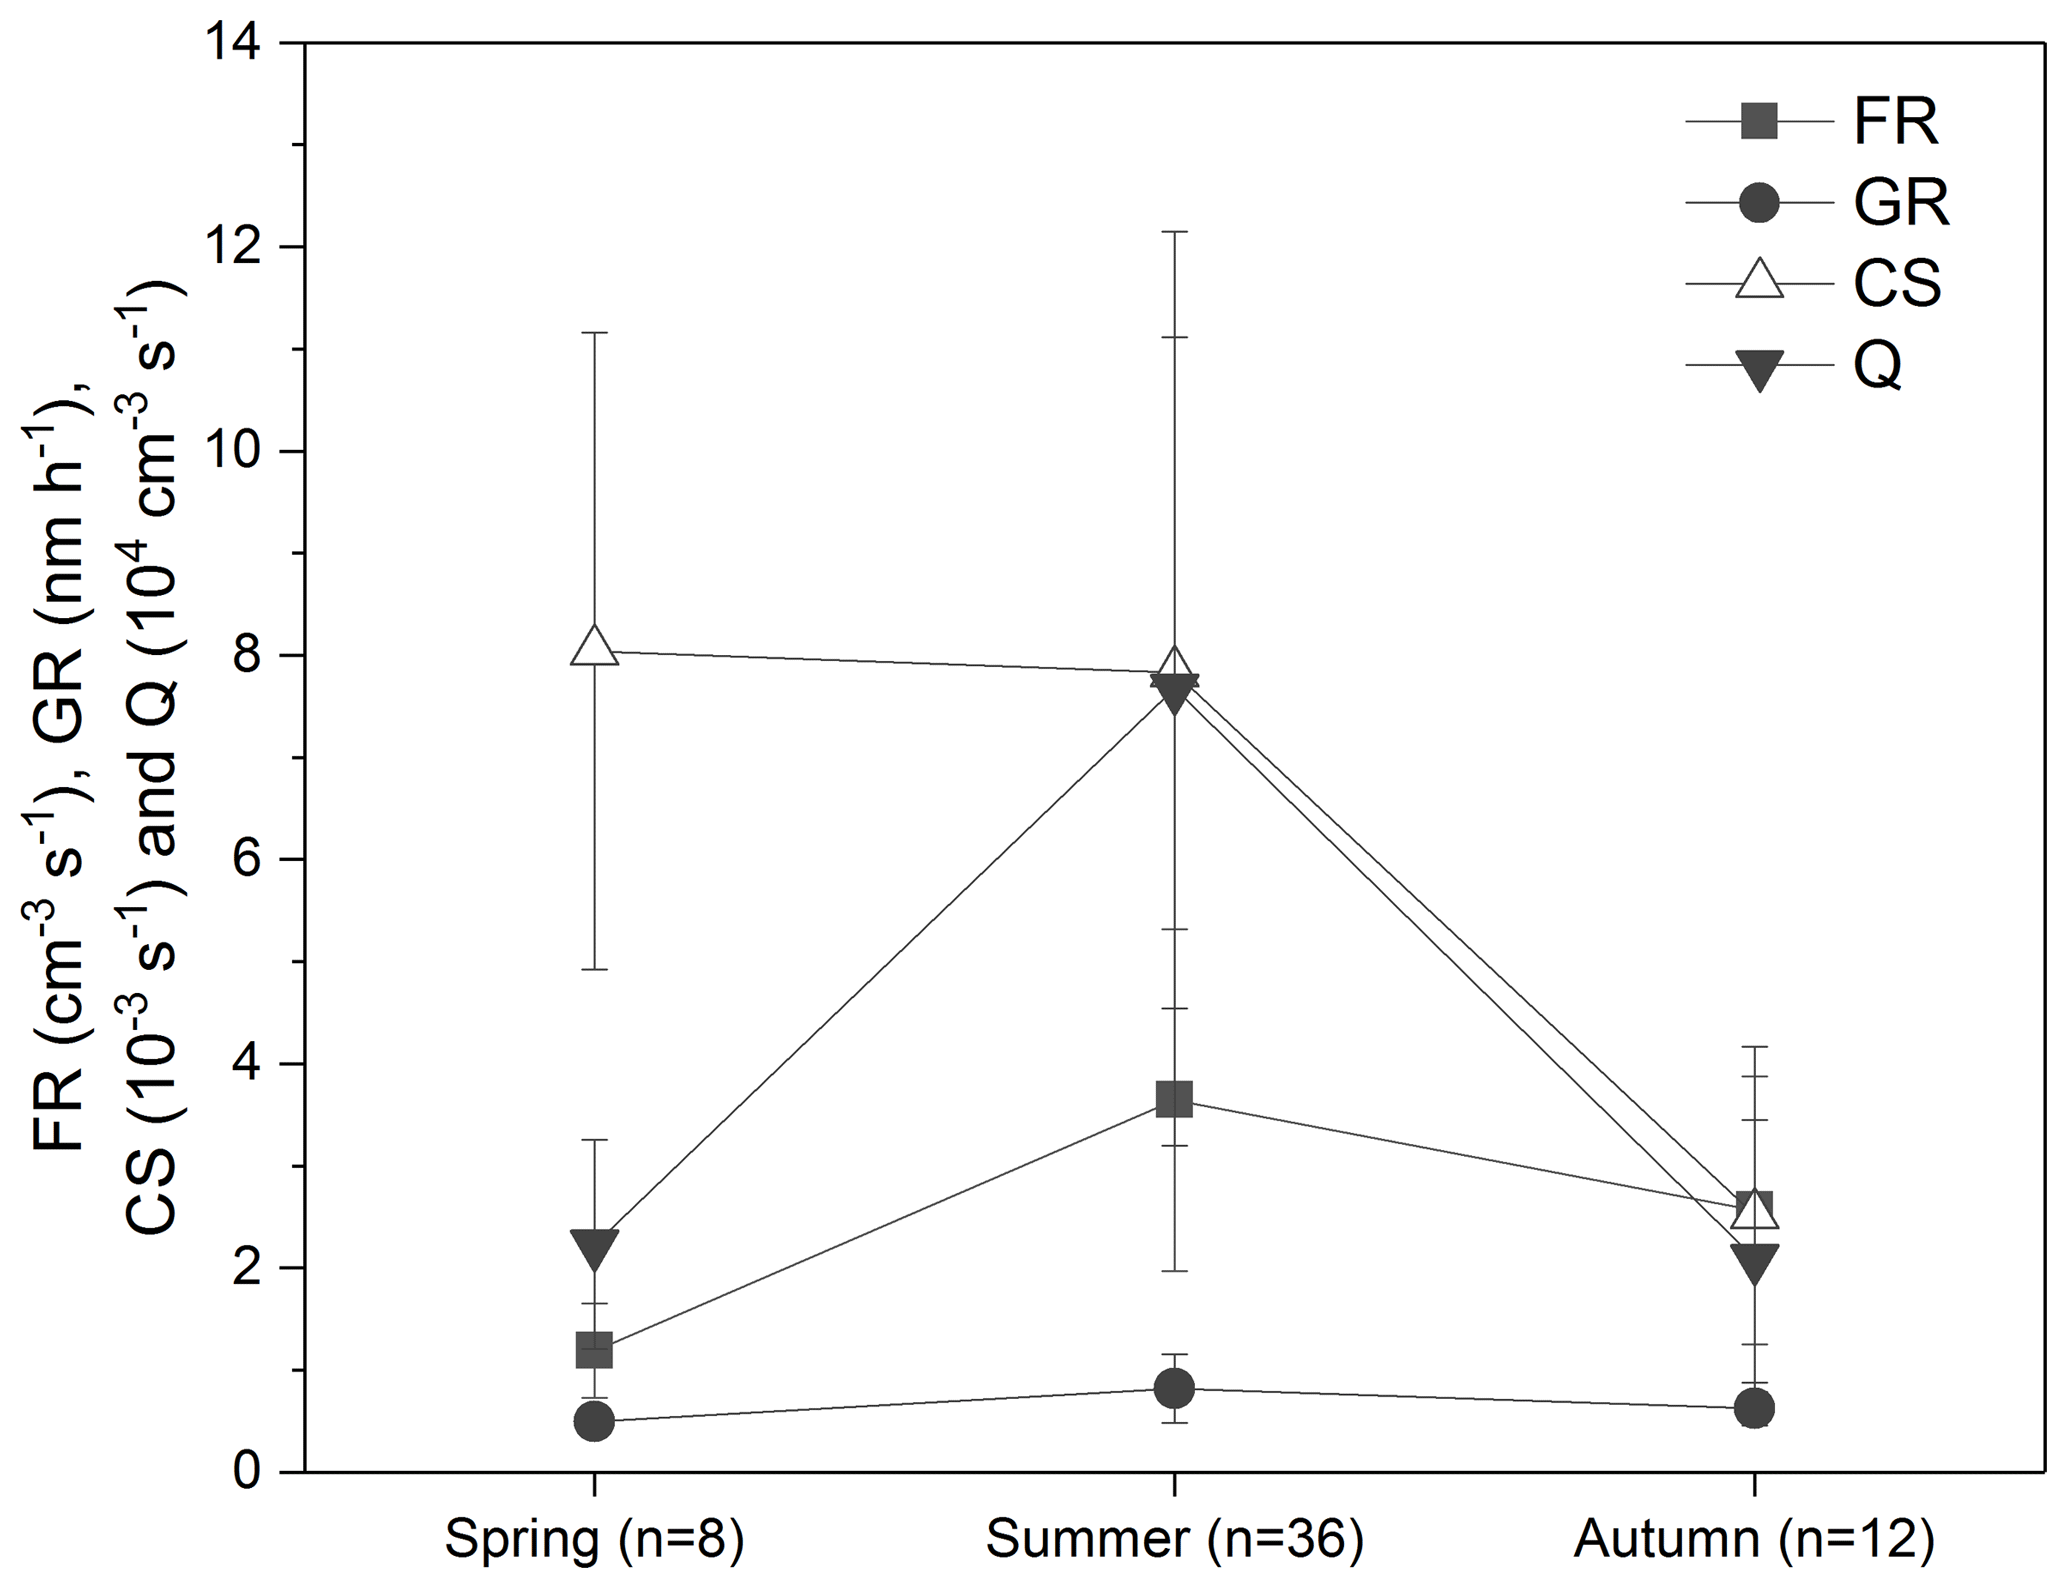
Figure 7Seasonal characteristics of parameters related to NPF events in which the air masses originated from the Bellingshausen Sea. FR, GR, CS and Q refer to formation rate, growth rate, condensation sink and source rate of condensing vapor, respectively. The error bars represent standard deviation.
For air mass originating from the Bellingshausen Sea (Case IV), the seasonal properties of the parameters related to the NPF events were analyzed. As shown in Fig. 7, the mean values of FR, GR and the source rate of condensable vapor were highest during the austral summer periods. However, mean values of CS were highest during the spring period.
In this study, the characteristics of NPF at King Sejong Station in the Antarctic Peninsula were investigated using a dataset of 8 years from March 2009 to December 2016, of total particle number concentrations and particle size distributions. The frequencies of NPF events and FR were obtained by using the data of total number concentrations, whereas GR, CS and the source rate of condensable vapor were calculated from the aerosol size distribution results. A low occurrence frequency of NPF events, at 6 %, was observed, and most of the NPF events occurred during the austral summer. No NPF events were observed during the winter due to lower solar radiation and a lack of precursors for particle formation. The mean values of the FR and GR were 2.79±1.05 cm−3 s−1 and 0.68±0.27 nm h−1, respectively. These results show that the FR at King Sejong Station is higher than that at other Antarctica sites, whereas the GR was relatively similar to values reported in previous studies conducted in the Antarctic. A possible reason for the lower GR can be attributed to the CS, which was 5–10 times higher than that reported at other stations in Antarctica. This observation suggests that condensable vapor contributed to the growth of nucleated nanoparticles and may have condensed onto preexisting particles, hence decreasing the GR. According to 48 h backward trajectory analysis, air masses originating from oceanic areas were dominant during the NPF events. In order to investigate the contribution of the NPF events to variation in CCN concentrations at a supersaturation value of 0.4 %, the CCN concentrations were compared with the CN2.5−10 concentrations as a function of time. The results showed that the CCN concentrations during and after the NPF events increased by approximately 11 % compared with those measured before the event. This study is the first to report the characteristics of NPF in the Antarctic Peninsula. However, further research is need to understand the chemical characteristics of aerosol particles and the chemical composition of precursors during NPF events to fully understand the NPF for this region including Arctic permafrost area.
The data analyzed in this publication will be readily provided upon request to the corresponding author (yjyoon@kopri.re.kr).
The supplement related to this article is available online at: https://doi.org/10.5194/acp-19-7583-2019-supplement.
JK and YJY designed the study; YG, JHC, HJK, KTP, JP and BYL analyzed aerosol data. JK and YJY prepared the manuscript with contributions from all co-authors.
The authors declare that they have no conflict of interest.
We would like to thank the many technicians and scientists of the overwintering crews. This work was supported by the KOPRI project (PE19010) and a Korea Grant from the Korean Government (MSIT) (NRF-2016M1A5A1901769) (KOPRI-PN19081).
This research has been supported by the Korea Polar Research Institute (grant no. PE19010).
This paper was edited by Veli-Matti Kerminen and reviewed by three anonymous referees.
Albrecht, B. A.: Aerosols, cloud microphysics, and fractional cloudiness, Science, 245, 1227–1230, https://doi.org/10.1126/science.245.4923.1227, 1989.
Anttila, T., Brus, D., Jaatinen, A., Hyvärinen, A.-P., Kivekäs, N., Romakkaniemi, S., Komppula, M., and Lihavainen, H.: Relationships between particles, cloud condensation nuclei and cloud droplet activation during the third Pallas Cloud Experiment, Atmos. Chem. Phys., 12, 11435–11450, https://doi.org/10.5194/acp-12-11435-2012, 2012.
Asmi, E., Frey, A., Virkkula, A., Ehn, M., Manninen, H. E., Timonen, H., Tolonen-Kivimäki, O., Aurela, M., Hillamo, R., and Kulmala, M.: Hygroscopicity and chemical composition of Antarctic sub-micrometre aerosol particles and observations of new particle formation, Atmos. Chem. Phys., 10, 4253–4271, https://doi.org/10.5194/acp-10-4253-2010, 2010.
Barbaro, E., Padoan, S., Kirchgeorg, T., Zangrando, R., Toscano, G., Barbante, C., and Gambaro, A.: Particle size distribution of inorganic and organic ions in coastal and inland Antarctic aerosol, Environ. Sci. Pollut. Res., 24, 2724–2733, https://doi.org/10.1007/s11356-016-8042-x, 2017.
Bianchi, F., Tröstl, J., Junninen, H., Frege, C., Henne, S., Hoyle, C. R., Molteni, U., Herrmann, E., Adamov, A., Bukowiecki, N., Chen, X., Duplissy, J., Gysel, M., Hutterli, M., Kangasluoma, J., Kontkanen, J., Kürten, A., Manninen, H. E., Münch, S., Peräkylä, O., Petäjä, T., Rondo, L., Williamson, C., Weingartner, E., Curtius, J., Worsnop, D. R., Kulmala, M., Dommen, J., and Baltensperger, U.: New particle formation in the free troposphere: A question of chemistry and timing, Science, 352, 1109–1112, https://doi.org/10.1126/science.aad5456, 2016.
Carslaw, K. S., Lee, L. A., Reddington, C. L., Pringle, K. J., Rap, A., Forster, P. M., Mann, G. W., Spracklen, D. V., Woodhouse, M. T., Regayre, L. A., and Pierce, J. R.: Large contribution of natural aerosols to uncertainty in indirect forcing, Nature, 503, 67–71, https://doi.org/10.1038/nature12674, 2013.
Dal Maso, M.: Condensation and coagulation sinks and formation of nucleation mode particles in coastal and boreal forest boundary layers, J. Geophys. Res., 107, 8097, https://doi.org/10.1029/2001jd001053, 2002.
Dal Maso, M., Kulmala, M., Riipinen, I., Wagner, R., Hussein, T., Aalto, P. P., and Lehtinen, K. E. J.: Formation and growth of fresh atmospheric aerosols: Eight years of aerosol size distribution data from SMEAR II, Hyytiälä, Finland, Boreal Environ. Res., 10, 323–336, 2005.
Dall'Osto, M., Beddows, D. C. S., Tunved, P., Krejci, R., Ström, J., Hansson, H. C., Yoon, Y. J., Park, K. T., Becagli, S., Udisti, R., Onasch, T., Ódowd, C. D., Simó, R., and Harrison, R. M.: Arctic sea ice melt leads to atmospheric new particle formation, Sci. Rep., 7, 3318, https://doi.org/10.1038/s41598-017-03328-1, 2017.
Fuchs, N. A. and Sutugin, A. G.: Highly Dispersed Aerosols, Ann Arbor Science Publ., Ann Arbor, Michigan, 1970.
Graf, H.-F., Shirsat, S. V., Oppenheimer, C., Jarvis, M. J., Podzun, R., and Jacob, D.: Continental scale Antarctic deposition of sulphur and black carbon from anthropogenic and volcanic sources, Atmos. Chem. Phys., 10, 2457–2465, https://doi.org/10.5194/acp-10-2457-2010, 2010.
Grenfell, J. L., Harrison, R. M., Allen, A. G., Shi, J. P., Penkett, S. A., O'Dowd, C. D., Smith, M. H., Hill, M. K., Robertson, L., Hewitt, C. N., Davison, B., Lewis, A. C., Creasey, D. J., Heard, D. E., Hebestreit, K., Alicke, B., and James, J.: An analysis of rapid increases in condensation nuclei concentrations at a remote coastal site in western Ireland, J. Geophys. Res.-Atmos., 104, 13771–13780, 1999.
Hinds, W. C.: Aerosol Technology: Properties, Behavior, and Measurement of Airborne Particles, 2nd edn., Wiley-Interscience, New York, 1999.
Humphries, R. S., Schofield, R., Keywood, M. D., Ward, J., Pierce, J. R., Gionfriddo, C. M., Tate, M. T., Krabbenhoft, D. P., Galbally, I. E., Molloy, S. B., Klekociuk, A. R., Johnston, P. V., Kreher, K., Thomas, A. J., Robinson, A. D., Harris, N. R. P., Johnson, R., and Wilson, S. R.: Boundary layer new particle formation over East Antarctic sea ice – possible Hg-driven nucleation?, Atmos. Chem. Phys., 15, 13339–13364, https://doi.org/10.5194/acp-15-13339-2015, 2015.
Humphries, R. S., Klekociuk, A. R., Schofield, R., Keywood, M., Ward, J., and Wilson, S. R.: Unexpectedly high ultrafine aerosol concentrations above East Antarctic sea ice, Atmos. Chem. Phys., 16, 2185–2206, https://doi.org/10.5194/acp-16-2185-2016, 2016.
IPCC: Climate change 2013: The physical science basis, Intergovernmental panel on Climate Change, Cambridge University Press, New York, USA, 571–740, 2013.
Ito, T.: Size distribution of Antarctic submicron aerosols, Tellus B, 45, 145–159, 1993.
Jang, E., Park, K.-T., Yoon, Y. J., Kim, T.-W., Hong, S.-B., Becagli, S., Traversi, R., Kim, J., and Gim, Y.: New particle formation events observed at the King Sejong Station, Antarctic Peninsula – Part 2: Link with the oceanic biological activities, Atmos. Chem. Phys., 19, 7595–7608, https://doi.org/10.5194/acp-19-7595-2019, 2019.
Järvinen, E., Virkkula, A., Nieminen, T., Aalto, P. P., Asmi, E., Lanconelli, C., Busetto, M., Lupi, A., Schioppo, R., Vitale, V., Mazzola, M., Petäjä, T., Kerminen, V.-M., and Kulmala, M.: Seasonal cycle and modal structure of particle number size distribution at Dome C, Antarctica, Atmos. Chem. Phys., 13, 7473–7487, https://doi.org/10.5194/acp-13-7473-2013, 2013.
Keil, A. and Wendisch, M.: Bursts of Aitken mode and ultrafine particles observed at the top of continental boundary layer clouds, J. Aerosol. Sci., 32, 649–660, https://doi.org/10.1016/s0021-8502(00)00102-6, 2001.
Kim, J., Yoon, Y. J., Gim, Y., Kang, H. J., Choi, J. H., Park, K.-T., and Lee, B. Y.: Seasonal variations in physical characteristics of aerosol particles at the King Sejong Station, Antarctic Peninsula, Atmos. Chem. Phys., 17, 12985–12999, https://doi.org/10.5194/acp-17-12985-2017, 2017.
Kim, J. S., Kim, Y. J., and Park, K.: Measurements of hygroscopicity and volatility of atmospheric ultrafine particles in the rural Pearl River Delta area of China, Atmos. Environ., 45, 4661–4670, 2011.
Komppula, M., Lihavainen, H., Hatakka, J., Paatero, J., Aalto, P., Kulmala, M., and Viisanen, Y.: Observations of new particle formation and size distributions at two different heights and surroundings in subarctic area in northern Finland, J. Geophys. Res.-Atmos., 108, 4295, https://doi.org/10.1029/2002jd002939, 2003.
Kontkanen, J., Lehtipalo, K., Ahonen, L., Kangasluoma, J., Manninen, H. E., Hakala, J., Rose, C., Sellegri, K., Xiao, S., Wang, L., Qi, X., Nie, W., Ding, A., Yu, H., Lee, S., Kerminen, V.-M., Petäjä, T., and Kulmala, M.: Measurements of sub-3 nm particles using a particle size magnifier in different environments: from clean mountain top to polluted megacities, Atmos. Chem. Phys., 17, 2163–2187, https://doi.org/10.5194/acp-17-2163-2017, 2017.
Kulmala, M., Dal Maso, M., Mäkelä, J. M., Pirjola, L., Väkevä, M., Aalto, P., Miikkulainen, P., Hämeri, K., and O'Dowd, C. D.: On the formation, growth and composition of nucleation mode particles, Tellus B, 53, 479–490, 2001.
Kulmala, M., Vehkamäki, H., Petäjä, T., Dal Maso, M., Lauri, A., Kerminen, V. M., Birmili, W., and McMurry, P. H.: Formation and growth rates of ultrafine atmospheric particles: A review of observations, J. Aerosol. Sci., 35, 143–176, https://doi.org/10.1016/j.jaerosci.2003.10.003, 2004.
Kulmala, M., Petäjä, T., Mönkkönen, P., Koponen, I. K., Dal Maso, M., Aalto, P. P., Lehtinen, K. E. J., and Kerminen, V.-M.: On the growth of nucleation mode particles: source rates of condensable vapor in polluted and clean environments, Atmos. Chem. Phys., 5, 409–416, https://doi.org/10.5194/acp-5-409-2005, 2005.
Kyrö, E.-M., Kerminen, V.-M., Virkkula, A., Dal Maso, M., Parshintsev, J., Ruíz-Jimenez, J., Forsström, L., Manninen, H. E., Riekkola, M.-L., Heinonen, P., and Kulmala, M.: Antarctic new particle formation from continental biogenic precursors, Atmos. Chem. Phys., 13, 3527–3546, https://doi.org/10.5194/acp-13-3527-2013, 2013.
Nguyen, Q. T., Glasius, M., Sørensen, L. L., Jensen, B., Skov, H., Birmili, W., Wiedensohler, A., Kristensson, A., Nøjgaard, J. K., and Massling, A.: Seasonal variation of atmospheric particle number concentrations, new particle formation and atmospheric oxidation capacity at the high Arctic site Villum Research Station, Station Nord, Atmos. Chem. Phys., 16, 11319–11336, https://doi.org/10.5194/acp-16-11319-2016, 2016.
O'Dowd, C. D., Hämeri, K., Mäkelä, J., Väkeva, M., Aalto, P., De Leeuw, G., Kunz, G. J., Becker, E., Hansson, H. C., Allen, A. G., Harrison, R. M., Berresheim, H., Kleefeld, C., Geever, M., Jennings, S. G., and Kulmala, M.: Coastal new particle formation: Environmental conditions and aerosol physicochemical characteristics during nucleation bursts, J. Geophys. Res.-Atmos., 107, 8107, https://doi.org/10.1029/2000JD000206, 2002.
Park, J., Sakurai, H., Vollmers, K., and McMurry, P. H.: Aerosol size distributions measured at the South Pole during ISCAT, Atmos. Environ., 38, 5493–5500, https://doi.org/10.1016/j.atmosenv.2002.12.001, 2004.
Park, K., Kim, J. S., and Seung, H. P.: Measurements of hygroscopicity and volatility of atmospheric ultrafine particles during ultrafine particle formation events at urban, industrial, and coastal sites, Environ. Sci. Technol., 43, 6710–6716, 2009.
Pierce, J. R. and Adams, P. J.: Efficiency of cloud condensation nuclei formation from ultrafine particles, Atmos. Chem. Phys., 7, 1367–1379, https://doi.org/10.5194/acp-7-1367-2007, 2007.
Pierce, J. R., Westervelt, D. M., Atwood, S. A., Barnes, E. A., and Leaitch, W. R.: New-particle formation, growth and climate-relevant particle production in Egbert, Canada: analysis from 1 year of size-distribution observations, Atmos. Chem. Phys., 14, 8647–8663, https://doi.org/10.5194/acp-14-8647-2014, 2014.
Rose, C., Sellegri, K., Velarde, F., Moreno, I., Ramonet, M., Weinhold, K., Krejci, R., Andrade, M., Wiedensohler, A., and Laj, P.: Frequent nucleation events at the high altitude station of Chacaltaya (5240 m a.s.l.), Bolivia, Atmos. Environ., 102, 18–29, https://doi.org/10.1016/j.atmosenv.2014.11.015, 2015.
Rose, C., Sellegri, K., Moreno, I., Velarde, F., Ramonet, M., Weinhold, K., Krejci, R., Andrade, M., Wiedensohler, A., Ginot, P., and Laj, P.: CCN production by new particle formation in the free troposphere, Atmos. Chem. Phys., 17, 1529–1541, https://doi.org/10.5194/acp-17-1529-2017, 2017.
Shen, X., Sun, J., Zhang, X., Zhang, Y., Zhang, L., and Fan, R.: Key features of new particle formation events at background sites in China and their influence on cloud condensation nuclei, Front. Environ. Sci. Eng., 10, 5, https://doi.org/10.1007/s11783-016-0833-2, 2016.
Shirsat, S. V. and Graf, H. F.: An emission inventory of sulfur from anthropogenic sources in Antarctica, Atmos. Chem. Phys., 9, 3397–3408, https://doi.org/10.5194/acp-9-3397-2009, 2009.
Spracklen, D. V., Carslaw, K. S., Kulmala, M., Kerminen, V.-M., Mann, G. W., and Sihto, S.-L.: The contribution of boundary layer nucleation events to total particle concentrations on regional and global scales, Atmos. Chem. Phys., 6, 5631–5648, https://doi.org/10.5194/acp-6-5631-2006, 2006.
Stein, A. F., Draxler, R. R., Rolph, G. D., Stunder, B. J. B., Cohen, M. D., and Ngan, F.: Noaa's hysplit atmospheric transport and dispersion modeling system, B. Am. Meteorol. Soc., 96, 2059–2077, https://doi.org/10.1175/bams-d-14-00110.1, 2015.
Twomey, S.: The Influence of Pollution on the Shortwave Albedo of Clouds, J. Atmos. Sci., 34, 1149–1152, https://doi.org/10.1175/1520-0469(1977)034<1149:Tiopot>2.0.Co;2, 1977.
Virkkula, A., Asmi, E., Teinilä, K., Frey, A., Aurela, M., Timonen, H., Mäkelä, T., Samuli, A., Hillamo, R., Aalto, P. P., Kirkwood, S., and Kulmala, M.: Review of aerosol research at the Finnish Antarctic research station Aboa and its surroundings in Queen Maud Land, Antarctica, Geophysica, 45, 163–181, 2009.
Warren, D. R. and Seinfeld, J. H.: Prediction of aerosol concentrations resulting from a burst of nucleation, J. Colloid. Interf. Sci., 105, 136–142, https://doi.org/10.1016/0021-9797(85)90356-X, 1985.
Weingartner, E., Nyeki, S., and Baltensperger, U.: Seasonal and diurnal variation of aerosol size distributions (10 < D < 750 nm) at a high-alpine site (Jungfraujoch 3580 m a.s.l.), J. Geophys. Res.-Atmos., 104, 26809–26820, 1999.
Weller, R., Schmidt, K., Teinilä, K., and Hillamo, R.: Natural new particle formation at the coastal Antarctic site Neumayer, Atmos. Chem. Phys., 15, 11399–11410, https://doi.org/10.5194/acp-15-11399-2015, 2015.
Willis, M. D., Burkart, J., Thomas, J. L., Köllner, F., Schneider, J., Bozem, H., Hoor, P. M., Aliabadi, A. A., Schulz, H., Herber, A. B., Leaitch, W. R., and Abbatt, J. P. D.: Growth of nucleation mode particles in the summertime Arctic: a case study, Atmos. Chem. Phys., 16, 7663–7679, https://doi.org/10.5194/acp-16-7663-2016, 2016.
Woo, K. S., Chen, D. R., Pui, D. Y. H., and McMurry, P. H.: Measurement of Atlanta aerosol size distributions: Observations of ultrafine particle events, Aerosol Sci. Technol., 34, 75–87, 2001.
Yli-Juuti, T., Riipinen, I., Aalto, P. P., Nieminen, T., Maenhaut, W., Janssens, I. A., Claeys, M., Salma, I., Ocskay, R., Hoffer, A., Imre, K., and Kulmala, M.: Characteristics of new particle formation events and cluster ions at K-puszta, Hungary, Boreal Environ. Res., 14, 683–698, 2009.
Yoon, Y. J., O'Dowd, C. D., Jennings, S. G., and Lee, S. H.: Statistical characteristics and predictability of particle formation events at Mace Head, J. Geophys. Res.-Atmos., 111, D13204, https://doi.org/10.1029/2005JD006284, 2006.
Yu, F. and Luo, G.: Oceanic dimethyl sulfide emission and new particle formation around the coast of antarctica: A modeling study of seasonal variations and comparison with measurements, Atmosphere, 1, 34–50, https://doi.org/10.3390/atmos1010034, 2010.