the Creative Commons Attribution 4.0 License.
the Creative Commons Attribution 4.0 License.
 | 04 Jun 2019
Simultaneous measurements of aerosol size distributions at three sites in the European high Arctic
David C. S. Beddows
Peter Tunved
Roy M. Harrison
Angelo Lupi
Vito Vitale
Silvia Becagli
Rita Traversi
Ki-Tae Park
Young Jun Yoon
Andreas Massling
Henrik Skov
Robert Lange
Johan Strom
Radovan Krejci
Aerosols are an integral part of the Arctic climate system due to their direct interaction with radiation and indirect interaction through cloud formation. Understanding aerosol size distributions and their dynamics is crucial for the ability to predict these climate relevant effects. When of favourable size and composition, both long-range-transported – and locally formed particles – may serve as cloud condensation nuclei (CCN). Small changes of composition or size may have a large impact on the low CCN concentrations currently characteristic of the Arctic environment. We present a cluster analysis of particle size distributions (PSDs; size range 8–500 nm) simultaneously collected from three high Arctic sites during a 3-year period (2013–2015). Two sites are located in the Svalbard archipelago: Zeppelin research station (ZEP; 474 m above ground) and the nearby Gruvebadet Observatory (GRU; about 2 km distance from Zeppelin, 67 m above ground). The third site (Villum Research Station at Station Nord, VRS; 30 m above ground) is 600 km west-northwest of Zeppelin, at the tip of north-eastern Greenland. The GRU site is included in an inter-site comparison for the first time. K-means cluster analysis provided eight specific aerosol categories, further combined into broad PSD classes with similar characteristics, namely pristine low concentrations (12 %–14 % occurrence), new particle formation (16 %–32 %), Aitken (21 %–35 %) and accumulation (20 %–50 %). Confined for longer time periods by consolidated pack sea ice regions, the Greenland site GRU shows PSDs with lower ultrafine-mode aerosol concentrations during summer but higher accumulation-mode aerosol concentrations during winter, relative to the Svalbard sites. By association with chemical composition and cloud condensation nuclei properties, further conclusions can be derived. Three distinct types of accumulation-mode aerosol are observed during winter months. These are associated with sea spray (largest detectable sizes, >400 nm), Arctic haze (main mode at 150 nm) and aged accumulation-mode (main mode at 220 nm) aerosols. In contrast, locally produced particles, most likely of marine biogenic origin, exhibit size distributions dominated by the nucleation and Aitken mode during summer months. The obtained data and analysis point towards future studies, including apportioning the relative contribution of primary and secondary aerosol formation processes and elucidating anthropogenic aerosol dynamics and transport and removal processes across the Greenland Sea. In order to address important research questions in the Arctic on scales beyond a singular station or measurement events, it is imperative to continue strengthening international scientific cooperation.
- Article
(4850 KB) - Companion paper
- BibTeX
- EndNote


The Arctic is a region sensitive to perturbations of the radiation budget, with complex feedback mechanisms. Since the 1980s this has led to a temperature increase of more than twice the global average (Cohen et al., 2014; Pithan and Mauritsen, 2014). Aerosols perturb the radiation balance of the Arctic environment in numerous ways (Carslaw et al., 2013). The contribution by aerosols to radiative forcing is a very important parameter, although it is still highly uncertain (IPCC, 2014). In order to improve the ability to estimate direct and indirect climate effects, a better knowledge of aerosols is an essential requisite. This includes aerosol properties and seasonal variability, their sources and the associated atmospheric reactions and transport processes. One of the main characteristic properties of an aerosol is the size distribution. The size distribution of Arctic aerosols shows a strong annual cycle. For example, the first full year of measurements of Arctic aerosol size distributions and chemical composition was conducted at the Zeppelin station in Svalbard (Ström et al., 2003), showing a very strong seasonal dependence of the number mode particle size. Tunved et al. (2013) subsequently reported a qualitative and quantitative assessment of more than 10 years of aerosol number size distribution data from the same location. They reported that seasonal variation seems to be controlled by both dominant sources as well as meteorological conditions. This can be broadly summarised in three distinctly different periods: accumulation-mode aerosol during the haze period (March–May), followed by high concentrations of locally formed small particles (June–August) and low concentrations of accumulation-mode particles and negligible abundance of ultrafine particles for the remainder of the year (September–February). Additional results from multi-year measurements reported similar conclusions using aerosol number size distributions collected at Tiksi (Asmi et al., 2016), Alert (Croft et al., 2016), Utqiaġvik (formerly Barrow; Lathem et al., 2013; Sharma et al., 2006; Polissar et al., 2001) and Villum Research Station at Station Nord (Nguyen et al., 2016).
Currently, the Arctic haze is not well represented within atmospheric models, mainly due to inadequate representation of scavenging processes, different transport mechanisms and underestimation and an unknown number of aerosol sources (Browse et al., 2014). Recently, the aerosol population was categorised via cluster analysis of aerosol size distributions taken at Zeppelin Mountain (Svalbard; Dall'Osto et al., 2017a) during an 11-year record (2000–2010) and at Villum Research Station (Greenland; Dall'Osto et al., 2018b) during a 5-year period (2012–2016). Outside the Arctic haze season, natural aerosol sources have been emphasised to be more important than transport from continental anthropogenic sources. Air mass trajectory analysis linked frequent nucleation events to biogenic precursors released by open water and melting sea ice regions, especially during the summer season. Both studies reported a striking negative correlation ( and −0.75, respectively) between sea ice extent and nucleation events. Given the likely decrease in future Arctic sea ice extent (Holland et al., 2006; Stroeve et al., 2012), the production and impact of natural ultrafine Arctic aerosols could increase as well in the future (Burkart et al., 2017; Dall'Osto et al., 2017a, 2018b, c). However, it was stressed that further studies are needed, given other new particle formation source regions and mechanisms exist, including the influence of emissions from seabird colonies (Croft et al., 2016; Weber et al., 1998) and intertidal zones (O'Dowd et al., 2002; Sipilä et al., 2016).
With this work, we wish to extend the knowledge of pan-Arctic aerosol dynamics. It is becoming evident that coordinated field measurement studies of ambient aerosol size distributions are essential to elucidate the complex interactions between the cryosphere, atmosphere, ocean and biosphere in different regions (Dall'Osto et al., 2018a, b). In this regard, an emerging multi-year set of observed aerosol number size distributions in the diameter range of 10 to 500 nm from five sites around the Arctic Ocean (Alert, Villum Research Station at Station Nord, Zeppelin, Tiksi and Utqiaġvik, formerly Barrow) was recently assembled and analysed (Freud et al., 2017). Major accumulation-mode aerosol sources were found in central Siberia and western Russia, and wet removal by snow or rain was found to be the main sink for accumulation-mode particles. It was argued that there is no single site that can be considered as being fully representative of the entire Arctic region with respect to aerosol number concentrations and distributions. Following the pioneering study of Freud et al. (2017), the aim of this paper is to present a detailed analysis of the main differences and similarities of the general features of the number size distributions between three different sites across a more specific area in the Arctic in the North Atlantic sector. We use data from the stations Gruvebadet (GRU), Zeppelin (ZEP) and Villum Research Station at Station Nord (VRS). The European Arctic is understood here as the part of the circumpolar Arctic located between Greenland and north-west Russia. Geographically, Greenland is part of the continent of North America. The Fram Stait, roughly between 77 and 81∘ N latitude and centred on the prime meridian, is located between Greenland and Svalbard islands. The climate in the Northern Hemisphere is centred in the Fram Strait. The Gulf Stream brings warm water to the eastern part of Fram Strait, where Svalbard is located, creating a mild climate, whereas an ice stream is flowing out of the Arctic Ocean along the east coast of Greenland, with a strong cooling effect. As a consequence, a large atmospheric temperature gradient exists across the Fram Strait of 16 ∘C, with an annual average temperature at Villum Research Station at Station Nord of −16 and −2 ∘C at Longyear byen, Svalbard. 18 years of observational data form the basis for a Ny-Ålesund atmospheric surface climatology which provided a statistical analysis showing an increase of air temperature of 1.35 ∘C per decade for the years 1994–2010 (Maturilli et al., 2013, 2015). This gradient has large consequences for the physical and chemical processes as well as for the biological systems (Fadeev et al., 2018; Randelhoff et al., 2018). In a nutshell, the Svalbard archipelago is among the Arctic regions that has experienced the greatest temperature increase during the last three decades (Nordli et al., 2014), therefore comparing aerosol measurements simultaneously collected in Greenland and Svalbard is essential to better understand aerosol sources and processes that may affect the changing climate. Previous studies have focused on the characterisation via air mass origin frequency and occurrence of different aerosol modes over timescales on the order of weeks to years (Ström et al., 2003; Tunved et al., 2013; Nguyen et al., 2016; Lupi et al., 2016) but only using a single station as a monitoring site. A brief comparison between ZEP and GRU was made in Lupi et al. (2016), showing good agreement over a period of 3 months.
Statistical tools are valuable when analysing large datasets from multiple locations. To capture more scales of Arctic aerosol variability, it is important to merge intensive field campaigns and long-term measurements across different stations. Provision of the extensive resource-demanding equipment required is only possible by means of international collaborations such those created in the present work. A growing effort in understanding recent drastic changes in the Arctic climate has stimulated more measurements, and a growing number of monitoring sites have become active. In the present work, aerosol size distributions are analysed using k-means cluster analysis (Beddows et al., 2009) applied to a long-term dataset composed of 3 years (2013–2015) of simultaneously recorded data at three stations (GRU, ZEP, VRS). This is the first time that the GRU site is used in a comparison of multi-year aerosol number size distribution datasets. All size distributions are quality assured and not filtered according to any other criteria. The cluster analysis applied herein uses the degree of similarity between individual observations to define groups and to assign group membership. By doing so, our clustering method provides a number of group average size distributions which can be compared across different time periods and monitoring sites (Beddows et al., 2009; Dall'Osto et al., 2011, 2018b). Whilst a number of intensive field studies have focused on single site datasets (Tunved et al., 2013; Dall'Osto et al., 2017a, 2018b), cluster analyses of multi-site long-term particle size distribution measurements are scarce (Freud et al., 2017; Dall'Osto et al., 2018b). It is important to stress that the only aim of this study was to compare the three stations by apportioning different aerosol categories and possible source associations. Future studies will look at the transport, both vertical (i.e. between VRS and GRU/VRS) and horizontal (i.e between GRU and ZEP), of both anthropogenic and natural aerosols.
2.1 Site description
Ultrafine aerosol size distributions were measured at three different sites. Figure 1 shows the location and the sea ice coverage across the whole of 2015 taken as an example. The measurement site of Zeppelin Mountain (ZEP) in the Ny-Ålesund community on Svalbard is situated at N and E. The Zeppelin (ZEP) station is located 474 m above sea level and is practically unaffected by local anthropogenic aerosol and pollution sources. Compared to stations closer to sea level, the Zeppelin station is less affected by local particle production occurring in the surf zone and by local air flow phenomena such as katabatic winds (Ström et al., 2003). The ZEP station is part of ACTRIS Data Centre (ACTRIS DC; developed through the EU project Aerosols, Clouds, and Trace gases Research InfraStructure Network; http://www.actris.eu, last access: 31 May 2019 – within the EC Seventh Framework Programme under “Research Infrastructures for Atmospheric Research”), part of the Global Atmosphere Watch (GAW) programme, and it has likely produced the longest existing Arctic aerosol size distribution dataset (Ström et al., 2003; Tunved et al., 2010; Freud et al., 2017).
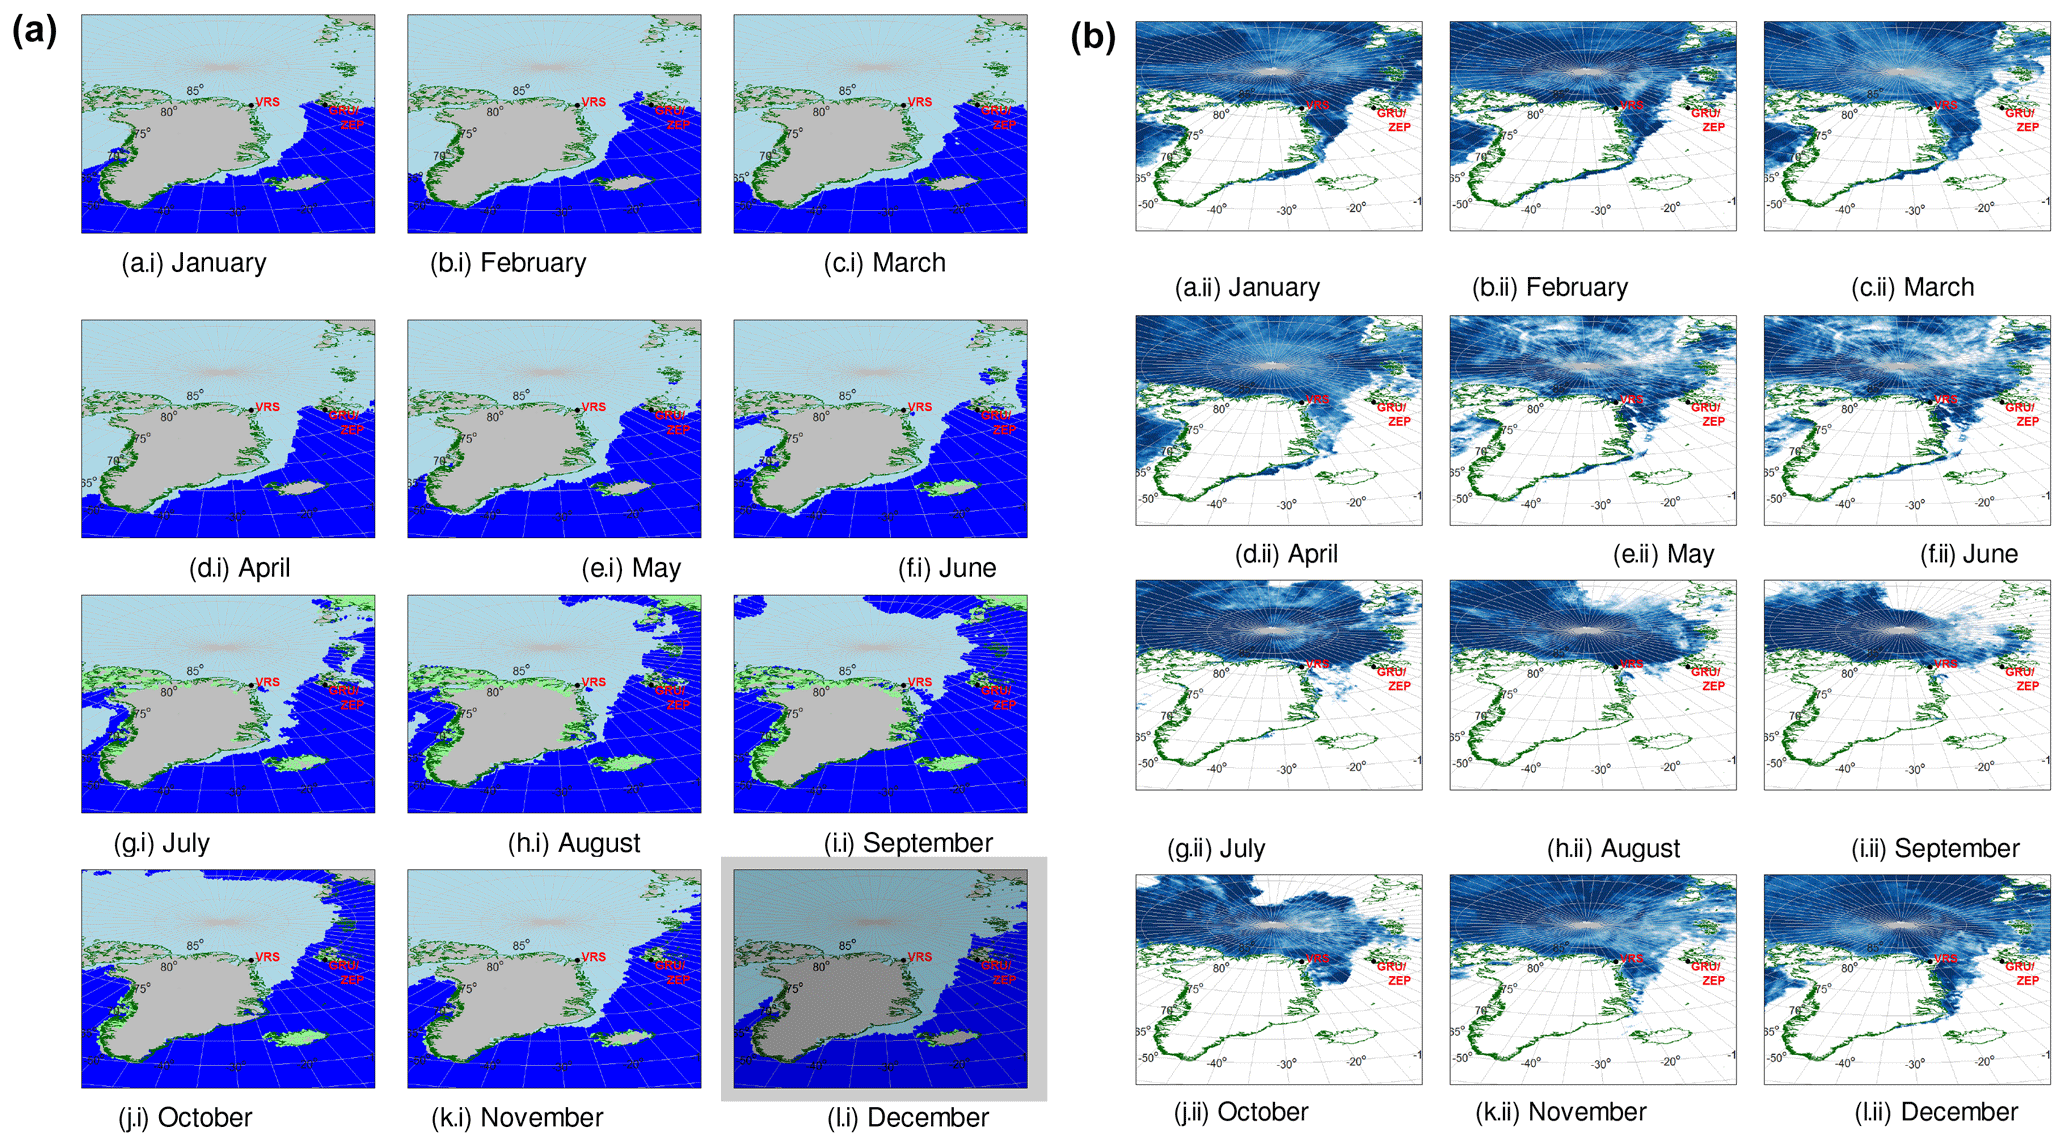
Figure 1(a) Sea ice (light blue), open water (dark blue), snow on land (grey) and land (light green) maps for the period March–October (a–h). Land borders are marked in dark green. (b) Sea ice maps (sea ice in dark blue) for the period March–October (a–h). Land borders are marked in dark green. Snow, land and open water are in white.
The Gruvebadet (GRU) observatory is also located in the proximity of the village of Ny-Ålesund ( N, E) in the island archipelago of Svalbard. The observatory is 67 m above sea level, located south-east of the main buildings of the village. It is located about 2 km from the ZEP station, at about 350 m lower altitude. Aerosol size distributions were collected usually from the end of March to the beginning of September.
About 800 km away from Svalbard, the Villum Research Station (VRS) is situated at the Station Nord military facility. Located at N, W, the station is situated in the most north-eastern part of Greenland, on the coast of the Fram Strait. The sampling took place about 2 km south-west of the main facilities of the military camp, in two different sampling stations, as measurements were shifted in summer 2015 from the original hut called “Flygers hut” to the new air observatory, 300 m west of Flygers hut. The sampling locations are located upwind of the military camp most of the time (Lange et al., 2018). Detailed descriptions of the site and analysis of predominant wind directions are available elsewhere (Nguyen et al., 2016, 2013).
2.2 Dataset
2.2.1 ZEP DMPS
The Differential Mobility Particle Sizer (DMPS) system comprises a custom-built twin differential mobility analyser (DMA) setup, including one Vienna-type medium DMA coupled to a TSI Condensation Particle Counter (CPC) 3010, covering sizes between 25 and 800 nm, and a Vienna-type short DMA coupled with a TSI CPC 3772, effectively covering sizes between 5 and 60 nm. The number size distributions from the two systems are transferred to a common size grid and merged. Both systems use a closed-loop setup. The instrument was inter-calibrated during an ACTRIS (https://www.actris.eu/, last access: 31 May 2019) workshop. Sizing and number concentrations are within 1 % and 5 % of the standard DMPS, respectively (Freud et al., 2017).
2.2.2 GRU SMPS
Aerosol size distribution in the diameter range from 10 to 470 nm using 54 channels was measured with a commercial Scanning Mobility Particle Sizer (SMPS TSI 3034; Hogrefe et al., 2006), with a time resolution of 10 min and particle size with a resolution of dlog Dj equivalent to 0.0312, where Dj indicates the instrumental class size. Further information can be found elsewhere (Lupi et al., 2016).
2.2.3 VRS SMPS
Scanning Mobility Particle Sizer (SMPS) data were collected in the period 2013–2015 in the size range of 9–915 nm in diameter. The SMPS is custom built with a Vienna-type medium column, and it used either a model TSI 3010 CPC or model TSI 7220 CPC. To ensure correct functioning, volumetric flow rates, temperatures and relative humidity (RH) of the aerosol and sheath flow were monitored, as well as inlet ambient pressure. No additional drying was performed, as the transition from the low ambient temperatures outside of the huts (−45 to +15 ∘C, yearly average −15 ∘C) to the heated inside (>20 ∘C) generally provides sufficient decrease in RH.
2.3 K-means cluster analysis
Approximately 25 000 aerosol size distributions obtained at 1 h resolution at the three monitoring sites were averaged to daily resolution, normalised by their vector length and analysed for clusters (Beddows et al., 2009). The standard procedure used (Beddows at al., 2014), including the cluster tendency test, provided a Hopkins index of 0.20 (Beddows et al., 2009). The method minimises the sum of squared distances between all points and the cluster centres. This allows identification of homogeneous groups by minimising the clustering error defined as the sum of the squared Euclidean distances between each data point and the corresponding cluster centre. The complexity of the dataset is reduced, allowing characterisation of the data according to the temporal and spatial trends of the clusters. In order to choose the optimum number of clusters, the Dunn index (DI) identifies dense and well-separated clusters. It provided a clear maximum for eight clusters, some of which belonged only to specific times of day, specific mechanisms and specific seasons.
2.4 Data analysis and additional chemical and physical supporting data
SMPS data from the three different stations were combined, and only days for which measurements were available at all three stations were considered in this analysis, resulting in 584 total days. Additional chemical and physical data were included in this study, in order to better describe the sampled aerosol types; these data were overlapped according to the same temporal trends when possible. PM10 sampling was performed at the GRU station by a TECORA Skypost sequential sampler equipped with a PM10 sampling head, operating following the EN 12341 European protocol. Aerosol samples were collected daily on Teflon (PALL Gelman) filters from March to September 2013–2015; in total 385 daily samples were analysed and overlapped with the GRU aerosol size distributions. Methane sulfonic acid (MSA) was determined by ion chromatography on the aqueous extract obtained from one-half of each filter (Becagli et al., 2016). Gaseous NH3 and SO2 data and inorganic aerosol species (Na, Mg, Cl, K, sulfate, nitrate, ammonium) at the ZEP monitoring site were obtained at daily resolution from the NILU website data for the period 2013–2015 (total of 650 overlapping days). Concentrations of cloud condensation nuclei (CCN) were measured continuously using a commercially available Droplet Measurement Technology (DMT) CCN counter at the ZEP station. In this study we used CCN concentrations at a supersaturation of 0.4 %. 723 total days of sampling were obtained at hourly resolution for the years 2013–2015 and overlapped with the aerosol size distributions obtained at ZEP. The size distribution data were averaged over 24 h using the start and end time of the chemical measurements.
3.1 Average monthly size distributions
The monthly averaged aerosol size distributions – averaged from the hourly data available at the three sites – are presented in Fig. 2. Simultaneously collected data are presented for the whole years (2013–2015). However, GRU did not have data coverage during winter months (November through February). The average size distributions at ZEP and VRS are broadly similar during the months of January and February (Fig. 2a–b), with low particle number concentrations and a broad accumulation mode, though larger at the ZEP site (about 250 nm) than at the VRS one (about 180 nm). The months of March and April (Fig. 2c–d) present similar size distributions among the three stations, showing a main large accumulation-mode peak at about 190 nm, likely associated with the Arctic haze occurring mainly during these months. It is worth noting that higher ultrafine particle number concentrations are seen in these two months relative to January–February (Fig. 2a–b). During the month of May (Fig. 2e), a clear increase of ultrafine particles can be seen at the Svalbard sites (GRU, ZEP) due to local new particle formation. The increased occurrence of new particle formation (NPF) events in May was found to correspond with the increasing concentration of biogenic aerosol in the Svalbard sites (Becagli et al., 2016; Dall'Osto et al., 2017a). Interestingly, the VRS site does not show this enrichment, likely due to the fact that sea ice is still covering most of the areas near north-eastern Greenland (Dall'Osto et al., 2017a).
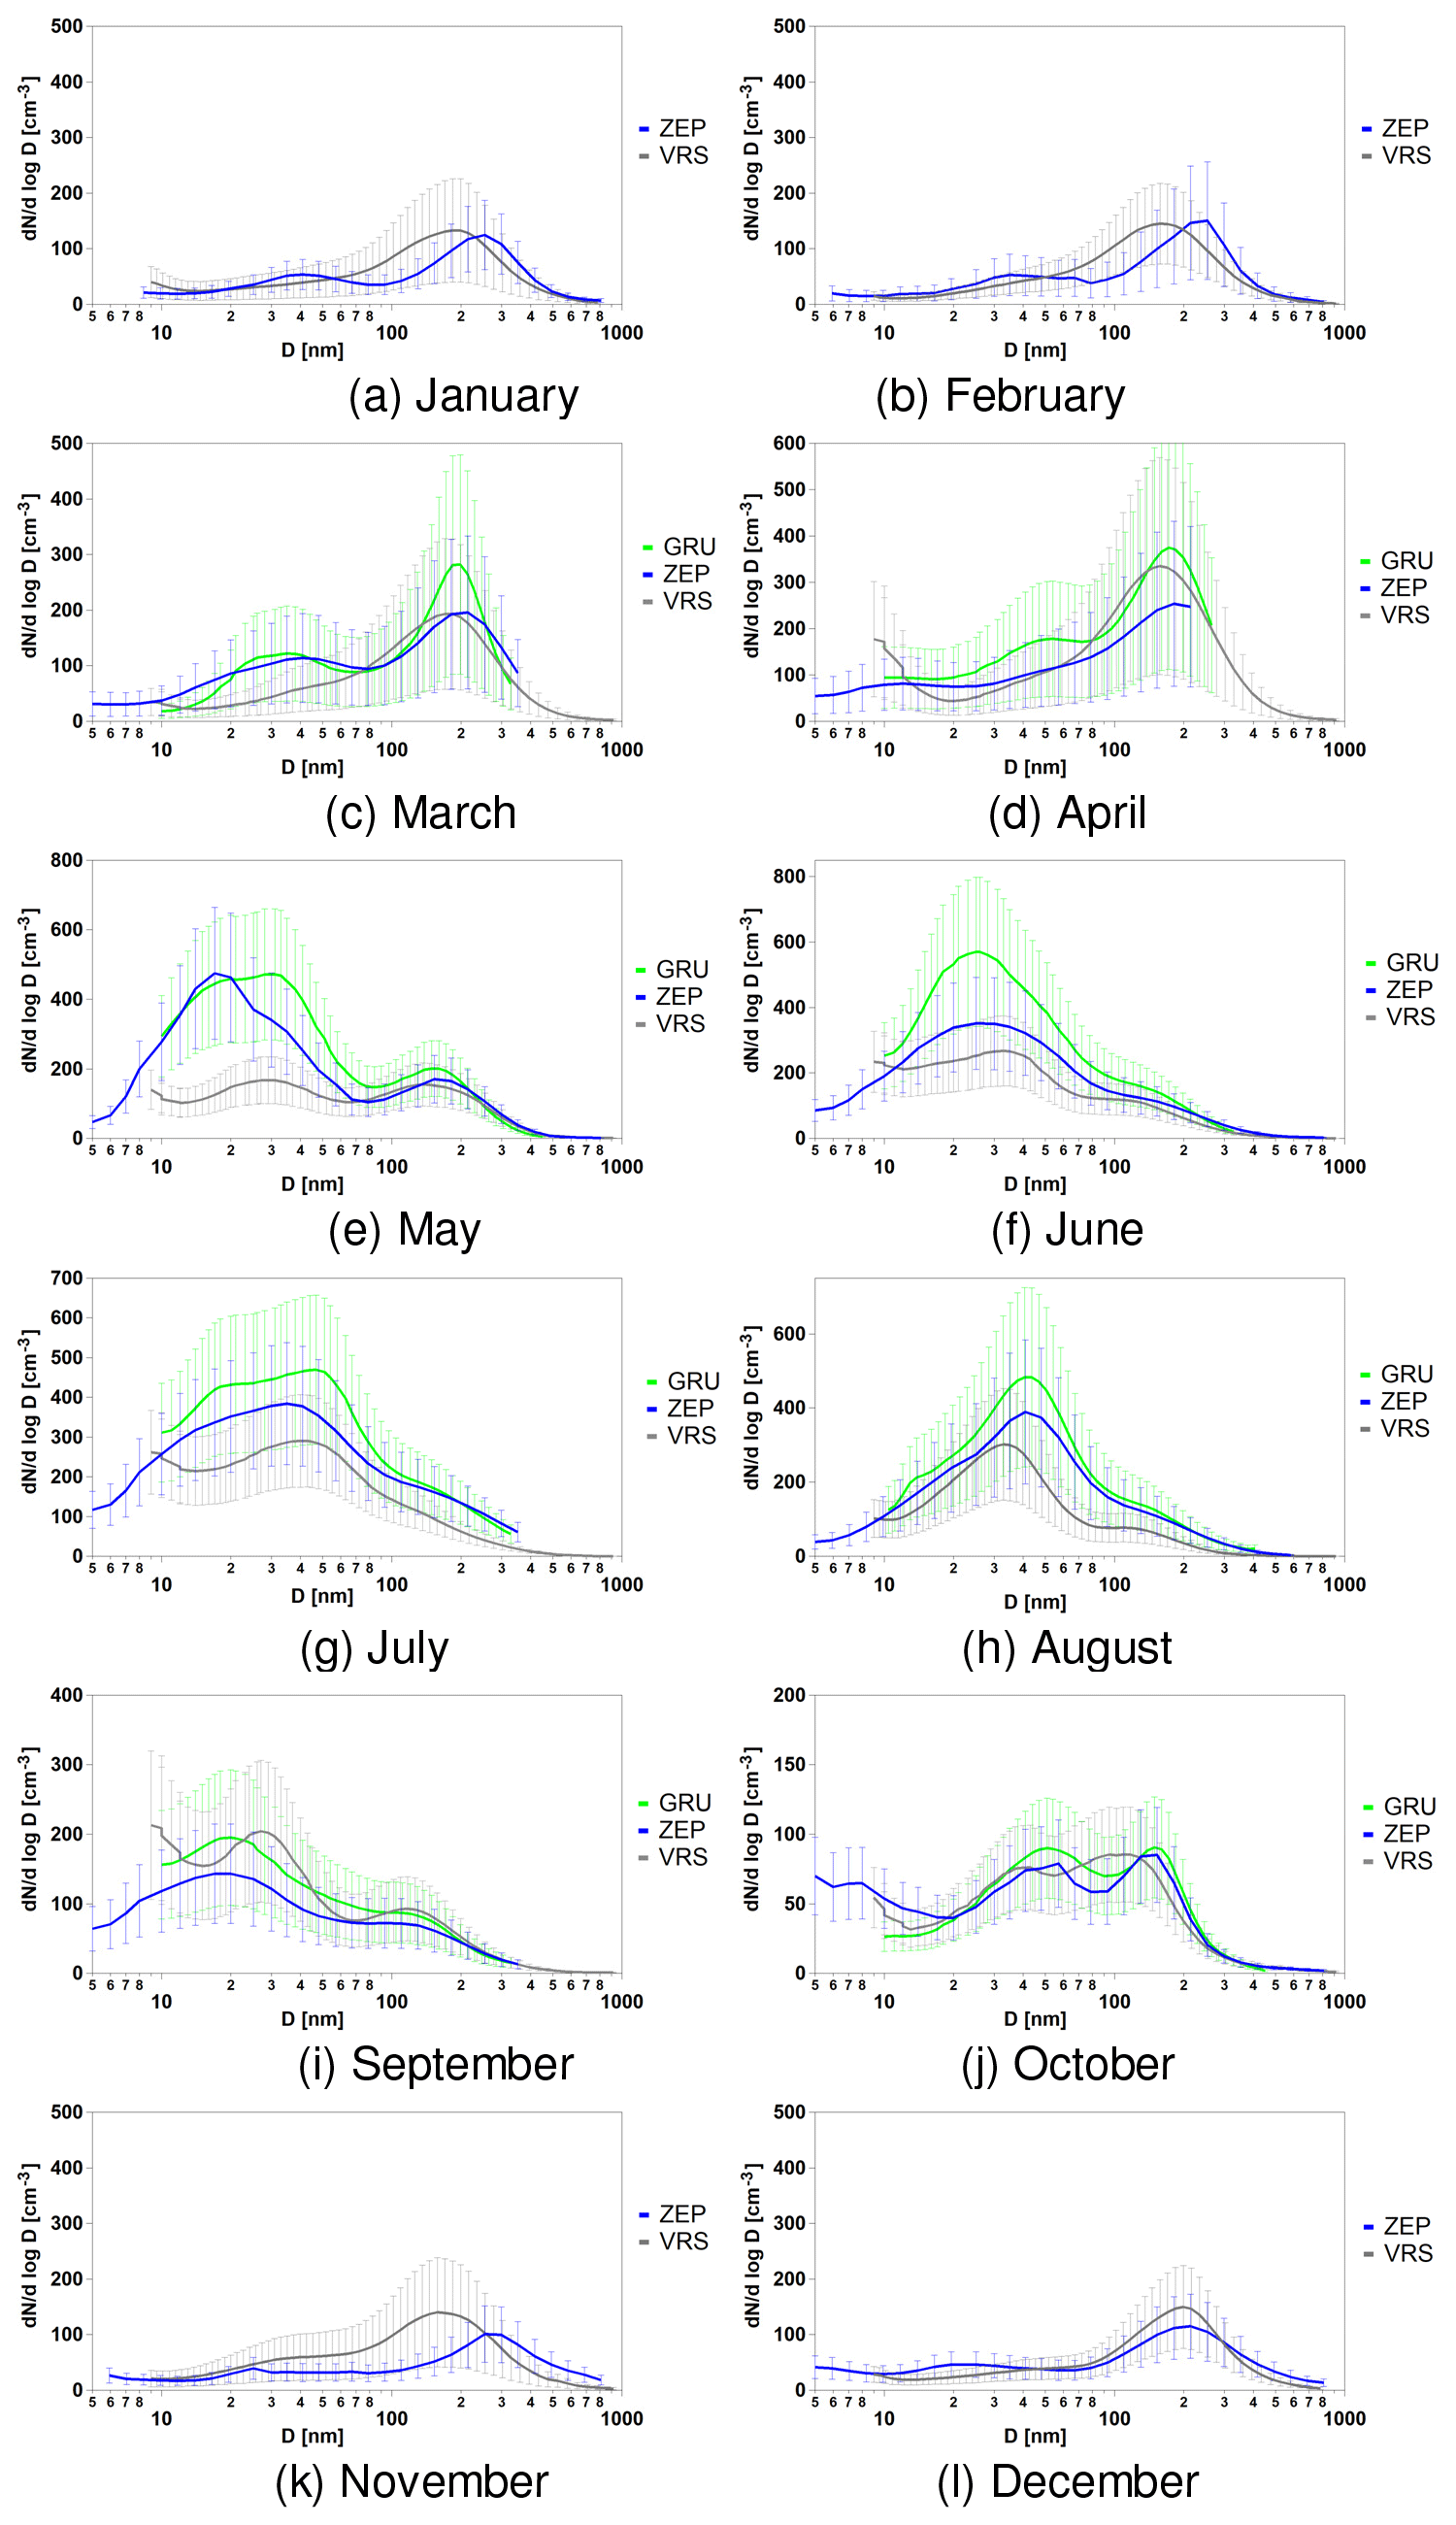
Figure 2Monthly average size distributions taken at the three sampling sites for the period January–December (a–l).
In contrast, during the summer months of June–August, progressively higher concentrations of ultrafine particles can be seen at all sites. Tunved et al. (2013) extensively discussed a strikingly sharp transition between spring and summer periods, a regime shifting between polluted spring and relatively cleaner summer at the ZEP site. Indeed, in a short period of time the accumulation aerosol dominating the springtime is diminished in favour of smaller particles (Engvall et al., 2008; Tunved et al., 2013).
The aerosol-mode transition from June to August is interesting. Already reported in Tunved et al. (2013), there is a shift from a monomodal mode at about 20–30 nm (June) to a monomodal mode at about 40–50 nm (August), with a transition bimodal mode in between (July). The reasons for this transition are likely to be multiple, including wet removal resulting in reduced condensation sink, leading to a higher concentration of gaseous precursors suitable for nucleation and new particle formation growing to larger modes (40–50 nm). Additionally, different nucleating gases and precursors may be playing a role in different seasons. Indeed, a strong increase in phytoplankton abundance typically occurs in the early spring (Arctic spring bloom), contributing to emissions of biogenic gas precursors (Becagli et al., 2016; Park et al., 2018). During summer, phytoplankton production beneath the ice-covered Arctic Ocean is considered to be minor because of the strong light attenuation properties of snow and sea ice; however this paradigm is being challenged by observations of under-ice phytoplankton blooms during the summer melt season (Arrigo et al., 2012; Mundy et al., 2014; Assmy et al., 2017).
Changes in sources, sinks and processes associated with colder autumn months (Tunved et al., 2013; Freud et al., 2017) later shift the aerosol modes seen at about 20–40 nm (September; Fig. 2i) to a bimodal-like aerosol distribution seen in October (Fig. 2j), with two main aerosol modes at about 50 and 150 nm, respectively. The remaining winter months show low particle number concentrations, where data are available for ZEP and VRS only. As expected, whilst the sites at GRU and ZEP are broadly similar, the VRS site located in Greenland seems to have fewer new particle events happening at a lower frequency. In order to fully elucidate the chemical and physical processes affecting the aerosol size distributions, we use statistical tools to reduce the complexity of these SMPS datasets.
3.2 K-means clustering analysis
The eight k-means clusters obtained exhibited frequencies of occurrence which varied between 1 % and 42 % (Table 1), without any clusters dominating the overall population. The individual clusters could be distributed into three main groups named nucleation, Aitken and accumulation classes. This additional classification was based not only upon their similar size distributions (see Fig. 3a–c) but also on consideration of strong similarities between chemical and physical parameters presented in the following sections. The reduction to the three more generic classifications was based on our data interpretation. The average aerosol size distributions of each aerosol category are presented in Fig. 3: (a) pristine and nucleation-mode classes; (b) Aitken-mode-dominated classes and (c) accumulation-mode-dominated classes.
Table 1Occurrence of the k-means cluster analysis featuring the eight aerosol categories detected at the three monitoring sites. At the bottom of the table general aerosol size distribution modes representing the sum of selected aerosol categories are reported.

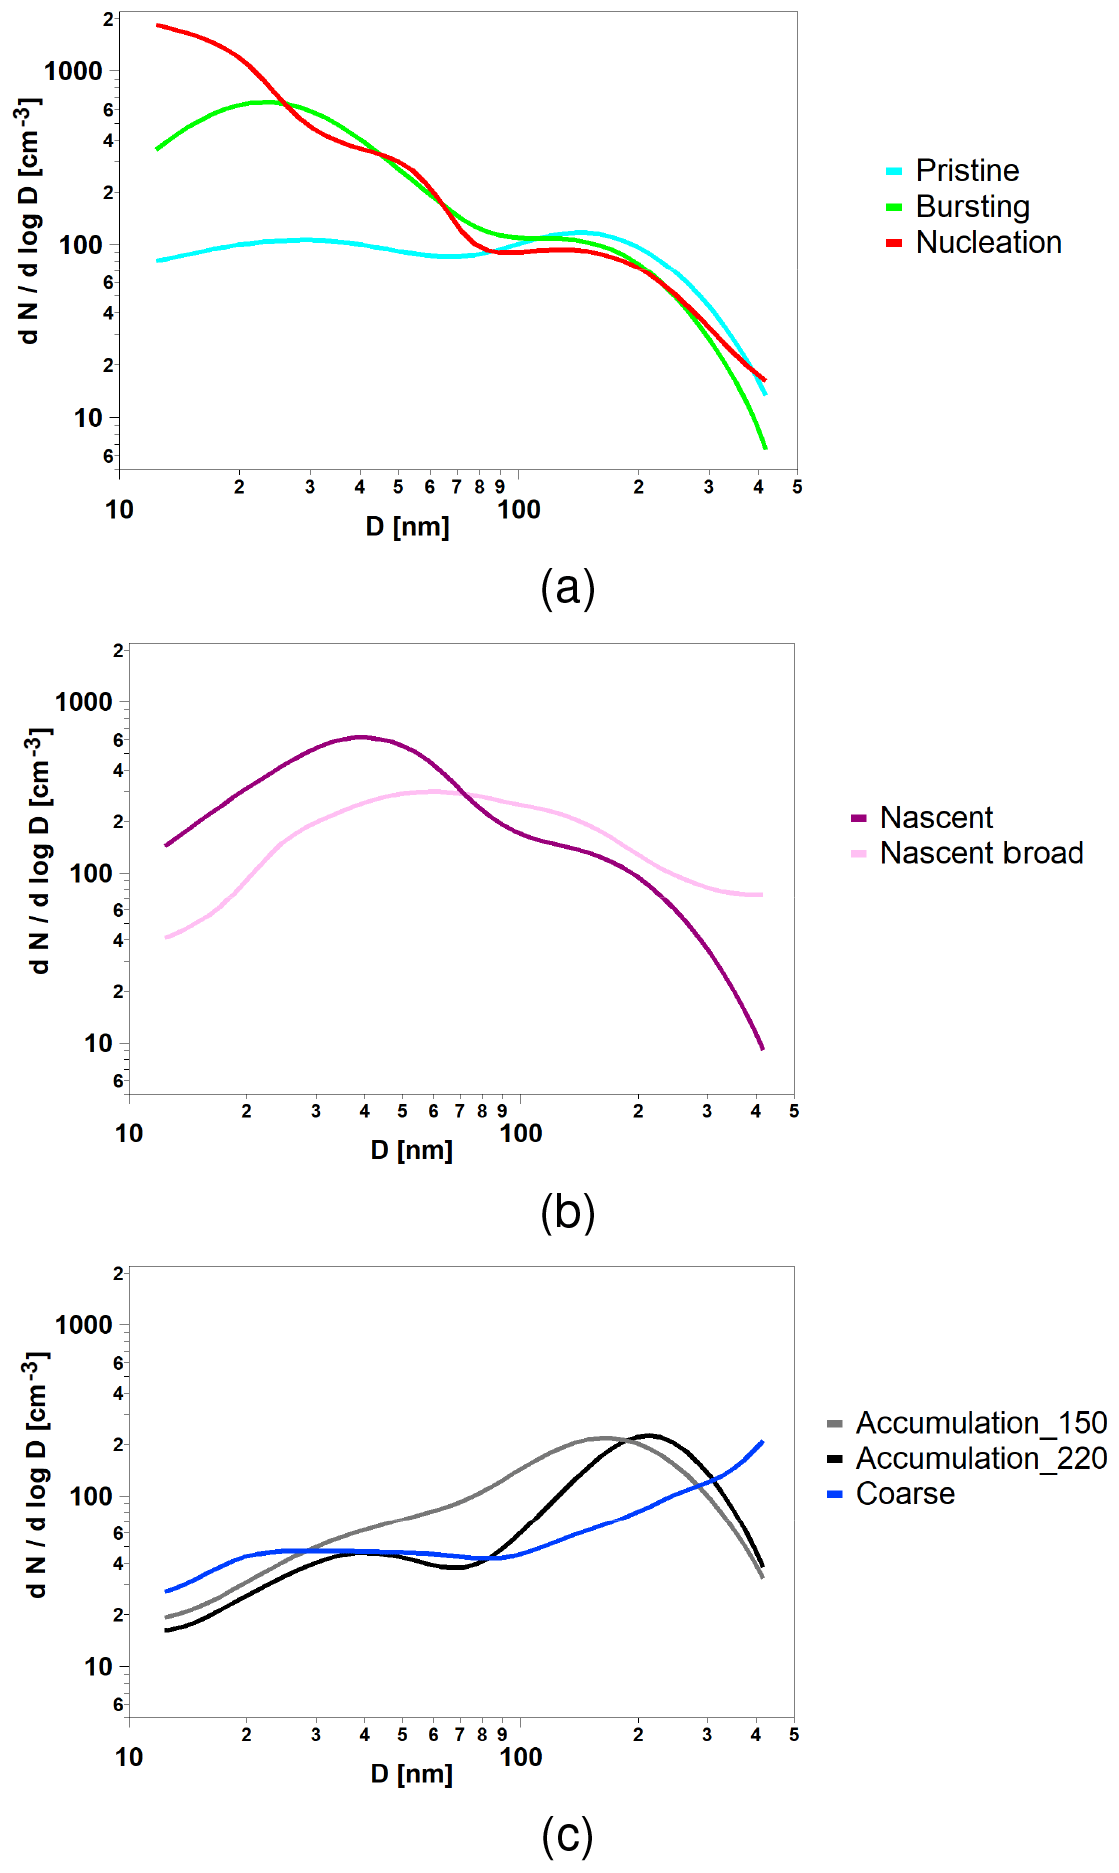
Figure 3K-means aerosol categories separated into the three classes: (a) pristine, bursting and nucleation; (b) nascent and nascent broad; and (c) accumulation_150, accumulation_220 and coarse.
3.2.1 Aerosol categories and occurrence
An aerosol k-means cluster can be interpreted as a particle size spectrum which is determined by a superposition of individual sources and processes. Therefore, the name of each cluster aims only to reflect a main feature associated with the particle size spectrum. It is not possible to associate a single source or process, given that each cluster results from a combination of multiple sources. The same aerosol category terminology was used in previous work; additional information can be found elsewhere (Dall'Osto et al., 2017a, b; Lange et al., 2018). Figure 3a (blue line) shows that the pristine category is associated with very low particle number concentrations (<100 particles cm−3). Average aerosol number concentrations across different sizes are shown in Fig. 3a, with two minor modes at 35 and 135 nm. The nucleation category (Fig. 3a, red line) shows average daily aerosol number size distributions peaking in the smallest detectable size at 10 nm. The name of this category – which will be used below to represent new particle formation events – stands for continuous gas–particle conversion occurring after the particle nucleation event. By contrast, Fig. 3a (green line) shows the average number size distribution with an ultrafine mode peaking at about 20–30 nm. We refer to this bursting category as a population that bursts and begin to exist or develop. Contrary to the nucleation category, this one fails to grow to larger sizes. The origins of this aerosol type can be multiple, including new particle formation with limited growth (so-called “apple” new particle formation events) or open ocean nucleation; an Arctic ultrafine primary origin can also not be ruled out.
Figure 3b shows two main aerosol categories with a dominating aerosol mode peaking in the Aitken size range at about 30–60 nm. Whilst aerosol the nascent category possess a main mode at about 40 nm, the category nascent broad shows a much broader Aitken mode peaking at about 60 nm. The name of this category is meant to be associated with aerosol (of about 30–60 nm), mainly from growing aerosol of secondary origin, related to local and regional marine biogenic sources, occurring mainly during summer (Quinn et al., 2011; Tunved et al., 2013). By contrast, Fig. 3c shows three aerosol categories whose aerosol size distributions are all mainly located in size ranges larger than 100 nm. Main modes can be seen at 150 nm (accumulation_150 category), at 220 nm (accumulation_220 category) and in the largest detected SMPS modes at about 400–500 nm (coarse category).
The temporal frequency during the years 2013–2015 of the eight aerosol categories is presented in Table 1. The pristine category presents a remarkably similar occurrence among the three monitoring sites (12 %–14 %). The nucleation category is more frequent at the Svalbard sites (11 %–15 %) relative to the VRS site (8 %). A similar pattern can be seen for the bursting category. It is also more frequent at GRU-ZEP (14 %–21 %) relative to VRS (8 %). Interestingly, the bursting shows high occurrence at GRU (21 %), perhaps reflecting some processes occurring near sea level across the fjord. The two Aitken categories (nascent and nascent broad) do not show such variability (7 %–21 %). By contrast, strong differences are seen in the accumulation-mode-dominated aerosol categories. For example, accumulation_150 is frequent at the ZEP site (19 %), whereas at the VRS site the dominating category is accumulation_220 (42 %), confirming a recent study specifically looking at the characterisation of distinct Arctic aerosol accumulation modes and their sources (Lange et al., 2018). Finally, the coarse aerosol category shows minor occurrence at all three sites (1 %–4 %).
3.2.2 Annual behaviour
The pristine category did not present a clear annual seasonality at the ZEP and VRS sites, although at the GRU site it occurred mainly during early summer months (Fig. 4a). The nucleation category clearly showed high occurrence during summer months at the VRS site. By contrast, at the Svalbard sites (GRU, ZEP) aerosol concentrations dominate in May and in August (Fig. 4b). Similar trends can be seen for the bursting category (Fig. 4c). Whilst at the VRS site this category shows occurrence similar to the nucleation category (Fig. 4b), at the Svalbard sites (GRU, ZEP), it mainly occurs during May–July. As previously discussed (Dall'Osto et al., 2017a, 2018), the lack of gaseous precursors during spring may be the limiting factors for the formation of new particles and/or due to the large numbers of pre-existing particles transported from mid-latitudes. The two Aitken-mode-dominated aerosol categories (nascent and nascent broad) show very similar temporal trends, peaking mainly during summer months at all three stations (Fig. 4d, e). Previous studies already discussed freshly and locally produced aerosol particles dominating the Arctic summer, driven by an increase in both biological activity and photochemistry, as well as limited long-range transport from mid-latitudes (Ström et al., 2009). Therefore, particles are not growing further than into a pronounced Aitken mode in summer months, particularly in July and August (Tunved et al., 2013; Dall'Osto et al., 2017a). The accumulation_150 category peaks mainly during the months of February–April, confirming its association with the Arctic haze phenomenon (Fig. 4f) at all three stations. By contrast, the larger accumulation_220 mode category occurs during all autumn and winter months at ZEP, including October–December (Fig. 4g). Finally, the coarse category does not show any clear trend due to its low frequency (Fig. 4h). The overall annual frequency is summarised in Fig. 5, in which the aerosol classes are shown. It is well known that the Arctic atmosphere is more heavily impacted by the transport of air pollution from lower latitudes in spring compared to in summer (Heidam et al., 2004; Law and Stohl, 2007). The continent-derived winter and spring aerosols, known as Arctic haze, reach their maximum number concentration during late spring, approximately in April (Tunved et al., 2013; Nguyen et al., 2016). We would like to remind the reader at this stage that the recent inter-comparison of particle number size distributions from several Arctic stations by Freud et al. (2017) suggests differences between the studied stations regarding cluster frequency of occurrence throughout the year. The most prominent differences were observed between the stations at Utqiaġvik (formerly Barrow) and Zeppelin, but the GRU site was not considered in their analysis.
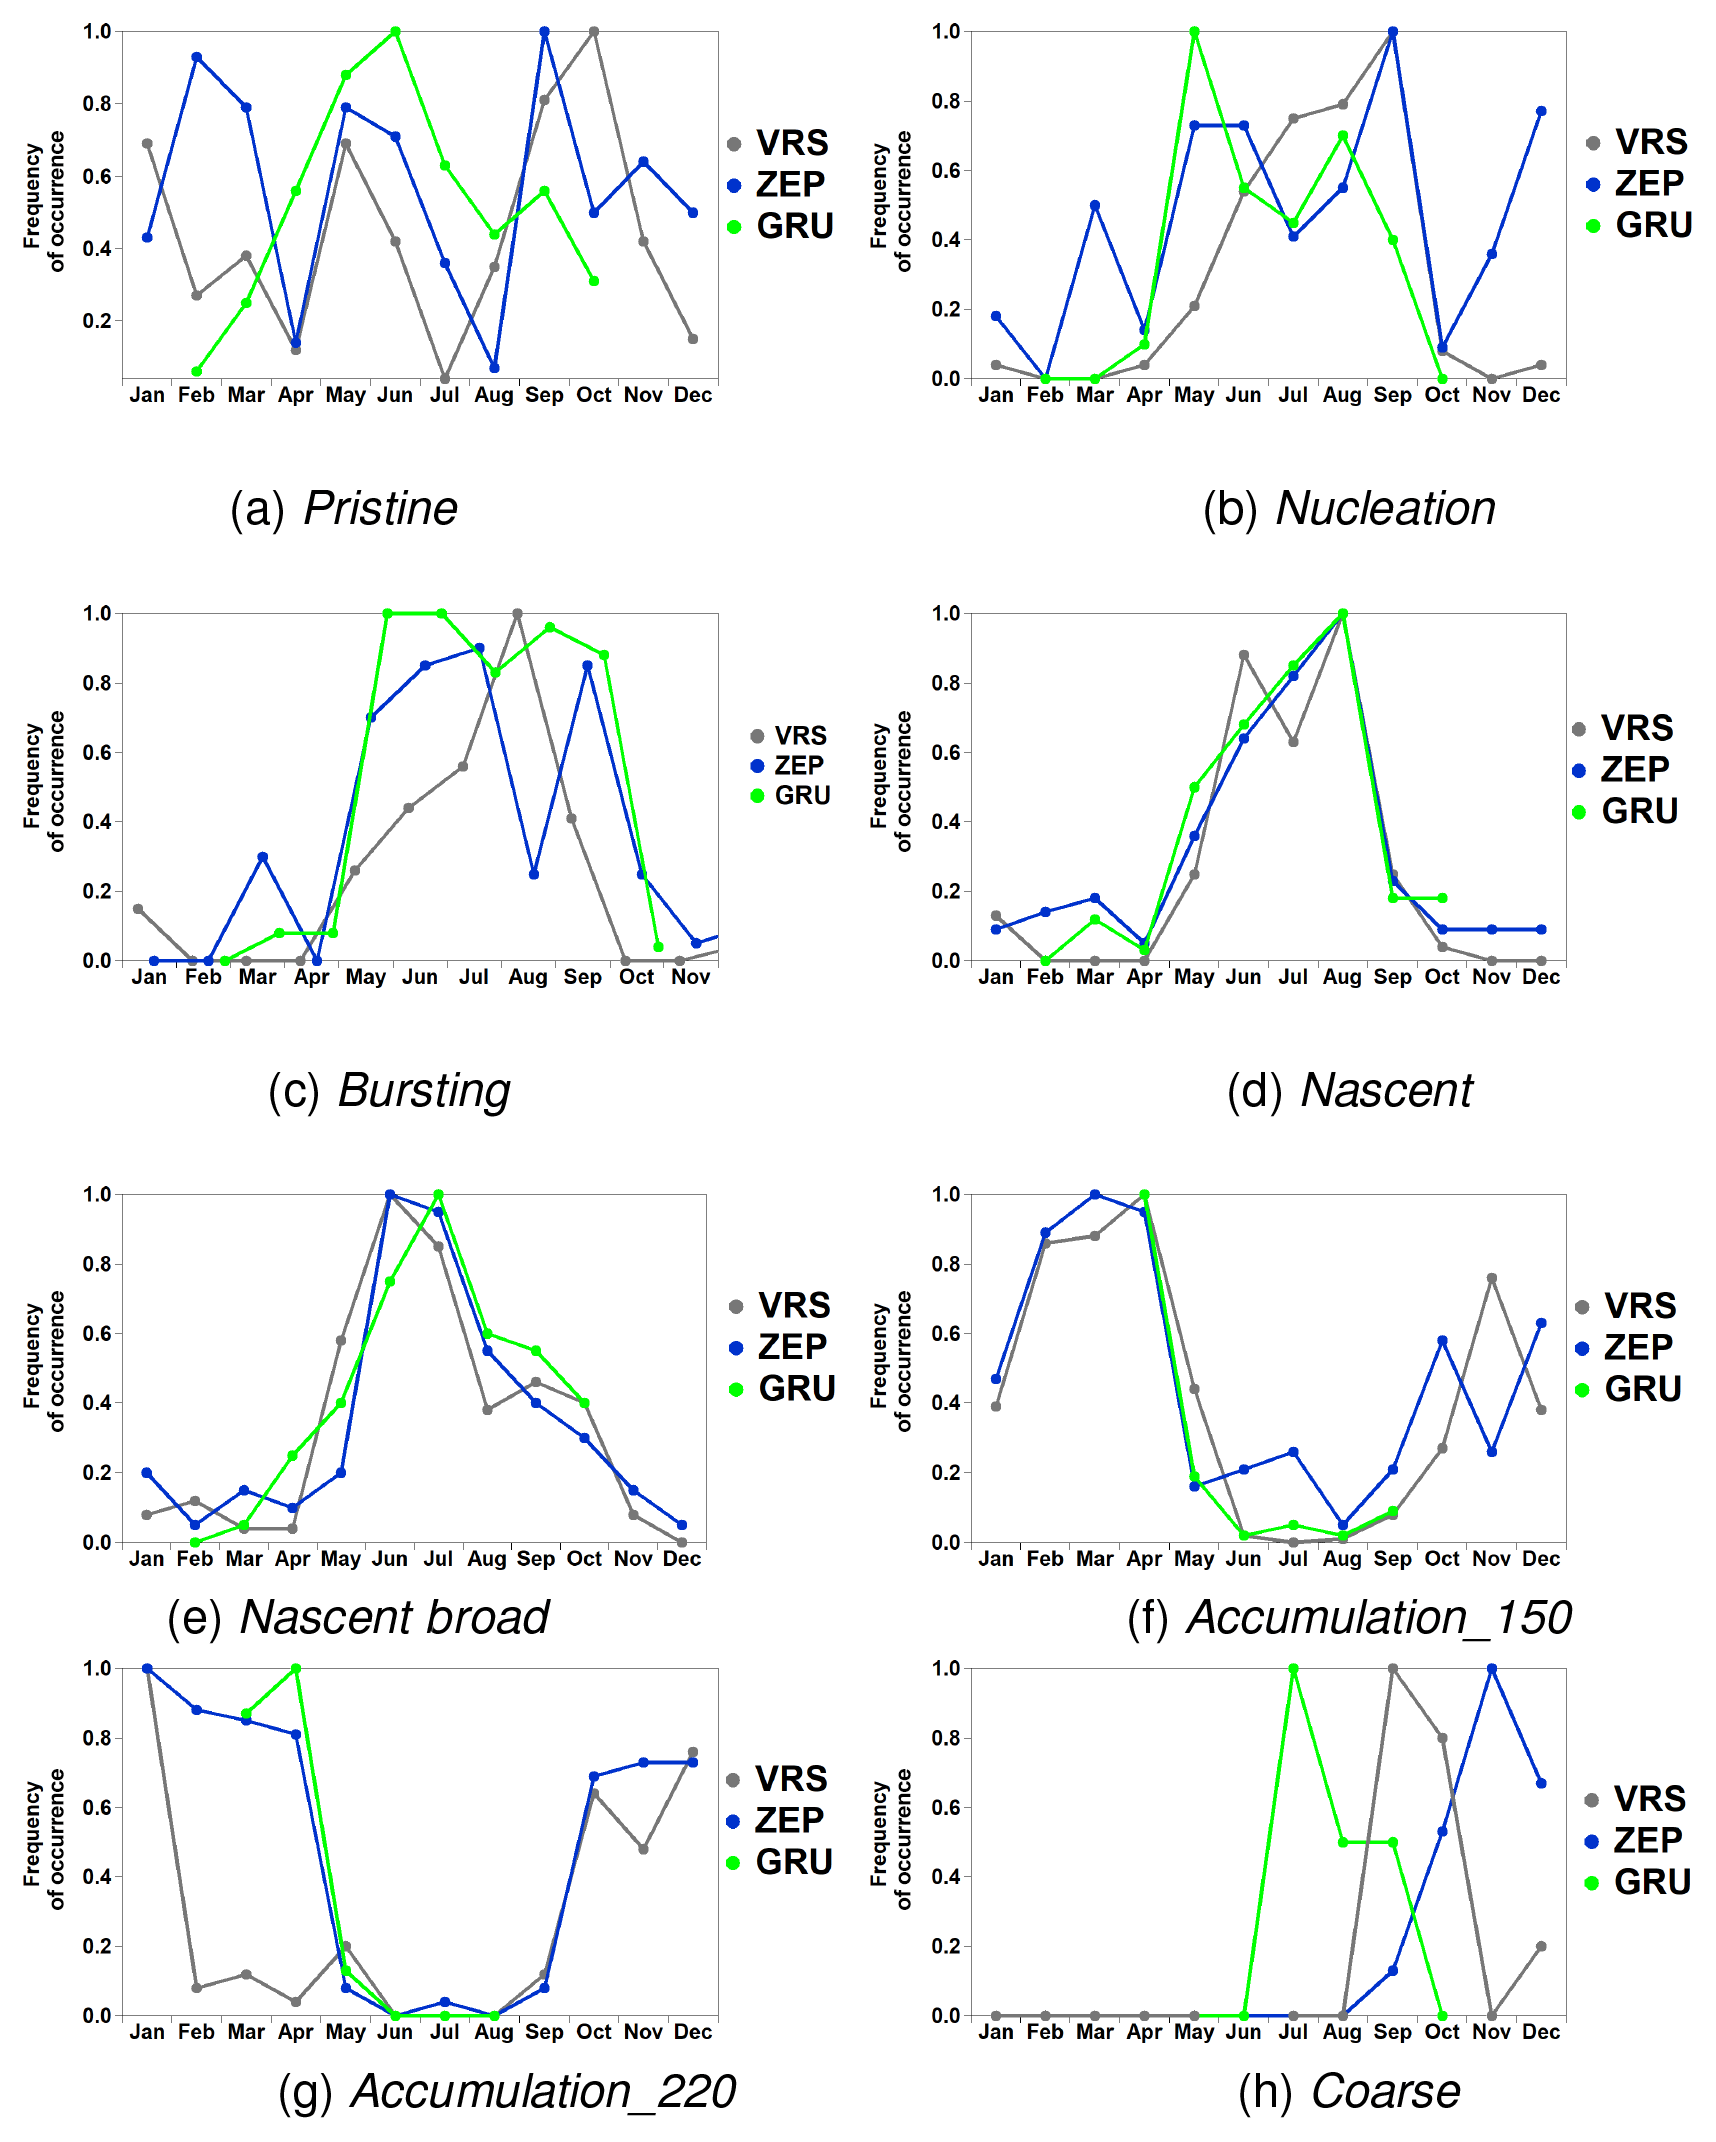
Figure 4Monthly occurrence of each size distribution category (a–h) over the entire available data period (2013–2015), at each measurement site (VRS, ZEP, GRU), reported as total counts, relative to the maximum frequency of occurrence.
3.2.3 Association of aerosol categories with chemical and physical parameters
Different chemical species of natural and anthropogenic origin may contribute to the Arctic aerosol (Tunved et al., 2013; Hirdman et al., 2010). In this section we compare – where possible – the aerosol size distribution categories herein apportioned with the chemical and physical parameters available in selected Arctic stations. A limitation of this study is that chemical and physical parameters were not simultaneously collected at the three stations for the entire period of study (2013–2015). Nevertheless, this section adds value to the work by presenting chemical and physical parameters when available. SO2 in the Arctic has both anthropogenic and natural sources (Barriel, 1986), but in our study it mainly occurs with accumulation-mode aerosols during wintertime (Fig. 6a; ZEP site only). Combustion-derived particles can be transported to the Arctic and experience ageing of the aerosol through condensational processes. Our study confirms previous findings, where SO2 was shown to correlate with black carbon both at VRS and ZEP (Nguyen et al., 2013; Massling et al., 2015; Dall'Osto et al., 2017a). By contrast, we find the highest concentrations of ammonia associated with the nucleation category. Interestingly, also the two Aitken-mode-dominated categories (nascent and nascent broad) show high concentrations of ammonia (Fig. 6b, ZEP site only). Ammonia can increase rates of new particle formation and growth via stabilisation of sulfuric acid clusters (Kirkby et al., 2011). There is growing interest to better constrain the ammonia emissions of the Arctic. Zooplankton excretion and bacterial remineralisation of phytoplankton-derived organic matter are believed to be a dominant source in the marine environment (Carpenter et al., 2012), although considerable uncertainty remains (Lin et al., 2016). The melting of sea ice is also a significant source of ammonium (Tovar-Sánchez et al., 2010), with protein-like compounds accumulating at the sea–ice interface (Galgani et al., 2016). Similar processes have also been seen in Antarctic sea ice (Dall'Osto et al., 2017b). There is evidence that coastal seabird colonies are sources of NH3 in the summertime Arctic (Wentworth et al., 2016), although this is still uncertain (Riddick et al., 2012). Recently, ammonia from seabirds was found to be a key factor contributing to bursts of newly formed coastal particles at Alert, Canada (Croft et al., 2016). However, regions of open water and melting sea ice were found to drive new particle formation in north-east Greenland (Dall'Osto et al., 2018b). These new particle formation events did not seem to be related to coastal zone bird colonies.
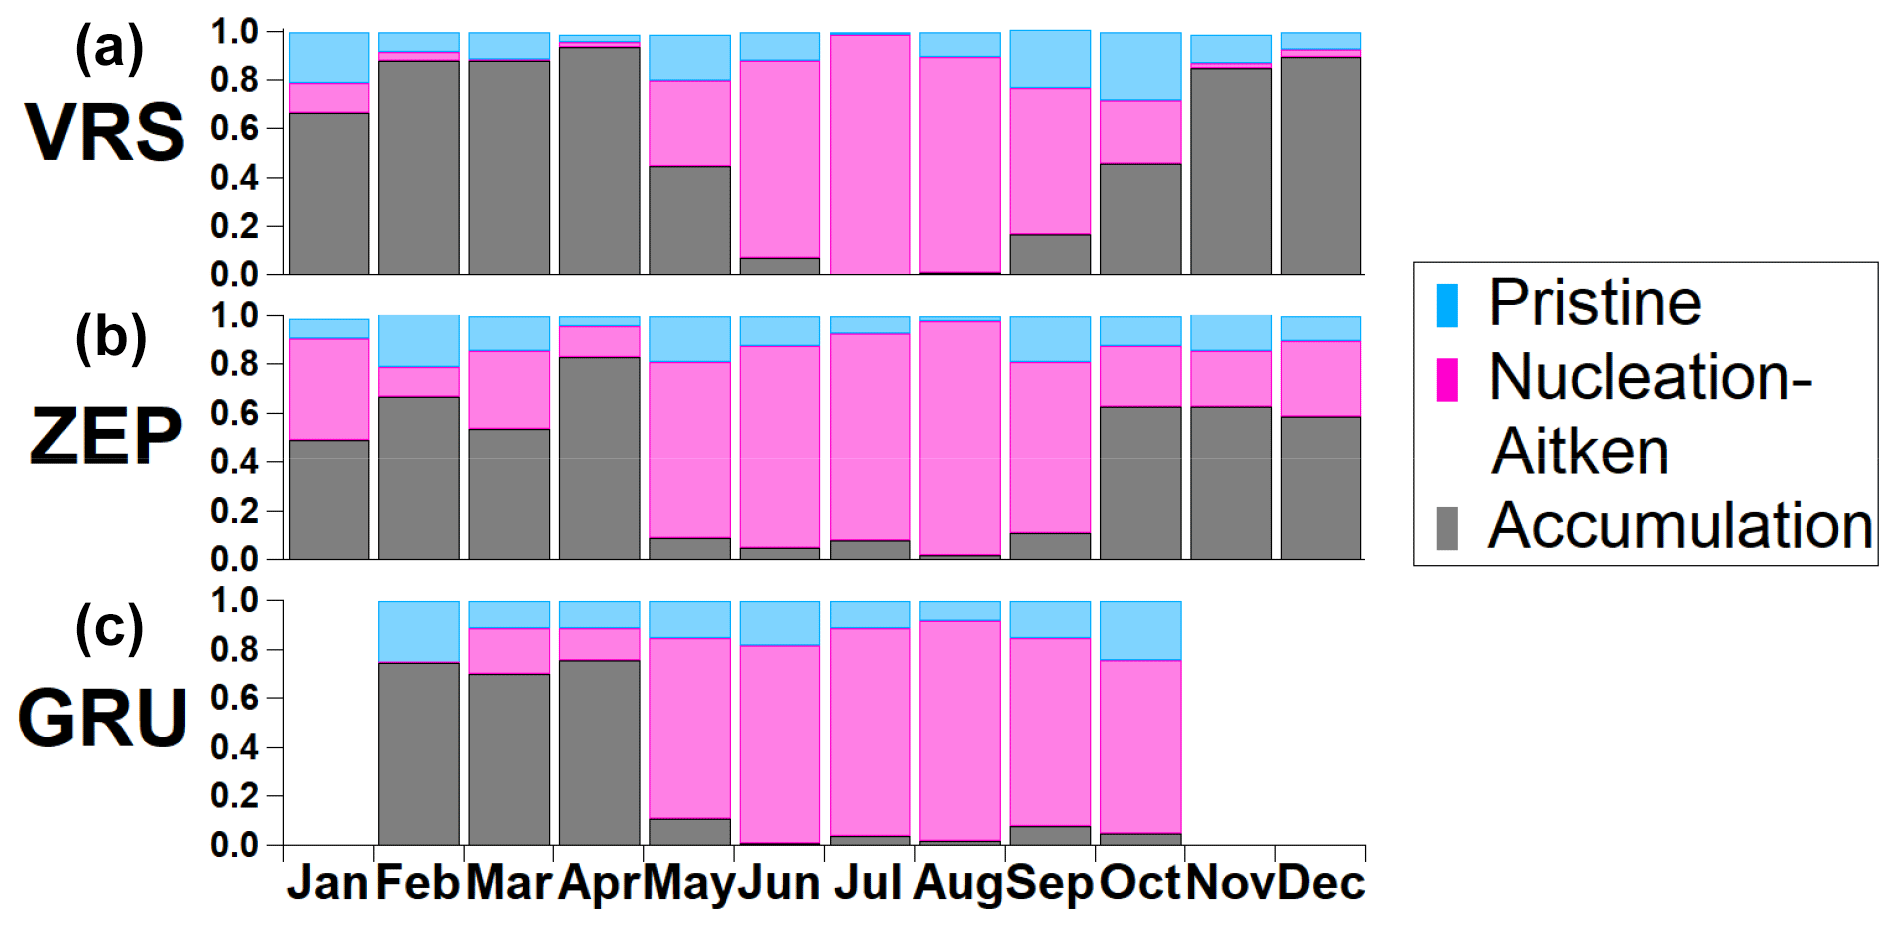
Figure 5Average monthly occurrence of the classes of size distribution categories for the three sites, for the entire data period. The nucleation- and Aitken-mode-dominated classes are binned together, while the individual pristine category is shown individually. (a) Villum Research Station, (b) Zeppelin Mountain and (c) Gruvebadet.
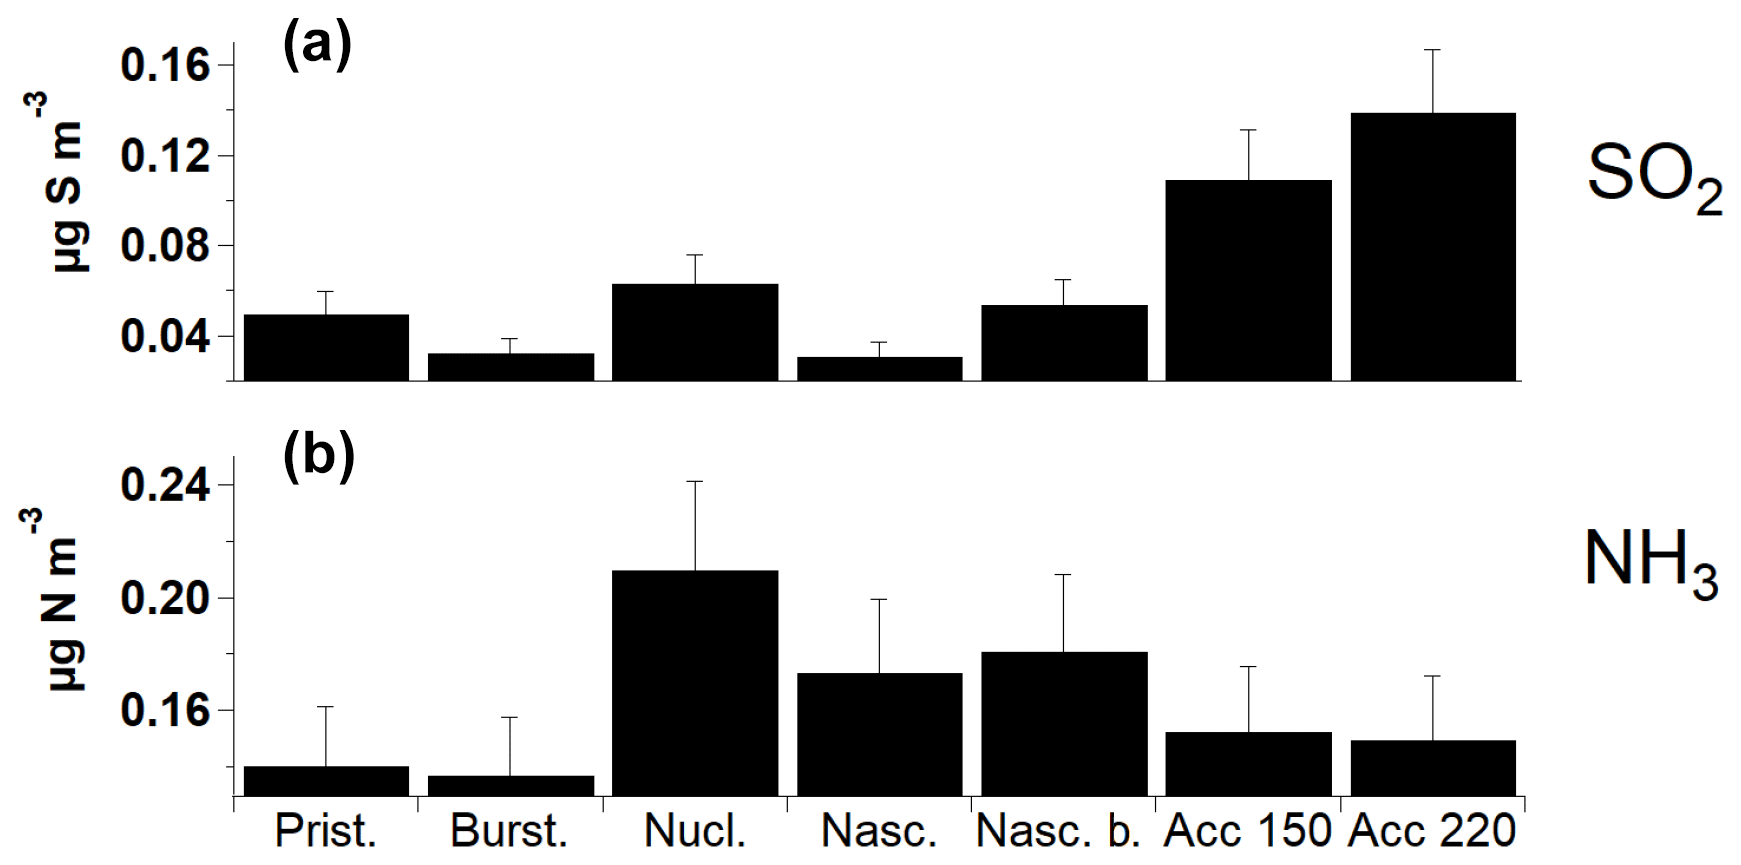
Figure 6Average concentration of gaseous species, associated with the occurrence of each size distribution category over the entire SMPS data period, at the Zeppelin Mountain site. (a) SO2. (b) NH3.
The association of size distribution categories with selected aerosol chemical components measured at GRU and ZEP is shown in Fig. 7. The aerosol chemical composition shown is derived from PM10 measurements and thus does not necessarily reflect the chemical composition of the aerosol covered by the size distribution analysis herein presented and discussed. Nevertheless, the comparison may help to apportion aerosol sources and processes. Figure 7a–c show similar trends for three chemical elements (Cl, Na, Mg). Mechanically generated sea salt particles are normally found in the coarser size fraction, indicating a marine source for Na, Mg and Cl. Indeed, the highest concentrations are seen for the coarse category (about 350, 300 and 40 ng m−3 for Cl, Na and Mg, respectively), followed by accumulation_150, accumulation_220 and pristine categories. Sea spray aerosol (SSA) is generated by bubble bursting due to surface winds. The contribution of SSA to the global aerosol burden is multiple times larger than that of anthropogenic aerosols (Raes et al., 2000; Grythe et al., 2014). Potassium can be associated with sea salt, although K-rich particles are often also attributed to biomass burning (Hudson et al., 2004; Moroni et al., 2017), correlating with gas-phase acetonitrile, a good biomass-burning tracer. Indeed, accumulation-mode aerosol categories show high concentrations of potassium (about 25–30 ng m−3), but the trend is not observed for the pristine category, likely more associated with biogenic Arctic activity. Non-sea-salt sulfate (nss-SO4) is a mixed-source tracer with a large anthropogenic fossil and biomass fuel component. At the same time nss-SO4 is also formed in large quantities from the atmospheric oxidation of dimethyl sulfide (DMS); this is further elaborated below. Aerosol nitrate is predominantly anthropogenic and arises from the oxidation of NOx from combustion processes associated with vehicles and industrial activity. A considerable proportion of acidic nitric and sulfuric aerosols are neutralised in the atmosphere by NH3. The two categories with the highest concentrations of sulfate, nitrate and ammonium are found to be accumulation_150 and accumulation_220 (about 500, 120 and 65 ng m−3, respectively), suggesting that these two categories are composed of a number of combined primary and secondary components of anthropogenic origin. It is interesting to note that ammonium only partly neutralises the Arctic aerosols (on average by one-third). Therefore, the aerosols are highly acidic.
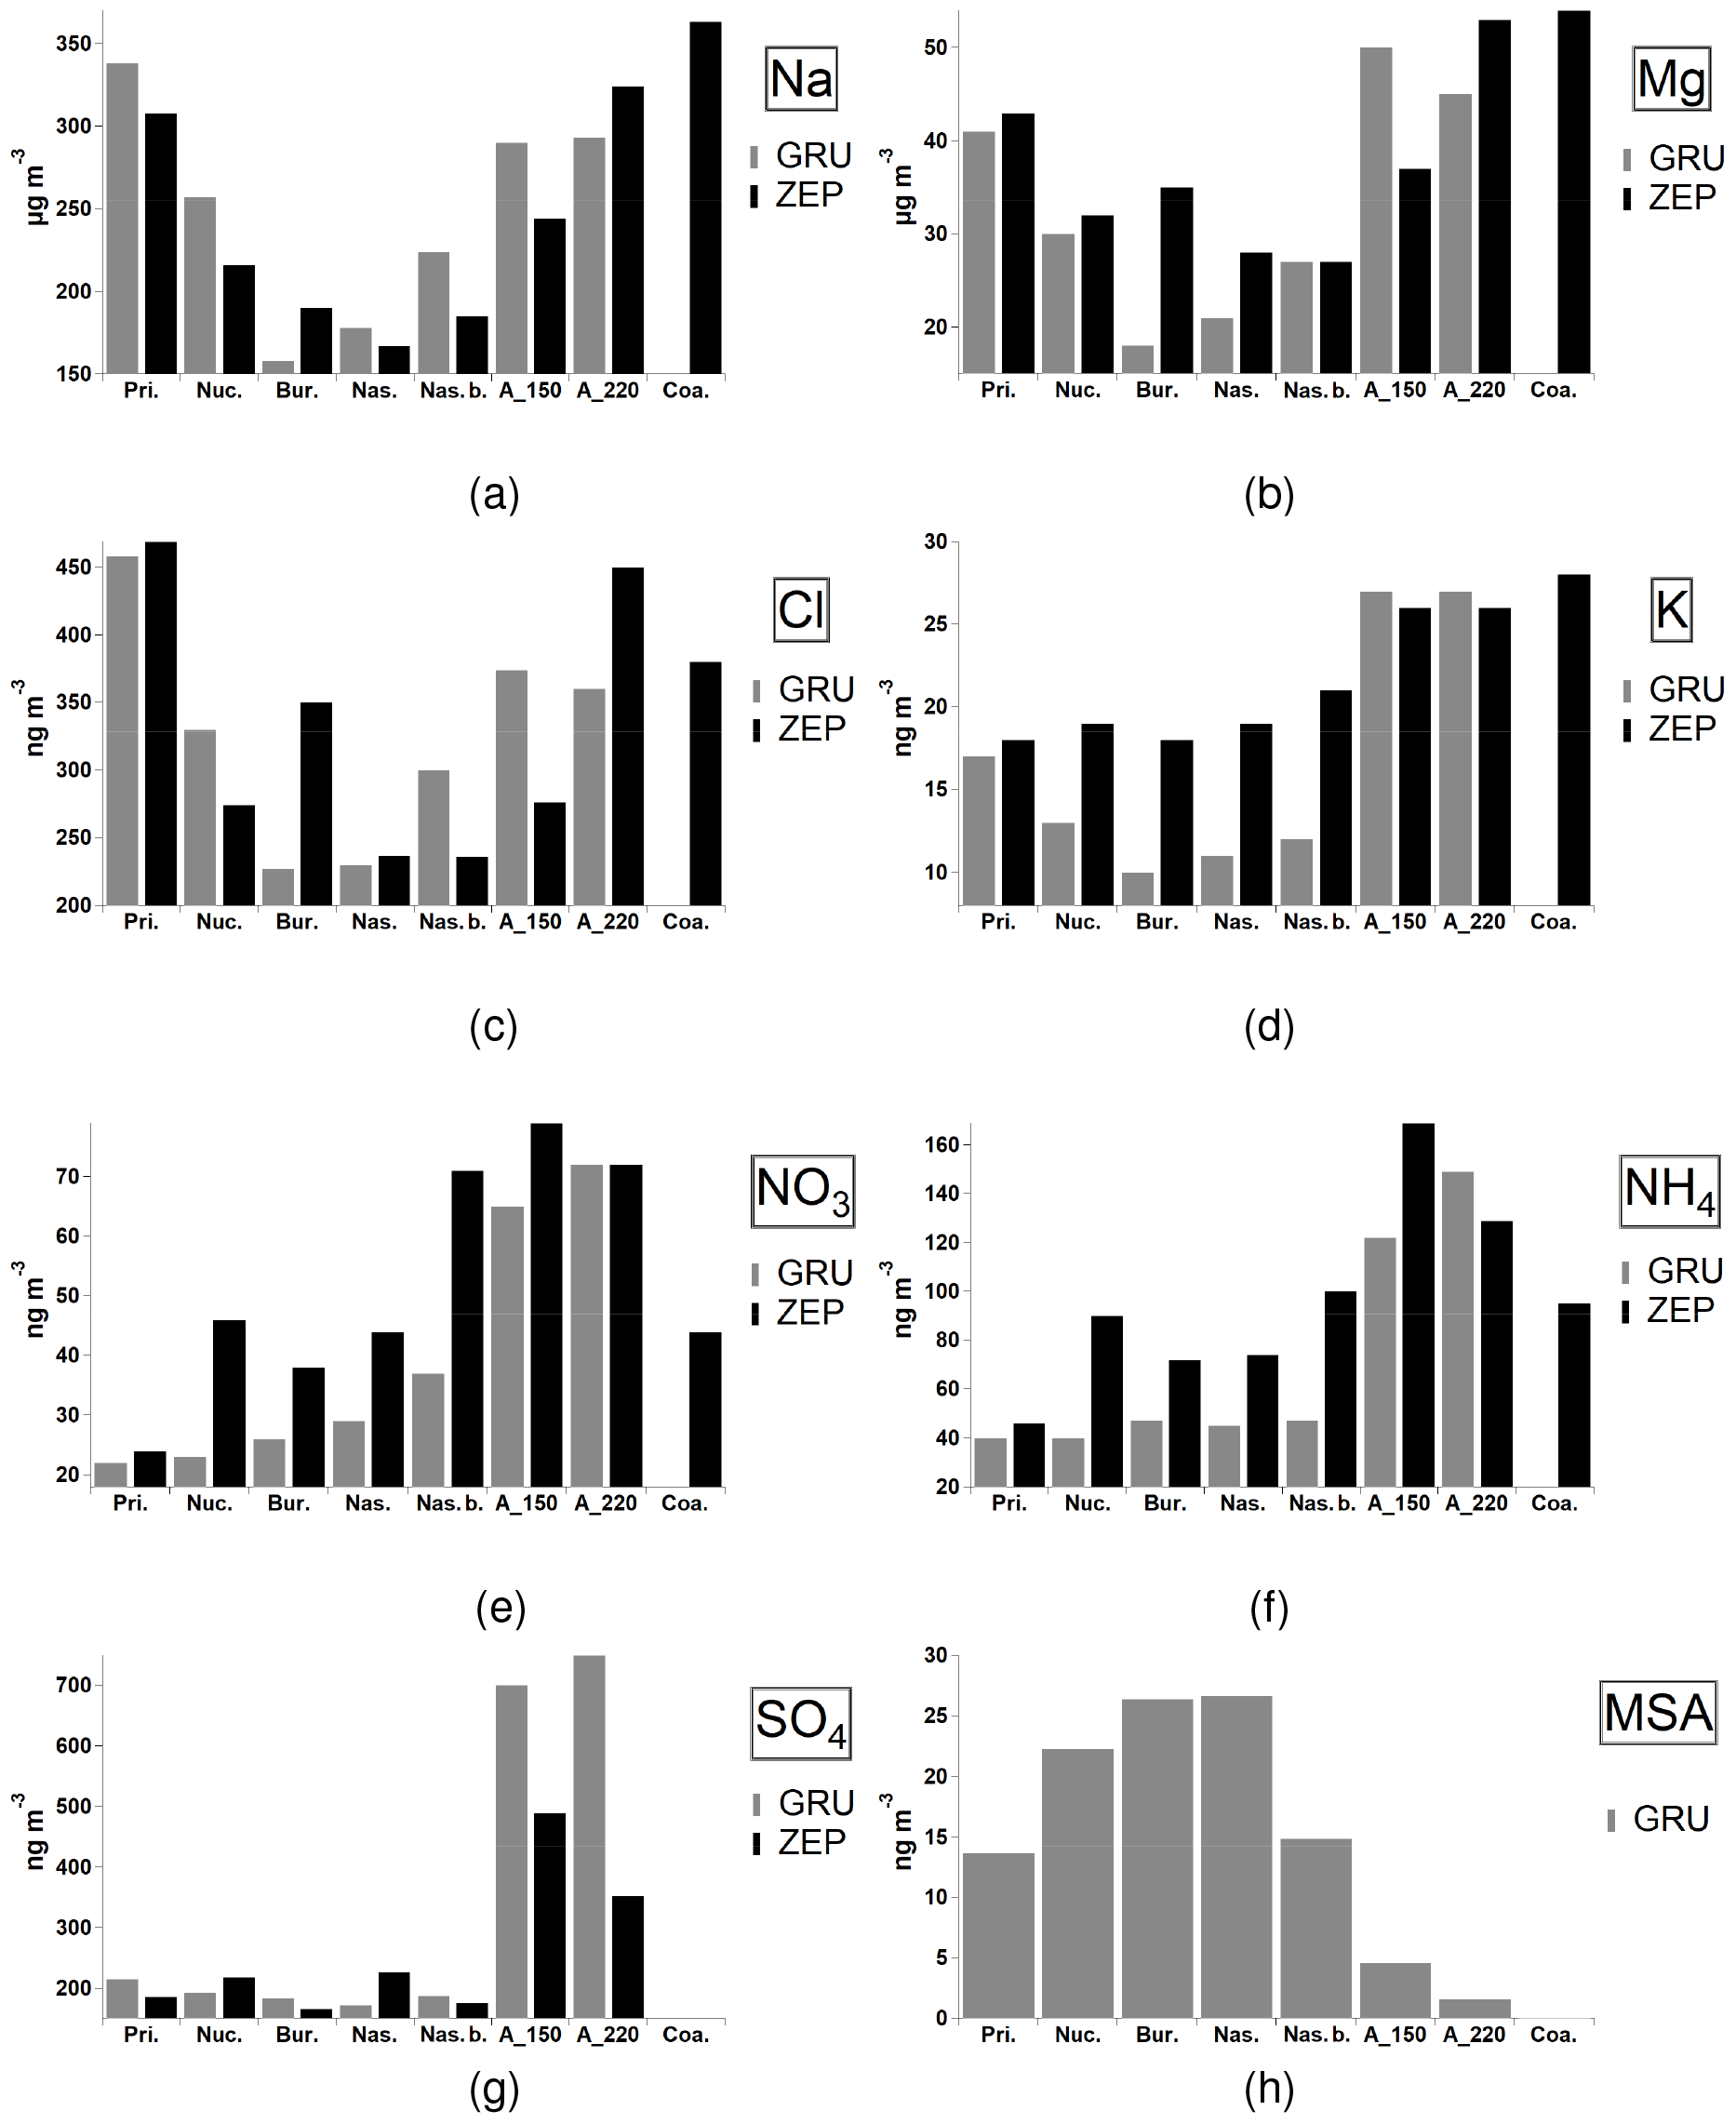
Figure 7Average daily concentrations of selected chemical tracers for each aerosol category (ZEP and GRU only). Standard deviations are not shown (about 25 %–35 %).
Overall, the lowest aerosol mass concentrations seen in Fig. 7a–e are the nucleation, nascent and nascent broad categories. This is not surprising because the occurrence of NPF events and growth in the Aitken mode is mainly controlled not only by the presence of precursor gases but also by pre-existing particle concentrations (Kulmala et al., 2001). Indeed, these events are often found under low aerosol concentration conditions in remote areas (Tunved et al., 2013). The low aerosol mass concentrations associated with these recently formed categories still allow us to draw important conclusions about the possible sources forming these new particles. An opposite trend relative to the previously discussed chemical aerosol markers can be seen in Fig. 7h, showing methane sulfonic acid (MSA) concentrations sampled at the GRU monitoring site. The highest concentrations can be seen for the bursting, nucleation, nascent and nascent broad categories. MSA is formed via oxidation of DMS, a gas produced by marine phytoplankton (Gali et al., 2015). DMS is the most abundant form of biogenic sulfur released from the ocean (Lovelock et al., 1972; Stefels et al., 2007). Previous studies show that the emission of oceanic DMS may impact aerosol formation in the Arctic atmosphere (Levasseur et al., 2013; Becagli et al., 2016; Dall'Osto et al., 2017a). A recent study at the ZEP size shows that during summer, the impact of the anthropogenic sources upon sulfate is lower (42 %), with a contribution comparable to that coming from biogenic emissions (35 %) (Udisti et al., 2016). The association of MSA not only with the nucleation but also with the bursting category suggests that secondary processes may drive both categories. However, it is important to stress that high uncertainty regarding the mechanism of aerosol production in the Arctic – especially from leads and open pack ice – still remains (Leck et al., 2002). The interactions between the surface layer of the ocean and the atmosphere are highly variable, and ecosystem interactions are more important than any single biological variable. For example, Park et al. (2018) discussed atmospheric DMS in the Arctic Ocean and its relation to phytoplankton biomass. The DMS production capacity of the Greenland Sea was estimated to be a factor of 3 greater than that of the Barents Sea, whereas the phytoplankton biomass in the Barents Sea was more than 2-fold greater than that in the Greenland Sea, stressing the occurrence of a greater abundance of DMS-producing phytoplankton in the Greenland Sea than in the Barents Sea during the phytoplankton bloom periods.
The chemical nature and origin of the fine particulate matter over Arctic regions, and especially of its organic fraction, are still largely unknown (Kawamura et al., 1996a, b; Leaitch et al., 2018). Water-soluble dicarboxylic acids, oxocarboxylic acids and α-dicarbonyls are ubiquitously found from the ground surface to the free troposphere (Decesari et al., 2006; Kawamura and Bikkina, 2016). Primary sources include fossil fuel combustion and burning of biomass and biofuels. Secondary sources include the production of volatile organic compounds (VOCs) via photooxidation and unsaturated fatty acids (UFAs) derived from anthropogenic and biogenic sources. VOC sources include wildfires and emissions from snow, ocean, sea ice, boreal forest and tundra (Tunved et al., 2006; Carpenter et al., 2012; Kos et al., 2014; Haque et al., 2016; Mungall et al., 2017). For this study, we were able to compare our SMPS aerosol categorisation with two organic chemical species measured at daily time resolution at the GRU monitoring sites. Results are shown in Fig. 8. A clear anti-correlation can be seen for oxalic and pyruvic acid. Broadly, in the remote marine atmosphere, pyruvic acid may be produced by photochemical oxidation of isoprene and other biogenic volatile organic compounds (BVOCs) emitted from marine biota, which are finally oxidised to produce oxalic acid (Carlton et al., 2007; Carpenter et al., 2012; Bikkina et al., 2014). Oxalic acid is often found to be the most abundant water-soluble organic compound in aerosols, and in-cloud processing is recognised as its major production pathway (Yu et al., 2005). Figure 8 further supports our hypothesis that the aerosol categories defined by low mass concentrations and numerous ultrafine sub-50 nm particles are associated with rather local secondary processes from marine VOC sources. Recent studies have found that lower organic mass (OM) concentrations but higher ratios of OM to non-sea-salt sulfate mass concentrations accompany smaller particles during the summer (Leitch et al., 2018), illustrating that marine Arctic organic components are responsible for the ultrafine aerosol population.
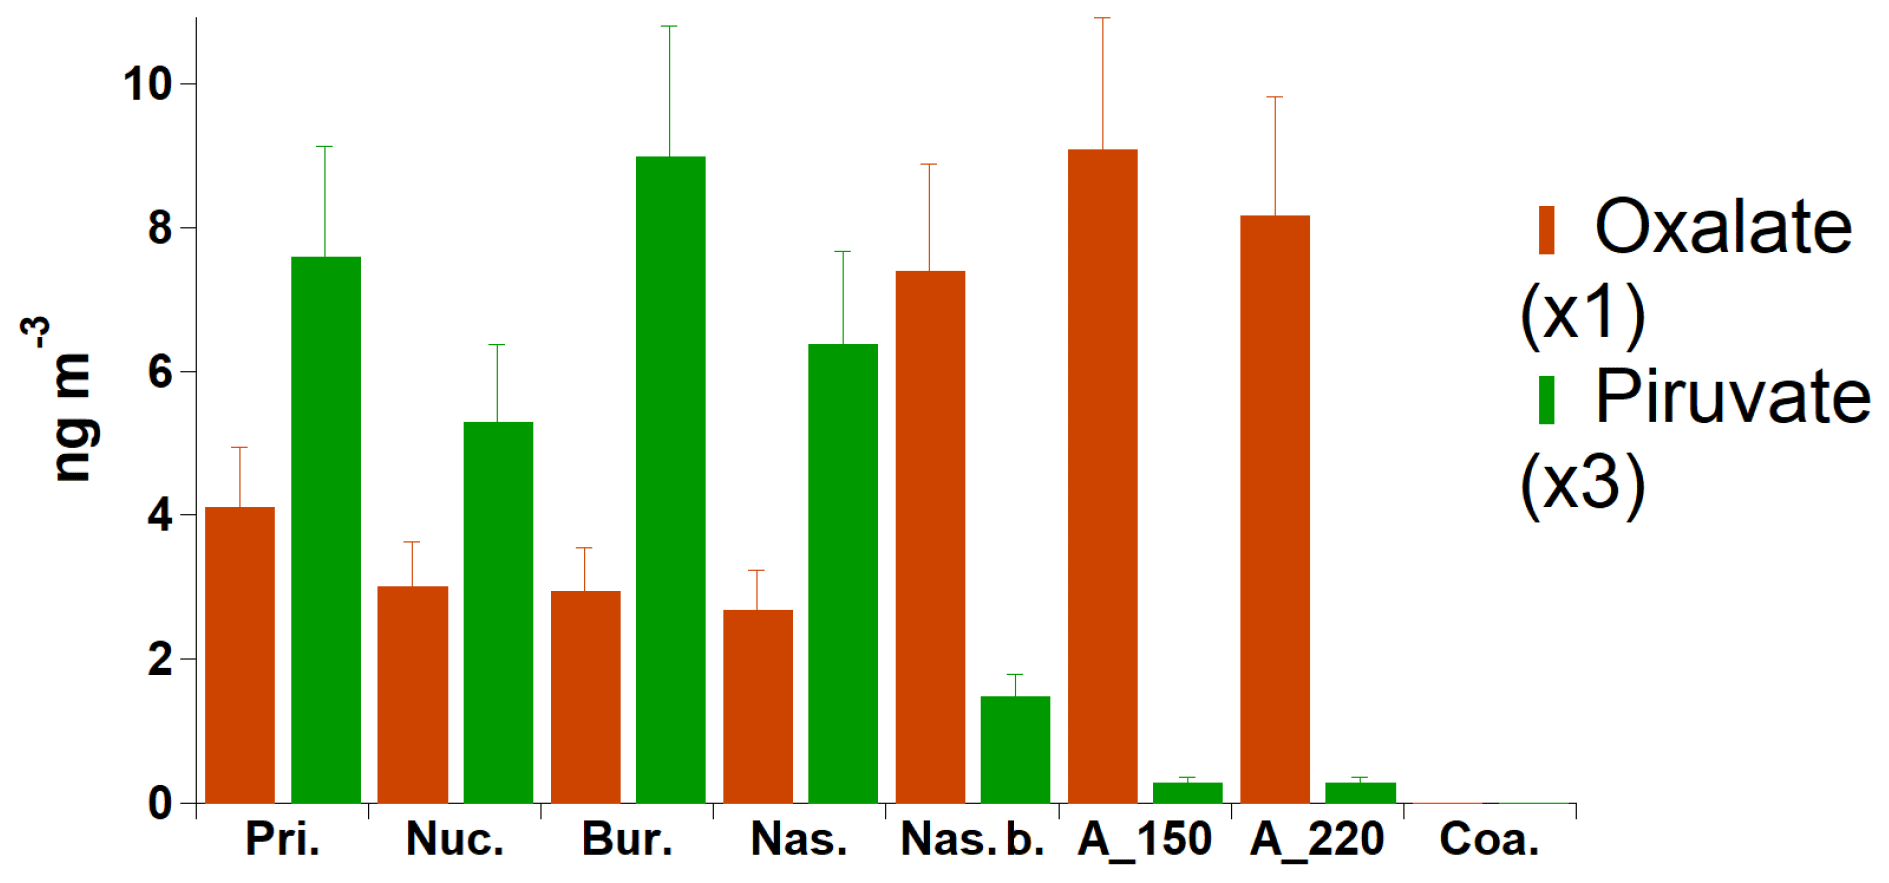
Figure 8Average daily concentrations of selected chemical tracers for each aerosol category (GRU only).
CCN number concentrations influence cloud microphysical and radiative properties and consequently the aerosol indirect radiative forcing (IPCC, 2014). The variability of even low concentrations of CCN is important in the Arctic, an environment where cloud formation – and hence cloud forcing – is limited by the CCN availability (Mauritsen et al., 2011). Figure 9 (ZEP site only) shows that the two accumulation categories (accumulation_150 and accumulation_220) are associated with the highest CCN concentrations (about 125 cm−3) as well as the highest ratio of CCN over N. Usually, ultrafine particles smaller than 100 nm in diameter are considered too small to activate to cloud droplets. However, Leaitch et al. (2016) concluded that 20–100 nm particles from Arctic natural sources can have a broad impact on the range of cloud droplet number concentrations (CDNCs) in clean environments, affirming a large uncertainty in estimating a baseline for the cloud albedo effect. Changes in pressure and temperature may not be efficient enough to generate the required supersaturations needed to activate smaller particles (Browse et al., 2014; Leaitch et al., 2013). However, the low concentrations of accumulation-mode aerosols often found in the Arctic may lower water vapour uptake rates during droplet formation, and the resulting increased supersaturation may enable smaller particles to become cloud droplets. The nascent and nascent broad categories also show associations with high CCN concentrations, despite the much lower average size distributions (Fig. 3d). Natural sources indeed have a significant impact on particle number over summer. Therefore, these natural sources facilitate aerosol activation to cloud droplets and thus cloud formation. Pristine, bursting and nucleation categories show very low associated CCN concentrations (about 50–75 cm−3), with only about 30 % of the total N being activated. In the previously mentioned study by Dall'Osto et al. (2017a) it is also shown that the new particle formation (NPF) events and the growth of these particles to a larger size can affect the CCN number concentration, reporting an increase of the CCN number concentration (measured at a supersaturation of 0.4 %) of 21 %, which is linked to NPF events. Low-level clouds are one of the major factors controlling the radiative balance in the Arctic. Further multidisciplinary studies are needed in order to understand the processes that determine cloud properties by which particles actually form cloud droplets under various conditions.
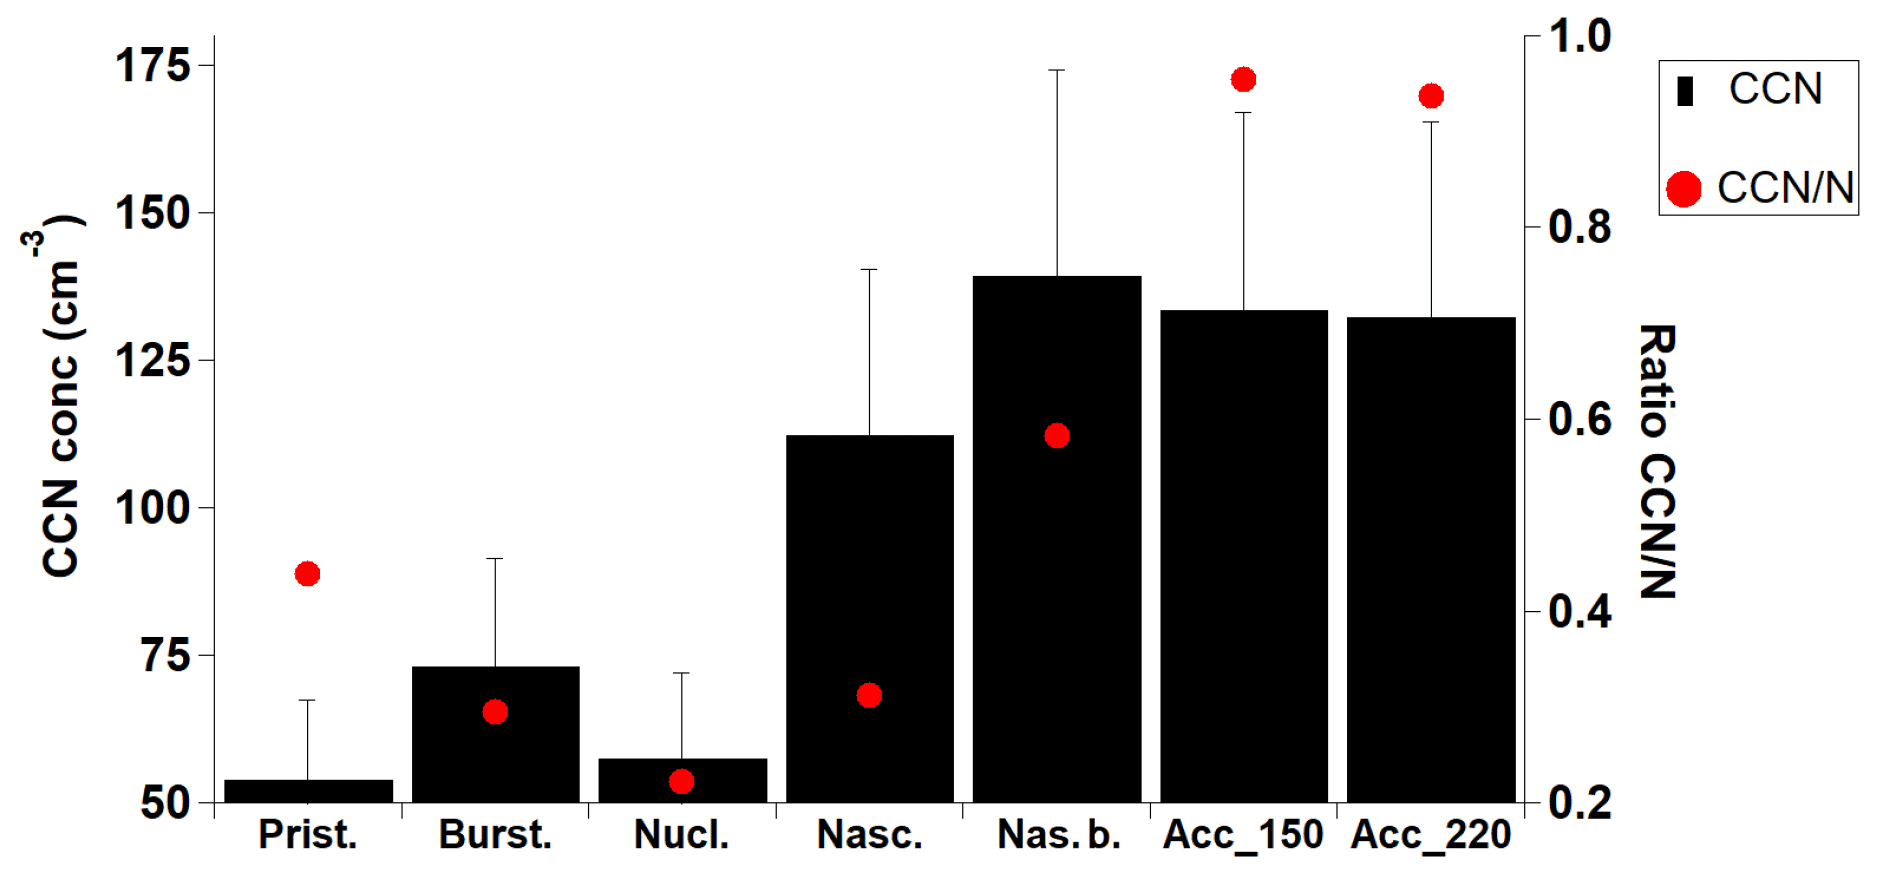
Figure 9Average daily concentrations of CCN concentrations for each aerosol category (ZEP only).
Aerosol size distributions sampled simultaneously in three background locations in the Arctic during 2013–2015 were analysed using k-means clustering techniques. The k-means analysis identified eight distinct aerosol size distributions representing specific aerosol categories: low particle number concentrations (pristine, 12 %–14 %), new particle formation and bursts of ultrafine particles (nucleation, 8 %–21 %; bursting, 11 %–21 %), ultrafine aerosols dominating the Aitken mode (nascent, 7 %–21 %; nascent broad, 10 %–14 %), accumulation-mode-dominated aerosols (accumulation_150, 13 %–42 %; accumulation_220, 8 %–19 %) and coarse sea spray aerosols (coarse, 1 %–4 %). During winter months, mass concentrations of atmospheric aerosols in the Arctic are higher compared to summer. Broadly, this is due to differences in the transport of anthropogenic particles and wet scavenging (Stohl, 2006); local boundary layer height, stability and stratification also play a role (Brooks et al., 2017). By contrast, total aerosol number concentrations in the Arctic are often found to be similar throughout the period of March–September (Tunved et al., 2013). However, the number concentrations in spring (March–April) are almost exclusively governed by accumulation-mode aerosols peaking at 150 nm, while the summer concentrations are associated with elevated numbers of Aitken-mode particles and frequent new particle formation events. The main findings of this work are given in the following.
The three monitoring sites experience very pristine low particle number concentrations only 12 %–14 % of the time.
New particle formation, growth and bursts of sub-30 nm particles are detected 8 %–21 % of the time. The lower frequencies detected at VRS (8 %) relative to the ZEP and GRU (11 %–21 %) are likely due to the former site being surrounded by the ice stream from the Arctic Ocean, being isolated from open ocean and melting sea ice regions, emitting biogenic gas precursors. The Aitken-mode aerosol categories dominate the summer time periods at all sites (19 %–35 %), but VRS has a shorter summer season due to longer sea ice coverage and 14 ∘C lower yearly average temperature compared to the stations at Svalbard.
Two types of accumulation-mode aerosols are found, one associated with the Arctic haze peaking in March–April (monomodal at about 150 nm) and one seen during the winter months (monomodal at about 220 nm). VRS is exposed to accumulation-mode aerosols longer than ZEP and GRU. This is likely due to different transport pathways into the polar dome, a boundary which separates cold air in the Arctic from the relatively warm air in mid-latitude regions (Stohl, 2006).
The aerosol size distribution data herein compared from three different stations were inter-compared for the first time. The study adds additional knowledge to the findings presented by Freud et al. (2017), with a focal point on the NPF phenomena observed in the Arctic environment. This important exercise had to be carried out, and the results – although not striking – set the ground for important future studies. In the future, a decrease in sea ice coverage across the Arctic Ocean may increase the annual primary production (Arrigo et al., 2008) and may alter the species composition of phytoplankton (Fujiwara et al., 2014). Hence, the emissions of biogenic sulfur gases that are aerosol precursors and hence affect aerosol growth and formation would increase in summer. In this regard, the location of the monitoring sites at Svalbard and Greenland is ideal to study aerosol formation and transport across the two different regions. The two stations are separated by the Greenland Sea, a highly productive region with a great abundance of DMS-producing phytoplankton (Park et al., 2018). As the DMS production capacity of the ocean depends critically on the phytoplankton species composition and the complex food web mechanisms (Stefels et al., 2007), multidisciplinary studies across these regions are warranted. The recent transformations in the Arctic and their global causes and consequences have put international cooperation in the Arctic Council at the forefront of research in governance (Knecht, 2016). Larger atmospheric chemistry and physics datasets are being collected by a number of countries, and this work highlights the benefit that can be gained from international cooperation. Given that the present work has validated the quality of the presented aerosol size distributions, these data will be used again to address specific questions, including vertical transport (i.e. the two sites at the Svalbard) and horizontal transport (i.e. Arctic aerosol transport from Greenland to Svalbard regions). The significant costs associated with these types of coordinated international collaborations can provide far more information than individual sites operating on their own. This may help to better understand the complex interactions and feedbacks between the aerosol, the clouds, the longwave and shortwave radiation, the ocean dynamics and the biota (Browse et al., 2014). Particular concern is also arising from increasing navigability in the rapidly melting Arctic Ocean with expanding community resupply, fishing, tourism, fossil fuel exploitation and cargo trading, which are projected to cause a large increase in emissions by 2050 (Melia et al., 2016). Future studies looking simultaneously at different Arctic monitoring sites will reduce the uncertainties in future projections of Arctic climate changes and their implications for our planet (Koivurova et al., 2012; Byers, 2013; Conde Perez and Valerieva Yaneva, 2016). Our study supports international environmental cooperation concerning the Arctic region.
Data supporting this publication are publicly available by contacting the corresponding author.
This study was conceived by MDO. The data analysis was carried out by DCSB, and data interpretation and writing were done by all authors. All authors contributed to developing the basic ideas, discussing the results and preparing the manuscript.
The authors declare that they have no conflict of interest.
The study was supported by the Spanish Ministry of Economy through project BIO-NUC (CGL2013-49020-R), PI-ICE (CTM2017-89117-R) and the Ramon y Cajal fellowship (RYC-2012-11922). The research leading to these results has received funding from the European Union's Horizon 2020 research and innovation programme under grant agreement no. 654109, the Danish Council for Independent Research (project NUMEN, DFF-FTP-4005-00485B) and previously from the European Union Seventh Framework Programme (FP7/2007-2013) under grant agreement no. 262254. The authors would like to acknowledge the Swedish EPA (Naturvårdsverket) and the Swedish Research Council Formas for the financial support. The work at Villum Research Station, Station Nord, was financially supported by the Danish Environmental Protection Agency via the MIKA/DANCEA funds for Environmental Support to the Arctic Region, which is part of the Danish contribution to the Arctic Monitoring and Assessment Programme (AMAP) and the Danish research project “Short-Lived Climate Forcers” (SLCF). The Villum Foundation is acknowledged for funding the construction of Villum Research Station, Station Nord. CCN measurements are supported by a KOPRI program (PN19081), funded by a National Research Foundation of Korea grant (NRF-2016M1A5A1901769). Data used in this article are archived and accessible from the EBAS database operated at the Norwegian Institute for Air Research (NILU) (http://ebas.nilu.no, last access: 31 May 2019). Data management is provided by the WMO Global Atmosphere Watch World Data Centre for Aerosol. SEANA (Shipping Emissions in the Arctic and North Atlantic Atmosphere), Reference NE/S00579X/1, is also acknowledged. The authors acknowledge financial support (to David C. S. Beddows) from the Natural Environment Research Council's funding of the National Centre for Atmospheric Science (NCAS) (grant number R8/H12/83/011).
This research has been supported by the Spanish Ministry of Economy through project BIO-NUC (CGL2013-49020-R), PI-ICE (CTM2017-89117-R) and the Ramon y Cajal fellowship (RYC-2012-11922). The research leading to these results has received funding from the European Union's Horizon 2020 research and innovation programme under grant agreement no. 654109, the Danish Council for Independent Research (project NUMEN, DFF-FTP-4005-00485B) and previously from the European Union Seventh Framework Programme (FP7/2007-2013) under grant agreement no. 262254. The work at Villum Research Station, Station Nord, was financially supported by the Danish Environmental Protection Agency via the MIKA/DANCEA funds for Environmental Support to the Arctic Region. The Villum Foundation funded the construction of Villum Research Station, Station Nord. CCN measurements are supported by a KOPRI program (PN19081), funded by a National Research Foundation of Korea grant (NRF-2016M1A5A1901769). The authors acknowledge financial support (to David C. S. Beddows) from the Natural Environment Research Council's funding of the National Centre for Atmospheric Science (NCAS) (grant number R8/H12/83/011).
This paper was edited by John Liggio and reviewed by two anonymous referees.
Arrigo, K. R., van Dijken, G., and Pabi, S.: Impact of a shrinking Arctic ice cover on marine primary production, Geophys. Res. Lett., 35, L19603, https://doi.org/10.1029/2008GL035028, 2008.
Arrigo, K. R., Perovich, D. K., Pickart, R. S., Brown, Z. W., van Dijken, G. L., Lowry, K. E., Mills, M. M., Palmer, M. A., Balch, W. M., Bahr, F., Bates, N. R., Benitez-Nelson, C., Bowler, B., Brownlee, E., Ehn, J. K., Frey, K. E., Garley, R., Laney, S. R., Lubelczyk, L., Mathis, J., Matsuoka, A., Mitchell, B. G., Moore, G. W. K., Ortega-Retuerta, E., Pal, S., Polashenski, C. M., Reynolds, R. A., Scheiber, B., Sosik, H. M., Stephens, M., and Swift, J. H.: Massive phytoplankton blooms under Arctic sea ice, Science, 336, 1408–1408, 2012.
Asmi, E., Kondratyev, V., Brus, D., Laurila, T., Lihavainen, H., Backman, J., Vakkari, V., Aurela, M., Hatakka, J., Viisanen, Y., Uttal, T., Ivakhov, V., and Makshtas, A.: Aerosol size distribution seasonal characteristics measured in Tiksi, Russian Arctic, Atmos. Chem. Phys., 16, 1271–1287, https://doi.org/10.5194/acp-16-1271-2016, 2016.
Assmy, P., Fernández-Méndez, M., Duarte, P., Meyer, A., Randelhoff, A., Mundy, C. J., Olsen, L. M., Kauko, H., Bailey, A., Chierici, M., Cohen, L., Doulgeris, A. P., Ehn, J. K., Fransson, A., Gerland, S., Hop, H., Hudson, S. R., Hughes, N., Itkin, P., Johnsen, G., King, J., Koch, B. P., Koenig, Z., Kwasniewski, S., Laney, S. R., Nicolaus, M., Pavlov, A., Polashenski, C. M., Provost, C., Rösel, A., Sandbu, M., Spreen, G., Smedsrud, L. H., Sundfjord, A., Taskjelle, T., Tatarek, A., Wiktor, J., Wagner, P. M., Wold, A., Steen, H., and Granskog, M. A.: Leads in Arctic pack ice enable early phytoplankton blooms below snow-covered sea ice, Sci. Rep., 7, 40850, https://doi.org/10.1038/srep40850, 2017.
Barriel, A.: Arctic air pollution: An overview of current knowledge, Atmos. Environ., 20, 643–663, 1986.
Becagli, S., Lazzara, L., Marchese, C., Dayan, U., Ascanius, S. E., Cacciani, M., Caiazzo, L., Di Biagio, C., Di Iorio, T., di Sarra, A., Eriksen, P., Fani, F., Giardi, F., Meloni, D., Muscari, G., Pace, G., Severi, M., Traversi, R., and Udisti, R.: Relationships linking primary production, sea ice melting, and biogenic aerosol in the Arctic, Atmos. Environ., 136, 1–15, https://doi.org/10.1016/j.atmosenv.2016.04.002, 2016.
Beddows, D. C. S., Dall'Osto, M., and Harrison, R. M.: Cluster Analysis of Rural, Urban and Curbside Atmospheric Particle Size Data, Environ. Sci. Technol., 43, 4694–4700, 2009.
Beddows, D. C. S., Dall'Osto, M., Harrison, R. M., Kulmala, M., Asmi, A., Wiedensohler, A., Laj, P., Fjaeraa, A. M., Sellegri, K., Birmili, W., Bukowiecki, N., Weingartner, E., Baltensperger, U., Zdimal, V., Zikova, N., Putaud, J.-P., Marinoni, A., Tunved, P., Hansson, H.-C., Fiebig, M., Kivekäs, N., Swietlicki, E., Lihavainen, H., Asmi, E., Ulevicius, V., Aalto, P. P., Mihalopoulos, N., Kalivitis, N., Kalapov, I., Kiss, G., de Leeuw, G., Henzing, B., O'Dowd, C., Jennings, S. G., Flentje, H., Meinhardt, F., Ries, L., Denier van der Gon, H. A. C., and Visschedijk, A. J. H.: Variations in tropospheric submicron particle size distributions across the European continent 2008–2009, Atmos. Chem. Phys., 14, 4327–4348, https://doi.org/10.5194/acp-14-4327-2014, 2014.
Bikkina, S., Kawamura, K., Miyazaki, Y., and Fu, P.: High abundance of oxalic, azelaic, and glyoxylic acids and methylglyoxal in the open ocean with high biological activity: Implication for secondary SOA formation from isoprene, Geophys. Res. Lett., 41, 3649–3657, https://doi.org/10.1002/2014GL059913, 2014.
Brooks, I. M., Tjernström, M., Persson, P. O. G., Shupe, M. D., Atkinson, R. A., Canut, G., Birch, C. E., Mauritsen, T., Sedlar, J., and Brooks, B. J.: The turbulent structure of the Arctic summer boundary layer during the Arctic summer cloud-ocean study, J. Geophys. Res.-Atmos., 122, 9685–9704, https://doi.org/10.1002/ 2017JD027234, 2017.
Browse, J., Carslaw, K. S., Mann, G. W., Birch, C. E., Arnold, S. R., and Leck, C.: The complex response of Arctic aerosol to sea-ice retreat, Atmos. Chem. Phys., 14, 7543–7557, https://doi.org/10.5194/acp-14-7543-2014, 2014.
Burkart, J., Willis, M. D., Bozem, H., Thomas, J. L., Law, K., Hoor, P., Aliabadi, A. A., Köllner, F., Schneider, J., Herber, A., Abbatt, J. P. D., and Leaitch, W. R.: Summertime observations of elevated levels of ultrafine particles in the high Arctic marine boundary layer, Atmos. Chem. Phys., 17, 5515–5535, https://doi.org/10.5194/acp-17-5515-2017, 2017.
Byers, M.: International Law and the Arctic, Cambridge University Press, Cambridge, 2013.
Carlton, A. G., Turpin, B. J., Altieri, K. E., Seitzinger, S., Reff, A., Lim, H.-J., and Ervens, B.: Atmospheric oxalic acid and SOA production from glyoxal: Results of aqueous photooxidation experiments, Atmos. Environ., 41, 7588–7602, 2007.
Carpenter, L. J., Archer, S. D., and Beale, R.: Ocean-atmosphere trace gas exchange, Chem. Soc. Rev., 41, 6473–6506, https://doi.org/10.1039/c2cs35121h, 2012.
Carslaw, K. S., Lee, L. A., Reddington, C. L., Pringle, K. J., Rap, A., Forster, P. M., Mann, G. W., Spracklen, D. V., Woodhouse, M. T., Regayre, L. A., and Pierce, J. R.: Large contribution of natural aerosols to uncertainty in indirect forcing, Nature, 503, 67–71, https://doi.org/10.1038/nature12674, 2013.
Cohen, J., Screen, J. A., Furtado, J. C., Barlow, M., Whittleston, D., Coumou, D., Francis, J., Dethloff, K., Entekhabi, D., and Overland, J.: Recent Arctic amplification and extreme mid-latitude weather, Nat. Geosci., 7, 627–637, 2014.
Conde Perez, E. and Valerieva Yaneva, Z.: The European Arctic policy in progress, Polar Sci., 10, 441e449, https://doi.org/10.1016/j.polar.2016.06.008, 2016.
Croft, B., Wentworth, G. R., Martin, R. V., Leaitch, W. R., Murphy, J. G., Murphy, B. N., Kodros, J., Abbatt, J. P. D., and Pierce, J. R.: Contribution of Arctic seabird-colony ammonia to atmospheric particles and cloud-albedo radiative effect, Nat. Commun., 7, 13444, https://doi.org/10.1038/ncomms13444, 2016.
Dall'Osto, M., Monahan, C., Greaney, R., Beddows, D. C. S., Harrison, R. M., Ceburnis, D., and O'Dowd, C. D.: A statistical analysis of North East Atlantic (submicron) aerosol size distributions, Atmos. Chem. Phys., 11, 12567–12578, https://doi.org/10.5194/acp-11-12567-2011, 2011.
Dall'Osto, M., Beddows, D. C. S., Tunved, P., Krejci, R., Ström, J., Hansson, H.-C., Yoon, Y. J., Park, K.-T., Becagli, S., Udisti, R., Onasch, T., O'Dowd, C. D., Simó, R., and Harrison, R. M.: Arctic sea ice melt leads to atmospheric new particle formation, Sci. Rep., 7, 3318, https://doi.org/10.1038/s41598-017-03328-1, 2017a.
Dall'Osto, M., Ovadnevaite, J., Paglione, M., Beddows, D. C., Ceburnis, D., Cree, C., Cortés, P., Zamanillo, M., Nunes, S. O., Pérez, G. L., Ortega-Retuerta, E., Emelianov, M., Vaqué, D., Marrasé, C., Estrada, M., Sala, M. M., Vidal, M., Fitzsimons, M. F., Beale, R., Airs, R., Rinaldi, M., Decesari, S., Facchini, M. C., Harrison, R. M., O'Dowd, C., and Simó, R.: Antarctic sea ice region as a source of biogenic organic nitrogen in aerosols, Sci. Rep., 7, 6047, https://doi.org/10.1038/s41598-017-06188-x,2017b.
Dall'Osto, M., Beddows, D. C. S., Asmi, A., Poulain, L., Hao, L., Freney, E., Allan, J. D., Canagaratna, M., Crippa, M., Bianchi, F., de Leeuw, G., Eriksson, A., Swietlicki, E., Hansson, H. C., Henzing, J. S., Granier, C., Zemankova, K., Laj, P., Onasch, T., Prevot, A., Putaud, J. P., Sellegri, K., Vidal, M., Virtanen, A., Simo, R., Worsnop, D., O'Dowd, C., Kulmala, M., and Harrison, R. M.: Novel insights on new particle formation derived from a paneuropean observing system, Sci. Rep., 8, 1482, https://doi.org/10.1038/s41598-017-17343-9, 2018a.
Dall'Osto, M., Lange, R., Geels, C., Beddows, D. C. S., Harrison, R. M., Simo, R., Boertmann, D., Skov, H., and Massling, A.: Open pack ice drives new particle formation in North East Greenland, Sci. Rep., in press, 2018b.
Dall'Osto, M., Simo, R., Harrison, R. M., Beddows, D. C. S., Saiz-Lopez, A., Lange, R., Skov, H., Nøjgaard, J. K., Nielsen, I. E., and Massling, A.: Abiotic and biotic sources influencing spring new particle formation in North East Greenland, Atmos. Environ., 190, 126–134, https://doi.org/10.1016/J.ATMOSENV.2018.07.019, 2018c.
Decesari, S., Fuzzi, S., Facchini, M. C., Mircea, M., Emblico, L., Cavalli, F., Maenhaut, W., Chi, X., Schkolnik, G., Falkovich, A., Rudich, Y., Claeys, M., Pashynska, V., Vas, G., Kourtchev, I., Vermeylen, R., Hoffer, A., Andreae, M. O., Tagliavini, E., Moretti, F., and Artaxo, P.: Characterization of the organic composition of aerosols from Rondônia, Brazil, during the LBA-SMOCC 2002 experiment and its representation through model compounds, Atmos. Chem. Phys., 6, 375–402, https://doi.org/10.5194/acp-6-375-2006, 2006.
Engvall, A.-C., Krejci, R., Ström, J., Treffeisen, R., Scheele, R., Hermansen, O., and Paatero, J.: Changes in aerosol properties during spring-summer period in the Arctic troposphere, Atmos. Chem. Phys., 8, 445–462, https://doi.org/10.5194/acp-8-445-2008, 2008.
Fadeev, E., Salter, I., Schourup-Kristensen, V., Metfies, K., Nöthig, E. M., Engel, A., Piontek, J., Boetius, A., and Bienhold, C.: Microbial Communities in the East and West Fram Strait During Sea Ice Melting Season, Front. Mar. Sci., 5, 429, https://doi.org/10.3389/fmars.2018.00429, 2018.
Freud, E., Krejci, R., Tunved, P., Leaitch, R., Nguyen, Q. T., Massling, A., Skov, H., and Barrie, L.: Pan-Arctic aerosol number size distributions: seasonality and transport patterns, Atmos. Chem. Phys., 17, 8101–8128, https://doi.org/10.5194/acp-17-8101-2017, 2017.
Fujiwara, A., Hirawake, T., Suzuki, K., Imai, I., and Saitoh, S.-I.: Timing of sea ice retreat can alter phytoplankton community structure in the western Arctic Ocean, Biogeosciences, 11, 1705–1716, https://doi.org/10.5194/bg-11-1705-2014, 2014.
Galgani, L., Piontek, J., and Engel, A.: Biopolymers form a gelatinous microlayer at the air-sea interface when Arctic sea ice melts, Sci. Rep., 6, 29465, https://doi.org/10.1038/srep29465, 2016.
Galí, M., Devred, E., Levasseur, M., Royer, S., and Babin, M.: A remote sensing algorithm for planktonic dimethylsulfoniopropionate (DMSP) and an analysis of global patterns, Remote Sens. Environ., 171, 171–184, https://doi.org/10.1016/j.rse.2015.10.012, 2015.
Grythe, H., Ström, J., Krejci, R., Quinn, P., and Stohl, A.: A review of sea-spray aerosol source functions using a large global set of sea salt aerosol concentration measurements, Atmos. Chem. Phys., 14, 1277–1297, https://doi.org/10.5194/acp-14-1277-2014, 2014.
Haque, M. M., Kawamura, K., and Kim, Y.: Seasonal variations of biogenic secondary organic aerosol tracers in ambient aerosols from Alaska, Atmos. Environ., 130, 95–104, 2016.
Heidam, N. Z., Christensen, J., Wahlin, P., and Skov, H.: Arctic atmospheric contaminants in NE Greenland: levels, variations, origins, transport, transformations and trends 1990–2001, Sci. Total Environ., 331, 5–28, https://doi.org/10.1016/j. scitotenv.2004.03.033, 2004.
Hirdman, D., Sodemann, H., Eckhardt, S., Burkhart, J. F., Jefferson, A., Mefford, T., Quinn, P. K., Sharma, S., Ström, J., and Stohl, A.: Source identification of short-lived air pollutants in the Arctic using statistical analysis of measurement data and particle dispersion model output, Atmos. Chem. Phys., 10, 669–693, https://doi.org/10.5194/acp-10-669-2010, 2010.
Hogrefe, O., Lala, G. G., Frank, B. P., Schwab, J. J., and Demerjian, K. L.: Field evaluation of a TSI 3034 scanning mobility particle sizer in New York City: Winter 2004 intensive campaign, Aerosol Sci. Tech., 40, 753–762, 2006.
Holland, M. M., Bitz, C. M., and Tremblay, B.: Future abrupt reductions in the summer Arctic sea ice, Geophys. Res. Lett., 33, L23503, https://doi.org/10.1029/2006GL028024, 2006.
Hudson, P. K., Murphy, D. M., Cziczo, D. J., Thomson, D. S., de Gouw, J. A., Warneke, C., Holloway, J., Jost, J. R., and Hubler, G.: Biomass-burning particle measurements: Characteristic composition and chemical processing, J. Geophys. Res.-Atmos., 109, D23S27, https://doi.org/10.1029/2003JD004398, 2004.
IPCC: Climate Change 2014: Impacts, Adaptation, and Vulnerability, 2014.
Kawamura, K. and Bikkina, S.: A review of dicarboxylic acids and related compounds in atmospheric aerosols: molecular distributions, sources and transformation, Atmos. Res., 170, 140–160, 2016.
Kawamura, K., Kasukabe, H., and Barrie, L. A.: Source and reaction pathways of dicarboxylic acids, ketoacids and dicarbonyls in arctic aerosols: One year of observations, Atmos. Environ., 30, 1709–1722, 1996a.
Kawamura, K., Sempéré, R., Imai, Y., Hayashi, M., and Fujii, Y.: Water soluble dicarboxylic acids and related compounds in the arctic aerosols, J. Geophys. Res., 101, 18721–18728, https://doi.org/10.1029/96JD01541, 1996b.
Kirkby, J., Curtius, J., Almeida, J., Dunne, E., Duplissy, J., Ehrhart, S., Franchin, A., Gagné, S., Ickes, L., Kürten, A., Kupc, A., Metzger, A., Riccobono, F., Rondo, L., Schobesberger, S., Tsagkogeorgas, G., Wimmer, D., Amorim, A., Bianchi, F., Breitenlechner, M., David, A., Dommen, J., Downard, A., Ehn, M., Flagan, R. C., Haider, S., Hansel, A., Hauser, D., Jud, W., Junninen,H., Kreissl, F., Kvashin, A., Laaksonen, A., Lehtipalo, K.,Lima, J., Lovejoy, E. R., Makhmutov, V., Mathot, S., Mikkilä, J., Minginette, P., Mogo, S., Nieminen, T., Onnela, A., Pereira, P., Petäjä, T., Schnitzhofer, R., Seinfeld, J. H., Sipilä, M., Stozhkov,Y., Stratmann, F., Tomé, A., Vanhanen, J., Viisanen, Y., Vrtala, A., Wagner, P. E., Walther, H., Weingartner, E., Wex, H., Winkler,P. M., Carslaw, K. S., Worsnop, D. R., Baltensperger, U., and Kulmala, M.: Role of sulphuric acid, ammonia and galactic cosmic rays in atmospheric aerosol nucleation, Nature, 476, 429–33, https://doi.org/10.1038/nature10343, 2011.
Knecht, S.: The Politics of Arctic International Cooperation: Introducing a Dataset on Stakeholder Participation in Arctic Council Meetings, 1998–2015, Cooperation and Conflict, 2016.
Koivurova, T., Kokko, K., Duyck, S., Sellheim, N., and Stepien, A.: The present and the future competence of the European Union in the Arctic, Polar Rec., 48, 361e371, https://doi.org/10.1017/S0032247411000295, 2012.
Kos, G., Kanthasami, V., Adechina, N., and Ariya, P. A.: Volatile organic compounds in Arctic snow: Concentrations and implications for atmospheric processes, Environ. Sci. Process. Impact., 16, 2592–2603, https://doi.org/10.1039/c4em00410h, 2014.
Kulmala, M., Dal Maso, M., Mäkelä, J. M., Pirjola, L., Väkevä, M., Aalto, P., Miikkulainen, P., Hämeri, K., and O'Dowd, C. D.: On the formation, growth and composition of nucleation modeparticles, Tellus B, 53, 479–490, 2001.
Lange, R., Dall'Osto, M., Skov, H., Nøjgaard, J. K., Nielsen, I. E., Beddows, D. C. S., Simo, R., Harrison, R. M., and Massling, A.: Characterization of distinct Arctic aerosol accumulation modes and their sources, Atmos. Environ., 183, 1–10, 2018.
Lathem, T. L., Beyersdorf, A. J., Thornhill, K. L., Winstead, E. L., Cubison, M. J., Hecobian, A., Jimenez, J. L., Weber, R. J., Anderson, B. E., and Nenes, A.: Analysis of CCN activity of Arctic aerosol and Canadian biomass burning during summer 2008, Atmos. Chem. Phys., 13, 2735–2756, https://doi.org/10.5194/acp-13-2735-2013, 2013.
Law, K. S. and Stohl, A.: Arctic air pollution: origins and impacts, Science, 315, 1537–1540, https://doi.org/10.1126/science.1137695, 2007.
Leaitch, W. R., Sharma, S., Huang, L., Toom-Sauntry, D., Chivulescu, A., Macdonald, A. M., von Salzen, K., Pierce, J. R., Bertram, A. K., Schroder, J. C., Shantz, N. C., Chang, R. Y.-W., and Norman, A.-L.: Dimethyl sulfide control of the clean summertime Arctic aerosol and cloud, Elem. Sci. Anthr., 1, 000017, https://doi.org/10.12952/journal.elementa.000017, 2013.
Leaitch, W. R., Korolev, A., Aliabadi, A. A., Burkart, J., Willis, M. D., Abbatt, J. P. D., Bozem, H., Hoor, P., Köllner, F., Schneider, J., Herber, A., Konrad, C., and Brauner, R.: Effects of 20–100 nm particles on liquid clouds in the clean summertime Arctic, Atmos. Chem. Phys., 16, 11107–11124, https://doi.org/10.5194/acp-16-11107-2016, 2016.
Leaitch, W. R., Russell, L. M., Liu, J., Kolonjari, F., Toom, D., Huang, L., Sharma, S., Chivulescu, A., Veber, D., and Zhang, W.: Organic functional groups in the submicron aerosol at 82.5∘ N, 62.5∘ W from 2012 to 2014, Atmos. Chem. Phys., 18, 3269–3287, https://doi.org/10.5194/acp-18-3269-2018, 2018.
Leck, C., Norman, M., Bigg, E. K., and Hillamo, R.: Chemical composition and sources of the high Arctic aerosol relevant for cloud formation, J. Geophys. Res., 107, 4135, https://doi.org/10.1029/2001JD001463, 2002.
Levasseur, M.: Impact of Arctic meltdown on the microbial cycling of sulphur, Nat. Geosci., 6, 691–700, https://doi.org/10.1038/Ngeo1910, 2013.
Lin, C. T., Jickells, T. D., Baker, A. R., Marca, A., and Johnson, M. T.: Aerosol isotopic ammonium signatures over the remote Atlantic Ocean, Atmos. Environ., 133, 165–169, 2016.
Lovelock, J. E., Maggs, R. J., and Rasmussen, R. A.: Atmospheric dimethyl sulphide and the natural sulphur cycle, Nature, 237, 452–453, https://doi.org/10.1038/237452a0, 1972.
Lupi, A., Busetto, M., Becagli, S., Giardi, F., Lanconelli, C., Mazzola, M., Udisti, R., Hansson. H.-C., Henning, T., Petkov, B., Ström, J., Krejci, R., Tunved, P., Viola, A. P., and Vitale, V.: Multi-seasonal ultrafine aerosol particle number concentration measurements at the Gruvebadet Laboratory, NyÅlesund, Svalbard Islands, Rend. Lincei-Sci. Fis., 27, 59–71, https://doi.org/10.1007/s12210-016-0532-8, 2016.
Massling, A., Nielsen, I. E., Kristensen, D., Christensen, J. H., Sørensen, L. L., Jensen, B., Nguyen, Q. T., Nøjgaard, J. K., Glasius, M., and Skov, H.: Atmospheric black carbon and sulfate concentrations in Northeast Greenland, Atmos. Chem. Phys., 15, 9681–9692, https://doi.org/10.5194/acp-15-9681-2015, 2015.
Maturilli, M., Herber, A., and König-Langlo, G.: Climatology and time series of surface meteorology in Ny-Ålesund, Svalbard, Earth Syst. Sci. Data, 5, 155–163, https://doi.org/10.5194/essd-5-155-2013, 2013.
Maturilli, M., Herber, A., and König-Langlo, G.: Surface radiation climatology for Ny-Ålesund, Svalbard (78.9∘ N), basic observations for trend detection, Theor. Appl. Climatol., 120, 331–339, https://doi.org/10.1007/s00704-014-1173-4, 2015.
Mauritsen, T., Sedlar, J., Tjernström, M., Leck, C., Martin, M., Shupe, M., Sjogren, S., Sierau, B., Persson, P. O. G., Brooks, I. M., and Swietlicki, E.: An Arctic CCN-limited cloud-aerosol regime, Atmos. Chem. Phys., 11, 165–173, https://doi.org/10.5194/acp-11-165-2011, 2011.
Melia, N., Haines, K., and Hawkins, E.: Sea ice decline and 21st century trans-Arctic shipping routes, Geophys. Res. Lett., 43, 9720–9728, https://doi.org/10.1002/2016GL069315, 2016.
Moroni, B., Cappelletti, D., Crocchianti, S., Becagli, S., Caiazzo, L., Traversi, R., Udisti, R., Mazzola, M., Markowicz, K., Ritter, C., and Zielinski, T.: Morphochemical characteristics and mixing state of long range transported wildfire particles at Ny-Ålesund (Svalbard Islands), Atmos. Environ., 156, 135–145, https://doi.org/10.1016/j.atmosenv.2017.02.037, 2017.
Mundy, C. J., Gosselin, M., Gratton, Y., Brown, K., Galindo, V., Campbell, K., Levasseur, M., Barber, D., Papakyriakou, T. N., and Bélanger, S.: Role of environmental factors on phytoplankton bloom initiation under landfast sea ice in Resolute Passage, Canada, Mar. Ecol. Prog. Ser., 497, 39–49, 2014.
Mungall, E. L., Abbatt, J. P. D., Wentzell, J. J. B., Lee, A. K. Y., Thomas, J. L., Blais, M., Gosselin, M., Miller, L. A., Papakyriakou, T., Willis, M. D., and Liggio, J.: A novel source of oxygenated volatile organic compounds in the summertime marine Arctic boundary layer, P. Natl. Acad. Sci. USA, 114, 6203–6208, https://doi.org/10.1073/pnas.1620571114, 2017.
Nguyen, Q. T., Skov, H., Sørensen, L. L., Jensen, B. J., Grube, A. G., Massling, A., Glasius, M., and Nøjgaard, J. K.: Source apportionment of particles at Station Nord, North East Greenland during 2008–2010 using COPREM and PMF analysis, Atmos. Chem. Phys., 13, 35–49, https://doi.org/10.5194/acp-13-35-2013, 2013.
Nguyen, Q. T., Glasius, M., Sørensen, L. L., Jensen, B., Skov, H., Birmili, W., Wiedensohler, A., Kristensson, A., Nøjgaard, J. K., and Massling, A.: Seasonal variation of atmospheric particle number concentrations, new particle formation and atmospheric oxidation capacity at the high Arctic site Villum Research Station, Station Nord, Atmos. Chem. Phys., 16, 11319–11336, https://doi.org/10.5194/acp-16-11319-2016, 2016.
Nordli, Ø., Przybylak, R., Ogilvie, A., and Isaksen, K.: Long-term temperature trends and variability on Spitsbergen: The extended Svalbard Airport temperature series, 1898–2012, Polar Res., 33, 21349, https://doi.org/10.3402/polar.v33.21349, 2014.
O'Dowd, C. D., Jimenez, J. L., Bahreini, R., Flagan, R. C., Seinfeld, J. H., Pirjola, L., Kulmala, M., Jennings, S. F. G., and Hoffmann, T.: Marine aerosol formation from biogenic iodine emissions, Nature, 417, 632–636, https://doi.org/10.1038/nature00775, 2002.
Park, K.-T., Lee, K., Kim, T.-W., Yoon, Y. J., Jang, E.-H., Jang, S., Lee, B.-Y., and Hermansen, O.: Atmospheric DMS in the Arctic Ocean and its relation to phytoplankton biomass, Global Biogeochem. Cy., 32, 351–359, https://doi.org/10.1002/2017GB005805, 2018.
Pithan, F. and Mauritsen, T.: Arctic amplification dominated by temperature feedbacks in contemporary climate models, Nat. Geosci., 7, 181–184, https://doi.org/10.1038/ngeo2071, 2014.
Polissar, A. V., Hopke, P. K., and Harris, J. M.: Source Regions for Atmospheric Aerosol Measured at Barrow, Alaska, Environ. Sci. Technol., 35, 4214–4226, https://doi.org/10.1021/es0107529, 2001.
Quinn, P. K. and Bates, T. S.: The case against climate regulation via oceanic phytoplankton sulphur emissions, Nature, 480, 51–56, https://doi.org/10.1038/nature10580, 2011.
Raes, F., Van Dingenen, R., Vignati, E., Wilson, J., Putaud, J. P., Seinfeld, J. H., and Adams, P.: Formation and cycling of aerosols in the global troposphere, Atmos. Environ., 34, 4215–4240, 2000.
Randelhoff, A., Reigstad, M., Chierici, M., and Sundfjord, A.: Seasonality of the physical and biogeochemical hydrography in the inflow to the arctic ocean through fram strait, Front. Mar. Sci., 5, 224, https://doi.org/10.3389/fmars.2018.00224, 2018.
Riddick, S. N., Dragosits, U., Blackall, T. D., Daunt, F., Wanless, S., and Sutton, M. A.: The global distribution of ammonia emissions from seabird colonies, Atmos. Environ., 55, 319–327, 2012.
Sharma, S., Andrews, E., Barrie, L. A., Ogren, J. A., and Lavoué, D.: Variations and sources of the equivalent black carbon in the high Arctic revealed by long-term observations at Alert and Barrow: 1989–2003, J. Geophys. Res., 111, D14208, https://doi.org/10.1029/2005JD006581, 2006.
Sipilä, M., Sarnela, N., Jokinen, T., Henschel, H., Junninen, H., Kontkanen, J., Richters, S., Kangasluoma, J., Franchin, A., Peräkylä, O., Rissanen, M. P., Ehn, M., Vehkamäki, H., Kurten, T., Berndt, T., Petäjä, T., Worsnop, D., Ceburnis, D., Kerminen, V.-M., Kulmala, M., and O'Dowd, C.: Molecular-scale evidence of aerosolparticle formation via sequential addition of HIO3, Nature, 537, 532–534, https://doi.org/10.1038/nature19314, 2016.
Stefels, J., Steinke, M., Turner, S., Malin, G., and Belviso, S.: Environmental constraints on the production and removal of the climatically active gas dimethylsulphide (DMS) and implications for ecosystem modeling, Biogeochemistry, 83, 245–275, https://doi.org/10.1007/s10533-007-9091-5, 2007.
Stohl, A.: Characteristics of atmospheric transport into the Arctic troposphere, J. Geophys. Res.-Atmos., 111, D11306, https://doi.org/10.1029/2005jd006888, 2006.
Stroeve, J. C., Kattsov, V., Barrett, A., Serreze, M., Pavlova, T., Holland, M., and Meier, W. N.: Trends in Arctic sea ice extent from CMIP5, CMIP3 and observation, Geophys. Res. Lett., 39, L16502, https://doi.org/10.1029/2012GL052676, 2012.
Ström, J., Umegard, J., Torseth, K., Tunved, P., Hansson, H. C., Holmen, K., Wismann, V., Herber, A., and Konig-Langlo, G.: One year of particle size distribution and aerosol chemicalcomposition measurements at the Zeppelin Station, Svalbard, March 2000–March 2001, Phys. Chem. Earth, 28, 1181–1190, https://doi.org/10.1016/j.pce.2003.08.058, 2003.
Ström, J., Engvall, A.-C., Delbart, F., Krejci, R., and Treffeisen, R.: On small particles in the Arctic summer boundary layer: observations at two different heights near Ny-Ålesund, Svalbard, Tellus B, 61, 473–482, https://doi.org/10.1111/j.1600-0889.2008.00412.x, 2009.
Tovar-Sánchez, A., Duarte, C. M., Alonso, J. C., Lacorte, S., Tauler, R., and Galbán-Malagón, C.: Impacts of metals and nutrients released from melting multiyear Arctic sea ice, J. Geophys. Res., 115, C07003, https://doi.org/10.1029/2009JC005685, 2010.
Tunved, P., Hansson, H. C., Kerminen, V. M., Strom, J., Dal Maso, M., Lihavainen, H., Viisanen, Y., Aalto, P. P., Komppula, M., and Kulmala, M.: High natural aerosol loading over boreal forests, Science, 312, 261–263, 2006.
Tunved, P., Ström, J., and Krejci, R.: Arctic aerosol life cycle: linking aerosol size distributions observed between 2000 and 2010 with air mass transport and precipitation at Zeppelin station, Ny-Ålesund, Svalbard, Atmos. Chem. Phys., 13, 3643–3660, https://doi.org/10.5194/acp-13-3643-2013, 2013.
Udisti, R., Bazzano, A., Becagli, S., Bolzacchini, E., Caiazzo, L., Cappelletti, D., Ferrero, L., Frosini, D., Giardi, F., Grotti, M., Lupi, A., Malandrino, M., Mazzola, M., Moroni, B., Severi, M., Traversi, R., Viola, A., and Vitale, V.: Sulfate source apportionment in the Ny Ålesund (Svalbard Islands) Arctic aerosol, Rend. Fis. Acc. Lincei., 27, S85–S94, https://doi.org/10.1007/s12210-016-0517-7, 2016.
Yu, J. Z., Huang, X.-F., Xu, J., and Hu, M.: When aerosol sulfate goes up, so does oxalate: implication for the formation mechanisms of oxalate, Environ. Sci. Technol., 29, 128–133, 2005.
Weber, R. J., McMurry, P. H., Mauldin, L., Tanner, D. J., Eisele, F. L., Brechtel, F. J., Kreidenweis, S. M., Kok, G. L., Schillawski, R. D., and Baumgardner, D.: A study of new particle formation and growth involving biogenic and trace gas species measured during ACE 1, J. Geophys. Res.-Atmos., 103, 16385–16396, https://doi.org/10.1029/97jd02465, 1998.
Wentworth, G. R., Murphy, J. G., Croft, B., Martin, R. V., Pierce, J. R., Côté, J.-S., Courchesne, I., Tremblay, J.-É., Gagnon, J., Thomas, J. L., Sharma, S., Toom-Sauntry, D., Chivulescu, A., Levasseur, M., and Abbatt, J. P. D.: Ammonia in the summertime Arctic marine boundary layer: sources, sinks, and implications, Atmos. Chem. Phys., 16, 1937–1953, https://doi.org/10.5194/acp-16-1937-2016, 2016.