the Creative Commons Attribution 4.0 License.
the Creative Commons Attribution 4.0 License.
 | 22 May 2019
Effects of air pollution control policies on PM2.5 pollution improvement in China from 2005 to 2017: a satellite-based perspective
Zongwei Ma
Riyang Liu
Jun Bi
Understanding the effectiveness of air pollution control policies is important for future policy making. China has implemented strict air pollution control policies since the 11th Five-Year Plan (FYP). There is still a lack of overall evaluation of the effects of air pollution control policies on PM2.5 pollution improvement in China since the 11th FYP. In this study, we aimed to assess the effects of air pollution control policies from 2005 to 2017 on PM2.5 using satellite remote sensing. We used the satellite-derived PM2.5 of 2005–2013 from one of our previous studies. For the data of 2014–2017, we developed a two-stage statistical model to retrieve satellite PM2.5 data using the Moderate Resolution Imaging Spectroradiometer (MODIS) Collection 6 aerosol optical depth (AOD), assimilated meteorology, and land use data. The first stage is a day-specific linear mixed effects (LME) model and the second stage is a generalized additive model (GAM). Results show that the Energy Conservation and Emissions Reduction (ECER) policy, implemented in the 11th FYP period and focused on SO2 emissions control, had co-benefits with PM2.5 reductions. The increasing trends of PM2.5 pollution (1.88 and 3.14 µg m−3 year−1 for all of China and the Jingjinji region in 2004–2007, p<0.005) were suppressed after 2007. The overall PM2.5 trend for all of China was −0.56 µg m−3 year−1 with marginal significance (p=0.053) and PM2.5 concentrations in the Pearl River Delta region had a big drop (−4.81 µg m−3 year−1, p<0.001) in 2007–2010. The ECER policy during the 12th FYP period was basically an extension of the 11th FYP policy. PM2.5 is a kind of composite pollutant which comprises primary particles and secondary particles such as sulfate, nitrate, ammonium, organic carbon, elemental carbon, etc. Since the ECER policy focused on single-pollutant control, it had shown great limitation for PM2.5 reductions. The PM2.5 concentrations did not decrease from 2010 to 2013 in polluted areas (p values of the trends were greater than 0.05). Therefore, China implemented two stricter policies: the 12th FYP on Air Pollution Prevention and Control in Key Regions (APPC-KR) in 2012, and the Action Plan of Air Pollution Prevention and Control (APPC-AP) in 2013. The goal of air quality improvement (especially PM2.5 concentration improvement) and measures for multi-pollutant control were proposed. These policies led to dramatic decreases in PM2.5 after 2013 (−4.27 µg m−3 year−1 for all of China in 2013–2017, p<0.001).
- Article
(13887 KB) -
Supplement
(869 KB) - BibTeX
- EndNote


Fine particulate matter (PM2.5, aerodynamic particulate matter with a diameter less than 2.5 µm) is a major atmospheric pollutant, which has been shown to be strongly associated with adverse health effects (e.g., cardiovascular and respiratory morbidity and mortality) in many epidemiological studies (Crouse et al., 2012; Dominici et al., 2006; Pope et al., 2002). With the rapid economic development and industrialization in the past decades, PM2.5 pollution has gradually become a major environmental issue in China (Liu et al., 2017a). However, the Chinese government did not focus on the PM2.5 issues until 2012. Therefore, air pollution control policies implemented before 2012 mainly focus on SO2, industrial dust, and soot emission control. The air pollution control policies of China started to pay attention to PM2.5 since late 2012.
Understanding the effectiveness of air pollution control policies is important for future air pollution control in China. Several studies have examined the historical air pollution control policies and their association with the trends of SO2, NO2, and PM10 (Jin et al., 2016; Chen et al., 2011; Hu et al., 2010). Since the national PM2.5 monitoring network was established in late 2012, few studies have evaluated the effects of air pollution control policies on PM2.5 concentrations before 2013 due to the lack of historical ground-monitoring data. Therefore, it is difficult to understand whether the air pollution control policies had synergistic effects on PM2.5 reductions before 2012.
In recent years, many studies have shown that satellite remote sensing provides a powerful tool to assess the spatiotemporal trends of air pollution for both global and regional scales (Miyazaki et al., 2017; Itahashi et al., 2012; Krotkov et al., 2016). Estimating ground PM2.5 using satellite aerosol optical depth (AOD) data was also an effective way to fill the spatiotemporal PM2.5 gaps left by ground-monitoring networks (Liu, 2013, 2014; Hoff and Christopher, 2009). There are two major methods to estimate ground-level PM2.5 concentrations using AOD data, i.e., the scaling method and statistical approach (Liu, 2014). The scaling method uses atmospheric chemistry models to simulate the association between AOD and PM2.5, and then calculate the satellite-derived PM2.5 using the equation Satellite-derived PM2.5 (Liu, 2014). Boys et al. (2014) and van Donkelaar et al. (2015) estimated the global satellite PM2.5 time series using the scaling method. Compared to the scaling method, statistical models have greater prediction accuracy but require large amount of ground-measured PM2.5 data to develop the models (Liu, 2014). By taking advantage of the newly established ground PM2.5 monitoring network, we developed a two-stage statistical model to estimate historical monthly mean PM2.5 concentrations using Moderate Resolution Imaging Spectroradiometer (MODIS) Collection 6 Aqua AOD data in one of our previous studies (Ma et al., 2016). Validation results shows that this monthly PM2.5 dataset has high prediction accuracy (R2=0.73). This accurate historical PM2.5 dataset from 2004 to 2013 allowed us to examine the effects of pollution control policies on PM2.5 concentrations. In this previous study (Ma et al., 2016), we preliminarily analyzed the effects of Energy Conservation and Emissions Reduction (ECER) policy in the 11th Five-Year Plan (FYP) (2006–2010). We found an inflection point around 2008, after which PM2.5 concentration showed a slight decreasing trend, showing the co-benefits of the ECER policy. From 2013 to 2017, China implemented the Action Plan of Air Pollution Prevention and Control (APPC-AP), which focused on PM2.5 pollution. Currently, there is still a lack of overall evaluation of the effects of air pollution control policies on PM2.5 pollution improvement in China from 2005 to 2017.
In this study, we aimed to assess the effects of air pollution control policies from 2005 to 2017 on PM2.5 using satellite remote sensing. We used the satellite-derived PM2.5 dataset developed in our previous study (Ma et al., 2016). Since this dataset was from 2004 to 2013 and data after 2014 have been lacking, we extended the dataset to 2017 in the present work. To keep consistent with our previous satellite PM2.5 dataset, we used the same method as described in our previous study (Ma et al., 2016).
During 2005 to 2017, China implemented a series of air pollution prevention and control policies, including the 11th FYP on Environmental Protection (2006–2010), ECER policy during the 11th FYP period, the 12th FYP on Environmental Protection (2011–2015), the 12th FYP on ECER, the 12th FYP on Air Pollution Prevention and Control in Key Regions (APPC-KR), and APPC-AP (2013–2017). The base year, implementation period, major goals, and major measures are listed in Table 1.
Table 1Overview of major air pollution control policies in China from 2005 to 2017.

a Abbreviations – FYP: Five-Year Plan; ECER: Energy Conservation and
Emissions Reduction; APPC-KR: Air Pollution Prevention and Control in Key
Regions; APPC-AP: Action Plan of Air Pollution Prevention and Control.
b The key regions are shown in Fig. S1 in the Supplement.
During the 11th FYP period, there was no specific air pollution control policy. Air pollution prevention and control measures were incorporated into the whole environmental protection plan or policy (i.e., 11th FYP on Environmental Protection and ECER policy). From Table 1 we can see that the air pollution policies during the 11th FYP mainly focused on total emission reduction. In this period, environmental management in China was emission control oriented; that is, the indicators for local governments' environmental performance assessment were emission reduction rates, not the environmental quality. The 12th FYP on Environmental Protection and ECER policy were basically the extension of the 11th FYP policies, which mainly focused on emission reduction.
The 12th FYP on APPC-KR is the first special plan for air pollution prevention and control. This plan proposed the idea of unification of total emission reduction and air quality improvement. And it proposed the goals of air pollutant concentration control for the first time. PM2.5 pollution control was also incorporated into this plan. Although the implementation period of the 12th FYP on APPC-KR was 2011–2015, it was issued in 29 October 2012. After that, China issued the APPC-AP (2013–2017) in 10 September 2013, which strengthened the air pollution control and the goals of air quality improvement. These policies indicated that the focus of air pollution control in China began to focus on PM2.5 concentrations reductions.
3.1 Satellite-based PM2.5 from 2004 to 2013
We estimated the monthly satellite-based PM2.5 data from 2004 to 2013 at 0.1∘ resolution in our previous work (Ma et al., 2016). Briefly, we developed a two-stage statistical model using MODIS Collection 6 AOD and assimilated meteorology, land use data, and ground-monitored PM2.5 concentrations in 2013. The overall model cross-validation R2 (coefficient of determination) was 0.79 (daily estimates) for the model year. Since ground-monitored data before 2013 have been lacking and therefore it is not possible to develop statistical models before 2013 to estimate historical PM2.5 concentrations. Thus, the historical PM2.5 concentrations (2004–2012) were then estimated using the model developed based on the 2013 model. Two methods were used to validate the accuracy of historical estimates. First, we compared the historical estimate monitoring data from Hong Kong and Taiwan before 2013. Second, we estimated PM2.5 concentrations in the first half of 2014 using the 2013 model and compared them with the ground measurements to evaluate the accuracy of PM2.5 estimates beyond the model year, which can represent the accuracy of historical estimates. Validation results indicated that it accurately predicted PM2.5 concentrations with little bias at the monthly level (R2=0.73, slope =0.91).
For PM2.5 concentrations from 2004 to 2013, we used the abovementioned satellite-based PM2.5 dataset, which was estimated using the model developed in 2013. First, this dataset has shown high accuracy and has been widely used in environmental epidemiological (Liu et al., 2016a; Wang et al., 2018a), health impact (Liu et al., 2017b; Wang et al., 2018b), and social economic impact (Chen and Jin, 2019; Yang and Zhang, 2018) studies in China. Second, a recent study has shown that the historical hindcast ability of the annual model decreased when hindcast year was long before the model year (Xiao et al., 2018). Therefore, we did not use the models of 2014 to 2017 to estimate the hindcast PM2.5.
3.2 Satellite-based PM2.5 from 2014 to 2017
Unlike historical estimates from 2004 to 2012, we have sufficient ground-monitored PM2.5 data to develop statistical models after 2013, which allows us to estimate daily PM2.5 concentrations accurately. Therefore, we developed a separate PM2.5–AOD statistical model for each year of 2014–2017 to estimate the spatially resolved (0.1∘ resolution) PM2.5 concentrations. To keep satellite PM2.5 estimates of 2014–2017 consistent with our previous satellite PM2.5 dataset, we used the same method as described in our previous study (Ma et al., 2016). The data, model development, and model validation are briefly introduced as follows.
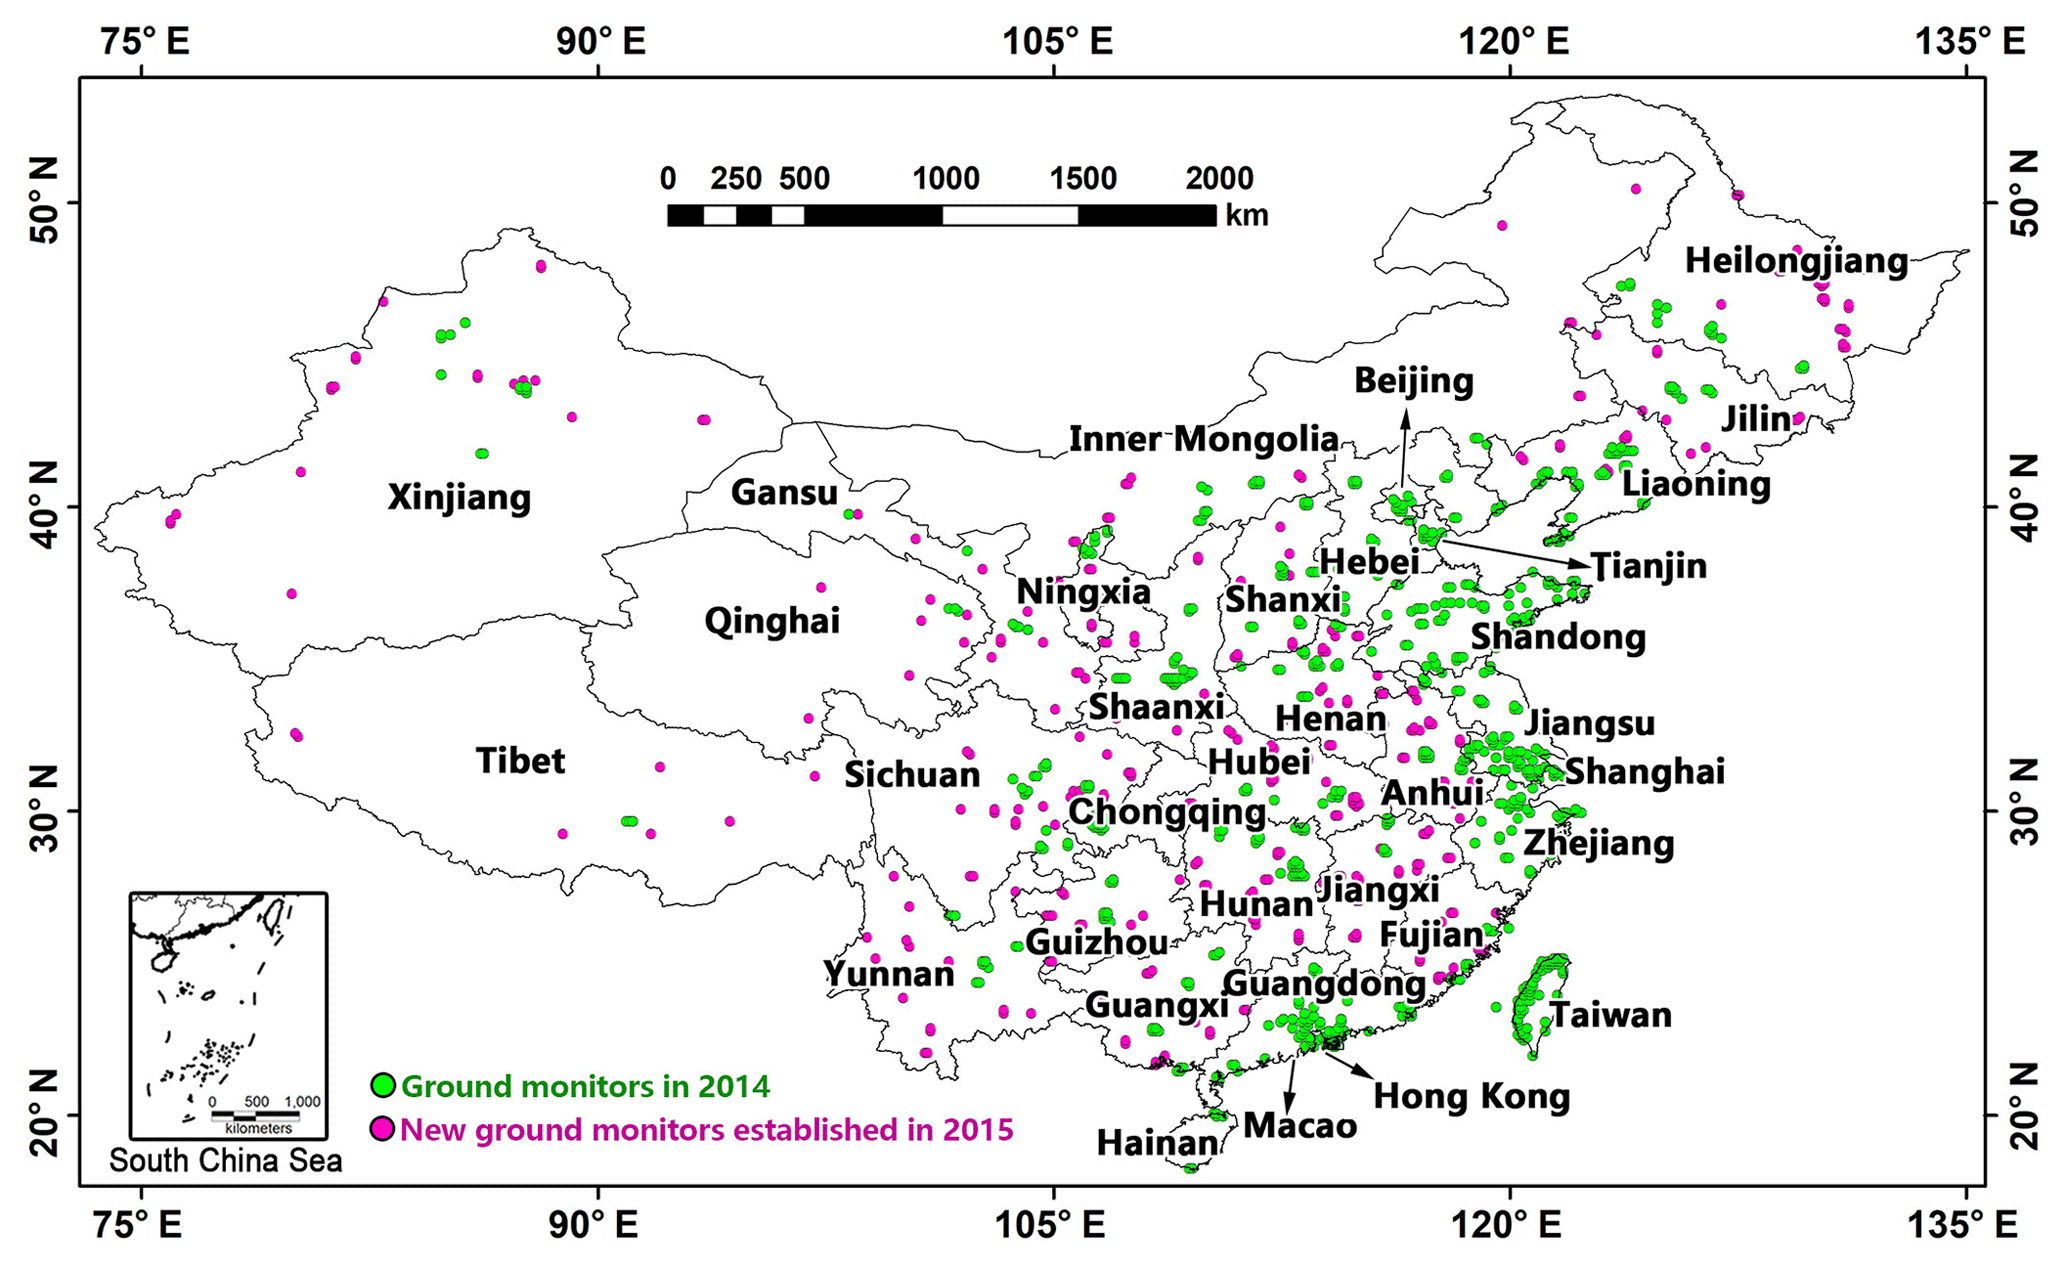
Figure 1Spatial distributions of ground PM2.5 monitors involved in model fitting and validation. Red circles denote the ground monitors in 2014. Pink circles denote new ground monitors established in 2015.
The data used in this study include ground-monitored PM2.5 concentrations (µg m−3), Aqua MODIS Collection 6 Dark Target (DT) AOD and Deep Blue (DB) AOD data, planetary boundary layer height (PBLH, 100 m), wind speed (WS, m s−1) at 10 m above the ground, mean relative humidity in PBL (RH_PBLH, %), surface pressure (PS, hPa), precipitation of the previous day (Precip_Lag1; mm), MODIS active fire spots, urban cover ( %), and forest cover ( %). ground-monitored PM2.5 data were collected from the China Environmental Monitoring Center (CEMC), environmental protection agencies of Hong Kong and Taiwan. Figure 1 shows the ground PM2.5 monitors used in this study. AOD data were downloaded from the Level 1 and Atmospheric Archive and Distribution System (https://ladsweb.modaps.eosdis.nasa.gov/, last access: 29 March 2019). Meteorological data were extracted from Goddard Earth Observing System Data Assimilation System GEOS-5 Forward Processing (GEOS 5-FP) meteorological data (ftp://rain.ucis.dal.ca, last access: 29 March 2019). MODIS fire spots were from the NASA Fire Information for Resource Management System (https://earthdata.nasa.gov/earth-observation-data/near-real-time/firms, last access: 29 March 2019). Land use information were downloaded from Resource and Environment Data Cloud Platform of Chinese Academy of Science (http://www.resdc.cn/data.aspx?DATAID=184, last access: 29 March 2019).
Previous studies have shown the data quality issue of ground PM2.5 measurements from the CEMC network (Liu et al., 2016b; Rohde and Muller, 2015). We performed the data screening procedure before model fitting. Abnormal values (extreme high or extreme low values for a site compared with its neighboring sites, repeated values for continuous hours, etc.) were deleted before model fitting. We required at least 20 hourly records to calculate the daily average PM2.5 concentrations. DT and DB AOD were combined using an inverse variance weighting method to improve the spatial coverage of AOD data (Ma et al., 2016). These combined AOD data have shown good consistency (R2=0.8, mean bias =0.07) with ground AOD measurements from the Aerosol Robotic Network (AERONET) (Ma et al., 2016). All data were assigned to a predefined 0.1∘ grid. Then all of the variables were matched by grid cell and day of the year (DOY) for model fitting.
A two-stage statistical model was developed for each year separately from 2014 to 2017. The first-stage linear mixed effects (LME) model included day-specific random intercepts and slopes for AOD, season-specific random slopes for meteorological variables, and fixed slope for precipitation and fire spots. The model structure of first-stage model is shown as follows:
where is ground PM2.5 measurements at grid cell s on DOY t; AODst is DT-DB merged AOD; WSst, PBLHst, PSst, RH_PBLHst, and Precip_Lag1st are meteorological variables; Fire_spotsst is the fire count; μ and μ′ are the fixed and day-specific random intercepts, respectively; β1–β7 are fixed slopes; is the day-specific random slope for AOD; – are the season-specific random slopes for meteorological variables; is the error term at grid cell s on DOY is the error term at grid cell s in season j; Ψ1 and Ψ2 are the variance–covariance matrices for the day- and season-specific random effects, respectively. The first-stage model was fitted for each province separately. We created a buffer zone for each province to include data with at least 3000 data records and at least 300 d. We averaged overlapped predictions from neighboring provinces to generate a smooth national PM2.5 concentration surface.
The second-stage generalized additive model (GAM) established the relationship between the residuals of the first-stage model and smooth terms of geographical coordinates, forest and urban cover.
where PM2.5_residst is the residual of the first-stage model at grid cell s on DOY t, μ0 is the intercept, s(X,Y)s is the smooth term of the coordinates of the centroid of grid cell s, s(ForestCover)s and s(UrbanCover)s are the smooth functions of forest cover and urban area for grid cell s, and εst is the error term.
To evaluate the model over-fitting, 10-fold cross-validation (CV) was used; that is, the model could have better prediction performance in the model fitting dataset than the data, which are not included model fitting. In 10-fold CV, all samples in the model dataset are randomly and equally divided into 10 subsets. One subset was used as testing samples and the rest of the subsets are used to fit the model. This process was repeated for 10 rounds until each subset was used for testing for once. Statistical indicators of coefficient of determination (R2), mean prediction error (MPE), and root mean squared prediction error (RMSE) were calculated and compared between model fitting and CV to assess model performance and over-fitting.
3.3 Time series analysis
Monthly mean PM2.5 concentrations for each grid cell were calculated to perform the time series analysis. Following our previous study (Ma et al., 2016), we required at least six daily PM2.5 predictions in each month to calculate the monthly mean PM2.5. We deseasonalized the monthly PM2.5 time series by calculating the monthly PM2.5 anomaly time series for each grid cell to remove the seasonal effect. The PM2.5 trend for each grid cell was calculated using least squares regression (Weatherhead et al., 1998):
where (PM2.5) is the PM2.5 anomaly at grid cell s for month m during the calculating period; (PM2.5)s,m is the estimated PM2.5 concentration at grid cell s for month m; m is the month index and M is the total number of months during the calculating period (2004–2017, M=168); is the 14-year average PM2.5 concentration of the month to which month m belongs (j=1 for January, j=2 for February, … , etc.); μ is the intercept; β is the slope, which is also the trend of PM2.5 (µg m−3 month−1); and ε is the error term. The annual PM2.5 trend (µg m−3 year−1) is 12×β. A t test was used to obtain the statistical significance of the trends. This method has been successfully applied to trend analyses of monthly mean PM2.5 and AOD anomaly time-series data (Hsu et al., 2012; Boys et al., 2014; Zhang and Reid, 2010; Xue et al., 2019). We analyzed the PM2.5 trend for different periods to examine the effects of air pollution control policies on PM2.5 pollution improvement.
4.1 Validation of satellite-based PM2.5 concentrations from 2014 to 2017
Table S1 in the Supplement summarized the statistics of all variables for the modeling dataset from 2014 to 2017. Overall, there are 95 649, 110 805, 113 490, and 123 652 matchups for the model fitting datasets for years of 2014, 2015, 2016, and 2017, respectively. The average PM2.5 concentration decreases year by year, from 65.66 µg m−3 in 2014 to 48.32 µg m−3 in 2017. Correspondingly, the average AOD also shows a decreasing trend from 0.67 in 2014 to 0.50 in 2017.
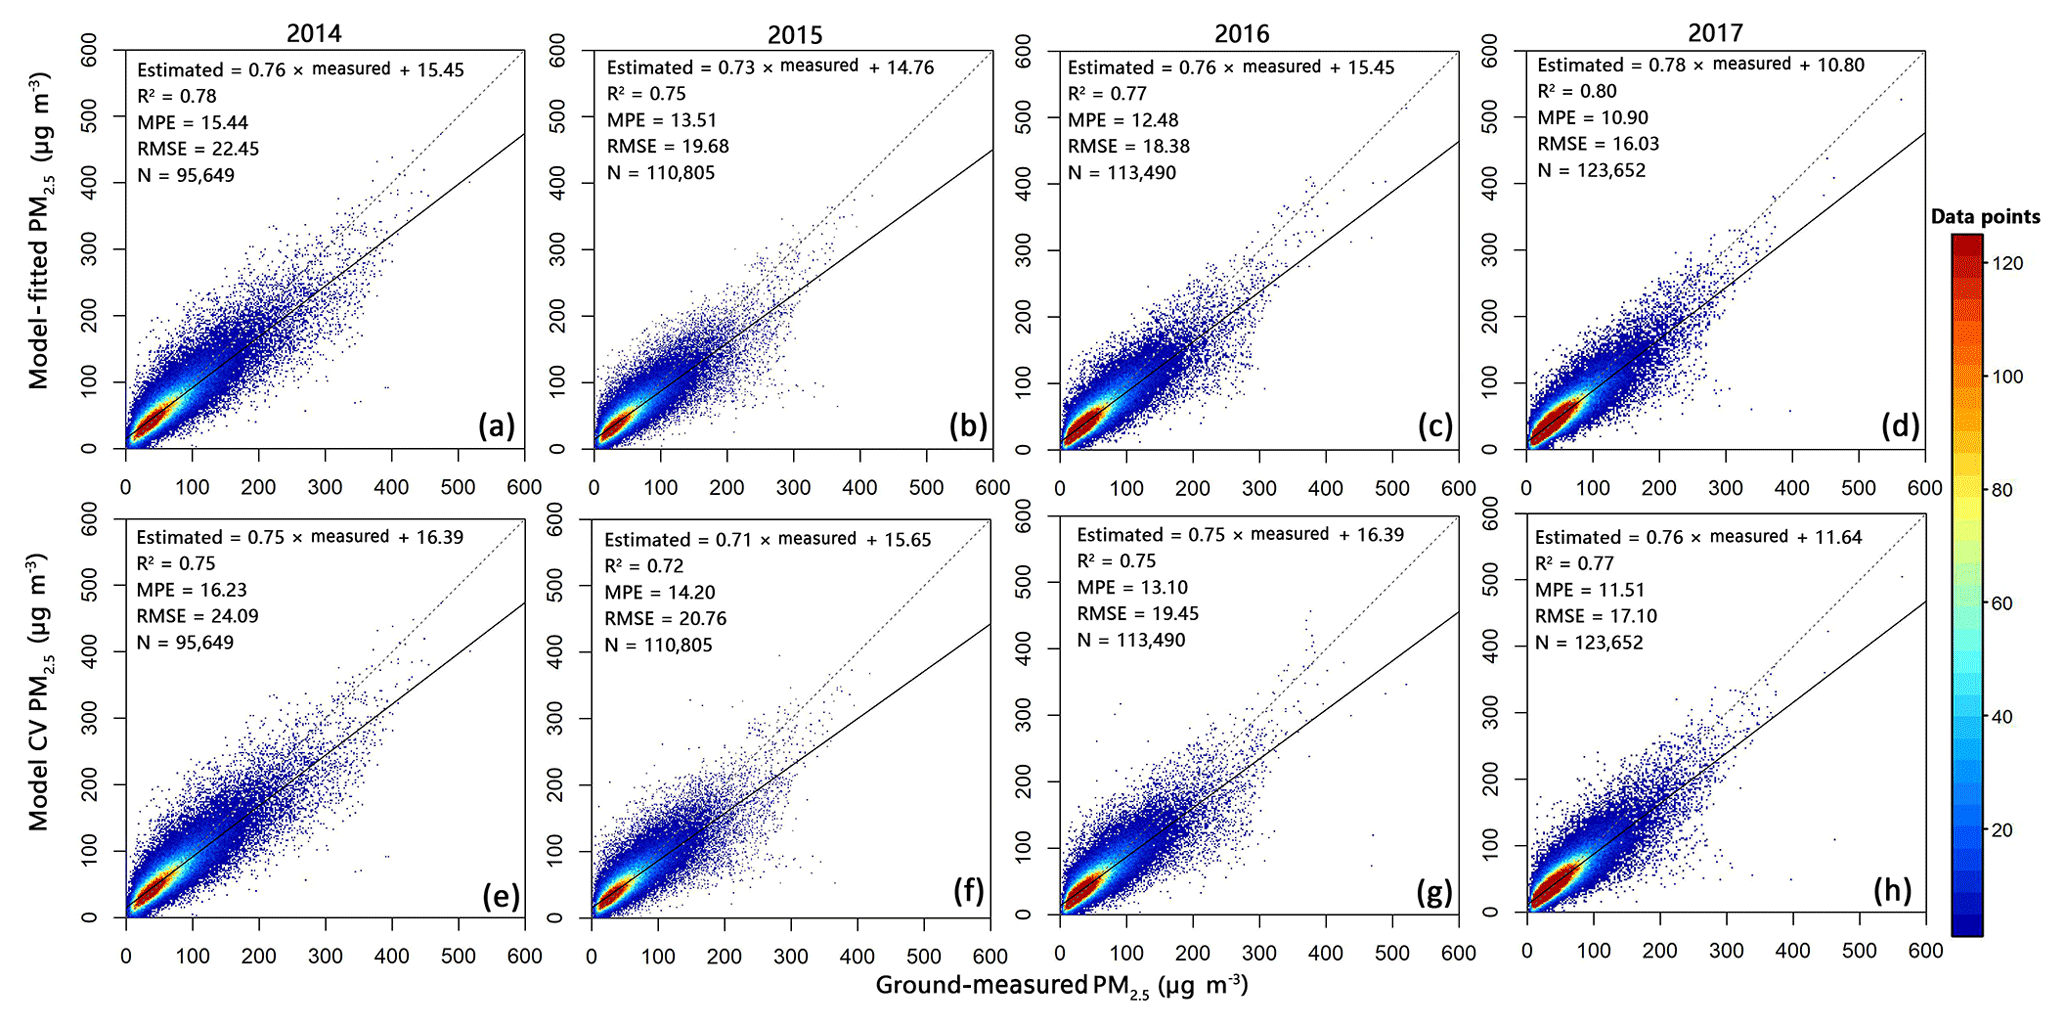
Figure 2Model fitting (upper row) and cross-validation (CV, lower row) results for satellite PM2.5 prediction models from 2014 to 2017.
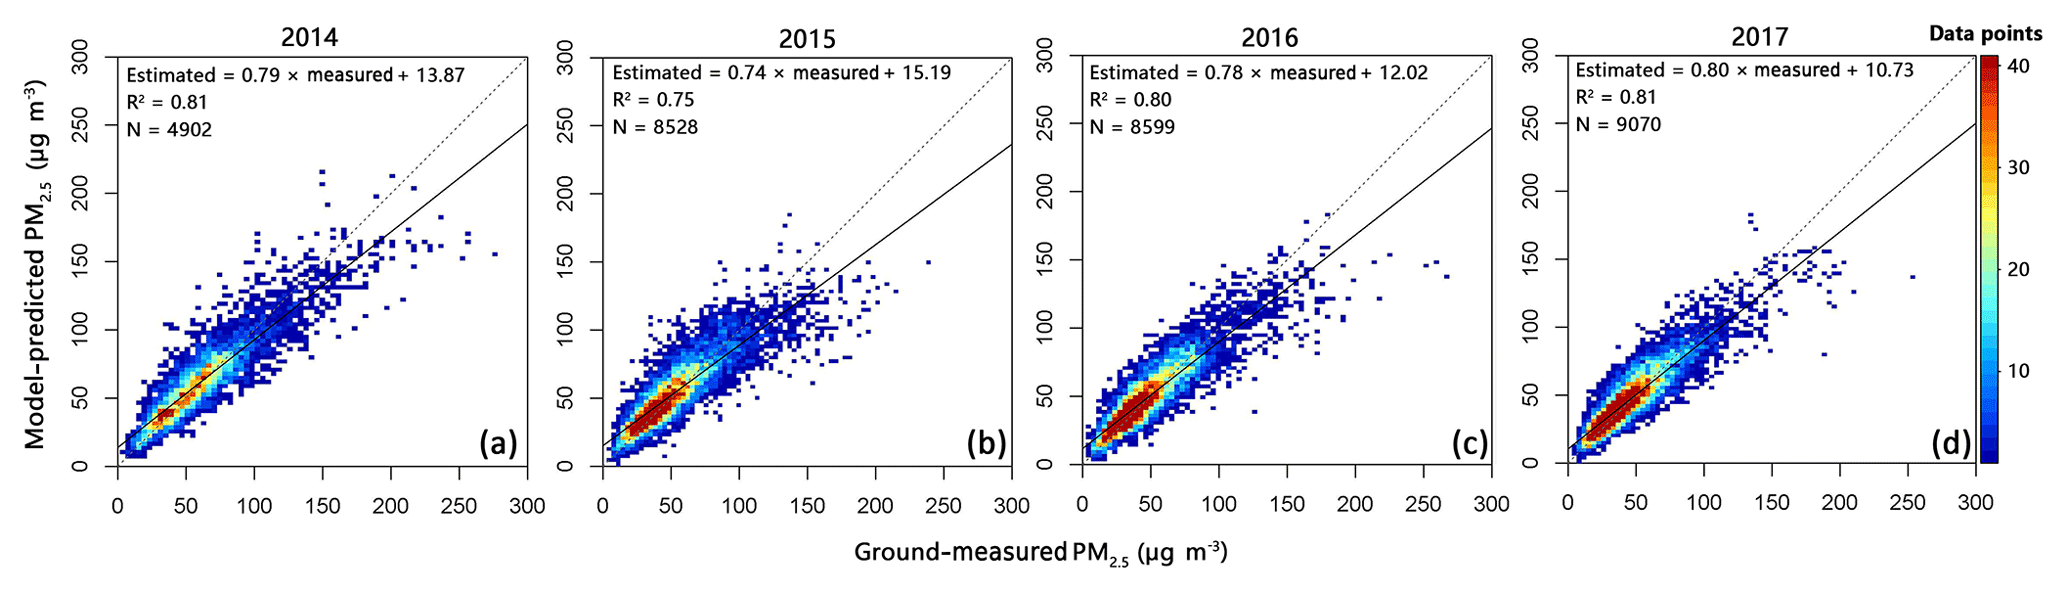
Figure 2 shows the model fitting and cross-validation results for each year's model. The model fitting R2 ranges from 0.75 (2015) to 0.80 (2017) and CV R2 ranges from 0.72 (2015) to 0.77 (2017), which is similar to the 2013 model (0.82 for model fitting and 0.79 for CV) developed in our previous study (Ma et al., 2016). The model prediction accuracy is different among years, which is consistent with previous studies. Hu et al. (2014) studied the 10-year spatial and temporal trends of PM2.5 concentrations in the southeastern US from 2001 to 2010. They developed a separate two-stage statistical model for each year and found the CV R2 ranged from 0.62 in 2009 to 0.78 in 2005 and 2006. Kloog et al. (2011, 2012) conducted two studies in the northeastern US and also found that the validation R2 varied among years. Compared to the model fitting R2, the CV R2 only decreases by 0.02 in 2016 and 0.03 in 2014, 2015, and 2017, showing that our models were not substantially over-fitted. For the monthly mean concentrations calculated from at least six daily PM2.5 predictions, the validation R2 values range from 0.75 to 0.81 (Fig. 3). The results show that the overall prediction accuracy of the models from 2014 to 2017 is satisfying.
The fixed effects, model fitting, and CV results of the first-stage LME model for each province are shown in Tables S2–S5. AOD is the only variable that was statistically significant in all provincial models for all years (p<0.05). Wind speed, relative humidity, precipitation, and fire spots were significant in most provincial models. The CV R2 varies for different provinces and different years. The CV R2 values range from 0.61 in Xinjiang to 0.77 in Heilongjiang for 2014, from 0.34 in Xinjiang to 0.76 in Hebei for 2015, from 0.44 in Tibet to 0.77 in Jiangsu for 2016, and from 0.38 in Xinjiang to 0.79 in Sichuan for 2017. We also fitted a first-stage LME model for all of China. Results show that the overall CV R2 values for the first-stage LME model dropped to 0.57, 0.52, 0.56, and 0.54, for 2014, 2015, 2016, and 2017, respectively. Therefore, fitting the first-stage model for each province separately can greatly improve the prediction accuracy.
A potential source of uncertainties in statistical models is the uneven spatial distribution of ground PM2.5 monitors. The CEMC air quality network mainly covers large urban centers with very limited site coverage in rural areas, especially in western part of the country. Since it requires a large amount of ground-measured PM2.5 data to develop satellite-based statistical model, this bias cannot be avoided. Despite this limitation, high model performances, which are much better than those using the scaling method, have been achieved in this study and previous similar studies (Zheng et al., 2016; Huang et al., 2018; Xue et al., 2019). For example, Geng et al. (2015) estimated long-term PM2.5 concentrations in China using a scaling method and found the validation R2 of PM2.5 predictions was 0.72 compared to the 5-month averaged ground PM2.5 concentrations for January–May 2013. A global study of PM2.5 estimates combining scaling and statistical methods shows that their validation R2 of long-term average PM2.5 was 0.67 for their first-stage scaling method (van Donkelaar et al., 2016).
4.2 Overall spatial and temporal trend of PM2.5 concentrations in China from 2004 to 2017
Figure 4 shows that spatial distribution characteristics of annual mean PM2.5 concentrations are similar among the years from 2004 to 2017. The most polluted area was the North China Plain (including the south of the Jingjinji region, Henan, and Shandong Provinces), which was also the largest polluted area. The Sichuan Basin (including eastern Sichuan and western Chongqing) is another polluted area. The cleanest areas were mainly located in Tibet, Hainan, Taiwan, Yunnan, and the north of Inner Mongolia. The spatial distributions of satellite-derived PM2.5 concentrations from 2013 to 2017 are consistent with the spatial characteristics of ground-monitored PM2.5 (Fig. S2).
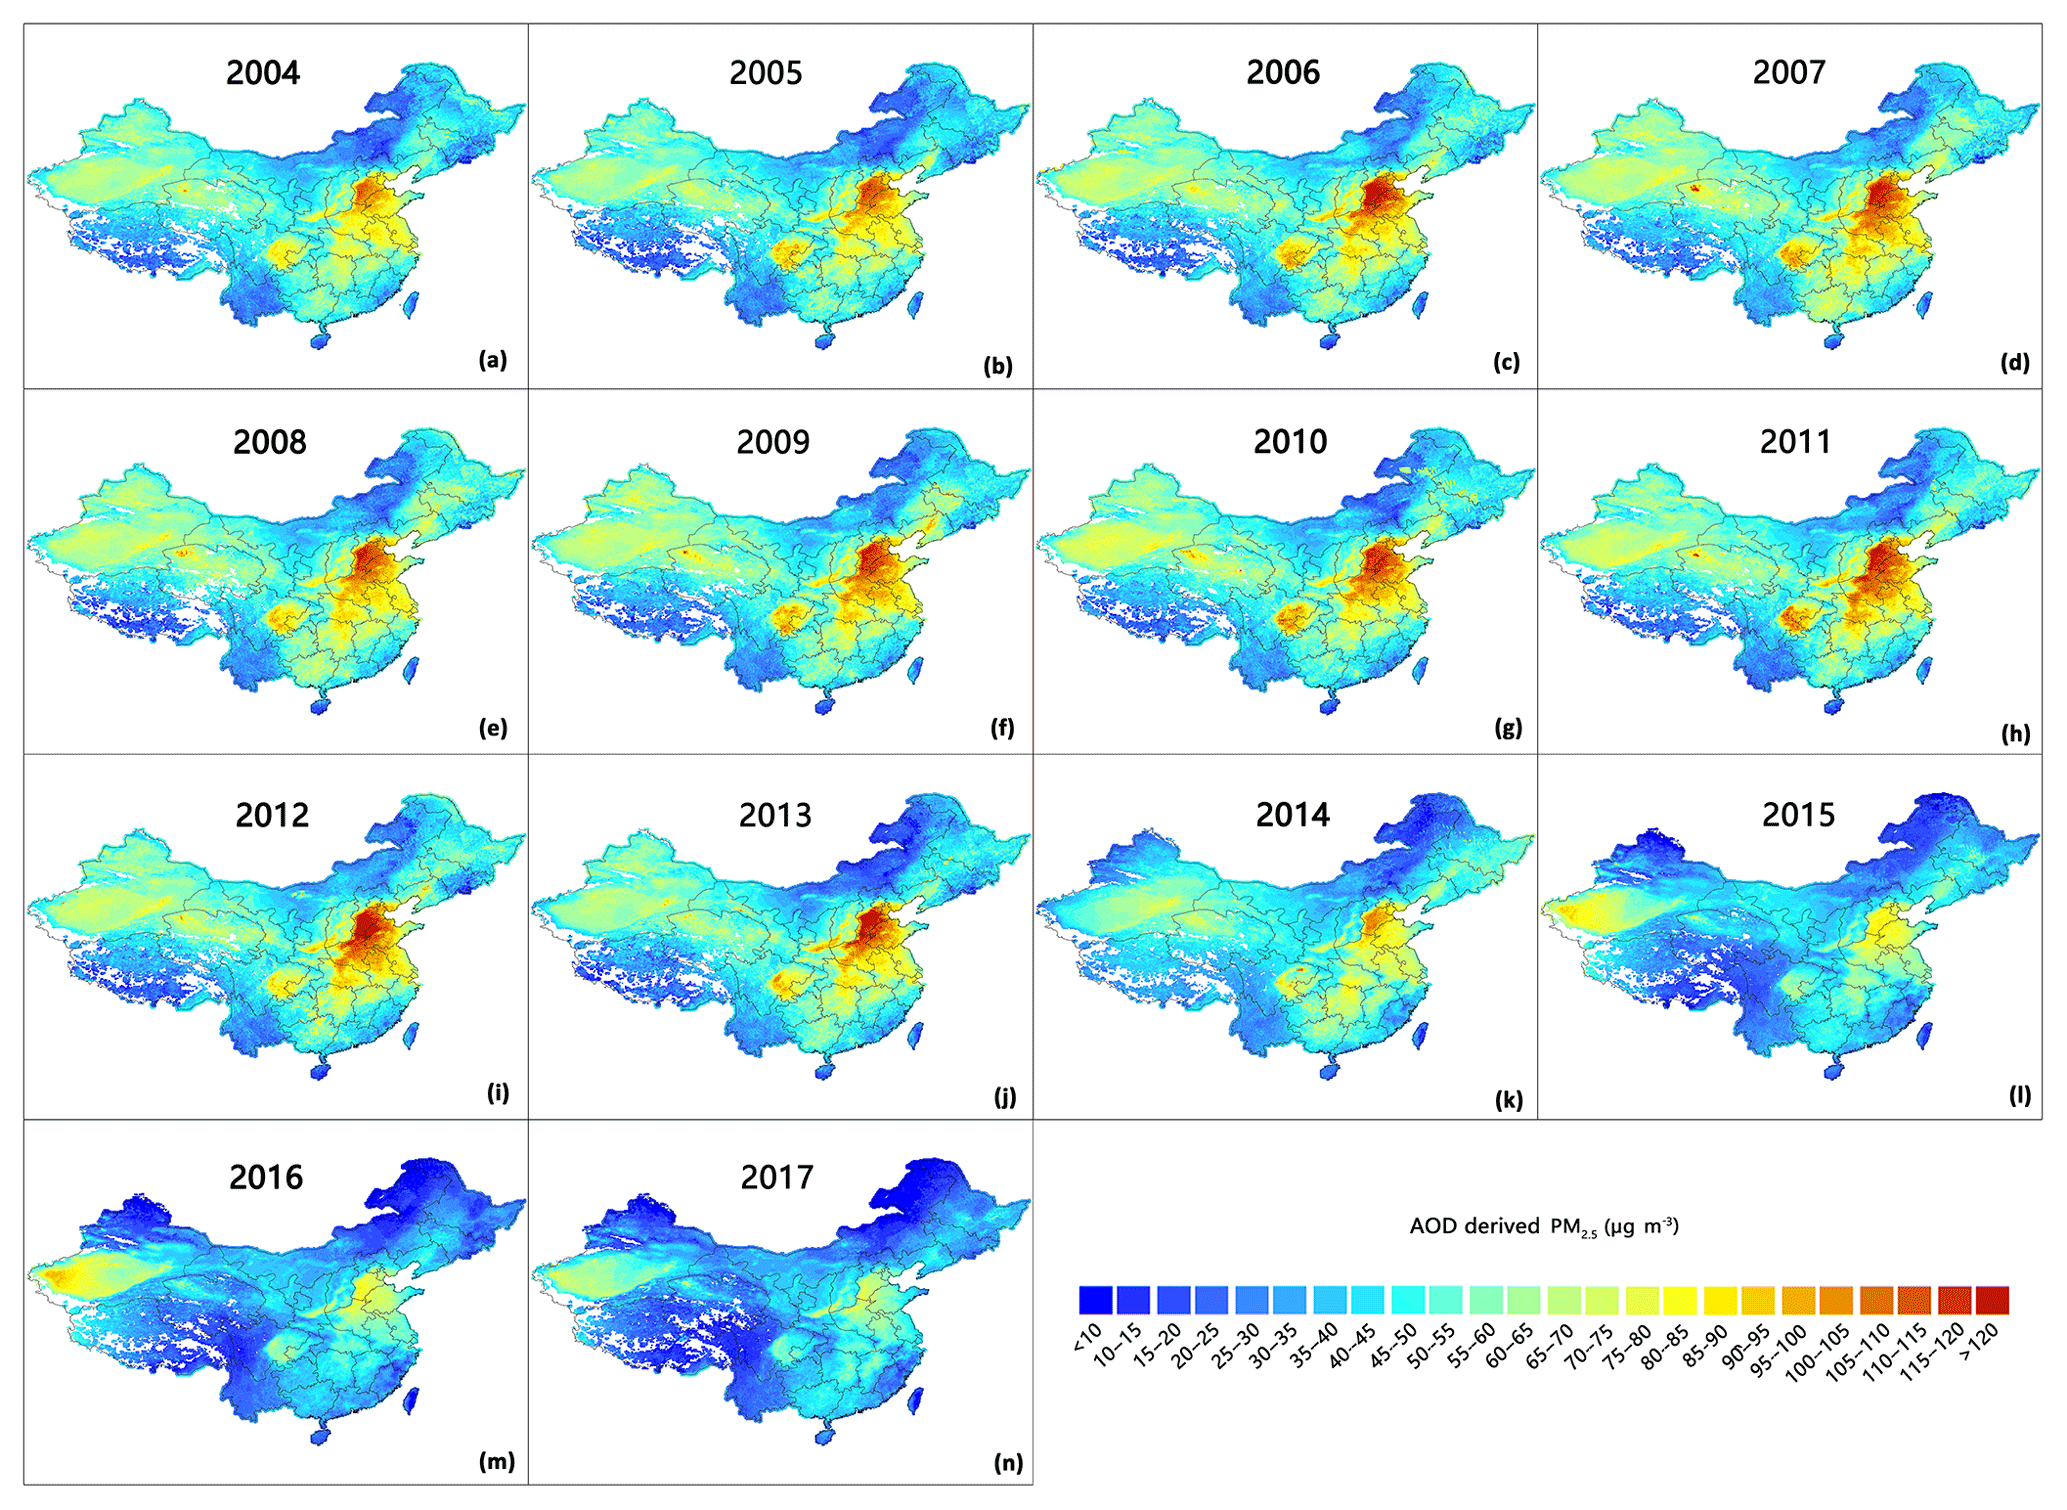
Figure 4Spatial distributions of annual mean satellite-derived PM2.5 concentrations from 2004 to 2017.

Figure 5Spatial distributions of PM2.5 trends and significance levels in China from 2004 to 2017.
Table 2Trends and 95 % confidence intervals (CIs) of PM2.5 concentrations for all of China and the Jingjinji, Yangtze River Delta, and Pearl River Delta regions from 2004 to 2017.
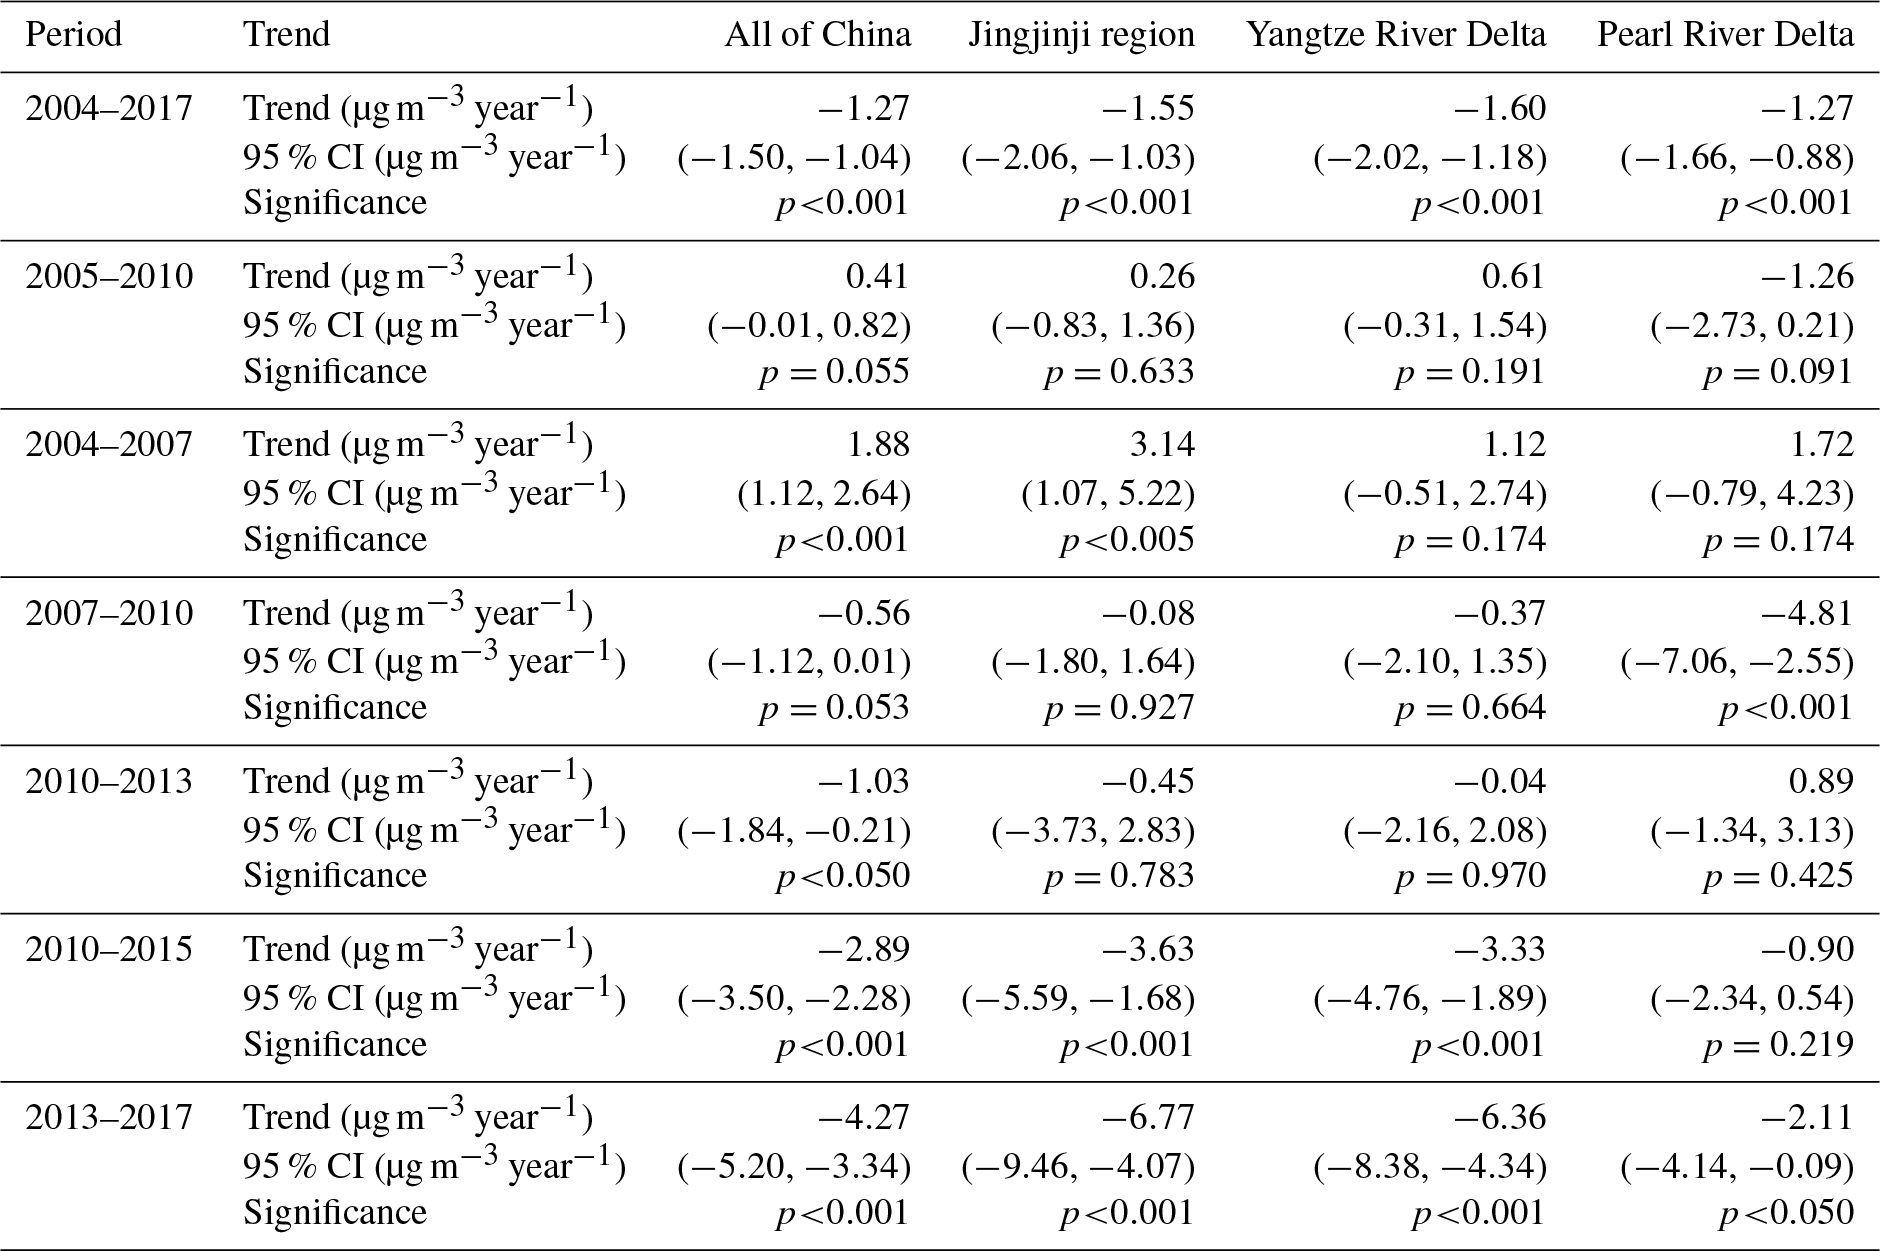
Figure 5 shows the spatial distributions of PM2.5 trends and significance levels in China from 2004 to 2017. Overall, the PM2.5 pollution level of most areas in China showed a decreasing trend (p<0.05). Figure 6 and Table 2 show that the overall trends of 2004–2017 for all of China and the Jingjinji, Yangtze River Delta (YRD), and Pearl River Delta (PRD) regions were −1.27, −1.55, −1.60, and −1.27 µg m−3 year−1 (all p<0.001), respectively. Back to Fig. 4, we can see that the decrease in PM2.5 mainly happened after 2013. PM2.5 concentrations showed an obvious increase from 2004 to 2007. The area with PM2.5 concentrations higher than 100 µg m−3 continuously expanded during this period. From 2008 to 2013, the pollution levels plateaued in most areas. After 2013, the PM2.5 concentrations obviously decreased.
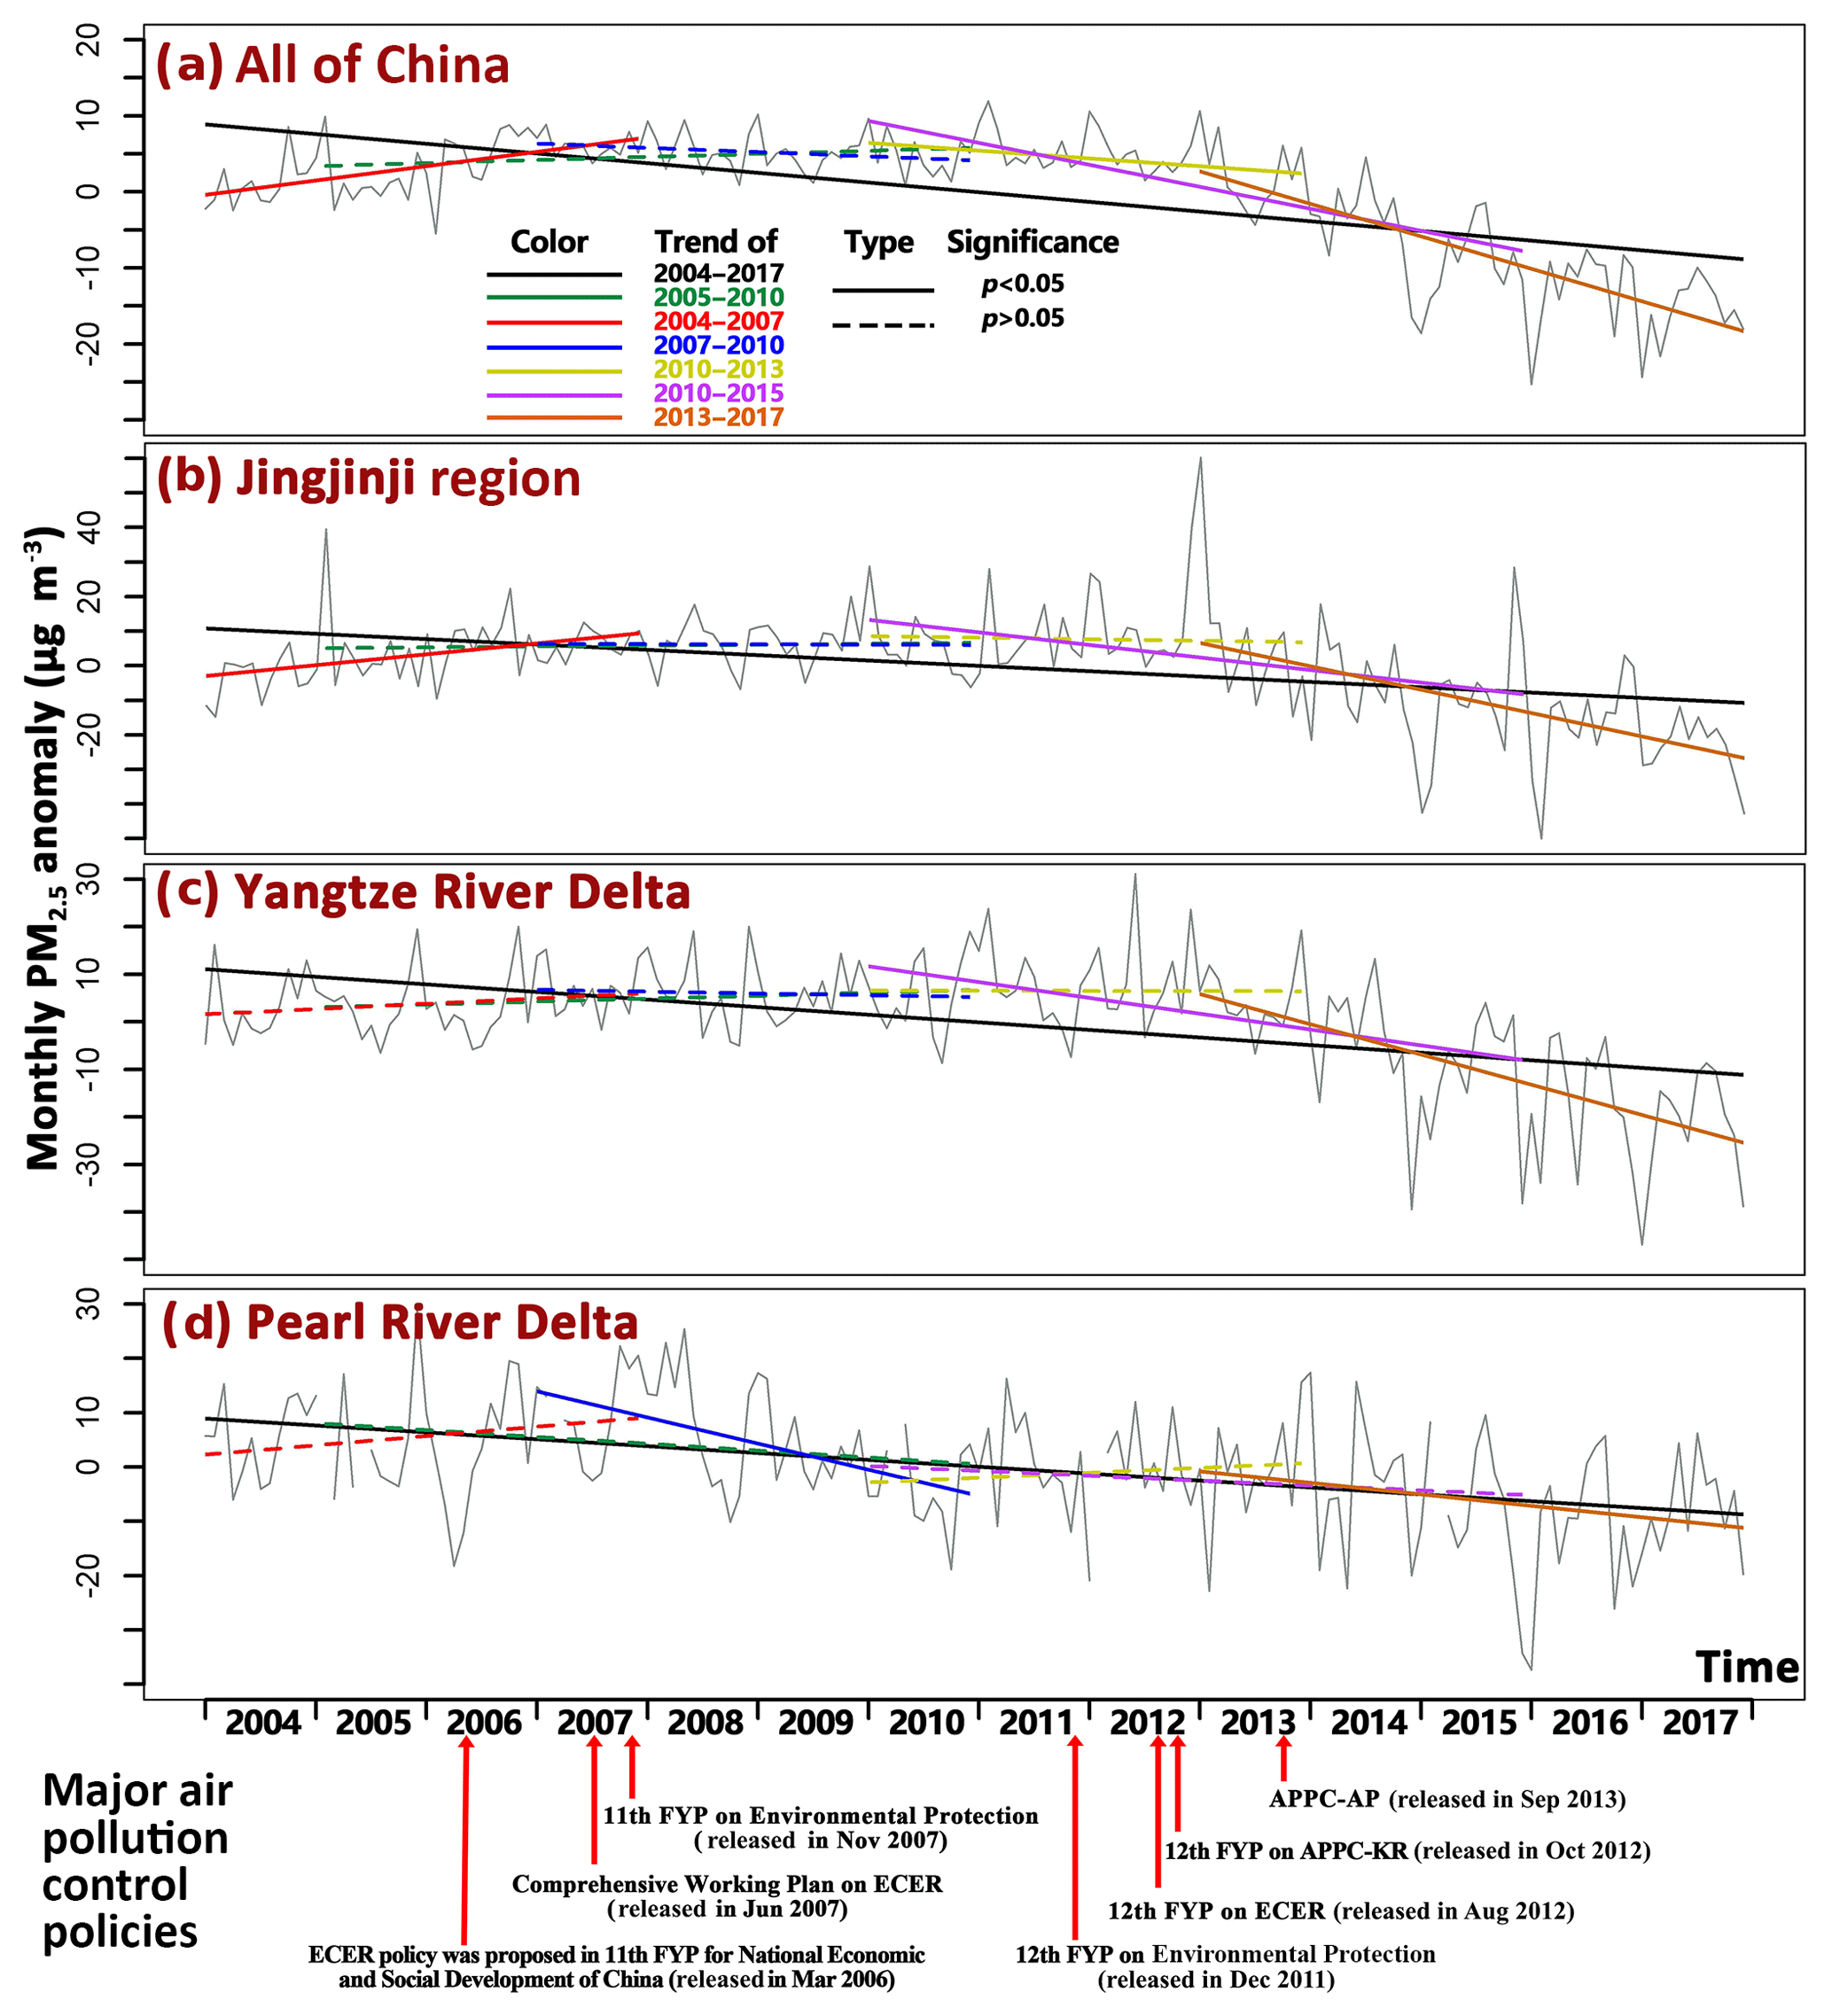
Figure 6PM2.5 trends for all of China and the Jingjinji, Yangtze River Delta (YRD), and Pearl River Delta (PRD) regions from 2004 to 2017, and corresponding air pollution control policies.
4.3 Effect of ECER policy during the 11th Five-Year Plan period
To assess the effect of ECER policy during the 11th FYP, we calculated the trends of PM2.5 for 2005–2010, 2004–2007, and 2007–2010 for each grid cell (Fig. 7).
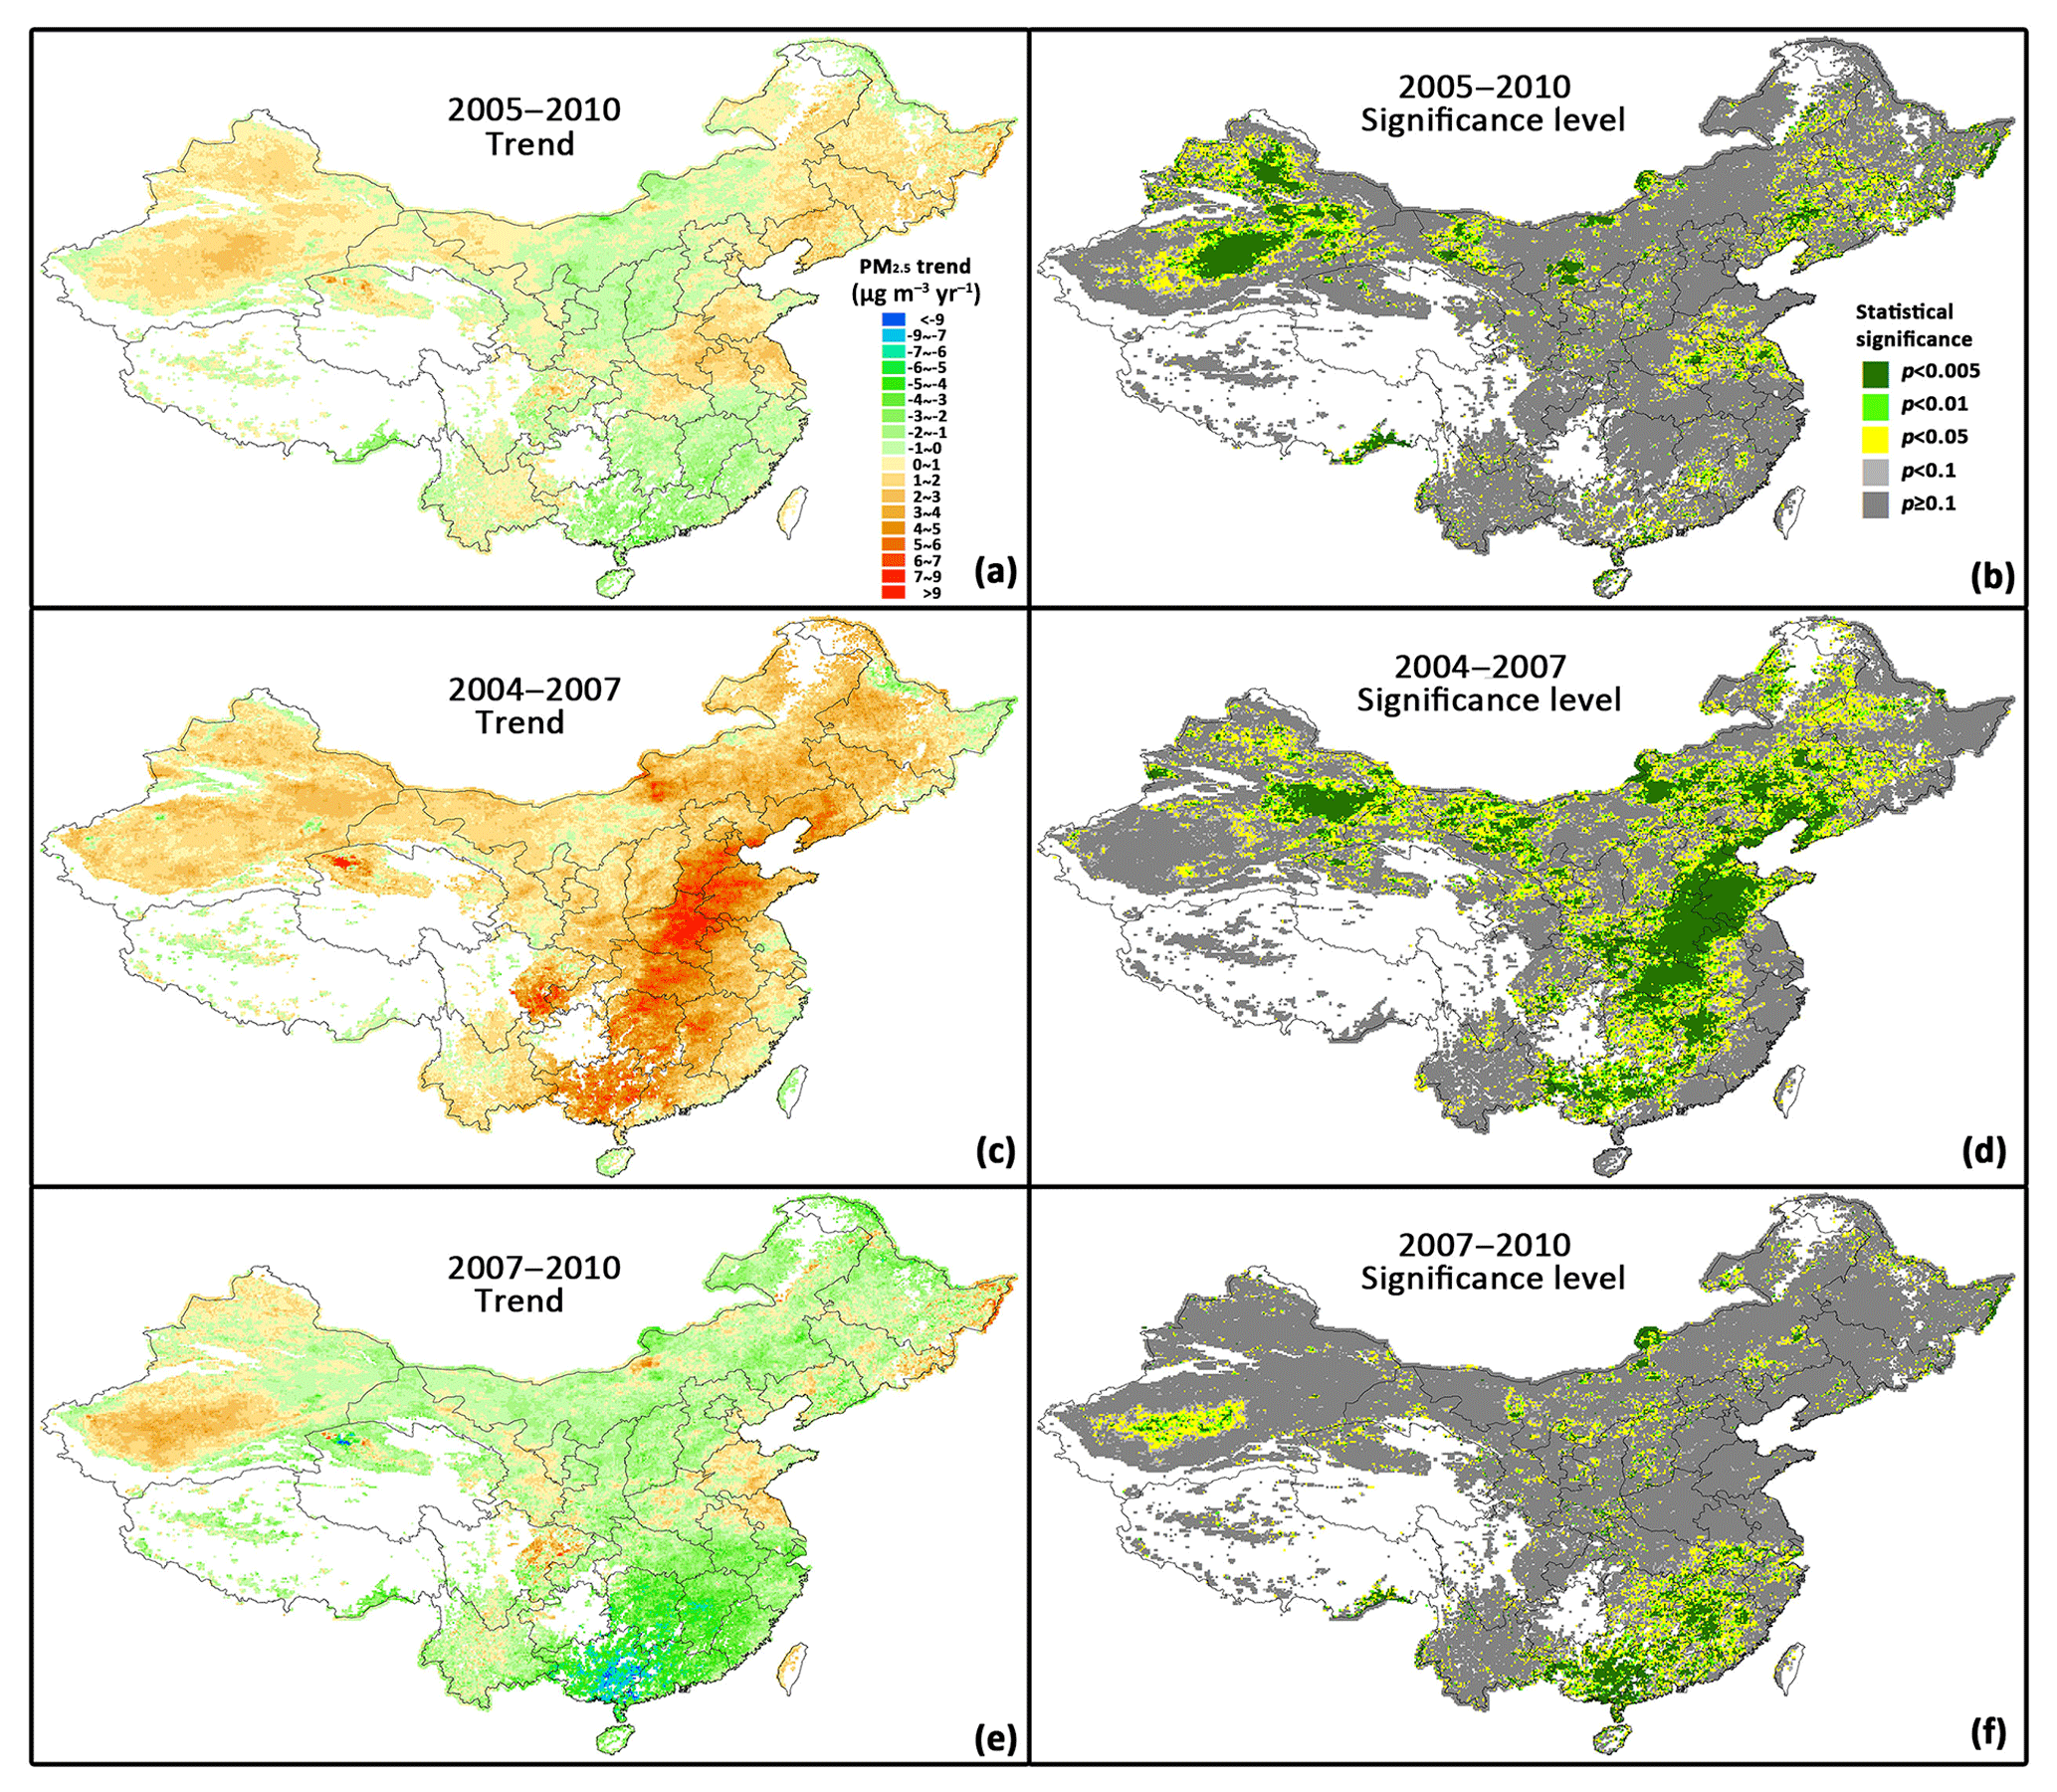
Figure 7Spatial distributions of PM2.5 trends and significance levels in China from 2005 to 2010.
Compared to the base year (2005) of the 11th FYP period, the overall PM2.5 pollution of 2010 did not show obvious change. Some of the area showed decreasing trends (Fig. 7a) but the trends were insignificant (Fig. 7b). Some regions (Shandong, Henan, and Jiangsu provinces and northeastern China) showed a slight increasing trend (∼1–2 µg m−3 year−1, p<0.001). Overall, the trends for all of China and the Jingjinji, YRD, and PRD regions were all insignificant (0.41, 0.26, 0.61, and −1.26 µg m−3 year−1, and all p>0.1) during the 11th FYP period.
However, when separating this period into two periods, we can see that before 2007, the PM2.5 concentrations generally had significant increasing trends (Fig. 7c, d), especially in the south of the Jingjinji region and in Henan, Shandong, and Hubei provinces. The overall trends for all of China and the Jingjinji region are 1.88 (p<0.001) and 3.14 µg m−3 year−1 (p<0.005) (Table 2). The trends for YRD and PRD regions are insignificant. During the 10th FYP period, China missed the emission control goals. The emission of sulfur dioxide increased by ∼28 % (Xue et al., 2014; Schreifels et al., 2012). The 11th FYP for National Economic and Social Development of China released in 2006 proposed the ECER goals. However, China did not achieve the annual goal in 2006. These could explain the increasing trend of PM2.5 during 2004–2007.
After that, China released the Comprehensive Working Plan on ECER (http://www.gov.cn/zwgk/2007-06/03/content_634545.htm, last access: 29 March 2019) in 2007 to strengthen the ECER measures. Major control measures included (Schreifels et al., 2012) implementing flue gas desulfurization for coal-fired power plants, closing inefficient and backward production centers, implementing energy conservation projects, increasing the pollution levy for SO2 emission, recommending baghouse dust filters for industrial soot and dust emission control, etc. As a result, great achievements had been made at the end of 11th FYP (Schreifels et al., 2012; Zhou et al., 2015): total emission of SO2 decreased by ∼14 % compared to the level of 1995; approximately 86 % of the power plants were installed with desulfurization facilities in 2010 compared to 14 % in 2005; nearly 80 GW of small coal-fired power units were closed during 2006–2010; soot emission of coal-fired power plants in 2010 was reduced by 55.6 % compared with that in 2005, etc.
Due to these control measures, the increasing trend of PM2.5 pollution was suppressed after 2007. PM2.5 concentrations of central and southern China decreased significantly, with highest trend of around −9 µg m−3 year−1 (Fig. 7e, f), p<0.01). The south of Jingjinji region and Henan, Shandong, and Hubei provinces, which had significantly increased before 2007, showed insignificant trends (Fig. 7f, p>0.05). Table 2 shows that the overall PM2.5 trend for all of China was −0.56 µg m−3 year−1 with marginal significance (p=0.053). Overall trends for the Jingjinji and YRD regions were not significant during the latter half of the 11th FYP period. And PM2.5 concentrations in the PRD region had a big drop (−4.81 µg m−3 year−1, p<0.001). Results show that although air pollution control policies of the 11th FYP were not designed for PM2.5 prevention and control, they still had co-benefits on PM2.5 pollution control. There were two main reasons. First, SO2 is the precursor gas of sulfate. Previous studies have shown that sulfate was the major component of PM2.5 during the 11th FYP period (Li et al., 2009, 2010; Pathak et al., 2009). The reduction of SO2 could therefore contribute to the suppression of increasing PM2.5 pollution. Second, the control of industrial dust and soot, which include a portion of primary PM2.5 (Yao et al., 2009), also contributed to the PM2.5 pollution reduction.
4.4 Effect of air pollution control policies in the 12th Five-Year Plan period (2011–2015)
Figure 8a and b show that most of the areas of China show a significant decreasing trend during the 12th FYP period. PM2.5 concentrations of all of China, Jingjinji, and YRD dropped by 2.89, 3.63, and 3.33 µg m−3 year−1 (p<0.001). When considering the years from 2010 to 2013, although the overall trend of all of China was −1.03 µg m−3 year−1 (p<0.05, Table 2), the decreasing trend mainly happened in Xinjiang and central Inner Mongolia. The deserts in Xinjiang and Inner Mongolia are the major sources of dust pollution in China. A recent study showed that dust is the largest contributor to PM2.5 over this region (Philip et al., 2014). The change in natural dust in desert areas may be the major contributor to the decreasing trend of PM2.5 during 2010–2013. Most of the polluted area in China did not show obvious change (Fig. 8c and d). As we mentioned above, The ECER policy during the 12th FYP period was basically the extension of the policy in the 11th FYP, which mainly focused on emissions reduction. Due to the development of the social economy, the ECER policy has shown limitations in PM2.5 reduction. PM2.5 is a kind of composite pollutant and its constituents includes primary particles and secondary particles such as sulfate, nitrate, ammonium, organic carbon, elemental carbon, etc. With the deepening of SO2 and industrial dust and soot emission reduction, their contributions to PM2.5 pollution control would be reduced, although the 12th FYP on Environmental Protection also proposed a 10 % reduction of NOx from 2010 to 2015. However, along with economic growth in China, the benefits of emission control for a single pollutant could be offset by increased energy usage. Considering the complicated PM2.5 compositions, comprehensive and coordinated control measures for multiple pollutants are urgently needed.
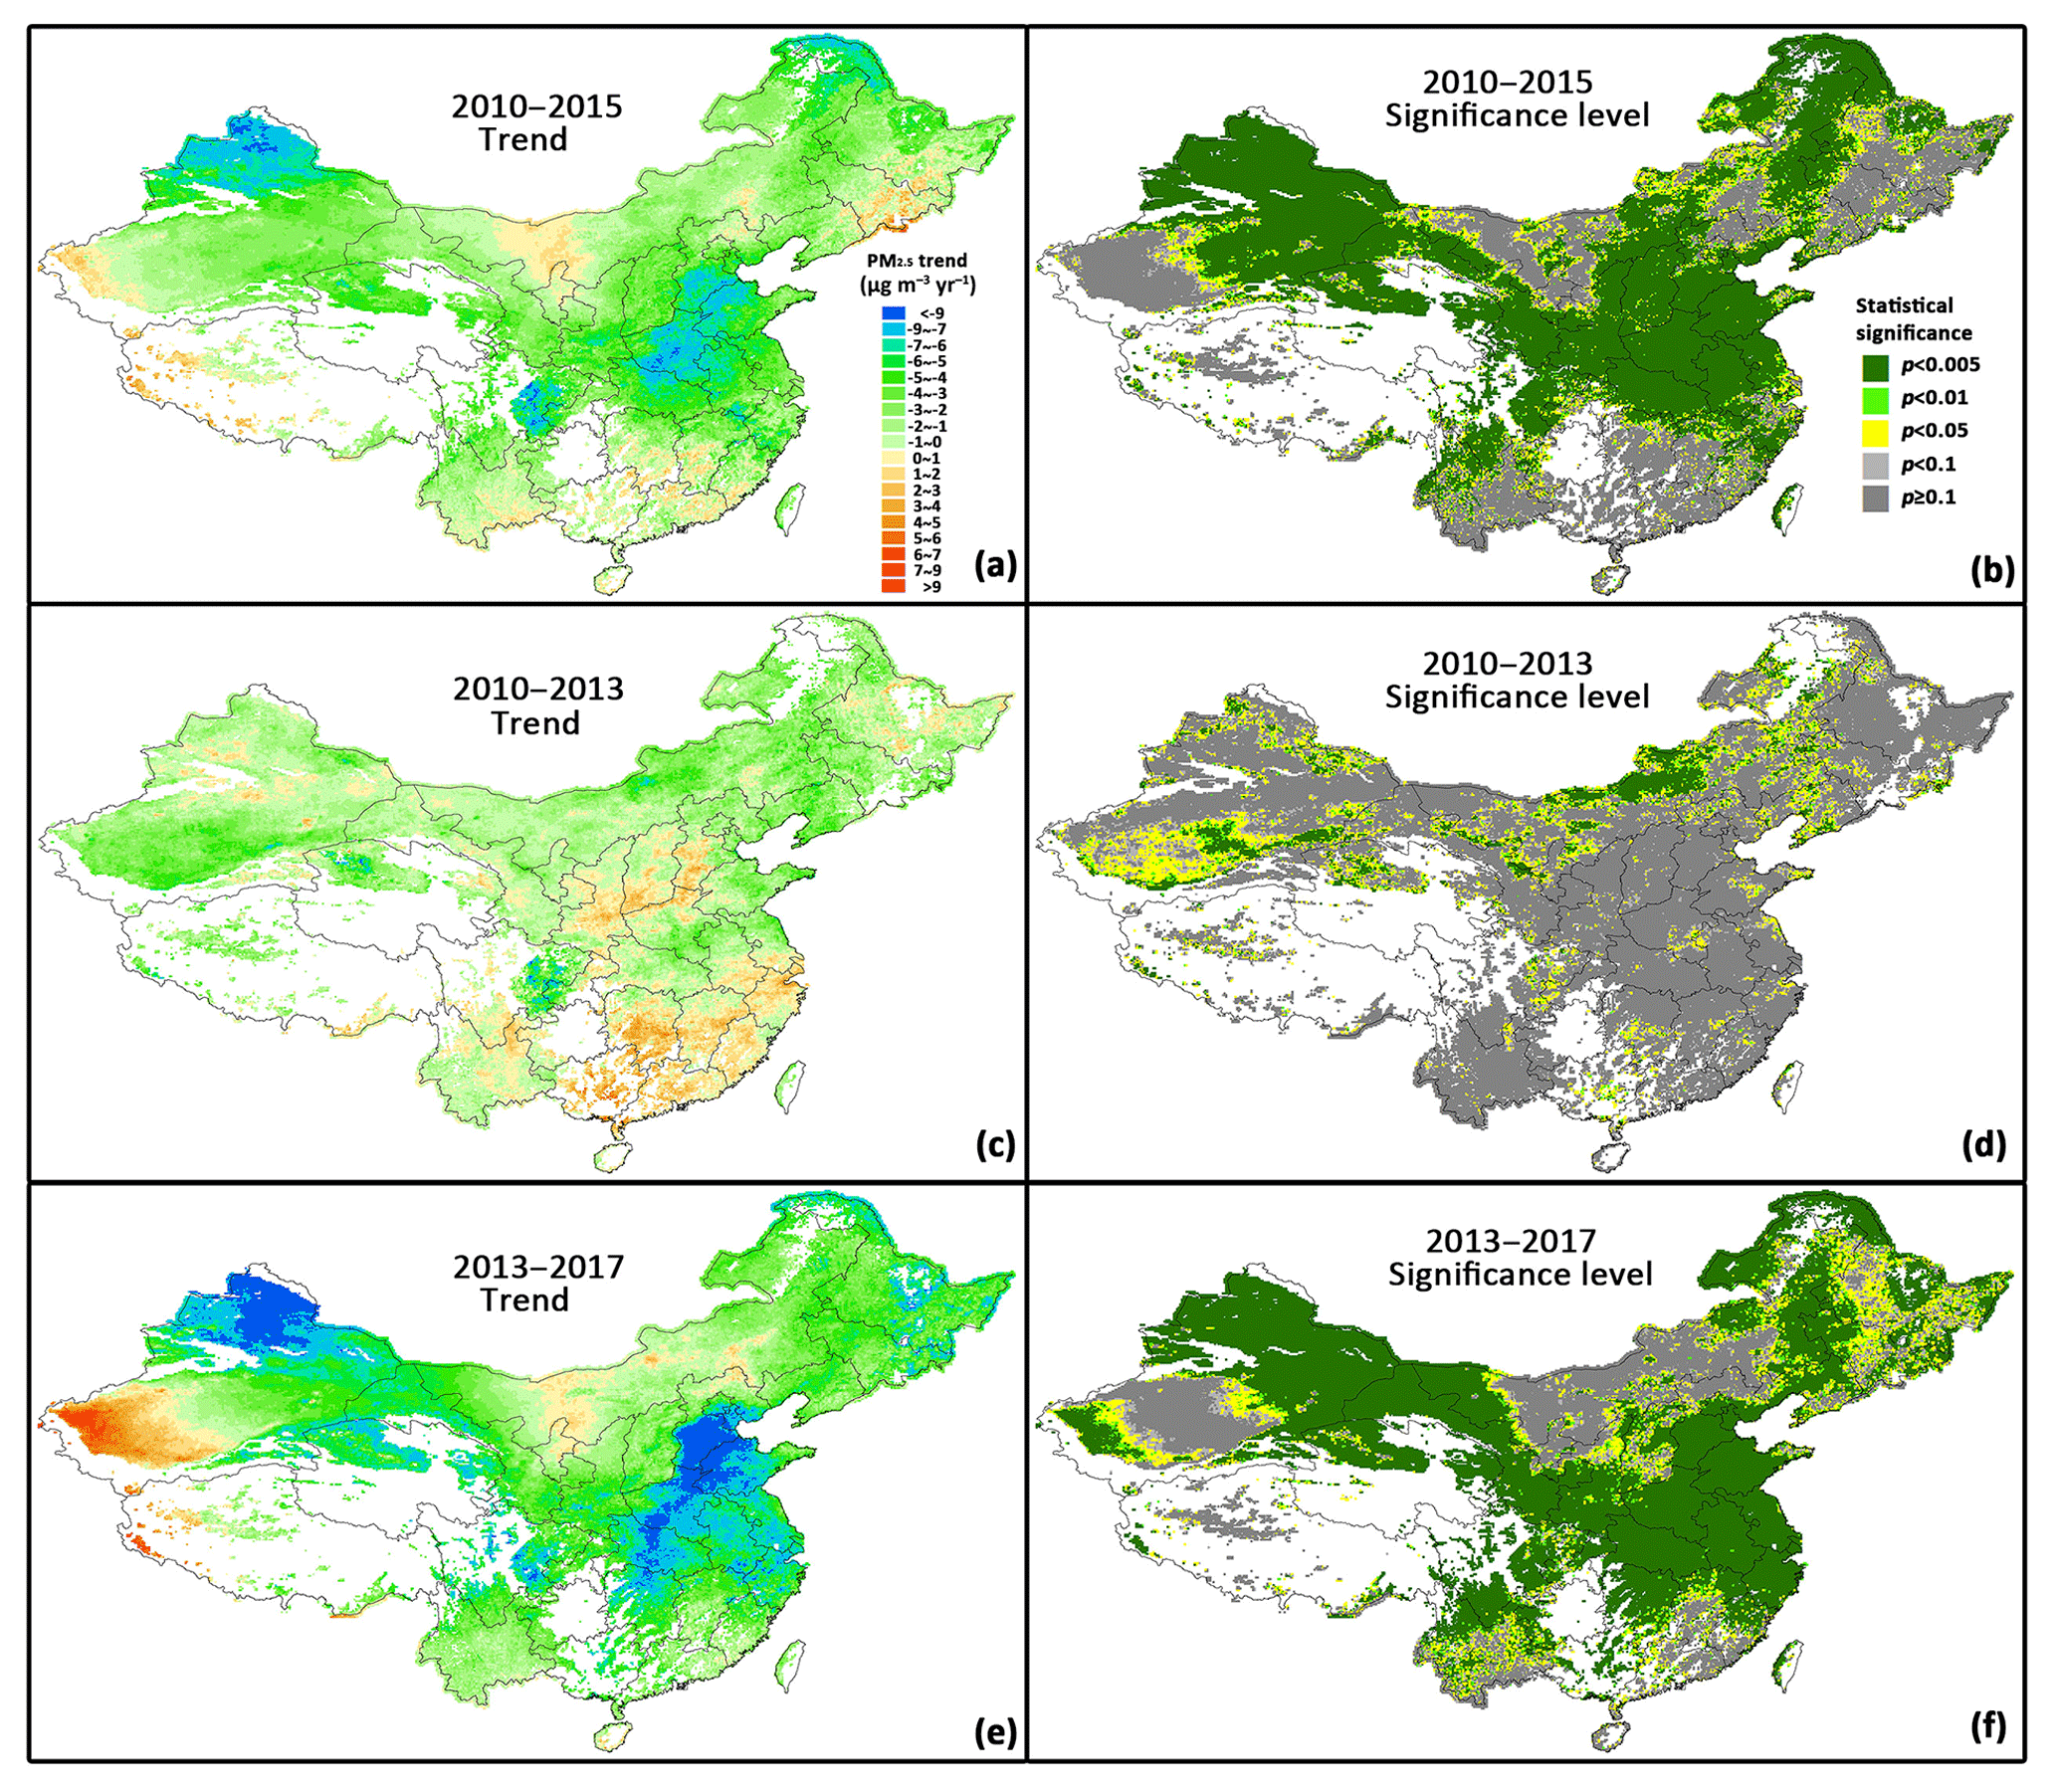
Figure 8Spatial distributions of PM2.5 trends and significance levels in China from 2010 to 2017.
Therefore, China issued the 12th FYP on APPC-KR in late 2012, which is the first special plan for air pollution prevention and control and focused on air quality improvement. APPC-KR proposed a series of key projects which included 477 SO2 treatment projects, 755 NOx treatment projects, 10 073 industrial soot and dust treatment projects, 1311 VOC treatment projects in key industrial sectors, 281 vapor recovery projects for oil and gas, 188 yellow-sticker vehicle elimination projects, 192 fugitive dust comprehensive treatment projects, and 122 capacity building projects. An English translation of APPC-KR and its key projects has been prepared by the Clean Air Alliance of China (CAAC) and can be found elsewhere (http://www.cleanairchina.org/product/6347.html, last access: 29 March 2019) (CAAC, 2013c, a).
In addition, in 2012, China issued a new air quality standard, i.e., the National Ambient Air Quality Standard of China (NAAQS) (GB 3095-2012). Compared with the former NAAQS (GB 3095-1996) issued in 1996, this new standard incorporated PM2.5 as a major control pollutant. According to GB 3095-2012, the Level 1 annual mean standard of PM2.5 is 15 µg m−3, which is assigned for protecting the air quality of natural reserves and scenic areas and is equivalent to the World Health Organization (WHO) Air Quality Interim Target-3 (IT-3). The Level 2 standard of 35 µg m−3 is designated for residential, cultural, industrial, and commercial areas, which is equivalent to WHO Air Quality Interim Target-1 (IT-1). Meanwhile, a comprehensive real-time air quality monitoring network covering 74 major Chinese cities was established in late 2012.
Table 3Goals and accomplishments for key regions of the 12th FYP on APPC-KR.

The implementation of APPC-KR, together with the implementation of APPC-AP starting from 2013 (shown in the following section), led to dramatic drops in PM2.5 concentrations in China after 2013. Table 3 shows PM2.5 concentration improvement goals and final accomplishments for key regions (see Fig. S1) of the 12th FYP on APPC-KR calculated from satellite PM2.5. Results show that all key regions accomplished the goals except for Yinchuan. The changes in population-weighted averages also show similar results. Overall, the 12th FYP on APPC-KR accomplished its air pollution control goals. And the decrease in PM2.5 concentrations was mainly attributable to the decrease after 2013.
4.5 Effect of Action Plan for Air Pollution Prevention and Control (2013–2017)
China issued the APPC-AP (2013–2017) in late 2013, which further strengthened the air pollution control measures and air quality improvement goals. The air pollution control measures included 10 categories:
-
increase effort for comprehensive pollution control, reduce emissions of multi-pollutants;
-
optimize industrial structure and promote industrial restructuring;
-
accelerate technology transformation and improve innovation capability;
-
adjust energy structure and increase clean energy supply;
-
strengthen environmental thresholds and optimize industrial layout;
-
promote the role of market mechanisms and improve environmental economic policies;
-
improve law and regulation system and carry on supervision and management based on law;
-
establish regional coordination mechanism and integrated regional environmental management;
-
establish monitoring and warning system and cope with heavy pollution episodes;
-
clarify responsibilities of government, enterprise, and society and mobilize public participation
Detailed measures of the APPC-AP can be found in English translation at http://www.cleanairchina.org/product/6349.html (last access: 29 March 2019) (CAAC, 2013b). To ensure that APPC-AP goals could be accomplished, China adopted a temporary measure in 2017, i.e., the intensified supervision for air pollution control in Jingjinji and the surrounding area (http://www.gov.cn/hudong/2017-07/14/content_5210588.htm, last access: 29 March 2019). There had been great achievements at the end of 2017. For example (Zheng et al., 2018), 71 % of the power plants met the ultralow emission levels; the average efficiency of coal-fired power units decreased from 321 g.c.e. kWh−1 in 2013 to 309 g.c.e. kWh−1 in 2017; non-methane volatile organic compound (NMVOC) emissions were cut down by 30 % through the implementation of a leak detection and repair (LDAR) program for the petrochemical industry; all coal boilers smaller than 7 MW in urban areas were shut down; and all “yellow label” vehicles (referring to gasoline and diesel vehicles that fail to meet Euro 1 and Euro 3 standards, respectively) were eliminated by the end of 2017, to name a few.
Table 4Goals and accomplishments of APPC-AP (2013–2017).
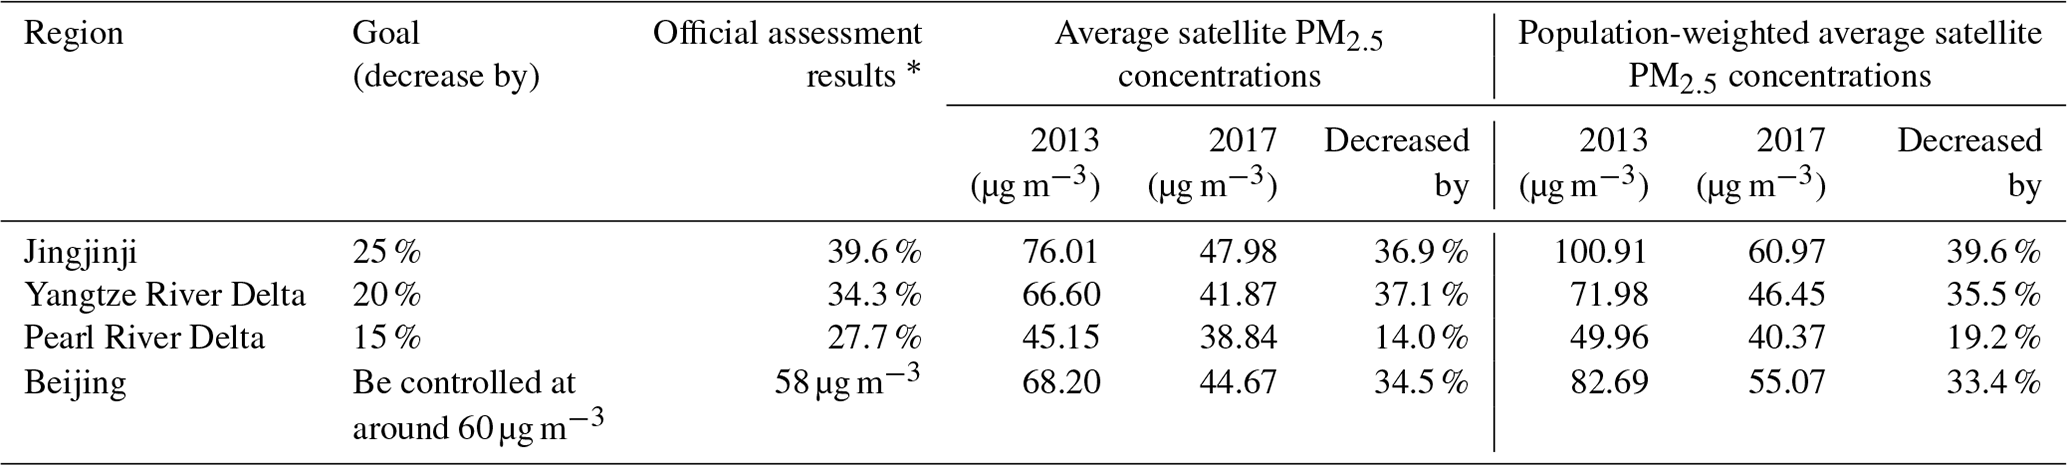
∗ See http://www.mee.gov.cn/gkml/sthjbgw/stbgth/201806/t20180601_442262.htm (last access: 29 March 2019).
The implementation of APPC-AP, together with the 12th FYP on APPC-KR, had led to a dramatic drop in PM2.5 concentrations from 2013 to 2017 (Fig. 8e and f). PM2.5 trends of 2013–2017 for all of China, Jingjinji, YRD, and PRD regions were −4.27, −6.77, −6.36, and −2.11 µg m−3 year−1 (all p<0.05), respectively (Table 2). This is comparable to a recent study (Silver et al., 2018), which found that the median trend in annual mean PM2.5 concentration across all ground air pollution monitoring stations is −3.4 µg m−3 year−1 from 2015 to 2017. Table 4 shows PM2.5 concentration improvement goals and final accomplishments for APPC-AP. The goals required that PM2.5 concentrations in Jingjinji, YRD, and PRD regions in 2017 should decrease by 25 %, 20 %, and 15 % compared to 2012, and the annual mean PM2.5 of Beijing should reach around 60 µg m−3. Since there were no ground measurements in 2012, the Ministry of Ecology and Environment (MEE) of China used 2013 as the base year to assess the performance of APPC-AP (http://www.mee.gov.cn/gkml/sthjbgw/stbgth/201806/t20180601_442262.htm, last access: 29 March 2019). To maintain consistency with the official performance assessment, we also used 2013 as the base year. Results show that the arithmetic average of satellite PM2.5 concentrations for Jingjinji, YRD, and PRD regions decreased by 36.9 %, 37.1 %, and 14.0 %, respectively, and annual mean PM2.5 of Beijing was 44.67 µg m−3 in 2017. From the view of satellite, Jingjinji, YRD, and Beijing accomplished their goals, and PRD was very close to the goal. However, the pollution level was still higher than WHO Air Quality IT-1 level and NAAQS (GB 3095-2012) Level 2 annual PM2.5 standards (both 35 µg m−3).
According to the official results of APPC-AP performance assessment (Table 4), PM2.5 of Jingjinji, YRD, and PRD regions decreased by 39.6 %, 34.3 %, and 27.7 %, respectively. And annual mean PM2.5 of Beijing was 58 µg m−3 in 2017. Compared to the arithmetic average satellite PM2.5, the populations weighted average results (Table 4) are closer to the official results. The main reason is that official performance assessment used ground measurements. However, the spatial distribution of ground monitors is uneven. Most of the sites are distributed in populated urban areas and only a few are located in rural areas. Compared to ground monitors, satellite remote sensing has more comprehensive spatial coverage. Figure S3 shows the spatial distribution of satellite and ground PM2.5 concentrations of 2017 in Beijing. It can be seen that the ground monitors are clustered in polluted urban centers. The cleaner north and northwest of Beijing have few sites. Thus the population-weighted results of satellite PM2.5 are closer to the official results, but still have differences. Since satellites have better spatial coverage than ground monitors, satellite PM2.5 can better represent the spatial variation of PM2.5 pollution. The population-weighted average satellite PM2.5 can better represent the health impact of PM2.5 pollution. When using ground monitors to calculate the regional mean concentrations, the weights of area and population for each site should be considered.
Xue et al. (2019) developed a machine learning method to estimate PM2.5 concentrations in China from 2000 to 2016. They reported that overall trends of PM2.5 in China were 2.097 µg m−3 year−1 (p<0.001), 0.299 µg m−3 year−1 (p>0.05), and −4.511 µg m−3 year−1 (p<0.001) in 2000–2007, 2008–2013, and 2013–2016, respectively. Lin et al. (2018) estimated high-resolution PM2.5 in annual scale in China from 2001 to 2015, and found national-scale trends of 0.04, −0.65, and −2.33 µg m−3 year−1 in 2001–2005, 2005–2010, and 2011–2015, respectively. Overall, our satellite-based PM2.5 trends are consistent with these two recent studies, except that we found no significant trend from 2005 to 2010 (0.41 µg m−3 year−1 but p>0.05), which is different from the study of Lin et al. (2018). The main reason could be that they did not include western China in their study area, and statistical significance levels were not reported in their study, which means that it is not known whether the trend was significant or not.
Although there have been several studies on the historical trends of PM2.5 in China, few have looked at the relations between the trends and air pollution control policies. This paper reviewed the air pollution control policies from 2005 to 2017. And for the first time we gave an overall evaluation of the effects of these policies on PM2.5 pollution improvement in China from the perspective of satellite remote sensing. Results show that our satellite PM2.5 dataset is a good source to evaluate the performance of air pollution policies. The trends of satellite-derived PM2.5 concentrations are consistent with the implementation of air pollution control policies in different periods.
The ECER policy implemented in the 11th FYP period (see Table 1 and Sect. 4.3) had co-benefits with PM2.5 pollution control. The overall PM2.5 pollution decreased to a certain extent (−0.56 µg m−3 year−1 for all of China, p=0.053) after 2007, but the effects were limited. The Environmental Protection Plan and ECER policy during the 12th FYP period were basically the extension of the 11th FYP policy, with additional total emission control on NOx. However, the total emission control oriented policy had shown its limitation. The PM2.5 concentrations of polluted areas did not decrease from 2010 to 2013 (e.g., −0.45 µg m−3 year−1 for the Jingjinji region, p=0.783).
To address the PM2.5 pollution issue, China implemented two strict policies: the 12th FYP on APPC-KR in 2012 and APPC-AP in 2013. The goal of air quality improvement was proposed for the first time. Besides, China incorporated PM2.5 as a major control pollutant into the National Ambient Air Quality Standard (GB 3095-2012). All these policies (details can be found in Table 1 and Sect. 4.4 and 4.5) led to dramatic decreases in PM2.5 after 2013 (−4.27 µg m−3 year−1 for all of China, p<0.001). And the implementation of these policies was also an important mark that environmental management in China began to change from total emission control oriented mode to environmental quality improvement oriented mode.
It should be noted that interannual variation in meteorology has also contributed to the changes in PM2.5. A recent study shows that meteorological conditions contributed approximately 20 % of the PM2.5 reduction in Beijing from 2013 to 2017, while the control of anthropogenic emissions contributed 80 % (Chen et al., 2019). In addition, the slowdown of economic development after the financial crisis in 2008 might contribute to the PM2.5 emissions reduction. According to the China Statistical Yearbook (NBS, 2018), the gross domestic product (GDP) growth rate decreased from 14.2 % in 2007 to 6.9 % in 2017. However, the GDP growth rates are still relatively high at the current stage (6 %–7 %). Contrarily, the PM2.5 concentrations have decreased dramatically. Without effective air pollution control policies, the PM2.5 pollution level would not decrease rapidly. Therefore, the effective air pollution control policy was the main reason for PM2.5 pollution reduction after 2013. Meteorological conditions also contributed a small portion of PM2.5 reductions.
The trends in PM2.5 concentrations in China also showed spatial heterogeneity. Multiple reasons may explain the regional differences, e.g., the pollution levels of base year, the regional differences of industrial structures, the spatial heterogeneity of anthropogenic and natural emissions, economic and industry development differences, variations of regional policies, and variations of meteorological conditions.
Currently, China has achieved great success in PM2.5 pollution control. However, PM2.5 concentrations in many areas are still much higher than the Level 2 annual PM2.5 standard of 35 µg m−3 of GB 3095-2012, which corresponds to WHO Air Quality IT-1. China has implemented a new air pollution control policy from 2018, i.e., the Three-year Action Plan to Win the Battle for Blue Skies (2018–2020). China's air quality is expected to be further improved in the next 3 years.
This study extended the satellite PM2.5 dataset in our previous study (Ma et al., 2016) to the year of 2017 and obtained longer time series of satellite PM2.5 data, which can provide more spatially resolved and highly accurate PM2.5 data for epidemiological, health impact assessment, and social economic impact studies in China.
The satellite-derived PM2.5 data used in this study can be requested from the corresponding author (jbi@nju.edu.cn).
The supplement related to this article is available online at: https://doi.org/10.5194/acp-19-6861-2019-supplement.
JB conceived and designed the study. RL collected and processed the data. ZM and YL performed statistical modeling for satellite PM2.5 predictions. ZM analyzed the spatiotemporal trends of PM2.5 concentrations. JB prepared and analyzed the air pollution control policies. ZM prepared the paper with contributions from all coauthors.
The authors declare that they have no conflict of interest.
This research has been supported by the National Natural Science Foundation of China (grant nos. 91644220, 71433007, and 41601546) and the Fundamental Research Funds for the Central Universities of China (grant no. 0211-14380078).
This paper was edited by Dominick Spracklen and reviewed by two anonymous referees.
Boys, B., Martin, R., van Donkelaar, A., MacDonell, R., Hsu, C., Cooper, M., Yantosca, R., Lu, Z., Streets, D. G., Zhang, Q., and Wang, S.: Fifteen-year global time series of satellite-derived fine particulate matter, Environ. Sci. Technol., 48, 11109–11118, 2014.
CAAC: Key Projects of “Twelfth Five-Year Plan” on Air Pollution Prevention and Control in Key Regions-Sample English Translation, Clean Air Alliance of China, available at: http://www.cleanairchina.org/product/6347.html (last access: 29 March 2019), 2013a.
CAAC: English Translation of Air Pollution Prevention and Control Action Plan, Clean Air Alliance of China, available at: http://www.cleanairchina.org/product/6349.html (last access: 29 March 2019), 2013b.
CAAC: English Translation of “Twelfth Five-Year Plan” on Air Pollution Prevention and Control in Key Regions, Clean Air Alliance of China, available at: http://www.cleanairchina.org/product/6347.html (last access: 29 March 2019), 2013c.
Chen, B., Kan, H., Chen, R., Jiang, S., and Hong, C.: Air pollution and health studies in China–policy implications, J. Air Waste Manage., 61, 1292–1299, 2011.
Chen, S. and Jin, H.: Pricing for the clean air: Evidence from Chinese housing market, J. Clean. Prod., 206, 297–306, 2019.
Chen, Z., Chen, D., Kwan, M., Chen, B., Cheng, N., Gao, B., Zhuang, Y., Li, R., and Xu, B.: The control of anthropogenic emissions contributed to 80 % of the decrease in PM2.5 concentrations in Beijing from 2013 to 2017, Atmos. Chem. Phys. Discuss., https://doi.org/10.5194/acp-2018-1112, in review, 2019.
Crouse, D. L., Peters, P. A., van Donkelaar, A., Goldberg, M. S., Villeneuve, P. J., Brion, O., Khan, S., Atari, D. O., Jerrett, M., and Pope, C.: Risk of nonaccidental and cardiovascular mortality in relation to long-term exposure to low concentrations of fine particulate matter: a Canadian national-level cohort study, Environ. Health Perspect., 120, 708–714, 2012.
Dominici, F., Peng, R. D., Bell, M. L., Pham, L., McDermott, A., Zeger, S. L., and Samet, J. M.: Fine particulate air pollution and hospital admission for cardiovascular and respiratory diseases, JAMA-J. Am. Med. Assoc., 295, 1127–1134, 2006.
Geng, G., Zhang, Q., Martin, R. V., van Donkelaar, A., Huo, H., Che, H., Lin, J., and He, K.: Estimating long-term PM2.5 concentrations in China using satellite-based aerosol optical depth and a chemical transport model, Remote Sens. Environ., 166, 262–270, 2015.
Hoff, R. M. and Christopher, S. A.: Remote sensing of particulate pollution from space: have we reached the promised land?, J. Air Waste Manage., 59, 645–675, 2009.
Hsu, N. C., Gautam, R., Sayer, A. M., Bettenhausen, C., Li, C., Jeong, M. J., Tsay, S.-C., and Holben, B. N.: Global and regional trends of aerosol optical depth over land and ocean using SeaWiFS measurements from 1997 to 2010, Atmos. Chem. Phys., 12, 8037–8053, https://doi.org/10.5194/acp-12-8037-2012, 2012.
Hu, H., Yang, Q., Lu, X., Wang, W., Wang, S., and Fan, M.: Air Pollution and Control in Different Areas of China, Crit. Rev. Env. Sci. Tec., 40, 452–518, 2010.
Hu, X., Waller, L. A., Lyapustin, A., Wang, Y., and Liu, Y.: 10-year spatial and temporal trends of PM2.5 concentrations in the southeastern US estimated using high-resolution satellite data, Atmos. Chem. Phys., 14, 6301–6314, https://doi.org/10.5194/acp-14-6301-2014, 2014.
Huang, K., Xiao, Q., Meng, X., Geng, G., Wang, Y., Lyapustin, A., Gu, D., and Liu, Y.: Predicting monthly high-resolution PM2.5 concentrations with random forest model in the North China Plain, Environ. Pollut., 242, 675–683, 2018.
Itahashi, S., Uno, I., Yumimoto, K., Irie, H., Osada, K., Ogata, K., Fukushima, H., Wang, Z., and Ohara, T.: Interannual variation in the fine-mode MODIS aerosol optical depth and its relationship to the changes in sulfur dioxide emissions in China between 2000 and 2010, Atmos. Chem. Phys., 12, 2631–2640, https://doi.org/10.5194/acp-12-2631-2012, 2012.
Jin, Y., Andersson, H., and Zhang, S.: Air pollution control policies in China: a retrospective and prospects, Int. J. Environ. Res. Public Health, 13, 1219, https://doi.org/10.3390/ijerph13121219, 2016.
Kloog, I., Koutrakis, P., Coull, B. A., Lee, H. J., and Schwartz, J.: Assessing temporally and spatially resolved PM2.5 exposures for epidemiological studies using satellite aerosol optical depth measurements, Atmos. Environ., 45, 6267–6275, 2011.
Kloog, I., Nordio, F., Coull, B. A., and Schwartz, J.: Incorporating local land use regression and satellite aerosol optical depth in a hybrid model of spatiotemporal PM2.5 exposures in the Mid-Atlantic states, Environ. Sci. Technol., 46, 11913–11921, 2012.
Krotkov, N. A., McLinden, C. A., Li, C., Lamsal, L. N., Celarier, E. A., Marchenko, S. V., Swartz, W. H., Bucsela, E. J., Joiner, J., Duncan, B. N., Boersma, K. F., Veefkind, J. P., Levelt, P. F., Fioletov, V. E., Dickerson, R. R., He, H., Lu, Z., and Streets, D. G.: Aura OMI observations of regional SO2 and NO2 pollution changes from 2005 to 2015, Atmos. Chem. Phys., 16, 4605–4629, https://doi.org/10.5194/acp-16-4605-2016, 2016.
Li, L., Wang, W., Feng, J., Zhang, D., Li, H., Gu, Z., Wang, B., Sheng, G., and Fu, J.: Composition, source, mass closure of PM2.5 aerosols for four forests in eastern China, J. Environ. Sci., 22, 405–412, 2010.
Li, W., Bai, Z., Liu, A., Chen, J., and Chen, L.: Characteristics of Major PM2.5 Components during Winter in Tianjin, China, Aerosol Air Qual. Res., 9, 105–119, 2009.
Lin, C., Liu, G., Lau, A. K. H., Li, Y., Li, C. C., Fung, J. C. H., and Lao, X. Q.: High-resolution satellite remote sensing of provincial PM2.5 trends in China from 2001 to 2015, Atmos. Environ., 180, 110–116, 2018.
Liu, C., Yang, C., Zhao, Y., Ma, Z., Bi, J., Liu, Y., Meng, X., Wang, Y., Cai, J., and Kan, H.: Associations between long-term exposure to ambient particulate air pollution and type 2 diabetes prevalence, blood glucose and glycosylated hemoglobin levels in China, Environ. Int., 92, 416–421, 2016a.
Liu, J., Li, W., and Li, J.: Quality screening for air quality monitoring data in China, Environ. Pollut., 216, 720–723, 2016b.
Liu, M., Bi, J., and Ma, Z.: Visibility-based PM2.5 concentrations in China: 1957–1964 and 1973–2014, Environ. Sci. Technol., 51, 13161–13169, 2017a.
Liu, M., Huang, Y., Ma, Z., Jin, Z., Liu, X., Wang, H., Liu, Y., Wang, J., Jantunen, M., Bi, J., and Kinney, P. L.: Spatial and temporal trends in the mortality burden of air pollution in China: 2004–2012, Environ. Int., 98, 75–81, 2017b.
Liu, Y.: New Directions: Satellite driven PM2.5 exposure models to support targeted particle pollution health effects research, Atmos. Environ., 68, 52–53, 2013.
Liu, Y.: Monitoring PM2.5 from space for health: past, present, and future directions, Environ. Manager., 2, 6–10, 2014.
Ma, Z., Hu, X., Sayer, A. M., Levy, R., Zhang, Q., Xue, Y., Tong, S., Bi, J., Huang, L., and Liu, Y.: Satellite-Based Spatiotemporal Trends in PM2.5 Concentrations: China, 2004–2013, Environ. Health Perspect., 124 184–192, 2016.
Miyazaki, K., Eskes, H., Sudo, K., Boersma, K. F., Bowman, K., and Kanaya, Y.: Decadal changes in global surface NOx emissions from multi-constituent satellite data assimilation, Atmos. Chem. Phys., 17, 807–837, https://doi.org/10.5194/acp-17-807-2017, 2017.
NBS: China Statistical Yearbook, National Bureau of Statistics of China, available at: http://www.stats.gov.cn/tjsj/ndsj/ (last access: 29 March 2019), 2018.
Pathak, R. K., Wu, W. S., and Wang, T.: Summertime PM2.5 ionic species in four major cities of China: nitrate formation in an ammonia-deficient atmosphere, Atmos. Chem. Phys., 9, 1711–1722, https://doi.org/10.5194/acp-9-1711-2009, 2009.
Philip, S., Martin, R. V., van Donkelaar, A., Lo, J. W.-H., Wang, Y., Chen, D., Zhang, L., Kasibhatla, P. S., Wang, S., Zhang, Q., Lu, Z., Streets, D. G., Bittman, S., and Macdonald, D. J.: Global Chemical Composition of Ambient Fine Particulate Matter for Exposure Assessment, Environ. Sci. Technol., 48, 13060–13068, 2014.
Pope, C. A., Burnett, R. T., Thun, M. J., Calle, E. E., Krewski, D., Ito, K., and Thurston, G. D.: Lung cancer, cardiopulmonary mortality, and long-term exposure to fine particulate air pollution, JAMA-J. Am. Med. Assoc., 287, 1132–1141, 2002.
Rohde, R. A. and Muller, R. A.: Air Pollution in China: Mapping of Concentrations and Sources, PLoS One, 10, e0135749, https://doi.org/10.1371/journal.pone.0135749, 2015.
Schreifels, J. J., Fu, Y., and Wilson, E. J.: Sulfur dioxide control in China: policy evolution during the 10th and 11th Five-year Plans and lessons for the future, Energ. Policy, 48, 779–789, 2012.
Silver, B., Reddington, C. L., Arnold, S. R., and Spracklen, D. V.: Substantial changes in air pollution across China during 2015–2017, Environ. Res. Lett., 13, 114012, https://doi.org/10.1088/1748-9326/aae718, 2018.
van Donkelaar, A., Martin, R. V., Brauer, M., and Boys, B. L.: Use of satellite observations for long-term exposure assessment of global concentrations of fine particulate matter, Environ. Health Perspect., 123, 135–143, 2015.
van Donkelaar, A., Martin, R. V., Brauer, M., Hsu, N. C., Kahn, R. A., Levy, R. C., Lyapustin, A., Sayer, A. M., and Winker, D. M.: Global Estimates of Fine Particulate Matter using a Combined Geophysical-Statistical Method with Information from Satellites, Models, and Monitors, Environ. Sci. Technol., 50, 3762–3772, 2016.
Wang, C., Xu, J., Yang, L., Xu, Y., Zhang, X., Bai, C., Kang, J., Ran, P., Shen, H., and Wen, F.: Prevalence and risk factors of chronic obstructive pulmonary disease in China (the China Pulmonary Health [CPH] study): a national cross-sectional study, The Lancet, 391, 1706–1717, 2018a.
Wang, Q., Wang, J., He, M. Z., Kinney, P. L., and Li, T.: A county-level estimate of PM2.5 related chronic mortality risk in China based on multi-model exposure data, Environ. Int., 110, 105–112, 2018b.
Weatherhead, E. C., Reinsel, G. C., Tiao, G. C., Meng, X. L., Choi, D., Cheang, W. K., Keller, T., DeLuisi, J., Wuebbles, D. J., and Kerr, J. B.: Factors affecting the detection of trends: Statistical considerations and applications to environmental data, J. Geophys. Res.-Atmos., 103, 17149–17161, 1998.
Xiao, Q., Chang, H. H., Geng, G., and Liu, Y.: An ensemble machine-learning model to predict historical PM2.5 concentrations in China from satellite data, Environ. Sci. Technol., 52, 13260–13269, 2018.
Xue, B., Mitchell, B., Geng, Y., Ren, W., Müller, K., Ma, Z., Puppim de Oliveira, J. A., Fujita, T., and Tobias, M.: A review on China's pollutant emissions reduction assessment, Ecol. Indic., 38, 272–278, 2014.
Xue, T., Zheng, Y., Tong, D., Zheng, B., Li, X., Zhu, T., and Zhang, Q.: Spatiotemporal continuous estimates of PM2.5 concentrations in China, 2000–2016: A machine learning method with inputs from satellites, chemical transport model, and ground observations, Environ. Int., 123, 345–357, 2019.
Yang, J. and Zhang, B.: Air pollution and healthcare expenditure: Implication for the benefit of air pollution control in China, Environ. Int., 120, 443–455, 2018.
Yao, Q., Li, S. Q., Xu, H. W., Zhuo, J. K., and Song, Q.: Studies on formation and control of combustion particulate matter in China: A review, Energy, 34, 1296–1309, 2009.
Zhang, J. and Reid, J. S.: A decadal regional and global trend analysis of the aerosol optical depth using a data-assimilation grade over-water MODIS and Level 2 MISR aerosol products, Atmos. Chem. Phys., 10, 10949–10963, https://doi.org/10.5194/acp-10-10949-2010, 2010.
Zheng, B., Tong, D., Li, M., Liu, F., Hong, C., Geng, G., Li, H., Li, X., Peng, L., Qi, J., Yan, L., Zhang, Y., Zhao, H., Zheng, Y., He, K., and Zhang, Q.: Trends in China's anthropogenic emissions since 2010 as the consequence of clean air actions, Atmos. Chem. Phys., 18, 14095–14111, https://doi.org/10.5194/acp-18-14095-2018, 2018.
Zheng, Y., Zhang, Q., Liu, Y., Geng, G., and He, K.: Estimating ground-level PM2.5 concentrations over three megalopolises in China using satellite-derived aerosol optical depth measurements, Atmos. Environ., 124, 232–242, 2016.
Zhou, K., Yang, S., Shen, C., Ding, S., and Sun, C.: Energy conservation and emission reduction of China's electric power industry, Renew. Sust. Energ. Rev., 45, 10–19, 2015.