the Creative Commons Attribution 4.0 License.
the Creative Commons Attribution 4.0 License.
 | 15 May 2019
A 10-year characterization of the Saharan Air Layer lidar ratio in the subtropical North Atlantic
Alberto Berjón
Africa Barreto
Yballa Hernández
Margarita Yela
Carlos Toledano
Particle extinction-to-backscatter ratio (lidar ratio) is a key parameter for a correct interpretation of elastic lidar measurements. Of particular importance is the determination of the lidar ratio of the Saharan Air Layer mineral dust transported into the free troposphere over the North Atlantic region. The location of the two sun photometer stations managed by the Izaña Atmospheric Research Centre (IARC) on the island of Tenerife and a decade of available micropulse lidar (MPL) data allow us to determine the lidar ratio under almost pure-dust conditions. This result can be considered representative of the Saharan dust transported westward over the North Atlantic in the subtropical belt.
Three different methods have been used to calculate the lidar ratio in this work: (1) using the inversion of sky radiance measurements from a sun–sky photometer installed at the Izaña Observatory (2373 m a.s.l.) under free-troposphere conditions; (2) the one-layer method, a joint determination using a micropulse lidar sited at the Santa Cruz de Tenerife sea-level station and photometric information considering one layer of aerosol characterized by a single lidar ratio; and (3) the two-layer method, a joint determination using the micropulse lidar and photometric information considering two layers of aerosol with two different lidar ratios. The one-layer method only uses data from a co-located photometer at Santa Cruz de Tenerife, while the two-layer conceptual approach incorporates photometric information at two heights from the observatories of Izaña and Santa Cruz de Tenerife. The almost pure-dust lidar ratio retrieval from the sun–sky photometer and from the two-layer method give similar results, with lidar ratios at 523 nm of 49 ± 6 and 50 ± 11 sr. These values obtained from a decade of data records are coincident with other studies in the literature reporting campaigns in the subtropical North Atlantic region. This result shows that the two-layer method is an improved conceptual approach compared to the single-layer approach, which matches the real lower-troposphere structure well. The two-layer method is able to retrieve reliable lidar ratios and therefore aerosol extinction profiles despite the inherent limitations of the elastic lidar technique.
We found a lack of correlation between lidar ratio and Ångström exponent (α), which indicates that the dust lidar ratio can be considered independent of dust size distribution in this region. This finding suggests that dust is, under most atmospheric conditions, the predominant aerosol in the North Atlantic free troposphere, which is in agreement with previous studies conducted at the Izaña Observatory.


Lidars are the most widely used systems for continuous monitoring of the vertical structure of atmospheric aerosols. The majority of the ground-based lidars used worldwide for aerosol monitoring are elastic backscatter lidars (Kovalev and Eichinger, 2005; Müller et al., 2007; Rocadenbosch et al., 2010; Mona et al., 2012). The main advantage of these systems is that they are relatively simple and low cost in comparison to other more complex systems, like the Raman lidars. However, the ratio between the aerosol extinction (σaer) and backscattering (βaer) coefficients should be considered constant throughout the atmospheric column in order to be able to estimate both magnitudes (Klett, 1985; Fernald, 1984). This ratio is known as the aerosol extinction-to-backscatter ratio or lidar ratio, . The lidar ratio is an intensive parameter characteristic of the type of aerosol present in the atmosphere and depends on the microphysical aerosol properties, such as the refractive index and size distribution but not on the aerosol load (Evans, 1988; Mona et al., 2006). This parameter is also required to convert the particle backscatter profiles into particle extinction profiles, and therefore it is essential for estimating the aerosol radiative effect.
The uncertainty of the lidar ratio retrieval determines the accuracy of the retrieved extinction and backscattering profiles. Typical relative errors in the retrieved backscatter and extinction profiles of 10 % and 20 % are assumed for the combined elastic lidar–photometer technique, which is low enough for climate impact studies (Bösenberg and Hoff, 2007). However, these errors have been estimated without considering overlap. Typical MPL overlap distances are between 5 and 6 km (Welton and Campbell, 2002) and overlap uncertainties ranges from 3 % in the short range to 4 % at 3 km. Also, the presence of different aerosol layering may affect the final uncertainty. As Pelón et al. (2002), Ansmann (2006), Ansmann et al. (2013) and Müller et al. (2007) have pointed out, considerably higher errors may be expected in the case of complex aerosol distributions such as different aerosol layer in the vertical, horizontal inhomogeneous aerosol layers or even in case of well-mixed layers because of the effect of the relative humidity, which may produce a change in size distributions and refractive indices (Ackermann, 1998). Many authors have shown that significant errors in the aerosol extinction profile may appear in the case of an inaccurate assumption of the aerosol extinction-to-backscatter ratio, which is more evident as the atmosphere becomes more inhomogeneous (e.g. Kovalev, 1995; Barnaba and Gobbi, 2001; Pelón et al., 2002; Ansmann, 2006). It typically occurs in the lower atmosphere (Barnaba and Gobbi, 2001), and more precisely within the planetary boundary layer (PBL), where the atmospheric aerosol properties are range-dependent (Ackermann, 1998), or in the presence of atmospheric layering such as the Sahara air layer (SAL) (Prospero and Carlson, 1972). Following these authors, it is necessary to change the conventional approach of a single aerosol layer with a constant lidar ratio value as input.
One of the areas in which the lidar ratio has a more relevant role is satellite remote sensing. NASA's CALIOP (Cloud-Aerosol LIdar with Orthogonal Polarization), launched in April 2006, provides a global coverage of cloud and aerosol profiles using a three-channel elastic backscatter lidar. This system needs an assumption about the lidar ratio to retrieve the extinction coefficient, which is done by means of an automated aerosol classification algorithm. The selection of the lidar ratio is one of the largest sources of uncertainty in the CALIOP retrievals (Young et al., 2013). CALIOP data processing V4, released in 2016, contain a reassessment of the lidar ratio assigned to each aerosol type (Kim et al., 2018). The CALIOP lidar ratio for mineral dust at 532 nm in this new version has been increased from 40±20 to 44±9 sr. An even higher lidar ratio, 58 sr, has been proposed for the retrieval of CALIOP by Amiridis et al. (2013).
Given that desert dust is one of the most prominent and widespread atmospheric aerosols, there are a number of publications concerning the reliable determination of mineral dust optical properties with the Saharan Mineral Dust Experiment (SAMUM) field campaign as the most comprehensive dust closure experiment in pure dust (Heintzenberg, 2009; Tesche et al., 2009; Wiegner et al., 2009; Ansmann et al., 2011, among others). However, there is little consensus about which lidar ratio is more appropriate for this aerosol type. Groß et al. (2013) performed a comprehensive analysis on the different lidar ratios reported in prior studies for pure desert Saharan dust. They found very different values, ranging between 40 and 70 sr and set a value of 48±5 sr by means of airborne lidar observations. This variability may be due to different physical properties of the mineral dust for different regions (Papayannis et al., 2008) and to the inevitable mix of aerosols of different natures present in different layers, although it may also be due to the different techniques used to obtain this parameter. These results are in agreement with other authors who proposed lidar ratios from about 40 sr (Omar et al., 2009) up to around 59 sr (Müller et al., 2007; Amiridis et al., 2013).
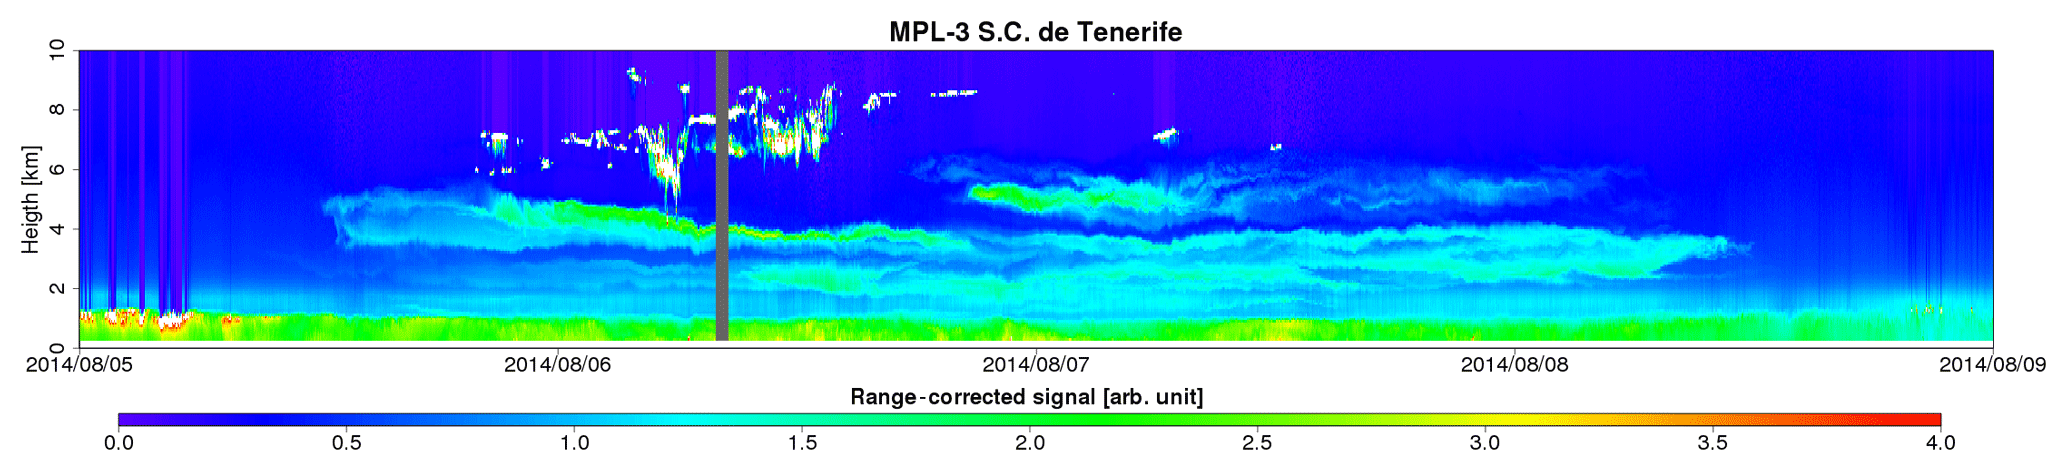
Figure 1Range-corrected signal mapping of a dust intrusion over the island of Tenerife on August 2014. In this case, the dust layer is well separated from the marine layer.
In this work, we present a lidar ratio assessment for mineral dust aerosol obtained from 10 years of lidar and photometric measurements made on the island of Tenerife, which is strongly influenced by the SAL, especially in summer at higher altitudes. The SAL has been extensively described as a well-mixed layer with a fairly constant potential temperature, vapour mixing ratio and dust particles concentration with height (Prospero and Carlson, 1980; Prospero, 1996; Karyampudi et al., 1999). Possible mixing and ageing processes are not expected to be relevant near the dust source in the free troposphere, as is the case of Tenerife, where mineral dust can be anticipated to be the dominant aerosol. Three different techniques have been used to obtain the lidar ratio of mineral dust. Firstly, it has been determined using the inversion retrievals of sky radiance measurements taken by a sun–sky photometer placed at a high-mountain station: the single-scattering albedo and the particle phase function at 180∘ (Müller et al., 2007). Secondly, the lidar ratio is determined by the classical Fernald–Klett method (Fernald, 1984; Klett, 1985). Finally, the Fernald–Klett method extends when considering two different aerosol layers. We will refer to the inversion using aerosol optical depth (AOD) measurements in a single layer (the surface layer) (Marenco et al., 1997; Takamura et al., 1994; Landulfo et al., 2008; Kovalev and Eichinger, 2005) as the one-layer method and to the use of AOD measurements in two atmospheric layers as the two-layer method. In the latter methodology we include measurements at sea level and at a high mountain site (2373 m a.s.l), taking advantage of the singular orographic characteristics of Tenerife. While the lower layer is typically affected by two types of aerosol (mix of marine aerosols and dust), the higher layer is periodically affected by Saharan desert dust outbreaks (Cuevas et al., 2015a, 2017a) and the predominance of almost pure-desert-dust conditions can be anticipated at these levels. In our case, the one-layer method leads to an average Saer that will be closer to values characteristic of a mixture of marine and dust aerosols; meanwhile the two-layer method provides an average Saer typical of almost pure dust.
So far, no systematic long-term study of elastic lidar data considering two layers has been reported. Only Cordoba-Jabonero et al. (2014) analysed 1 year, 2009, of the lidar data presented in this work with a different methodology.
The paper is structured as follows. Site description is done in Sect. 2, while the instruments used in this study are described in Sect. 3. A description of the aerosol in the study region is provided in Sect. 4. The lidar ratio calculation from sun–sky photometer measurements, and from the one- and the two-layer methods are explained in Sect. 5. An assessment of the lidar ratio obtained for mineral dust using the different methodologies is presented in Sect. 6, which also includes an assessment on the impact of considering a range-independent lidar ratio in the inversion method and an analysis of the lidar ratio dependence with particle size. Finally, the main conclusions of this study are given in Sect. 7.
The Canary Islands' weather is heavily influenced by the north-east trade winds and the Azores High, which are primarily responsible for the existence of a near-permanent temperature inversion over the area (Alonso-Pérez et al., 2011; Carrillo et al., 2016) at a height generally between 800 and 1500 m a.s.l. (Carrillo et al., 2016; Martín et al., 2012). This temperature inversion caps a wet and relatively cold marine boundary layer (MBL) in which the marine aerosol dominates. Above the temperature inversion, the air mass is generally representative of free-troposphere (FT) conditions, with very low particle concentrations during most of the year.
Due to its proximity to the African continent, this area is occasionally affected by the SAL, especially during the summer months, with dust-laden air mass intrusions (Cuevas et al., 2013; Rodríguez et al., 2015). The SAL is considered a relatively dry, warm and well-mixed layer characterized by a relative diurnal stability of Saharan dust optical properties (Prospero and Carlson, 1980; Prospero, 1996; Karyampudi et al., 1999). Smirnov et al. (1998) and Barreto et al. (2014) reported high-AOD stability conditions during dust outbreaks at Izaña Observatory. SAL intrusions over Tenerife can affect the FT, the MBL or both. Figure 1 shows an example of an SAL intrusion over the island of Tenerife on August 2014, where the dust layer is well separated from the MBL.
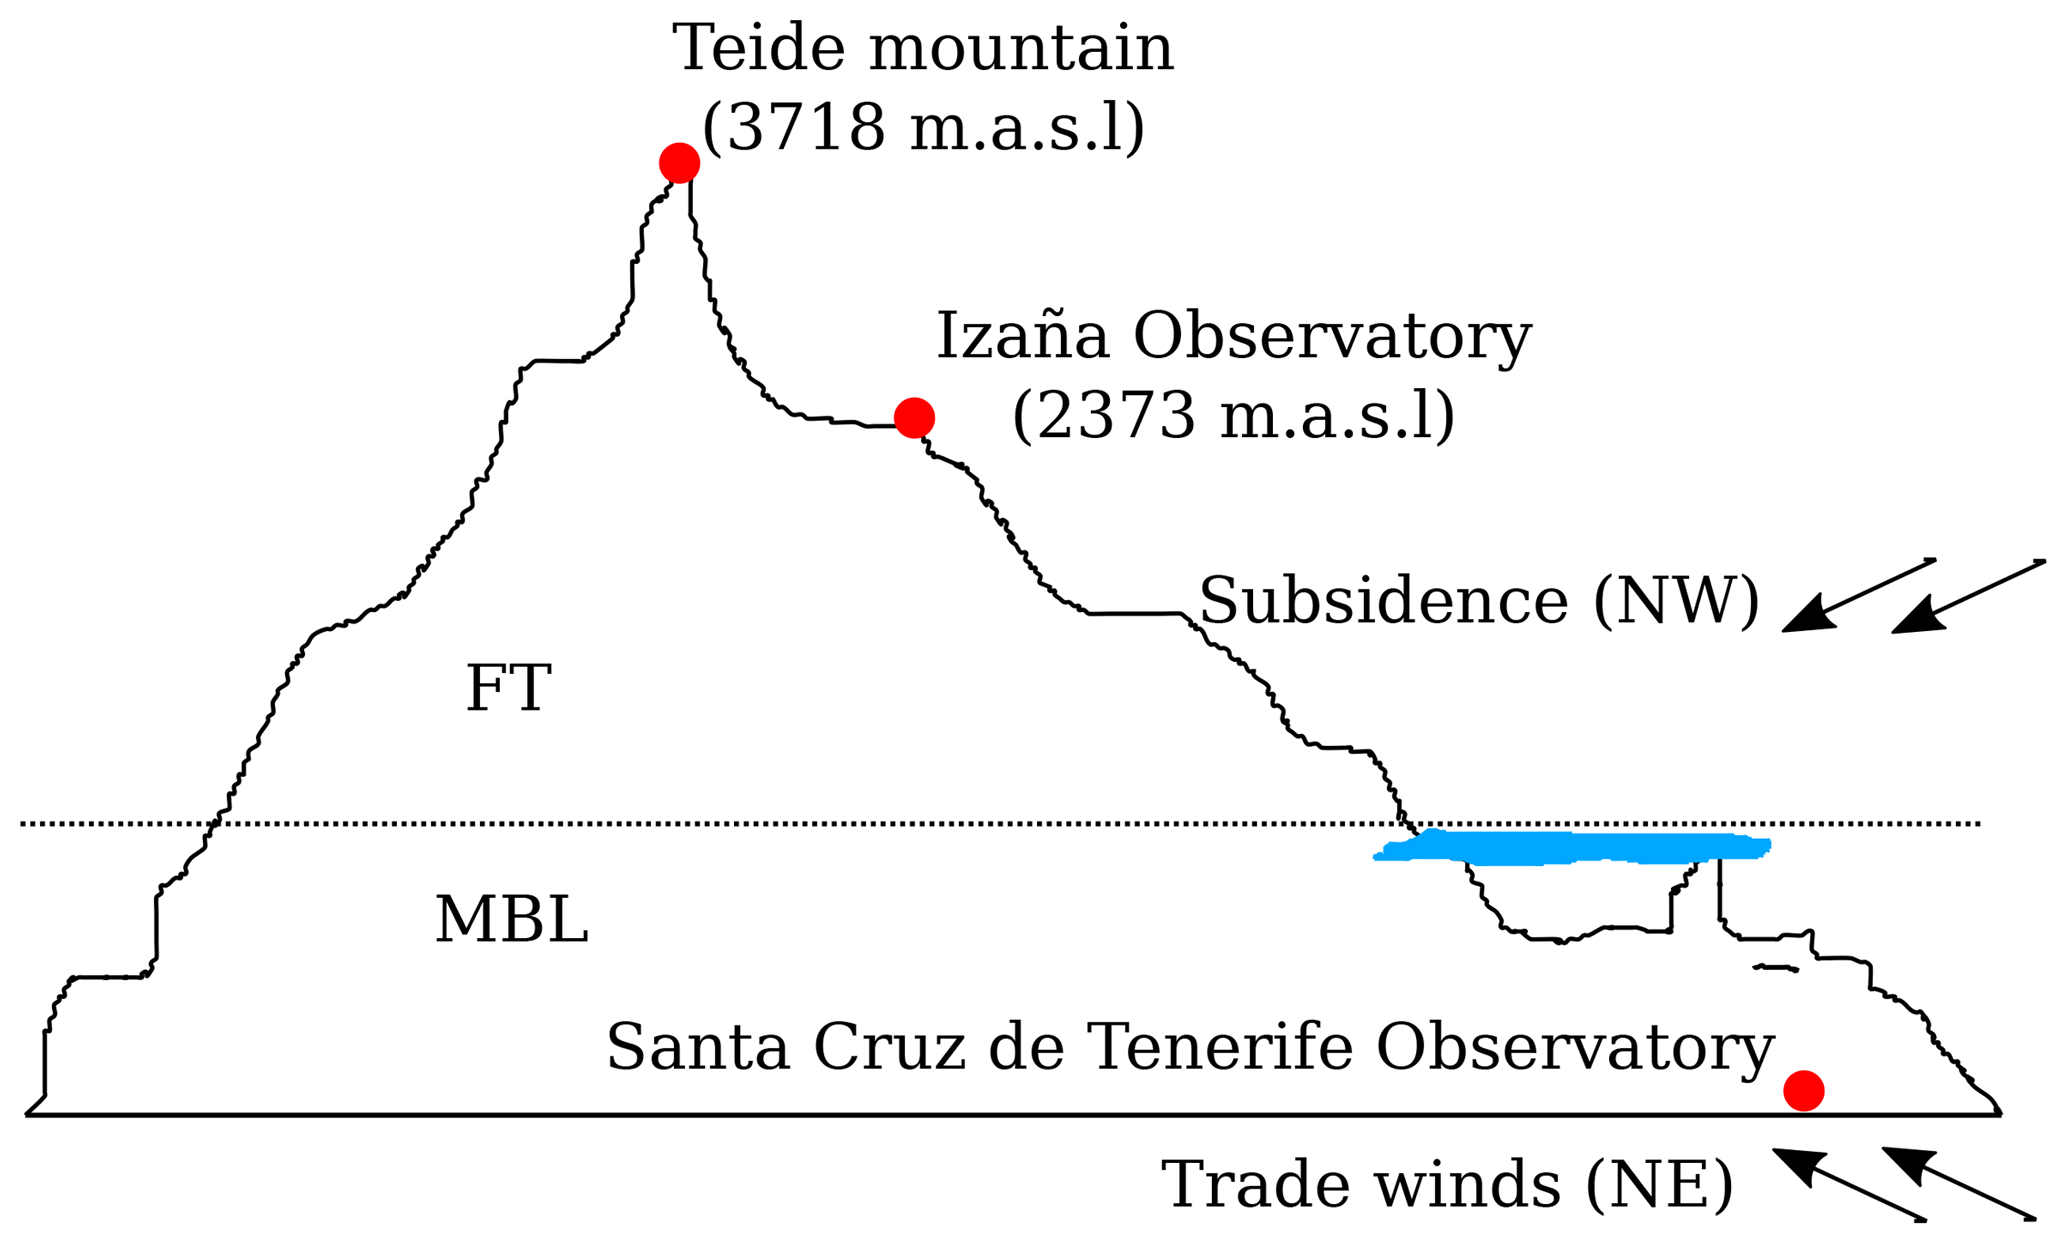
Figure 2Location of Santa Cruz de Tenerife and Izaña observatories on the island of Tenerife.
The Izaña Atmospheric Research Centre (IARC) manages two atmospheric monitoring stations on the island of Tenerife (Fig. 2). The Izaña Observatory (IZO) is the principal site. It is situated on the top of the Izaña mountain, (28.309∘ N, 16.499∘ W, 2373 m a.s.l.) and is one of the World Meteorological Organization Global Atmosphere Watch (GAW) stations (Cuevas et al., 2015b, 2017b). This station is also a reference calibration site for worldwide aerosol monitoring networks such as the AErosol RObotic NETwork (AERONET) (Toledano et al., 2018). The Santa Cruz Observatory (SCO) is located near the coastline in the city of Santa Cruz de Tenerife (28.473∘ N, 16.247∘ W, 52 m a.s.l.). Both sites are separated by 30 km horizontally, but since the Izaña Observatory is in the FT and thus free from the influence of the ground surface, we assume that the measurements made at the IZO are also representative of the atmosphere over the SCO.
3.1 Sun photometer data
Cimel sun photometers are used to retrieve both AOD and sky radiance at Santa Cruz Observatory (AODSCO) and at Izaña Observatory (AODIZO). The whole data series is available throughout the AERONET network (Holben et al., 1998). In this work, we have used the cloud-screened Level 1.5 products (Smirnov et al., 2000) processed by AERONET (algorithm version 2.0) despite AERONET quality assurance AOD Level 2.0 (Holben et al., 2006) generally being recommended for climatological studies. Level 1.5 was chosen because some products like the single-scattering albedo, which is used in this work, only rise to Level 2.0 at AOD > 0.4 for 440 nm, a condition that is rarely reached at the Izaña station. However, the requirements applied in Level 2.0 have been established to guarantee the quality of the products at most of the sites throughout the entire AERONET network. Izaña station, together with Mauna Loa Observatory, is a calibration centre for AERONET reference photometers, which are later used for the calibration by intercomparison of AERONET's field photometers. The capability for Langley plot calibration at Izaña Observatory has been demonstrated by Toledano et al. (2018), which implies that the calibration of the photometers used in the Izaña data series is much more precise than at other sites. As a consequence, the restrictive criteria of the AERONET Level 2.0 product has not been assumed in this work.
3.2 Lidar data
The IARC, in collaboration with the Spanish National Institute for Aerospace Technology (INTA), has operated an elastic micropulse lidar (MPL, Science & Engineering Services Inc., model 1000 v.3) at Santa Cruz de Tenerife site since 2002. In 2005, the operation of this instrument was automated and it was integrated into the NASA Micro-Pulse Lidar Network (MPLNET) (Welton et al., 2001). The technical specifications of this instrument can be found in Table 1.

The lidar signal inversion has been applied to the MPL profiles obtained over a decade, from 2007 to 2017, except for the year 2010, when the instrument was not in operation due to upgrading and maintenance procedures. The maintenance and homogeneity of the data series over such a long period require a significant amount of effort to periodically recalibrate dark current, afterpulse and overlap (Campbell et al., 2002). In particular, the determination of the overlap function, fundamental to guaranteeing the quality of MPL measurements, has been obtained from horizontal profiles at night and were made in the Izaña Observatory under optimal conditions, i.e. under free-troposphere conditions and selecting nights with homogeneous atmospheric conditions (low aerosol load, low humidity, no clouds and low wind speed) (Campbell et al., 2002). A quality control of the overlap calibration has been done based on comparison with the molecular lidar return calculated from temperature profiles under clean conditions at night (Kovalev, 2015). In addition, the installation of the instruments in a temperature-controlled room allow us to minimize thermal effects on the system (Rodríguez-Gonzalez et al., 2005).
A total of 53 982 lidar profiles have been inverted using the one-layer method and 18 785 using the two-layer method. The latter is more restrictive since cloudless conditions and output AOD control are simultaneously required for both stations. AOD at an MPL wavelength of 523 nm has been calculated using Ångström power law with parameters estimated by linear regression from the AERONET AOD between 440 and 870 nm.
Since the Fernald–Klett method has been applied to cloud-free conditions, AERONET Level 1.5 has been used as the first filter to discard data affected by clouds. However, lidar and photometer perform observations in different directions; thus it was also necessary to develop a specific cloud-screening for lidar data. Taking into account that only daytime data are analysed in this work, we have used a simple cloud-screening algorithm based on the temporal smoothness of the lidar background (Clothiaux et al., 1998). A second order polynomial fit between the background, B(t), and time, in a time windows of 15 min around ti, has been used to determine if a measurement made in ti is free of clouds. If RMSE , we consider the observation free of clouds.
Previous studies have shown that mineral dust dominates the aerosol regime in the study region (Basart et al., 2009; Guirado, 2015; Cuevas et al., 2015a; García et al., 2017). In situ aerosol measurements conducted by García et al. (2017) in the Izaña Observatory concluded that mineral dust is the main contributor to background levels of aerosols in this site. Recirculated Saharan dust or dust from North America are hypothesized as the main contributors for these background levels. Basart et al. (2009), Guirado (2015) and Cuevas et al. (2015a) corroborated that high-AOD conditions (AOD >0.1) are associated with the presence of large particles (Ångström exponent or α < 0.25 for pure dust) due to the Saharan dust transport, more prevalent in Izaña in summer and in Santa Cruz de Tenerife in winter. Following Cuevas et al. (2015a), an Ångström exponent <0.6 can be used to discriminate those conditions where dust is the main aerosol component.
Sun photometer data have been used to assess the AOD limit for clean conditions in Izaña. This threshold will be used in the following sections to evaluate the lidar ratio under clean and dusty conditions. For AODIZO>0.1, the Ångström exponent is almost constant and low (Fig. 3), pointing to the presence of predominantly coarse-mode aerosols. However, below the threshold in AOD of 0.1, we observe considerably higher α values, up to median values of 1.3, confirming the presence of predominantly fine-mode aerosols in Izaña and therefore the existence of clean conditions.
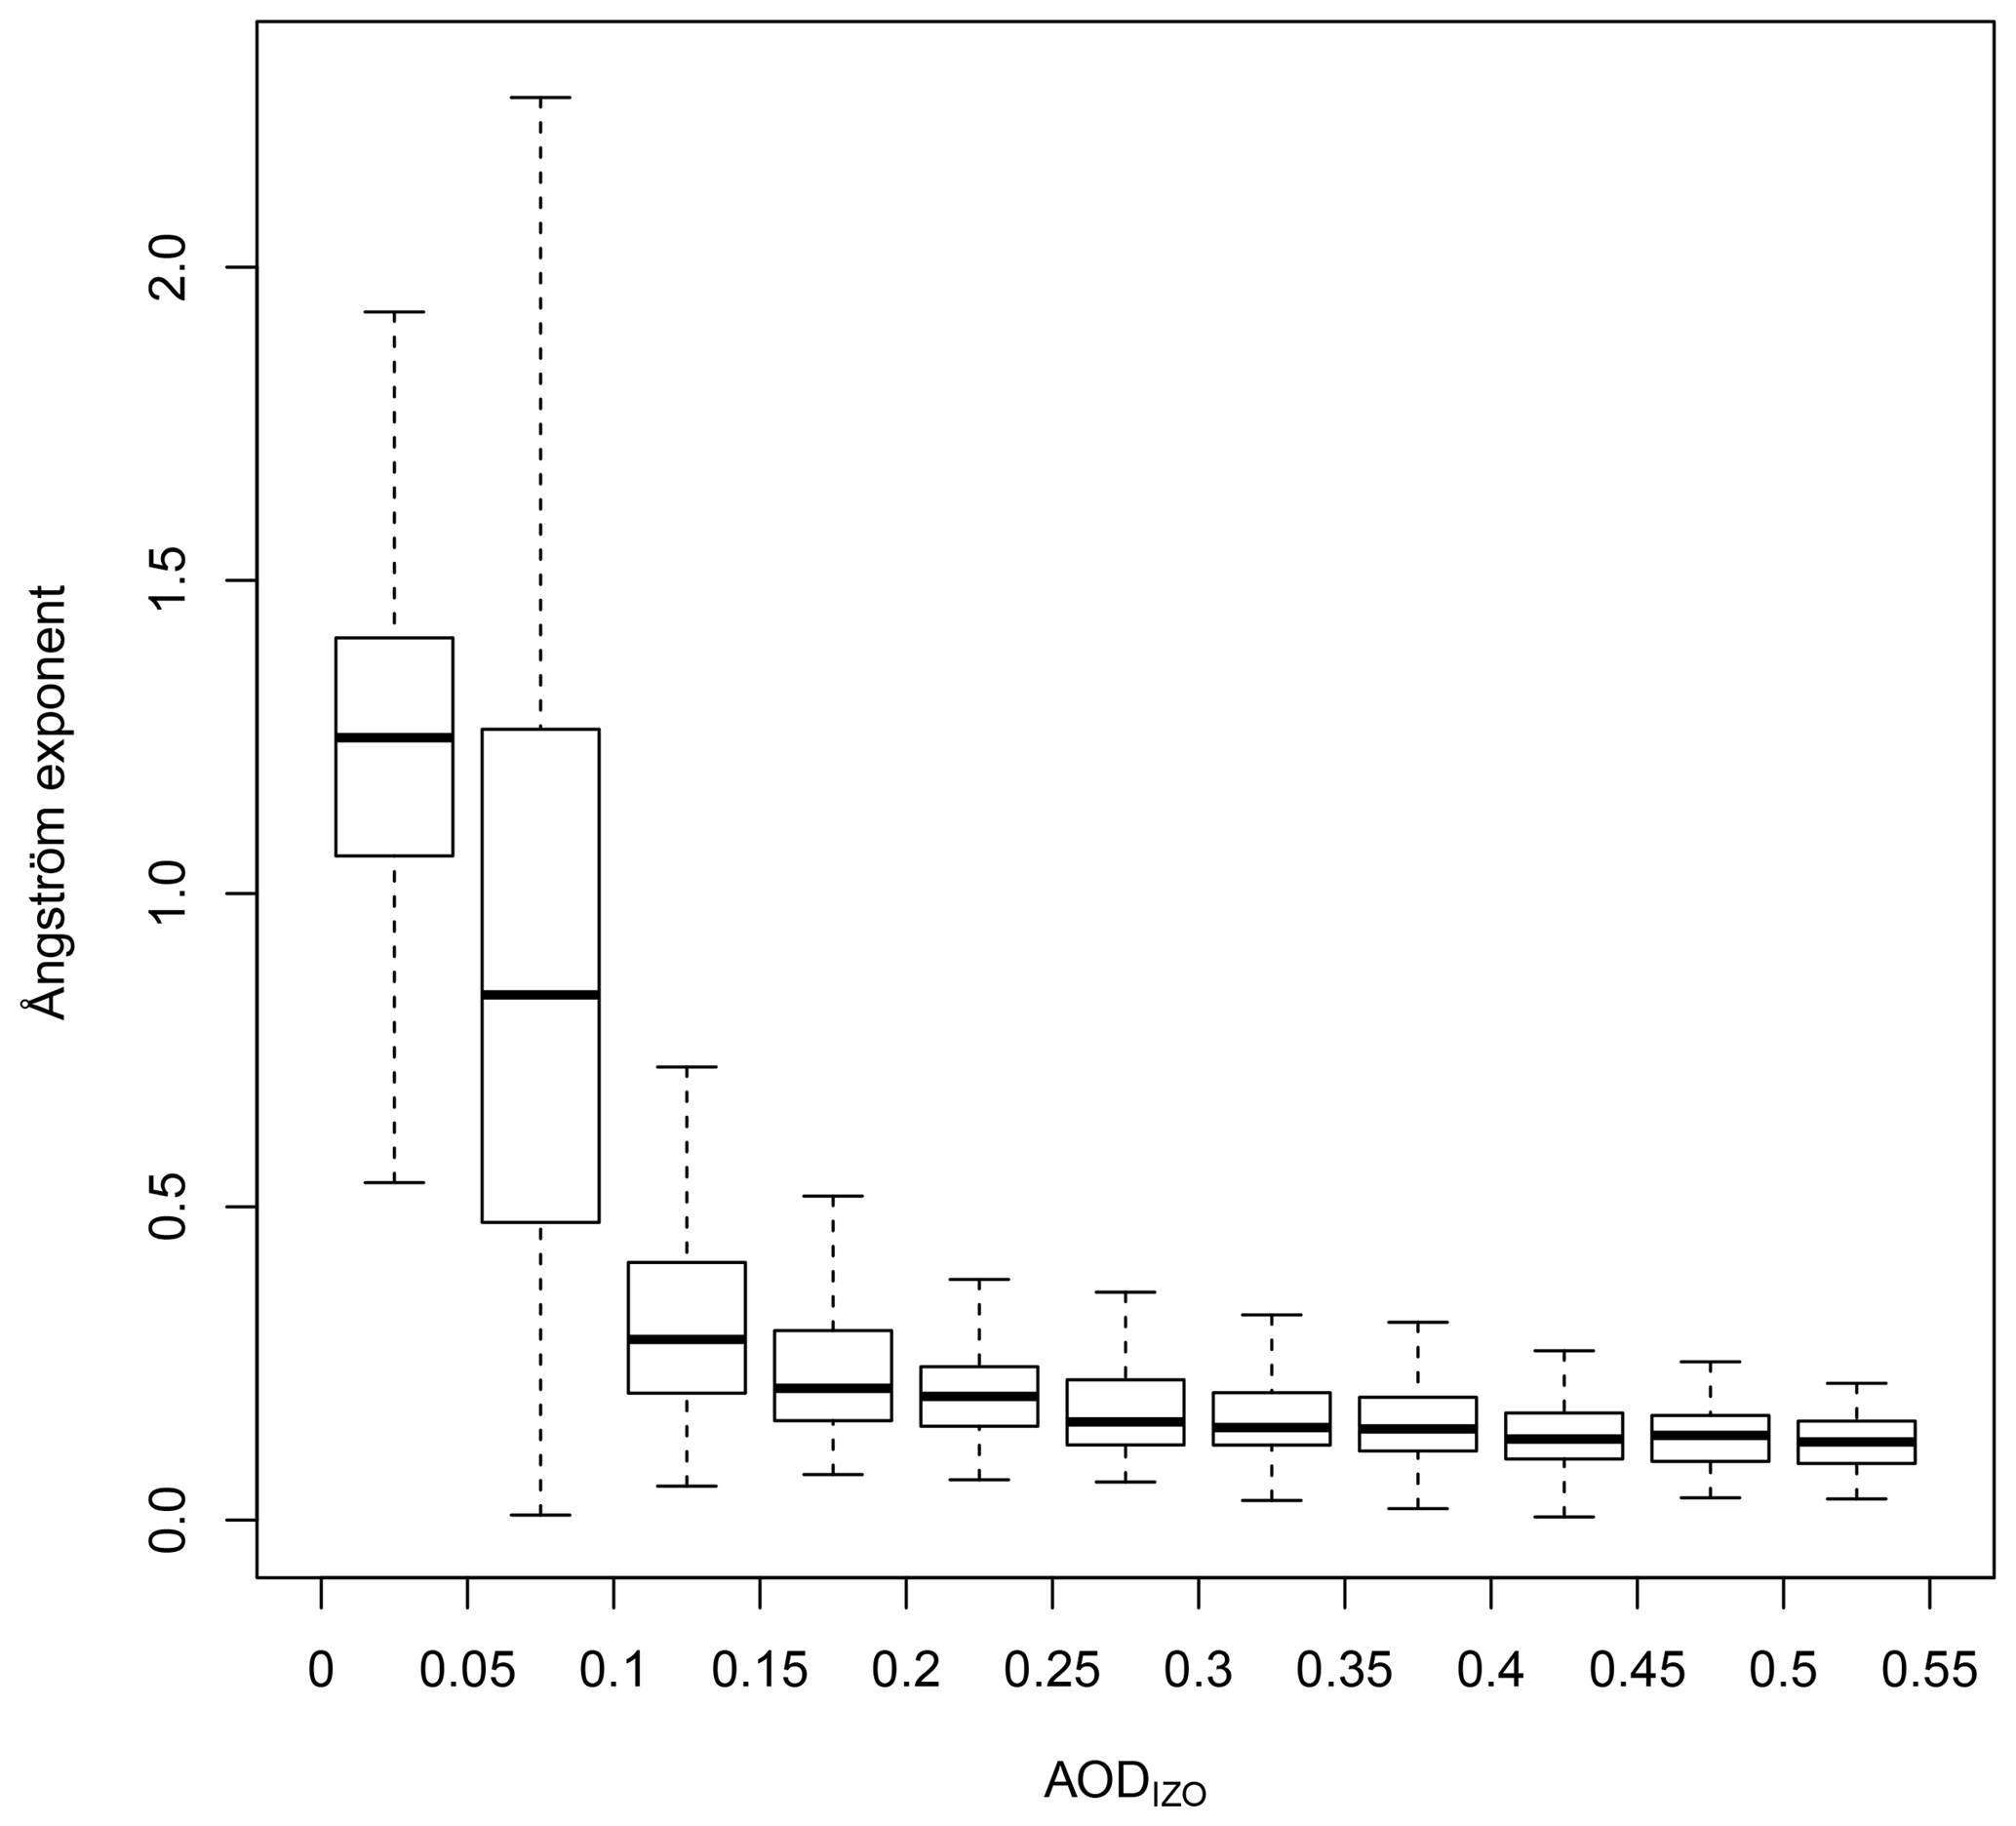
Figure 3Ångström exponent against AOD measured at Izaña between January 2007 and December 2017. AODs above 0.55 are very scarce and therefore are not shown in the plot.
In terms of aerosol size distribution, the previous studies concluded that under clean conditions fine-mode aerosols dominate the aerosol size distribution in Izaña (with an effective radius, Reff, of 0.15 µm), while a typical bimodal size distribution is observed at Santa Cruz with a dominance of coarse-mode maritime aerosols (Reff∼1.72 µm) over the fine mode (Reff∼0.14 µm). Under Saharan dust influence, a bimodal size distribution is also observed, with a dominant coarse mode and an increase in the fine-mode aerosol volume concentration at both stations in relation to clean conditions.
These results suggest that mineral dust is the dominant aerosol in the FT of the subtropical North Atlantic region under both clean and dusty conditions.
5.1 Lidar ratio from the sun–sky photometer
The lidar ratio for mineral dust aerosols can be calculated using data from the photometer installed at the Izaña Observatory, where the presence of almost pure dust can be anticipated. The lidar ratio can be calculated from the single-scattering albedo, ω, and the phase function at 180∘, P(180∘) (Eq. 1) (Müller et al., 2003). ω and P(180∘) are obtained from the inversion of almucantar measurements (Dubovik and King, 2000; Dubovik et al., 2006).
In order to be directly comparable with the lidar ratio obtained from the MPL signal inversion, the lidar ratio has been calculated for 523 nm by linear interpolation between the 440 and 670 nm photometer spectral bands. This method for lidar ratio calculation serves as validation for the two approaches using MPL data (the one- and two-layer methods) but also as an independent and robust technique for lidar ratio determination.
5.2 One-layer method – analysis of the lidar data using AOD from a single photometer
The Fernald–Klett method (Klett, 1985; Fernald, 1984) is generally used to estimate the aerosol optical properties from elastic lidar measurements. This method makes the following assumptions:
-
The atmosphere is composed of molecules and aerosols, so we can write and . Optical properties of the molecular component are known.
-
Aerosol extinction or backscattering coefficient is known at a reference height, rref.
-
Saer can be considered constant at different heights.
In this work the downward method (Fernald, 1984) is used, repeating βaer(r) and σaer(r) calculations while varying Saer value from 1 to 100 with an increment of 1. For each repetition, the integrated σaer(r) along the atmospheric column is compared with the AOD from the collocated photometer. We select the value Saer that minimizes this difference, removing those cases in which the minimum AOD difference is greater than 0.01. Finally, βaer(r) and σaer(r) are those calculated with the chosen Saer.
The signal-to-noise ratio (snr(r)) is normally used to have an estimation of the signal strength relative to the noise at different heights. This magnitude is defined for the photon-counting mode as follows:
where the numerator represents the laser light backscattered by the atmosphere at the range r that reaches the detector, and the denominator is the noise associated with a detector when the incident photon count follows a Poisson distribution (Welton and Campbell, 2002). N is the number of shots during the acquisition of the signal. The noise is calculated considering not only the laser backscattered by the atmosphere but also the background signal. Therefore, the snr drops as the altitude increases, with lower values during the day (Spinhirne, 1993).
In order to establish an upper bound to the lidar profile, rmax, we consider a snr(r) threshold of 3 (Morille et al., 2007) to limit the height at which meaningful data are obtainable.
To apply the Fernald–Klett method it is necessary to know the aerosol extinction or backscattering coefficient at a certain reference height, rref. If this height is selected high enough, the particle concentration will be zero and therefore βaer(rref) and σaer(rref) can also be considered equal to zero (Klett, 1985).
To identify the height-range free of aerosols, the measured range-corrected signal can be compared to a calculated molecular attenuated backscattering profile, Zm(r)=βm(r)Tm(r)2. Zm(r) values can be calculated from air pressure and temperature at different heights following Kovalev and Eichinger (2005). Air pressure and temperature profiles can be obtained from local radiosondes or by means of meteorological analysis. In our case, and although radiosondes are available twice a day, we have used data from the Global Data Assimilation System (GDAS) model from the National Centres for Environmental Prediction (NCEP) (Kanamitsu, 1989) so that the methodology can be applied to another place without restriction to the availability of on-site radiosondes. The ratio Z(r)∕Zm(r) should be invariant above rref, and so its derivative should be zero. We have empirically set a threshold method to find rref as described in Eq. (3).
After rescaling Zm(r) to fit Z(r) between rref and rmax, it has been noted that Z(rref) tends to be systematically slightly larger than Zm(rref) (Fig. 4). These results suggest that some aerosol can still be found at the altitude obtained from Eq. (3) and point to the need to apply a correction to this method. To this end, the lowest r above this first approximation, for which Zm(r)≥Z(r), has been considered to have a refined reference height. Our results confirmed that, in 76 % of the analysed profiles, this second rref is two or more steps (at least 150 m) above the first estimated value.
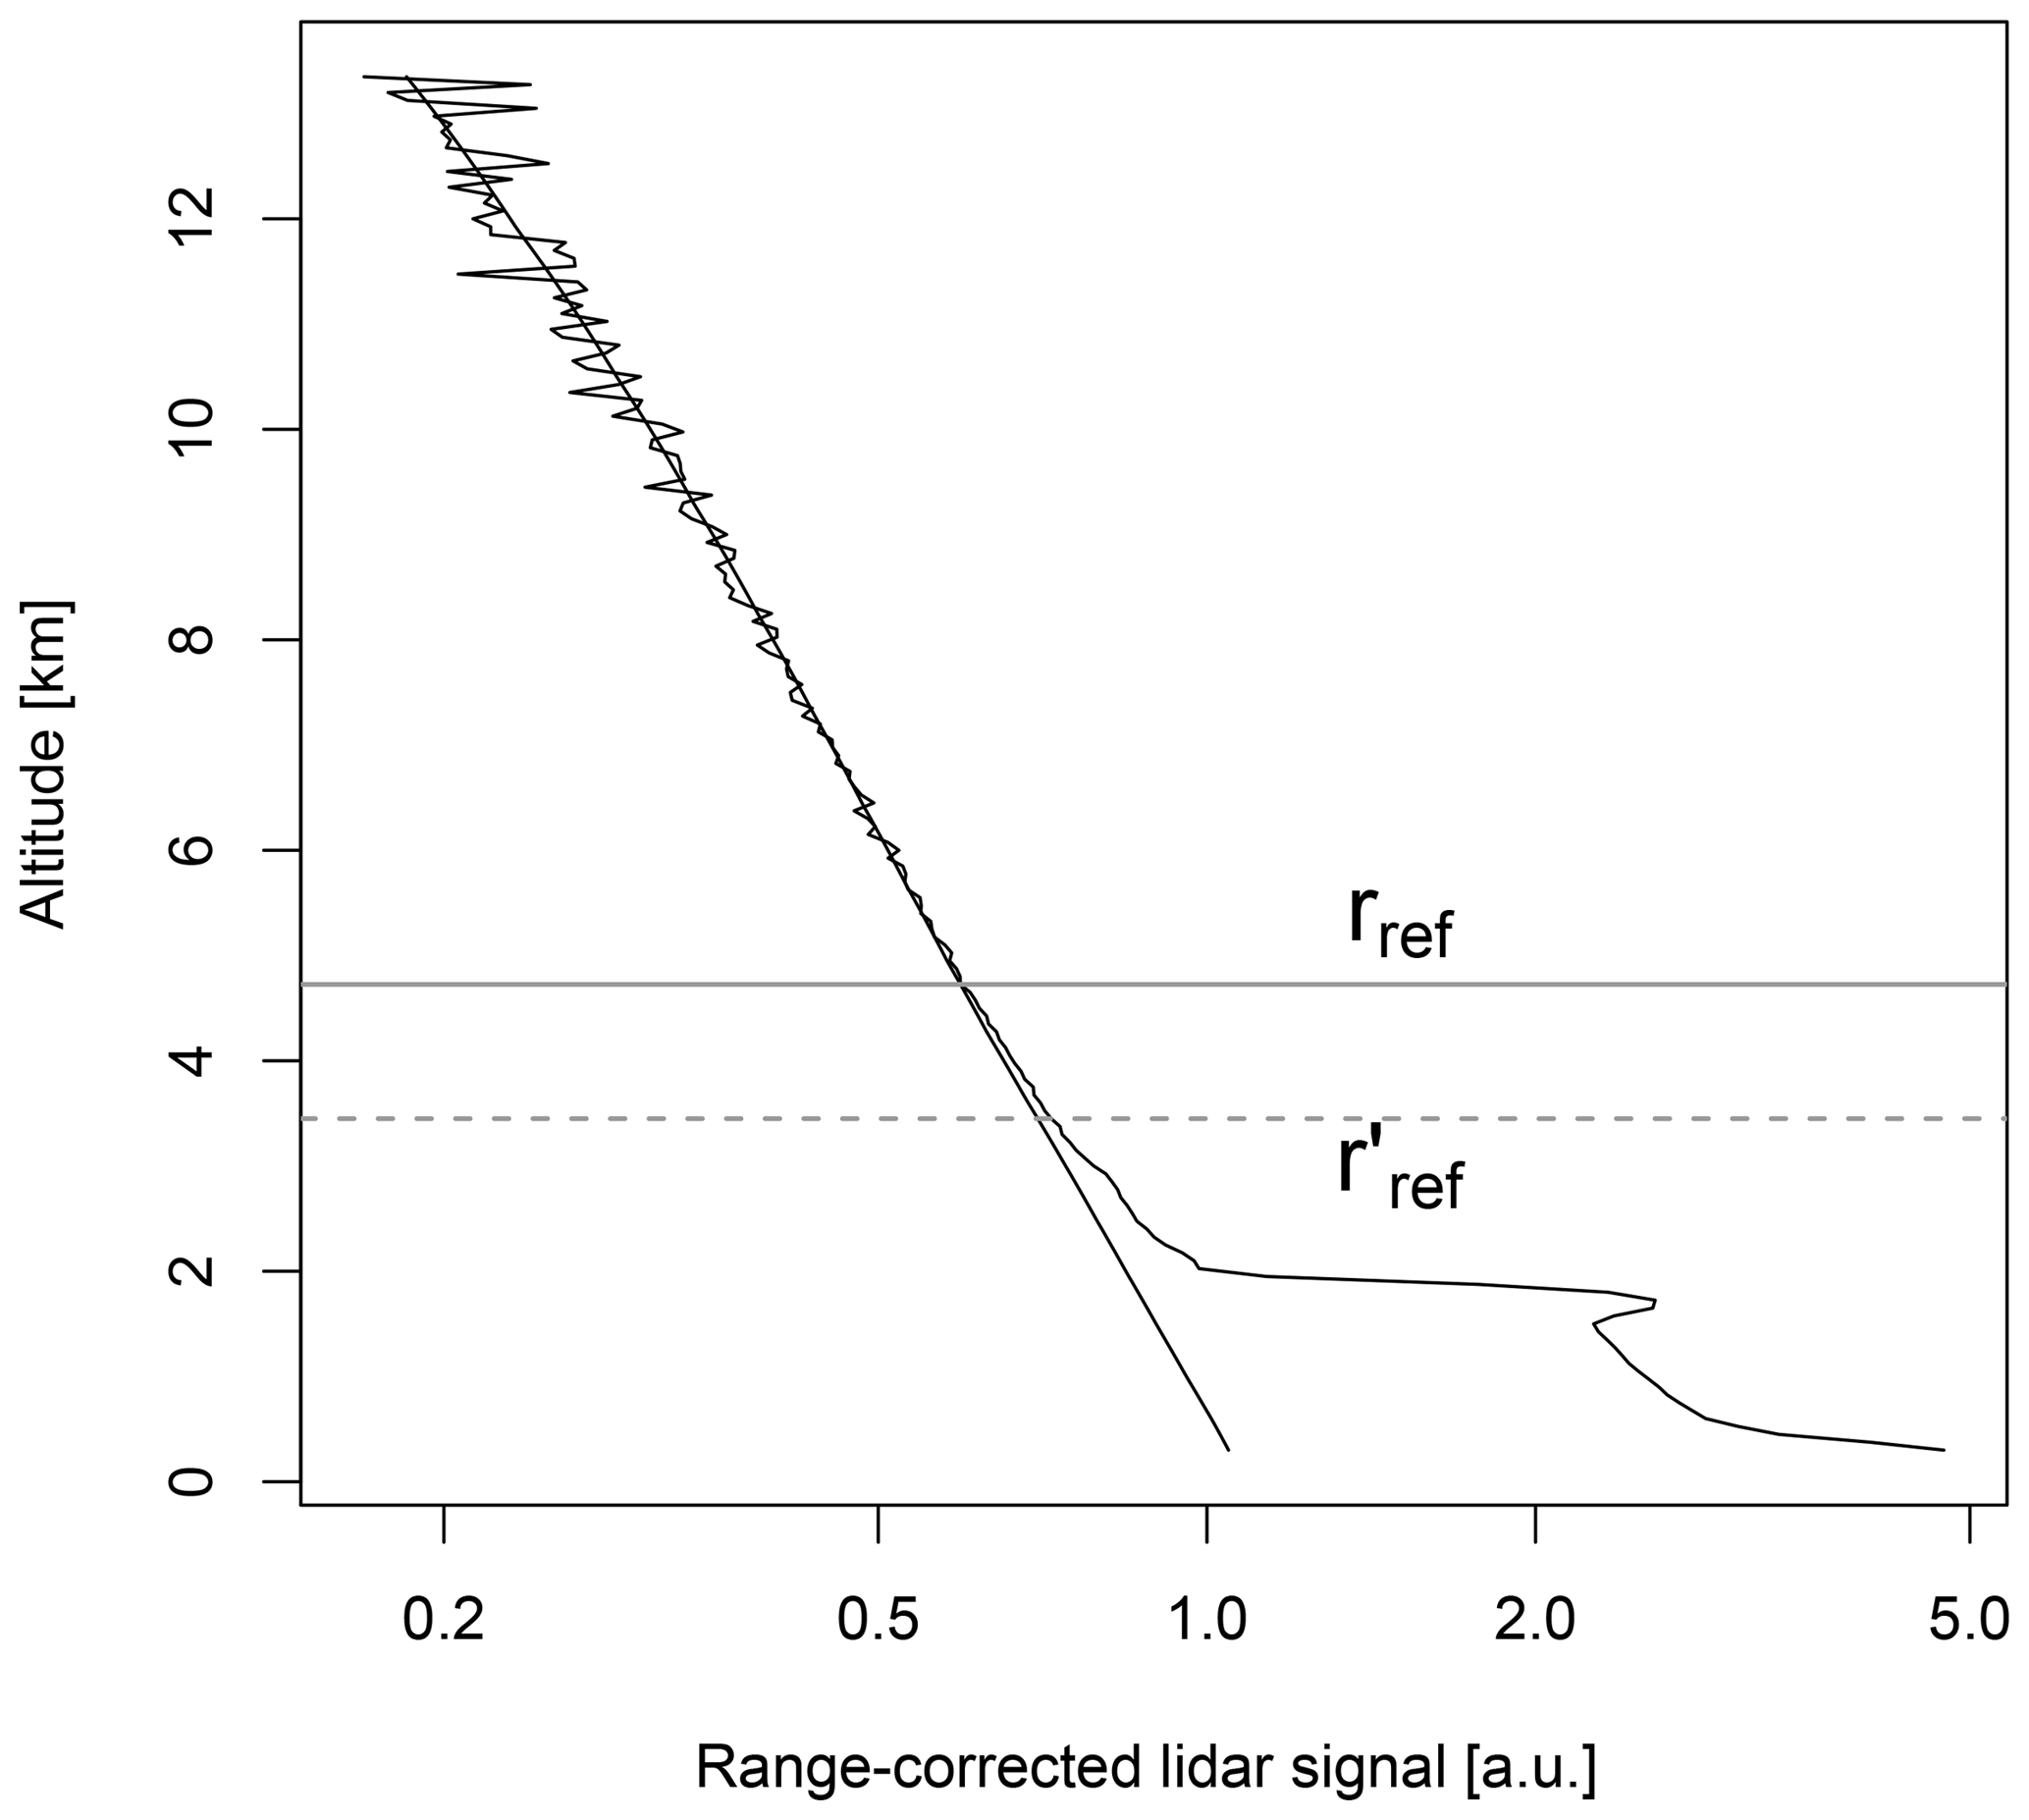
Figure 4Reference altitude determination. is the first approximation of the minimum altitude free of aerosols and clouds. rref is the final value used in this work.
Occasional differences between the aerosols observed by the lidar and the photometer can be expected because of the different viewing geometry of these two systems. The lidar system constant, C, has been used to filter these cases. This constant can be calculated using the relation above rref. Since this expression contains information from both the lidar (Z(r)) and the photometer (Taer), an incorrect C value will be obtained if some differences exist in the aerosol observed by these two instruments. Over the 10-year period analysed in this study, we obtained mean values of 12.8±1.6 km and 5.0±1.2 km for rmax and rref respectively. This means that the effective free-aerosol atmosphere for determining C is about 7 km. In this work we have rejected lidar data from which C differs from its daily average by more than 3 times the daily standard deviation. However, in the case of intense dust intrusions at high altitude, rref gets too close to rmax, which prevents the application of the method.
5.3 Two-layer method – analysis of the lidar data using AOD from two photometers at different altitudes
The analysis of the lidar data using two photometers is also based on the Fernald–Klett method, and most of the procedure is equivalent to that described in Sect. 5.2. However, in this case we consider a height-dependent lidar ratio, Saer(r). This more realistic approximation leads us to propose the two-layer method as a conceptual model, rather than as an unrealistic approach for retrieving the particle extinction profile. Since we have two AOD measurement sites at different heights, we can determine two lidar ratios corresponding to two different layers. The questions that immediately arise are where the border of these two layers is and how the transition between the two layers occurs, which are not trivial issues.
As we have previously stated, the main characteristic of the study zone is the thermal inversion between 800 and 1500 m.a.s.l., located below the Izaña Observatory. Thus, if we consider the limit between the two layers at Izaña Observatory height, the lower layer will include the MBL and the lower part of the FT. Instead, our approach in this work was to find the natural limit between the MBL and the FT, so that we can retrieve the associated lidar ratios of both layers, Saer(MBL) and Saer(FT). The top of the MBL is generally associated with a strong reduction of the lidar backscatter signal (Fig. 5a); thus the height of the limit between the MBL and the FT, rl, can be easily determined as the largest negative vertical gradient in lidar signal (Endlich et al., 1979).
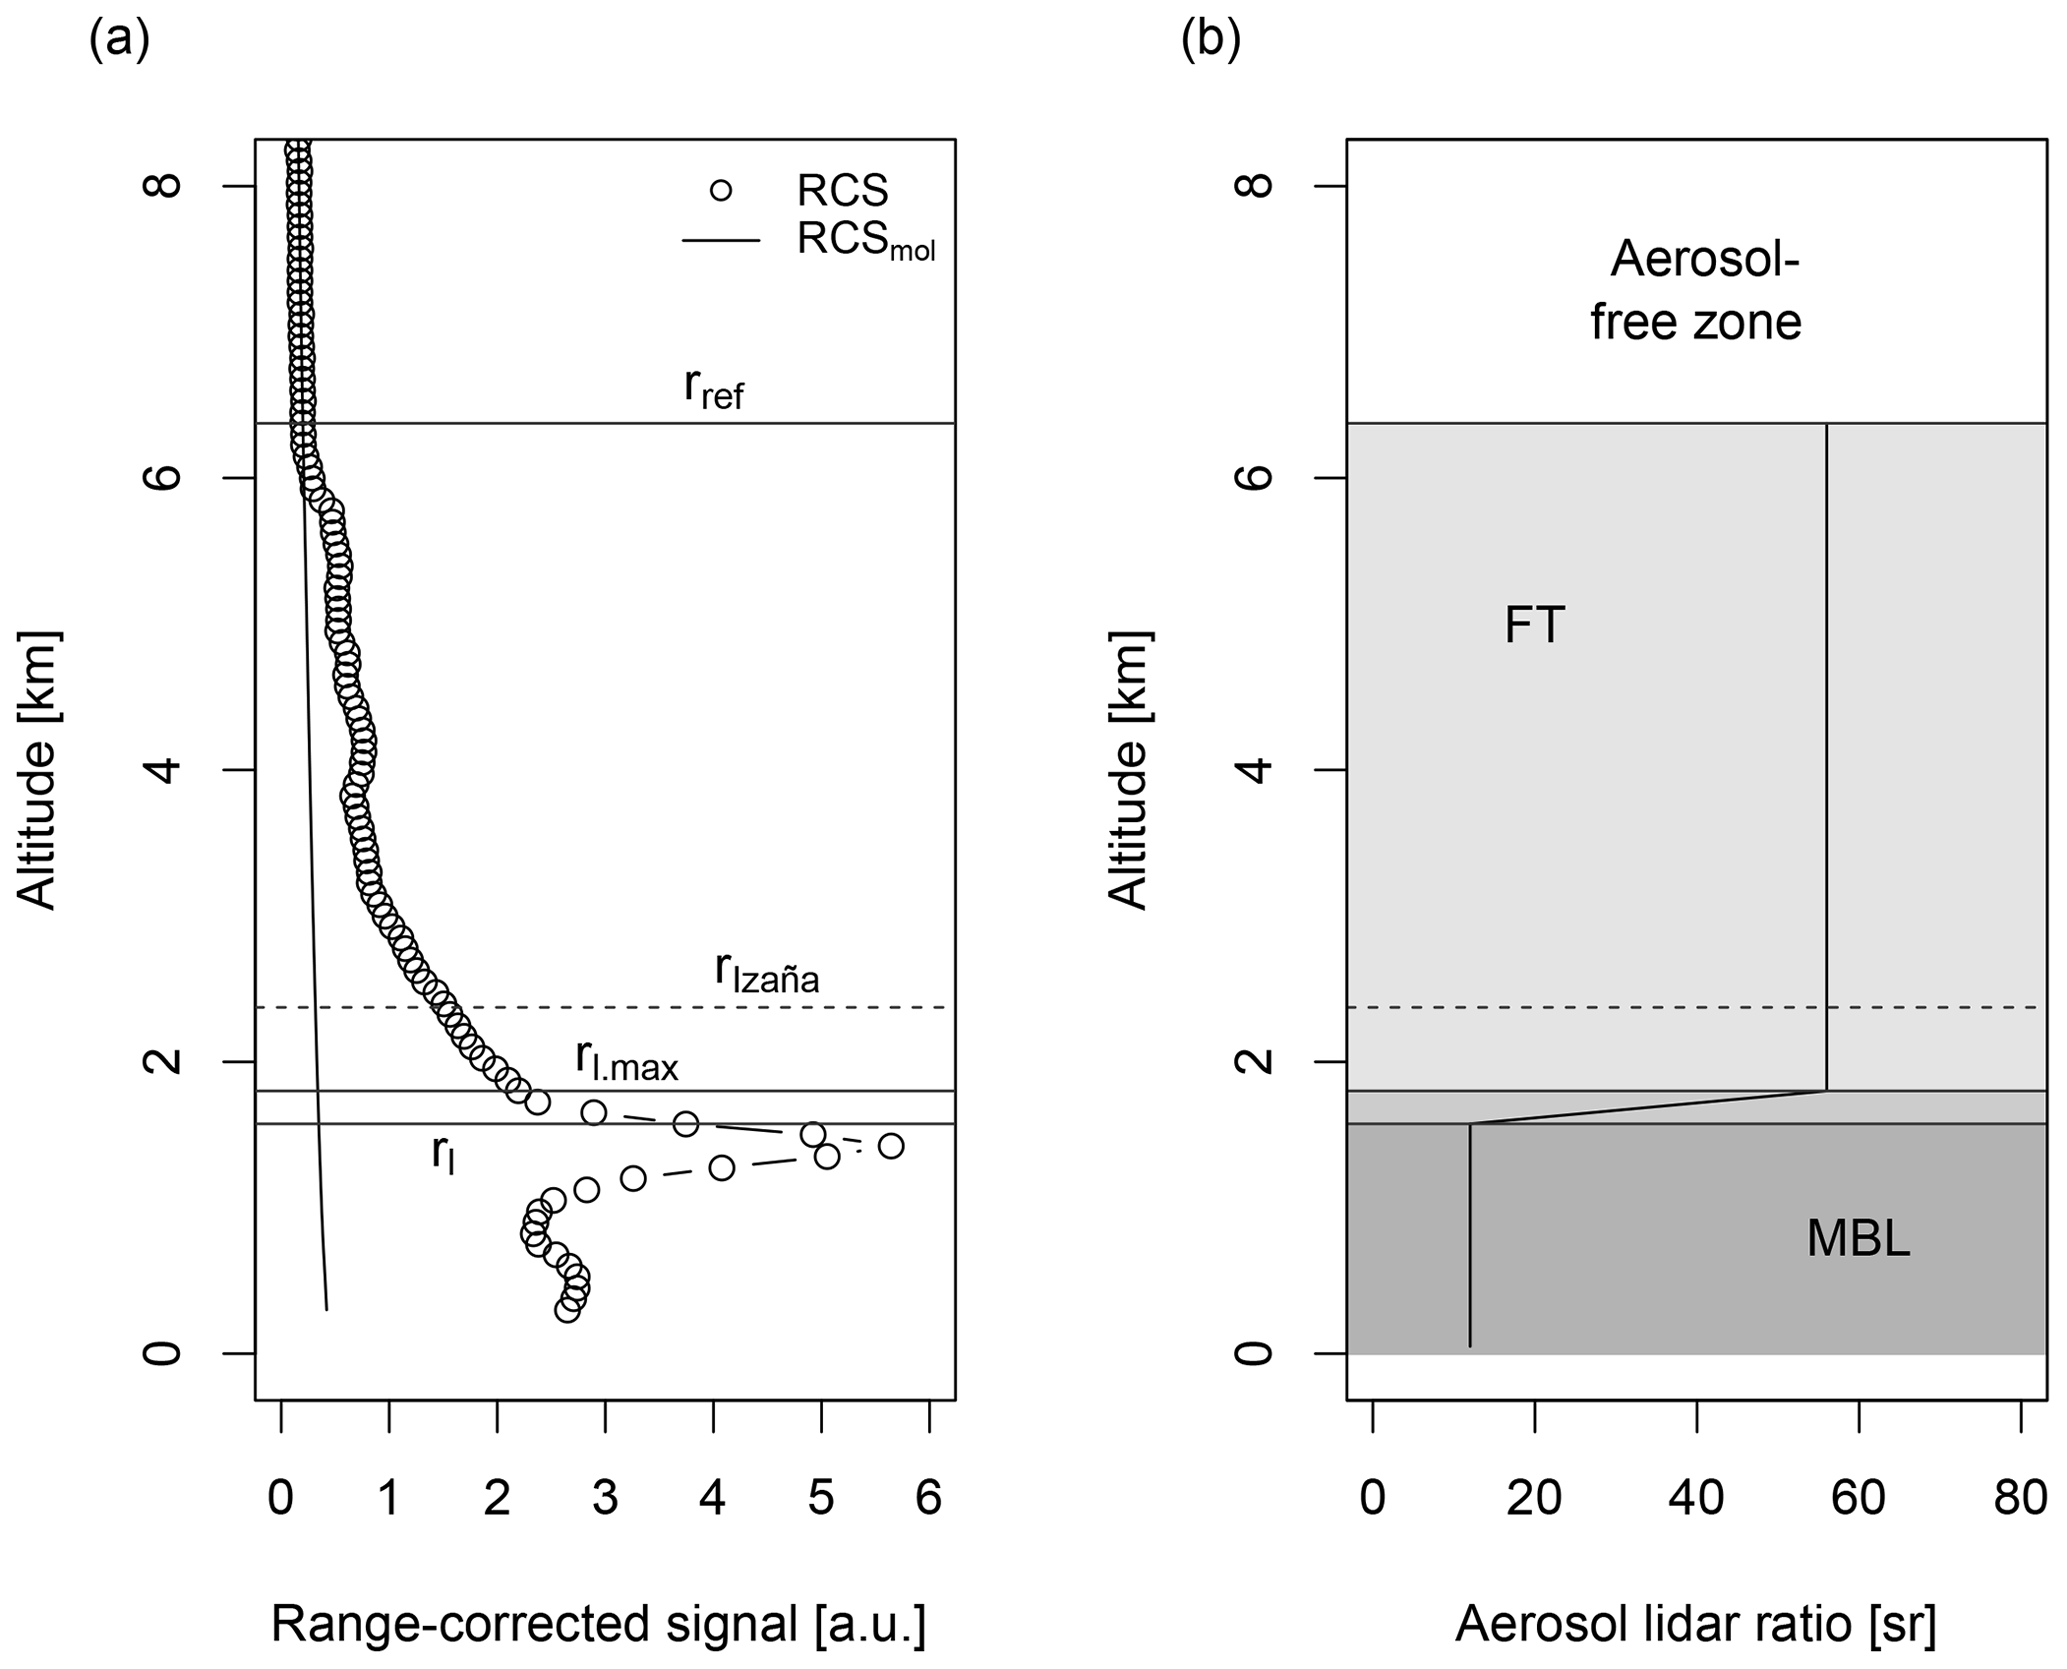
Figure 5Two aerosol layer conceptual model. The boundary between the MBL and the FT, rl, is determined using the gradient method. rl,max and rl determine the transition zone.
If we consider a discontinuity in Saer(r), this will lead to a discontinuity in the extinction coefficient, which is not likely to happen in the atmosphere. To avoid discontinuities, we have defined a transition zone between the MBL and the FT, where Saer(r) varies linearly with height between Saer(MBL) and Saer(FT). The lower limit of the transition zone is set to rl and the upper limit, rl,max, is defined as the height above rl where the gradient is reduced below 20 % of its maximum value at rl (Fig. 5a).
To determine Saer(FT), we apply the same iterative method as in Sect. 5.2 to the AOD measured at Izaña Observatory and to the lidar profile from rref down to Izaña altitude, rIzaña. To determine Saer(MBL), the iterative process is repeated for values from 1 to 100 with an increment of 1, but these Saer(MBL) values are only used for heights below rl. Saer(r) is fixed to the previously calculated Saer(FT) value for heights between rl,max and rIzaña, and it is linearly interpolated between Saer(FT) and Saer(MBL) for the transition zone, between rl,max and rl (Fig. 5b).
In this work we present an evaluation of lidar ratios extracted from 10 years of systematic measurements taken by means of the three different techniques previously described (sun-photometry and the one- and the two-layer inversion techniques). This study aims to contribute to the knowledge of this important intensive aerosol property (lidar ratio) in a representative region of the Saharan dust transport over the subtropical North Atlantic towards the Americas.
In an effort to focus only on almost pure-dust conditions, preventing the occurrence of mixtures of different aerosol types, we will restrict this analysis in the two-layer method and in the sun-photometry technique to the FT, where the influence of marine and anthropogenic aerosols is minimized and the prevalence of mineral dust can be ensured.
6.1 Lidar ratio characterization in the FT from sun photometer data
The aerosol lidar ratios derived from the sun–sky photometer at Izaña Observatory against the AODIZO are shown in Fig. 6. The corresponding histograms of Saer(FT) for low-AOD conditions (AODIZO<0.1) and high-AOD conditions (AODIZO>0.1) are presented in Fig. 7a and b. This AOD limit has been set in Sect. 4. The existence of a large variability in lidar ratios is evident for low-AOD conditions (Fig. 7b), with a Saer(FT) distribution centred in a mean value of 52±12 sr. However, for high aerosol load, Saer(FT) dispersion is notably reduced, and a mean value of 49 sr is obtained with a lower standard deviation of 6 sr (Fig. 7b).
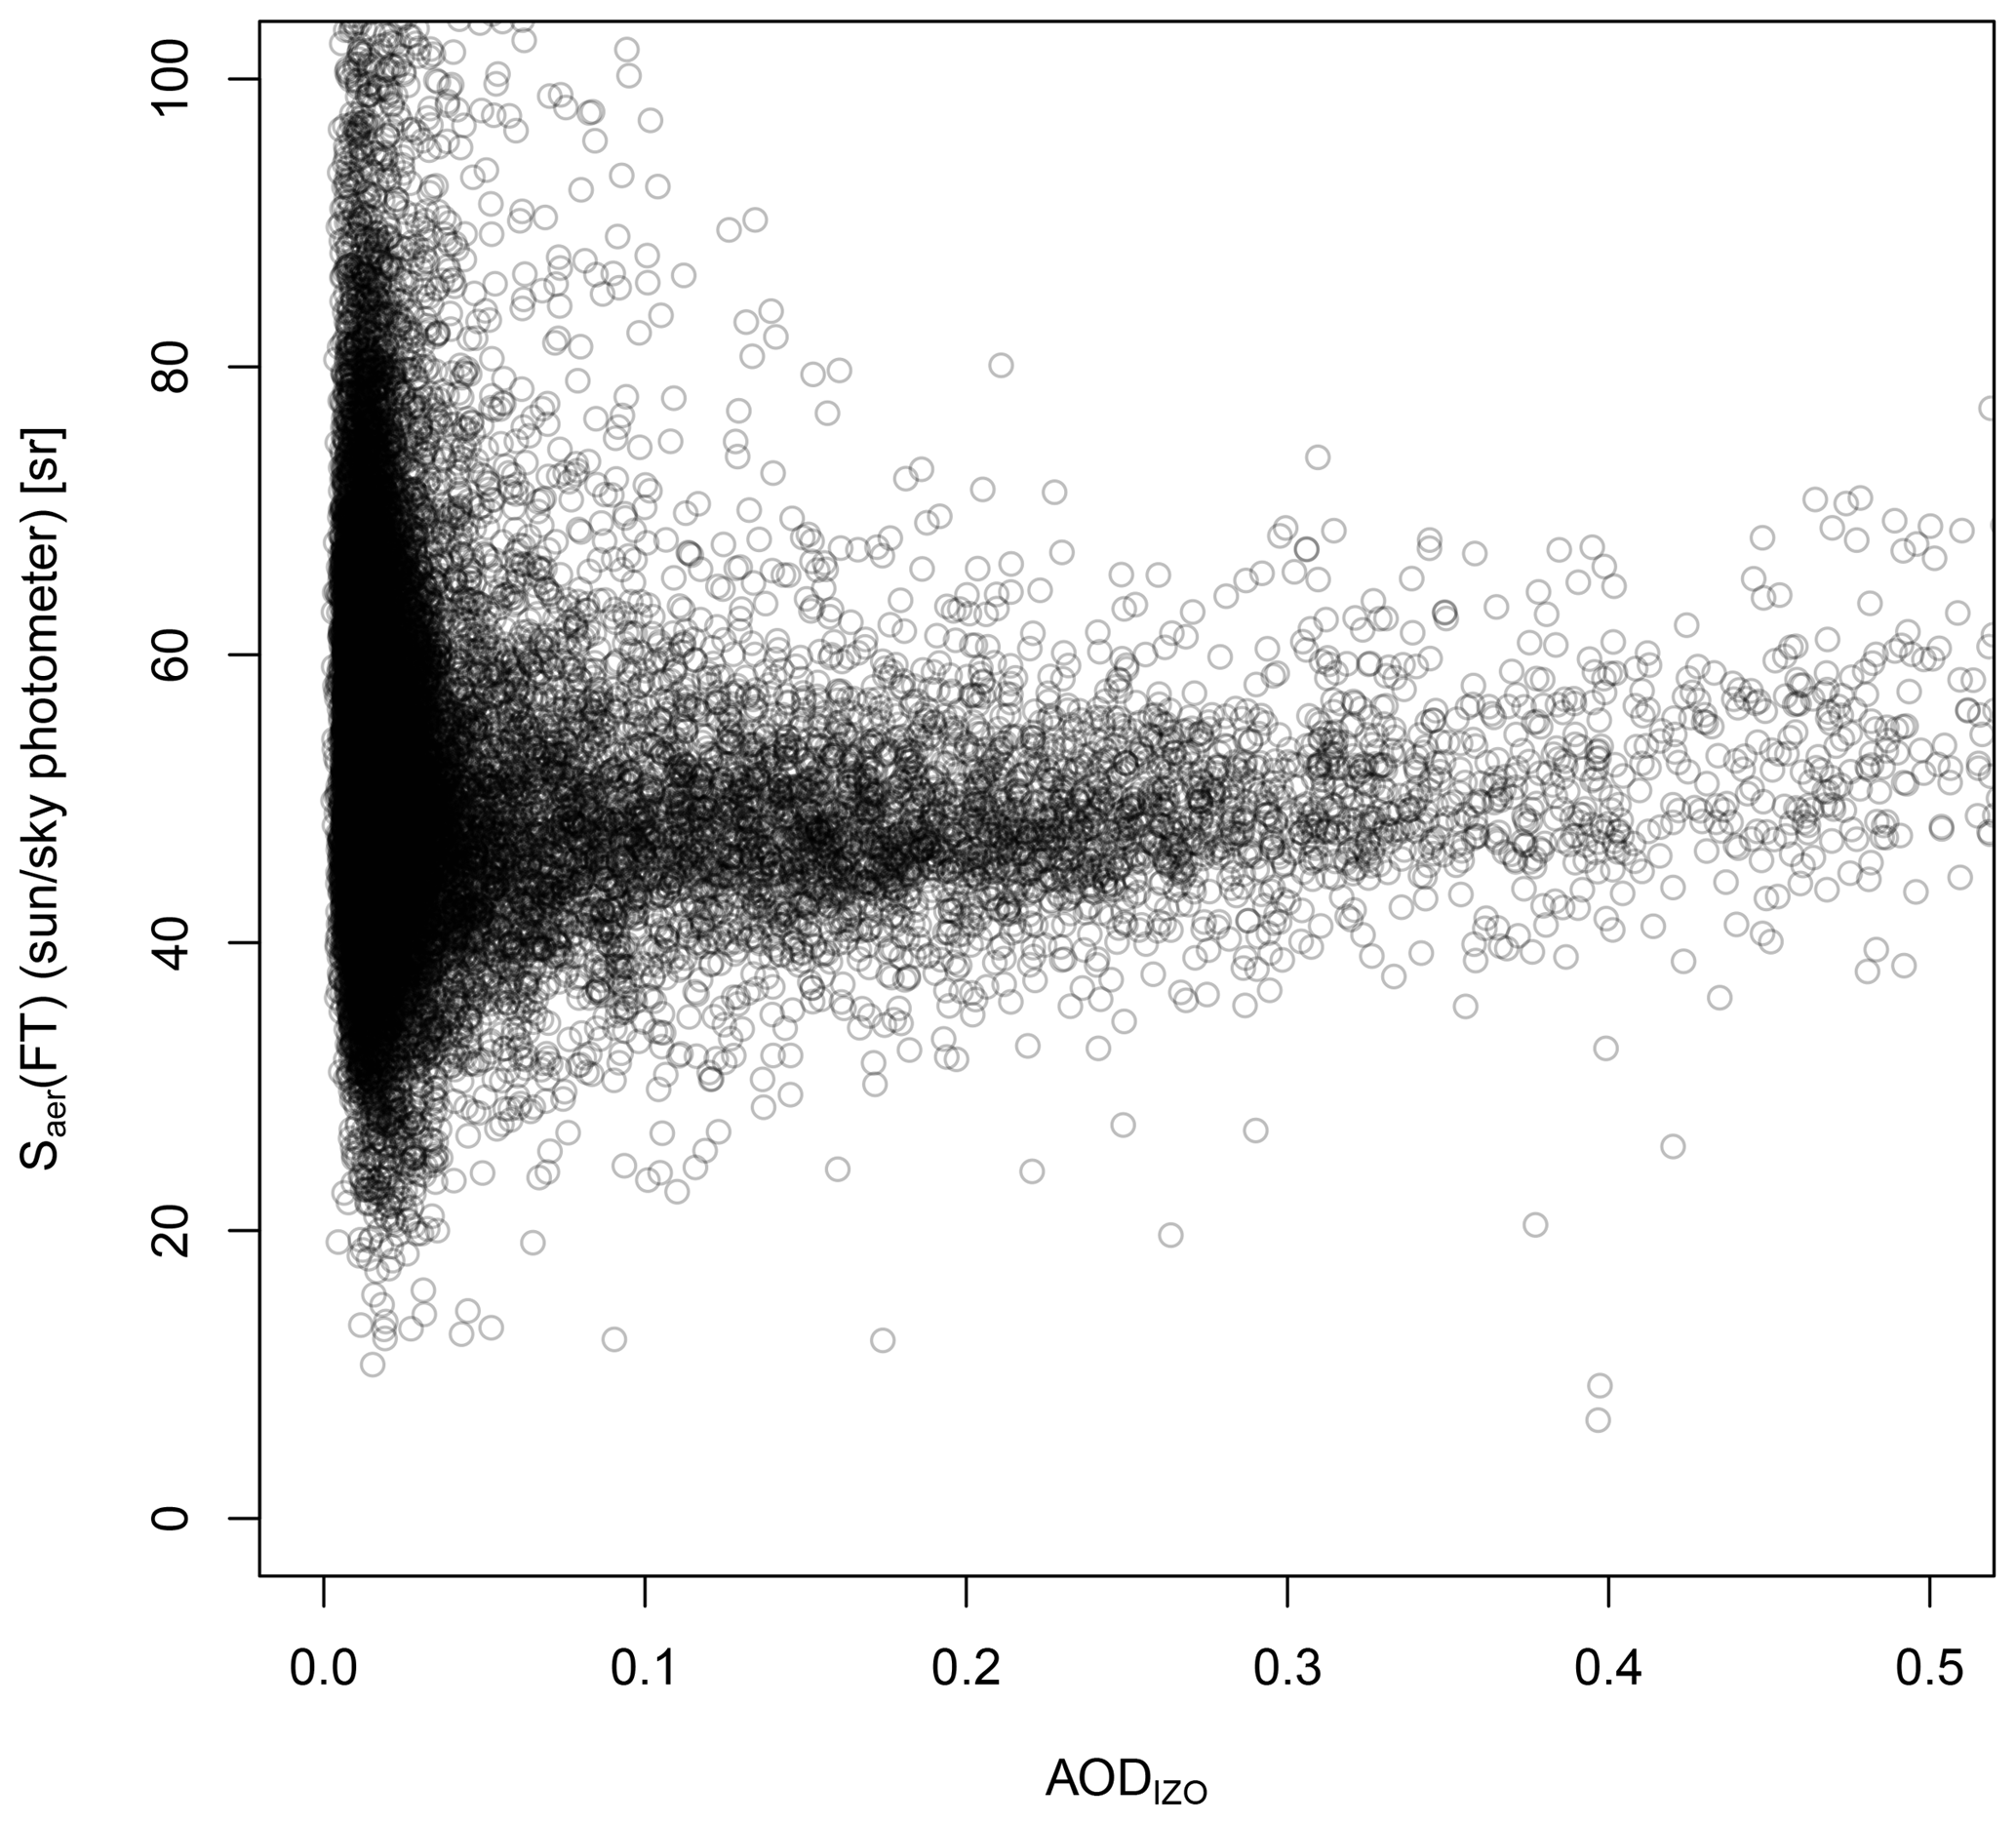
Figure 6Lidar ratio at 523 nm from the sun–sky photometer installed at Izaña Observatory against AOD.
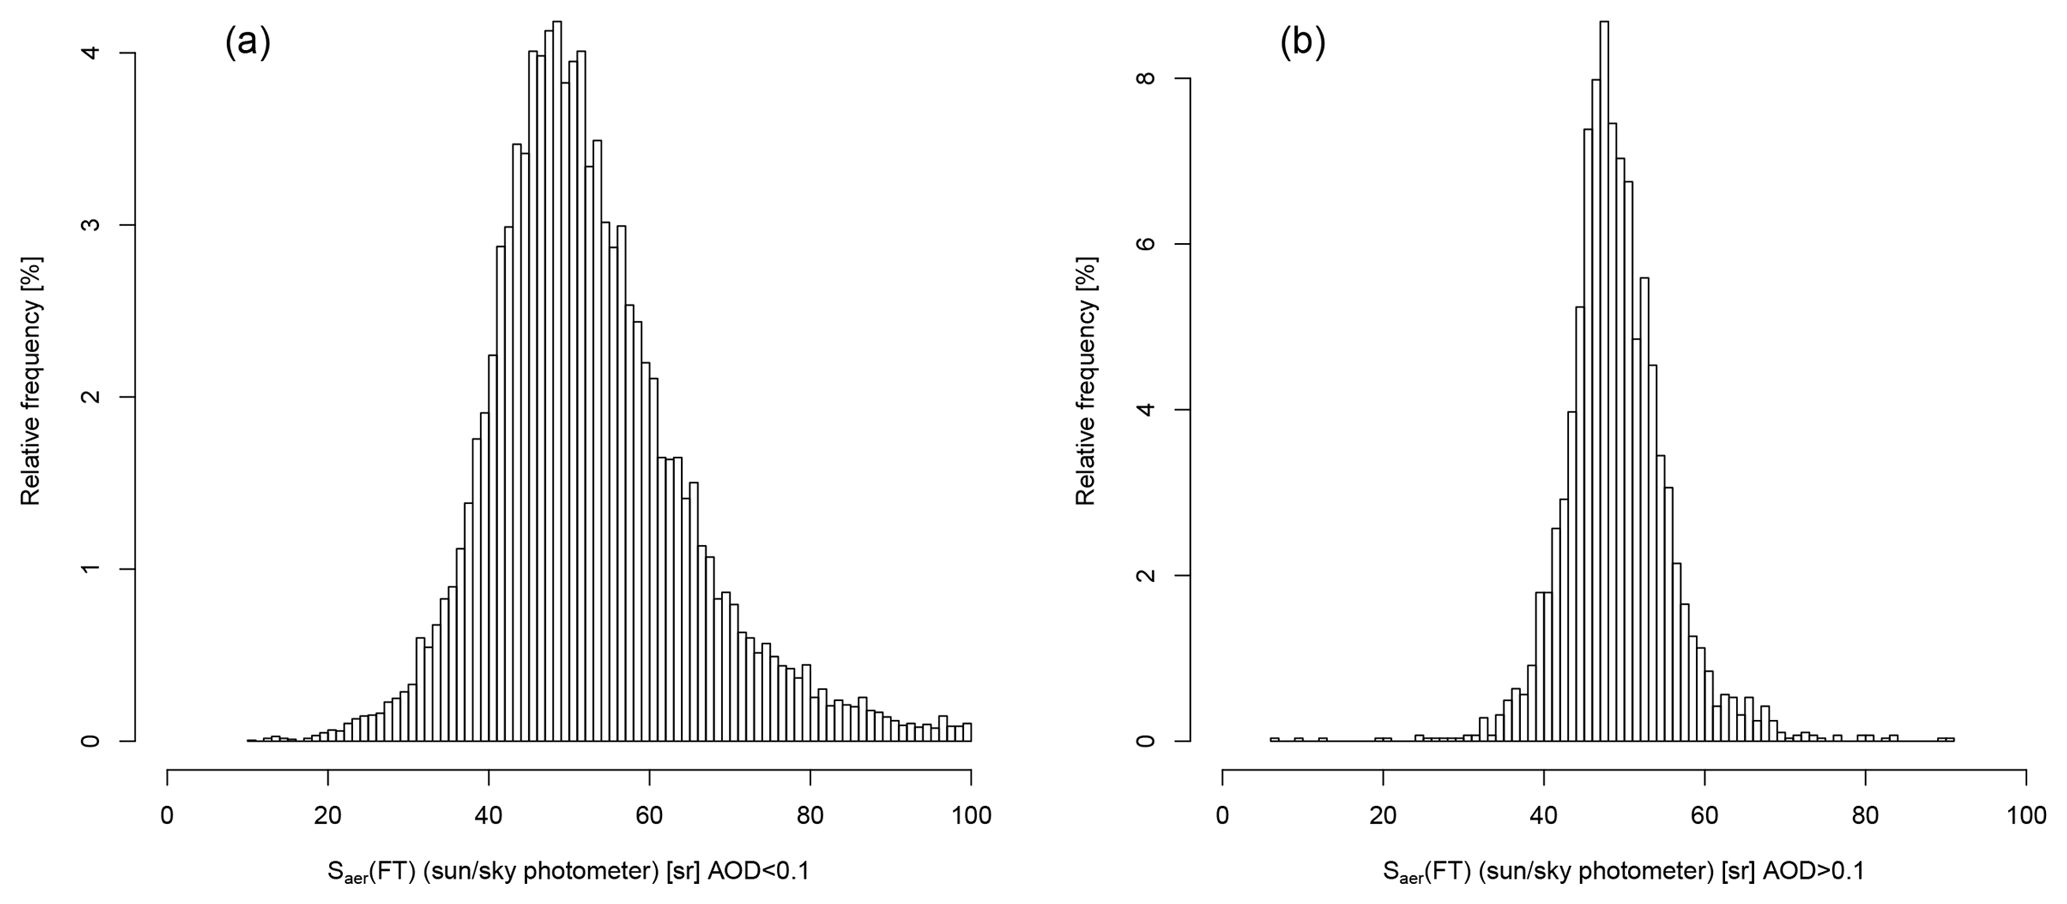
Figure 7Histograms of the lidar ratios at 523 nm obtained from the sun–sky photometer installed at Izaña for (a) AODIZO<0.1 and (b) AODIZO>0.1.
6.2 Lidar ratio characterization in the FT and in the MBL from MPL elastic data (the one- and the two-layer inversion techniques)
The lidar ratio obtained by means of the classic Fernald–Klett method, the one-layer method, is shown in Fig. 8a. Retrieved lidar ratios increase when AODSCO increases due to the presence of the SAL. However, the mean lidar ratio obtained using this method is 24±10 sr, which is close to the typical marine lidar ratio but far from the dust lidar ratio (Müller et al., 2007; Bréon, 2013). In the case of the two-layer inversion, Saer(FT) behaves in a very different way for AODIZO higher and lower than 0.1 (Fig. 8b). For high aerosol load conditions, Saer(FT) is distributed symmetrically around a mean value of 50 sr, with a standard deviation of 11 sr (Fig. 9a). However, for clean conditions (AODIZO<0.1), which is the common situation at the Izaña Observatory with 76 % of the data, the retrieved mean Saer(FT) is similar, 51 sr, but the results are more scattered, with a standard deviation of 19 sr, and sometimes it reaches values much higher than 100 sr. In this work, lidar ratios above 100 sr are considered out of the range commonly accepted in the bibliography (Weitkamp, 2005) and were eliminated from further analysis. The distribution of data for AODIZO<0.1 (Fig. 9a) is asymmetric, with a rather heavy tail for high lidar ratios. This higher dispersion in Fig. 9a should be, to a large extent, due to the uncertainty of the retrieval, as dispersion in Fig. 7a is very much lower. This uncertainty in the lidar ratio of the top layer for low AODIZO may affect the retrieval of the aerosol properties in the MBL since, as discussed in Sect. 5.3, it is used in the inversion of the lower layer between rl,max and rl. In order to avoid this undesired effect, Saer(FT) is fixed to 51 sr for clean conditions (AODIZO<0.1) and the inversion is repeated for the lower layer. The Saer(MBL) thus obtained is shown in Fig. 8c. The behaviour of Saer(MBL) is similar to that observed in the lidar ratio obtained with the one-layer method, but in this case we can see lower lidar ratios associated with AOD up to 0.2. This is because the lidar ratio and the AOD do not correspond exactly to the same layers. AODSCO−AODIZO refers to the layer from the sea level to the Izaña Observatory level, while Saer(MBL) refers to the layer up to rl.
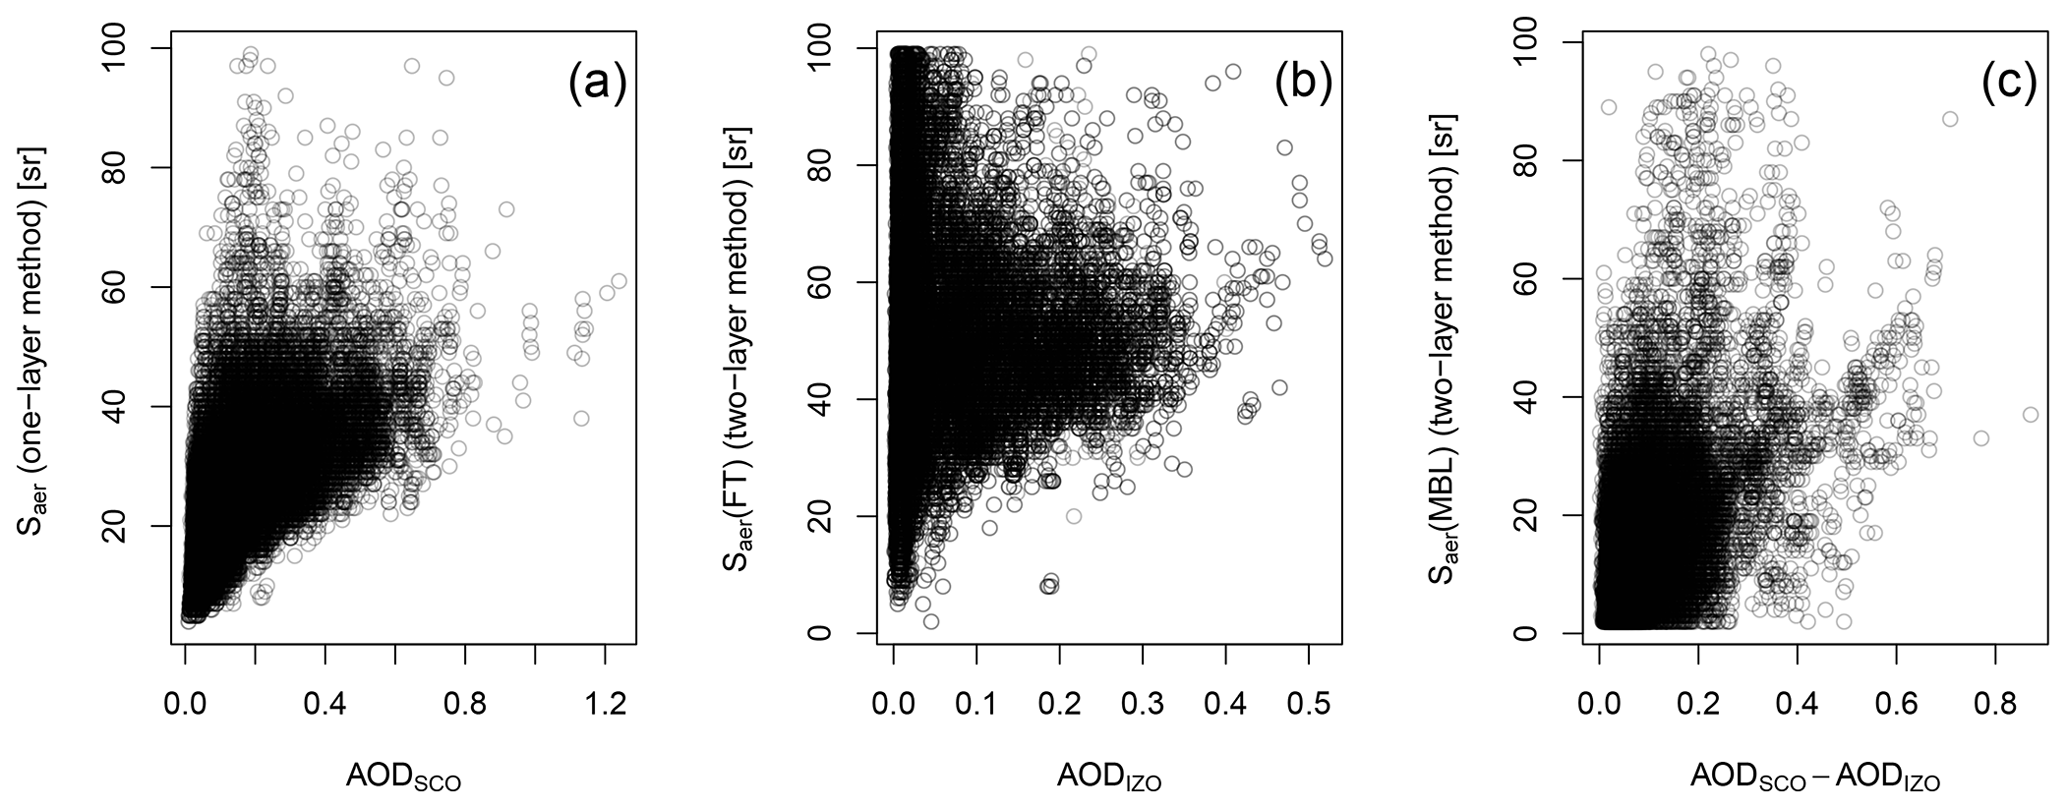
Figure 8Lidar ratio for (a) one-layer inversion, (b) two-layer inversion for the FT and (c) two-layer inversion for the MBL, all of them against AOD.
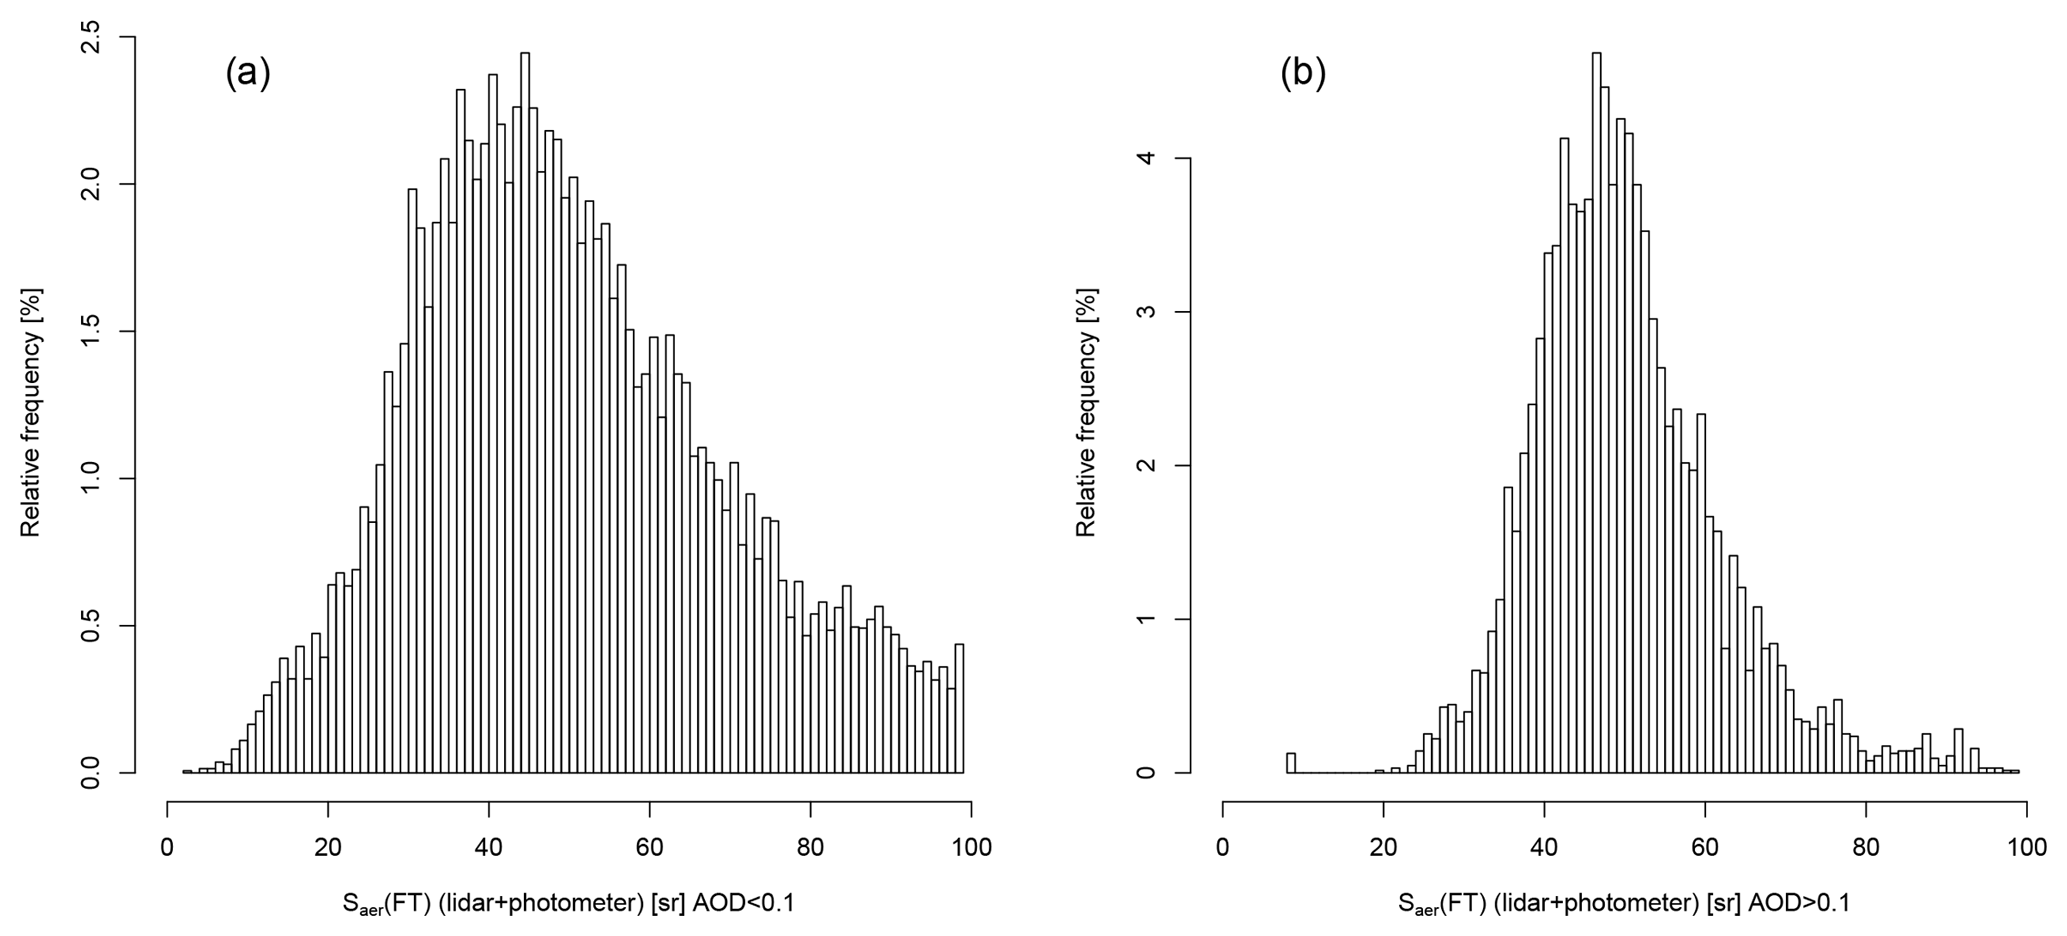
Figure 9Histograms of the FT lidar ratios at 523 nm obtained from two-layer inversion for (a) AODIZO<0.1 and (b) AODIZO>0.1.
These results are repeated throughout all years of the analysed decade. The lidar ratios estimated by the one-layer method (Fig. 10a) are midway between those obtained by the two-layer method (Fig. 10b) for the FT, dominated by mineral dust and the MBL.
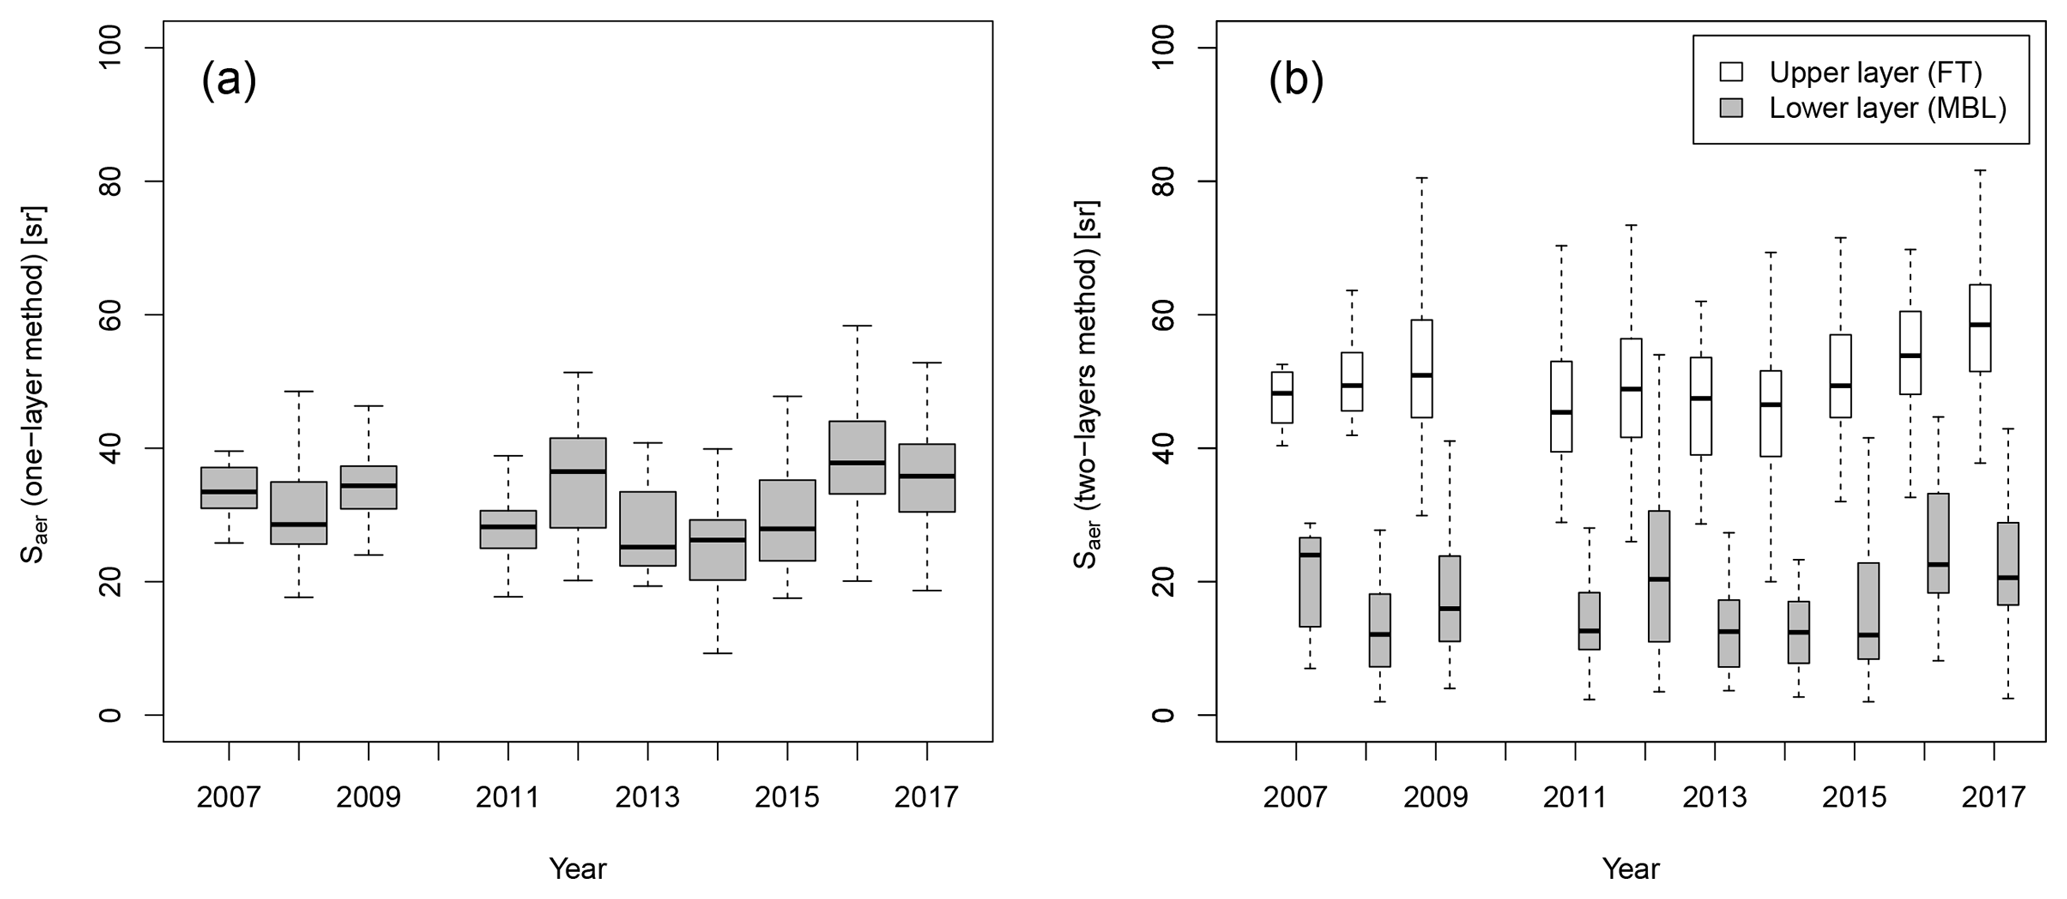
Figure 10Lidar ratio at 523 nm from (a) one-layer and (b) two-layer methods for each year between 2007 and 2017. The central rectangles extend from the first quartile to the third quartile and the median is represented by a horizontal line. The whiskers are defined as the upper and lower quartiles ±1.5 IQR (interquartile range).
6.3 Lidar ratio evaluation and comparison with previous studies
A summary of the mean and standard deviation of Saer obtained using the three inversion methods proposed in this study can be found in Table 2. The one-layer method provides a mean lidar ratio of 24 ± 10 sr, while the value retrieved for the lower layer in the two-layer method is lower (16 ± 11 sr). This last result is quite similar to the lidar ratio of North Atlantic marine aerosol of 18 ± 5 sr reported by Groß et al. (2013), who determined this value by means of airborne High Spectral Resolution Lidar (HSRL) observations. But compared with other lidar ratios found in the literature for marine aerosol (Müller et al., 2007; Haarig et al., 2017; Kim et al., 2018; Cattrall et al., 2005), the mean lidar ratio we obtain for the MBL is lower than expected. This could be related to higher uncertainties at low ranges due to overlap. Further analysis are needed to verify these lidar ratios. Cordoba-Jabonero et al. (2011) used the same MPL system at Santa Cruz de Tenerife in a case study, finding a columnar lidar ratio of 24 sr for non-dust conditions, which matches the value we give using the one-layer method, and 69 sr for mixed-dust conditions, much higher than the one we determined in our study. Cordoba-Jabonero et al. (2014) considering two layers found a lidar ratio of 43 sr for MBL under Saharan dust conditions using the same instrument as in this work. These widely varying lidar ratios reflect the difficulty of determining the lidar ratio at lower altitudes. The different methodologies and assumptions made in the different studies and the heterogeneity in aerosol composition at these altitudes, as well as the added problem of the higher uncertainties in ground-based elastic lidars at lower altitudes due to the overlap effect, prevent us from determining a reliable lidar ratio in the MBL.
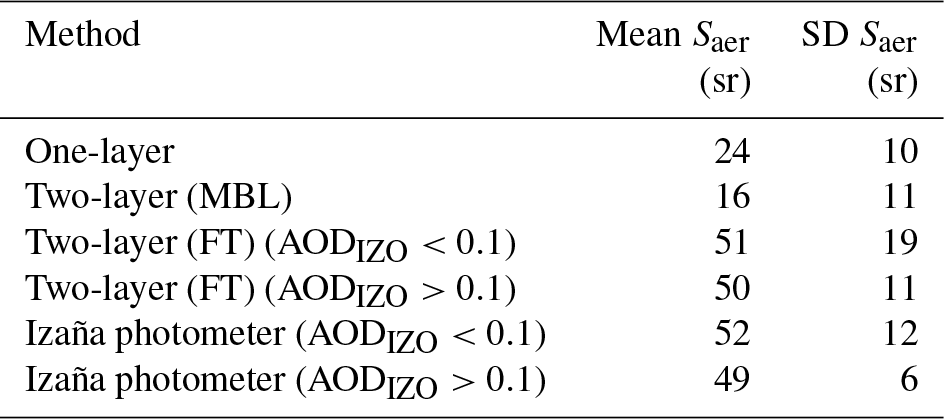
The comparison analysis between the lidar ratio in the FT (Saer(FT)) from the two-layer method and the value derived independently from the sun–sky photometer at Izaña Observatory in the 10-year time period of this study is presented in Fig. 11. Since both methods use different measurements done by the photometer at Izaña (direct sun and sky measurements), there are no simultaneous measurements and therefore daily means are calculated for both series and coincident values are chosen. Saer(FT) values of 52 ± 12 and 49 ± 6 sr for low- and high-AOD conditions, respectively, were retrieved from the sun–sky photometer (Table 2). Similar values of 51 ± 19 and 50 ± 11 sr were obtained from the two-layer method. As can be seen, the mean discrepancy between the methods calculated in this way is 1 sr, confirming the consistency of the Saer(FT) obtained with the two methods throughout a decade. These results are in very good agreement with the value of 48 ± 5 sr found by Groß et al. (2013) for pure dust using airborne HSRL observations performed in a region near the Canary Islands. Cordoba-Jabonero et al. (2014) found a higher Saer(FT) of 56 sr with a two-layer approach using the same instrument as in this work but with a different data processing. All these results are considerably higher than the lidar ratio assigned for mineral dust in the CALIOP aerosol classification algorithm (44 ± 9 sr). This underestimation of the CALIOP lidar ratio for dust has been shown in other studies (Papagiannopoulos et al., 2016, and references herein).
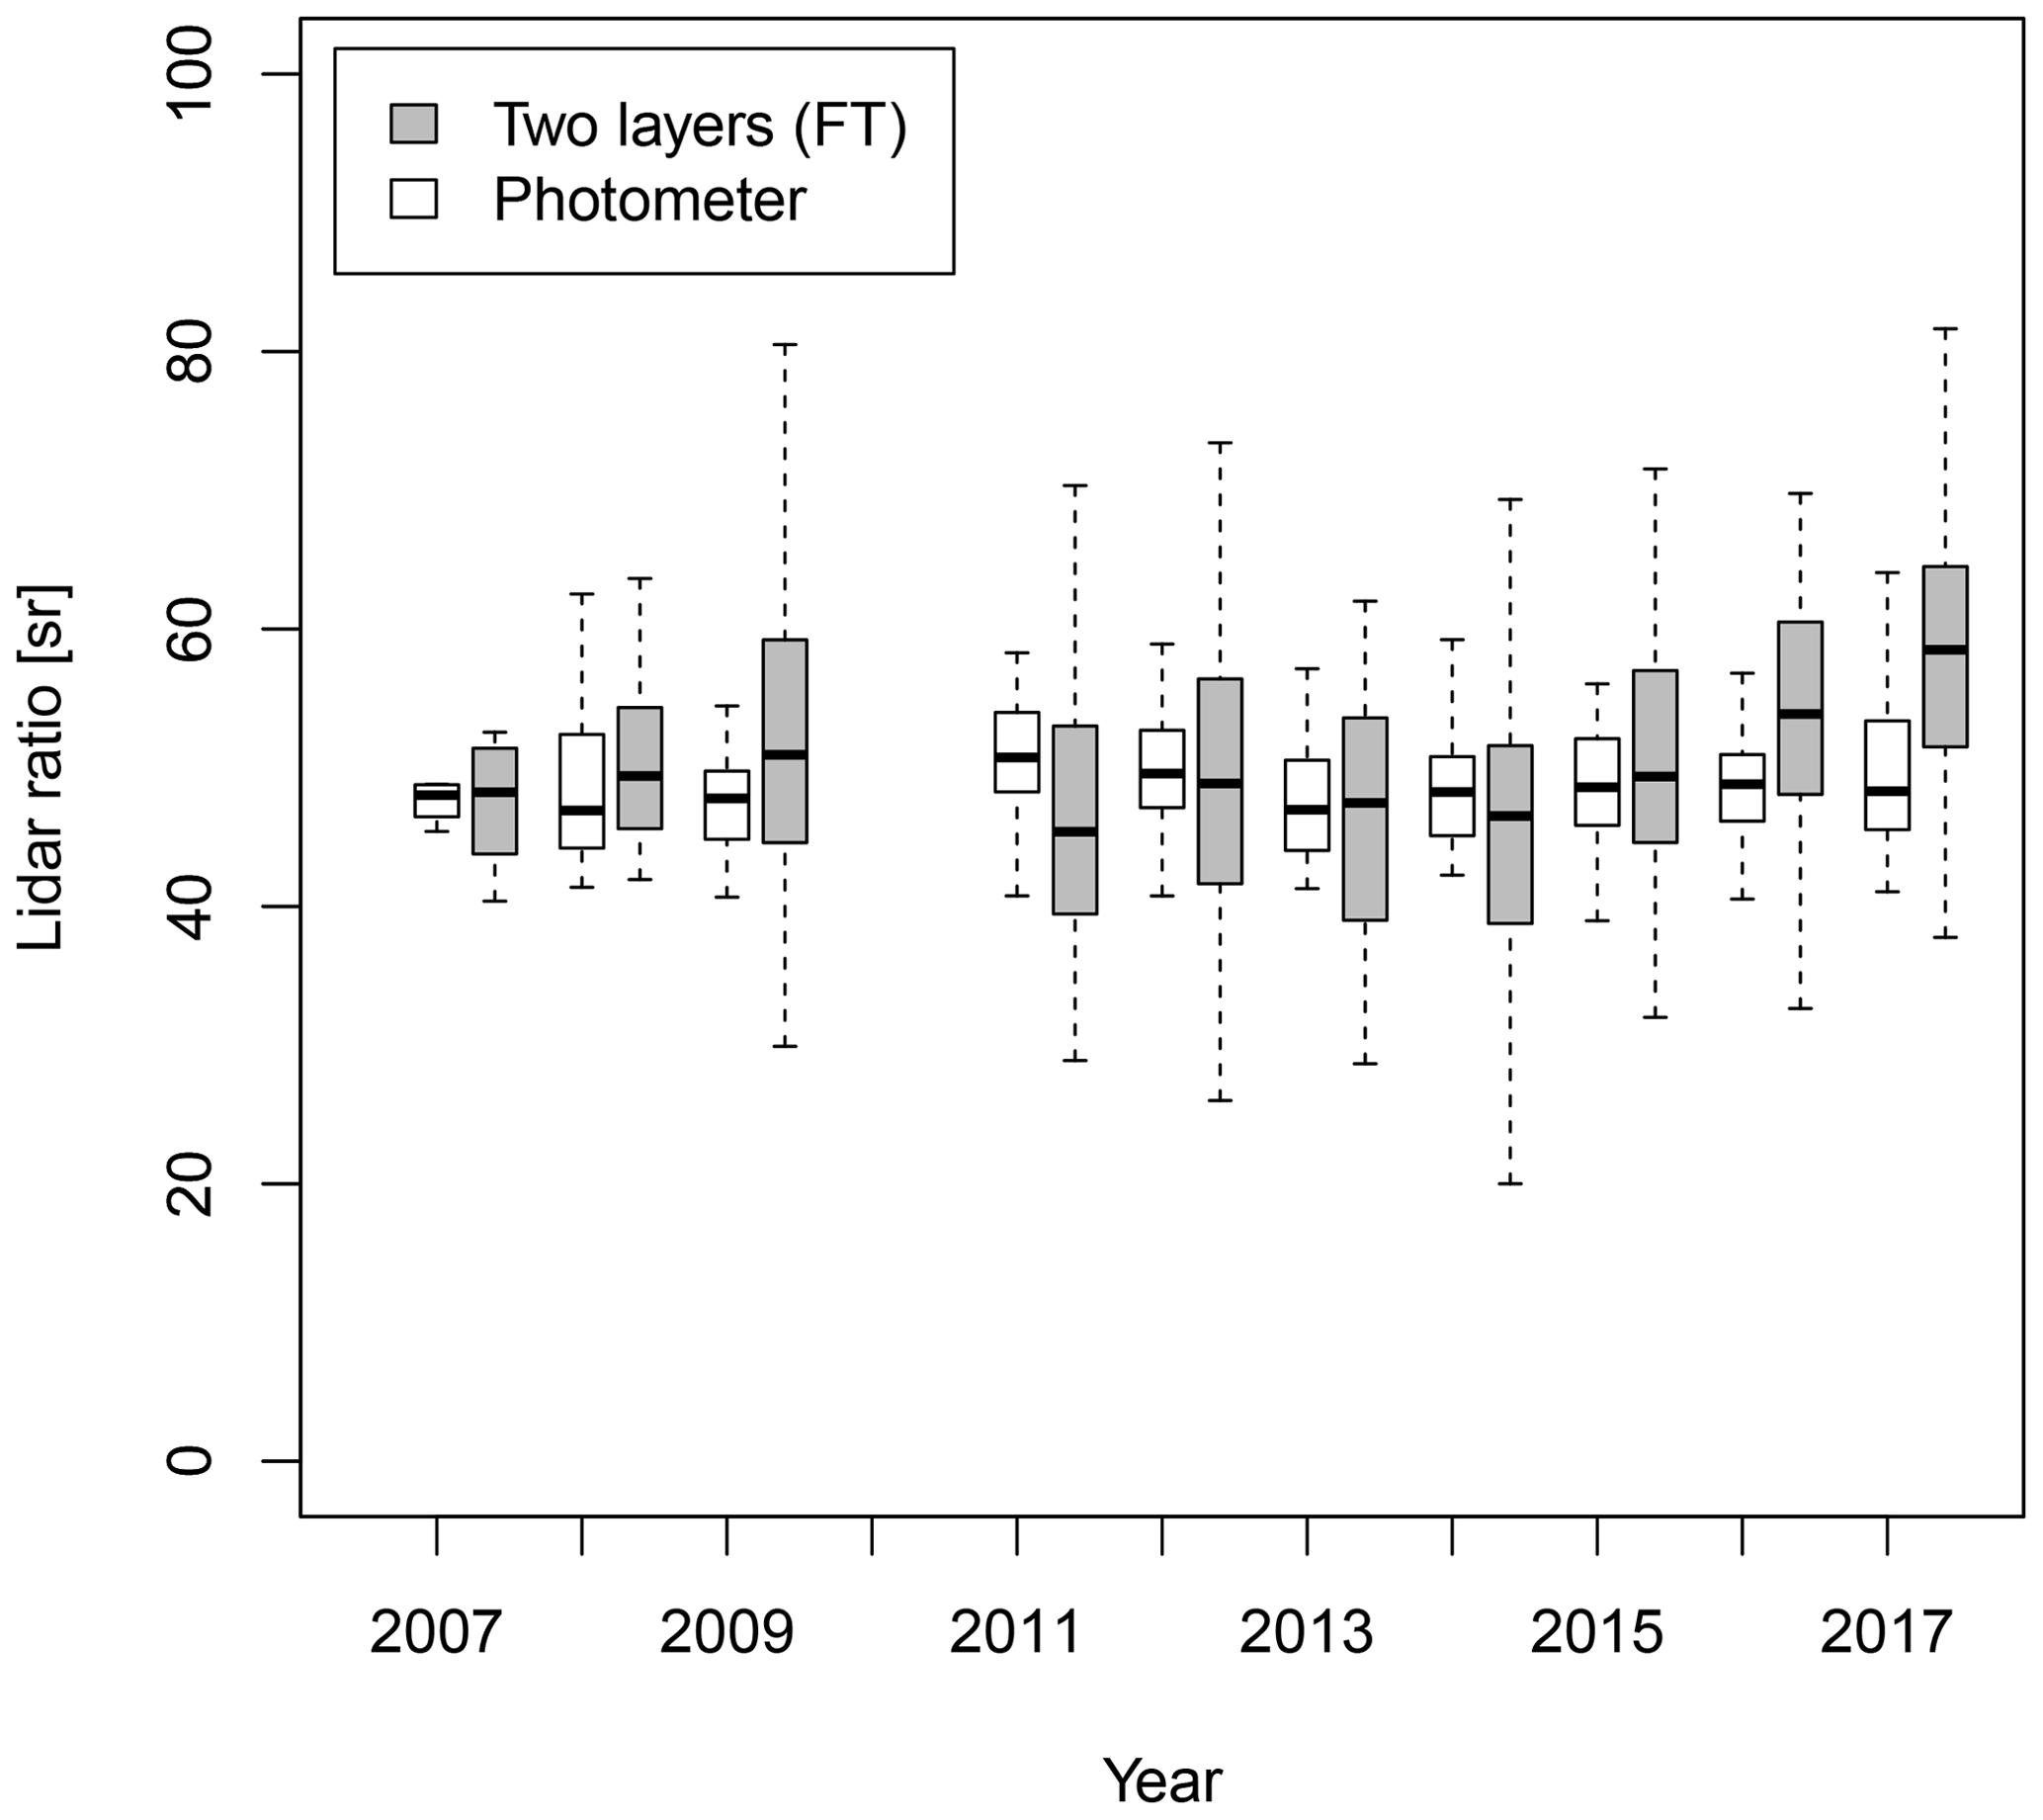
Figure 11Upper layer lidar ratio from two-layer method (gray boxes) and from Aeronet inversion of the sun photometer data at Izaña Observatory (white boxes), for each year between 2007 and 2017. The central rectangles extend from the first quartile to the third quartile and the median is represented by a horizontal line. The whiskers are defined as the upper and lower quartiles ±1.5 IQR (interquartile range).
A higher dispersion in the Saer(FT) calculated from both sun-photometry and MPL data is observed for clean conditions. This larger dispersion may be due to the uncertainty associated with the low aerosol load or to the characteristics of the residual aerosol that is present in these cases.
6.4 Assessment of the impact of using a constant range-independent lidar ratio in the inversion algorithm
Our results indicate that the conceptual model presented in the two-layer method, with two lidar ratios associated with the two different layers which are easily identifiable at this subtropical site, is a more reliable approach for retrieving the FT lidar ratio in this region than the common one-layer approach. However, the impact of choosing one of these two approaches on the aerosol vertical profile after inversion is still unclear. A comparison analysis based on βaer(r) and σaer(r) calculated using the one- and the two-layer methods in such relevant measurement period has been used to assess the inaccuracies that we could be committing on the aerosol vertical profile by using the classical one-layer method.
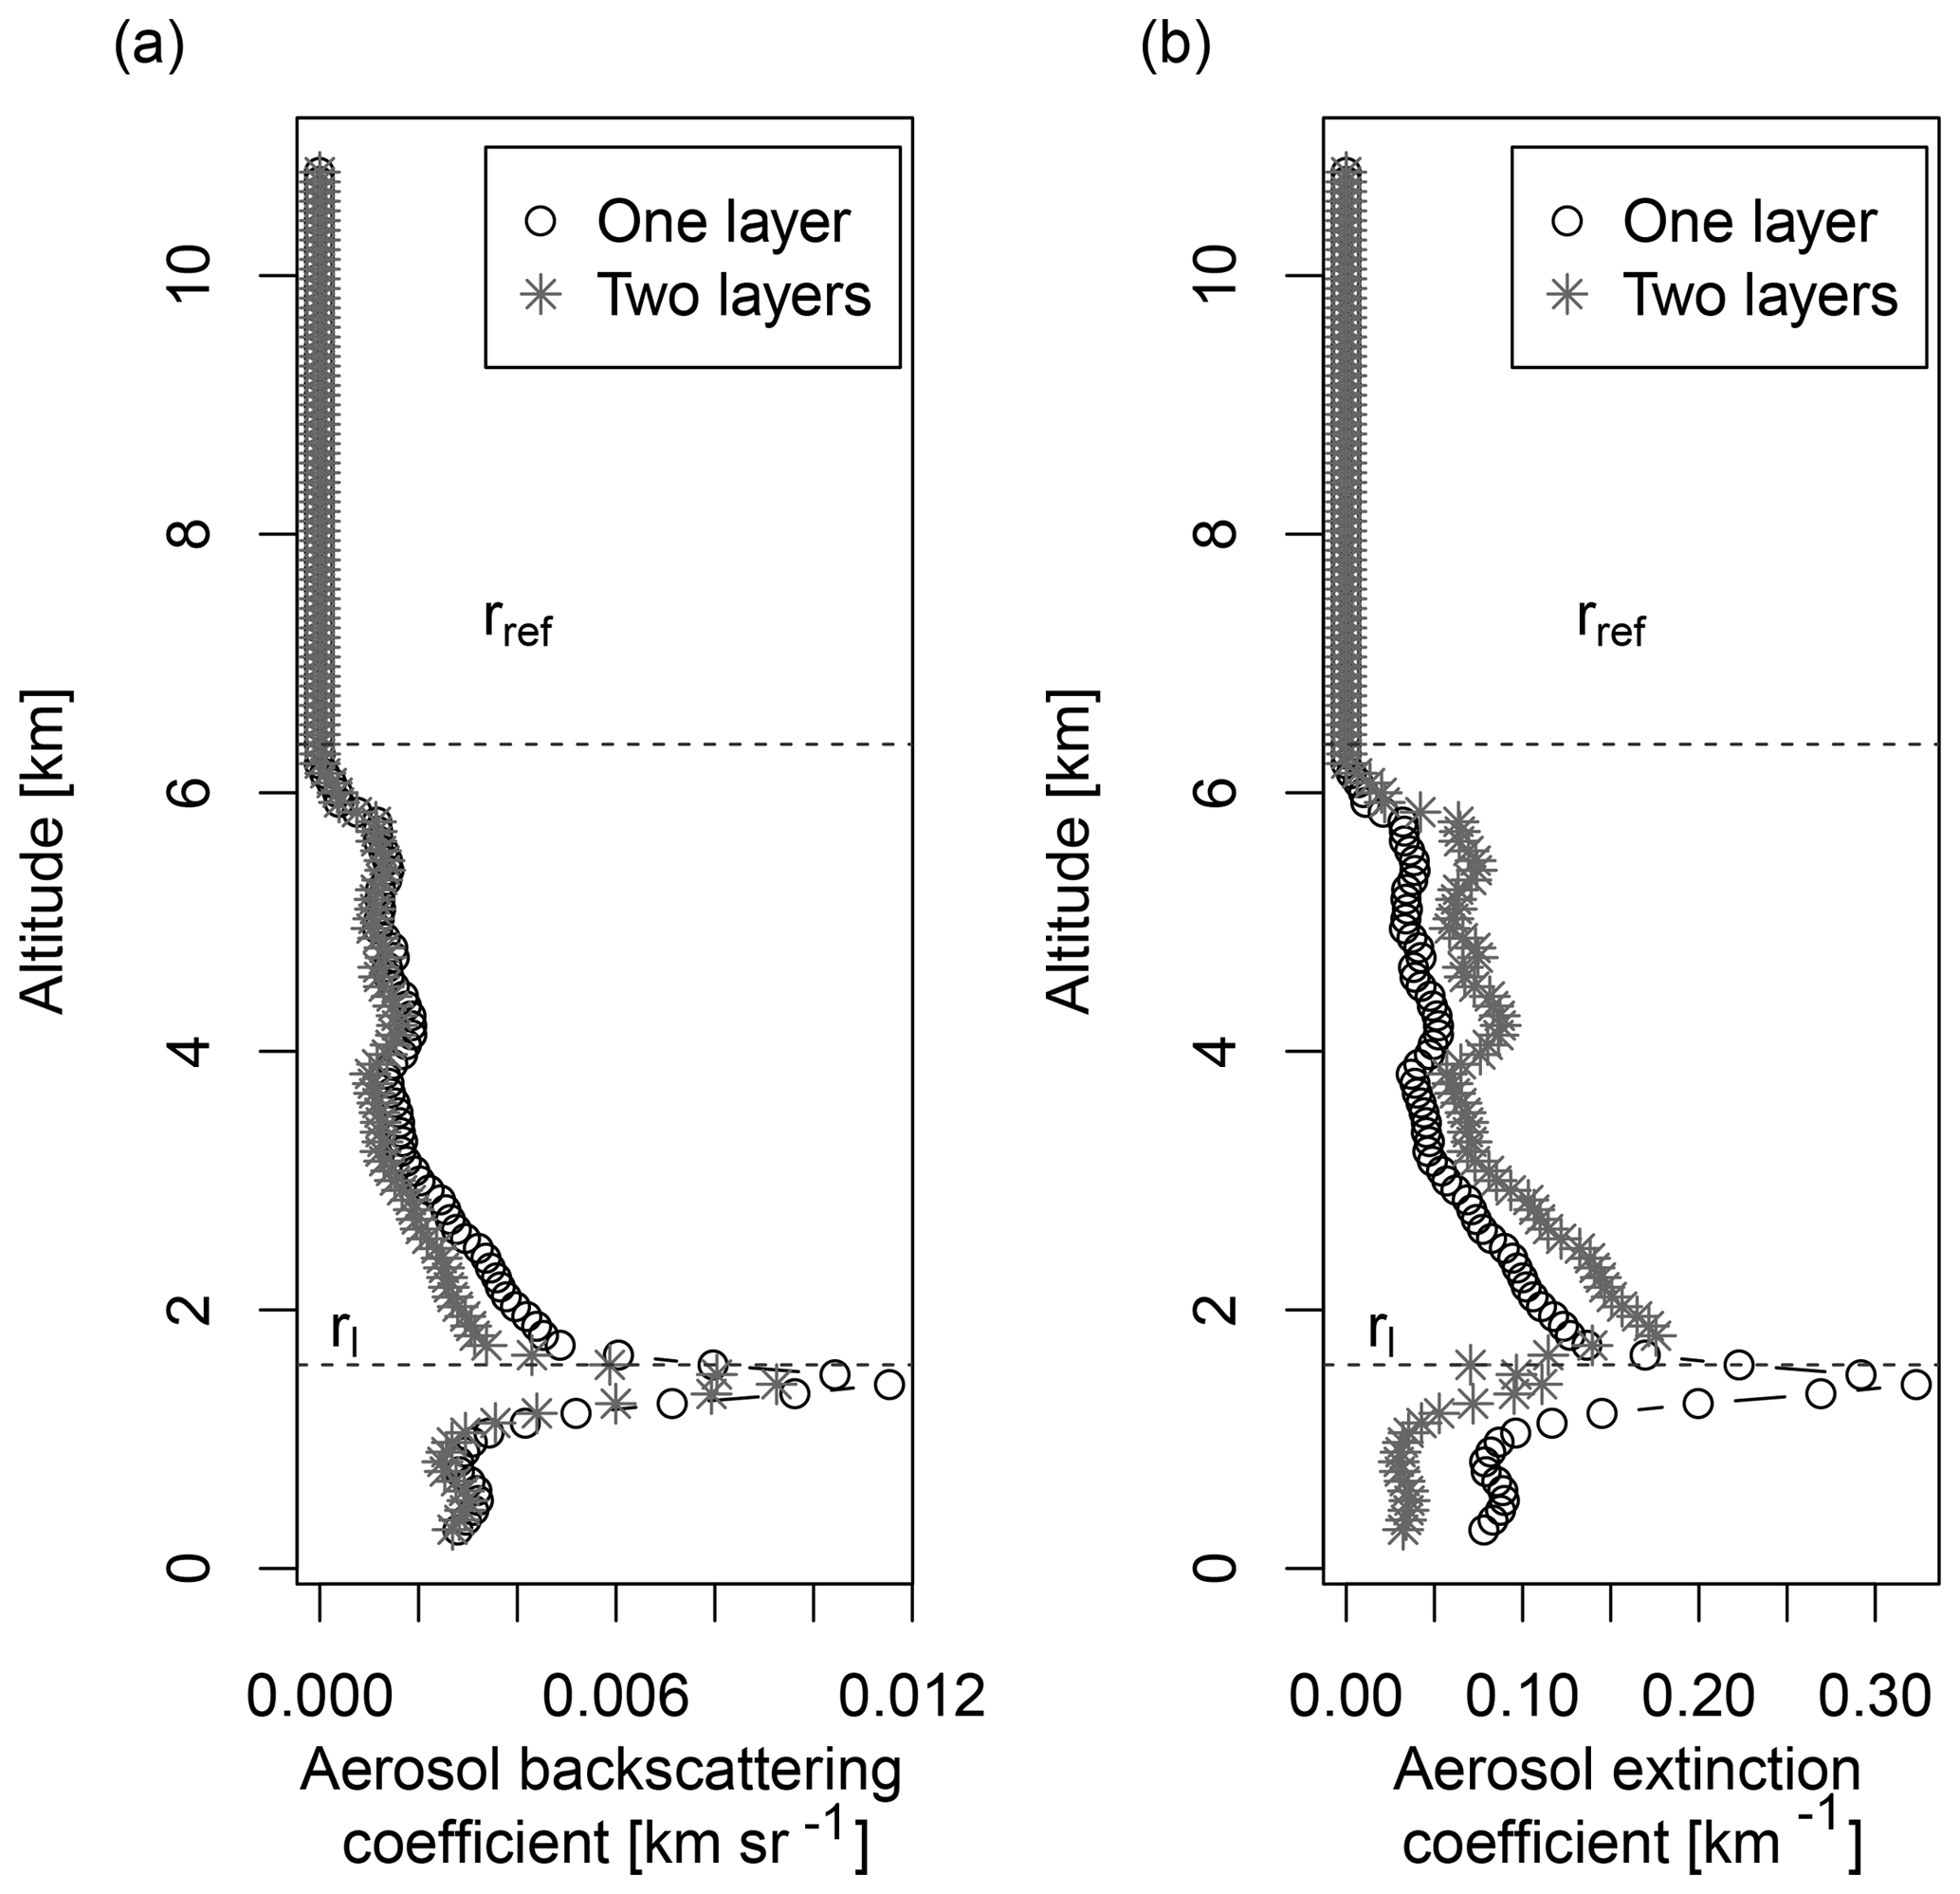
Figure 12Example of the extinction and backscattering coefficients under dust conditions obtained by using one- and two-layer methods applied to a lidar profile made on 5 August 2013 (AODSCO=0.46). Upper limits of the MBL (rl) and FT (rref) are represented by horizontal dashed lines.
Some examples of the extinction and backscattering coefficients profiles extracted under different aerosol loading scenarios are first presented to give evidence of the differences between these two inversion techniques. Figure 12 shows βaer(r) and σaer(r) profiles for a moderate Saharan dust outbreak (AODSCO=0.46 and AODIZO=0.28 at 523 nm), retrieved on 5 August 2013, with the one- and the two-layer methods. This is an example of a moderate dust outbreak in which dust is vertically distributed up to 6 km. A higher βaer(r) along the whole profile is retrieved for the one-layer inversion, with a maximum difference at about rl and the same values for the minimum range and rref. Regarding the aerosol extinction profile, the differences between the aerosol extinction profiles obtained by the two methods are readily apparent. The one-layer method underestimates σaer(r) in the FT and overestimates σaer(r) in the MBL. The peak near rl in σaer(r) retrieved from this method, due to the proportionality with βaer(r), almost disappears in the profile retrieved with the two-layer method. Nevertheless, a small discontinuity remains at rl height, maybe due to our Saer(r) approximation between rl and rl,max. Another example of the retrieval by both methods, in this case for clean conditions (AODSCO=0.10 and AODIZO=0.006 atr 523 nm), is shown in Fig. 13. This example corresponds to 27 December 2012, when there were pristine conditions above the MBL. In this case the results from both methods are more similar, with the most noticeable difference between them being found in the residual aerosol above the MBL, where the aerosol extinction coefficient is underestimated in the case of the one-layer method. Aerosol extinction coefficient at lower levels are also slightly overestimated by the one-layer method. Finally, Fig. 14 shows an example of retrieval under heavy dust intrusion on 28 June 2012 (AODSCO=0.82 and AODIZO=0.48 at 523 nm). In this case, most of the aerosol in both layers is dust, and the lidar ratio obtained by the one- and the two-layer methods is very similar. We can conclude from this preliminary comparison analysis that the classical one-layer approach, under conditions like those studied in this work, underestimates the aerosol extinction profile in the FT for clean conditions and moderate Saharan dust outbreaks, while overestimating aerosol extinction in the MBL. It is precisely under these conditions that the lidar ratio is expected to be range dependent. Clean conditions are associated with marine aerosols as the dominant aerosol in the MBL, while dust is expected to be the dominant aerosol in the FT. Moderate dust outbreaks affecting the Santa Cruz de Tenerife station, which mainly occur during winter, are associated with dust and marine as the dominant aerosols in the MBL, with almost-pure dust as the dominant aerosol in the FT. On the contrary, strong dust outbreaks, although less frequent, result in a strong impact of dust on both the MBL and the FT, with dust being the dominant aerosol in the lower troposphere. A range-independent lidar ratio is therefore a plausible approximation under these conditions.
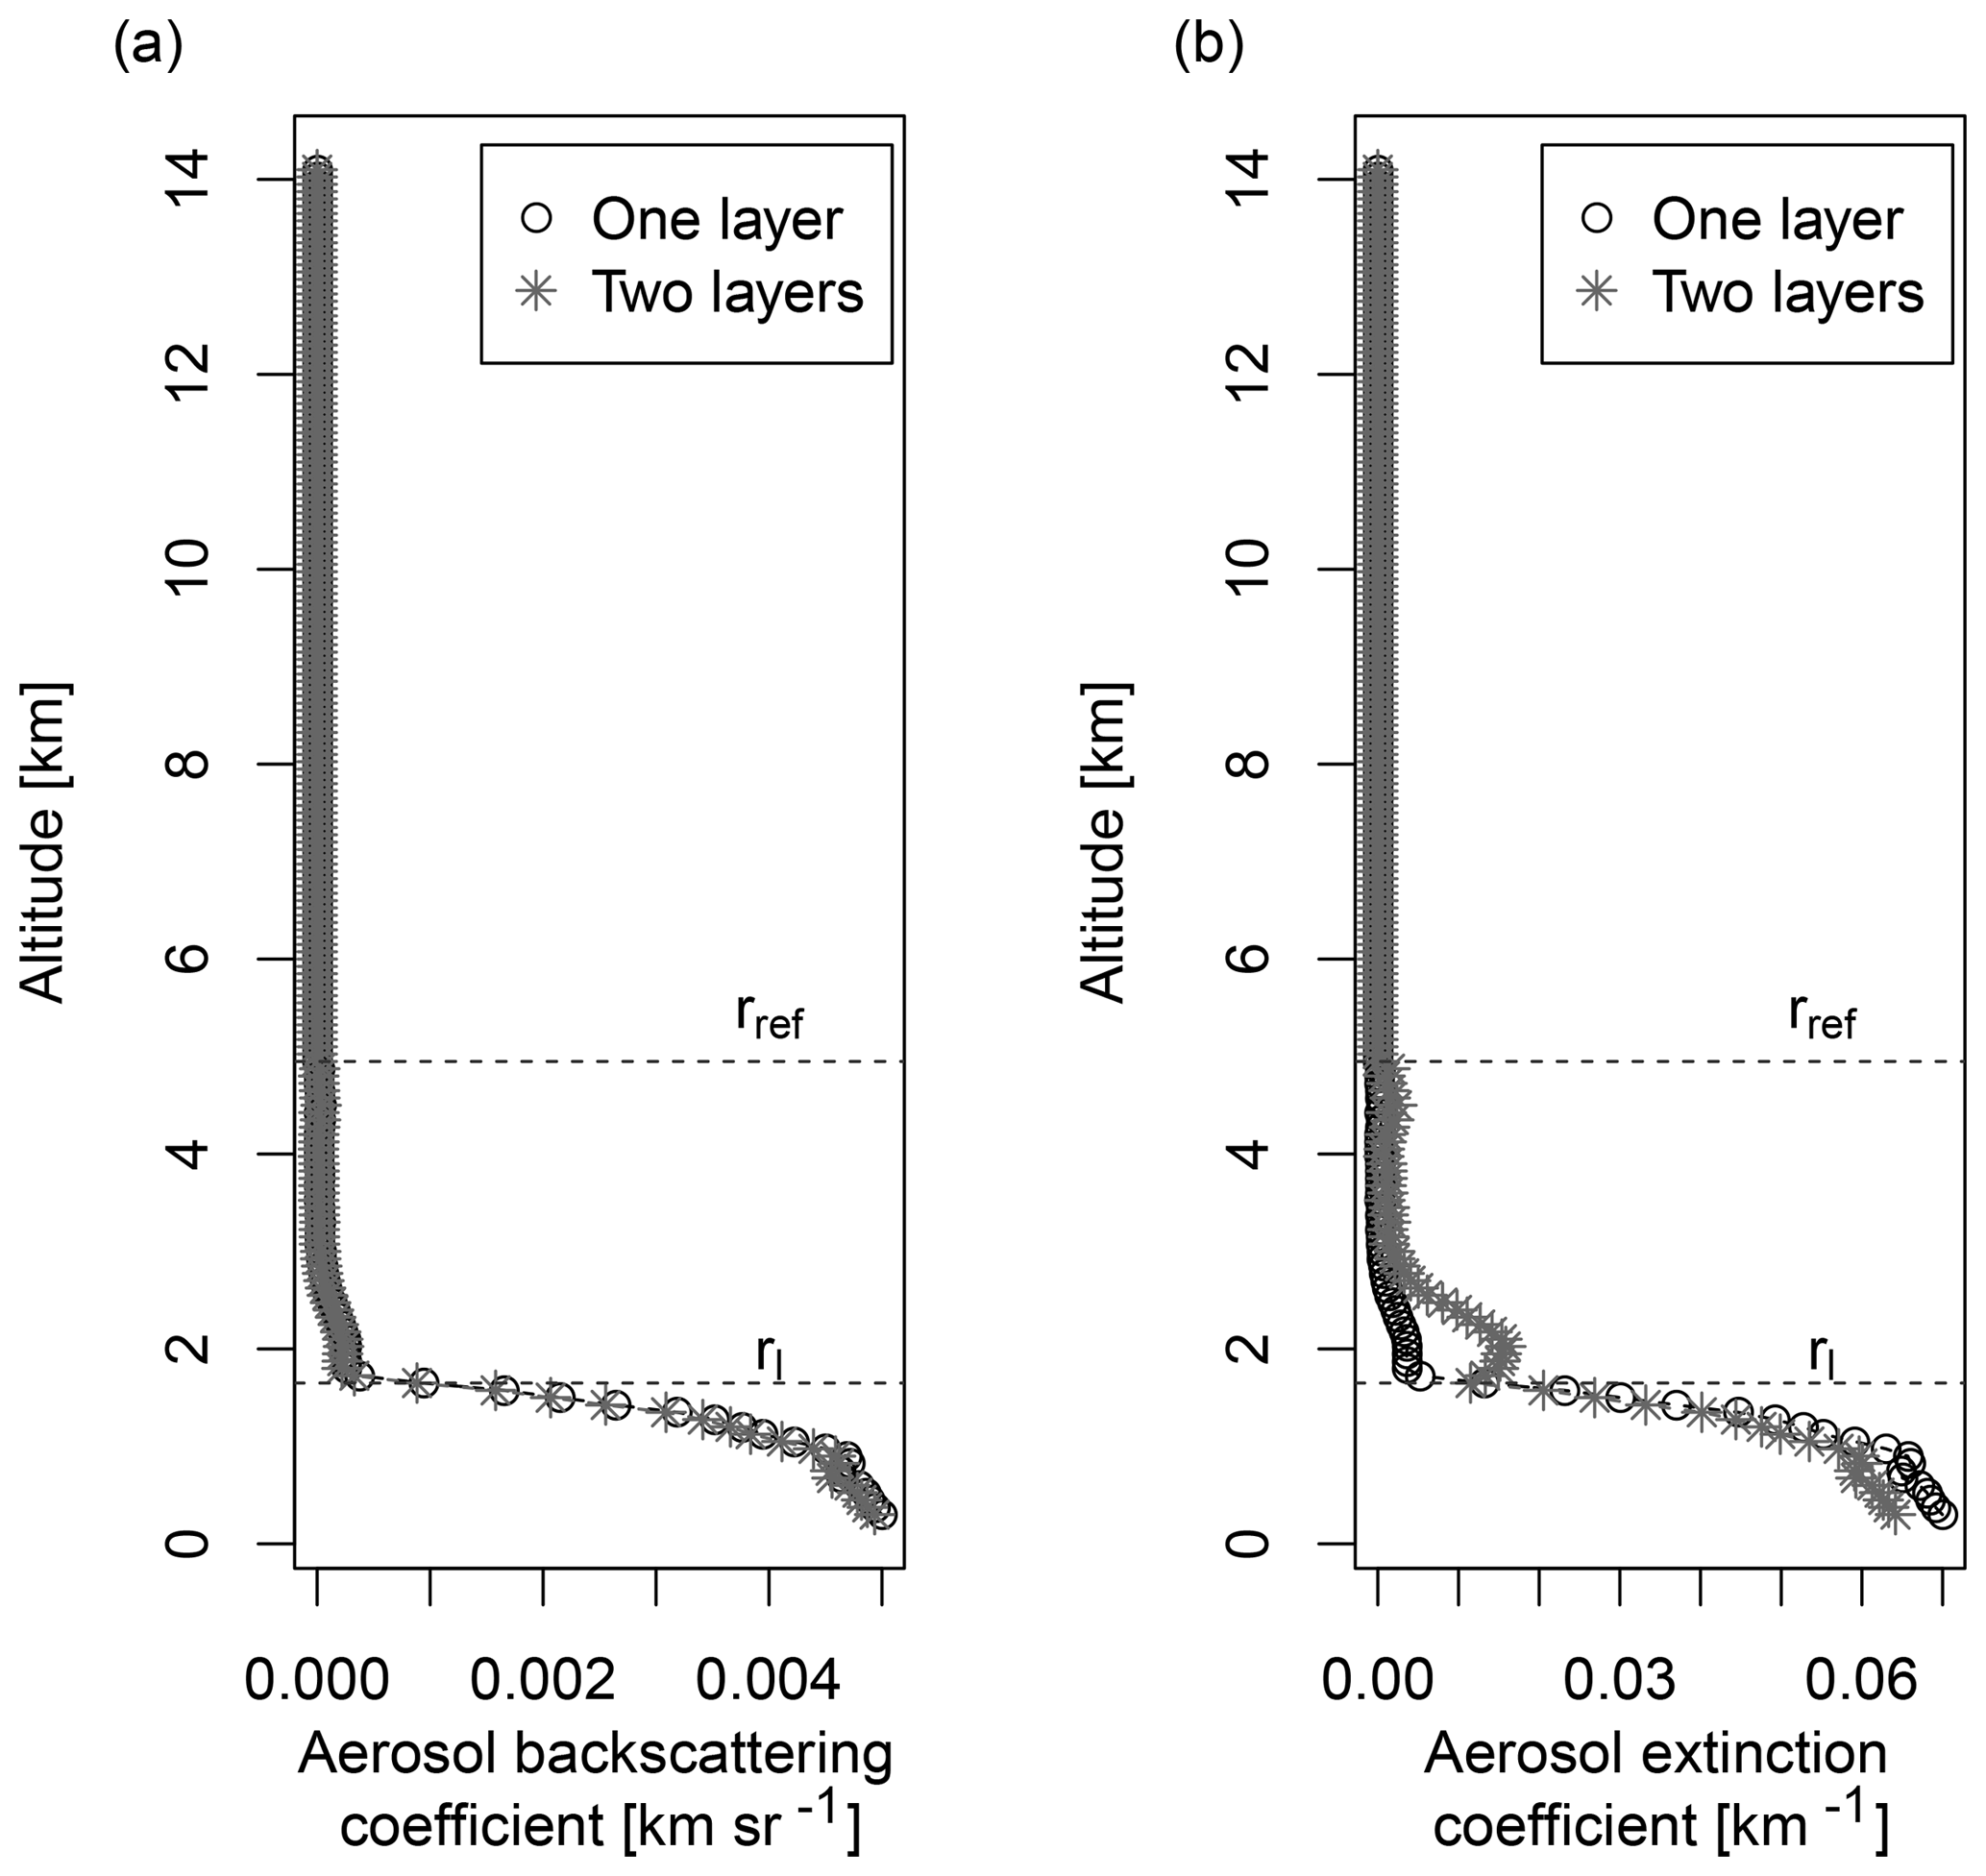
Figure 13Example of the extinction and backscattering coefficients under clean conditions obtained by using one- and two-layer methods applied to a lidar profile made on 27 December 2012 (AODSCO=0.10). Upper limits of the MBL (rl) and FT (rref) are represented by horizontal dashed lines.

Figure 14Example of the extinction and backscattering coefficients under heavy aerosol load conditions obtained by using one- and two-layer methods applied to a lidar profile made on 28 June 2012. Upper limits of the MBL (rl) and FT (rref) are represented by horizontal dashed lines.
The main statistics of the βaer(r) and σaer(r) differences between the two lidar inversion methods have been calculated for the period 2007–2017 and presented in Fig. 15. The σaer(r) difference shows a median value of about 92 % at surface level and −25 % above the thermal inversion, and the βaer(r) difference shows a median value up to 21 %. Maximum σaer differences are found at surface level, where ∼ 25 % of the single-layer inversions overestimate σaer by more than 200 %. These results represent a quantification of the impact of using a range-independent lidar ratio in the subtropical North Atlantic, where two well-differentiated layers in the vertical constitute a meteorological feature of the lower troposphere.
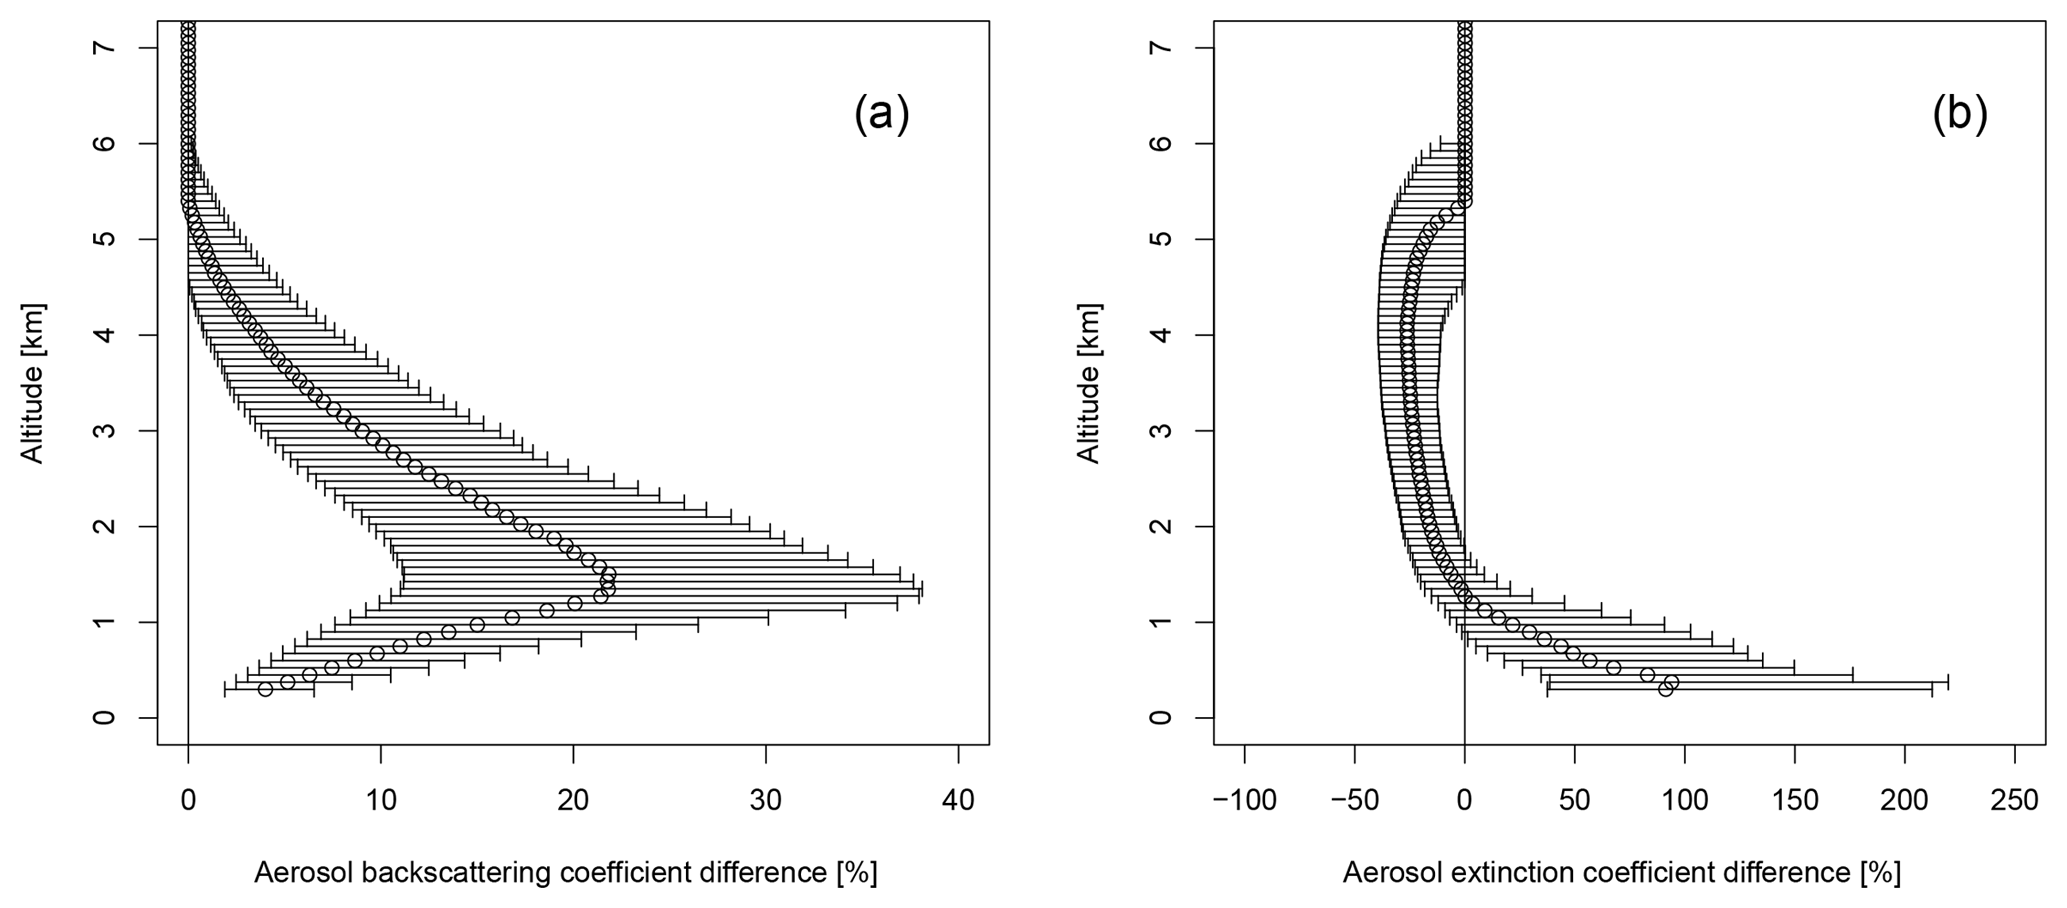
Figure 15Statistics of the differences of extinction and backscattering coefficients obtained by using one- and two-layer methods. For each altitude, median difference, first and third quartile are shown.
6.5 Analysis of the lidar ratio dependence with particle size for almost pure dust
Good knowledge of the possible correlation between lidar ratio and particle size of pure mineral dust might help in the optical properties retrieval or provide useful information for aerosol classification algorithms. As an intensive aerosol property, the dust lidar ratio is independent of aerosol loading and is strongly dependent on the mineral dust microphysical properties. Therefore, a lack of correlation between Saer(FT) and AODIZO could be anticipated. However, since the AOD regime at Izaña is strongly associated with different dominant modes in particle size distribution (varying from a dominant fine mode under clean conditions to a dominant coarse mode under Saharan dust outbreaks), this lack of expected correlation may be questioned. The previous analysis has been extended for different intervals of AODIZO, including a lidar ratio statistic of the two inversion methods. Both methods are able to extract a stable Saer(FT) with AOD, especially for AODIZO>0.1, where the results are almost independent of the aerosol load, as can be seen in Fig. 16. A lower dispersion is clearly observed in the lidar ratio from the sun–sky photometer at Izaña in addition to a small increase in Saer(FT) for clean conditions.
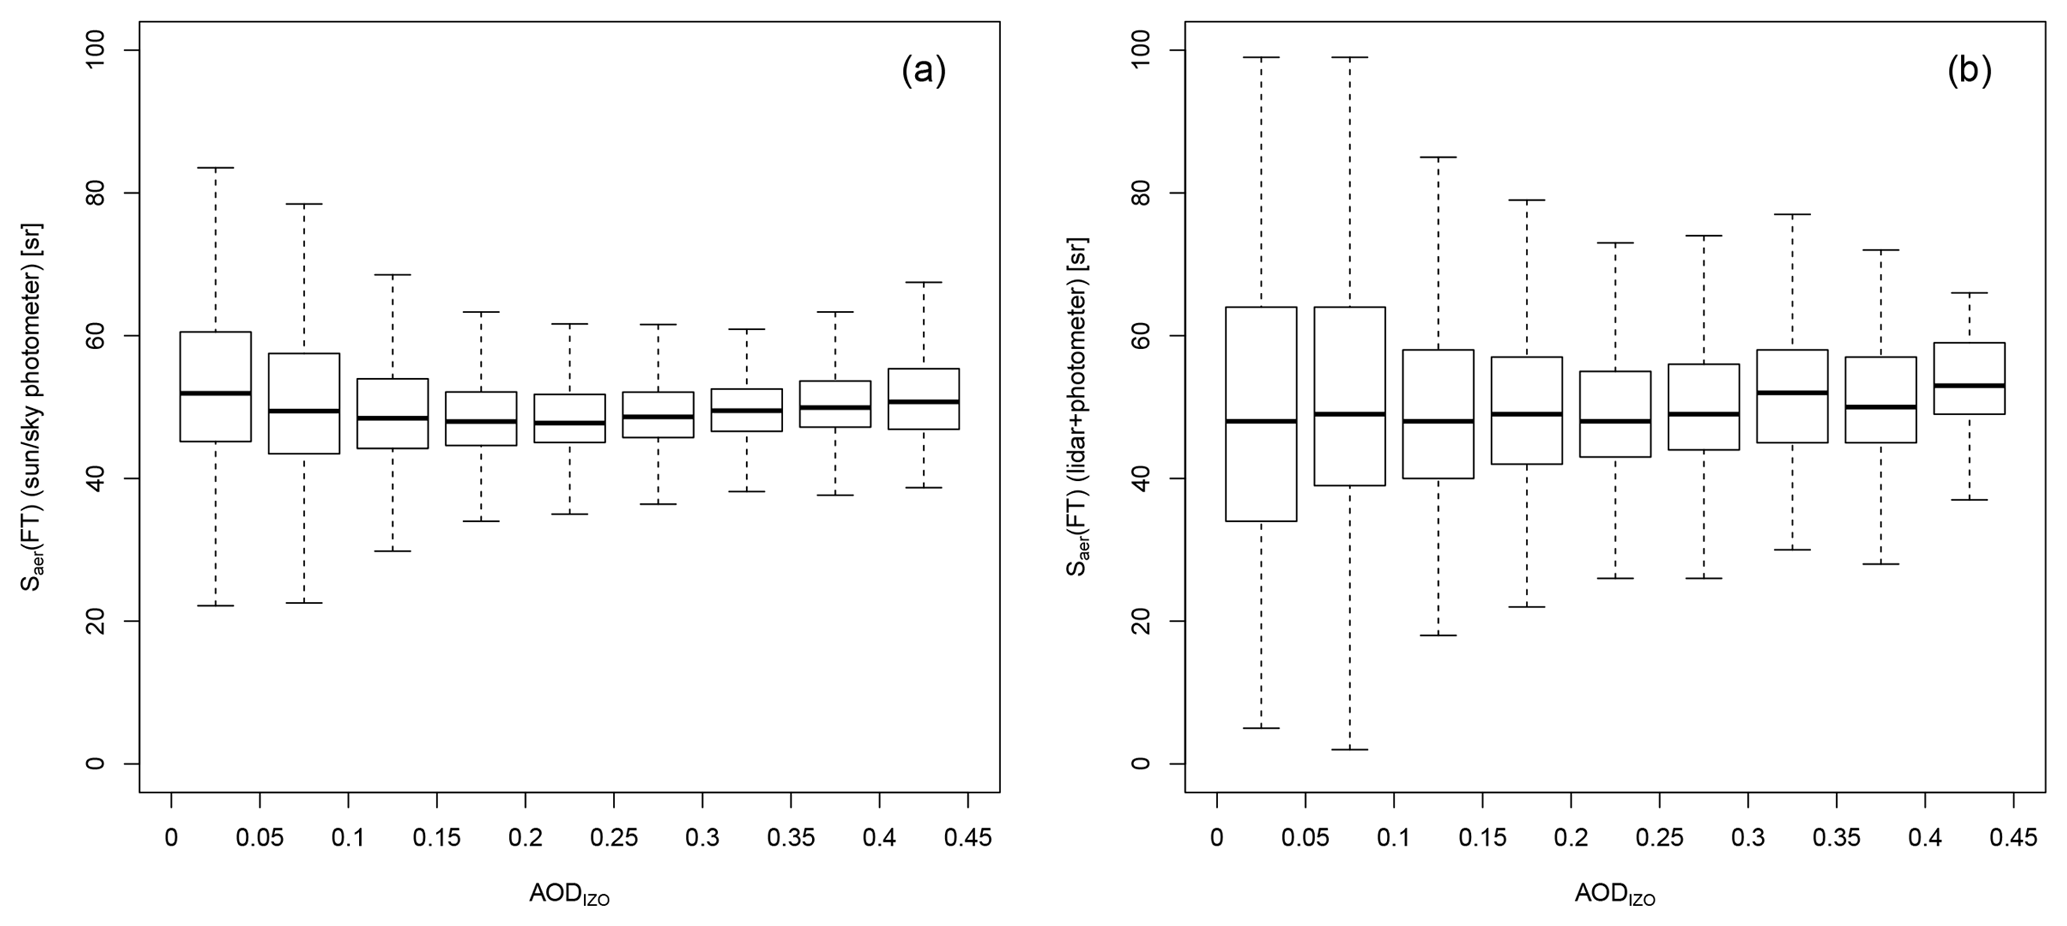
Figure 16Lidar ratios at 523 nm obtained from (a) the sun–sky photometer installed at Izaña and from (b) two-layer inversion for the FT for different AODIZO intervals. The central rectangles extend from the first quartile to the third quartile and the median is represented by a horizontal line. The whiskers are defined as the upper and lower quartiles ±1.5 IQR (interquartile range).
The Ångström exponent is also an important optical parameter which is related to particle size. As Song et al. (2018) stated, a close relationship between the lidar ratio and Ångström exponent can be anticipated for certain types of aerosols. The correlation between these two parameters reflects the possible relationship between the directional characteristics of the light scattered and particle size. We have focused on the relationship between the Ångström exponent, α, and lidar ratio for dust, and therefore we have restricted the Ångström exponent to α<0.6 conditions according to the criterion presented in Cuevas et al. (2015a) for dust as the dominant aerosol. To this end, we have used information on the Ångström exponent extracted from the sun–sky photometer at Izaña and lidar ratios from sun–sky photometry (Fig. 17a) and from the two-layer method (Fig. 17b) in the same 10-year time period (2007–2017). Figure 17a and b show that lidar ratio for mineral dust as dominant aerosol (α<0.6) is almost independent on α. This figure shows median values ranging from 46.4 to 49.6 for Saer(FT) calculated from the sun–sky photometer and from 46 to 50 for Saer(FT) retrieved using the two-layer method. These results differ from those found by other authors (Song et al., 2018; Mona et al., 2014; Balis et al., 2004), who found some correlation between these two optical parameters. Song et al. (2018) found a strong correlation between lidar ratio and α for desert aerosol using a synthetic database theoretically generated using Mie scattering theory, while Mona et al. (2014) and Balis et al. (2004) found anticorrelations between them for lofted Saharan dust plumes using Raman lidar measurements at Potenza and Thessaloniki, respectively. These latter results were attributed to a probable mixture of different aerosols.
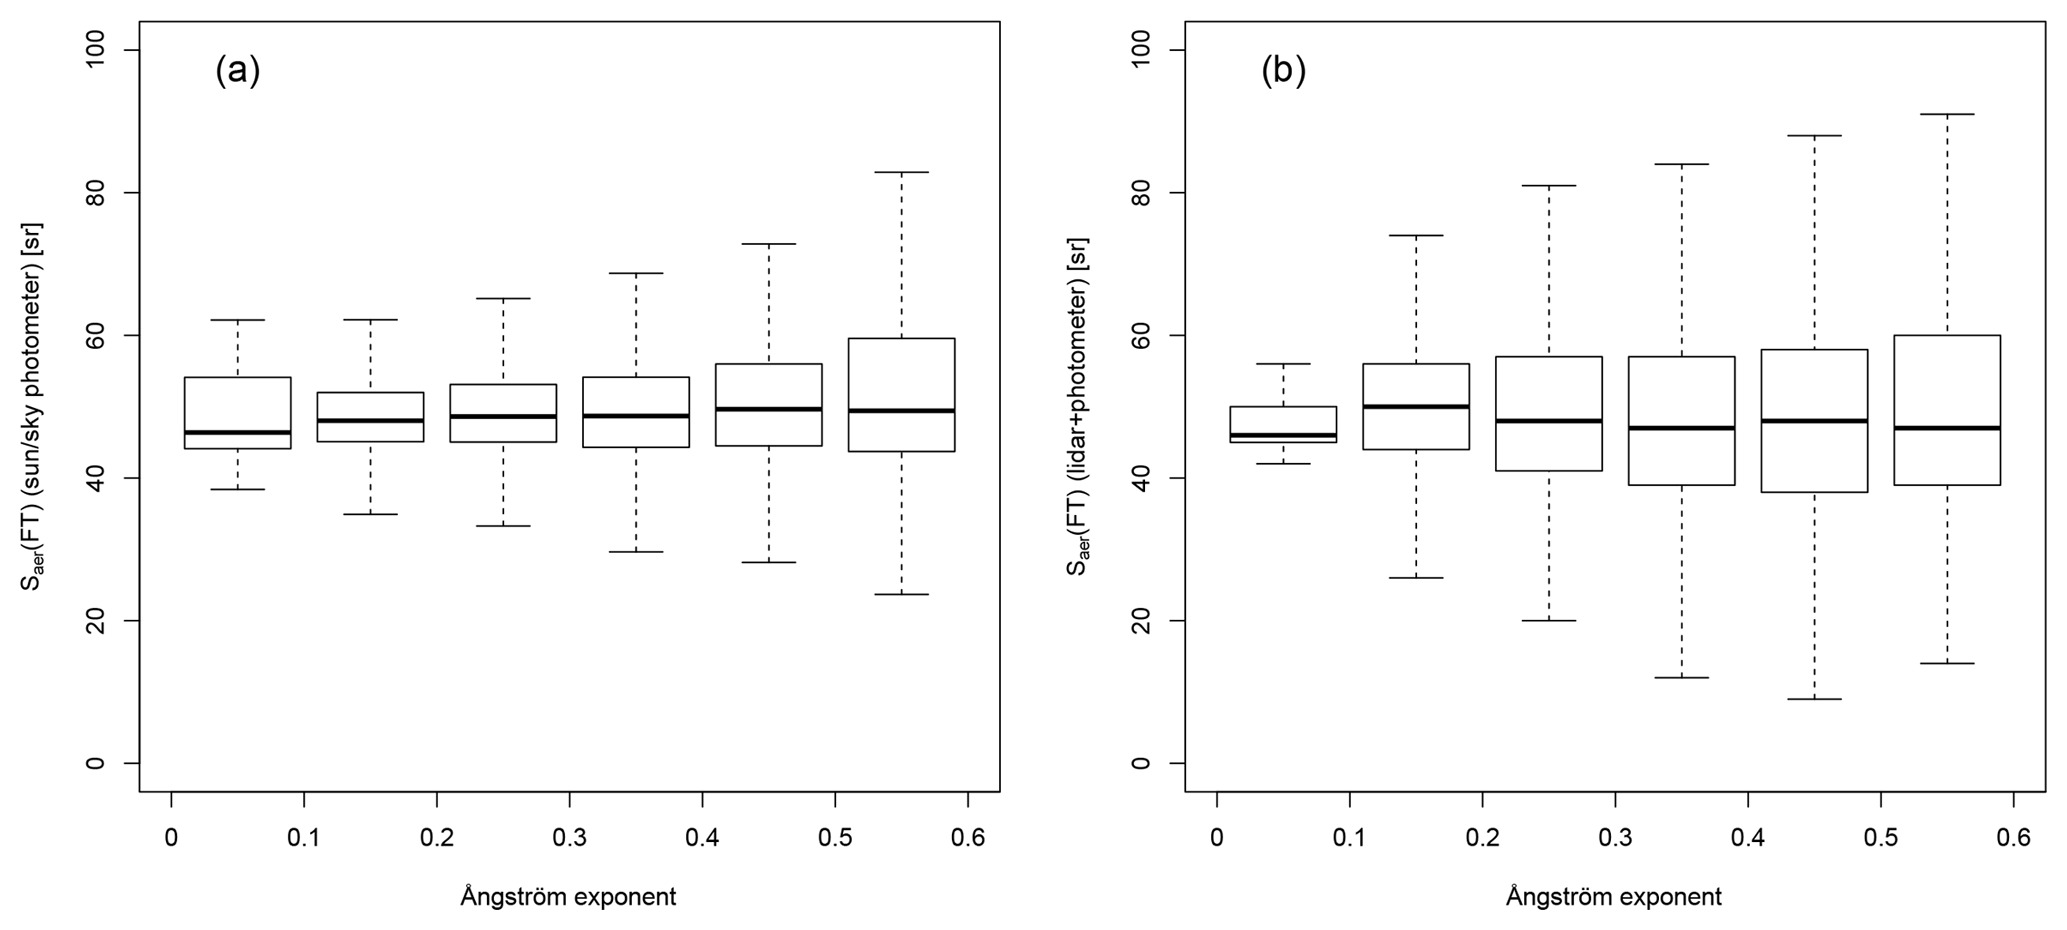
Figure 17Lidar ratios at 523 nm for mineral dust conditions (α<0.6) obtained from (a) the sun–sky photometer installed at Izaña and from (b) two-layer inversion for the FT for different Ångström exponent intervals. The central rectangles extend from the first quartile to the third quartile and the median is represented by a horizontal line. The whiskers are defined as the upper and lower quartiles ±1.5 IQR (interquartile range).
The fact that lidar ratio for mineral dust is observed to be practically unchanged with α and the consequent apparent contradiction with previous studies can be explained because mineral dust is the predominant aerosol component in the FT at this subtropical North Atlantic site. Previous studies have shown that mineral dust is the main contributor to background levels of aerosols in this site, with recirculated Saharan dust or dust from North America as the main expected contributors for these background levels. Meanwhile high-AOD conditions are associated with the presence of Saharan dust with an increase in both fine- and coarse-mode aerosol volume concentrations.
The lack of correlation between lidar ratio and α for almost pure mineral dust reflects that this type of aerosol on the subtropical North Atlantic region maintains a similar backscattering and extinction efficiency regardless of the predominant mode of dust size distribution.
Ten years of systematic MPL-lidar and photometric measurements made on the island of Tenerife have been used in this work to determine the lidar ratio associated with Saharan mineral dust in the subtropical North Atlantic. This is a region strongly influenced by the Saharan Air Layer and the results presented here might be considered representative of Saharan dust transported westward over the North Atlantic in the subtropical belt as a result of the homogeneity and longevity of this elevated layer.
Meanwhile an aerosol mixture between marine and dust is the predominant aerosol within the subtropical marine boundary layer. Almost pure mineral dust can be anticipated to be the dominant aerosol in the free troposphere. In an effort to prevent the occurrence of mixtures of different aerosols and to avoid the higher uncertainties expected for this type of ground-based lidar system at lower altitudes, we have restricted this analysis to the subtropical FT.
Three different methods have been used to estimate the lidar ratio (Saer(FT)) for almost pure mineral dust, using information extracted at Santa Cruz de Tenerife coastal station and at Izaña Observatory (under FT conditions). The first method uses inversion of sky radiance measurements from a sun–sky photometer placed at Izaña Observatory. This robust technique has been used as an independent reference to compare the results obtained from the other two methods used in this work. The second technique uses lidar information and a range-independent lidar ratio to estimate the aerosol extinction profile. This single-layer approach (the one-layer method), based on the Fernald–Klett inversion method, uses the AOD and lidar profiles measured at Santa Cruz de Tenerife. The last method, the two-layer approach, is also an inversion method based on the Fernald–Klett method but incorporates AOD measurements at the sea level and at the high mountain Izaña Observatory, taking advantage of the singular orographic characteristics of Tenerife. This method is expected to better match the real lower-troposphere vertical structure of the North Atlantic subtropical region.
A lidar ratio of 50 ± 11 sr for the Saharan dust at 523 nm is derived from the analysis conducted in this study with the two-layer method over a period of 10 years. The mean lidar ratio value derived from the Izaña Observatory photometer, with a value of 49 ± 6 sr, agrees very well with that obtained with the MPL. This good agreement between techniques, with a mean discrepancy of about 1 sr, confirms the consistency of the Saer(FT) obtained by these two methods throughout a decade. This consistency is also reasserted considering the good agreement with previous results performed by means of airborne HSRL observations in a region near the Canary Islands (Groß et al., 2013). However, the one-layer method provided a columnar lidar ratio of 24 ± 10 sr, considerably lower than the previous methods because of the contribution of the marine aerosol in the MBL, which tends to reduce the value of the lidar ratio. From these results we conclude that the two-layer method is not only an improved conceptual approach that matches the real lower-troposphere structure better than the single-layer approach but also gives lidar ratio results which have been validated with independent measurements. This results in more reliable extinction vertical profiles. Although it is important to emphasize that the two-layer method proposed in this paper is only applicable provided information from two photometers in different atmospheric layers is included. Further validation on the aerosol extinction coefficient against that provided by Raman or HSRL techniques will be required to assess the reliability of this technique.
We have quantified the impact of using a range-independent lidar ratio in the inversion method in a region where two well-differentiated layers constitute a typical meteorological feature. Median extinction coefficient differences of 92 % and −25 % were found in the 2007–2017 time period at surface level and above the thermal inversion, respectively, when the one- and the two-layer methods were compared. Maximum differences in the extinction profile were found at surface level, with ∼25 % of the single-layer inversions overestimating σaer by more than 200 %. We conclude that the classical one-layer approach underestimates the aerosol extinction profile in the FT while overestimating aerosol extinction in the MBL for clean conditions and moderate Saharan dust outbreaks. These are the most frequent conditions under which the lidar ratio is expected to be range dependent at this latitude.
The lack of correlation between lidar ratio and α for almost pure mineral dust found in this work reflects that mineral dust over the subtropical North Atlantic shows a similar backscattering and extinction efficiency regardless of the predominant mode of dust size distribution. These results, in accordance with previous studies, suggest that dust is always the predominant aerosol in the North Atlantic free troposphere. The lack of correlation between lidar ratio and α observed and the Saer value for almost pure mineral dust set in this work might be helpful for the optical properties retrieval and provide key information for aerosol classification algorithms in a region of relevant importance for the Saharan dust transport over the North Atlantic.
Finally, we have proved that reliable lidar ratios, and therefore aerosol extinction profiles, can be retrieved by incorporating additional information and previous knowledge about the aerosol vertical distribution using a decade of observations despite the inherent limitations of the elastic lidar technique.
The photometer inversion data used for the present study are available from the AERONET website (https://aeronet.gsfc.nasa.gov/, last access: 10 May 2019). The MPL lidar data at the Santa Cruz station are also available upon request.
Alberto Berjón, Africa Barreto and Yballa Hernández conceived and designed the methodology and wrote the paper. Margarita Yela, Carlos Toledano and Emilio Cuevas provided financial support and resources. Emilio Cuevas supervised this research activity. All authors discussed the results and contributed to the final paper.
The authors declare that they have no conflict of interest.
This work has been developed within the framework of the activities of the World Meteorological Organization (WMO) Commission for Instruments and Methods of Observations (CIMO) Izaña test bed for aerosols and water vapour remote-sensing instruments. AERONET sun photometers at Izaña have been calibrated within the AERONET Europe TNA, supported by the European Union's Horizon 2020 research and innovation programme under grant agreement no. 654109 (ACTRIS-2). The authors also acknowledge the AERONET team for their support, the Juan de la Cierva postdoctoral fellowship (JCI-2010-06097) from the Spanish Ministry of Science and Innovation, as well as the AMISOC project, CGL2011-24891, from the Spanish Plan for Research, Development and Innovation, which has partially supported the maintenance of the lidar at Santa Cruz de Tenerife. Our colleague Celia Milford improved the English of this paper.
This paper was edited by Stelios Kazadzis and reviewed by three anonymous referees.
Ackermann, J.: The Extinction-to-Backscatter Ratio of Tropospheric Aerosol: A Numerical Study, J. Atmos. Ocean. Tech., 15, 1043–1050, https://doi.org/10.1175/1520-0426(1998)015<1043:TETBRO>2.0.CO;2, 1998. a, b
Alonso-Pérez, S., Cuevas, E., Perez, C., Querol, X., Baldasano, J., Draxler, R., and Bustos, J. D.: Trend changes of African airmass intrusions in the marine boundary layer over the subtropical Eastern North Atlantic region in winter, Tellus B, 63, 255–265, https://doi.org/10.1111/j.1600-0889.2011.00524.x, 2011. a
Amiridis, V., Wandinger, U., Marinou, E., Giannakaki, E., Tsekeri, A., Basart, S., Kazadzis, S., Gkikas, A., Taylor, M., Baldasano, J., and Ansmann, A.: Optimizing CALIPSO Saharan dust retrievals, Atmos. Chem. Phys., 13, 12089–12106, https://doi.org/10.5194/acp-13-12089-2013, 2013. a, b
Ansmann, A.: Ground-truth aerosol lidar observations: Can the Klett solutions obtained from ground and space be equal for the same aerosol case?, Appl. Opt., 45, 3367–3371, https://doi.org/10.1364/AO.45.003367, 2006. a, b
Ansmann, A., Petzold, A., Kandler, K., Tegen, I., Wendisch, M., Müller, D., Weinzierl, B., Müller, T., and Heintzenberg, J.: Saharan Mineral Dust Experiments SAMUM-1 and SAMUM-2: what have we learned?, Tellus B, 63, 403–429, https://doi.org/10.1111/j.1600-0889.2011.00555.x, 2011. a
Ansmann, A., Müller, D., Wandinger, U., and Mamouri, R.: Lidar profiling of aerosol optical and microphysical properties from space: overview, review, and outlook, in: Lidar Remote Sensing for Industry and Environment Monitoring, 879502, https://doi.org/10.1117/12.2028112, 2013. a
Balis, D. S., Amiridis, V., Nickovic, S., Papayannis, A., and Zerefos, C.: Optical properties of Saharan dust layers as detected by a Raman lidar at Thessaloniki, Greece, Geophys. Res. Lett., 31, L13104, https://doi.org/10.1029/2004GL019881, 2004. a, b
Barnaba, F. and Gobbi, G. P.: Lidar estimation of tropospheric aerosol extinction, surface area and volume: Maritime and desert-dust cases, J. Geophys. Res., 106, 3005–3018, https://doi.org/10.1029/2000JD900492, 2001. a, b
Barreto, A., Cuevas, E., Pallé, P., Romero, P. M., Guirado, C., Wehrli, C. J., and Almansa, F.: Recovering long-term aerosol optical depth series (1976–2012) from an astronomical potassium-based resonance scattering spectrometer, Atmos. Meas. Tech., 7, 4103–4116, https://doi.org/10.5194/amt-7-4103-2014, 2014. a
Basart, S., Pérez, C., Cuevas, E., Baldasano, J. M., and Gobbi, G. P.: Aerosol characterization in Northern Africa, Northeastern Atlantic, Mediterranean Basin and Middle East from direct-sun AERONET observations, Atmos. Chem. Phys., 9, 8265–8282, https://doi.org/10.5194/acp-9-8265-2009, 2009. a, b
Bösenberg, J. and Hoff, R.: Plan for the implementation of the GAW Aerosol Lidar Observation Network GALION, Tech. Rep. WMO/GAW No. 178, World Meteorological Organization, available at: http://library.wmo.int/pmb_ged/wmo-td_1443.pdf (last access: 12 December 2018), 2007. a
Bréon, F.-M.: Aerosol extinction-to-backscatter ratio derived from passive satellite measurements, Atmos. Chem. Phys., 13, 8947–8954, https://doi.org/10.5194/acp-13-8947-2013, 2013. a
Campbell, J. R., Hlavka, D. L., Welton, E. J., Flynn, C. J., Turner, D. D., Spinhirne, J. D., Scott, V. S., and Hwang, I. H.: Full-Time, Eye-Safe Cloud and Aerosol Lidar Observation at Atmospheric Radiation Measurement Program Sites: Instruments and Data Processing, J. Atmos. Ocean. Tech., 19, 431–442, https://doi.org/10.1175/1520-0426(2002)019<0431:FTESCA>2.0.CO;2, 2002. a, b
Carrillo, J., Guerra, J. C., Cuevas, E., and Barrancos, J.: Characterization of the Marine Boundary Layer and the Trade-Wind Inversion over the Sub-tropical North Atlantic, Bound.-Lay. Meteorol., 158, 311–330, https://doi.org/10.1007/s10546-015-0081-1, 2016. a, b
Cattrall, C., Reagan, J., Thome, K., and Dubovik, O.: Variability of aerosol and spectral lidar and backscatter and extinction ratios of key aerosol types derived from selected Aerosol Robotic Network locations, J. Geophys. Res.-Atmos., 110, D10S11, https://doi.org/10.1029/2004JD005124, 2005. a
Clothiaux, E. E., Mace, G. G., Ackerman, T. P., Kane, T. J., Spinhirne, J. D., and Scott, V. S.: An Automated Algorithm for Detection of Hydrometeor Returns in Micropulse Lidar Data, J. Atmos. Ocean. Tech., 15, 1035–1042, https://doi.org/10.1175/1520-0426(1998)015<1035:AAAFDO>2.0.CO;2, 1998. a
Córdoba-Jabonero, C., Sorribas, M., Guerrero-Rascado, J. L., Adame, J. A., Hernández, Y., Lyamani, H., Cachorro, V., Gil, M., Alados-Arboledas, L., Cuevas, E., and de la Morena, B.: Synergetic monitoring of Saharan dust plumes and potential impact on surface: a case study of dust transport from Canary Islands to Iberian Peninsula, Atmos. Chem. Phys., 11, 3067–3091, https://doi.org/10.5194/acp-11-3067-2011, 2011. a
Cordoba-Jabonero, C., Adame, J., Grau, D., Cuevas, E., and Gil-Ojeda, M.: Lidar ratio discrimination retrieval in a two-layer aerosol system from elastic lidar measurements in synergy with sun-photometry data, in: Conference Proceedings of the 1st International Conference on Atmospheric Dust – DUST 2014, vol. 1, 243–248, https://doi.org/10.14644/dust.2014.040, 2014. a, b, c
Cuevas, E., González, Y., Rodríguez, S., Guerra, J. C., Gómez-Peláez, A. J., Alonso-Pérez, S., Bustos, J., and Milford, C.: Assessment of atmospheric processes driving ozone variations in the subtropical North Atlantic free troposphere, Atmos. Chem. Phys., 13, 1973–1998, https://doi.org/10.5194/acp-13-1973-2013, 2013. a
Cuevas, E., Camino, C., Benedetti, A., Basart, S., Terradellas, E., Baldasano, J. M., Morcrette, J. J., Marticorena, B., Goloub, P., Mortier, A., Berjón, A., Hernández, Y., Gil-Ojeda, M., and Schulz, M.: The MACC-II 2007–2008 reanalysis: atmospheric dust evaluation and characterization over northern Africa and the Middle East, Atmos. Chem. Phys., 15, 3991–4024, https://doi.org/10.5194/acp-15-3991-2015, 2015a. a, b, c, d, e
Cuevas, E., Milford, C., Bustos, J., del Campo-Hernández, R., García, O., García, R., Gómez-Peláez, A., Ramos, R., Redondas, A., Reyes, E., Romero-Campos, S. R. P., Schneider, M., Belmonte, J., Gil-Ojeda, M., Almansa, F., Alonso-Pérez, S., Barreto, A., Guirado-Fuentes, Y. G.-M. C., López-Solano, C., Afonso, S., Bayo, C., Berjón, A., Bethencourt, J., Camino, C., Carreño, V., Castro, N., Cruz, A., Damas, M., Ory-Ajamil, F. D., García, M., de Mesa, C. F., González, Y., Hernández, C., Hernández, Y., Hernández, M., Hernández-Cruz, B., Jover, M., Kühl, S., López-Fernández, R., López-Solano, J., Peris, A., Rodríguez-Franco, J., Sálamo, C., Sepulveda, E. S., and Sierra, M.: Izaña Atmospheric Res earch Center Activity Report 2012–2014, Tech. Rep. WMO/GAW No. 219, World Meteorological Organization & Izaña Atmospheric Resear Center (AEMET), available at: https://library.wmo.int/pmb_ged/gaw_219_en.pdf (last access: 12 December 2018), 2015b. a
Cuevas, E., Gómez-Peláez, A., Rodríguez, S., Terradellas, E., Basart, S., García, R., García, O., and Alonso-Pérez, S.: The pulsating nature of large-scale Saharan dust transport as a result of interplays between mid-latitude Rossby waves and the North African Dipole Intensity, Atmos. Environ., 167, 586–602, https://doi.org/10.1016/j.atmosenv.2017.08.059, 2017a. a
Cuevas, E., Milford, C., Bustos, J., del Campo-Hernández, R., García, O., García, R., Gómez-Peláez, A., Guirado-Fuentes, C., Marrero, C., Prats, N., Ramos, R., Redondas, A., Reyes, E., Romero-Campos, S. R. P., Schneider, M., Belmonte, J., Yela, M., Almansa, F., Barreto, A., López-Solano, C., Basart, S., Terradellas, E., Afonso, S., Bayo, C., Berjón, A., Bethencourt, J., Carreño, V., Castro, N., Cruz, A., Damas, M., Ory-Ajamil, F. D., García, M., Gómez-Trueba, V., González, Y., Hernández, C., Hernández, Y., Hernández-Cruz, B., Jover, M., León-Luís, S., López-Fernández, R., López-Solano, J., Rodríguez, E., Rodríguez-Franco, J., Rodríguez-Valido, M., Sálamo, C., Sanromá, E., Santana, D., Tomás, F. S., Sepúlveda, E., Sierra, M., and Sosa, E.: Izaña Atmospheric Research Center Activity Report 2015–2016, Tech. Rep. WMO/GAW No. 236, World Meteorological Organization & Izaña Atmospheric Resear Center (AEMET), available at: https://library.wmo.int/doc_num.php?explnum_id=4139 (last access: 12 December 2018), 2017b. a
Dubovik, O. and King, M. D.: A flexible inversion algorithm for retrieval of aerosol optical properties from Sun and sky radiance measurements, J. Geophys. Res.-Atmos., 105, 20673–20696, https://doi.org/10.1029/2000JD900282, 2000. a
Dubovik, O., Sinyuk, A., Lapyonok, T., Holben, B. N., Mishchenko, M., Yang, P., Eck, T. F., Volten, H., Muñoz, O., Veihelmann, B., van der Zande, W. J., Leon, J.-F., Sorokin, M., and Slutsker, I.: Application of spheroid models to account for aerosol particle nonsphericity in remote sensing of desert dust, J. Geophys. Res.-Atmos., 111, D11208, https://doi.org/10.1029/2005JD006619, 2006. a
Endlich, R., Ludwig, F., and Uthe, E.: An automatic method for determining the mixing depth from lidar observations, Atmos. Environ., 13, 1051–1056, https://doi.org/10.1016/0004-6981(79)90015-5, 1979. a
Evans, B. T. N.: Sensitivity of the backscatter/extinction ratio to changes in aerosol properties: implications for lidar, Appl. Optics, 27, 3299–3305, https://doi.org/10.1364/AO.27.003299, 1988. a
Fernald, F. G.: Analysis of atmospheric lidar observations: some comments, Appl. Optics, 23, 652–653, https://doi.org/10.1364/AO.23.000652, 1984. a, b, c, d
García, M. I., Rodríguez, S., and Alastuey, A.: Impact of North America on the aerosol composition in the North Atlantic free troposphere, Atmos. Chem. Phys., 17, 7387–7404, https://doi.org/10.5194/acp-17-7387-2017, 2017. a, b
Groß, S., Esselborn, M., Weinzierl, B., Wirth, M., Fix, A., and Petzold, A.: Aerosol classification by airborne high spectral resolution lidar observations, Atmos. Chem. Phys., 13, 2487-2505, https://doi.org/10.5194/acp-13-2487-2013, 2013. a, b, c, d
Guirado, C.: Caracterización de las propiedades de los aerosoles en columna en la región subtropical, PhD thesis, Universidad de Valladolid, available at: http://uvadoc.uva.es/handle/10324/13220 (last access: 12 December 2018), 2015. a, b
Haarig, M., Ansmann, A., Gasteiger, J., Kandler, K., Althausen, D., Baars, H., Radenz, M., and Farrell, D. A.: Dry versus wet marine particle optical properties: RH dependence of depolarization ratio, backscatter, and extinction from multiwavelength lidar measurements during SALTRACE, Atmos. Chem. Phys., 17, 14199–14217, https://doi.org/10.5194/acp-17-14199-2017, 2017. a
Heintzenberg, J.: The SAMUM-1 experiment over Southern Morocco: overview and introduction, Tellus B, 61, 2–11, https://doi.org/10.1111/j.1600-0889.2008.00403.x, 2009. a
Holben, B., Eck, T., Slutsker, I., Tanré, D., Buis, J., Setzer, A., Vermote, E., Reagan, J., Kaufman, Y., Nakajima, T., Lavenu, F., Jankowiak, I., and Smirnov, A.: AERONET – A Federated Instrument Network and Data Archive for Aerosol Characterization, Remote Sens. Environ., 66, 1–16, https://doi.org/10.1016/S0034-4257(98)00031-5, 1998. a
Holben, B. N., Eck, T. F., Slutsker, I., Smirnov, A., Sinyuk, A., Schafer, J., Giles, D., and Dubovik, O.: Aeronet's Version 2.0 quality assurance criteria, in: Proceedings of the SPIE, 64080Q, https://doi.org/10.1117/12.706524, 2006. a
Kanamitsu, M.: Description of the NMC Global Data Assimilation and Forecast System, B. Am. Meteorol. Soc., 4, 335–342, https://doi.org/10.1175/1520-0434(1989)004<0335:DOTNGD>2.0.CO;2, 1989. a
Karyampudi, V. M., Palm, S. P., Reagen, J. A., Fang, H., Grant, W. B., Hoff, R. M., Pierce, H. F., Torres, O., Browell, E. V., and Melfi, S. H.: Validation of the Saharan Dust plume conceptual model using Lidar, Meteosat, and ECMWF Data, B. Am. Meteorol. Soc., 80, 1045–1075, https://doi.org/10.1175/1520-0477(1999)080<1045:VOTSDP>2.0.CO;2, 1999. a, b
Kim, M.-H., Omar, A. H., Tackett, J. L., Vaughan, M. A., Winker, D. M., Trepte, C. R., Hu, Y., Liu, Z., Poole, L. R., Pitts, M. C., Kar, J., and Magill, B. E.: The CALIPSO version 4 automated aerosol classification and lidar ratio selection algorithm, Atmos. Meas. Tech., 11, 6107–6135, https://doi.org/10.5194/amt-11-6107-2018, 2018. a, b
Klett, J. D.: Lidar inversion with variable backscatter/extinction ratios, Appl. Optics, 24, 1638–1643, https://doi.org/10.1364/AO.24.001638, 1985. a, b, c, d
Kovalev, V.: Solutions in Lidar Profiling of the Atmosphere, John Wiley & Sons Inc., 2015. a
Kovalev, V. A.: Sensitivity of the lidar solution to errors of the aerosol backscatter-to-extinction ratio: Influence of a monotonic change in the aerosol extinction coefficient, Appl. Optics, 34, 3457–3462, https://doi.org/10.1364/AO.34.003457, 1995. a
Kovalev, V. A. and Eichinger, W. E.: Elastic Lidar: Theory, Practice, and Analysis Methods, Wiley-Blackwell, https://doi.org/10.1002/0471643173, 2005. a, b, c
Landulfo, E., Papayannis, A., Torres, A. S., Uehara, S. T., Pozzetti, L. M. V., Alencar de Matos, C., Sawamura, P., Morinobu Nakaema, W., and de Jesus, W.: A Four-Year Lidar – Sun Photometer Aerosol Study at São Paulo, Brazil, J. Atmos. Ocean. Tech., 25, 1463–1468, https://doi.org/10.1175/2007JTECHA984.1, 2008. a
Marenco, F., Santacesaria, V., Bais, A. F., Balis, D., di Sarra, A., Papayannis, A., and Zerefos, C.: Optical properties of tropospheric aerosols determined by lidar andspectrophotometric measurements (Photochemical Activity and Solar UltravioletRadiation campaign), Appl. Opt., 36, 6875–6886, https://doi.org/10.1364/AO.36.006875, 1997. a
Martín, J. L., Bethencourt, J., and Cuevas-Agulló, E.: Assessment of global warming on the island of Tenerife, Canary Islands (Spain). Trends in minimum, maximum and mean temperatures since 1944, Clim. Change, 114, 343–355, https://doi.org/10.1007/s10584-012-0407-7, 2012. a
Mona, L., Amodeo, A., Pandolfi, M., and Pappalardo, G.: Saharan dust intrusions in the Mediterranean area: Three years of Raman lidar measurements, J. Geophys. Res.-Atmos., 111, D16203, https://doi.org/10.1029/2005JD006569, 2006. a
Mona, L., Liu, Z., Müller, D., Omar, A., Papayannis, A., Pappalardo, G., Sugimoto, N., and Vaughan, M.: Lidar measurements for desert dust characterization: An overview, Adv. Meteorol., 2012, 356265, https://doi.org/10.1155/2012/356265, 2012. a
Mona, L., Papagiannopoulos, N., Basart, S., Baldasano, J., Binietoglou, I., Cornacchia, C., and Pappalardo, G.: EARLINET dust observations vs. BSC-DREAM8b modeled profiles: 12 year-long systematic comparison at Potenza, Italy, Atmos. Chem. Phys., 14, 8781–8793, https://doi.org/10.5194/acp-14-8781-2014, 2014. a, b
Morille, Y., Haeffelin, M., Drobinski, P., and Pelon, J.: STRAT: An Automated Algorithm to Retrieve the Vertical Structure of the Atmosphere from Single-Channel Lidar Data, J. Atmos. Ocean. Tech., 24, 761–775, https://doi.org/10.1175/JTECH2008.1, 2007. a
Müller, D., Mattis, I., Wandinger, U., Ansmann, A., Althausen, D., Dubovik, O., Eckhardt, S., and Stohl, A.: Saharan dust over a central European EARLINET–AERONET site: Combined observations with Raman lidar and Sun photometer, J. Geophys. Res.-Atmos., 108, 4345, https://doi.org/10.1029/2002JD002918, 2003. a
Müller, D., Ansmann, A., Mattis, I., Tesche, M., Wandinger, U., Althausen, D., and Pisani, G.: Aerosol-type-dependent lidar ratios observed with Raman lidar, J. Geophys. Res.-Atmos., 112, D16202,, https://doi.org/10.1029/2006JD008292, 2007. a, b, c, d, e, f
Omar, A. H., Winker, D. M., Vaughan, M. A., Hu, Y., Trepte, C. R., Ferrare, R. A., Lee, K.-P., Hostetler, C. A., Kittaka, C., Rogers, R. R., Kuehn, R. E., and Liu, Z.: The CALIPSO Automated Aerosol Classification and Lidar Ratio Selection Algorithm, J. Atmos. Ocean. Tech., 26, 1994–2014, https://doi.org/10.1175/2009JTECHA1231.1, 2009. a
Papagiannopoulos, N., Mona, L., Alados-Arboledas, L., Amiridis, V., Baars, H., Binietoglou, I., Bortoli, D., D'Amico, G., Giunta, A., Guerrero-Rascado, J. L., Schwarz, A., Pereira, S., Spinelli, N., Wandinger, U., Wang, X., and Pappalardo, G.: CALIPSO climatological products: evaluation and suggestions from EARLINET, Atmos. Chem. Phys., 16, 2341–2357, https://doi.org/10.5194/acp-16-2341-2016, 2016. a
Papayannis, A., Amiridis, V., Mona, L., Tsaknakis, G., Balis, D., Bösenberg, J., Chaikovski, A., De Tomasi, F., Grigorov, I., Mattis, I., Mitev, V., Müller, D., Nickovic, S., Pérez, C., Pietruczuk, A., Pisani, G., Ravetta, F., Rizi, V., Sicard, M., Trickl, T., Wiegner, M., Gerding, M., Mamouri, R. E., D'Amico, G., and Pappalardo, G.: Systematic lidar observations of Saharan dust over Europe in the frame of EARLINET (2000–2002), J. Geophys. Res.-Atmos., 113, D10204, https://doi.org/10.1029/2007JD009028, 2008. a
Pelón, J., Flamant, P., León, J. F., Tanrè, D., Sicard, M., and Satheesh, S. K.: Characterization of aerosol spatial distribution and optical properties over the Indian Ocean from airborne LIDAR and radiometry during INDOEX'99, J. Geophys. Res., 107, 8029, https://doi.org/10.1029/2001JD000402, 2002. a, b
Prospero, J. M.: Saharan dust transport over the north Atlantic Ocean and Mediterranean: An Overview, in The Impact of Desert Dust from Northern Africa Across the Mediterranean, Springer, Dordrecht, https://doi.org/10.1007/978-94-017-3354-0, 1996. a, b
Prospero, J. M. and Carlson, T. N.: Vertical and areal distribution of Saharan dust over the western equatorial north Atlantic Ocean, J. Geophys. Res., 77, 5255–5265, https://doi.org/10.1029/JC077i027p05255, 1972. a
Prospero, J. M. and Carlson, T. N.: Saharan air outbreaks over the Tropical North Atlantic, Pure Appl. Geophys., 119, 677–691, https://doi.org/10.1007/BF00878167, 1980. a, b
Rocadenbosch, F., Reba, M. N. M., Sicard, M., and Comerón, A.: Practical analytical backscatter error bars for elastic one-component lidar inversion algorithm, Appl. Opt., 49, 3380–3393, https://doi.org/10.1364/AO.49.003380, 2010. a
Rodríguez, S., Cuevas, E., Prospero, J. M., Alastuey, A., Querol, X., López-Solano, J., García, M. I., and Alonso-Pérez, S.: Modulation of Saharan dust export by the North African dipole, Atmos. Chem. Phys., 15, 7471–7486, https://doi.org/10.5194/acp-15-7471-2015, 2015. a
Rodríguez-Gonzalez, J., Lopez, C., Chueca, S., Martín, T., Ayala, V., Gil, M., Cuevas, E., and Guillemont, N.: Lidar MPL en Santa Cruz de Tenerife. Proyecto de automatización y control de las medidas, in: Proceedings of the XI Congreso Nacional de Teledetección ”Avances en la Observación de la Tierra, Puerto de la Cruz, Tenerife, Spain, 21–23 September 2005, 503–506, 2005. a
Smirnov, A., Holben, B. N., Slutsker, I., Welton, E, J., and Formenti, P.: Optical properties of Saharan dust during ACE 2, J. Geophys. Res., 103, 28079–28092, https://doi.org/10.1029/98JD01930, 1998. a
Smirnov, A., Holben, B. N., Eck, T. F., Dubovik, O., and Slutsker, I.: Cloud-screening and quality control algorithms for the AERONET database, Remote Sens. Environ., 73, 337–349, https://doi.org/10.1016/S0034-4257(00)00109-7, 2000. a
Song, Y., Zhang, B., Shi, G., Li, S., Di, H., Yan, Q., and Hua, D.: Correlation between the lidar ratio and the Ångström exponent of various aerosol types, Particuology, 40, 62–69, https://doi.org/10.1016/j.partic.2017.12.002, 2018. a, b, c
Spinhirne, J.: Micro pulse lidar, IEEE T. Geosci. Remote, 31, 48–55, https://doi.org/10.1109/36.210443, 1993. a
Takamura, T., Sasano, Y., and Hayasaka, T.: Tropospheric aerosol optical properties derived from lidar, sun photometer, and optical particle counter measurements, Appl. Opt., 33, 7132–7140, 1994. a
Tesche, M., Ansmann, A., MüLLER, D., Althausen, D., Mattis, I., Heese, B., Freudenthaler, V., Wiegner, M., Esselborn, M., Pisani, G., and Knippertz, P.: Vertical profiling of Saharan dust with Raman lidars and airborne HSRL in southern Morocco during SAMUM, Tellus B, 61, 144–164, https://doi.org/10.1111/j.1600-0889.2008.00390.x, 2009. a
Toledano, C., González, R., Fuertes, D., Cuevas, E., Eck, T. F., Kazadzis, S., Kouremeti, N., Gröbner, J., Goloub, P., Blarel, L., Román, R., Barreto, Á., Berjón, A., Holben, B. N., and Cachorro, V. E.: Assessment of Sun photometer Langley calibration at the high-elevation sites Mauna Loa and Izaña, Atmos. Chem. Phys., 18, 14555–14567, https://doi.org/10.5194/acp-18-14555-2018, 2018. a, b
Weitkamp, C. (ed.): Lidar Range-Resolved Optical Remote Sensing of the Atmosphere, Springer-Verlag New York, https://doi.org/10.1007/b106786, 2005. a
Welton, E. J. and Campbell, J. R.: Micropulse Lidar Signals: Uncertainty Analysis, J. Atmos. Ocean. Tech., 19, 2089–2094, https://doi.org/10.1175/1520-0426(2002)019<2089:MLSUA>2.0.CO;2, 2002. a, b
Welton, E. J., Campbell, J. R., Spinhirne, J. D., and Scott, V. S.: Global monitoring of clouds and aerosols using a network of micropulse lidar systems, Proc. SPIE 4153, Lidar Remote Sensing for Industry and Environment Monitoring, https://doi.org/10.1117/12.417040, 2001. a
Wiegner, M., Gasteiger, J., Kandler, K., Weinzierl, B., Rasp, K., Esselborn, M., Freudenthaler, V., Heese, B., Toledano, C., Tesche, M., and Althausen, D.: Numerical simulations of optical properties of Saharan dust aerosols with emphasis on lidar applications, Tellus B, 61, 180–194, https://doi.org/10.1111/j.1600-0889.2008.00381.x, 2009. a