the Creative Commons Attribution 4.0 License.
the Creative Commons Attribution 4.0 License.
 | 16 Jan 2019
Comparison of surface ozone simulation among selected regional models in MICS-Asia III – effects of chemistry and vertical transport for the causes of difference
Hajime Akimoto
Tatsuya Nagashima
Jie Li
Joshua S. Fu
Dongsheng Ji
Jiani Tan
Zifa Wang
In order to clarify the causes of variability among the model outputs for surface ozone in the Model Intercomparison Study Asia Phase III (MICS-Asia III), three regional models, CMAQ v.5.0.2, CMAQ v.4.7.1, and NAQPMS (abbreviated as NAQM in this paper), have been selected. Detailed analyses of monthly averaged diurnal variation have been performed for selected grids covering the metropolitan areas of Beijing and Tokyo and at a remote oceanic site, Oki. The chemical reaction mechanism, SAPRC99, used in the CMAQ models tended to give a higher net chemical ozone production than CBM-Z used in NAQM, agreeing with previous studies. Inclusion of the heterogeneous “renoxification” reaction of only in NAQM would give a higher NO concentration resulting in a better agreement with observational data for NO and nighttime O3 mixing ratios. In addition to chemical processes, the difference in the vertical transport of O3 was found to affect the simulated results significantly. Particularly, the increase in downward O3 flux from the upper layer to the surface after dawn was found to be substantially different among the models. Larger early morning vertical transport of O3 simulated by CMAQ 5.0.2 is thought to be the reason for higher daytime O3 in July in this model. All three models overestimated the daytime ozone by ca. 20 ppbv at the remote site Oki in July, where in situ photochemical activity is minimal.


In the Model Intercomparison Study Asia Phase III (MICS-Asia Phase III), one of the targets was to narrow down the difference in the model simulation results by using common key input parameters such as precursor emissions, meteorological fields, and boundary conditions to allow a more focused discussion on the causes of the difference among model outputs. In most of the past model intercomparison studies for chemical transport models (CTMs) for air quality, such key parameters were not common to all the models, which made the discussion of the causes of the differences among the model outputs difficult, and the results often demonstrated that the ensemble mean of simulated mixing ratios agreed reasonably well with observations even though the disagreement among the models was often significantly large (for example, Han et al., 2008; Fiore et al., 2009).
In order to improve the state of model intercomparison studies, participants of the MICS-Asia III studies agreed to use common emission data (M. Li et al., 2017), meteorological fields (specified Weather Research and Forecasting Model (WRF)), and boundary conditions by either of two global CTMs (GEOS-Chem and CHASER) provided within the project (Wang et al., 2019; J. Li et al., 2019). The following 12 regional models have been submitted to the MICS-Asia III using the designated common emissions, meteorological fields, and boundary conditions: six WRF-CMAQ (Community Multiscale Air Quality Modeling System, two v.5.0.2, one v.5.0.1, and three v.4.7.1), four WRF-Chem (Weather Research and Forecasting (WRF) model coupled with Chemistry), one WRF-NHM (JMA Nonhydrostatic Model)/Chem, and one WRF-NAQPMS (Nested Air Quality Prediction Modeling System, which is abbreviated to NAQM in this paper hereafter for simplicity). It turned out, however, that even though these 12 models used the specified common key input components, large variabilities in the spatial distribution and absolute mixing ratios among the models were found for ozone (O3) (J. Li et al., 2019).
In the present study, three regional models, two WRF-CMAQ, v.5.02 and v.4.7.1, and WRF-NAQM were selected among the 12 abovementioned models to elucidate the causes of differences, and detailed comparisons were made for selected grids covering the metropolitan areas of Beijing and Tokyo and at a remote oceanic site at Oki in April and July in 2010. We selected the two models of CMAQ because CMAQ models have been widely used to assess the air quality for ozone in Asia (e.g., Yamaji et al., 2008; Kurokawa et al., 2009; Fu et al., 2012), and the difference in the simulated results between different versions (v.5.02 and v.4.7.1) is of concern. Furthermore, we selected WRF-NAQM because this is one of the regional CTMs developed in Asia, giving substantially lower mixing ratios of surface ozone compared to most WRF-CMAQ models including the two selected models (J. Li et al., 2019). The metropolitan areas of the two megacities of Beijing and Tokyo have been selected for the comparison to test whether regional models can be applied to the mitigation policy of urban ozone pollution. Oki, an EANET (Acid Deposition Monitoring Network in East Asia) monitoring station located in the southern part of the Sea of Japan, was selected as a remote reference site located between the two megacities, as in situ photochemical production of O3 is known to be minimal there (Jaffe et al., 1996).
Basic features and the whole simulated domain of the regional models, CMAQ v.4.7 (Foley et al., 2010), v.5.0 (CMAS, 2011), and NAQM (J. Li et al., 2016), used in this study are given elsewhere in this issue (J. Li et al., 2019). The employed horizontal resolution was 45 km for all the models, and the maximum height and number of vertical layers were 45 km and 40 layers, respectively, in the CMAQ models and 20 km and 20 layers, respectively, in the NAQM, so that the vertical resolution in the troposphere was about the same. The lowest layer for which the simulated data of ozone were extracted in this paper was 50 m from the ground. Model calculations by CMAQ v.5.0.2 and v.4.7.1 and NAQM were conducted at the University of Tennessee, USA; National Institute for Environmental Studies, Japan; and Institute of Atmospheric Physics, China, respectively. All the models used the common meteorological fields from WRF simulation and common emissions of MIX () for 2010 (M. Li et al., 2017) developed in the MICS-Asia III project. The initial and boundary conditions were supplied by global models, CHASER for CMAQ v.4.7.1 and NAQM and GEOS-Chem for CMAQ v.5.0.2. It was agreed that either CHASER or GEOS-Chem may be used in MICS-Asia III since they were confirmed to give reasonably good agreement for the O3 field in the Asian domain.
Other than these three key components (emissions, meteorological field, and boundary conditions), the three models employed different sub-models and parameters for the gas-phase and aerosol chemistry module, dry deposition parameters, boundary layer scheme, etc. As for the gas-phase chemistry, CMAQ v.4.7.1 and v.5.0.2 incorporated SAPRC99 (Carter, 2000), and NAQM employed CBM-Z (Zaveri and Peters, 1999). In CMAQ v.4.7.1 (Foley et al., 2010), major upgrades were made on the aerosol treatment from the previous version: (a) updates to the heterogeneous N2O5 parameterization, (b) improvement in the treatment of secondary organic aerosol (SOA), (c) inclusion of dynamic mass transfer for coarse-mode aerosol, and (d) revisions to the cloud model. The NAQM and CMAQ v.4.7.1 employed ISORROPIA v.1.7 (Nenes et al., 1998), and CMAQ v.5.0.2 incorporated ISORROPIA v.2.1 (Fountoukis and Nenes, 2007) for inorganic aerosol chemistry modules. In addition, CMAQ v.4.7.1 and v.5.0.2 included AERO5 and AERO6 (Binkowski and Roselle, 2003), respectively, as an organic aerosol chemistry module. The sub-modules for dry deposition and wet deposition employed in the three models were essentially the same. The Asymmetric Convective Model version 2 (ACM2) for the planetary boundary layer (PBL) (Pleim, 2007) was employed in both CMAQ v.4.7.1 and v.5.0.2. The Yonsei University (YSU) boundary layer scheme was used for calculating boundary layer height for NAQM (J. Li et al., 2016). As for the advection module, the models by Yamartino (1993) and Walcek and Aleksic (1998) were used for CMAQ (v.4.7.1 and v.5.0.2) and NAQM, respectively. For the computation of the vertical transport for advection, CMAQ v.5.0.2 used the PPM (piecewise parabolic method) scheme, compared to CMAQ v.4.7.1, which used the vertical velocity directly from WRF.
All the comparisons between the model simulations and the model using observational data were made for monthly averaged diurnal variations in the mixing ratios of O3 and NO in April and July. April and July were chosen here because in situ photochemical build-up of O3 in April is insignificant but the daytime maximum mixing ratio of O3 is relatively high, reflecting the well-known spring maximum of O3 for the background in the Northern Hemisphere including East Asia (Monks, 2000; Pochanart et al., 2003), while in July a much higher in situ photochemical buildup of O3 is observed in urban areas in East Asia. Two representative megacities, Beijing and Tokyo, were selected as urban areas for the comparison. As a remote reference site, Oki, an EANET site situated between Beijing and Tokyo, was selected. The Oki site is located on a cliff of an island where the local emissions of NOx and volatile organic compounds (VOCs) are insignificant so that in situ production of O3 is also minimal (Jaffe et al., 1996; Pochanart et al., 2002). Since the NO levels at Oki are too low to obtain any meaningful data using the conventional chemiluminescence NOx monitoring instrument, comparison with modeling results was carried out only for O3 at this site in this study. All the calculations were conducted for the whole year of 2010 using the meteorological field and emission data for this year.
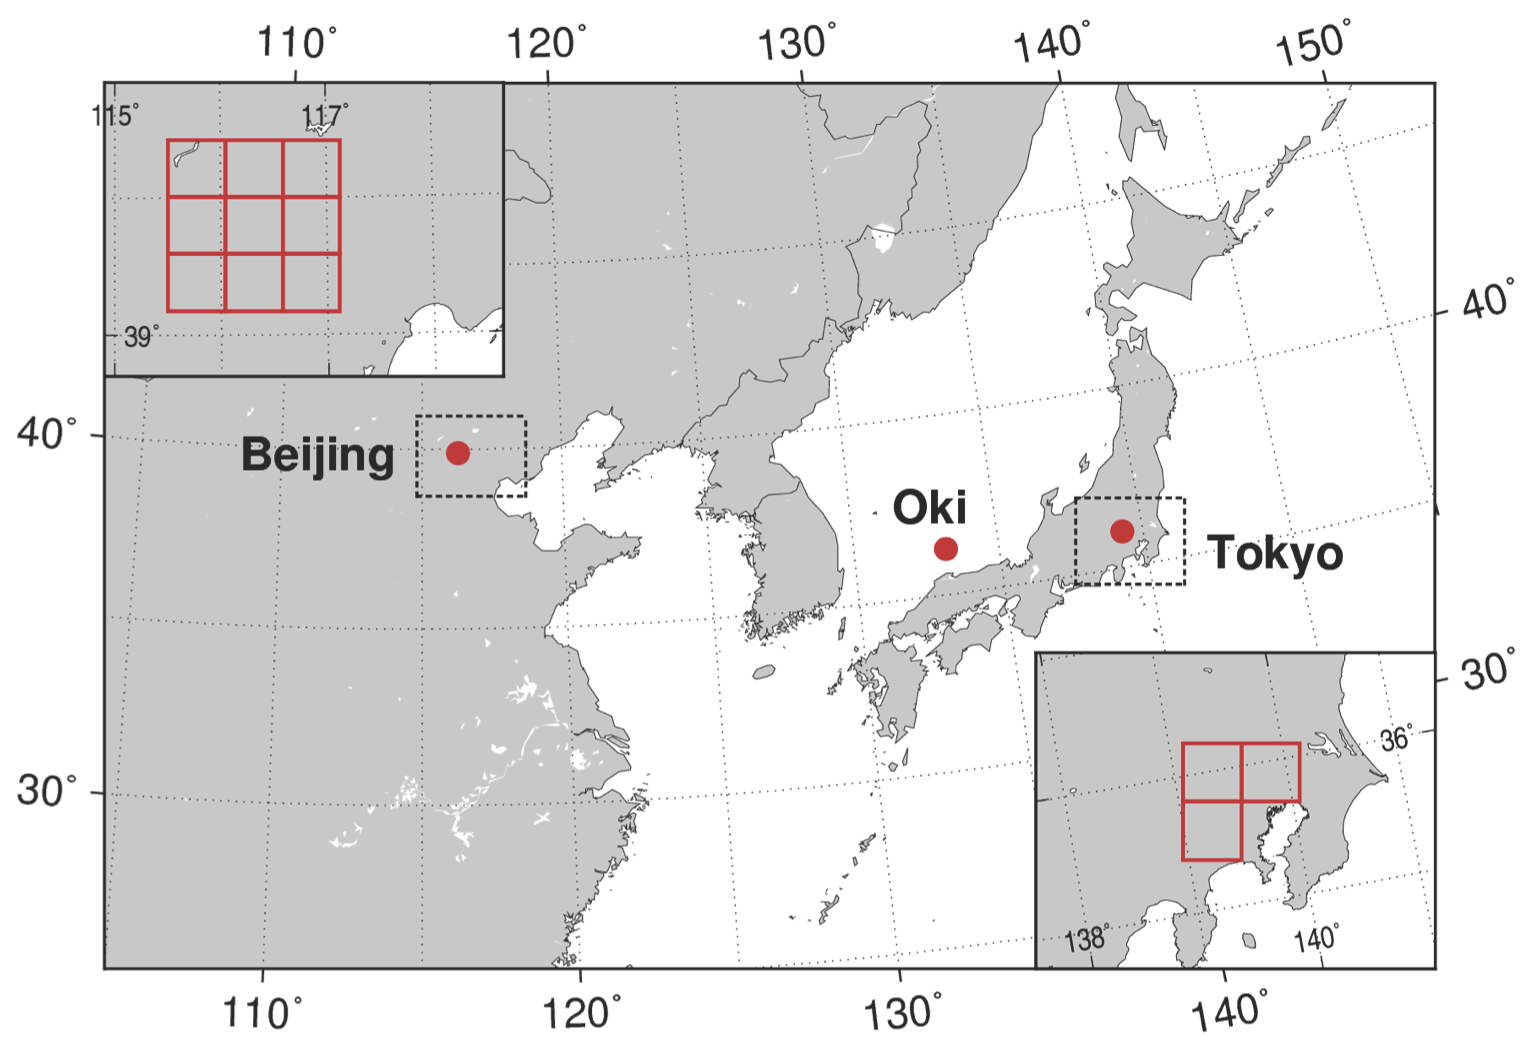
Figure 1Grids for comparison of the model simulation and observation; Beijing and Tokyo metropolitan areas and Oki EANET site.
The domains of the Beijing, Tokyo, and Oki sites were centered at 39.9∘ N, 116.3∘ E; 36.0∘ N, 139.3∘ E; and 36.3∘ N and 133.1∘ E, respectively. The selected domains for Beijing and Tokyo consisted of nine (3×3) and three (2+1) grids, respectively, covering the metropolitan areas of the cities as shown in Fig. 1. Data of a single grid covering the island were used for the Oki site. The observational data used for Tokyo were 1 h averaged values in 2010 of the average of 118 (for O3) and 126 (for NO) non-roadside monitoring stations within the selected grid (Fig. 1). The data were obtained from Atmospheric Environment Monitoring Data Files in the Environmental Information Database stored at the National Institute for Environmental Studies (NIES), Japan. In Beijing, unfortunately, no routine monitoring data of 1 h averaged values of O3 in 2010 are open to the public. Therefore, unpublished data from two sites (IAP tower campus and Yangfang) obtained by IAP, and literature values published in Xu et al. (2011) and Chen et al. (2015), have been referred to in this work. The O3 and NOx instruments at the IAP site (39.9∘ N, 116.3∘ E), which is an urban site surrounded by residential infrastructure and a freeway to the east (ca. 200 m), were on the rooftop of a building (10 m above the ground). Yangfang (39.5∘ N, 116.7∘ E) is a suburban site in the north of Beijing, ca. 40 km away from IAP. The instruments were 10 m above the ground on the campus of a university with little influence from local sources and sinks. The O3 and NOx instruments were an ultraviolet photometric analyzer (model 49i, Thermo Fisher Scientific (Thermo), USA) and a chemiluminescence analyzer (model 42i TL, Thermo, USA), respectively. One of the Beijing data that we used is the monthly averaged daily maximum concentration of O3 in April and July in 2014–2015 averaged over two suburban sites, Daxing (39.7∘ N, 116.4∘ E) and Shunyi (40.1∘ N, 116.7∘ E), presented by Chen et al. (2015). Another datum is the averaged diurnal variation at three urban–suburban sites, Fengtai, Shunyi, and Baolian, in July and August 2007, which are given in the paper by Xu et al. (2011). All the denoted observational sites in Beijing are located within the selected nine model grids shown in Fig. 1.
The observational data for Oki are the 1 h averaged EANET data in 2010 provided on request by the Network Center, Asia Center for Air Pollution Research (ACAP) (http://www.acap.asia, last access: 24 May 2018).

Figure 2Monthly averaged diurnal variation in Beijing, (a) O3 in April, (b) O3 in July, (c) NO in April, and (d) NO in July.
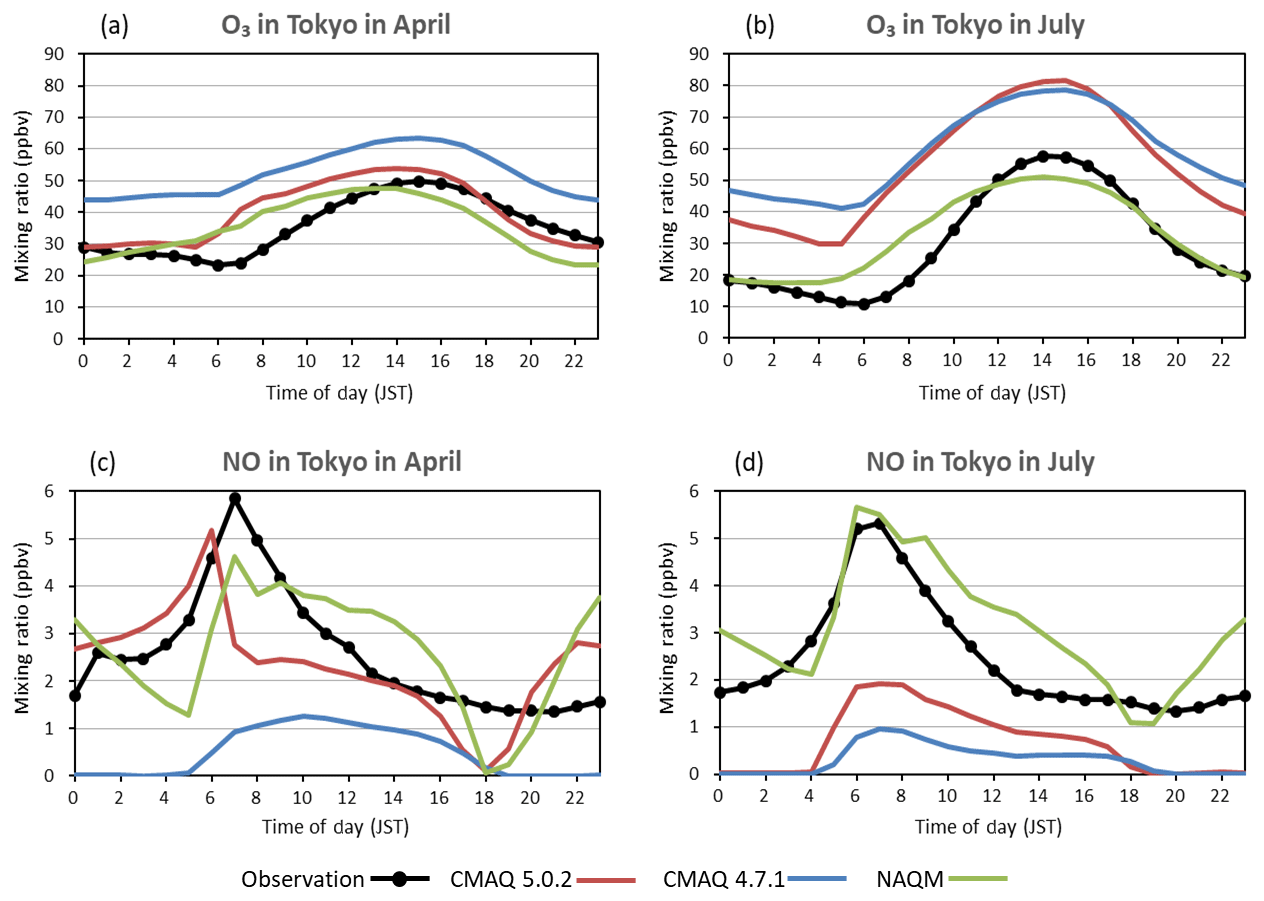
Figure 3Monthly averaged diurnal variation in Tokyo, (a) O3 in April, (b) O3 in July, (c) NO in April, and (d) NO in July.
Figure 2a–d depict the simulated and observed mixing ratios of the monthly averaged diurnal variations in the O3 and NO concentrations in April and July in Beijing, and Fig. 3a–d show similar results in Tokyo. The comparisons of the values simulated by CMAQ 5.0.2 and 4.7.1 (hereafter, “v.” for version will be omitted for simplicity) and NAQM are plotted in each figure together with the observational data.
In Beijing, observational data of surface ozone at the routine monitoring stations managed by the Beijing municipal government were, unfortunately, not available until 2013 (Chen et al., 2015). The average of two observational data sets obtained by IAP in 2010 is marked by the dashed lines with filled circles in Fig. 2a and b for O3 and in Fig. 2c and d for NO. Other published observational data of diurnal variation in O3 in Beijing in April are available by Xu et al. (2011) at four sites, two urban (Fengtai and Baolian), one suburban (Shunyi), and one rural (Shangdianzi) in summer (21 June–12 September) in 2007. Since the diurnal variation in the urban and suburban sites is consistent, the average of these three sites is plotted in Fig. 2b, marked by a dashed line with triangles. No monthly average diurnal variation in O3 is available for April in Beijing in the literature. Chen et al. (2015) reported the monthly averaged daily maximum mixing ratio of O3 to be ca. 60 ppbv at an urban site (Dongsi) and ca. 75 and 65 ppbv at two suburban sites (Daxing and Shunyi, respectively) within the selected grids in this study. If we simply take the average of these three values, the daily maximum mixing ratio is ca. 65 ppbv (not shown in Fig. 2a). Only the IAP data are plotted for NO with solid lines in Fig. 2c and d.
As can be seen in Figs. 2a, b and 3a, b, the diurnal pattern of the simulated surface ozone shows a maximum in the late afternoon around 14:00–16:00 local time in both Beijing (CST, UTC+8) and Tokyo (JST, UTC+9), agreeing well with the observations. The simulated mixing ratios of O3 by CMAQ 4.7.1 are the highest, and those simulated by NAQM are the lowest in both Beijing and Tokyo in both April and July. The diurnal variations in O3 simulated by CMAQ 4.7.1 are in parallel with the NAQM values for whole days in all cases, but the predicted mixing ratios by CMAQ 4.7.1 are higher by ca. 20 and 40 ppbv than those predicted by NAQM in April and July, respectively, in both Beijing and Tokyo. The O3 mixing ratios predicted by CMAQ 5.0.2 have peculiar seasonal characteristics; i.e., the mixing ratio is slightly higher but close to that predicted by NAQM within 10 ppbv in both Beijing and Tokyo in April, whereas in July the daytime O3 maximum predicted by CMAQ 5.0.2 is very close to that predicted by CMAQ 4.7.1, much higher than the value by NAQM. In Tokyo, the simulated mixing ratios of CMAQ 5.0.2 and NAQM are closer to the observations in April, and NAQM gives a closer matching with observations in July, while CMAQ 4.7.1 overestimates the values in both months as shown in Figs. 2b and 3b. A comparison with the observations will be discussed later, including the uncertainty of the observational data in Beijing.
The observed mixing ratios of NO show a peak value at around 07:00 (CST in Beijing and JST in Tokyo), a decrease during morning, followed by a slow decay in the afternoon, and they start to build up during nighttime in both April and July, in both Beijing and Tokyo. The peak values of the mixing ratios in the morning are ca. 13–14 and 6 ppbv in April and ca. 11 and 5–6 ppbv in July in Beijing and Tokyo, respectively. The minimum mixing ratios in the evening are ca. 1.7 and 1.4 ppbv in April and 2.3 and 1.3 ppbv in July in Beijing and Tokyo, respectively. Thus, it can be noted that the NO mixing ratios in Beijing are nearly double those in Tokyo.
The simulated mixing ratios of NO are generally in the order of , but they vary considerably among the models. In April, CMAQ 5.0.2 gives morning peak values of 13–14 ppbv in Beijing and ca. 5 ppbv in Tokyo, which agrees well with the observations. NAQM overpredicts the NO mixing ratio in April in Beijing but gives a reasonable agreement with the observations in Tokyo as shown in Figs. 2c and 3c. In contrast, CMAQ 4.7.1 gives a broad daytime peak of only ca. 2 ppbv in Beijing and ca. 1 ppbv in Tokyo in April, which is quite different from other models, and it considerably underpredicts the observational data. In July, only NAQM gives a morning peak mixing ratio of ca. 8 ppbv in Beijing and 5.5 ppbv in Tokyo, agreeing fairly well with the observations including diurnal variation (Figs. 2d and 3d). In contrast, both CMAQ 5.0.2 and 4.7.1 give morning peaks as low as 1–2 ppbv and a nearly zero mixing ratio during nighttime, which are significantly lower than the observational values.
It can be noted that the simulated and observed levels of O3 are highly anti-correlated with those of NO. For example, the reasonably good agreements of O3 simulated by CMAQ 5.0.2 and NAQM in April and by NAQM in July in Tokyo correspond to the reasonably good agreement of NO in each case. Much higher overestimates of O3 by CMAQ 4.7.1 in April and by both CMAQ 5.0.2 and 4.7.1 in July correspond to the substantial underestimates of NO.
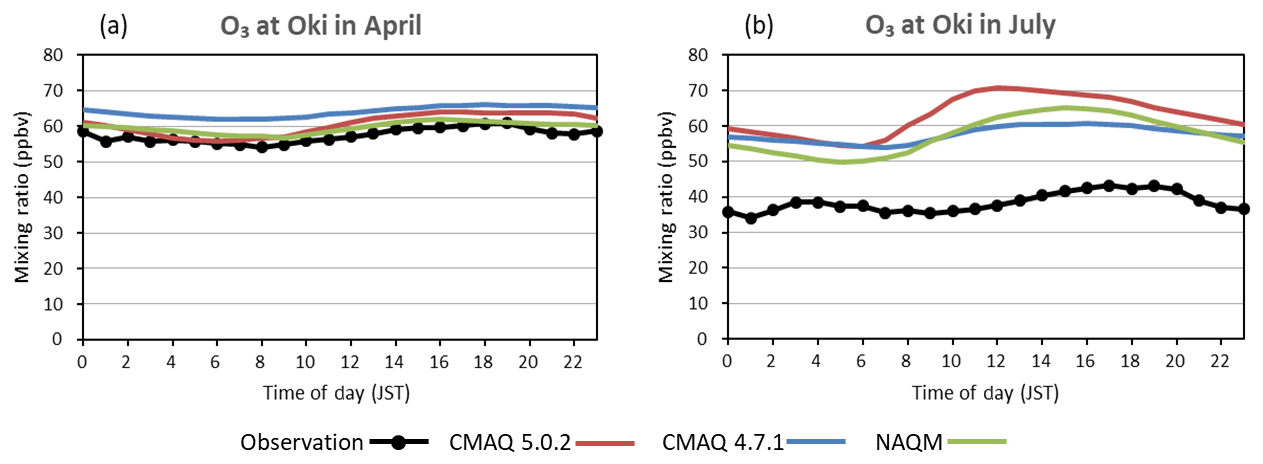
Figure 4a and b show the monthly averaged diurnal variation in O3 mixing ratios at Oki in April and July, respectively. As shown in Fig. 4a, all three models give consistent mixing ratios of O3 at 60–65 ppbv in April, agreeing well with observations within 10 ppbv. In July, although the simulated mixing ratios of O3 agree well with each other within 10 ppbv, they are in the range of 50–70 ppbv as compared to the observational level of 35–45 ppbv. Thus, all three models overestimate the O3 mixing ratio by nearly 20 ppbv. Although the characteristics of remote sites showing only a slight daytime buildup of O3 are well reproduced by the models, the substantial overestimate of the simulated O3 mixing ratio in July compared to the observational values should be of concern.
The causes of the differences in the simulated results among the three models mentioned above must be due to either chemical or transport processes incorporated in the models. Here, possible causes of differences of those processes are discussed individually.
5.1 Comparison of chemical mechanism sub-modules
One of the differences in the three models in this study is the chemical reaction mechanism sub-module. CMAQ 5.0.2 and 4.7.1 incorporate SAPRC99 while NAQM employs CBM-Z. It has been well known that different photochemical mechanisms used in regional CTMs produce different results in the prediction of O3. Jimenez et al. (2003) compared seven photochemical mechanisms including CBM-IV (Gery et al., 1989) and SAPRC99 using a box model. Comparisons of CBM-IV, CBM-V (Sarwar et al., 2008), and SAPRC99 incorporated into regional CTMs have been made by Faraji et al. (2008) and Luecken et al. (2008). The main differences among these mechanisms have been noted to be the lumping technique describing organic compounds into surrogate groups (Jimenez et al., 2003), the differences in the products of the reaction of aromatics with OH radicals, and the overall branching ratio of radical generation and termination reactions (Faraji et al., 2008). The results of these studies gave a consistent picture that SAPRC99 gives higher concentrations of O3 than CBM-IV in both the box model calculation and regional model simulation over the United States. The O3 concentration obtained by CBM-V is reported to be between the CBM-IV and SAPRC99 values (Luecken et al., 2008). The reason for the higher concentration of O3 by SAPRC99 has been deduced to be due to the more efficient peroxy radical production in the photochemical reaction scheme of SAPR99 compared to that of the CBM modules.
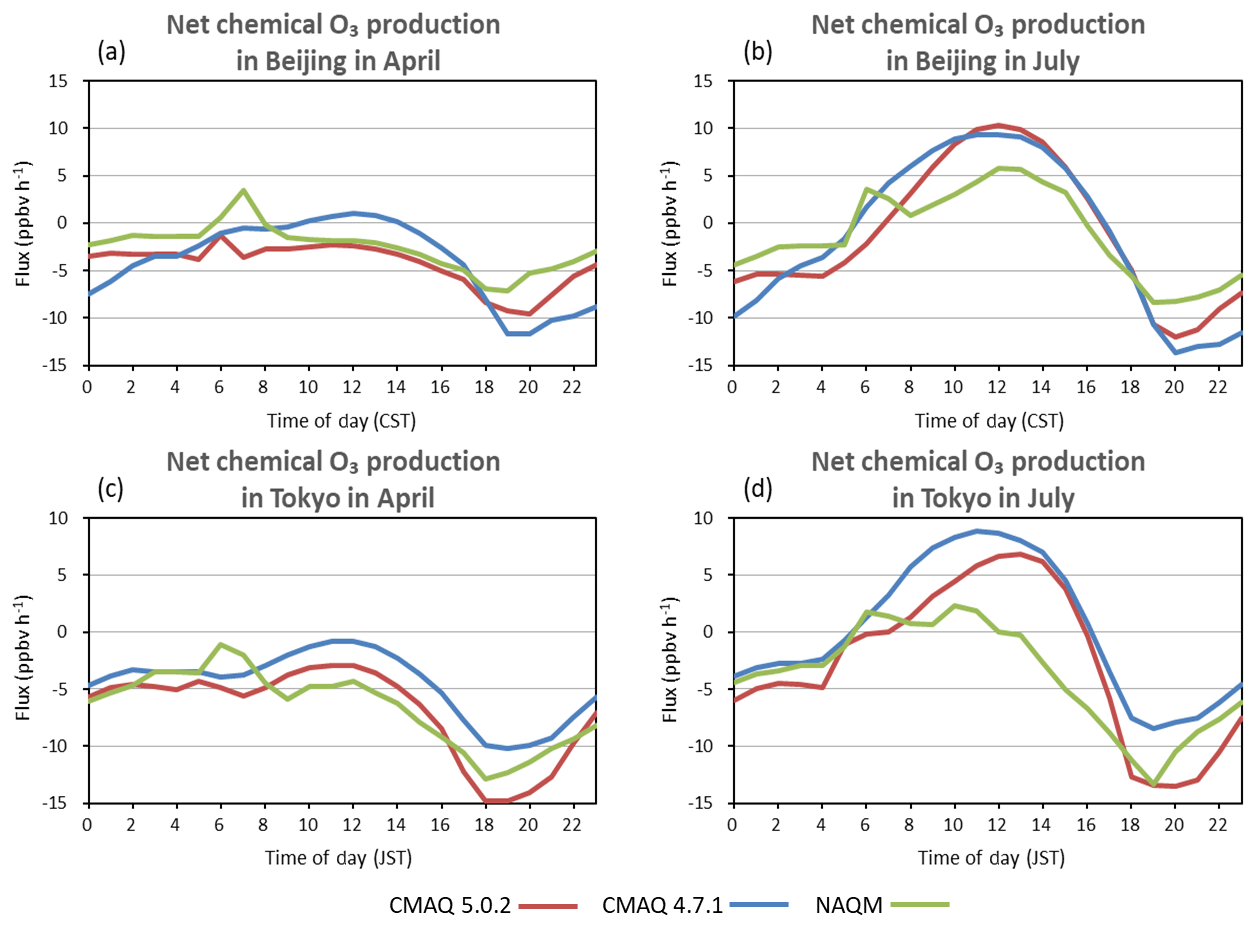
Figure 5Comparison of net chemical O3 production in (a) Beijing in April, (b) Beijing in July, (c) Tokyo in April, and (d) Tokyo in July.
Figure 5a–d show the net chemical production of O3 in Beijing and Tokyo in April and July calculated in this study. Here, the net chemical production, N(O3), was calculated by the equation in NAQM. The CMAQ models give the net chemical production as the difference in the O3 mixing ratio between the calculation steps of the chemistry module with a process analysis package. The net chemical production was calculated in each grid and then the average was taken for all the grids. As revealed in Fig. 5, the CMAQ models gave higher net ozone productions than the NAQM models did, which is consistent with the results of earlier studies, showing that the photochemical reaction scheme of SAPRC99 gives a higher O3 production than do the CBM modules. The reaction scheme of CBM-Z is the revision of CBM-IV, and the major revision is described as (1) inclusion of revised inorganic chemistry, (2) explicit treatment of lesser reactive paraffins, (3) revised parameterization for reactive paraffin, olefin, and aromatic reactions, (4) inclusion of alkyl and acyl peroxy radical interactions and their reaction with NO3, (5) inclusion of organic nitrates and hydroperoxides, and (6) refined isoprene chemistry. Although any intercomparison including CBM-Z has not been reported, the overall photochemical reactivity would be assumed to be similar to CBM-V, which gives a higher O3 value than CBM-IV and a lower value than SAPRC99. Thus, the maximum values of daytime net O3 production in CMAQ 5.0.2 and 4.7.1 in July are ca. 10 and 7–9 ppbv h−1 compared to ca. 6 and 2 ppbv h−1 in NAQM in Beijing and Tokyo, respectively, showing substantially larger values for CMAQ than for NAQM.
It can be noted that the net O3 production in NAQM shows a peak in the early morning after the break of dawn in both Beijing and Tokyo, which could be a cause of overestimation or earlier rise of O3 in the morning by the NAQM simulation as seen in Figs. 2a, b and 3a, b, although the effect is marginal in the case of Beijing in April. The cause of the early morning peak of net O3 production in NAQM might be due to the photolysis of higher HONO that is produced by the heterogeneous reaction of NO2. More quantitative sensitivity analyses should be performed to confirm these effects.
In April, the net chemical production of O3 is, in general, negative in all the models for both Beijing and Tokyo, except for that in CMAQ 4.7.1 around midday and that in NAQM in early morning, which show slightly positive values. A tendency of higher net O3 production is seen particularly for CMAQ 4.7.1, which may be the main cause of higher O3 by this model in both Beijing and Tokyo in April (Figs. 2a and 3a). The daytime net O3 production simulated by CMAQ 5.0.2 is similar to that simulated by CMAQ 4.7.1 in July but is substantially lower in April. Since the chemistry mechanism of SAPRC99 is used in both CMAQ versions, the difference may be related to the vertical transport of some relevant species.
5.2 Effects of heterogeneous “renoxification” reaction of HNO3
Figures 2 and 3 show the common feature of anti-correlation of O3 and NO concentrations as noted above. This feature is most clearly seen for the comparison of O3 and NO concentrations in July in both cities, demonstrating a large overestimation of O3 and a large underestimation of NO by CMAQ 4.7.1 and 5.0.2, while much lower O3 and much higher NO are estimated by NAQM. The situation in April also confirms this finding.
It should be noted that the rate constants of the most sensitive gas-phase reactions affecting the balance of O3 and NO (Finlayson-Pitts and Pitts, 2000; Akimoto, 2016), such as
have been well established (Burkholder et al., 2015, and earlier evaluations of the series), and more or less the same reaction rates are employed in both SAPRC99 and CBM-Z. As for the heterogeneous processes affecting NOx, the reaction
is included in common in the heterogeneous inorganic chemistry sub-module ISORROPIA and employed in the CMAQ and NAQM models.
It has been noted that the simulated gaseous HNO3 concentration and HNO3∕NOx ratio were found to be 2–10 times higher when using global and regional CTMs than the observational data during the PEM-West (Singh et al., 1996), TRACE-P (Talbot et al., 2003), and PEM-Tropics A and SONEX (Brunner et al., 2005) aircraft campaigns over the Pacific and Atlantic oceans. The same result has also been reported by ground observations in the remote troposphere at Mauna Loa (Hauglustaine et al., 1996) and in the polluted boundary layer of the Beijing–Tianjin–Hebei region (Y. Li et al., 2015).
Another concern regarding recent NOx chemistry has been focused on the high concentration of HONO in the urban atmosphere, which is thought to be produced by the heterogeneous reaction of NO2 and H2O on the aerosol and ground surface (for example, Y. Li et al., 2011; Gonçalves et al., 2012; Wong et al., 2013). Inclusion of the additional heterogeneous source of HONO not only affects the photochemical O3 formation due to the increase in OH radicals but also increases HNO3 due to the increase in the reaction . Y. Li et al. (2015) have shown that the inclusion of the heterogeneous formation of HONO gives more HNO3, which tends to give a larger overestimation of gaseous HNO3 in the Beijing–Tianjin–Hebei region.
In order to solve the problem of overestimation of HNO3, the heterogeneous reaction of HNO3 on soot surface to reproduce NO and NO2 has been proposed to be a renoxification process early by Lary et al. (1997) in the analysis of the aircraft observation data above. The heterogeneous reaction of HNO3 on soot surfaces to produce NO∕NO2 has been confirmed experimentally in laboratory studies (Disselkamp et al., 2000; Muñoz and Rossi, 2002), although the product ratio and reaction mechanism are not well established yet. The steady-state uptake coefficient γss of this reaction has been reported to be for black soot using geometric surface area (Muñoz and Rossi, 2002).
Only NAQM among the three models studied here incorporates the following heterogeneous nonstoichiometric reactions on the surface of soot (J. Li et al., 2015, 2018).
for Reaction (5) and for Reaction (6). The renoxification by Reaction (5) could have contributed to the increase in NO in Figs. 2c and d and 3c and d, resulting in a better agreement with the observation. The increase in NO could decrease O3 by the titration reaction (Reaction 1), which may also give a better agreement for O3 with the observation, particularly during nighttime. However, no quantitative sensitivity analysis has been made in the present study, and it is highly recommended that verification of the importance of such a heterogeneous renoxification reaction in model simulation be made against accurate measurements of gaseous HNO3 together with other NOy in the polluted urban atmosphere.
5.3 Effects of vertical transport
Other than the difference in chemical reaction mechanisms, the difference in transport module could give rise to differences in the output of O3 concentrations. In order to analyze the effects of transport, process analysis of horizontal and vertical transport of O3 has been conducted. Since it has been found that there is not much difference in horizontal transport and surface deposition, and the chemical mechanisms of CMAQ 5.0.2 and CMAQ 4.7.1 are the same, the difference in model performance must be ascribed to the difference in vertical transport processes.
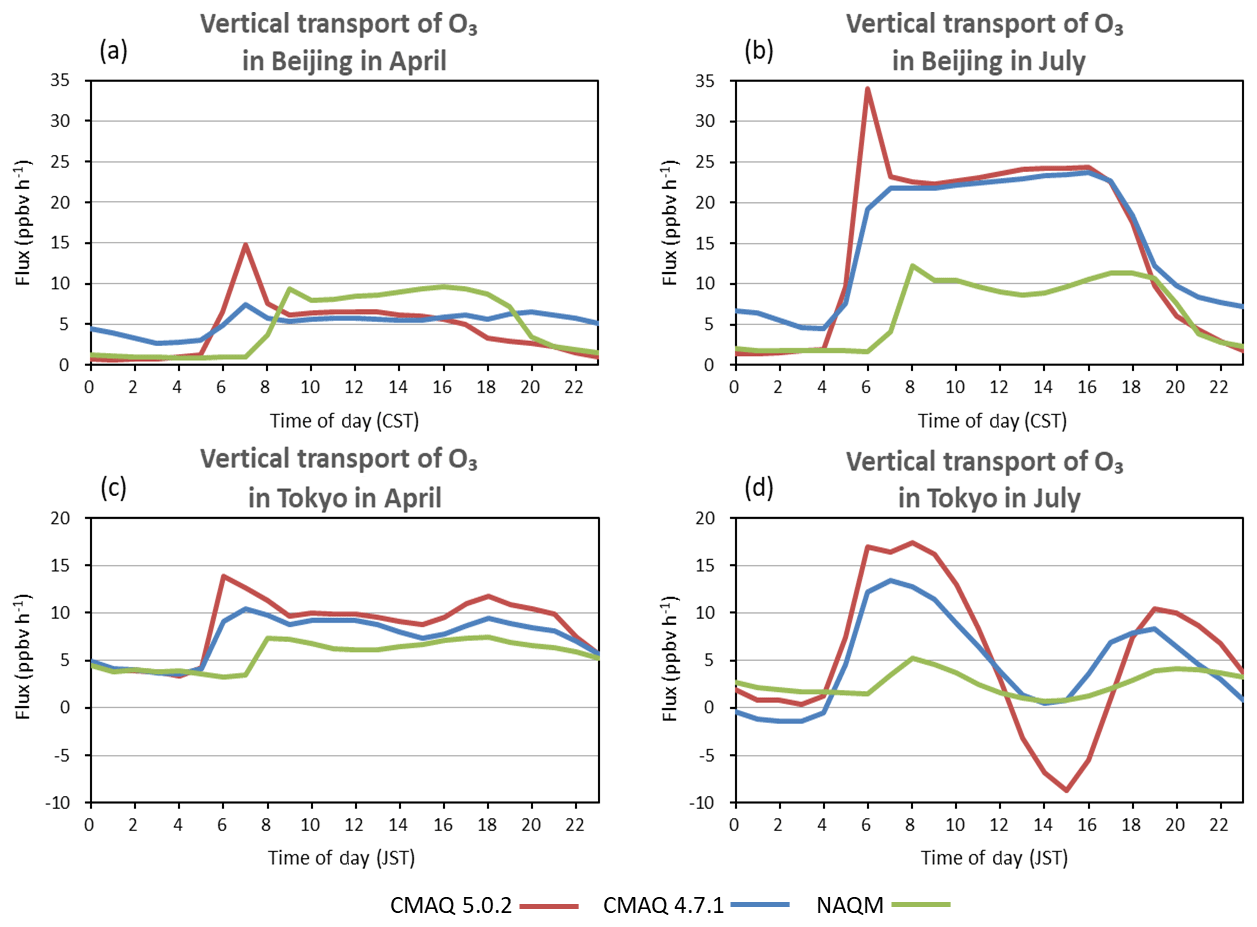
Figure 6Comparison of vertical transport of O3 in (a) Beijing in April, (b) Beijing in July, (c) Tokyo in April, and (d) Tokyo in July.
Figure 6a and b show the comparison of vertical O3 transport among the three models in Beijing in April and July, respectively, and Fig. 6c and d show similar plots for Tokyo. The daytime downward vertical flux of O3 for both CMAQ models in Beijing is nearly the same (22–25 ppbv h−1) in July and much larger than the values (ca. 6 ppbv h−1) in April. In contrast, the values of NAQM are ca. 10 ppbv h−1 in both April and July, which is larger than the values of CMAQ in April, but smaller than those of CMAQ by a factor of 2 in July. The diurnal variation in vertical O3 flux in Tokyo is quite different from that in Beijing in July; downward O3 flux is positive only in the morning till noon and nearly zero or negative in the afternoon. Such characteristics are common for all three models. The maximum downward fluxes of O3 in the morning in Tokyo in CMAQ 5.0.2 (ca. 17 ppbv h−1) and CMAQ 4.7.1 (ca. 13 ppbv h−1) are much higher than those in NAQM (<5 ppbv h−1). Thus, it is concluded that at least a part of much higher O3 concentrations estimated by CMAQ 5.0.2 and 4.7.1 compared to NAQM shown in Figs. 2b and 3b in Beijing and Tokyo in July can be ascribed to the higher downward O3 flux estimated by the CMAQ models compared to NAQM.
A peculiar feature of vertical O3 flux in CMAQ 5.0.2 shown in Fig. 6 is the strong positive morning peak at around 07:00 and 06:00 CST in Beijing in April and July, respectively, and also at 06:00–07:00 JST in Tokyo in April. Here, it should be noted that the vertical transport was computed in the PPM scheme in CMAQ 5.0.2 instead of the direct extraction from WRF in CMAQ 4.7.1 as described in the method section. The PPM method has been known to introduce more downward flux of O3 from higher layers to the surface layer. Another point to be noted is the delayed rise of vertical downward O3 flux by nearly 2 h in NAQM in both April and July in Beijing and Tokyo. Although this feature is not scrutinized in this study, it should be noted here that the vertical transport treatment significantly affects the simulated results of O3 in regional CTMs.

Figure 7Monthly averaged diurnal variation in (a) O3 concentration in April, (b) hourly O3 concentration change in April, (c) O3 concentration in July, and (d) hourly O3 concentration change in July in Beijing.
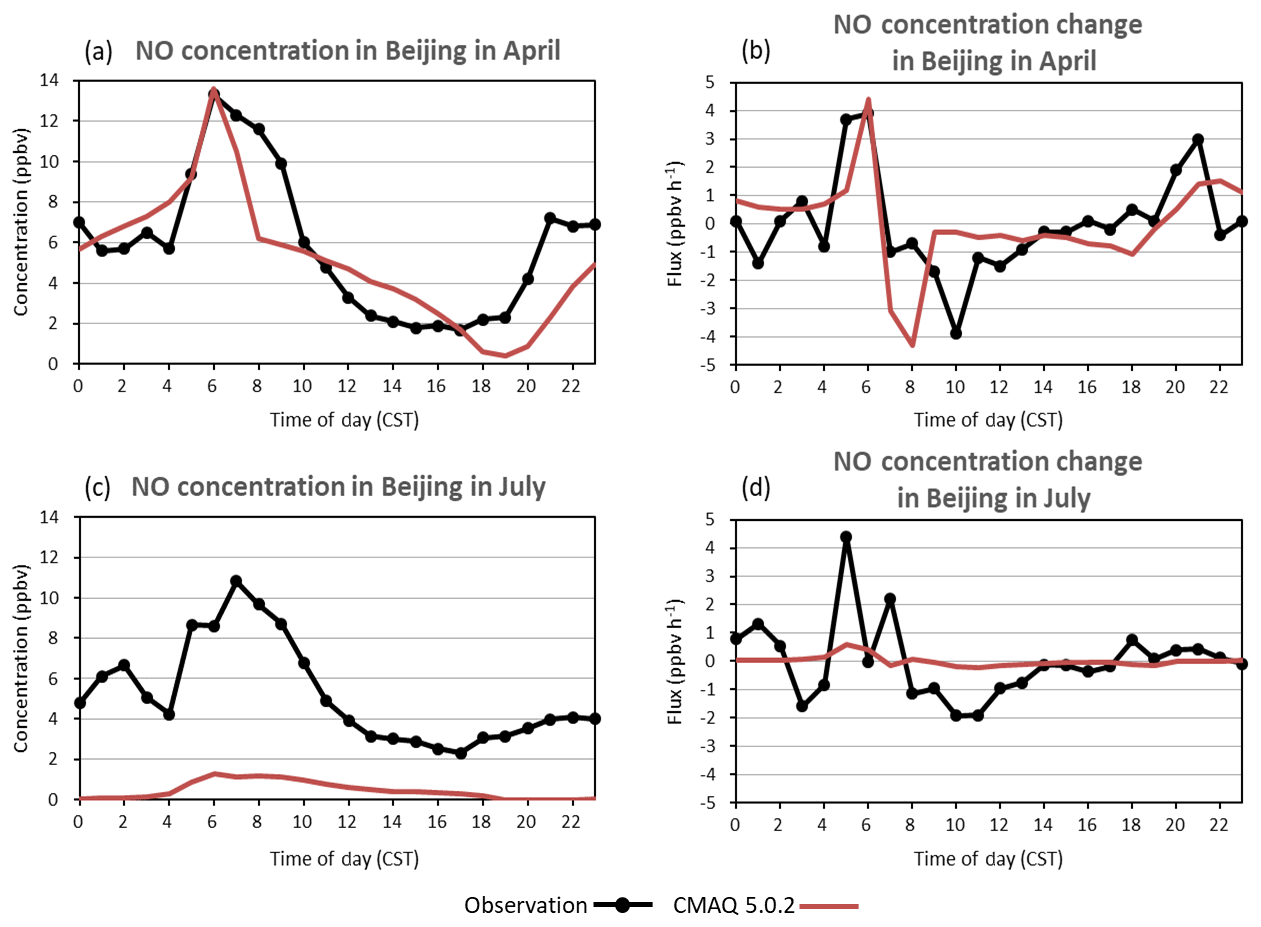
Figure 8Monthly averaged diurnal variation in (a) NO concentration in April, (b) hourly NO concentration change in April, (c) NO concentration in July, and (d) hourly NO concentration change in July in Beijing.
5.4 Comparison of the transport process in CMAQ v.5.0.2 and v.4.7.1
As seen in Figs. 2 and 3, CMAQ 5.0.2 gives relatively low O3 and relatively high NO mixing ratios, closer to the values in NAQM in April, but relatively high O3 and low NO closer to those in CMAQ 4.7.1 in July in both Beijing and Tokyo. Since the chemical mechanisms of CMAQ 5.0.2 and CMAQ 4.7.1 are the same, the difference in the model performance must be ascribed to the difference in transport processes. Figure 7a and b show the comparison of O3 mixing ratios and the change in hourly O3 mixing ratios between CMAQ 5.0.2 and the observations in Beijing in April, and similar plots for July are shown in Fig. 7c and d. As for the observational values, data provided by IAP are used for the plots. The large rise in the change of O3 concentrations at 07:00–08:00 shown in Fig. 7b and d clearly corresponds to the early morning peak of downward transport flux of O3 at 06:00–07:00 CST in Fig. 6a and b. Such a sharp rise at 07:00 a.m. is not seen in CMAQ 4.7.1, although a small peak is discernable in April. This implies that such a feature is due to the characteristics of the vertical transport module of CMAQ 5.0.2. Similar plots for NO are shown in Fig. 8a–d. In April, the NO mixing ratio by CMAQ 5.0.2 rises in early morning, which corresponds well with the observation. The cause of such an early morning rise of NO mixing ratio and change in hourly mixing ratio is assumed to be the increase in traffic in the morning. In July, however, although the observation of NO mixing ratio and hourly change shows a similar morning peak in April, the CMAQ 5.0.2 simulation does not give any such morning peak, which would correspond to a very low NO mixing ratio simulated by CMAQ 5.0.2 together with CMAQ 4.7.1 as seen in Fig. 2d. Although the phenomena could be caused by rapid oxidation of NO to NO2 in summer, the reason is unknown at this stage.
It should be noted that after the large rise at 07:00–08:00 CST, the hourly change of O3 mixing ratio simulated by CMAQ 5.0.2 agrees well with the observed O3 change in the late morning and afternoon as shown in Fig. 7b and d. This implies that the large morning surge gives a much earlier rise of O3 compared to the observation. It can be noted, however, that the morning surge at 07:00 CST in July is ca. 15 ppbv, which is not much higher than ca. 10 ppbv in April. Thus, although the morning surge is larger in July than in April, this would not be the main cause of the much higher predicted O3 concentration in the morning in July compared to April. A large difference in the simulated concentration of nighttime O3 can be seen between April and July in CMAQ 5.0.2 and also between CMAQ 5.0.2 and CMAQ 4.7.1 in April. The nighttime O3 is as low as 10–20 ppbv in Beijing and 20–30 ppbv in Tokyo in both CMAQ 5.0.2 and NAQM in April, agreeing with observation. However, the nighttime O3 simulated by CMAQ 4.7.1 is as high as 30 and 45 ppbv in April in Beijing and Tokyo, respectively. In July, the nighttime O3 is 20–30 ppbv in Beijing and ca. 20 ppbv in Tokyo in NAQM, which is close to the observation, while both CMAQ models give 40–50 ppbv in both Beijing and Tokyo, which is substantially higher than the observation. The high nighttime O3 simulated by the CMAQ models would contribute at least partly to the high daytime O3 in July. Although the coarse resolution of 45 km grid tends to give a higher nighttime O3 due to less effective NO titration, it would not be enough to explain such a high nighttime O3 in CMAQ 4.7.1 for both April and July and CMAQ 5.0.2 for July since the NAQM simulation with the same grid size reproduces the nighttime O3 as low as 20 ppb, agreeing better with the observation. It would be important to quantify the effect of the heterogeneous production of nighttime NO from HNO3 to evaluate its impact on nighttime O3.
5.5 Comparison of simulations with the observational data of O3 in Beijing and Tokyo
Both CMAQ 5.0.2 and NAQM give reasonably good agreement of O3 mixing ratios with the observational data in April in Tokyo. It can be noted that both CMAQ 5.0.2 and NAQM give higher mixing ratios by 10–15 ppb after dawn. For CMAQ 5.0.2, as mentioned above, the overestimate could be caused by the peak of downward O3 flux in the early morning. NAQM gives a similar overestimate of the O3 mixing ratio by ca. 10 ppbv in the early morning, but this phenomenon could be caused by the peak of the net chemical ozone production (Fig. 5) rather than the vertical transport. Although the cause of the early morning peak of the net O3 production has not been elucidated in this study, it may be related to the photolysis of HONO accumulated during nighttime since the heterogeneous production of HONO (Eq. 6) is included in NAQM.
In July, NAQM is the sole model giving a good agreement with the observation in Tokyo. It can be noted, however, that the calculated concentration is higher than the observation by ca. 10 ppbv in early morning similar to April. Such a higher rise of the O3 mixing ratio in the early morning is discernible in July in Tokyo in CMAQ 5.0.2. The same phenomenon can also be seen in July in Tokyo, and the cause is assumed to be the early morning peaks of downward flux of O3 and net O3 production in CMAQ 5.0.2 and NAQM, respectively. It should be noted that the enhanced mixing ratios of O3 in early morning are persistent at least till noon, giving higher values of simulated mixing ratios.
Substantially higher simulated O3 mixing ratios in CMAQ 4.7.1 than the observation in both April and July, and in CMAQ 5.0.2 in July in Tokyo (Fig. 3a and b) may at least partially be caused by the higher nighttime mixing ratios of O3, which would contribute to the baseline mixing ratio for the whole day. It would be expected that if the nighttime O3 could be reduced to the observational level, a better agreement of O3 with observation would be expected for the whole day.
As for the observational data in Beijing, the daily maximum of O3 mixing ratio in July is ca. 90 ppbv in Xu et al. (2011) and ca. 60 ppbv by the IAP data, while the nighttime minimums are both 10–20 ppbv consistently. Since the maximum O3 mixing ratio in summer is expected to be higher in Beijing than in Tokyo (ca. 60 ppbv) due to higher NO (see Figs. 2d and 3d) and NO2 levels by a factor of ∼2 (not shown), the higher observational data in Beijing than in Tokyo in Fig. 2c could be more representative for the average of the calculated grids in Beijing. Although there is still a large uncertainty in the monthly averaged observational data of O3 in Beijing in 2010, a tendency of overestimation by CMAQ 5.0.2 and 4.7.1 and underestimation by NAQM in Beijing in July can be suggested.
In April in Beijing, Chen et al. (2015) reported the daily maximum mixing ratio of O3 at ca. 65 ppbv in 2014–2015, which is substantially higher than the IAP data of ca. 40 ppbv in 2010. An increase in surface ozone has been reported in Beijing at the rural sites of Shangdianzi during the period of 2004–2015 with regard to the maximum daily average 8 h mixing ratios (MDA8) (Ma et al., 2016). Although the long-term increasing trend indicates an average rate of 1.13±0.01 ppb yr−1, no monthly data were reported, and the year-by-year variability is substantial. If we assume that the monthly averaged MDA8 values in April 2010 are lower by 10 ppbv than those in 2015, the uncertainty of the daily maximum observational value in April in Beijing would be in the range of 40–55 ppbv. Thus, within the uncertainty range, a tendency of overestimation by CMAQ 4.7.1 and an underestimation by NAQM could be suggested.
As for the discussion of reproducibility of the model simulation, a comparison of 3-year averaged values in more recent years after 2013, when routine monitoring data at considerably more sites within the targeted grids are available, would be highly desirable, particularly in Beijing.
5.6 Overestimation of O3 at Oki, a remote oceanic site
At the remote site of Oki, an overestimation by ca. 20 ppb for daytime O3 has been seen in July in Fig. 4b by all three models with a spatial resolution of 45 km. Such an overestimation of summertime O3 at Oki by the CMAQ models has been reported by Lin et al. (2009) with MM5-CMAQ v.4.6 (27 km×27 km), while a much better agreement with the observation was previously reported by Yamaji et al. (2006) (80 km×80 km) using RAMS-CMAQ v.4.4 and J. Li et al. (2007) using NAQM (81 km×81 km). The seasonal variation in O3 at remote sites around Japan has shown a springtime monthly maximum of ca. 60 ppb and a summertime monthly minimum of 35–40 ppb (Pochanart et al., 1999, 2002), which is consistent with the observational data shown in Fig. 4. The summertime minimum at Oki and other remote islands in this region are well established to be due to prevailing clean marine air (Pochanart et al., 2002; Yamaji et al., 2006).
Since the overestimation does not depend on the spatial resolution of the model, as noted above, and the daytime buildup of O3 due to local photochemical activity is <10 ppbv in the observation and 5–15 ppbv in the simulation as shown in Fig. 4b, the overestimation of O3 concentration in July by all three models cannot be ascribed to the direct influence of nearby terrestrial emissions of precursors in mainland Japan. The overestimation could be due to either a more frequent influence of terrestrial air masses by WRF compared to the real meteorology or higher O3 concentration in the oceanic air around this area affected by the influence of non-episodic terrestrial emissions including long-range transport. The reproduction of observed concentrations by models at Oki would be important for the analysis of air quality in Japan since air masses passing through Oki provide a flowing-in background mixing ratio to mainland Japan.
In order to identify the causes of the substantial variability among the simulated modeling results for surface ozone in MICS-Asia III even though using the same emissions, meteorological field, and boundary conditions, three regional models, namely CMAQ 5.0.2 and 4.7.1 and NAQM, were selected and a detailed comparison was made in the selected grids covering the metropolitan areas in Beijing and Tokyo and at the remote oceanic site of Oki. The analyses were made for the monthly averaged diurnal change of surface ozone in April and July 2010.
The simulated O3 concentration was the highest in CMAQ 4.7.1, followed by that in CMAQ 5.0.2 and NAQM in both Beijing and Tokyo in April, while both CMAQ models gave much higher O3 values than NAQM did in July. At Oki, the simulations for O3 by all three models agree well with each other and with the observation in April. In July, however, all the models overestimated daytime O3 by ca. 20 ppb compared to the observation.
Three causes for the difference among model outputs have been identified and discussed.
-
The chemistry mechanism sub-module SAPRC99 used in the CMAQ was found to give higher net ozone production values than CBM-Z in NAQM, agreeing with previous studies.
-
Higher NO concentrations have been predicted by NAQM than by CMAQ, possibly due to the inclusion of a heterogeneous renoxification reaction of , which gave a better agreement with observational concentration, particularly for nighttime NO and O3.
-
A vertical downward O3 flux was found to substantially affect the diurnal pattern and mixing ratios of O3.
All the concentration data of O3 and NO used in Figs. 2–4 and 7–8 were from the submitted data for MICS-Asia III. The availability of the data may be specified in the overview paper for O3 by Li et al. (2019). The process analysis data for CMAQ v.5.0.2 and v. 4.7.1 and NAQM used in Figs. 5–6 were provided by each co-author, Joshua S. Fu., Tatsuya Nagashima, and Jie Li, respectively.
HA analysed the data and wrote the first draft of the paper. TN, JL, and JSF provided the process analysis data for their own models and conducted discussions for the paper. DJ provided the observational data of IAP, and JT performed a process analysis calculation using their model. ZW contributed to the availability of modeling data of MICS-Asia III and to overall discussion of the paper.
The authors declare that they have no conflict of interest.
This article is part of the special issue “Regional assessment of air pollution and climate change over East and Southeast Asia: results from MICS-Asia Phase III”. It is not associated with a conference.
This research was supported by the Environment Research and Technology
Development Fund (S12-1) of the Ministry of the Environment, Japan, and by
the Natural Science Foundation of China (41620104008).
Edited by: Gregory R. Carmichael
Reviewed by: two anonymous referees
Akimoto, H.: Atmospheric Reaction Chemistry, Springer Japan, Tokyo, 2016.
Binkowski, F. S. and Roselle, S. J.: Models-3 Community Multiscale Air Quality(CMAQ) model aerosol component 1. Model description, J. Geophys. Res., 108, 4183, https://doi.org/10.1029/2001JD001409, 2003.
Brunner, D., Staehelin, J., Rogers, H. L., Köhler, M. O., Pyle, J. A., Hauglustaine, D. A., Jourdain, L., Berntsen, T. K., Gauss, M., Isaksen, I. S. A., Meijer, E., van Velthoven, P., Pitari, G., Mancini, E., Grewe, V., and Sausen, R.: An evaluation of the performance of chemistry transport models – Part 2: Detailed comparison with two selected campaigns, Atmos. Chem. Phys., 5, 107–129, https://doi.org/10.5194/acp-5-107-2005, 2005.
Burkholder, J. B., Sander, S. P., Abatt, J. P. D., Barker, J. R., Huie, R. E., Kolb, C. E., Kurylo, M. J., Orkin, V. L., Wilmouth, D. M., and Wine, P. H.: Chemical Kinetics and Photochemical Data for Use in Atmospheric Studies, Evaluation Number 18, JPL Publication 15-10, Pasadena, California, available at: http://jpldataeval.jpl.nasa.gov/ (last access: 31 July 2018), 2015.
Carter, W. L.: Implementation of the SAPRC-99 chemical mechanism into the Models-3 framework, Report to the United States Environmental Protection Agency, 29 January 2000.
Chen, W., Tang, H., and Zhao, H.: Diurnal, weekly and monthly spatial variations of air pollutants and air quality of Beijing, Atmos. Environ., 119, 21–34, 2015.
CMAS: Operational Guidance for the Community Multiscale Air Quality (CMAQ) Modeling System: Version 5.0, available at: https://www.airqualitymodeling.org/index.php/CMAQ (last access: 31 July 2018), version 5.0 (February 2010 release), OGD, 2011.
Disselkamp, R. S., Carpenter, M. A., and Cowin, J. P.: A chamber investigation of nitric acid-soot aerosol chemistry at 298 K, J. Atmos. Chem., 37, 113–123, 2000.
Faraji, M., Kimura, Y., and Allen, D.: Comparison of the Carbon Bond and SAPRC photochemical mechanisms under conditions relevant to southeast Texas, Atmos. Environ., 42, 5821–5836, 2008.
Finlayson-Pitts, B. J. and Pitts Jr., J. N.: Chemistry of the Upper and Lower Atmosphere, Academic Press, San Diego, 2000.
Fiore, A. M., Dentener, F. J., Wild, O., Cuvelier, C., Schultz, M. G., Hess, P., Textor, C., Schulz, M., Doherty, R. M., Horowitz, L. W., MacKenzie, I. A., Sanderson, M. Shindell, G., D. T., Stevenson, D. S., Szopa, S., Van Dingenen, R., Zeng, G., Atherton, C., Bergmann, D., Bey, I., Carmichael, G., Collins, W. J., Duncan, B. N., Faluvegi, G., Folberth, G., Gauss, M., Gong, S., Hauglustaine, D., Holloway, T., Isaksen, I. S. A., Jacob, D. J., Jonson, J. E., Kaminski, J. W., Keating, T. J., Lupu, A., Marmer, E., Montanaro, V., Park, R. J., Pitari, G., Pringle, K. J., Pyle, J. A., Schroeder, S., Vivanco, M. G., Wind, P., Wojcik, G., Wu, S., and Zuber A.: Multimodel estimates of intercontinental source- receptor relationships for ozone pollution, J. Geophys. Res., 114, D04301, https://doi.org/10.1029/2008JD010816, 2009.
Foley, K. M., Roselle, S. J., Appel, K. W., Bhave, P. V., Pleim, J. E., Otte, T. L., Mathur, R., Sarwar, G., Young, J. O., Gilliam, R. C., Nolte, C. G., Kelly, J. T., Gilliland, A. B., and Bash, J. O.: Incremental testing of the Community Multiscale Air Quality (CMAQ) modeling system version 4.7, Geosci. Model Dev., 3, 205–226, https://doi.org/10.5194/gmd-3-205-2010, 2010.
Fountoukis, C. and Nenes, A.: ISORROPIA II: a computationally efficient thermodynamic equilibrium model for K+–Ca2+–Mg2+––Na+–––Cl−–H2O aerosols, Atmos. Chem. Phys., 7, 4639–4659, https://doi.org/10.5194/acp-7-4639-2007, 2007.
Fu, J. S., Dong, X., Gao, Y., Wong, D. C., and Lam, Y. F.: Sensitivity and linearity analysis of ozone in East Asia: The effects of domestic emission and intercontinental transport, J. Air Waste Manag. Assoc., 62, 1102–1114, 2012.
Gery, M. W., Whitten, G. Z., Killus, J. P., and Dodge, M. C.: A photochemical kinetics mechanism for urban and regional scale computer modeling, J. Geophys. Res., 94, 12925–12956, 1989.
Gonçalves, M., Dabdub, D., Chang, W. L., Jorba, O., and Baldasano, J. M.: Impact of HONO sources on the performance of mesoscale air quality models, Atmos. Environ., 54, 168–176, 2012.
Han, Z., Sakurai, T., Ueda, H., Carmichael, G. R., Streets, D., Hayami, H., Wang, Z., Holloway, T., Engardt, M., Hozumi, Y., Park, S. U., Kajino, M., Sartelet, K., Fung, C., Bennet, C., Thongboonchoo, N., Tang, Y., Chang, A., Matsuda, K., and Amann, M.: MICS-Asia II: Model intercomparison and evaluation of ozone and relevant species, Atmos. Environ., 42, 3491–3509, 2008.
Hauglustaine, D. A., Ridley, B. A., Solomon, S., Hess, P. G., and Madronich, S.: HNO3∕NOx ratio in the remote troposphere During MLOPEX 2: Evidence for nitric acid reduction on carbonaceous aerosols?, Geophys Res. Lett., 23, 2609–2612, 1996.
Jaffe, D. A., Honrath, R. E., Zhang, L., Akimoto, H., Shimizu, A., Mukai, H., Murano, K. Hatakeyama, S., and Merrill, J.: Measurements of NO, NOy, CO and O3 and estimation of the ozone production rate at Oki Island, Japan, during PEM-West, J. Geophys. Res., 101, 2037–2048, 1996.
Jimenez, P., Baldasano, J. M., and Dabdub, D.: Comparison of photochemical mechanisms for air quality modeling, Atmos. Environ., 37, 4179–4194, 2003.
Kurokawa, J., Ohara, T., Uno, I., Hayasaki, M., and Tanimoto, H.: Influence of meteorological variability on interannual variations of springtime boundary layer ozone over Japan during 1981–2005, Atmos. Chem. Phys., 9, 6287–6304, https://doi.org/10.5194/acp-9-6287-2009, 2009.
Lary, D. J., Lee, A.M., Toumi, R., Newchurch, M. J., Pirre, M., and Renard, J. B.: Carbon aerosols and atmospheric photochemistry, J. Geophys. Res., 102, 3671–3682, 1997.
Li, J., Wang, Z., Akimoto, H., Gao, C., Pochanart, P., and Wang, X.: Modeling study of ozone seasonal cycle in lower troposphere over east Asia, J. Geophys. Res., 112, D22S25, https://doi.org/10.1029/2006JD008209, 2007.
Li, J., Wang, Z., Zhuang, G., Luo, G., Sun, Y., and Wang, Q.: Mixing of Asian mineral dust with anthropogenic pollutants over East Asia: a model case study of a super-duststorm in March 2010, Atmos. Chem. Phys., 12, 7591–7607, https://doi.org/10.5194/acp-12-7591-2012, 2012.
Li, J., Dong, H., Zeng, L., Zhang, Y., Shao, M., Wang, Z., Sun, Y., and Fu, P.: Exploring Possible Missing Sinks of Nitrate and Its Precursors in Current Air Quality Models – A Case Simulation in the Pearl River Delta, China, Using an Observation-Based Box Model, SOLA, 11, 124–128, 2015.
Li, J., Yang, W., Wang, Z., Chen, H., Hu, B., Li, J., Sun, Y., and Fu, P.: Y. Zhang, Modeling study of surface ozone source-receptor relationships in East Asia, Atmos. Res., 167, 77–88, 2016.
Li, J., Chen, X., Wang, Z., Du, H., Yang, W., Sun, Y., Hu, B., Li, J., Wang, W., Wang, T., Fu, P., and Huang, H.: Radiative and heterogeneous chemical effects of aerosols on ozone and inorganic aerosols over East Asia, Sci. Total Environ. 622–623, 1327–1342, 2018.
Li, J., Nagashima, T., Kong, L., Ge, B., Yamaji, K., Fu, J. S., Wang, X., Itahashi, S., Lee, H.-J., Kim, C.-H., Lin, C.-Y., Zhang, M., Tao, Z., Kajino, M., Liao, H., Li, M., Woo, J.-H., Kurokawa, J., Pan, Y., Wu, Q., Akimoto, H., Carmichael, G. R., and Wang Z.: Model evaluation and inter-comparison of surface-level ozone and relevant species in East Asia in the context of MICS-ASIA phase III, Atmos. Chem. Phys. Discuss., submitted, 2019.
Li, M., Zhang, Q., Kurokawa, J.-I., Woo, J.-H., He, K., Lu, Z., Ohara, T., Song, Y., Streets, D. G., Carmichael, G. R., Cheng, Y., Hong, C., Huo, H., Jiang, X., Kang, S., Liu, F., Su, H., and Zheng, B.: MIX: a mosaic Asian anthropogenic emission inventory under the international collaboration framework of the MICS-Asia and HTAP, Atmos. Chem. Phys., 17, 935–963, https://doi.org/10.5194/acp-17-935-2017, 2017.
Li, Y., An, J., Min, M., Zhang, W., Wang, F., and Xie, P.: Impacts of HONO sources on the air quality in Beijing, Tianjin and Hebei Province of China, Atmos. Environ., 45, 4735–4744, 2011.
Li, Y., An, J., Kajino, M., Li, J., and Qu, Y.: Impacts of additional HONO Sources on concentrations and deposition of NOy in the Beijing-Tianjin-Hebei Region of China, SOLA, 11, 36–42, 2015.
Lin, M., Holloway, T., Oki, T., Streets, D. G., and Richter, A.: Multi-scale model analysis of boundary layer ozone over East Asia, Atmos. Chem. Phys., 9, 3277–3301, https://doi.org/10.5194/acp-9-3277-2009, 2009.
Luecken, D. Phillips, L. S., Sarwar G., and Jang, C.: Effects of using the CB05 vs. SAPRC99 vs. CB4 chemical mechanism on model predictions: Ozone and gas-phase photochemical precursor concentrations, Atmos. Environ., 42, 5805–5820, 2008.
Ma, Z., Xu, J., Quan, W., Zhang, Z., Lin, W., and Xu, X.: Significant increase of surface ozone at a rural site, north of eastern China, Atmos. Chem. Phys., 16, 3969–3977, https://doi.org/10.5194/acp-16-3969-2016, 2016.
Monks, P. S.: A review of the observations and origins of the spring ozone maximum, Atmos. Environ., 34, 3545–3561, 2000.
Muñoz, M. S. S. and Rossi, M. J.: Heterogeneous reactions of HNO3 with flame soot generated under different combustion conditions. Reaction mechanism and kinetics, Phys. Chem. Chem. Phys., 4, 5110–5118, 2002.
Nenes, A., Pandis, S. N., and Pilinis, C.: ISORROPIA: A new thermodynamic equilibrium model for multiphase multicomponent inorganic, Aerosols, Aquat. Geochem., 4, 123–152, 1998.
Pleim, J. E.: A combined local and nonlocal closure model for the atmospheric boundary layer. Part I: Model description and testing, J. Appl. Meteor. Climatol., 46, 1383–1395, 2007.
Pochanart, P., Hirokawa, J., Kajii, Y., and Akimoto, H.: Influence of regional-scale anthropogenic activity in northeast Asia observed at Oki, Japan, J. Geophys. Res., 104, 3621–3631, 1999.
Pochanart, P.,. Akimoto, H, Kinjo, Y., and Tanimoto, H.: Surface ozone at four remote island sites and the preliminary assessment of the exceedances of its critical level in Japan, Atmos. Environ., 36, 4235–4250, 2002.
Pochanart, P., Akimoto, H., Kajii, Y., Potemkin, V. M., and Khodzher, T. V.: Regional background ozone and carbon monoxide variations in remote Siberia/East Asia, J. Geophys. Res., 108, 4028, https://doi.org/10.1029/2001JD001412, 2003.
Sarwar, G., Luecken, D., Yarwood, G., Whitten, G., and Carter, W. P. L.: Impact of an updated Carbon Bond mechanism on predictions from the CMAQ modeling system: preliminary assessment, J. Appl. Meteor. Climat., 47, 3–14, 2008.
Singh, H. B., Herlth, D., Kolyer, R., Salas, L., Bradshaw, J. D., Sandholm, S. T., Davis, D. D., Crawford, J., Kondo, Y., Koike, M., Talbot, R., Gregory, G. L., Sachse, G. W., Browell, E., Blake, D. R., Rowland, F. S., Newell, R., Merrill, J., Heikes, S. B., Liu, C., Crutzen, P. J., and Kanakidou, M.: Reactive nitrogen and ozone over the western Pacific: Distribution, partitioning, and sources, J. Geophys Res., 101, 1793–1808, 1996.
Talbot, R., Dibb, J., Scheuer, E., Seid, G., Russo, R., Sandholm, S., Tan, D., Singh, H., Blake, D., Blake, N., Atlas, E., Sachse, G., Jordan, C., and Avery, M.: Reactive nitrogen in Asian continental outflow over the western Pacific: Results from the NASA Transport and Chemical Evolution over the Pacific (TRACE-P) airborne mission, J. Geophys Res., 108, D20, https://doi.org/10.1029/2002JD003129, 2003.
Walcek, C. J. and Aleksic, N. M.: A simple but accurate mass conservative, peak-preserving, mixing ratio bounded advection algorithm with FORTRAN code, Atmos. Environ., 32, 3863–3880, 1998.
Wang, Z. F., et al.: Overview paper for MICS-Asia III, in preparation, 2019.
Wong, K. W., Tsai, C., Lefer, B., Grossberg, N., and Stutz, J.: Modeling of daytime HONO vertical gradients during SHARP 2009, Atmos. Chem. Phys., 13, 3587–3601, https://doi.org/10.5194/acp-13-3587-2013, 2013.
Xu, J., Ma, J. Z., Zhang, X. L., Xu, X. B., Xu, X. F., Lin, W. L., Wang, Y., Meng, W., and Ma, Z. Q.: Measurements of ozone and its precursors in Beijing during summertime: impact of urban plumes on ozone pollution in downwind rural areas, Atmos. Chem. Phys., 11, 12241–12252, https://doi.org/10.5194/acp-11-12241-2011, 2011.
Yamaji, K., Ohara, T., Uno, I., Tanimoto, H., Kurokawa, J., and Akimoto, H.: Analysis of the seasonal variation of ozone in the boundary layer in East Asia using the Community Multi-scale Air Quality model: What controls surface ozone levels over Japan?, Atmos. Environ., 40, 1856–1868, 2006.
Yamaji, K., Ohara, T., Uno, I., Kurokawa, J., Pochanart, P., and Akimoto, H.: Future prediction of surface ozone over east Asia using Models-3 Community Multiscale Air Quality Modeling System and Regional Emission Inventory in Asia, J. Geophys. Res., 113, D08306, https://doi.org/10.1029/2007JD008663, 2008.
Yamartino, R. J.: Nonnegative, conserved scalar transport using grid-cell-centered, spectrally constrained Blackman cubics for applications on a variable-thickness mesh, Mon. Weather Rev., 121, 753–763, 1993.
Zaveri, R. A. and Peters, L. K.: A new lumped structure photochemical mechanism for large-scale applications, J. Geophys. Res., 104, 30387–30415, 1999.