the Creative Commons Attribution 4.0 License.
the Creative Commons Attribution 4.0 License.
 | 18 Apr 2019
Constraining the aerosol influence on cloud liquid water path
Edward Gryspeerdt
Tom Goren
Odran Sourdeval
Johannes Quaas
Johannes Mülmenstädt
Sudhakar Dipu
Claudia Unglaub
Andrew Gettelman
Matthew Christensen
The impact of aerosols on cloud properties is one of the largest uncertainties in the anthropogenic radiative forcing of the climate. Significant progress has been made in constraining this forcing using observations, but uncertainty remains, particularly in the magnitude of cloud rapid adjustments to aerosol perturbations. Cloud liquid water path (LWP) is the leading control on liquid-cloud albedo, making it important to observationally constrain the aerosol impact on LWP.
Previous modelling and observational studies have shown that multiple processes play a role in determining the LWP response to aerosol perturbations, but that the aerosol effect can be difficult to isolate. Following previous studies using mediating variables, this work investigates use of the relationship between cloud droplet number concentration (Nd) and LWP for constraining the role of aerosols. Using joint-probability histograms to account for the non-linear relationship, this work finds a relationship that is broadly consistent with previous studies. There is significant geographical variation in the relationship, partly due to role of meteorological factors (particularly relative humidity). The Nd–LWP relationship is negative in the majority of regions, suggesting that aerosol-induced LWP reductions could offset a significant fraction of the instantaneous radiative forcing from aerosol–cloud interactions (RFaci).
However, variations in the Nd–LWP relationship in response to volcanic and shipping aerosol perturbations indicate that the Nd–LWP relationship overestimates the causal Nd impact on LWP due to the role of confounding factors. The weaker LWP reduction implied by these “natural experiments” means that this work provides an upper bound to the radiative forcing from aerosol-induced changes in the LWP.
- Article
(4441 KB) -
Supplement
(126 KB) - BibTeX
- EndNote


Atmospheric aerosols are known to affect the radiative balance of the atmosphere, both through a direct interaction with radiation and via indirect interactions with cloud properties (Boucher et al., 2014). As almost all liquid cloud droplets form on an aerosol particle, changing the number and composition of aerosol particles can change the concentration of cloud droplets (Nd) in a cloud, leading to changes in the cloud brightness (Twomey, 1974) and possibly also leading to changes in the cloud fraction (CF or fc) and possibly also to changes in liquid water path (LWP or L) through an impact on precipitation (e.g. Albrecht, 1989). Estimates of radiative forcing due to changes in cloud properties vary significantly between different global climate models (Zelinka et al., 2014; Heyn et al., 2017), highlighting the need for observational constraints on the impact of aerosol on cloud properties.
Unlike greenhouse gases, aerosol properties vary strongly in space and time. The co-variation in aerosol and cloud properties in the present-day atmosphere has been used to infer the impact of aerosols on cloud properties (e.g. Sekiguchi et al., 2003; Kaufman et al., 2005; Koren et al., 2005). Such observed relationships have been used to estimate the instantaneous radiative forcing (RFaci) from a change in Nd (e.g. Quaas et al., 2008; Stevens et al., 2017; McCoy et al., 2017; Gryspeerdt et al., 2017) and of the aerosol-induced change in CF (Chen et al., 2014; Goren and Rosenfeld, 2014; Gryspeerdt et al., 2016; Christensen et al., 2017). As the leading order term for determining cloud albedo (Engström et al., 2015), it is also vital to constrain aerosol effects on the in-cloud LWP, separate from changes in the CF. Existing studies show a mixed picture; while some models (Quaas et al., 2009; Koren et al., 2014; Seifert et al., 2015; Grosvenor et al., 2017; Neubauer et al., 2017) and observational studies (Gryspeerdt et al., 2014b; McCoy et al., 2018) suggest an increase in LWP with increasing aerosol, other studies (Wang et al., 2003; Small et al., 2009; Chen et al., 2014; Michibata et al., 2016; Christensen et al., 2017; Sato et al., 2018) find a reduction in LWP as aerosol increases. Some studies find both an increase and a decrease in LWP, depending on the meteorological conditions (Han et al., 2002; Ackerman et al., 2004; Bretherton et al., 2007; Xue et al., 2008; Toll et al., 2017; Bender et al., 2018), while other studies suggest a very weak LWP response to aerosol (Wang et al., 2012; Malavelle et al., 2017). The main aim of this work is to reconcile these previous studies and develop a constraint on the aerosol impact on LWP.
The key difficulty in interpreting observed aerosol–cloud relationships is separating the causal impact of aerosols (the change in LWP caused by an aerosol perturbation) from the confounding role of local meteorology (e.g. Quaas et al., 2010) and retrieval errors (e.g. Várnai and Marshak, 2009). Relative humidity in particular has been shown to obscure the causal relationship between aerosol optical depth (AOD) and CF (Quaas et al., 2010; Chand et al., 2012; Grandey et al., 2013). As many cloud properties are correlated to CF, the factors that obscure the aerosol–CF relationship can also confound other aerosol–cloud relationships, even those involving “intrinsic” cloud properties (Chen et al., 2014), such as cloud top pressure (Gryspeerdt et al., 2014a) and LWP (Christensen et al., 2017; Neubauer et al., 2017). Recent work (Gryspeerdt et al., 2016) has suggested that the use of a mediating variable such as Nd can be used to account for the confounding influence of relative humidity. Following from this, the potential of the Nd–LWP relationship to constrain the aerosol impact on LWP is investigated in this work.
Similar to the aerosol–LWP relationship, where both potential aerosol effects and confounders can influence the strength of the relationship, several effects may influence the observed Nd–LWP relationship.
- E1
Aerosol effects. An increased aerosol concentration is likely to increase Nd. This increase in Nd may affect cloud processes and in turn modify the LWP. There are several hypothesised pathways for a causal effect of aerosol on LWP, varying in relative strength with the local meteorological conditions and aerosol environment:
-
Precipitation suppression (Albrecht, 1989) – an increased Nd at initially unchanged LWP implies reduced cloud droplet sizes, suppressing the formation of precipitation. This reduction in the cloud water loss to precipitation could subsequently increase cloud depth (Pincus and Baker, 1994) and thus LWP. While it has been demonstrated that a reduction in droplet size suppresses precipitation (Suzuki et al., 2013), it is not clear how strongly this impacts LWP.
-
The sedimentation–entrainment feedback (Ackerman et al., 2004; Bretherton et al., 2007) – the reduction in droplet radius from increased Nd reduces the sedimentation flux in stratiform clouds, concentrating liquid water in the entrainment zone at the cloud top and increasing cloud-top evaporative and radiative cooling, increasing the entrainment rate. This increases the evaporative cooling in a positive feedback that depends on the above-cloud relative humidity, with drier air above cloud tops implying a larger LWP decrease. Negative Nd–LWP relationships in recent observational studies were suggested to have been due to this effect (Chen et al., 2014; Michibata et al., 2016; Sato et al., 2018).
-
Evaporation–entrainment feedbacks (Wang et al., 2003; Xue and Feingold, 2006; Jiang et al., 2006; Small et al., 2009; Dagan et al., 2017) – smaller droplets have a faster evaporation timescale, enhancing the cooling and hence the negative buoyancy at the edge of cumulus clouds. This intensifies the horizontal buoyancy gradient, increasing entrainment and hence evaporation, reducing the LWP with an expected similar meteorological dependency to E1b. Aircraft observations have found increased horizontal buoyancy gradients and reductions in cloud liquid water content (LWC) in polluted clouds (Small et al., 2009).
-
Warm cloud invigoration (Koren et al., 2014) – when Nd is low, a lack of droplet surface area slows the cloud LWC growth, increasing the local supersaturation. In this Nd-limited state, increasing the Nd in polluted clouds increases the LWC and thus the latent heat release, allowing the cloud to achieve a larger vertical extent, which may increase the LWP.
-
- E2
Retrieval errors. The MODIS LWP and Nd both depend on the retrieved cloud top droplet effective radius (re) and cloud optical depth (τc) and involve assumptions of varying validity (e.g. Grosvenor et al., 2018).
-
Random errors in the retrieval of cloud properties (τc, re) becoming correlated errors in Nd and LWP – using Nd and LWP calculated using the adiabatic assumption, random errors in τc will generate a positive Nd–LWP sensitivity , while errors in re will generate a negative sensitivity ; see Appendix A for details.
-
Sub-adiabatic clouds – both the LWP and the Nd retrieval make assumptions about the adiabaticity of clouds. Variations in the adiabaticity (Merk et al., 2015), even across a single cloud, can therefore generate a positive Nd–LWP sensitivity .
-
Other systematic retrieval errors – systematic biases in re and τc (particularly in broken-cloud regions) may also affect the Nd–LWP relationship. Other possibilities include variations in the vertical distribution of cloud water, assumptions about the droplet size spectrum, a dependence on satellite and solar zenith angle (Eastman and Wood, 2016; Grosvenor and Wood, 2014), and non-linearities in the retrieval (Zhang and Platnick, 2011).
-
- E3
Feedbacks. A change to the LWP may affect Nd, obscuring the causal impact of Nd on LWP. This feedback may depend on other meteorological parameters, generating an apparent dependence on local meteorology in the observed Nd–LWP relationship. The existence of strong feedbacks can make using a mediating variable to account for meteorological covariation problematic (Pearl, 1994).
-
Wet scavenging feedbacks – for a given Nd, precipitation preferentially occurs at high LWP. Precipitation scavenging of aerosol can reduce the amount of aerosol available for future activation to cloud droplets, reducing Nd. Conversely, if an increased Nd decreases the precipitation rate, this could result in a further increase in the Nd through a reduction in wet scavenging and an increase in the available aerosol (a positive feedback).
-
The impact of entrainment on the retrieved Nd – the retrieved Nd depends on the re and the impact of entrainment on re depends on the mixing type. Extreme inhomogeneous mixing (Baker et al., 1980) leads to a reduction in Nd and LWP, but no immediate change in the droplet size distribution and hence no change in the re or the retrieved Nd. In contrast, homogeneous mixing (Warner, 1973) reduces the LWP and the re, leading to an increase in the retrieved Nd. Increased dry air entrainment would produce a larger change in retrieved Nd (and LWP), generating a negative Nd–LWP relationship due to fluctuations in entrainment where homogeneous mixing dominates. This effect could decouple the cloud-top Nd (where it is retrieved) from the activated Nd at cloud base.
-
- E4
Additional confounders. Although using Nd as a mediating variable helps to account for the impact of RH on the aerosol–LWP relationship, additional meteorological confounders, impacting both Nd and LWP, may still impact the Nd–LWP relationship, obscuring the causal impact of Nd on LWP. An example case could be a convergence situation that leads to high moisture values (high LWP) and high updraught values (high Nd, even at constant aerosol). In addition, through the aerosol impact on Nd, covariations between aerosol and LWP (due to changes in air mass) could also create an Nd–LWP relationship, obscuring the causal Nd impact on LWP.
These effects are depicted in Fig. 1. To constrain the causal aerosol influence on LWP, the impact of E1 has to be identified and isolated from that of E2–E4. This would allow the aerosol impact on LWP to be constrained using the Nd–LWP relationship.

Figure 1A simplified picture of the Nd–LWP system, showing factors impacting the causal relationship (“E1”) – potential meteorological confounders and retrieval errors (“E2”, “E4”), LWP dependent controls on Nd (“E3”) and the impact of aerosols on Nd (CCN).
It is necessary to understand the role of these different processes on the Nd–LWP relationship in order to determine the impact of aerosols on the LWP. Using a variety of different satellite retrievals along with reanalysis data, the Nd–LWP relationship is investigated globally and the impact of meteorology is explored. To understand the role of feedbacks (E3) and additional confounders (E4), natural experiments are used to examine the Nd–LWP relationship in regions where there is a strong aerosol perturbation. Finally, the observed relationship is converted to a radiative forcing, allowing it to be compared to other observational studies and to be used for further analysis of the aerosol impact on clouds and the climate.
This work is based on observational data from the Aqua satellite, specifically the Moderate Resolution Imaging Spectroradiometer (MODIS), the Advanced Microwave Scanning Radiometer for EOS (AMSR-E), and the Clouds And The Earth'S Radiant Energy System (CERES) instruments for a 3 year period (2007–2009 inclusive).
Nd is retrieved using the level-2 collection-6 MODIS cloud property dataset (MYD06_L2) at a 1 km by 1 km resolution, making use of the adiabatic assumption (Brenguier et al., 2000; Quaas et al., 2006). Following the work of Grosvenor and Wood (2014) and Bennartz and Rausch (2017), the Nd is filtered to include only liquid, single-layer clouds with a top warmer than 268 K at 1 km resolution. In addition, pixels with an optical depth smaller than 4 or an effective radius less than 4 µm are excluded due to the uncertainty of these retrievals (Sourdeval et al., 2016). Pixels with a 5 km cloud fraction less than 0.9 are excluded to remove pixels close to cloud edges, and only pixels with a solar zenith angle of less than 65∘ and a sensor zenith angle of less than 41.4∘ are used to reduce the impact of known biases (Grosvenor and Wood, 2014; Eastman and Wood, 2016; Grosvenor et al., 2018). Finally, only pixels with an inhomogeneity index (Cloud_Mask_SPI) of less than 30 are used to account for biases in the effective radius (re) in inhomogeneous scenes (Zhang and Platnick, 2011). Trials using a more stringent upper limit of 10 show little difference to the results presented here (not shown). The Nd is gridded to a 1∘ by 1∘ resolution and, finally, the condensation rate temperature correction from Gryspeerdt et al. (2016) is applied.
The MODIS LWP is gridded to a 1∘ by 1∘ resolution from MYD06_L2, selecting only liquid, single-layer clouds with tops warmer than 268 K. The extra filtering applied to the Nd is not applied to the LWP at the pixel resolution as the LWP is less sensitive to re biases and this filtering would significantly bias the LWP against AMSR-E by selecting primarily high LWP scenes. However, only 1∘ by 1∘ grid boxes with an Nd retrieval are retained for this analysis, resulting in an implicit filtering by satellite and solar zenith angles.
As both the MODIS LWP and Nd rely on the adiabatic assumption and the same retrieved cloud properties, there is a significant potential for errors in these properties due to failures of the adiabatic assumption (Merk et al., 2015) and consequent correlated errors generating a Nd–LWP relationship (E2b). The Nd retrieval is better able to deal with non-adiabatic clouds than the effective radius retrieval alone (Painemal and Zuidema, 2011). For the majority of this work, the LWP is determined using V6 of the AMSR-E Ocean product (Wentz and Meissner, 2004), a passive microwave product that does not depend on the adiabatic assumption. Clear-sky bias corrections are applied following Lebsock and Su (2014) at the pixel level. As the wind speed and sea surface temperature retrievals are unreliable in precipitating scenes, they are interpolated to precipitating locations by fitting a cubic mesh (Jones et al., 2001). To determine the in-cloud LWP, the AMSR-E LWP is divided by the MODIS cloud retrieval CF at the AMSR-E pixel level (14 km), with pixels having a CF of less than 10 % being excluded due to the large uncertainty in the resulting in-cloud LWP. Finally, the AMSR-E data are gridded from the sensor footprint of 14 km to a 1∘ by 1∘ resolution.
As a linear sensitivity is not able to fully describe the non-linear relationship between Nd and LWP, a piecewise relationship of the form (Eq. 1) is used. Lp and are the LWP and Nd values at the intersection between the two parts of the curve, while ml and mh are the gradients of the fit for the low- and high-Nd portions of the curve. This curve is fit to the Nd–LWP joint-probability histogram (P(L|Nd)), using the Levenberg–Marquardt algorithm in log–log space (Jones et al., 2001). By fitting to the joint-probability histogram, each Nd bin is given equal weight, rather than the weighting by the present-day Nd probability distribution implicit in the standard linear regression. This leads to a clearer picture of the overall form of the relationship, as the shape of the relationship does not change as the Nd distribution changes (as might happen due to anthropogenic aerosol emissions; Gryspeerdt et al., 2017). Note that this method, using “snapshots” of cloud fields, restricts the analysis to inferring information about cloud development, rather than studying their evolution directly (e.g. Matsui et al., 2006; Meskhidze et al., 2009; Gryspeerdt et al., 2014b).
To convert a change in LWP to a change in top-of-atmosphere radiation, data from the CERES 1∘ daily Single Scanner Footprint Edition 4 dataset are used (Wielicki et al., 1996). The all-sky albedo from CERES (α) is shown in a histogram as a function of the CF (fc), LWP and Nd, creating a single, global, joint-probability histogram (). Given the retrieved cloud properties for a location (fc, LWP and Nd), this histogram produces a distribution of consistent values of the all-sky albedo (P(α)). This can be used to calculate the mean oceanic albedo to within 1% in the tropics, with an RMS error in the tropics of 1 %, increasing to around 5 % near the poles. These variations are primarily due to differences in the mean solar zenith angle between the MODIS and CERES datasets, such that they have a small effect when determining the albedo sensitivities in this work.
Following Eq. (2), the Nd–LWP and Nd–fc relationships can be used to determine a change in scene (all-sky) albedo as a function of an Nd change. The relationships are treated as conditional probabilities , following Gryspeerdt et al. (2016). When combined with the Nd sensitivity to aerosol (τa) changes P(Nd|τa), this allows the scene albedo as a function of aerosol to be calculated for a given scene of liquid clouds (Eq. 3), where the circumflex indicates that a variable has been set to a certain value (the causal relationship). Note that this is different from the observed relationship P(α|τa), due to the confounding effects of local meteorology (Pearl, 1994; Gryspeerdt et al., 2016). It also makes the assumption that the observed conditional probabilities represent the causal relationship (i.e. , representing only E1), an assumption that will be investigated in this work.
The albedo sensitivity to aerosol through modifications of each of the components of the albedo (Nd, L, fc) can be determined by replacing probabilities conditioned on Nd with unconditional probabilities. For example, the sensitivity due only to Nd variations (the Twomey effect; Twomey, 1974) can be determined by removing any dependence of CF and LWP on Nd ( and ) in Eq. (2). The change in planetary albedo is then determined by multiplying each grid box by (the ice cloud fraction), making the implicit assumption that there is no change in the ice cloud albedo or . This is converted to a radiative forcing by multiplying by the incoming solar flux and anthropogenic aerosol fractions from Bellouin et al. (2013) and Kinne (2019).
To avoid uncertainties associated with the aerosol anthropogenic fraction inherent in estimates of the aerosol radiative forcing, the effective radiative forcing (ERF) due to LWP changes is not reported directly, only as a fraction of the RFaci calculated using the same dataset (Bellouin and Quaas, 2019). The value for the forcing due to LWP changes can be re-constructed using an appropriate estimate of the RFaci if required (e.g. Quaas et al., 2008; Stevens et al., 2016; McCoy et al., 2017; Gryspeerdt et al., 2017).
4.1 Global relationships
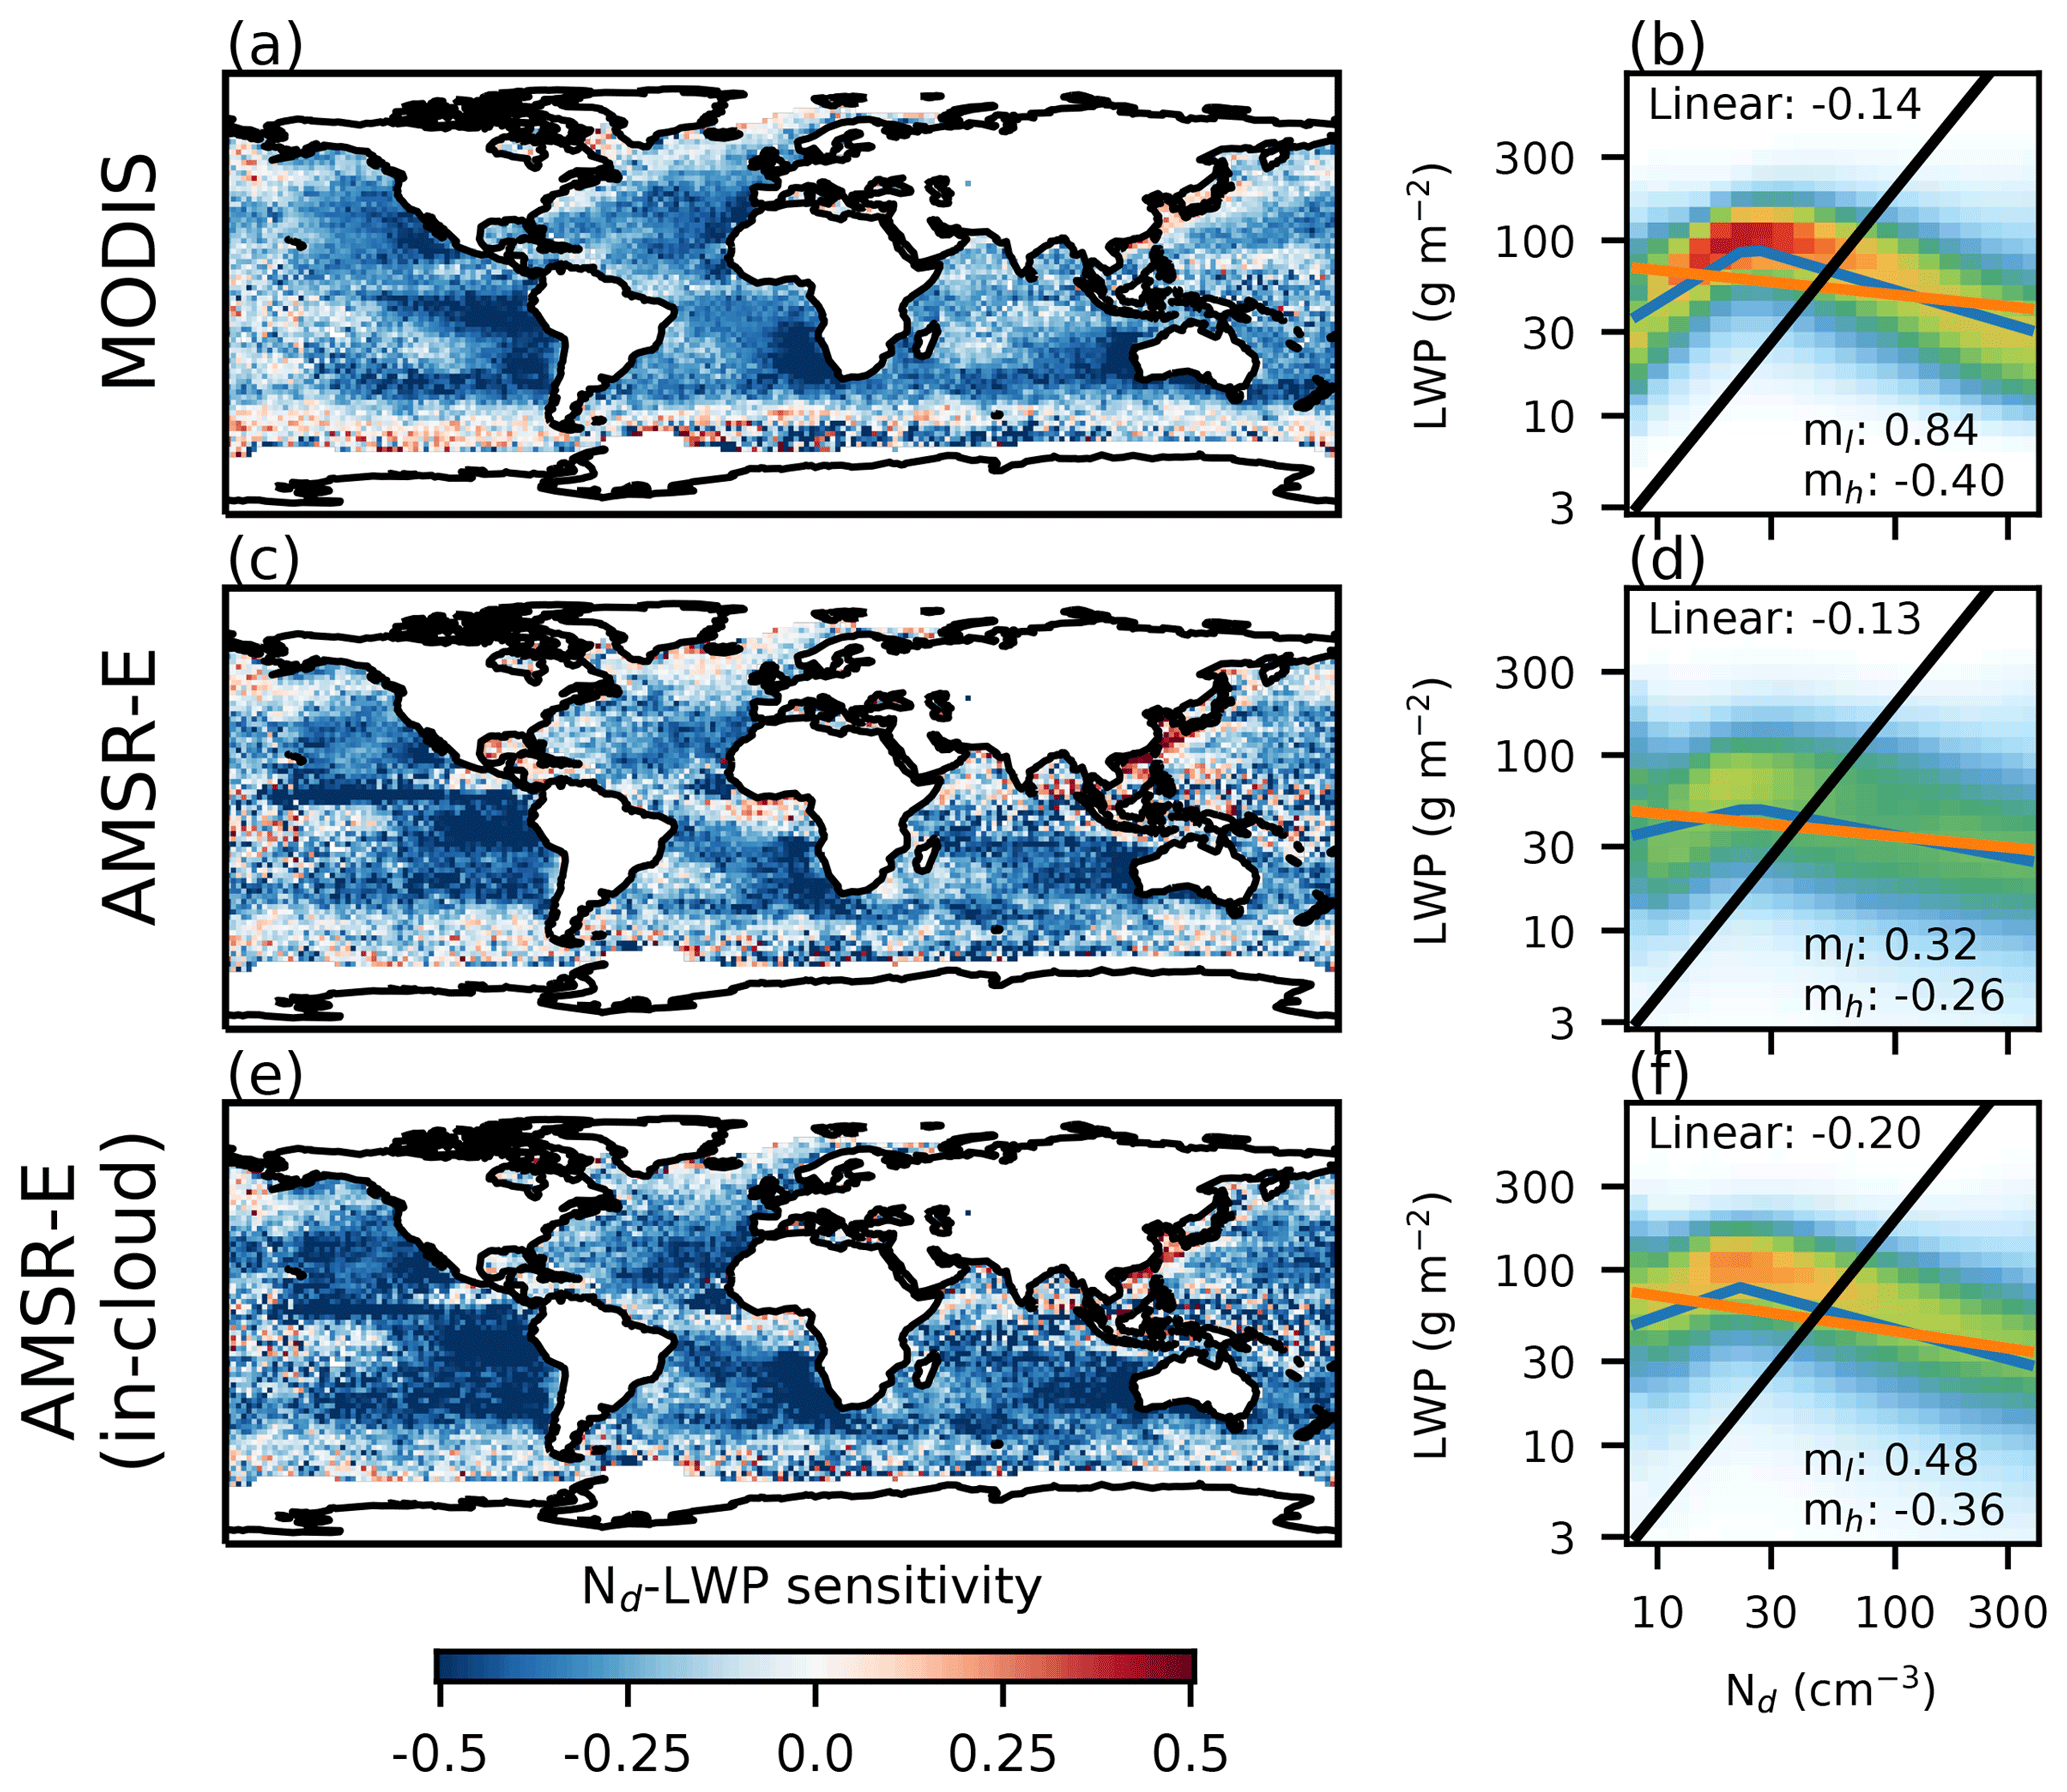
Figure 2(a, c, e) The sensitivity (linear regression coefficient in log–log space) of Nd to LWP for a selection of different LWP measures, using MODIS Nd for the period 2007–2009. The sensitivities are calculated at a 1∘ by 1∘ resolution from instantaneous (daily) data. (a) MODIS LWP, (b) AMSR-E (all-sky) LWP and (c) AMSR-E (in-cloud) LWP. The right-hand column shows the global joint Nd–LWP histogram, where each column is normalised so that it sums to 1 (showing P(LWP|Nd)). The black line is at an effective radius of 15 µm (assuming adiabatic clouds), an approximate indicator of precipitation, with precipitating clouds lying to the upper left of the line. The orange line is a linear regression on the data, with the linear sensitivity shown in the top left of the subplot. The blue line is a fit of the form Eq. (1), with the gradients ml and mh shown in the lower right of each subplot.
Similar to previous studies (Michibata et al., 2016), a negative linear Nd–LWP sensitivity (Fig. 2a, equivalent to the slope of the orange line in Fig. 2b) is found globally over oceans, with a particularly strong negative relationship in the subtropical stratocumulus decks off the western coasts of continents. Positive sensitivities are observed in some regions, particularly in the East China Sea. The sensitivity becomes noisier close to the international dateline, due to a mismatch between the MODIS and AMSR-E definitions of a day.
A similar negative relationship is observed when using the AMSR-E LWP, both the all-sky LWP (Fig. 2c) and the in-cloud LWP (Fig. 2e). The relationship in Fig. 2c, using the all-sky LWP, is much weaker than the in-cloud LWP in Fig. 2e, which is the most strongly negative linear sensitivity of the three relationships in Fig. 2. A strong positive relationship remains in the East China Sea.
The Nd–LWP joint histograms shown in the right-hand column of Fig. 2 show that the Nd–LWP relationship is highly non-linear at a global scale. All of the histograms show an increase in the LWP with increasing Nd at low Nd, followed by a decrease in the LWP at high Nd. Despite global variations in Nd and LWP retrieval biases (e.g. Grosvenor and Wood, 2014) and in Nd, this non-linearity is not obvious in the global plots of the linear sensitivity. However, a similar variation in the sensitivity simulated in LES (Xue et al., 2008; Dagan et al., 2015, 2017) and in studies of ship tracks, where the impact of the injection of aerosol from shipping depends on the background cloud state (Goren and Rosenfeld, 2014; Toll et al., 2017). This non-linearity is consistent with the action of at least two proposed aerosol effects in liquid clouds (E1). The positive relationship at low Nd is consistent with precipitation suppression, occurring only in the precipitating region of the Nd–LWP space (left of the black line in Fig. 2b, d, f). Warm cloud invigoration would also be consistent with a positive Nd–LWP relationship. The negative relationship at high Nd, in regions of Nd–LWP space where the cloud is unlikely to be precipitating (right of the black line), supports the model-based results of Ackerman et al. (2004), Xue and Feingold (2006) and Xue et al. (2008), where increasing the Nd can result in a LWP reduction in clouds in which precipitation does not reach the surface.
The differences between the fits of Eq. (1) to the MODIS (Fig. 2b) and the AMSR-E (Fig. 2f) histograms demonstrate how a simple linear regression for calculating a sensitivity does not capture the strength or nature of the relationship. The AMSR-E relationship in Fig. 2f has a slightly weaker negative relationship at high Nd (mh) than that found using MODIS data (Fig. 2b), but a 50 % more strongly negative sensitivity worldwide. This shows the importance of considering the complete relationship and suggests that the linear sensitivity alone is not a strict constraint on the aerosol impact on LWP. The MODIS Nd–LWP relationship has an mh close to the value expected due to errors in the re retrieval (−0.4). The mh values for the in-cloud LWP from both MODIS and AMSR-E are larger than those from the LES simulations of Ackerman et al. (2004) ( for the DYCOMS and dry ASTEX cases), Bretherton et al. (2007) (equivalent ) and Xue et al. (2008) ().
The non-linear behaviour of the Nd–LWP relationship is similar to that expected due to correlated errors in the MODIS Nd and LWP retrievals (E2, Appendix A). However, the similarity between the MODIS (Fig. 2b) and the in-cloud AMSR-E (Fig. 2f) relationships (unaffected by correlated errors due to the independent LWP measurement) shows that although correlated errors (E2) may play a role in determining the Nd–LWP relationship, they do not dominate it. However, to avoid any further impact of E2, the AMSR-E in-cloud LWP is used to characterise the Nd–LWP relationship for the remainder of this work.
4.2 Regional relationships
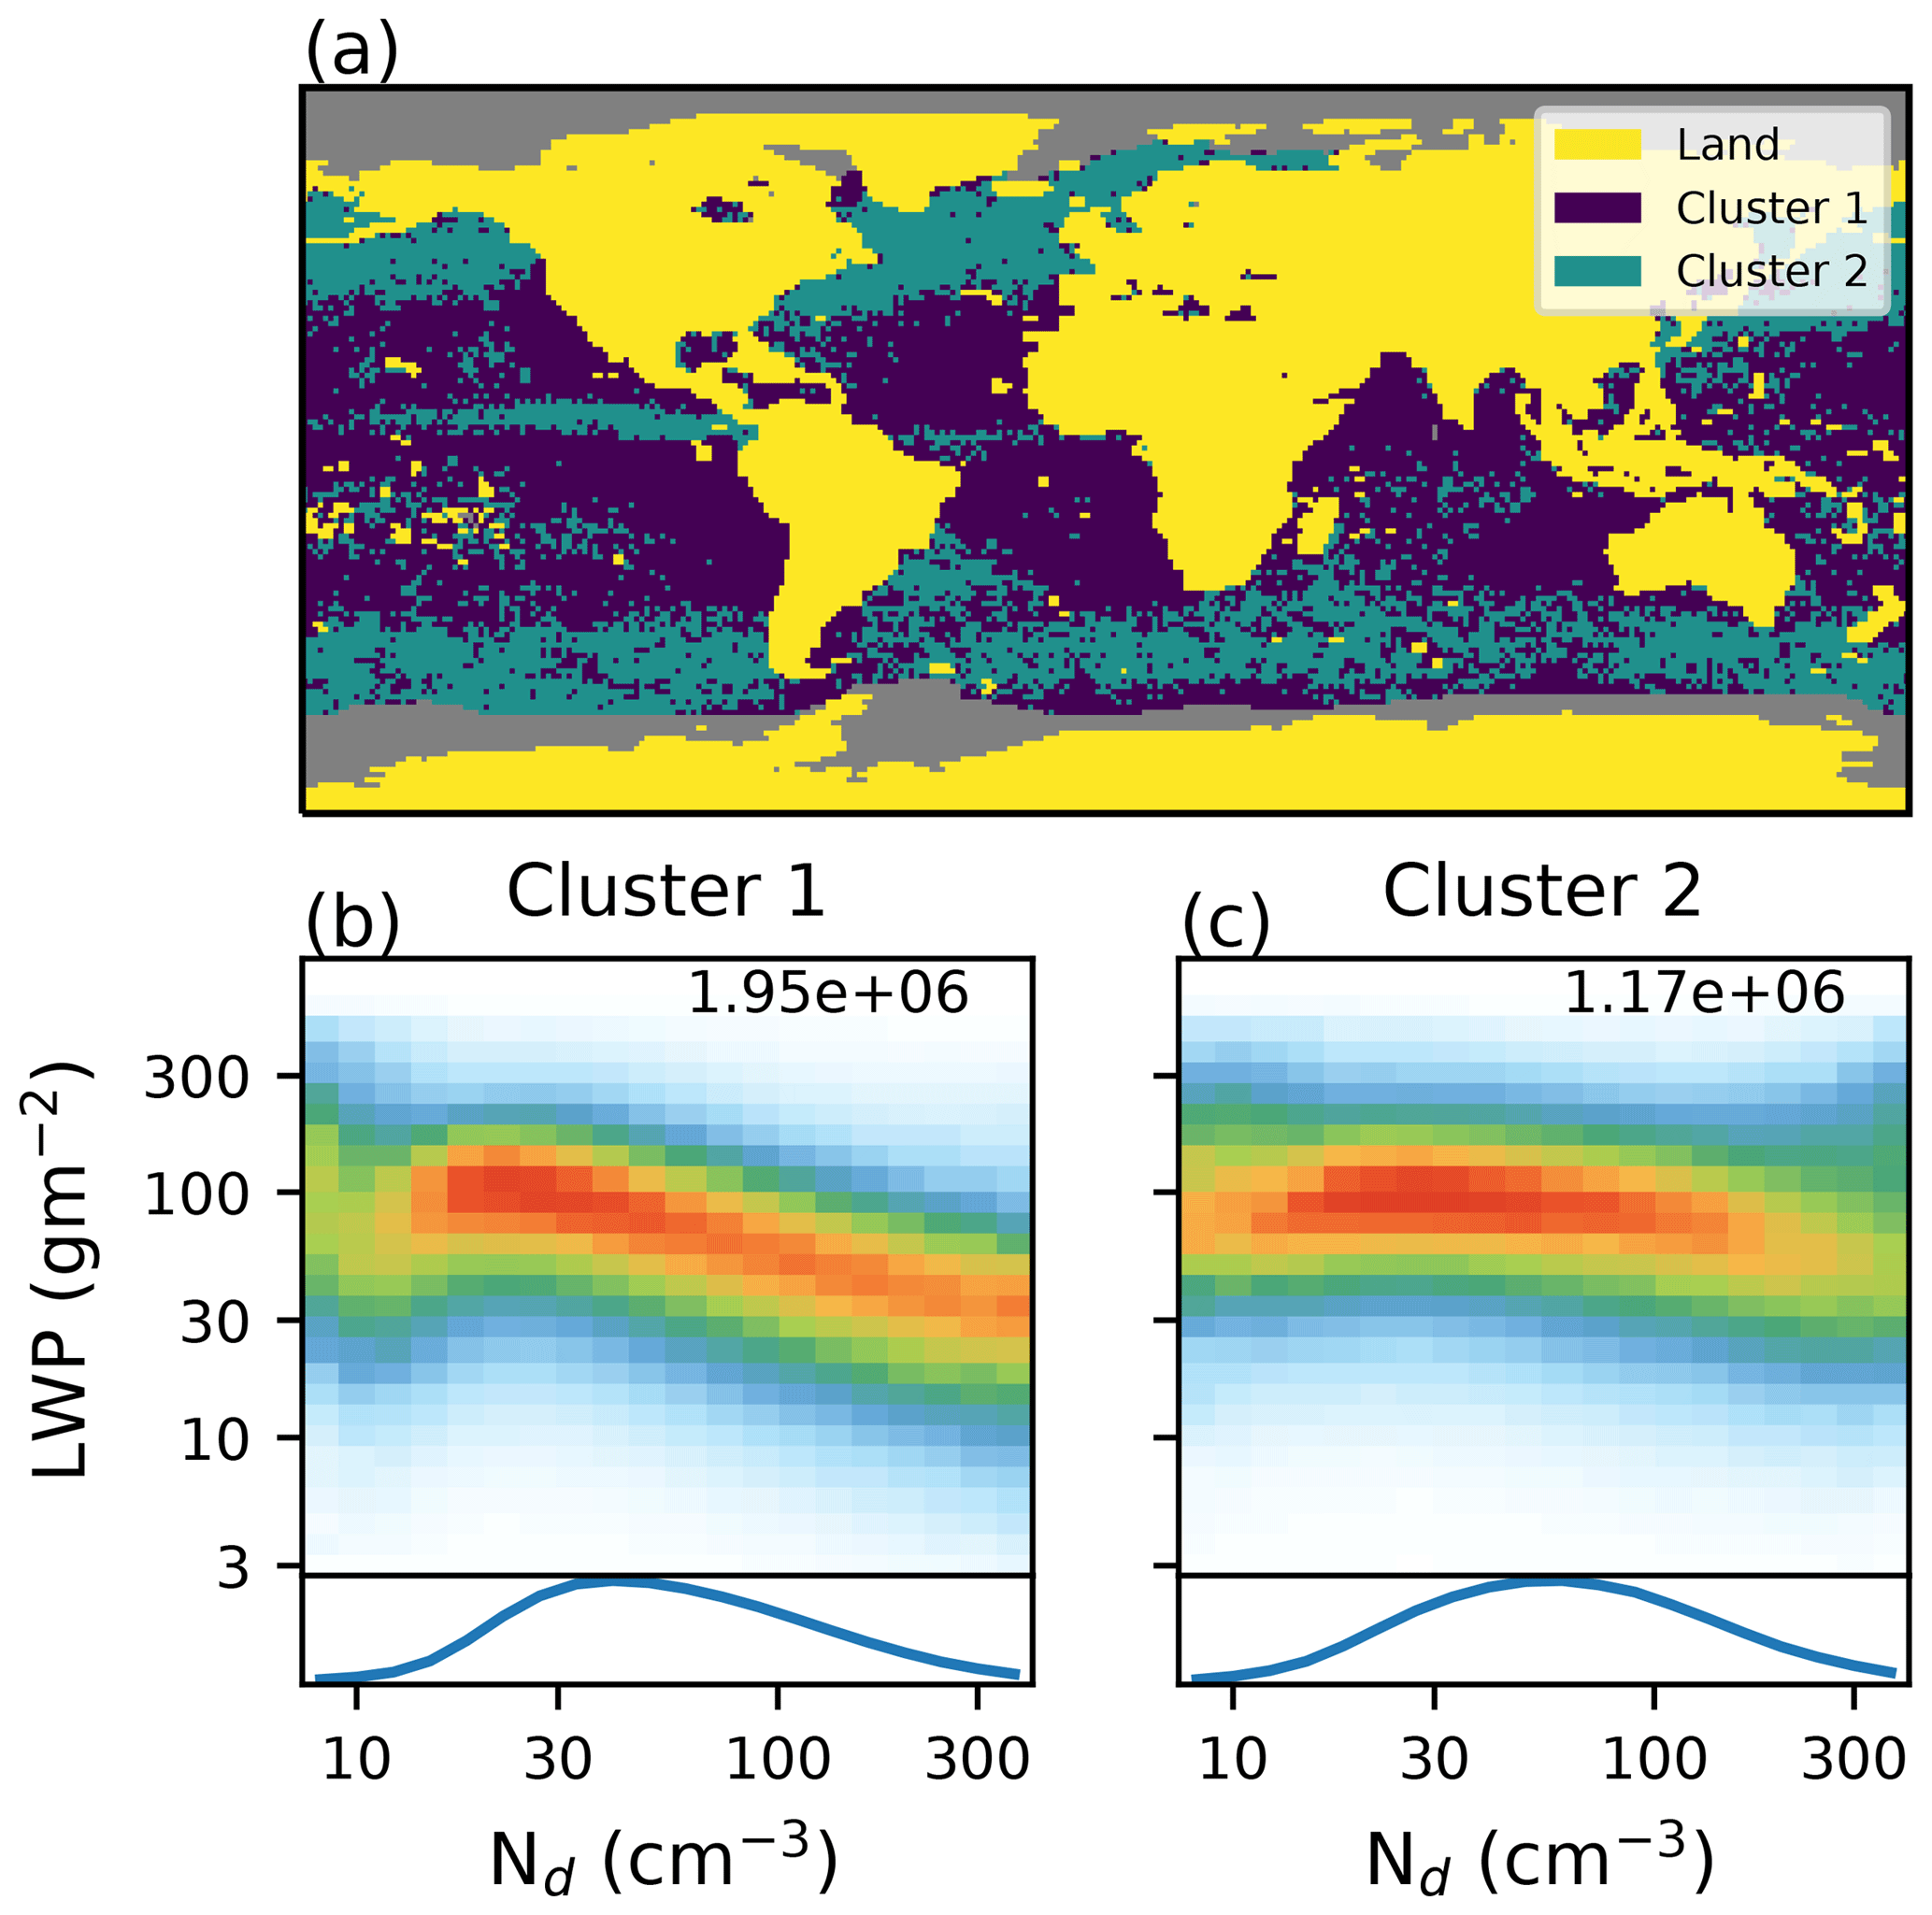
Figure 3(a) The location of the oceanic clusters for the Nd–LWP relationship, determined using the k-POD clustering method, using MODIS Nd and the AMSR-E in-cloud LWP. Panels (b) and (c) show Nd–LWP joint histograms for the two clusters (as in Fig. 2) The line plot at the bottom shows the occurrence of each Nd value for each cluster, and the number of retrievals assigned to each cluster is displayed in the upper right of each histogram.
Due to the difficulty of visualising joint histograms globally, and the sparse nature of the histograms in some regions making fitting Eq. (1) prone to error, a clustering approach is used to select regions with similar microphysics. A k-means clustering method (Anderberg, 1973) is used on the Nd–LWP joint-probability histograms representing each 1∘ by 1∘ grid box. The algorithm is modified to deal with missing data (k-POD; Chi et al., 2016), resulting in two distinct clusters over ocean with each grid box being assigned to a single cluster (Fig. 3). The clustering algorithm fills in missing data in the histograms with data interpolated from the clusters. This may reduce the number of clusters, but it suffices for demonstrating global variation. The first cluster (Fig. 3b) is found primarily in the subtropical subsidence regions, particularly in the Pacific and South Atlantic. This cluster is characterised by an increase in LWP with Nd at low Nd, followed by a decrease in LWP at high Nd, similar to the global relationships in Fig. 2.
The second cluster (Fig. 3c) dominates in the tropics and in the mid-latitudes, regions with a larger ice CF (e.g. Marchand et al., 2010). The Nd distribution is less skewed towards lower values in this cluster. This cluster only includes about half the number of retrievals of the first cluster, occurring over a smaller area in regions that typically have a higher ice CF. This lower frequency of occurrence explains the similarity of the global results with the first cluster.
The primary difference between the clusters is in their behaviour at high Nd. Whilst the subtropical cluster (Fig. 3b) shows a decrease in LWP with increasing Nd (negative mh), the second cluster is almost insensitive to Nd, even showing a slight increase in the LWP at the highest Nd values. This may indicate a difference in the processes that are important for forming precipitation in the two different clusters (Mülmenstädt et al., 2015) and so a different response to Nd perturbations. The weak sensitivity of LWP to Nd (Fig. 3c) is similar to the results of Malavelle et al. (2017), who suggest a weak overall response of LWP to Nd variations in a region where cluster two dominates. However, it means that the mid-latitude response may be a poor constraint on the response of the subtropical stratocumulus to Nd perturbations, an issue that is of particular importance given the large role of the stratocumulus decks for the global aerosol forcing (Gryspeerdt and Stier, 2012).

Figure 4Joint histograms (as in Fig. 2) created for meteorological conditions, separated by RH at 750 hPa and LTS. The difference plots are shown at the end of each row and column, with red above blue in each column, showing an increase in AMSR-E in-cloud LWP at high LTS ∕ RH750 for a given Nd. The histograms under each joint histogram show P(Nd) for each set of meteorological conditions.
4.3 The impact of meteorology
While the overall form of the relationship remains the same, there is some variation in the Nd–LWP joint histogram as a function of the meteorological state (Fig. 4). Following previous studies (Chen et al., 2014; Michibata et al., 2016), the data are separated by low troposphere stability (LTS) and relative humidity at 750 hPa (RH750; approximately cloud top). Although the saturation deficit is more closely related to evaporation rates, we use RH750 for consistency with previous work.
The response to LTS variations is small, occurring primarily in the part of Nd–LWP space where precipitation is expected (Fig. 4c, f). The weak response to LTS is different from previous studies, which have shown a similar sized response to LTS and RH changes (Chen et al., 2014). A comparison between Fig. 4a and b shows that this variation in the linear sensitivity is partly due to variations in the Nd distribution. At high LTS (Fig. 4b), the mean Nd is larger than that found at low LTS (Fig. 4a), resulting in a more negative linear sensitivity. However, the high Nd sensitivity from the fitted relationship (mh) is very similar at both high and low LTS. The difference in the precipitating region sensitivity (ml) may be due to variations in the precipitation processes or regime-dependent retrieval errors for shallow cumulus (low LTS) and stratocumulus clouds (high LTS). However, the low frequency of occurrence of these low-Nd conditions (the histograms under each joint histogram in Fig. 4) limits their impact on the mean Nd–LWP sensitivity.
The difference in Nd–LWP histograms for the two RH750 classes is much more pronounced, particularly for the high LTS cases (Fig. 4b, e), where stratocumulus clouds are common. This may be due to the dependence of the evaporation–entrainment feedback (E1c) on cloud edge entrainment, where a weaker relationship to cloud top relative humidity might be expected than in cases where the sedimentation–entrainment feedback (E1b; and hence cloud top entrainment) dominates. At high Nd, there is a significant shift in the LWP towards higher values with increasing RH750, resulting in a decrease in the magnitude of mh as the RH750 increases. A relative decrease in mh of around 20 % is observed, slightly smaller than the 30 % decrease in the linear sensitivity. Unlike the variations in the sensitivity with LTS, the increase in Nd with increasing RH750 is accompanied by a decrease in the linear sensitivity, showing that changes in the Nd distribution are not the sole controller of the magnitude of the linear sensitivity and that this measure of the relationship can provide information about mh.
These changes in mh as a function of RH750 and LTS fit the conclusions of previous studies (Ackerman et al., 2004; Chen et al., 2014; Michibata et al., 2016); increased entrainment at higher Nd results in a reduction of the LWP, with a stronger decrease at lower cloud top humidities. Results using the saturation deficit are similar, but with an increased magnitude (see Supplement). The resulting decrease in LWP with increasing Nd would reduce cloud albedo, offsetting the RFaci (also due to an increase in Nd) and reducing the overall ERFaci.
The strong negative relationship observed in Sect. 4 and in previous observational studies (Chen et al., 2014; Michibata et al., 2016; Sato et al., 2018) is in contrast to recent studies showing a weak or varied LWP response to aerosol perturbations (Chen et al., 2012; Christensen et al., 2014; Malavelle et al., 2017; Toll et al., 2017). While a negative Nd–LWP relationship has been found in some modelling studies with large-eddy simulations (Ackerman et al., 2004; Xue and Feingold, 2006; Xue et al., 2008), the strength of this negative relationship () is weaker than the sensitivities observed in Sect. 4. It is possible that feedbacks (E3) or the existence of additional confounders (E4) could be obscuring the causal relationship (Fig. 1). This would reduce the utility of the Nd–LWP relationship as a constraint on aerosol–cloud interactions in climate models and for determining the aerosol radiative forcing.
In situations where there is a loop or feedback in the causal graph (e.g. Fig. 1), an experiment is required to determine the strength of the causal relationship. Although the capability to artificially alter Nd over a large spatial and temporal scale does not exist, large aerosol perturbations are able to alter the CCN environment and hence Nd independently of any feedbacks or confounders (E2–E4; Fig. 1). The Nd–LWP relationship produced by these “natural experiments” would therefore be expected to be closer to the causal impact of aerosol on LWP than the relationship determined in Sect. 4.
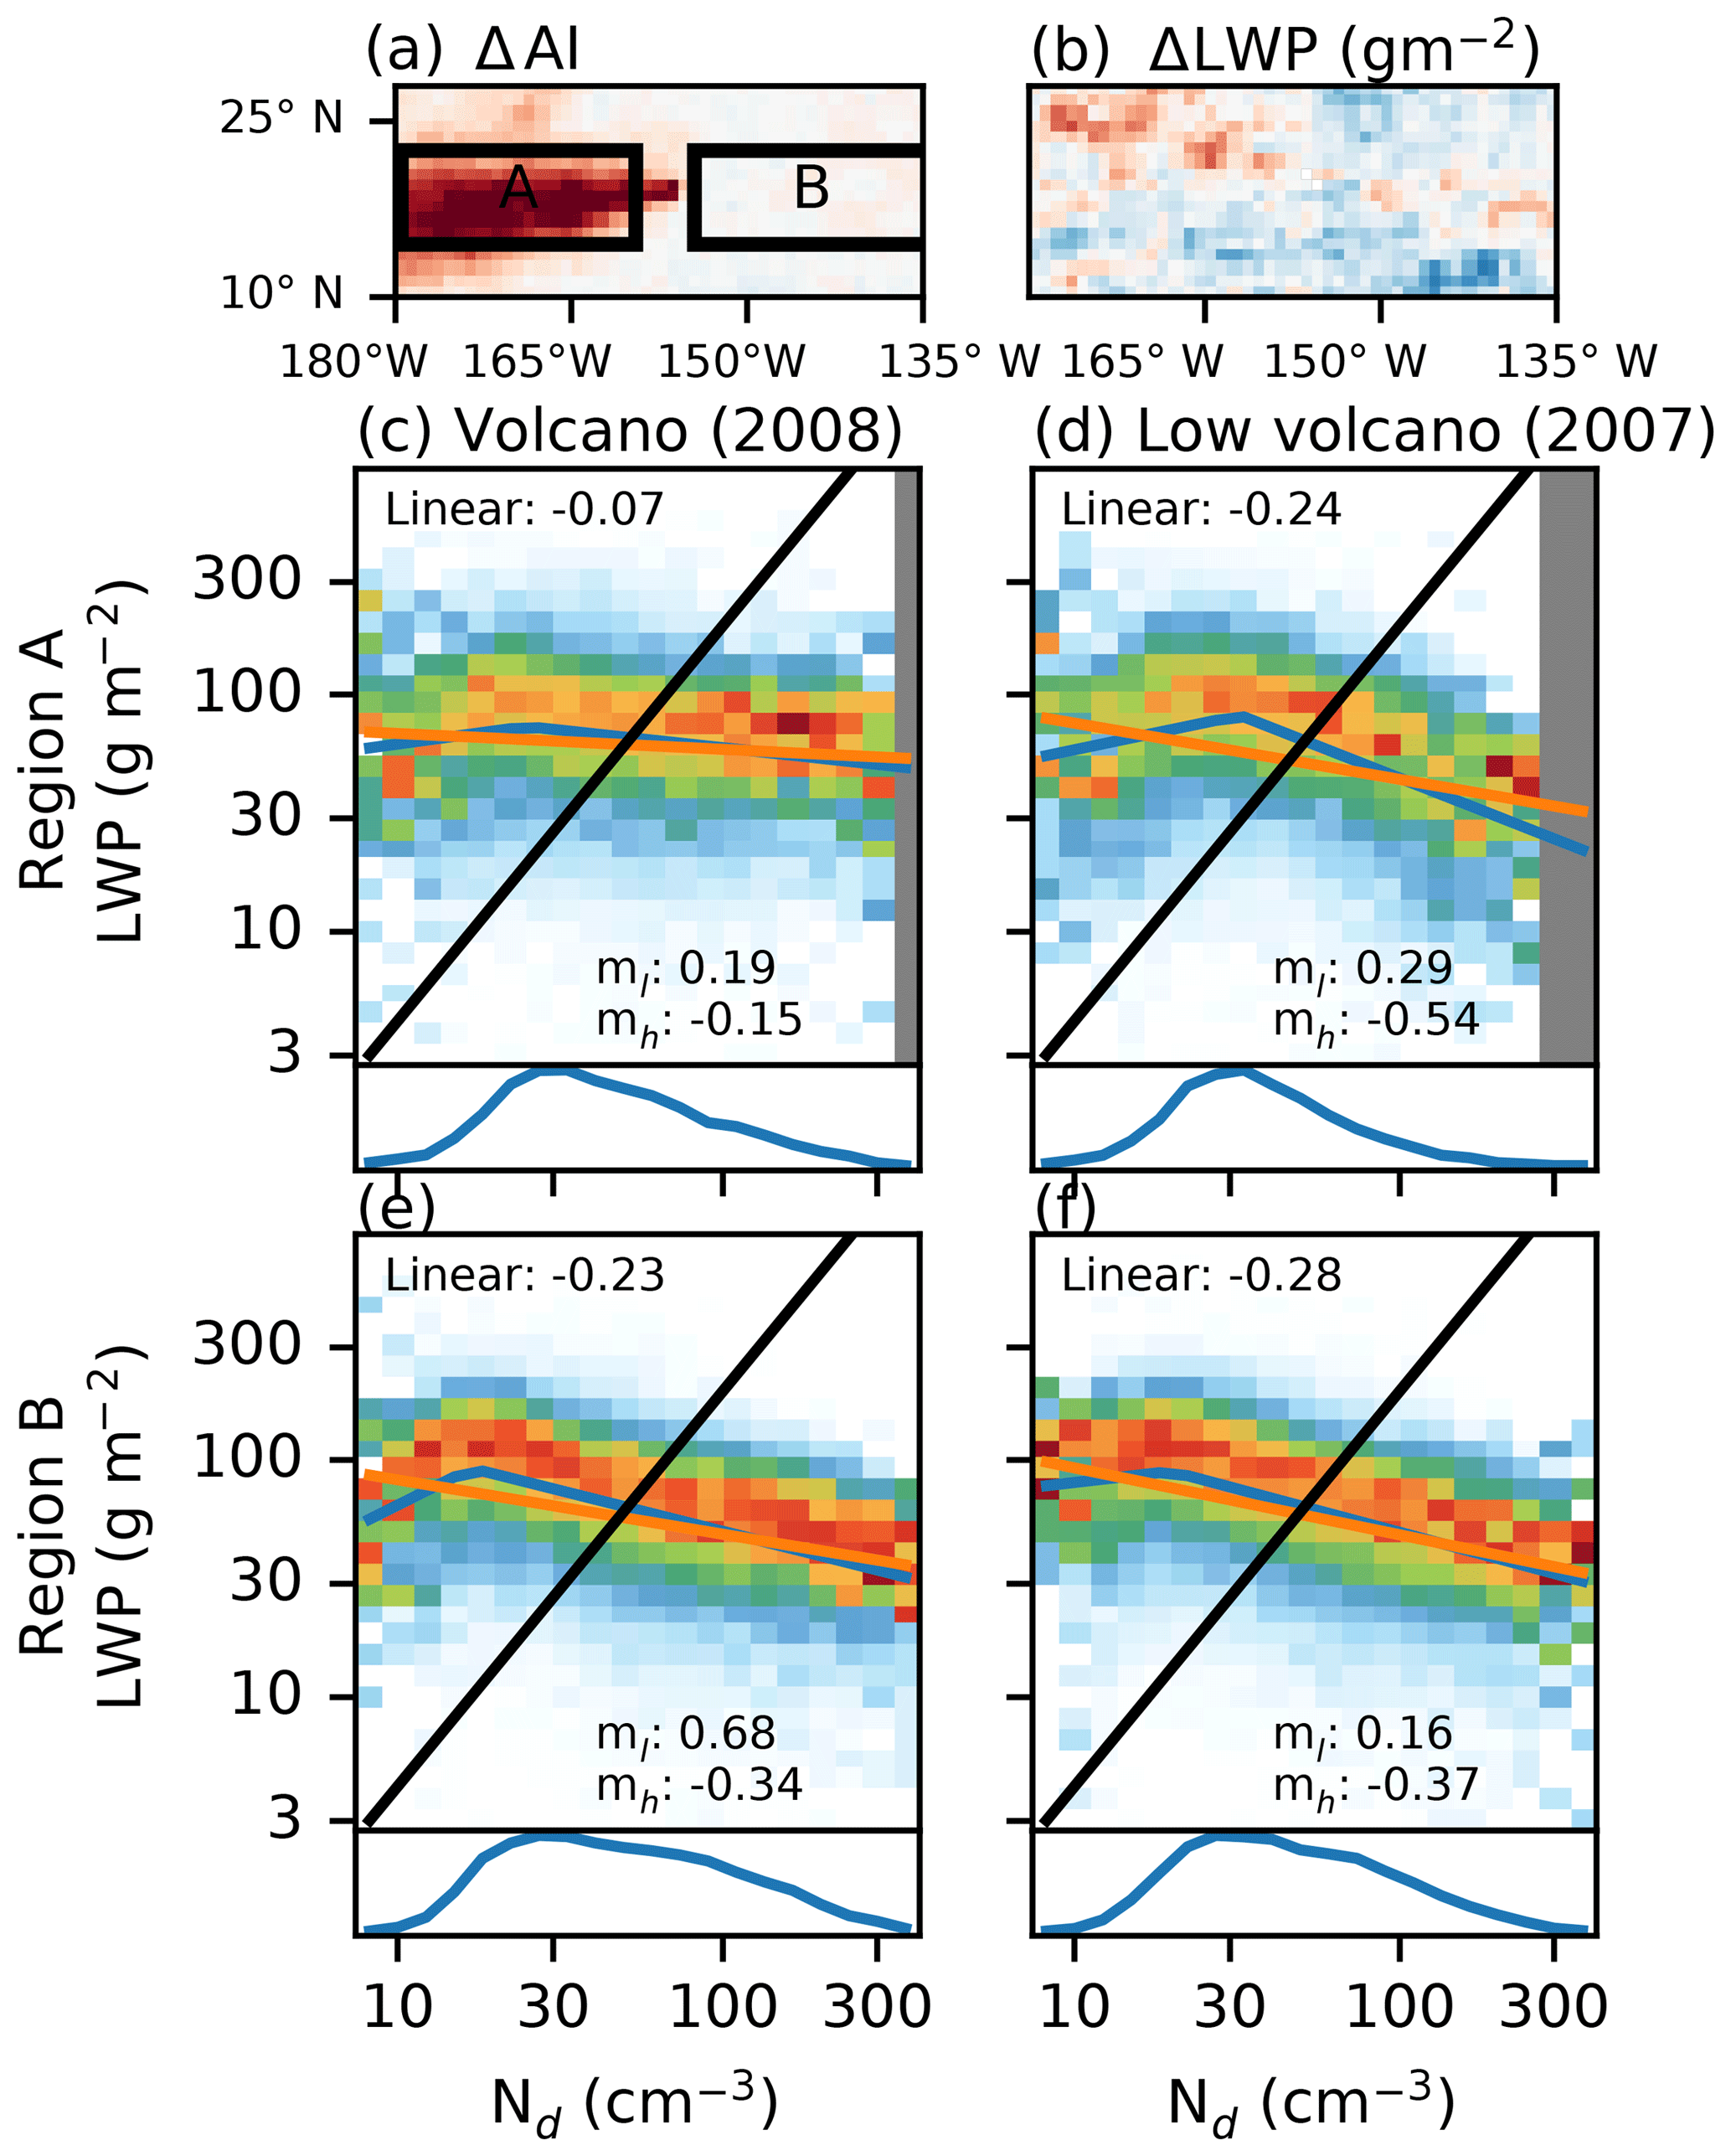
Figure 5Nd–LWP relationships as in Fig. 2 in two regions around Hawai'i for 2 years, a low-emissions year (2007) and a high-emissions year (2008). Panels (a) and (b) show the difference in AI and LWP between the high and low emission years, with red indicating an increase in 2008. Panels (c)–(f) show the Nd–LWP joint histograms (as in Fig. 2) for the two periods in the regions from (a).
Volcanoes provide a possible natural experiment (e.g. Gassó, 2008; Yuan et al., 2011; Toll et al., 2017), as their SO2 emissions are independent of the prevailing meteorological conditions (Gassó, 2008; Ebmeier et al., 2014). Following Yuan et al. (2011). The Kilauea volcano on the island of Hawai'i is used as an exogeneous aerosol perturbation. Previous work has shown a stronger linear AOD–Nd sensitivity downwind of Kilauea than in surrounding regions, demonstrating the strong impact the SO2 from Kilauea has on Nd (Gryspeerdt and Stier, 2012). There is significant variability in the SO2 emitted from the volcano. Comparing a year with strong SO2 emissions (2008) with a low-emissions year (2007) shows that the variation in aerosol index (AI; AOD times Ångström exponent; Nakajima et al., 2001) downwind from the volcano comes primarily from the variation in aerosol (Fig. 5a), rather than in meteorological conditions.
Despite the strong negative Nd–LWP relationship observed in sub-tropical regions (Fig. 3b), there is no change in the LWP (Fig. 5b) in the region with a strong change in AI (region A). This lack of a LWP response to volcanic emissions is similar to the results of Malavelle et al. (2017) but is within the area covered by the more sensitive cluster (Fig. 3). The weak LWP response to aerosol variations suggests that the strong negative Nd–LWP relationship (Figs. 2, 3) is unlikely to describe the impact of Nd variations on LWP.
This interpretation is supported by the variation in the Nd–LWP relationships as a function of SO2 emissions. In 2007, volcanic emissions were weak and the Nd–LWP relationship was very similar between the regions downwind (region A; Fig. 5d) and upwind (B; Fig. 5f) of the volcano, with a strongly negative mh and negative linear sensitivity. However, in the high aerosol environment of 2008 (Fig. 5c), this negative relationship becomes much weaker in the volcanic plume (), whilst little change is observed upwind of the island (Fig. 5e). There is a difference in the LTS between 2007 and 2008 of around 1 K in both regions. However, the similarity of the Nd–LWP relationship in region B indicates that variations in meteorological properties cannot explain the changes in region A. This means that the inter-annual difference in region A can be attributed primarily to aerosol variations (E1).
In the absence of feedbacks (E3), additional confounders (E4) and meteorological variations, the Nd–LWP relationship should be insensitive to the cause of the Nd variations. Given the similarity in the meteorological conditions between the years, the difference in the Nd–LWP relationship in region A therefore suggests that the relationship is modified by feedbacks (E3) or additional confounders (E4). Due to the high volcanic emissions, the 2008 Nd–LWP relationship in region A is known to be strongly controlled by aerosol variations (E1) and has a reduced impact of other processes (E2–E4), such that it is likely closer to the causal Nd–LWP relationship. This indicates a considerably weaker role for Nd than determined in Sect. 4. With an mh of −0.15, the in-plume results are much closer to the results from LES simulations (Ackerman et al., 2004; Bretherton et al., 2007; Xue et al., 2008, ) and in situ observations of ship tracks, where decreases in LWP have been observed under particularly polluted conditions (Ackerman et al., 2000; Noone et al., 2000; Christensen and Stephens, 2011; Goren and Rosenfeld, 2014). The consequently weaker LWP response to aerosol is in better agreement with the weak LWP changes observed in Fig. 5b and Malavelle et al. (2017).
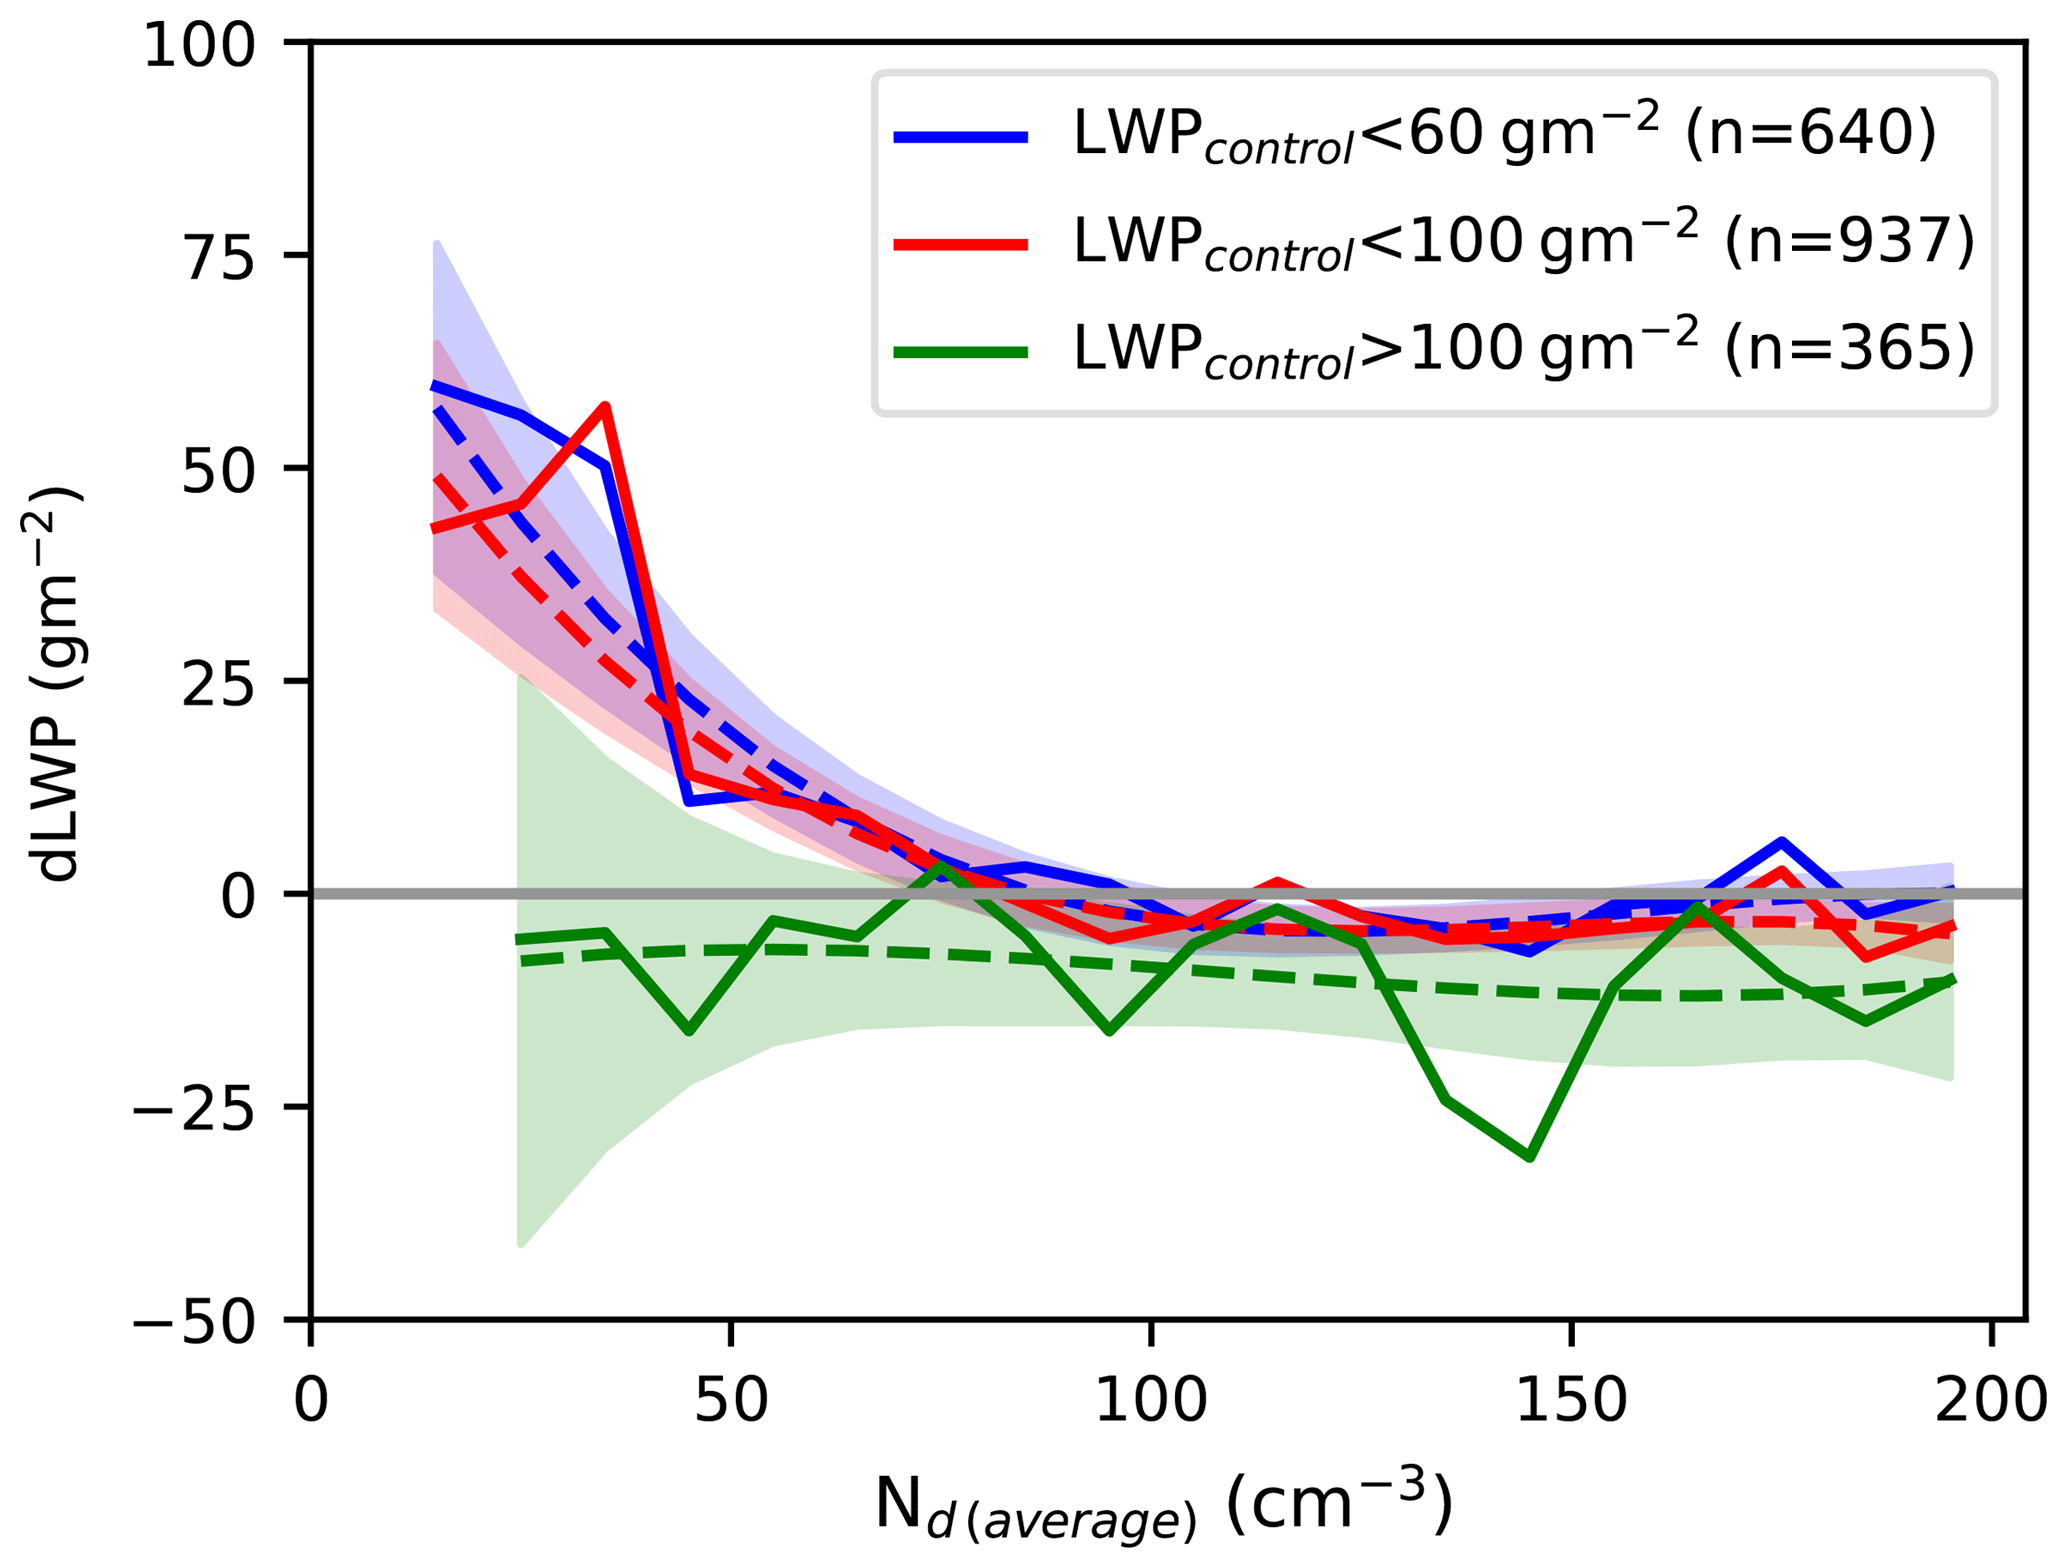
Figure 6The difference in the LWP between the ship track and surrounding control regions as a function of the ship track Nd. The separate lines are for different values of control LWP. The LWP and Nd values are from MODIS, using the ship track dataset from Christensen et al. (2014). The numbers in the legend are the number of ship tracks that make up each line. Each line is characterised by a third-order uncertainty-weighted polynomial fit (dashed), with the shaded area showing the 2σ uncertainty on the fit.
The Kilauea volcano primarily affects shallow cumulus clouds (Oreopoulos et al., 2014), which exert a weak control on the ERFaci from LWP changes due to their low liquid CF. The processes responsible for a reduction in LWP (E1c) may be different from those controlling stratocumulus clouds (E1b). Shipping provides another source of exogeneous aerosol perturbations (Hobbs et al., 2000), generating ship tracks that are primarily concentrated in the high CF stratocumulus regions. Using a database of ship tracks from Christensen et al. (2014), the relationship between the in-ship-track Nd and LWP increase in the ship track compared to the control region around the track (dLWP) indicates how the LWP responds to Nd perturbations. As the Nd values always increase from the control region to the inside the ship track, dLWP shares a sign with the gradient of the Nd–LWP relationship. Note that due to the required spatial resolution, the LWP for these ship tracks is retrieved using MODIS, rather than AMSR-E.
For low control values of the LWP (Fig. 6), increases in LWP (positive values of dLWP) are seen at lower in-ship-track values of Nd, but as the ship track Nd gets higher, the dLWP reduces to close to zero, with a negative dLWP for the most polluted cases. When the control LWP is high, dLWP is consistently weakly negative, although this likely is due to regression to the mean effects (the mean control LWP is 82 g m−2). This suggests that the LWP becomes insensitive to further aerosol ∕ Nd perturbations once the LWP reaches a sufficient magnitude, consistent with an aerosol suppression of precipitation (E1a). These small dLWP values at high Nd are consistent with the Kilauea results, suggesting a weak LWP response at high Nd. If the LWP response in ship tracks followed the relationships from Sect. 4, a strong negative dLWP should be visible at high Nd, in contrast to the weak negative response actually observed (Fig. 6).
By selecting situations where aerosol is known to be responsible for Nd variations (so-called “natural experiments”), the impact of feedbacks (E3) and additional covariations (E4) can be reduced (although not completely removed). In these situations, the Nd variations are driven by exogeneous aerosol perturbations, such that the LWP variations are a response to (rather than a driver or indicator of) the change in Nd (E1 only). This means that the Nd–LWP relationship during these “natural experiments” provides better information on the LWP response to Nd variations, such that the strong negative Nd–LWP relationships observed in Sect. 4 likely overestimate the decrease in LWP in response to aerosol perturbations. While the satellite-derived relationships may therefore be unsuitable as a direct estimate on the aerosol impact on LWP, they could be used as a lower bound on the LWP change (an upper bound on the radiative forcing) from aerosol-induced LWP decreases.
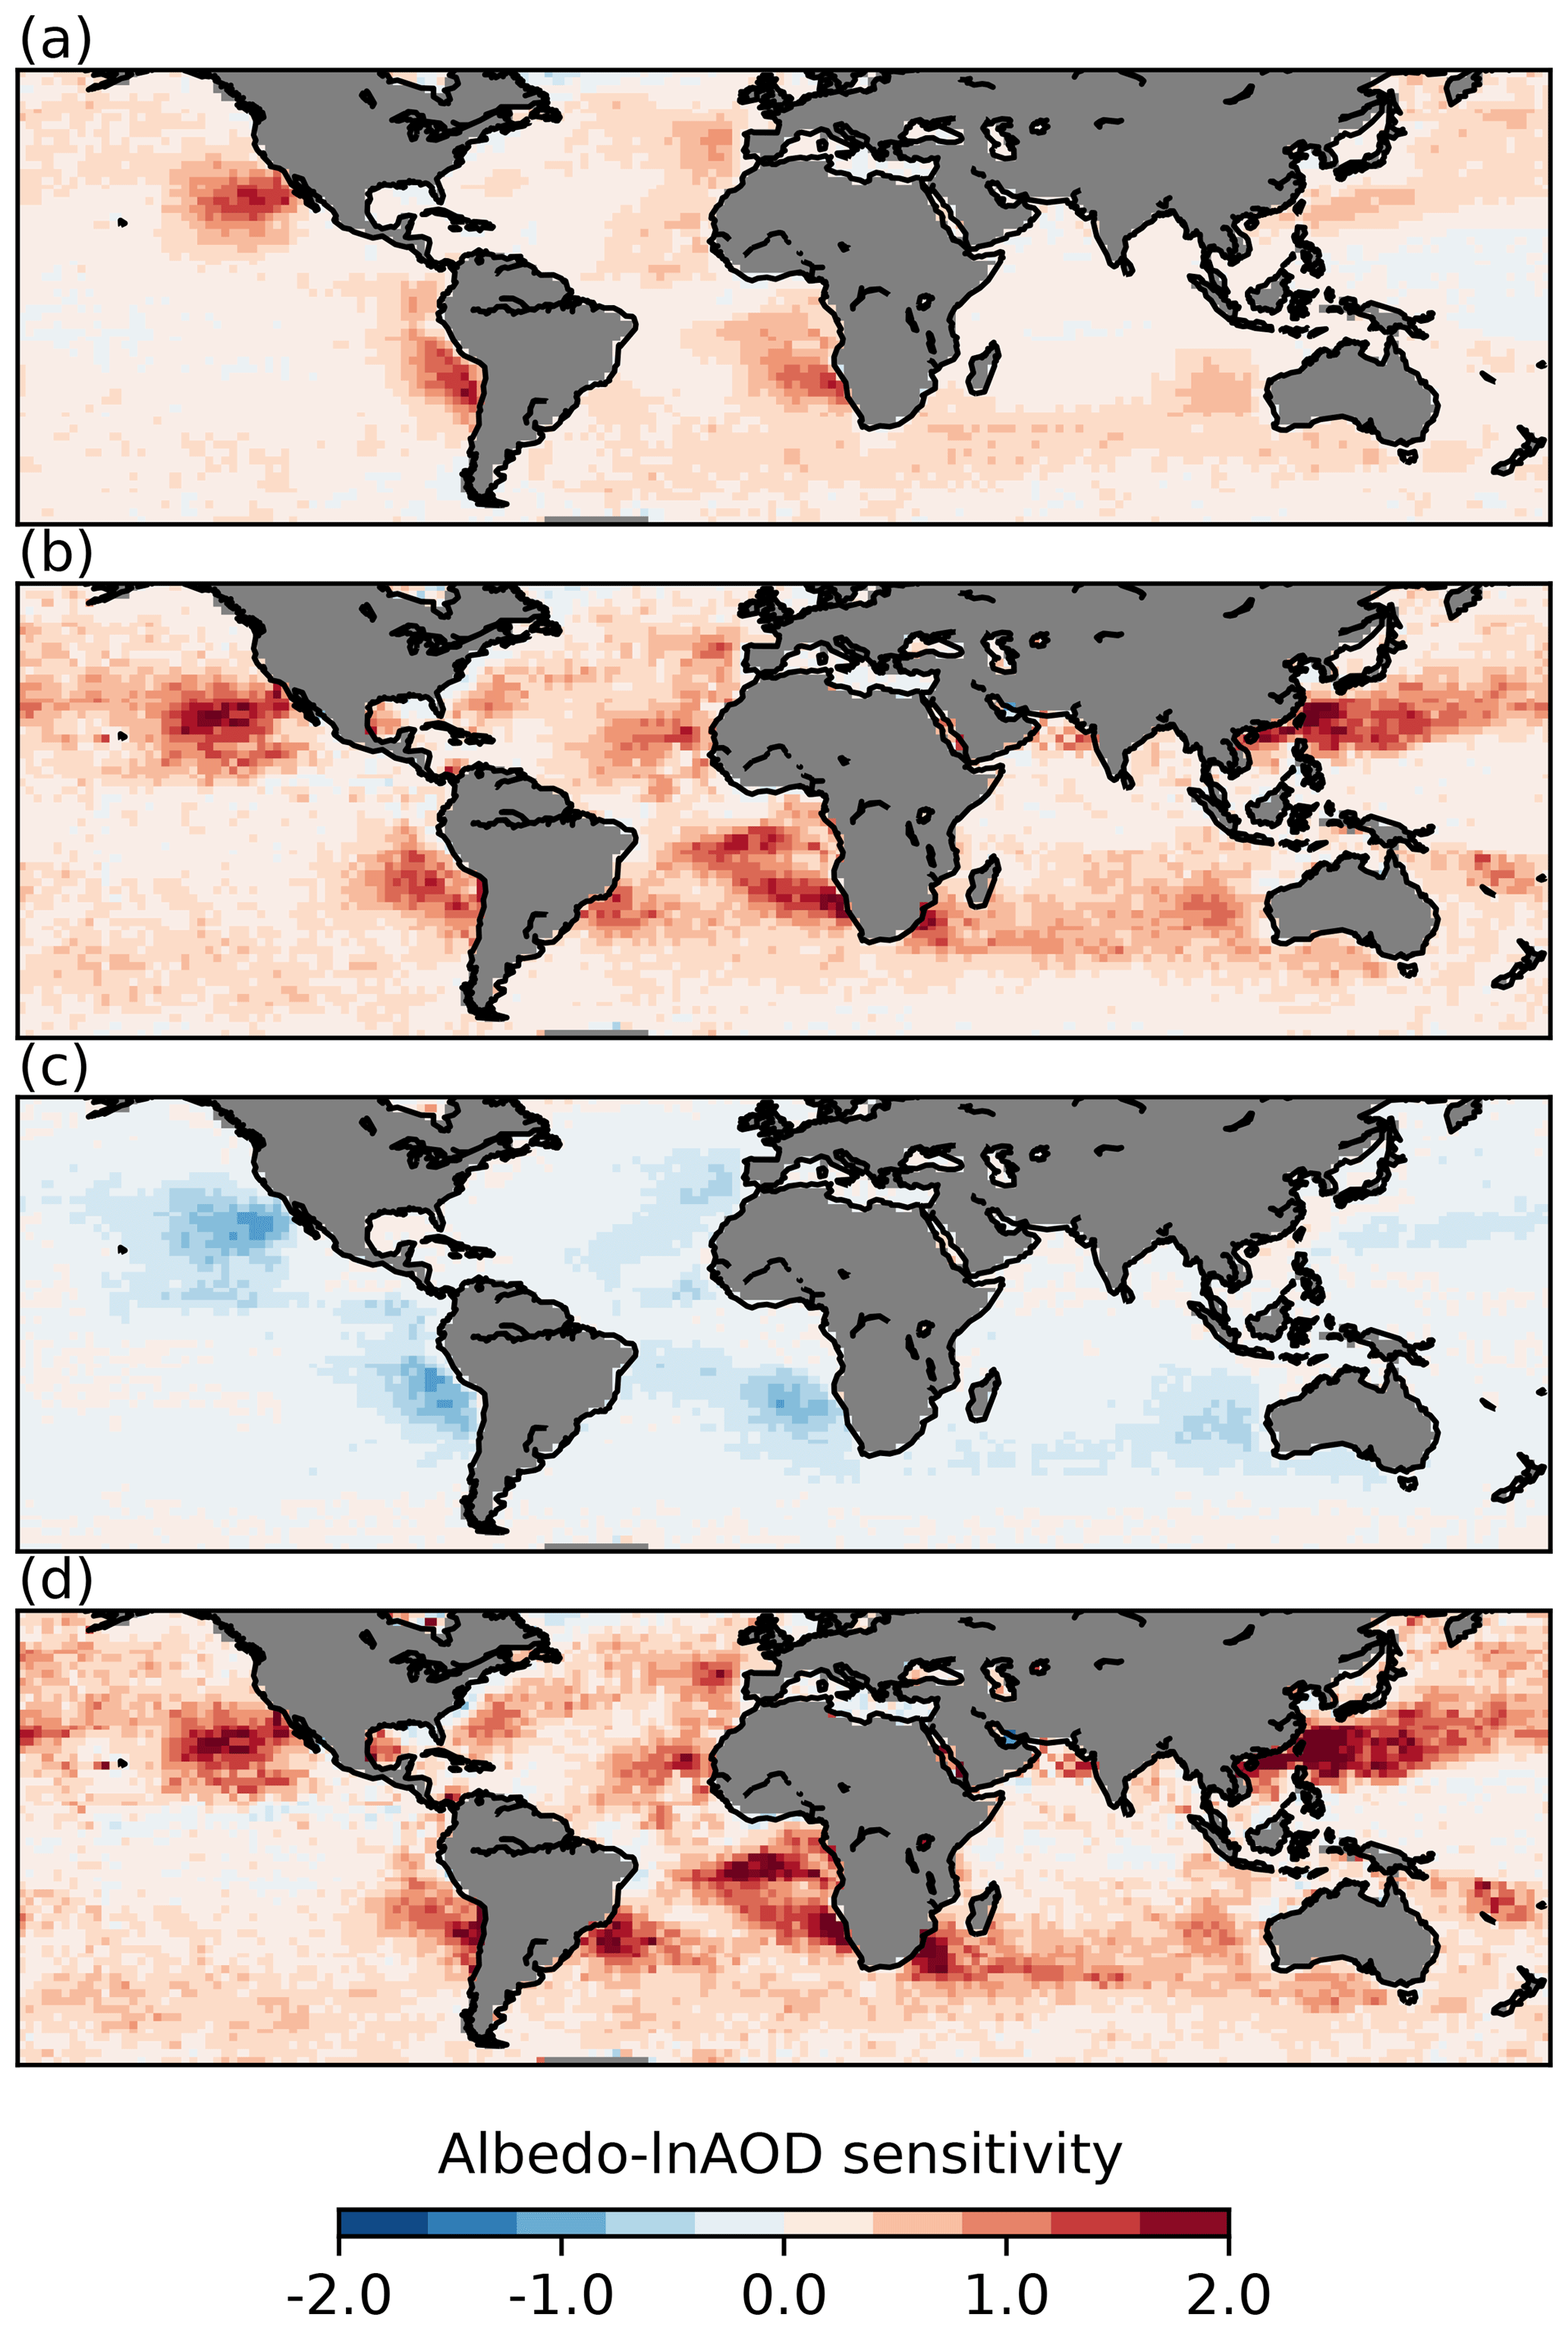
Figure 7The sensitivity of cloud albedo to lnAOD variations (a linear sensitivity calculated from P(α|τa)) through (a) Nd changes (Twomey only), (b) CF changes (const. Nd and LWP) and (c) LWP changes. Panel (d) shows the total sensitivity, which is calculated directly using Eq. (2), not as a linear sum of (a)–(c).
The planetary albedo sensitivities to aerosol perturbations are shown in Fig. 7 following Eq. (2). Due to the difficulty of visualising joint histograms globally, linear sensitivities are determined from the joint histograms (P(α|τa)) by weighting by the present-day aerosol distribution (see Gryspeerdt et al., 2016). The first three subplots show the albedo sensitivity through modifying the Nd (constant CF and LWP; Fig. 7a), CF (constant LWP; Fig. 7b) and AMSR-E LWP (constant CF; Fig. 7c). Both changes in Nd and CF increase the scene albedo, which results in a negative radiative forcing. They have somewhat different spatial patterns, with the albedo sensitivity to Nd changes being concentrated in the centres of the stratocumulus decks due to the high liquid cloud fraction. The sensitivity to CF changes is highest at the edges of the stratocumulus decks, where the greatest potential for modifying the cloud fraction exists, as found in previous studies (Gryspeerdt et al., 2016; Christensen et al., 2017; Andersen et al., 2017).
The sensitivity to LWP changes is also strongly dependent on the liquid CF and so is strongest in the centres of the stratocumulus decks (Fig. 7c). As a reduction in LWP with increasing Nd is observed in these regions (Fig. 3), this results in a negative albedo sensitivity to aerosol through LWP changes, which would in turn create a positive radiative forcing. Combining the albedo sensitivities in Fig. 7 with the anthropogenic aerosol fraction from Bellouin et al. (2013) implies a positive radiative forcing from LWP changes that offsets 62 % of the RFaci calculated using the same data, resulting in a weakening of the RFaci. The offset is similar (59 %) when using the anthropogenic fraction from Kinne (2019). This is likely the upper bound on the fraction of the RFaci offset by LWP reductions, following the results of Sect. 5 and supported by the weaker offsetting in regions with larger aerosol perturbations (e.g. the East China Sea, the tropical and North Atlantic). Despite the reduced albedo sensitivity due to the LWP reduction, the overall albedo sensitivity to aerosols is still positive (Fig. 7d), resulting in a negative ERFaci from liquid clouds due to the strong implied forcing from the Nd–CF relationship (approximately a 200 % increase above the RFaci).
There remains considerable uncertainty in the magnitudes of these effects. The albedo change is only calculated over ocean. Observational studies suggest the Nd change and RFaci over land are small, but it is possible that the LWP adjustments could have a very different character and relationship to the RFaci over land. The variation in the Nd–LWP relationship in the Kilauea volcanic plume (Fig. 5) and the response of the LWP in ship tracks (Fig. 6) suggest that the LWP change determined in Fig. 7 is overly strong. This would then place a 62 % offset of the RFaci as the upper bound on the radiative forcing from LWP changes (larger offsets are unlikely). This is consistent with previous work, where an increase in cloud albedo is found in response to a change in aerosol (Lebsock et al., 2008; Chen et al., 2014; Christensen et al., 2016), such that a LWP reduction cannot completely offset the RFaci.
This work demonstrates that a non-linear relationship exists between Nd and LWP (Fig. 2). These results are in agreement with previous studies, with an increase in LWP with Nd at low Nd from precipitation suppression (E1a), but a decrease at high Nd due to increased cloud top or lateral entrainment (E1b, c). The similarity in the relationship when using different measures of LWP suggests that this relationship is not primarily due to LWP retrieval errors (E2). There are global variations in the Nd–LWP relationship and significant changes accompany variations in meteorological factors, particularly RH750 (Fig. 4). The observed Nd–LWP relationship implies a reduction in LWP with increasing aerosol and Nd, resulting in a positive radiative forcing that offsets around 60 % of the RFaci.
The analysis in Sect. 5 suggests that the negative Nd–LWP relationship observed over much of the world may be overestimated, resulting in too strong a corresponding positive radiative forcing due to aerosol-induced LWP adjustments. A precipitation feedback (E3a) would produce a positive Nd–LWP relationship and so is unlikely to be responsible. An entrainment-based feedback on the Nd (E3b) or an additional confounder (E4) could be responsible for the negative Nd–LWP relationship.
The albedo sensitivity to aerosol via LWP changes is particularly strong in the stratocumulus regions (Fig. 7), due to the high liquid cloud fraction. This implies an important role for the sedimentation–entrainment feedback (E1b). With the entrainment of dry environmental air at the cloud top, the assumptions in the Nd retrieval of a linearly increasing liquid water content and vertically constant Nd no longer hold as the cloud is no longer adiabatic, such that the cloud top Nd is no longer representative of the cloud base Nd. A reduction in the cloud top re by homogeneous mixing during entrainment would produce an increase in Nd required by E3b. Cloud top homogeneous mixing generating an apparent Nd–LWP would also create the dependence of the Nd–LWP relationship on RH750 observed in Fig. 4. A stronger impact on the retrieved Nd would be found with the entrainment of drier air, resulting in a more negative Nd–LWP relationship.
However, although some studies have found evidence of homogeneous mixing in stratocumulus cloud (Breon and Doutriaux-Boucher, 2005; Yum et al., 2015), many studies have found that inhomogeneous mixing dominates, particularly at cloud tops (Nicholls, 1987; Pawlowska et al., 2000; Gerber et al., 2005; Burnet and Brenguier, 2007; Yum et al., 2015). While inhomogeneous mixing reduces the Nd, in extreme cases it does not result in an re change and so may not be detected by satellite. As such, some proportion of homogeneous mixing is required for E3b to generate a negative Nd–LWP relationship in satellite data. A discrepancy between satellite-retrieved and in situ Nd as a function of humidity or entrainment rate might be one indicator of this process. Further investigation into the mixing and behaviour of these retrievals at cloud tops is necessary to establish the impact of E3b on the Nd retrievals and the Nd–LWP relationship.
An additional, unknown confounder (E4) is also a possible explanation for the results in Sect. 5. This effect would have to act on both Nd and LWP together – a process that only affects one would not generate the systematic bias required. Even if such an unknown, additional confounding process exists, the conclusion drawn from Sect. 5 would still hold – that the implied aerosol impact on LWP in Fig. 7 is likely too strong.
By using 1∘ by 1∘ average values, this work ignores the impact of sub-grid variability of the Nd and LWP retrievals (Zhang et al., 2018). Preliminary work indicates that this may modify the relationship, with the strength of the relationship changing when it is determined at smaller spatial and temporal scales. If the interpretation of the results from natural experiments is followed, it implies that these small-scale Nd–LWP relationships are strongly influenced by E2–E4, due to the lack of aerosol variation to drive the Nd variation necessary to highlight the impact of E1. The cause of this scale dependence will be investigated in future studies.
Although volcanic emissions (Fig. 5) and ship tracks are exogeneous sources of aerosol, the datasets linked to these sources are limited. They occur in relatively restricted locations on the globe and there are a small number of the high-Nd retrievals required to populate the Nd–LWP histogram (Fig. 6). While the ship track dataset is concentrated in stratocumulus regions (Christensen et al., 2014), it is still possible that the effect on shallow cumulus clouds could be large enough to overcome the relatively small CF in this regime which has previously been shown to restrict the contribution of shallow cumulus clouds to the RFaci (Gryspeerdt and Stier, 2012). Given the importance of the Nd to this work, an improved understanding of the behaviour of the Nd retrieval through a comparison with in situ data is particularly important. Future studies are planned to expand this dataset of exogeneous aerosol perturbations in marine clouds such that a more representative global study of this type can be performed. Process-resolving simulations of these cases and a comparison to the global results are necessary to fully understand the behaviour of the satellite retrievals and how accurately they can represent the aerosol Nd–LWP system to better constrain the aerosol impact on LWP.
Along with liquid cloud fraction (CF) and droplet number concentration (Nd), the liquid water path (LWP) has a large impact on the albedo of a scene containing liquid clouds. However, due to the nature of the Nd–LWP relationship and the retrievals of these properties, global constraints of the aerosol impact on LWP and the corresponding radiative impact have been difficult to determine. Several possible mechanisms for generating a relationship between Nd and LWP are described in Sect. 2.
This work has demonstrated that although there is a clear relationship between the satellite-retrieved Nd and LWP, this relationship is highly non-linear. At low Nd values (where precipitation is expected), there is an increase in LWP with increasing Nd consistent with an aerosol suppression of precipitation (E1a). At high Nd, the LWP decreases with increasing Nd, an effect which has been previously suggested to be due to the droplet size impact on entrainment (E1b/c, Fig. 2). This non-linearity of the Nd–LWP relationship restricts the ability of linear regressions to characterise the relationship. The reduction in LWP with increasing Nd is only slightly stronger when using MODIS LWP compared to the in-cloud LWP from AMSR-E, suggesting that although correlated errors in the MODIS LWP and Nd can play a role (E2), they do not dominate the magnitude of the Nd–LWP relationship.
By clustering the Nd–LWP joint histograms, it is shown that the primary variation in the histograms comes from variations in the LWP behaviour at high Nd (Fig. 3). In the subtropical subsidence regions, there is a clear LWP reduction with increasing Nd, whilst in other regions, LWP remains constant or even increases with LWP even at high Nd. The global relationship is dominated by the subtropical relationship due to the high liquid CF and higher Nd variation in these regions, but the regional variations in the Nd–LWP relationship make it difficult to use the results from one region to constrain others.
Part of this variability come from regional differences in meteorological conditions. Significant variations in the Nd–LWP relationship are found with variations in RH750 and LTS (Fig. 4). As with the global relationships, linear regressions have difficulty fully characterising these relationships. As noted by Chen et al. (2014) and Michibata et al. (2016), cloud top relative humidity plays an important role in determining the strength of the relationship, with a more weakly negative Nd–LWP relationship in humid regions.
However, results from natural experiments created by volcanic outgassing and shipping suggest that the negative Nd–LWP relationship is likely overestimated. In situations where the strong aerosol variability is the leading control on Nd variations, the impact of feedbacks (E3) or additional confounders (E4) on the Nd–LWP relationship is significantly reduced. This suggests that the weaker Nd–LWP relationship observed in response to ship and volcanic aerosol perturbations better represents the impact of aerosols (E1) than the strong relationship observed at a global scale (Sect. 4), bringing the observations into better agreement with LES simulations (Ackerman et al., 2004; Bretherton et al., 2007; Xue et al., 2008).
The observed Nd–LWP relationship suggests that LWP adjustments could offset up to 60 % of the RFaci (Twomey effect) (Fig. 7), as a positive radiative forcing. This represents an upper bound on the positive radiative forcing expected from a LWP reduction. The results from natural experiments suggest that the LWP response is likely weaker than this (Figs. 5, 6), as the causal Nd–LWP relationship is obscured by feedbacks (E3) and additional confounders (E4) in many cases. Further work is required to bound the LWP response, but these results suggest that the overall ERFaci is likely to be negative, supported by previous studies that have found that a complete offset of the RFaci is unlikely (Chen et al., 2014).
Although it has been demonstrated in this work that the Nd–LWP relationship has a substantial impact on the ERFaci, it is clear that significant uncertainties remain. The satellite-retrieved Nd–LWP relationship has several features that are similar to the relationship predicted by high-resolution models (Ackerman et al., 2004; Sato et al., 2018), but the extent to which these relationships represent the causal relationship (and so can be used to constrain aerosol–cloud interactions) is not clear and so can be used to constrain aerosol–cloud interactions. A wider study of the effect of aerosols on LWP due to exogenous aerosol perturbations in a variety of cloud regimes would provide one avenue for progress, as would finding a suitable mediating variable within the Nd–LWP relationship.
The MODIS data are from the NASA Goddard Space Flight Center. The CERES data were obtained from the NASA Langley Research Center Atmospheric Science Data Center. The AMSR-E were obtained from the National Snow and Ice Data Center. The data products are referenced in Sect. 3.
If the LWP and Nd are calculated from MODIS data using the adiabatic assumption (Szczodrak et al., 2001; Quaas et al., 2006), they take the form
where is the adiabatic factor (fad=1 is completely adiabatic) and c(T) is the temperature correction to the condensation rate from Gryspeerdt et al. (2016). The linear sensitivity expected from re variations, assuming a constant τc, is then
By similar logic, the sensitivity expected at a constant re from variations in τc is
Note that the cause of these variations is not specified. A variation in re due to retrieval errors or Nd variations would produce the same effect. As both the LWP and Nd relate to the adiabatic factor in the same way as the optical depth, the expected sensitivity from adiabatic factor variation is also 2.
The supplement related to this article is available online at: https://doi.org/10.5194/acp-19-5331-2019-supplement.
All of the authors participated in the design of the study. EG performed the analysis and wrote the paper. MC provided the ship track dataset. All of the authors assisted in the interpretation of the results and commented on the paper.
The authors declare that they have no conflict of interest.
This work was supported by funding from the European Research Council under the European Union's Seventh Framework Programme (FP7/2007-2013 and ERC grant agreement no. FP7-306284 – QUAERERE). Edward Gryspeerdt is supported by an Imperial College London Junior Research Fellowship. TG received funding from the European Union Horizon 2020 research and innovation program under the Marie Sklodowska-Curie grant agreement 703880. The authors would like to thanks the reviewers for their helpful comments and suggestions.
This paper was edited by Graham Feingold and reviewed by two anonymous referees.
Ackerman, A. S., Toon, O. B., Taylor, J. P., Johnson, D. W., Hobbs, P. V., and Ferek, R. J.: Effects of Aerosols on Cloud Albedo: Evaluation of Twomey's Parameterization of Cloud Susceptibility Using Measurements of Ship Tracks, J. Atmos. Sci., 57, 2684–2695, https://doi.org/10.1175/1520-0469(2000)057<2684:EOAOCA>2.0.CO;2, 2000. a
Ackerman, A. S., Kirkpatrick, M. P., Stevens, D. E., and Toon, O. B.: The impact of humidity above stratiform clouds on indirect aerosol climate forcing, Nature, 432, 1014–1017, https://doi.org/10.1038/nature03174, 2004. a, b, c, d, e, f, g, h, i
Albrecht, B. A.: Aerosols, Cloud Microphysics, and Fractional Cloudiness, Science, 245, 1227–1230, https://doi.org/10.1126/science.245.4923.1227, 1989. a, b
Anderberg, M.: Cluster analysis for applications, Elsevier, New York, 1973. a
Andersen, H., Cermak, J., Fuchs, J., Knutti, R., and Lohmann, U.: Understanding the drivers of marine liquid-water cloud occurrence and properties with global observations using neural networks, Atmos. Chem. Phys., 17, 9535–9546, https://doi.org/10.5194/acp-17-9535-2017, 2017. a
Baker, M. B., Corbin, R. G., and Latham, J.: The influence of entrainment on the evolution of cloud droplet spectra: I. A model of inhomogeneous mixing, Q. J. Roy. Meteor. Soc., 106, 581–598, https://doi.org/10.1002/qj.49710644914, 1980. a
Bellouin, N. and Quaas, J.: Bounding the effective aerosol radiative forcing, Rev. Geophys., in preparation, 2019. a
Bellouin, N., Mann, G. W., Woodhouse, M. T., Johnson, C., Carslaw, K. S., and Dalvi, M.: Impact of the modal aerosol scheme GLOMAP-mode on aerosol forcing in the Hadley Centre Global Environmental Model, Atmos. Chem. Phys., 13, 3027–3044, https://doi.org/10.5194/acp-13-3027-2013, 2013. a, b
Bender, F. A.-M., Frey, L., McCoy, D. T., Grosvenor, D. P., and Mohrmann, J. K.: Assessment of aerosol–cloud–radiation correlations in satellite observations, climate models and reanalysis, Clim. Dynam., 1–22, https://doi.org/10.1007/s00382-018-4384-z, 2018. a
Bennartz, R. and Rausch, J.: Global and regional estimates of warm cloud droplet number concentration based on 13 years of AQUA-MODIS observations, Atmos. Chem. Phys., 17, 9815–9836, https://doi.org/10.5194/acp-17-9815-2017, 2017. a
Boucher, O., Randall, D. A., Artaxo, P., Bretherton, C., Feingold, G., Forster, P. M., Kerminen, V.-M., Kondo, Y., Liao, H., Lohmann, U., Rasch, P., Satheesh, S. K., Sherwood, S., Stevens, B., and Zhang, X. Y.: Clouds and Aerosols, in: Climate Change 2013 – The Physical Science Basis: Working Group I Contribution to the Fifth Assessment Report of the Intergovernmental Panel on Climate Change, Cambridge University Press, 571–658, https://doi.org/10.1017/CBO9781107415324.016, 2014. a
Brenguier, J.-L., Pawlowska, H., Schüller, L., Preusker, R., Fischer, J., and Fouquart, Y.: Radiative Properties of Boundary Layer Clouds: Droplet Effective Radius versus Number Concentration, J. Atmos. Sci., 57, 803–821, https://doi.org/10.1175/1520-0469(2000)057<0803:RPOBLC>2.0.CO;2, 2000. a
Breon, F.-M. and Doutriaux-Boucher, M.: A comparison of cloud droplet radii measured from space, IEEE T. Geosci. Remote, 43, 1796–1805, https://doi.org/10.1109/TGRS.2005.852838, 2005. a
Bretherton, C. S., Blossey, P. N., and Uchida, J.: Cloud droplet sedimentation, entrainment efficiency, and subtropical stratocumulus albedo, Geophys. Res. Lett., 34, L03813, https://doi.org/10.1029/2006GL027648, 2007. a, b, c, d, e
Burnet, F. and Brenguier, J.-L.: Observational Study of the Entrainment-Mixing Process in Warm Convective Clouds, J. Atmos. Sci., 64, 1995–2011, https://doi.org/10.1175/JAS3928.1, 2007. a
Chand, D., Wood, R., Ghan, S. J., Wang, M., Ovchinnikov, M., Rasch, P. J., Miller, S., Schichtel, B., and Moore, T.: Aerosol optical depth increase in partly cloudy conditions, J. Geophys. Res., 117, 17207, https://doi.org/10.1029/2012JD017894, 2012. a
Chen, Y.-C., Christensen, M. W., Xue, L., Sorooshian, A., Stephens, G. L., Rasmussen, R. M., and Seinfeld, J. H.: Occurrence of lower cloud albedo in ship tracks, Atmos. Chem. Phys., 12, 8223–8235, https://doi.org/10.5194/acp-12-8223-2012, 2012. a
Chen, Y.-C., Christensen, M. W., Stephens, G. L., and Seinfeld, J. H.: Satellite-based estimate of global aerosol–cloud radiative forcing by marine warm clouds, Nat. Geosci., 7, 643–646, https://doi.org/10.1038/NGEO2214, 2014. a, b, c, d, e, f, g, h, i, j, k
Chi, J. T., Chi, E. C., and Baraniuk, R. G.: k-POD: A Method for k-Means Clustering of Missing Data, Am. Stat., 70, 91–99, https://doi.org/10.1080/00031305.2015.1086685, 2016. a
Christensen, M. W. and Stephens, G. L.: Microphysical and macrophysical responses of marine stratocumulus polluted by underlying ships: Evidence of cloud deepening, J. Geophys. Res., 116, D03201, https://doi.org/10.1029/2010JD014638, 2011. a
Christensen, M. W., Suzuki, K., Zambri, B., and Stephens, G. L.: Ship track observations of a reduced shortwave aerosol indirect effect in mixed-phase clouds, Geophys. Res. Lett., 41, 6970–6977, https://doi.org/10.1002/2014GL061320, 2014. a, b, c, d
Christensen, M. W., Chen, Y.-C., and Stephens, G. L.: Aerosol Indirect Effect Dictated by Liquid Clouds, J. Geophys. Res., 121, 14636–14650, https://doi.org/10.1002/2016JD025245, 2016. a
Christensen, M. W., Neubauer, D., Poulsen, C. A., Thomas, G. E., McGarragh, G. R., Povey, A. C., Proud, S. R., and Grainger, R. G.: Unveiling aerosol–cloud interactions – Part 1: Cloud contamination in satellite products enhances the aerosol indirect forcing estimate, Atmos. Chem. Phys., 17, 13151–13164, https://doi.org/10.5194/acp-17-13151-2017, 2017. a, b, c, d
Dagan, G., Koren, I., and Altaratz, O.: Competition between core and periphery-based processes in warm convective clouds – from invigoration to suppression, Atmos. Chem. Phys., 15, 2749–2760, https://doi.org/10.5194/acp-15-2749-2015, 2015. a
Dagan, G., Koren, I., Altaratz, O., and Heiblum, R. H.: Time-dependent, non-monotonic response of warm convective cloud fields to changes in aerosol loading, Atmos. Chem. Phys., 17, 7435–7444, https://doi.org/10.5194/acp-17-7435-2017, 2017. a, b
Eastman, R. and Wood, R.: Factors Controlling Low-Cloud Evolution over the Eastern Subtropical Oceans: A Lagrangian Perspective Using the A-Train Satellites, J. Atmos. Sci., 73, 331–351, https://doi.org/10.1175/JAS-D-15-0193.1, 2016. a, b
Ebmeier, S. K., Sayer, A. M., Grainger, R. G., Mather, T. A., and Carboni, E.: Systematic satellite observations of the impact of aerosols from passive volcanic degassing on local cloud properties, Atmos. Chem. Phys., 14, 10601–10618, https://doi.org/10.5194/acp-14-10601-2014, 2014. a
Engström, A., Bender, F. A.-M., Charlson, R. J., and Wood, R.: Geographically coherent patterns of albedo enhancement and suppression associated with aerosol sources and sinks, Tellus B, 67, 26442, https://doi.org/10.3402/tellusb.v67.26442, 2015. a
Gassó, S.: Satellite observations of the impact of weak volcanic activity on marine clouds, J. Geophys. Res., 113, D14S19, https://doi.org/10.1029/2007JD009106, 2008. a, b
Gerber, H., Frick, G., Malinowski, S. P., Brenguier, J.-L., and Burnet, F.: Holes and Entrainment in Stratocumulus, J. Atmos. Sci., 62, 443–459, https://doi.org/10.1175/JAS-3399.1, 2005. a
Goren, T. and Rosenfeld, D.: Decomposing aerosol cloud radiative effects into cloud cover, liquid water path and Twomey components in marine stratocumulus, Atmos. Res., 138, 378–393, https://doi.org/10.1016/j.atmosres.2013.12.008, 2014. a, b, c
Grandey, B. S., Stier, P., and Wagner, T. M.: Investigating relationships between aerosol optical depth and cloud fraction using satellite, aerosol reanalysis and general circulation model data, Atmos. Chem. Phys., 13, 3177–3184, https://doi.org/10.5194/acp-13-3177-2013, 2013. a
Grosvenor, D. P. and Wood, R.: The effect of solar zenith angle on MODIS cloud optical and microphysical retrievals within marine liquid water clouds, Atmos. Chem. Phys., 14, 7291–7321, https://doi.org/10.5194/acp-14-7291-2014, 2014. a, b, c, d
Grosvenor, D. P., Field, P. R., Hill, A. A., and Shipway, B. J.: The relative importance of macrophysical and cloud albedo changes for aerosol-induced radiative effects in closed-cell stratocumulus: insight from the modelling of a case study, Atmos. Chem. Phys., 17, 5155–5183, https://doi.org/10.5194/acp-17-5155-2017, 2017. a
Grosvenor, D. P., Sourdeval, O., Zuidema, P., Ackerman, A., Alexandrov, M. D., Bennartz, R., Boers, R., Cairns, B., Chiu, J. C., Christensen, M., Deneke, H., Diamond, M., Feingold, G., Fridlind, A., Hünerbein, A., Knist, C., Kollias, P., Marshak, A., McCoy, D., Merk, D., Painemal, D., Rausch, J., Rosenfeld, D., Russchenberg, H., Seifert, P., Sinclair, K., Stier, P., van Diedenhoven, B., Wendisch, M., Werner, F., Wood, R., Zhang, Z., and Quaas, J.: Remote Sensing of Droplet Number Concentration in Warm Clouds: A Review of the Current State of Knowledge and Perspectives, Rev. Geophys., 56, 409–453, https://doi.org/10.1029/2017RG000593, 2018. a, b
Gryspeerdt, E. and Stier, P.: Regime-based analysis of aerosol-cloud interactions, Geophys. Res. Lett., 39, L21802, https://doi.org/10.1029/2012GL053221, 2012. a, b, c
Gryspeerdt, E., Stier, P., and Grandey, B. S.: Cloud fraction mediates the aerosol optical depth-cloud top height relationship, Geophys. Res. Lett., 41, 3622–3627, https://doi.org/10.1002/2014GL059524, 2014a. a
Gryspeerdt, E., Stier, P., and Partridge, D. G.: Satellite observations of cloud regime development: the role of aerosol processes, Atmos. Chem. Phys., 14, 1141–1158, https://doi.org/10.5194/acp-14-1141-2014, 2014b. a, b
Gryspeerdt, E., Quaas, J., and Bellouin, N.: Constraining the aerosol influence on cloud fraction, J. Geophys. Res., 121, 3566–3583, https://doi.org/10.1002/2015JD023744, 2016. a, b, c, d, e, f, g, h
Gryspeerdt, E., Quaas, J., Ferrachat, S., Gettelman, A., Ghan, S., Lohmann, U., Morrison, H., Neubauer, D., Partridge, D. G., Stier, P., Takemura, T., Wang, H., Wang, M., and Zhang, K.: Constraining the instantaneous aerosol influence on cloud albedo, P. Natl. Acad. Sci. USA, 114, 4899–4904, https://doi.org/10.1073/pnas.1617765114, 2017. a, b, c
Han, Q., Rossow, W. B., Zeng, J., and Welch, R.: Three Different Behaviors of Liquid Water Path of Water Clouds in Aerosol–Cloud Interactions, J. Atmos. Sci., 59, 726–735, https://doi.org/10.1175/1520-0469(2002)059<0726:TDBOLW>2.0.CO;2, 2002. a
Heyn, I., Block, K., Mülmenstädt, J., Gryspeerdt, E., Kühne, P., Salzmann, M., and Quaas, J.: Assessment of simulated aerosol effective radiative forcings in the terrestrial spectrum, Geophys. Res. Lett., 44, 1001–1007, https://doi.org/10.1002/2016GL071975, 2017. a
Hobbs, P. V., Garrett, T. J., Ferek, R. J., Strader, S. R., Hegg, D. A., Frick, G. M., Hoppel, W. A., Gasparovic, R. F., Russell, L. M., Johnson, D. W., O'Dowd, C., Durkee, P. A., Nielsen, K. E., and Innis, G.: Emissions from Ships with respect to Their Effects on Clouds, J. Atmos. Sci., 57, 2570–2590, https://doi.org/10.1175/1520-0469(2000)057<2570:EFSWRT>2.0.CO;2, 2000. a
Jiang, H., Xue, H., Teller, A., Feingold, G., and Levin, Z.: Aerosol effects on the lifetime of shallow cumulus, Geophys. Res. Lett., 33, L14806, https://doi.org/10.1029/2006GL026024, 2006. a
Jones, E., Oliphant, T., and Peterson, P.: SciPy: Open source scientific tools for Python, 2001. a, b
Kaufman, Y. J., Koren, I., Remer, L. A., Rosenfeld, D., and Rudich, Y.: The effect of smoke, dust, and pollution aerosol on shallow cloud development over the Atlantic Ocean, P. Natl. Acad. Sci. USA, 102, 11207–11212, https://doi.org/10.1073/pnas.0505191102, 2005. a
Kinne, S.: Aerosol radiative effects with MACv2, Atmos. Chem. Phys. Discuss., https://doi.org/10.5194/acp-2018-949, in review, 2019. a, b
Koren, I., Kaufman, Y. J., Rosenfeld, D., Remer, L. A., and Rudich, Y.: Aerosol invigoration and restructuring of Atlantic convective clouds, Geophys. Res. Lett., 32, L14828, https://doi.org/10.1029/2005GL023187, 2005. a
Koren, I., Dagan, G., and Altaratz, O.: From aerosol-limited to invigoration of warm convective clouds, Science, 344, 1143–1146, https://doi.org/10.1126/science.1252595, 2014. a, b
Lebsock, M. and Su, H.: Application of active spaceborne remote sensing for understanding biases between passive cloud water path retrievals, J. Geophys. Res., 119, 8962–8979, https://doi.org/10.1002/2014JD021568, 2014. a
Lebsock, M., Stephens, G., and Kummerow, C.: Multisensor satellite observations of aerosol effects on warm clouds, J. Geophys. Res., 113, D15205, https://doi.org/10.1029/2008JD009876, 2008. a
Malavelle, F. F., Haywood, J. M., Jones, A., Gettelman, A., Clarisse, L., Bauduin, S., Allan, R. P., Karset, I. H. H., Kristjansson, J. E., Oreopoulos, L., Cho, N., Lee, D., Bellouin, N., Boucher, O., Grosvenor, D. P., Carslaw, K. S., Dhomse, S., Mann, G. W., Schmidt, A., Coe, H., Hartley, M. E., Dalvi, M., Hill, A. A., Johnson, B. T., Johnson, C. E., Knight, J. R., O'Connor, F. M., Partridge, D. G., Stier, P., Myhre, G., Platnick, S., Stephens, G. L., Takahashi, H., and Thordarson, T.: Strong constraints on aerosol–cloud interactions from volcanic eruptions, Nature, 546, 485–491, https://doi.org/10.1038/nature22974, 2017. a, b, c, d, e
Marchand, R., Ackerman, T., Smyth, M., and Rossow, W. B.: A review of cloud top height and optical depth histograms from MISR, ISCCP, and MODIS, J. Geophys. Res., 115, D16206, https://doi.org/10.1029/2009JD013422, 2010. a
Matsui, T., Masunaga, H., Kreidenweis, S. M., Pielke, R. A., Tao, W.-K., Chin, M., and Kaufman, Y. J.: Satellite-based assessment of marine low cloud variability associated with aerosol, atmospheric stability, and the diurnal cycle, J. Geophys. Res., 111, D17204, https://doi.org/10.1029/2005JD006097, 2006. a
McCoy, D. T., Bender, F. A.-M., Mohrmann, J. K. C., Hartmann, D. L., Wood, R., and Grosvenor, D. P.: The global aerosol-cloud first indirect effect estimated using MODIS, MERRA, and AeroCom, J. Geophys. Res., 122, 1779–1796, https://doi.org/10.1002/2016JD026141, 2017. a, b
McCoy, D. T., Field, P. R., Schmidt, A., Grosvenor, D. P., Bender, F. A.-M., Shipway, B. J., Hill, A. A., Wilkinson, J. M., and Elsaesser, G. S.: Aerosol midlatitude cyclone indirect effects in observations and high-resolution simulations, Atmos. Chem. Phys., 18, 5821–5846, https://doi.org/10.5194/acp-18-5821-2018, 2018. a
Merk, D., Deneke, H., Pospichal, B., and Seifert, P.: Investigation of the adiabatic assumption for estimating cloud micro- and macrophysical properties from satellite and ground observations, Atmos. Chem. Phys., 16, 933–952, https://doi.org/10.5194/acp-16-933-2016, 2016. a, b
Meskhidze, N., Remer, L. A., Platnick, S., Negrón Juárez, R., Lichtenberger, A. M., and Aiyyer, A. R.: Exploring the differences in cloud properties observed by the Terra and Aqua MODIS Sensors, Atmos. Chem. Phys., 9, 3461–3475, https://doi.org/10.5194/acp-9-3461-2009, 2009. a
Michibata, T., Suzuki, K., Sato, Y., and Takemura, T.: The source of discrepancies in aerosol–cloud–precipitation interactions between GCM and A-Train retrievals, Atmos. Chem. Phys., 16, 15413–15424, https://doi.org/10.5194/acp-16-15413-2016, 2016. a, b, c, d, e, f, g
Mülmenstädt, J., Sourdeval, O., Delanoë, J., and Quaas, J.: Frequency of occurrence of rain from liquid-, mixed-, and ice-phase clouds derived from A-Train satellite retrievals, Geophys. Res. Lett., 42, 6502–6509, https://doi.org/10.1002/2015GL064604, 2015. a
Nakajima, T., Higurashi, A., Kawamoto, K., and Penner, J. E.: A possible correlation between satellite-derived cloud and aerosol microphysical parameters, Geophys. Res. Lett., 28, 1171, https://doi.org/10.1029/2000GL012186, 2001. a
Neubauer, D., Christensen, M. W., Poulsen, C. A., and Lohmann, U.: Unveiling aerosol–cloud interactions – Part 2: Minimising the effects of aerosol swelling and wet scavenging in ECHAM6-HAM2 for comparison to satellite data, Atmos. Chem. Phys., 17, 13165–13185, https://doi.org/10.5194/acp-17-13165-2017, 2017. a, b
Nicholls, S.: A Model of Drizzle Growth In Warm, Turbulent, Stratiform Clouds, Q. J. Roy. Meteor. Soc., 113, 1141–1170, https://doi.org/10.1002/qj.49711347805, 1987. a
Noone, K. J., Johnson, D. W., Taylor, J. P., Ferek, R. J., Garrett, T., Hobbs, P. V., Durkee, P. A., Nielsen, K., Öström, E., O'Dowd, C., Smith, M. H., Russell, L. M., Flagan, R. C., Seinfeld, J. H., de, B. L., van, G. R. E., Hudson, J. G., Brooks, I., Gasparovic, R. F., and Pockalny, R. A.: A Case Study of Ship Track Formation in a Polluted Marine Boundary Layer., J. Atmos. Sci., 57, 2748–2764, https://doi.org/10.1175/1520-0469(2000)057<2748:ACSOST>2.0.CO;2, 2000. a
Oreopoulos, L., Cho, N., Lee, D., Kato, S., and Huffman, G. J.: An examination of the nature of global MODIS cloud regimes, J. Geophys. Res., 119, 8362–8383, https://doi.org/10.1002/2013JD021409, 2014. a
Painemal, D. and Zuidema, P.: Assessment of MODIS cloud effective radius and optical thickness retrievals over the Southeast Pacific with VOCALS-REx in situ measurements, J. Geophys. Res., 116, D24206, https://doi.org/10.1029/2011JD016155, 2011. a
Pawlowska, H., Brenguier, J., and Burnet, F.: Microphysical properties of stratocumulus clouds, Atmos. Res., 55, 15–33, https://doi.org/10.1016/S0169-8095(00)00054-5, 2000. a
Pearl, J.: A Probabilistic Calculus of Actions, in: Uncertainty in Artificial Intelligence 10, edited by: Lopez de Mantaras, R. and Poole, D., Morgan Kaufmann, San Mateo, CA, 454–462, https://doi.org/10.1016/B978-1-55860-332-5.50062-6, 1994. a, b
Pincus, R. and Baker, M.: Effects of precipitation on the albedo susceptibility of clouds in the marine boundary layer, Nature, 372, 250–252, 1994. a
Quaas, J., Boucher, O., and Lohmann, U.: Constraining the total aerosol indirect effect in the LMDZ and ECHAM4 GCMs using MODIS satellite data, Atmos. Chem. Phys., 6, 947–955, https://doi.org/10.5194/acp-6-947-2006, 2006. a, b
Quaas, J., Boucher, O., Bellouin, N., and Kinne, S.: Satellite-based estimate of the direct and indirect aerosol climate forcing, J. Geophys. Res., 113, D05204, https://doi.org/10.1029/2007JD008962, 2008. a, b
Quaas, J., Ming, Y., Menon, S., Takemura, T., Wang, M., Penner, J. E., Gettelman, A., Lohmann, U., Bellouin, N., Boucher, O., Sayer, A. M., Thomas, G. E., McComiskey, A., Feingold, G., Hoose, C., Kristjánsson, J. E., Liu, X., Balkanski, Y., Donner, L. J., Ginoux, P. A., Stier, P., Grandey, B., Feichter, J., Sednev, I., Bauer, S. E., Koch, D., Grainger, R. G., Kirkevåg, A., Iversen, T., Seland, Ø., Easter, R., Ghan, S. J., Rasch, P. J., Morrison, H., Lamarque, J.-F., Iacono, M. J., Kinne, S., and Schulz, M.: Aerosol indirect effects – general circulation model intercomparison and evaluation with satellite data, Atmos. Chem. Phys., 9, 8697–8717, https://doi.org/10.5194/acp-9-8697-2009, 2009. a
Quaas, J., Stevens, B., Stier, P., and Lohmann, U.: Interpreting the cloud cover – aerosol optical depth relationship found in satellite data using a general circulation model, Atmos. Chem. Phys., 10, 6129–6135, https://doi.org/10.5194/acp-10-6129-2010, 2010. a, b
Sato, Y., Goto, D., Michibata, T., Suzuki, K., Takemura, T., Tomita, H., and Nakajima, T.: Aerosol effects on cloud water amounts were successfully simulated by a global cloud-system resolving model, Nat. Commun., 9, 985, https://doi.org/10.1038/s41467-018-03379-6, 2018. a, b, c, d
Seifert, P., Kunz, C., Baars, H., Ansmann, A., Bühl, J., Senf, F., Engelmann, R., Althausen, D., and Artaxo, P.: Seasonal variability of heterogeneous ice formation in stratiform clouds over the Amazon Basin, Geophys. Res. Lett., 42, 5587–5593, https://doi.org/10.1002/2015GL064068, 2015. a
Sekiguchi, M., Nakajima, T., Suzuki, K., Kawamoto, K., Higurashi, A., Rosenfeld, D., Sano, I., and Mukai, S.: A study of the direct and indirect effects of aerosols using global satellite data sets of aerosol and cloud parameters, J. Geophys. Res., 108, 4699, https://doi.org/10.1029/2002JD003359, 2003. a
Small, J. D., Chuang, P. Y., Feingold, G., and Jiang, H.: Can aerosol decrease cloud lifetime?, Geophys. Res. Lett., 36, L16806,, https://doi.org/10.1029/2009GL038888, 2009. a, b, c
Sourdeval, O., C.-Labonnote, L., Baran, A. J., Mülmenstädt, J., and Brogniez, G.: A methodology for simultaneous retrieval of ice and liquid water cloud properties – Part 2: Near-global retrievals and evaluation against A-Train products, Q. J. Roy. Meteor. Soc., 142, 3063–3081, https://doi.org/10.1002/qj.2889, 2016. a
Stevens, B., Fiedler, S., Kinne, S., Peters, K., Rast, S., Müsse, J., Smith, S. J., and Mauritsen, T.: MACv2-SP: a parameterization of anthropogenic aerosol optical properties and an associated Twomey effect for use in CMIP6, Geosci. Model Dev., 10, 433–452, https://doi.org/10.5194/gmd-10-433-2017, 2017. a
Stevens, B., Fiedler, S., Kinne, S., Peters, K., Rast, S., Müsse, J., Smith, S. J., and Mauritsen, T.: MACv2-SP: a parameterization of anthropogenic aerosol optical properties and an associated Twomey effect for use in CMIP6, Geosci. Model Dev., 10, 433–452, https://doi.org/10.5194/gmd-10-433-2017, 2017. a
Suzuki, K., Stephens, G. L., and Lebsock, M. D.: Aerosol effect on the warm rain formation process: Satellite observations and modeling, J. Geophys. Res., 118, 170–184, https://doi.org/10.1002/jgrd.50043, 2013. a
Toll, V., Christensen, M., Gassó, S., and Bellouin, N.: Volcano and Ship Tracks Indicate Excessive Aerosol-Induced Cloud Water Increases in a Climate Model, Geophys. Res. Lett., 44, 12,492–12,500, https://doi.org/10.1002/2017GL075280, 2017. a, b, c, d
Twomey, S.: Pollution and the planetary albedo, Atmos. Environ., 8, 1251–1256, https://doi.org/10.1016/0004-6981(74)90004-3, 1974. a, b
Várnai, T. and Marshak, A.: MODIS observations of enhanced clear sky reflectance near clouds, Geophys. Res. Lett., 36, L6807, https://doi.org/10.1029/2008GL037089, 2009. a
Wang, M., Ghan, S., Liu, X., L'Ecuyer, T. S., Zhang, K., Morrison, H., Ovchinnikov, M., Easter, R., Marchand, R., Chand, D., Qian, Y., and Penner, J. E.: Constraining cloud lifetime effects of aerosols using A-Train satellite observations, Geophys. Res. Lett., 39, L15709, https://doi.org/10.1029/2012GL052204, 2012. a
Wang, S., Wang, Q., and Feingold, G.: Turbulence, Condensation, and Liquid Water Transport in Numerically Simulated Nonprecipitating Stratocumulus Clouds, J. Atmos. Sci., 60, 262–278, https://doi.org/10.1175/1520-0469(2003)060<0262:TCALWT>2.0.CO;2, 2003. a, b
Warner, J.: The Microstructure of Cumulus Cloud: Part IV. The Effect on the Droplet Spectrum of Mixing Between Cloud and Environment, J. Atmos. Sci., 30, 256–261, https://doi.org/10.1175/1520-0469(1973)030<0256:TMOCCP>2.0.CO;2, 1973. a
Wentz, F. and Meissner, T.: AMSR-E/Aqua L2B Global Swath Ocean Products derived from Wentz Algorithm, Version 2.6, https://doi.org/10.5067/AMSR-E/AE_OCEAN.002, 2004. a
Wielicki, B. A., Barkstrom, B. R., Harrison, E. F., Lee, R. B., Louis Smith, G., and Cooper, J. E.: Clouds and the Earth's Radiant Energy System (CERES): An Earth Observing System Experiment, B. Am. Meteorol. Soc., 77, 853–868, https://doi.org/10.1175/1520-0477(1996)077<0853:CATERE>2.0.CO;2, 1996. a
Szczodrak, M., Austin, P. H., and Krummel, P. B.: Variability of Optical Depth and Effective Radius in Marine Stratocumulus Clouds, J. Atmos. Sci., 58, 2912–2926, https://doi.org/10.1175/1520-0469(2001)058<2912:VOODAE>2.0.CO;2, 2001. a
Xue, H. and Feingold, G.: Large-Eddy Simulations of Trade Wind Cumuli: Investigation of Aerosol Indirect Effects, J. Atmos. Sci., 63, 1605–1622, https://doi.org/10.1175/JAS3706.1, 2006. a, b, c
Xue, H., Feingold, G., and Stevens, B.: Aerosol Effects on Clouds, Precipitation, and the Organization of Shallow Cumulus Convection, J. Atmos. Sci., 65, 392–406, https://doi.org/10.1175/2007JAS2428.1, 2008. a, b, c, d, e, f, g
Yuan, T., Remer, L. A., and Yu, H.: Microphysical, macrophysical and radiative signatures of volcanic aerosols in trade wind cumulus observed by the A-Train, Atmos. Chem. Phys., 11, 7119–7132, https://doi.org/10.5194/acp-11-7119-2011, 2011. a, b
Yum, S. S., Wang, J., Liu, Y., Senum, G., Springston, S., McGraw, R., and Yeom, J. M.: Cloud microphysical relationships and their implication on entrainment and mixing mechanism for the stratocumulus clouds measured during the VOCALS project, J. Geophys. Res., 120, 5047–5069, https://doi.org/10.1002/2014JD022802, 2015. a, b
Zelinka, M. D., Andrews, T., Forster, P. M., and Taylor, K. E.: Quantifying components of aerosol-cloud-radiation interactions in climate models, J. Geophys. Res., 119, 7599–7615, https://doi.org/10.1002/2014JD021710, 2014. a
Zhang, L., Zhao, T., Gong, S., Kong, S., Tang, L., Liu, D., Wang, Y., Jin, L., Shan, Y., Tan, C., Zhang, Y., and Guo, X.: Updated emission inventories of power plants in simulating air quality during haze periods over East China, Atmos. Chem. Phys., 18, 2065–2079, https://doi.org/10.5194/acp-18-2065-2018, 2018. a
Zhang, Z. and Platnick, S.: An assessment of differences between cloud effective particle radius retrievals for marine water clouds from three MODIS spectral bands, J. Geophys. Res., 116, D20215, https://doi.org/10.1029/2011JD016216, 2011. a, b
- Abstract
- Introduction
- Isolating an aerosol effect
- Methods
- The Nd–LWP relationship
- Feedbacks and additional confounders
- The implied ERFaci
- Discussion
- Conclusions
- Data availability
- Appendix A: Expected sensitivities
- Author contributions
- Competing interests
- Acknowledgements
- Review statement
- References
- Supplement