the Creative Commons Attribution 4.0 License.
the Creative Commons Attribution 4.0 License.
 | 17 Apr 2019
Statistical climatology of mid-latitude mesospheric summer echoes characterised by OSWIN (Ostsee-Wind) radar observations
Dimitry Pokhotelov
Gunter Stober
Jorge Luis Chau
Mid-latitude mesospheric summer echoes (MSEs) appear in radar observations during summer months. The geophysical factors controlling the formation of MSEs include solar and energetic particle ionisation, neutral temperature, turbulence, and meridional transport. A total of 12 years of summer months observations with the OSWIN (Ostsee-Wind) radar in Kühlungsborn, Germany, have been analysed to detect MSE events and to analyse statistical connections to these controlling factors. A more sensitive and consistent method for deriving signal-to-noise ratio has been utilised. Daily and monthly composite analysis demonstrates strong daytime preference and early summer seasonal preference for MSEs. The statistical results are not entirely conclusive due to the low-occurrence rates of MSEs. Nevertheless, it is demonstrated that the meridional transport from colder high-latitude summer mesosphere is the important controlling factor, while no clear connection to geomagnetic and solar activity is found.


Mesospheric echoes are strong radar echoes observed by very high frequency (VHF) radars within the ionospheric D region at the altitudes of 80–90 km. While mesospheric echoes are observed at various latitudes from polar regions to the Equator, this study specifically focuses on the summer observations over the northern mid-latitude region; thus the term MSE refers here to the mid-latitude mesospheric summer echoes only. When observed at polar latitudes, the summer mesospheric echoes are typically referred as polar mesospheric summer echoes (PMSEs). The first observations of mid-latitude mesospheric summer echoes have been reported near Göttingen, Germany (Czechowsky et al., 1979; Reid et al., 1989). Since that, comprehensive studies of (P)MSEs were conducted using various radar systems (Ecklund and Balsley, 1981; Thomas et al., 1992; Bremer et al., 2006; Morris et al., 2007; Latteck and Bremer, 2017). Simultaneous observations of (P)MSEs with radars, and noctilucent clouds (NLCs) with lidars (Nussbaumer et al., 1996; Thomas et al., 1996; Gerding et al., 2018) revealed that (P)MSEs and NLCs are closely related phenomena linked to ice particles formed in the cold summer mesosphere. The current understanding of physical mechanisms leading to the formation of (P)MSEs is summarised in the review by Rapp and Lübken (2004).
Under sufficiently low temperatures, when ice particles are formed, enhanced levels of ionisation are needed to produce (P)MSEs. Consequently, (P)MSEs appear during summer months in the cold upper mesosphere, and primarily under daylight conditions. D-region ionisation could be enhanced by geomagnetic activity and resulting particle precipitation, suggesting connections to geomagnetic indices and solar energy flux. Meridional transport could bring colder air from the polar mesosphere to the mid-latitudes, as well as to advect the existing PMSEs to mid-latitudes, suggesting connections to meridional mean winds and/or planetary waves.
Long-term VHF radar observations of PMSEs at polar latitudes in Andøya, Norway (Bremer et al., 2009; Latteck and Bremer, 2017), indicated dependence on geomagnetic activity, showing a pronounced positive correlation between the planetary activity index (Ap) and the occurrence of PMSEs. A weaker correlation between the solar radiation flux and the occurrence of PMSEs was also reported (Latteck and Bremer, 2017). VHF radar observations of MSEs at mid-latitudes in Kühlungsborn, Germany (Latteck et al., 1999; Zecha et al., 2003; Zeller and Bremer, 2009; Zeller et al., 2009), demonstrated similar summertime and daytime preferences for mesospheric echoes. Similarly to PMSE, a dependence on global geomagnetic activity (Ap index) was found, as well as a weaker dependence on solar energy flux. However, the occurrence rates of MSEs appear substantially lower compared to PMSEs, with maximum occurrence rates in summer months reaching ∼90 % and 30 % for PMSEs and MSEs, respectively. It has to be noted that earlier statistical studies of MSEs used relatively short datasets (less than one 11-year solar cycle), which in combination with low-occurrence rate of MSEs results in poor statistics.
The purpose of this paper is to investigate long-term (12 years) observations of MSEs by OSWIN (Ostsee Wind radar) located in Kühlungsborn, Germany (54∘ N, 12∘ E), in order to study statistical dependencies of geomagnetic and solar activity, seasonal and diurnal variabilities of MSEs, and dependencies on meridional transport. Since the OSWIN radar has undergone substantial hardware modifications during the observation period, a new method of absolute calibration, based on the cosmic noise intensity, has been applied throughout the OSWIN radar dataset. In addition to the global geomagnetic index, we also considered dependencies on the auroral electrojet index and solar wind speed, which arguably provide better proxies for auroral and relativistic particle precipitation, respectively. In order to study the dependence on meridional transport, wind data from a specular meteor radar are used. We investigate which factors, besides solar irradiance, play significant roles in controlling the occurrence of MSEs.
OSWIN is the phased array VHF (53.5 MHz) radar in Kühlungsborn operated during summer months primarily to study MSEs. The dataset analysed here covers years 2004–2013 (with year 2009 missing) and years 2015–2017. In year 2014, the radar was not operational and the antenna array was substantially reconfigured. The technical specifications of both original and reconfigured OSWIN systems are given in Gerding et al. (2018). For the purposes of the current analysis only the vertical radar beam (of 6∘ beam width) has been used. OSWIN runs in synchronised operation with the nearby meteor radar receive-only station in Kühlungsborn.
The OSWIN raw data were processed by fitting a truncated Gaussian function to each spectrum obtained from the measured raw voltages (Kudeki et al., 1999; Sheth et al., 2006; Chau and Kudeki, 2006; Stober et al., 2018). Before the data fitting, 32 coherent and 8 incoherent integrations were used. The resulting spectra contained 256 points. Similar to Stober et al. (2018), we also removed potential meteor detections including specular meteors, as well as head echoes.
The MSE detection is based on a global sky noise estimate derived from all range gates between 50 and 120 km altitude where the truncated Gaussian fitting resulted in a signal-to-noise ratio (SNR) dB for each record. The global sky noise estimate allows the definition of a new SNR value for each record, which is then used further on to detect potential MSE events.
The available dataset has been processed to obtain hourly values of SNR only for summer months (June–August). The detection of MSE is defined when the observed hourly value of SNR exceeds the SNR threshold. Note that the definition of SNR used in this study differs from the definition of SNR used in Gerding et al. (2018) and in earlier MSE studies with OSWIN (Bremer et al., 2006; Zeller et al., 2009). In the current analysis, once the hourly SNR value exceeds the threshold, the maximum SNR value in a vertical column between altitudes of 75 and 93 km is considered as the SNR of the detected MSE. The altitude of the maximum SNR value is considered as the height of the detected echo.
OSWIN radar does not provide continuous wind measurements. Meridional wind data for this study have been obtained from the VHF meteor radar located in Juliusruh, Germany (54∘ N, 13∘ E). While the meteor radar is not co-located with OSWIN, the zonal distance of 120 km is within the field of view of the meteor radar. The meteor radar provides hourly averaged wind values in the range of altitude between about 75 and 110 km using backscatter from meteor ionisation trails (e.g. Stober et al., 2017). For the statistical study, the meridional wind values are taken at the altitude closest to the height of the detected MSE. The statistical uncertainties in the meridional winds range from 1 to 5 m s−1 (Stober et al., 2017), with the largest uncertainties at the upper and lower edges of the meteor layer.
To analyse the effects of geomagnetic activity, the planetary 3 h range index (Kp) is used to characterise the global geomagnetic activity, and the auroral electrojet (AE) index is used to characterise the geomagnetic substorm-related activity such as auroral particle precipitation and ionospheric Joule heating. The solar wind speed (Vsw), measured in situ on a spacecraft upstream from the Earth's magnetosphere (King and Papitashvili, 2005), is used as a proxy for the energetic electron precipitation from the Earth's outer radiation belts. The solar activity is characterised by the solar radio flux at 10.7 cm wavelength (F10.7). For each hour of OSWIN observations, the values of AE, Kp, Vsw, and F10.7 are assigned using the NASA's OMNIWeb database. To avoid a contamination of the statistics by very small counts during extreme events, a threshold of ≥5 MSE detections is used here.
3.1 Daily and monthly occurrences of MSEs
Superposed epoch analysis of the entire OSWIN dataset for each day throughout the summer months has been done with respect to 00:00 UTC time. The total occurrence of MSEs within each UTC hour, computed in percentage with respect to the total hours of observations, is shown in panel (a) of Fig. 1. Panels (b), (c), and (d) of Fig. 1 show occurrences of MSEs during the months of June, July, and August, respectively. As expected, there is a clear daytime preference for MSEs, though there are noticeable occurrences of MSEs during night hours as well.
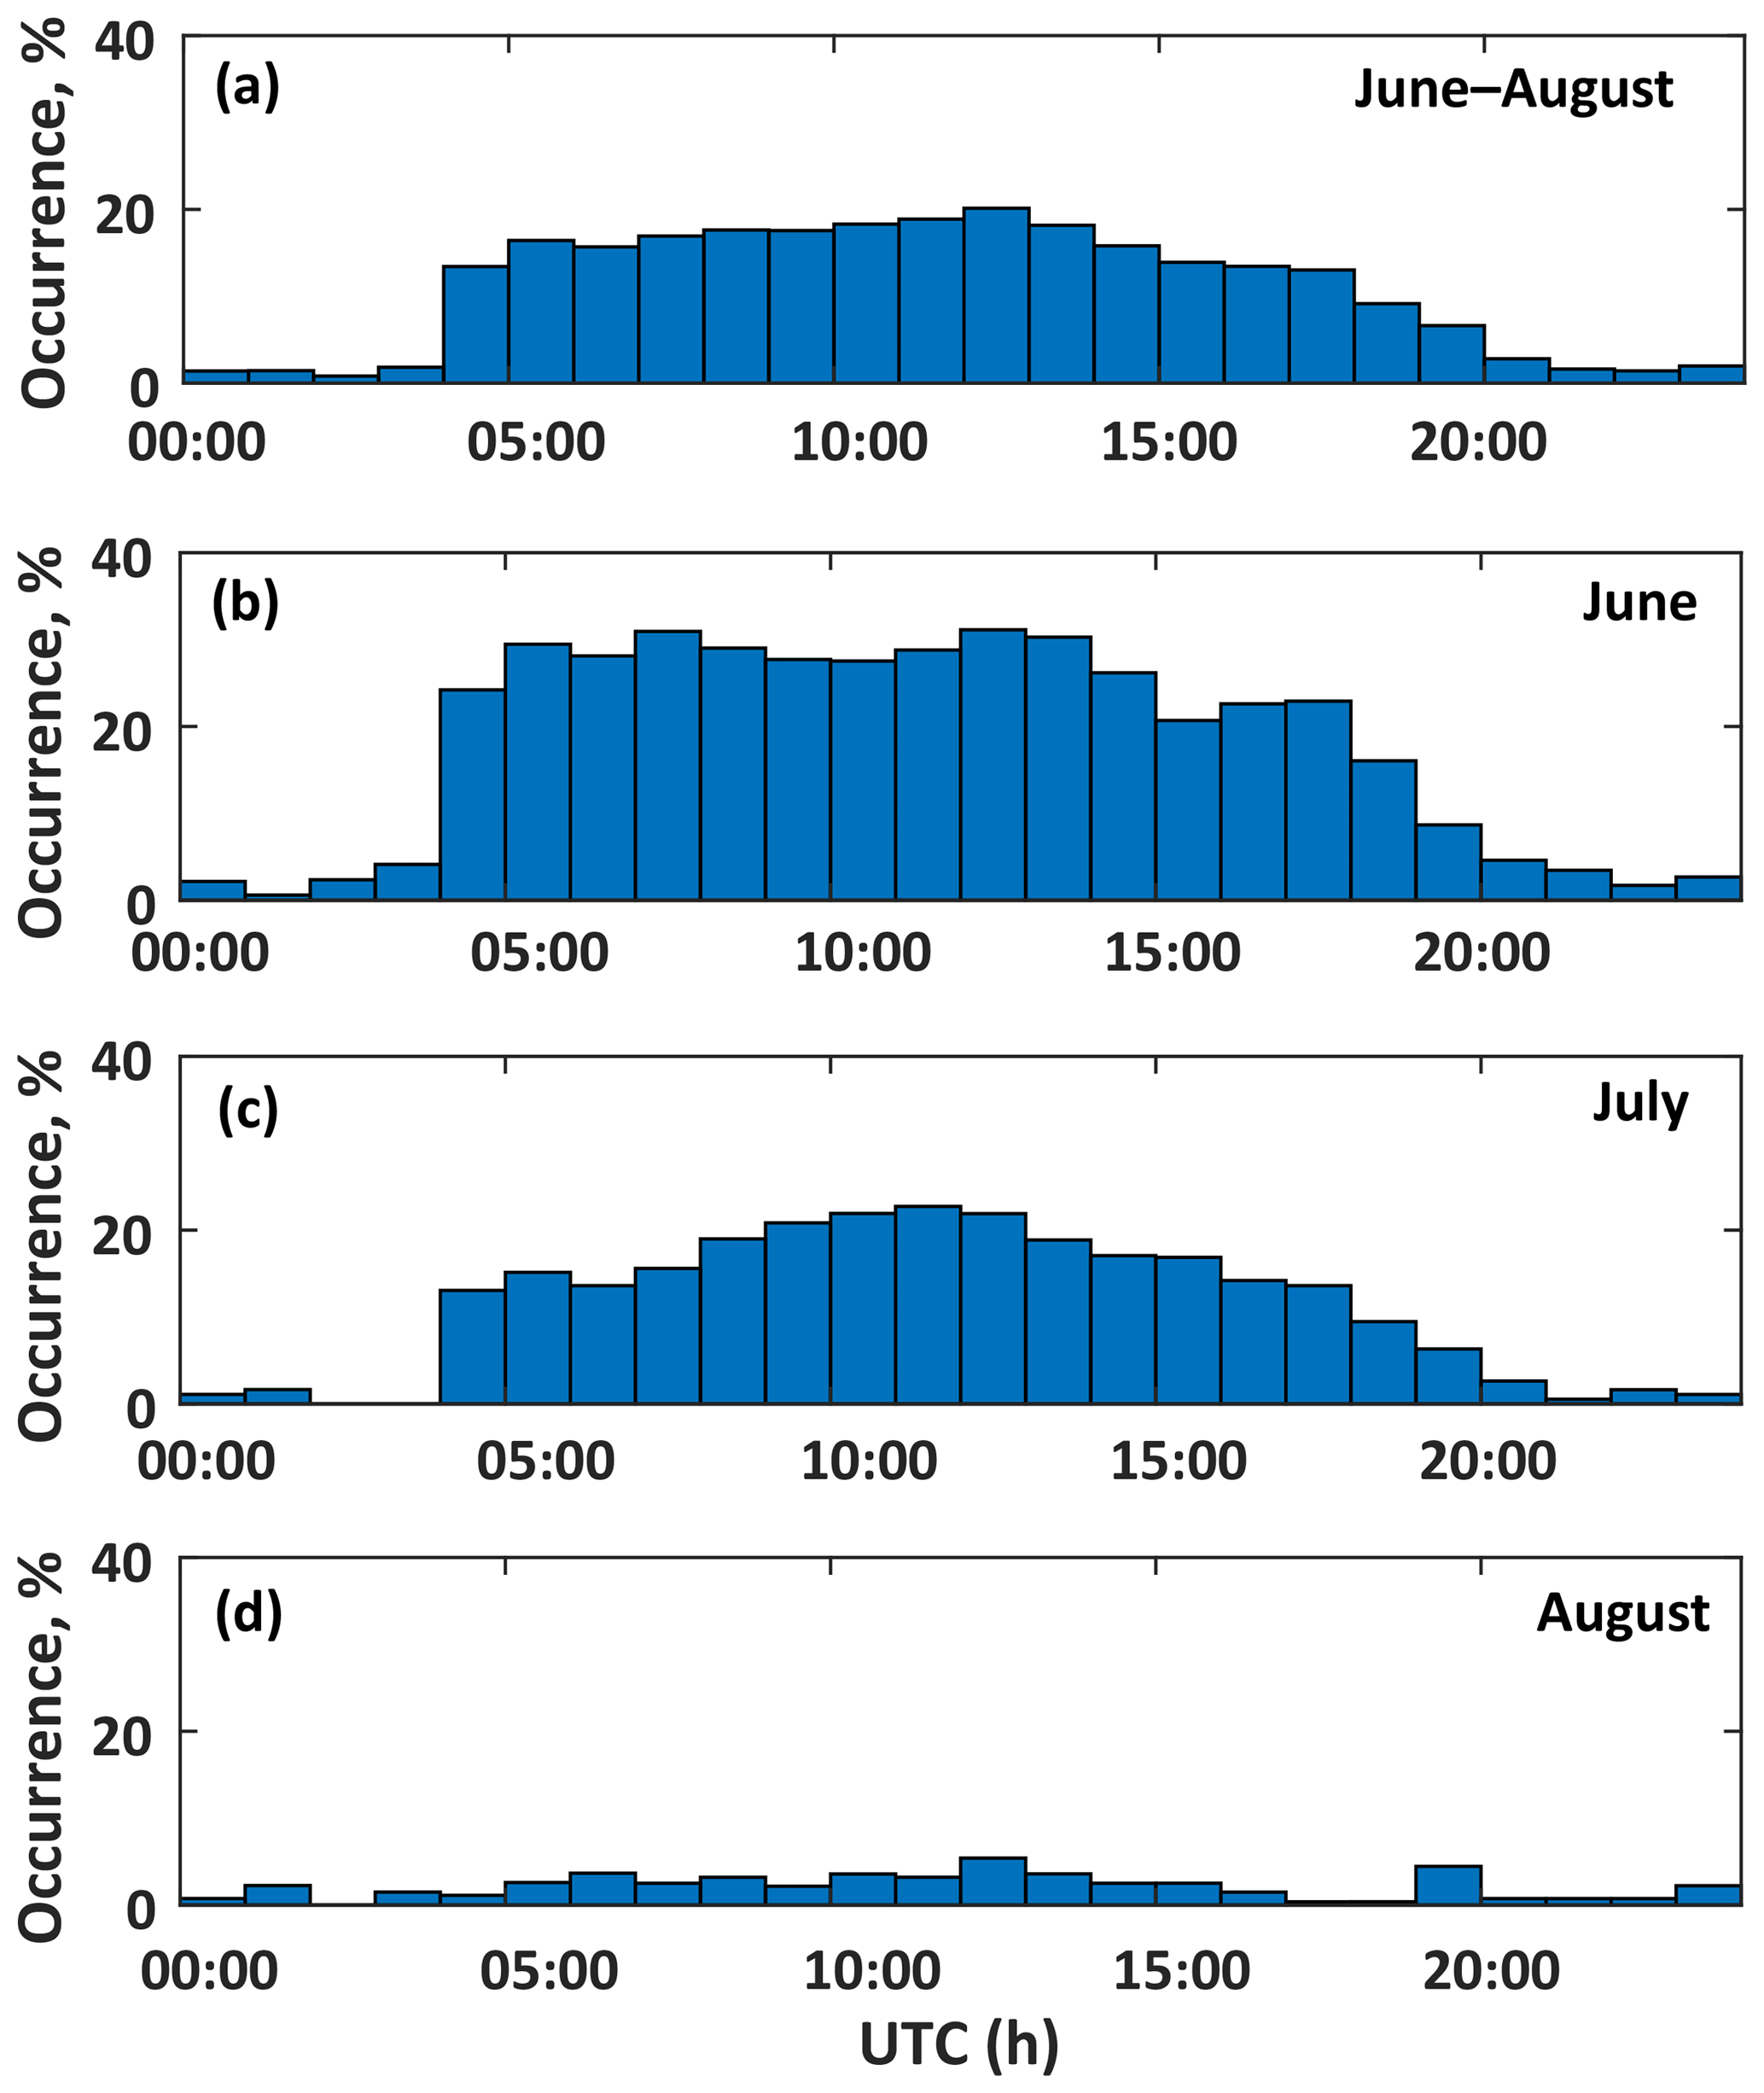
Figure 1The 24 h composites of MSE occurrences (with respect to 00:00 UTC time) for all days of summer (a), and the days of June, July, and August (b, c, and d, respectively).
In terms of monthly distribution, the maximum MSE occurrence is observed during June, with the occurrence diminishing in August. Such a strong MSE preference for early summer, also noticed but unexplained by Bremer et al. (2006), is not seen in long-term observations of PMSEs at polar latitudes (Bremer et al., 2006; Latteck and Bremer, 2017). In addition to the summer solstice conditions, the early summer preference could be attributed, at least in part, to the meridional wind climatology. Figure 2 shows the 10-year climatology of mean meridional winds observed by the Juliusruh meteor radar (extracted using the procedure described by Stober et al., 2017) and indicates that the southward (negative) winds at the relevant altitudes (∼85 km) are strongest in late June to early July (see further discussion in Sect. 3.3). The occurrences of MSEs, as a function of height and UTC, are shown in Fig. 3. The predominant altitude of MSEs of ∼85 km is consistent with the earlier statistical analysis based on 3 years of OSWIN observations (Zecha et al., 2003).
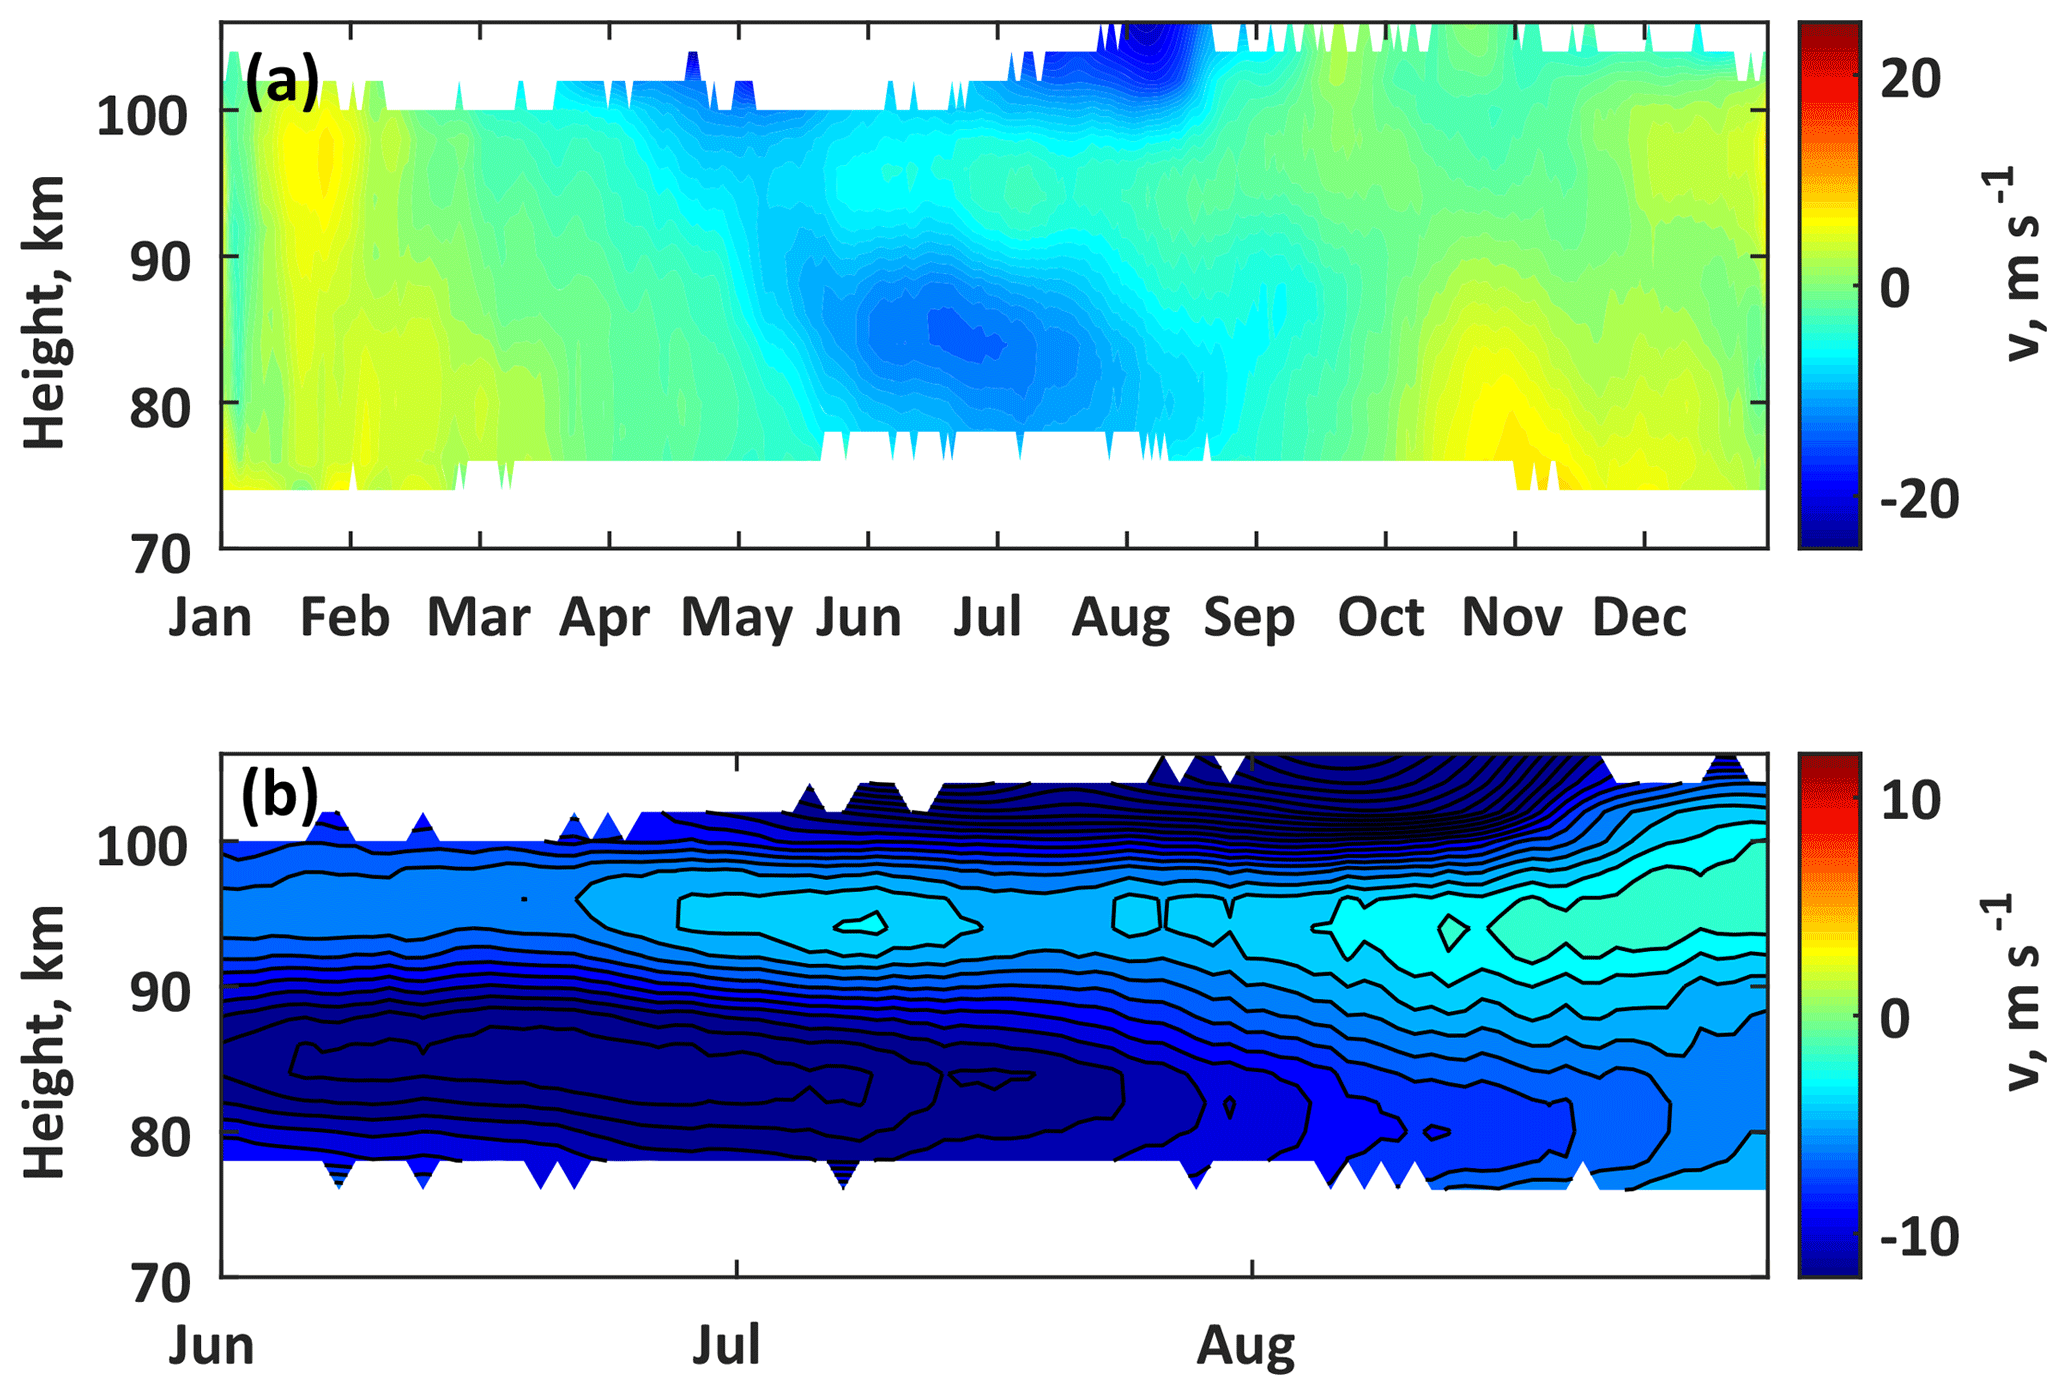
Figure 2Climatology of meridional mean winds obtained from Juliusruh meteor radar observations over years 2007–2016. Panel (a) shows climatology for the entire year; panel (b) shows climatology for summer months only.
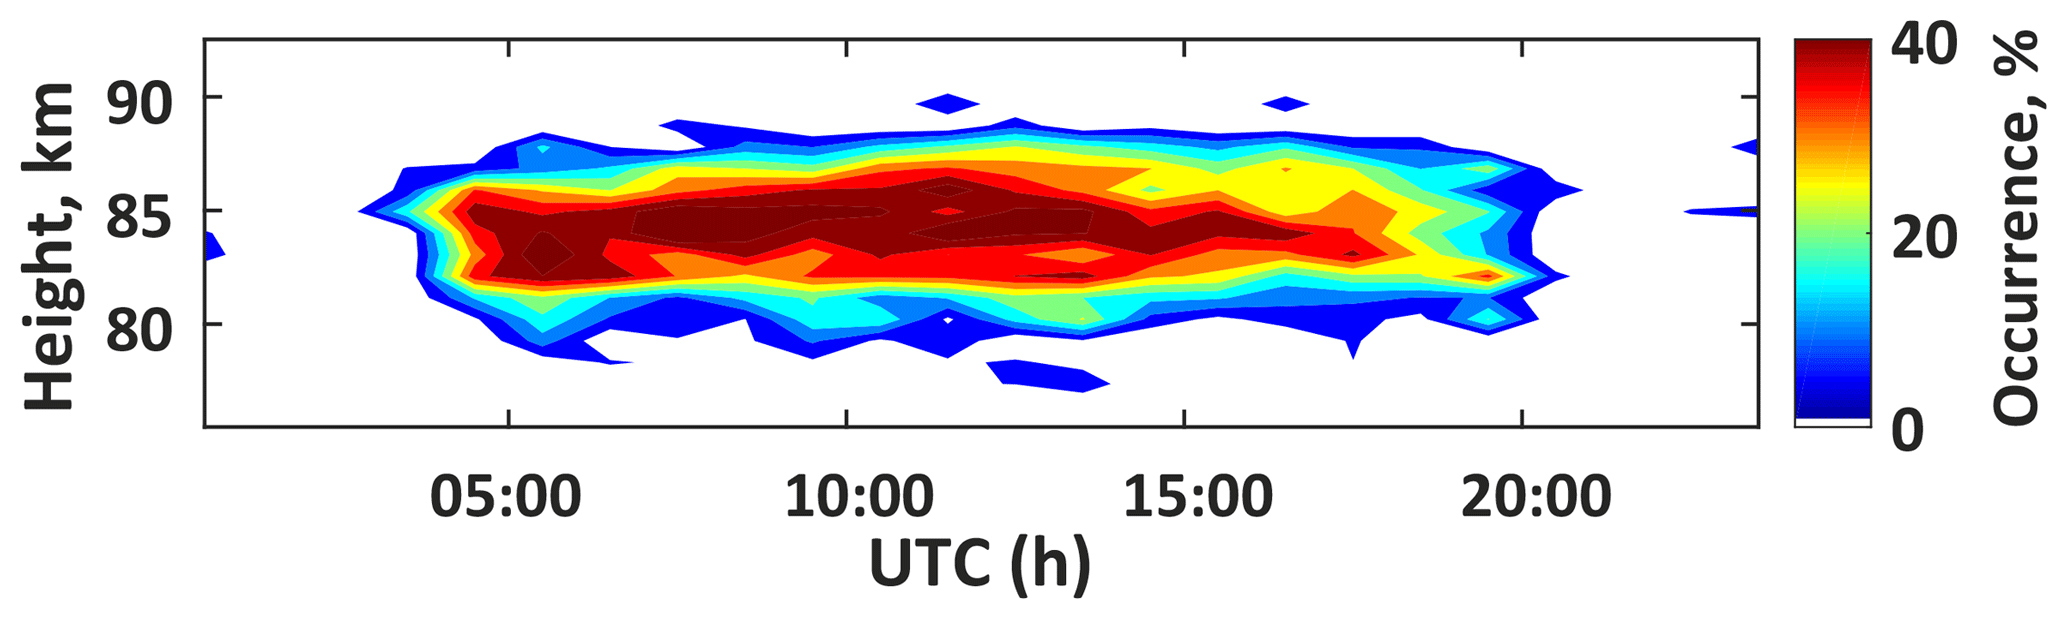
Figure 3The 24 h composites of MSE occurrences as function of UTC time and the height of detected echoes.
Average occurrences of MSEs during each summer month of observations are shown in Fig. 4 for all 12 years of OSWIN observations. While the MSE occurrences are always highest in June, there is noticeable variability from year to year, with some years (especially 2006) having smaller differences in occurrences between June and July. The reason for this variability is not clear, as it could be due to solar cycle effects, year-to-year variability in atmospheric circulation, and/or variable planetary wave activity. It has been suggested earlier that the increased planetary wave activity could play a role in the formation of MSEs by affecting the meridional transport (e.g. Zeller et al., 2009). However, an investigation of this possible connection is beyond the scope of this paper, as it would require a rigorous analysis using global atmospheric circulation models.
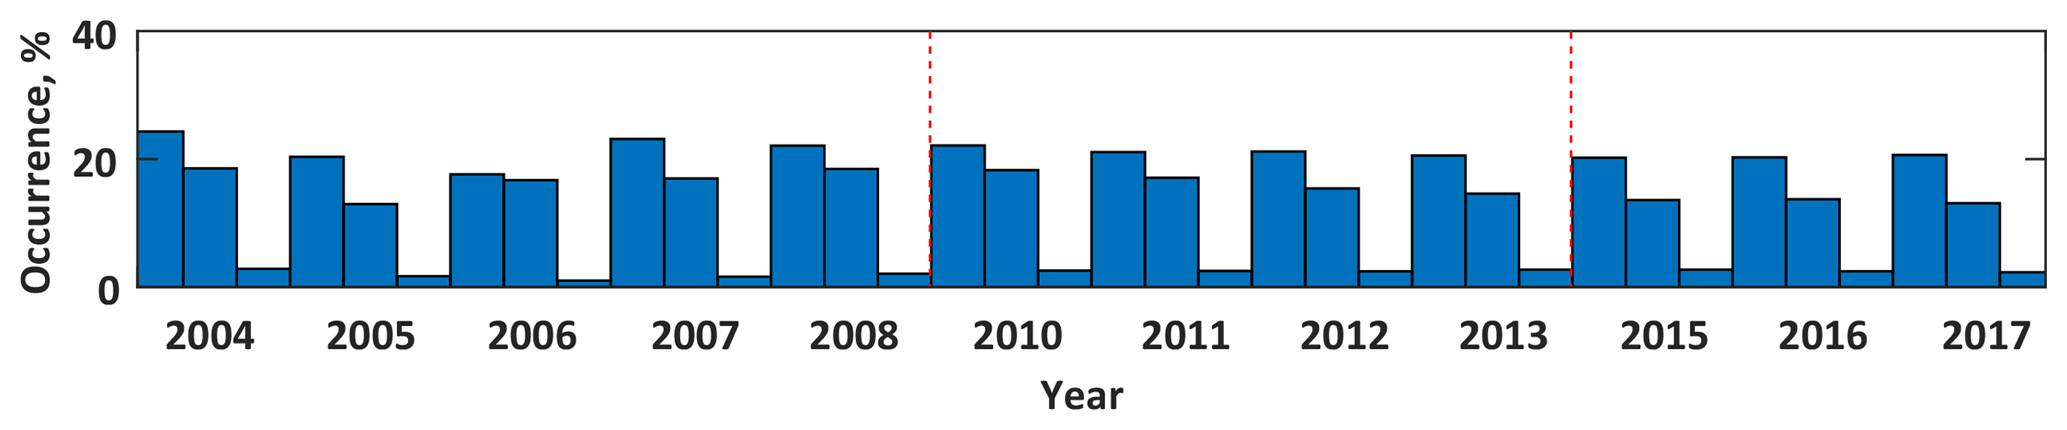
Figure 4Occurrences of MSEs during each month of OSWIN observations. Blue bars show occurrences during June, July, and August of each year, with the maximum occurrence always in June. Red vertical dashed lines indicate the two missing years (2009 and 2014).
3.2 Dependence on geomagnetic and solar activity
Dependencies of MSEs on geomagnetic and solar activity (AE, Kp, Vsw, and F10.7) for the entire OSWIN dataset are illustrated in Fig. 5. In panels (a)–(d) of Fig. 5, the number of counts of MSE observations in a specific bin is shown by red bars, as well as the number of total observation hours divided by a factor of 5 (blue bars). It is clear that the distribution of counts with detected MSEs resembles the distribution of total counts, indicating only weak or no dependence on geomagnetic and solar conditions. The corresponding Pearson correlation coefficients (R2) between MSE occurrences and the values of AE, Kp, Vsw, and F10.7 are 0.11, 0.17, 0.06, and 0.02, respectively. A distribution of MSE occurrences is shown in panels (e)–(h) of Fig. 5. No clear dependence on the solar radio flux is seen, though there is a weak correlation with Kp values (masked by low-count threshold, as discussed below), which is generally consistent with earlier studies (Bremer et al., 2006; Zeller and Bremer, 2009). The relevance of the planetary Kp index for the formation of (P)MSE, suggested in earlier studies (e.g. Bremer et al., 2006), is not obvious as the ionisation of the ionospheric D layer requires high energy of precipitating particles; for example, electrons with energies above 50 keV would be needed to produce substantial ionisation at altitude of ∼85 km (Turunen et al., 2009). While strong geomagnetic storms could produce these energies of precipitation at polar latitudes and sometimes at mid-latitudes, such events are rare and have spring and autumn seasonal preference (e.g. Gonzalez et al., 1994) and thus should have only a marginal impact on the MSE statistics. In this study, the effects of strong storms are manifested by higher occurrences of MSEs at Kp >7, but they do not appear in Fig. 5 due to the low-event count (<5 events). Energetic precipitation (100 keV and above) from the Earth's outer radiation belts is known to be correlated with high-speed solar wind intervals (Mathie and Mann, 2001; Meredith et al., 2011), which are frequent recurring phenomena and not necessarily manifested by high Kp (Tsurutani et al., 2006). Thus, the solar wind speed (Vsw) is expected to be a better proxy for the high-energy precipitation effects. In addition, the auroral electrojet index (AE) could be a good indicator for auroral precipitation (at least at high latitudes), as well as for high-speed solar stream related effects manifested by high-AE intervals (Tsurutani et al., 2006).

Figure 5Dependencies of MSEs on solar and geomagnetic activity, manifested by 10.7 cm solar radio flux F10.7 in solar flux units (a, e), planetary 3 h range index Kp (b, f), auroral electrojet index AE (c, g), and solar wind speed Vsw (d, h). In the top row (a–d), the total counts of OSWIN observation hours are shown by blue bars, and the counts of hours with MSEs detected are shown by red bars (note that the number of total counts is divided by a factor of 5). In the bottom row (e–h), the occurrences of MSEs in each bin of the solar or geomagnetic indices are shown by blue bars, and the red lines indicate the number of counts with MSEs detected. Correlation coefficients between the occurrence of MSEs and solar or geomagnetic indices are shown by blue numbers.
MSE counts and occurrences shown in Fig. 5, panels (c) and (g) respectively, suggest that there is no clear dependence on the AE index. The dependence on the solar wind speed (Fig. 5d and h) is more clear, with higher occurrences of MSEs at Vsw>500 km s−1, i.e. under the solar wind regime dominated by fast solar wind (Bothmer and Daglis, 2007). However, the low values of correlation coefficients indicate overall insignificant dependencies. A weak connection to the geomagnetic activity is likely to be related to (a) low-occurrence rates of MSEs leading to poor statistics, not well representing geomagnetically disturbed periods, and (b) mid-latitudes being too remote to be directly affected by geomagnetic activity, with an exception of energetic particle precipitation from the outer radiation belts (which may also explain relatively stronger correlation with Vsw). Taking (a) and (b) into account, it is advisable to conduct a statistical study using radar observations of PMSEs at high latitudes, following the methodology described here, instead of using only the Kp index as in earlier studies (e.g. Bremer et al., 2006; Latteck and Bremer, 2017).
It needs to be mentioned that the connections between radar-observed mesospheric echoes and D-region electron density enhancements during geomagnetic disturbances remain controversial. While it is generally accepted that (P)MSEs require enhanced levels of ionisation (Rapp and Lübken, 2004), observations during the July 2000 major solar flare event with different radars at polar latitudes (Rapp et al., 2002; Barabash et al., 2004) surprisingly show anti-correlations between the PMSE strength and the D-region electron densities. To explain the controversy, Chau et al. (2014) suggested that an interplay between the Faraday rotation and the D-layer absorption effects could diminish a correlation between the geomagnetic activity and the PMSE strength observed by VHF radars. Clearly this topic requires further studies with different radar systems at polar latitudes, which are beyond the scope of this article.
3.3 Dependence on meridional transport
Dependencies on meridional wind values are illustrated in Fig. 6. The values of meridional winds observed at the altitudes of detected MSEs are binned in the range of ±80 m s−1 (with negative winds directed equatorward). In panels (a)–(d) of Fig. 6, the number of counts of MSE observations in a specific velocity bin is shown (red bars), as well as the number of total observation hours divided by a factor of 5 (blue bars). In panels (e)–(h) of Fig. 6, the occurrences of MSEs are shown in each velocity bin. Assuming possible meridional advection times of 12–24 h, the observed meridional winds averaged over the previous 6, 12, and 24 h are shown in panels (b), (c), and (d) of Fig. 6, respectively. The narrowing of the wind distribution, as the wind averaging interval increases from 6 to 24 h, is likely due to the temporal filtering off of terdiurnal and semidiurnal tidal components. It is clear that the distribution of counts with detected MSEs is shifted towards the negative wind values by 10–15 m s−1, and the occurrence of MSEs is maximal at strongly negative wind values ( m s−1). This indicates the importance of the meridional transport for the formation of MSEs. The corresponding Pearson correlation coefficients between MSE occurrences and the values of meridional winds averaged over previous 1, 6, 12, and 24 h are 0.46, 0.93, 0.93, and 0.95, respectively. It has to be noted that the mean winds are generally southward during summer months, with climatological values of m s−1 (see Fig. 2).
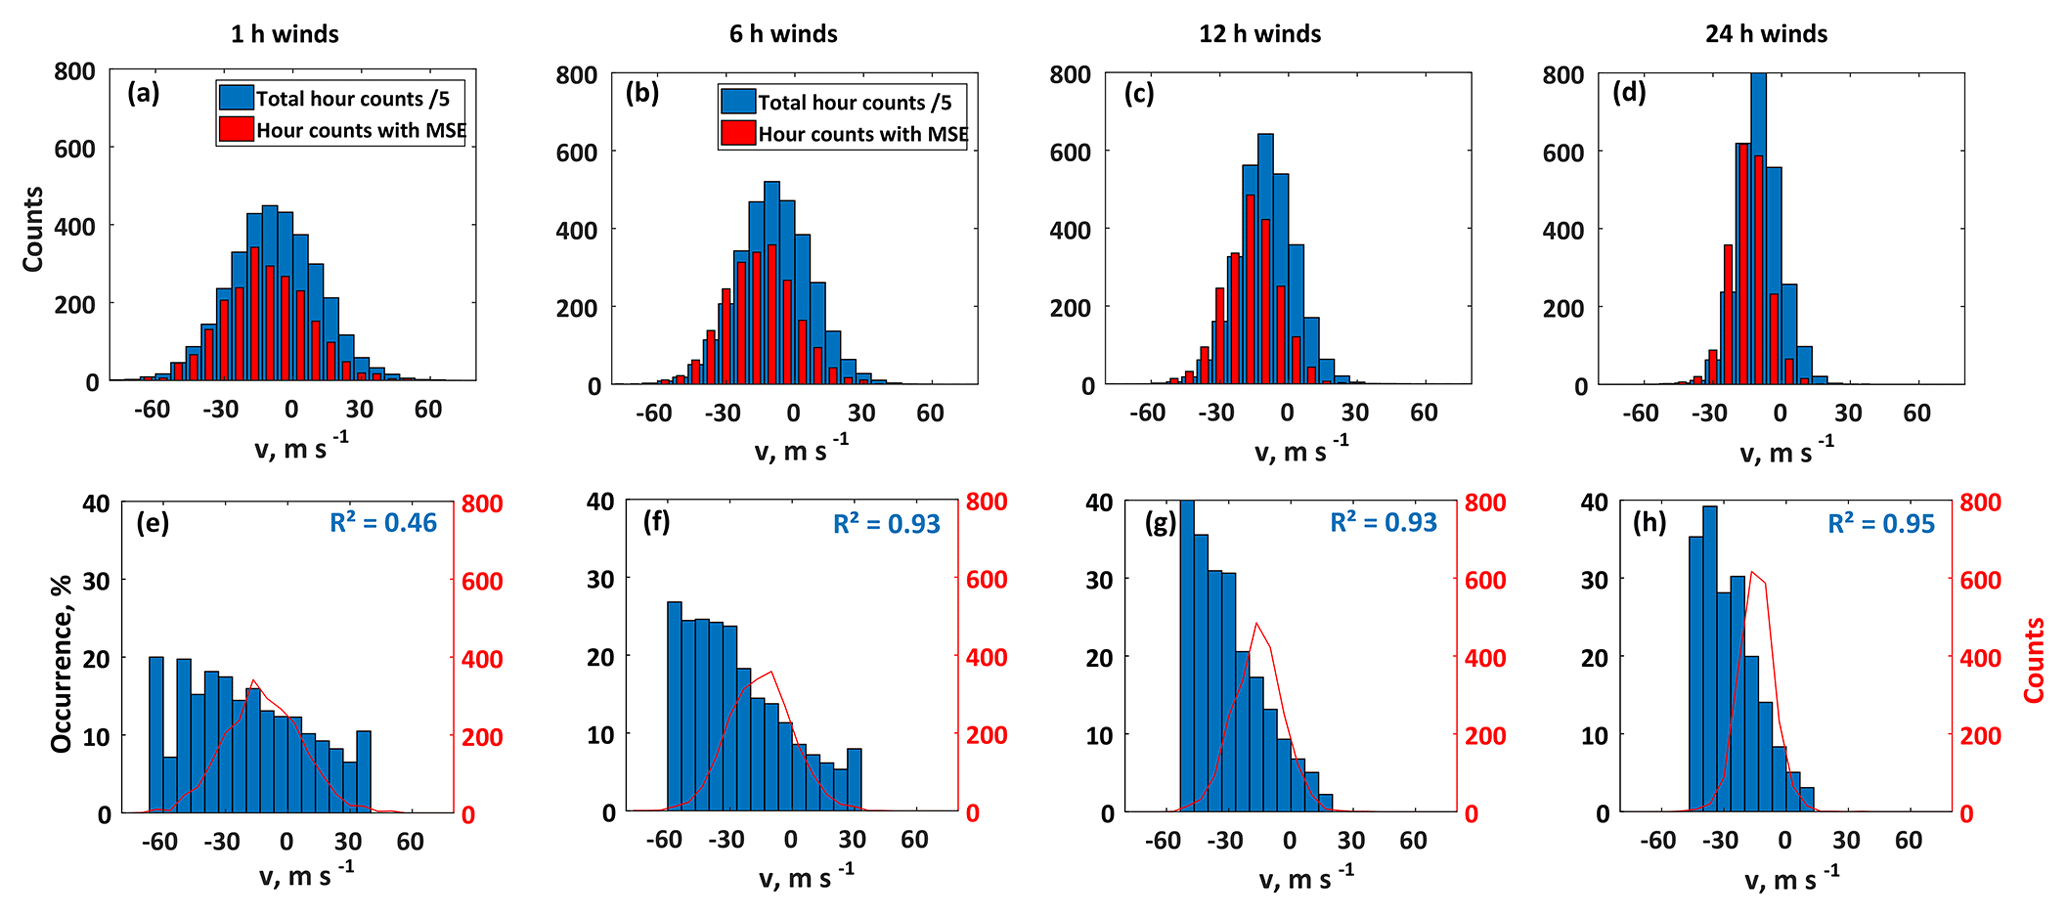
Figure 6Dependencies of MSEs on meridional transport, quantified by the hourly meridional winds obtained by the Juliusruh meteor radar. In the top row (a–d), the total counts of OSWIN observation hours (divided by a factor of 5) are shown by blue bars for each bin of meridional wind speed, and the counts of hours with MSEs detected are shown by red bars. In the bottom row (e–h), the occurrences of MSEs vs. meridional wind are shown by blue bars, and the red lines indicate the number of counts with MSEs detected. Correlation coefficients between the occurrence of MSEs and meridional winds are shown by blue numbers.
The proposed mechanism for the influence of meridional winds involves colder summer mesospheric air being advected southward from polar latitudes, bringing the local temperatures below the freezing point and allowing ice crystals to be formed or sustained, which is necessary for MSEs (Rapp and Lübken, 2004). The formation of MSEs is expected to happen in the course of this advection, with relevant transport times of ∼24 h as illustrated by the analysis of NLC transport (Kiliani et al., 2013). Satellite observations of the mesospheric temperatures, water vapour, and NLCs (Hervig et al., 2016), combined with ground observations in Kühlungsborn, also suggest the temperature and the meridional transport to be the key factors in controlling the NLC occurrence at mid-latitudes. Thus it is reasonable to assume that the meridional advection plays the key role in the formation of MSEs, also contributing to the observed early summer preference for the MSEs.
Twelve years of summertime observations of MSEs with the OSWIN VHF radar have been analysed to study the physical mechanisms responsible for the formation of mesospheric echoes. With the MSE detection procedure based on a global sky noise estimate we were able to analyse the entire dataset with the same sensitivity threshold, though the OSWIN radar has been substantially reconfigured over the time period. The dataset is examined statistically to establish the main factors controlling the MSE occurrence, including time of a day, period of summer, geomagnetic and solar activity, and meridional wind regime. The main conclusions can be summarised as follows:
-
In agreement with earlier studies, the occurrence of MSEs is substantially lower relative to the occurrence of PMSEs reported at polar latitudes. The occurrence of MSEs shows strong daylight preference, though a finite number of MSE events also appears under dark conditions. A more sensitive detection method used in this study facilitates the detections of these night-time echoes. Monthly composite analysis indicates strong preferences of MSEs for early summer months, especially for June, which can be explained by a combination of the summer solstice conditions and the most favourable conditions for the southward meridional transport.
-
No clear connection between the occurrence of MSEs, and solar and geomagnetic indices has been found. In addition to the dependencies on the planetary Kp index, investigated earlier, we investigated the dependence on the auroral electrojet index and solar wind speed. The observed correlations with solar and geomagnetic conditions appear weak and insignificant. The connection to geomagnetic activity remains controversial, and it needs to be investigated further using PMSE observations with different radars at polar latitudes where the occurrences of mesospheric echoes are higher.
-
Clear MSE preferences for stronger southward meridional winds are indicated and are especially pronounced when the meridional winds are averaged over the previous 12–24 h interval, i.e. when the contribution of terdiurnal and semidiurnal (dominant) tides averages out. The suggested explanation is that the colder summer mesospheric air from higher latitudes is effectively transported southwards, with MSEs forming in the process. This interpretation appears consistent with satellite observations of NLC clouds and their environment, and with the previous results of the numerical modelling of NLC cloud transport.
The OSWIN radar data and the Juliusruh meteor radar wind data are available upon request from Gunter Stober (stober@iap-kborn.de). Geomagnetic indices, F10.7 solar flux, and solar wind data were obtained from the NASA's OMNIWeb database (http://omniweb.gsfc.nasa.gov, NASA, 2019).
OSWIN radar raw data and meteor radar raw data were processed by GS. Statistical analysis of radar data and solar and geomagnetic activity data was conducted by DP in consultation with JLC and GS. DP prepared the paper with contributions from all co-authors.
The authors declare that they have no conflict of interest.
This article is part of the special issue “Layered phenomena in the mesopause region (ACP/AMT inter-journal SI)”. It is a result of the LPMR workshop 2017 (LPMR-2017), Kühlungsborn, Germany, 18–22 September 2017.
We acknowledge the IAP technicians for the technical support in operating the
OSWIN radar and the Juliusruh meteor radar.
The publication of this article was
funded by the
Open Access Fund of the Leibniz Association.
This paper was edited by Bernd Funke and reviewed by two anonymous referees.
Barabash, V., Kirkwood, S., Feofilov, A., and Kutepov, A.: Polar mesosphere summer echoes during the July 2000 solar protonevent, Ann. Geophys., 22, 759–771, https://doi.org/10.5194/angeo-22-759-2004, 2004. a
Bothmer, V. and Daglis, I. A.: Space Weather – Physics and Effects, Springer-Verlag, Berlin, 438 pp., ISBN 978-3-540-23907-9, 2007. a
Bremer, J., Hoffmann, P., Höffner, J., Latteck, R., Singer, W., Zecha, M., and Zeller, O.: Long-term changes of mesospheric summer echoes at polar and middle latitudes, Journal of Atmospheric and Solar-Terrestrial Physics, 68, 1940–1951, https://doi.org/10.1016/j.jastp.2006.02.012, 2006. a, b, c, d, e, f, g
Bremer, J., Hoffmann, P., Latteck, R., Singer, W., and Zecha, M.: Long-term changes of (polar) mesosphere summer echoes, Journal of Atmospheric and Solar-Terrestrial Physics, 71, 1571–1576, https://doi.org/10.1016/j.jastp.2009.03.010, 2009. a
Chau, J. L. and Kudeki, E.: First E- and D-region incoherent scatter spectra observed over Jicamarca, Ann. Geophys., 24, 1295–1303, https://doi.org/10.5194/angeo-24-1295-2006, 2006. a
Chau, J. L., Röttger, J., and Rapp, M.: PMSE strength during enhanced D region electron densities: Faraday rotation and absorption effects at VHF frequencies, J. Atmos. So.-Terr. Phys., 118, 113–118, https://doi.org/10.1016/j.jastp.2013.06.015, 2014. a
Czechowsky, P., Ruester, R., and Schmidt, G.: Variations of mesospheric structures in different seasons, Geophys. Res. Lett., 6, 459–462, https://doi.org/10.1029/GL006i006p00459, 1979. a
Ecklund, W. L. and Balsley, B. B.: Long-term observations of the Arctic mesosphere with the MST radar at Poker Flat, Alaska, J. Geophys. Res., 86, 7775–7780, https://doi.org/10.1029/JA086iA09p07775, 1981. a
Gerding, M., Zöllner, J., Zecha, M., Baumgarten, K., Höffner, J., Stober, G., and Lübken, F.-J.: Simultaneous observations of NLCs and MSEs at midlatitudes: implications for formation and advection of ice particles, Atmos. Chem. Phys., 18, 15569–15580, https://doi.org/10.5194/acp-18-15569-2018, 2018. a, b, c
Gonzalez, W. D., Joselyn, J. A., Kamide, Y., Kroehl, H. W., Rostoker, G., Tsurutani, B. T., and Vasyliunas, V. M.: What is a geomagnetic storm?, J. Geophys. Res., 99, 5771–5792, https://doi.org/10.1029/93JA02867, 1994. a
Hervig, M. E., Gerding, M., Stevens, M. H., Stockwell, R., Bailey, S. M., Russell, J. M., and Stober, G.: Mid-latitude mesospheric clouds and their environment from SOFIE observations, J. Atmos. Sol.-Terr. Phys., 149, 1–14, https://doi.org/10.1016/j.jastp.2016.09.004, 2016. a
Kiliani, J., Baumgarten, G., Lübken, F. J., Berger, U., and Hoffmann, P.: Temporal and spatial characteristics of the formation of strong noctilucent clouds, J. Atmos. Sol.-Terr. Phys., 104, 151–166, https://doi.org/10.1016/j.jastp.2013.01.005, 2013. a
King, J. H. and Papitashvili, N. E.: Solar wind spatial scales in and comparisons of hourly Wind and ACE plasma and magnetic field data, J. Geophys. Res., 110, A02104, https://doi.org/10.1029/2004JA010649, 2005. a
Kudeki, E., Bhattacharyya, S., and Woodman, R. F.: A new approach in incoherent scatter F region E × B drift measurements at Jicamarca, J. Geophys. Res., 104, 28145–28162, https://doi.org/10.1029/1998JA900110, 1999. a
Latteck, R. and Bremer, J.: Long-term variations of polar mesospheric summer echoes observed at Andøya (69∘ N), J. Atmos. Sol.-Terr. Phys., 163, 31–37, https://doi.org/10.1016/j.jastp.2017.07.005, 2017. a, b, c, d, e
Latteck, R., Singer, W., and Höffner, J.: Mesosphere summer echoes as observed by VHF radar at Kühlungsborn (54∘ N), Geophys. Res. Lett., 26, 1533–1536, https://doi.org/10.1029/1999GL900225, 1999. a
Mathie, R. A. and Mann, I. R.: On the solar wind control of Pc5 ULF pulsation power at mid-latitudes: Implications for MeV electron acceleration in the outer radiation belt, J. Geophys. Res., 106, 29783–29796, https://doi.org/10.1029/2001JA000002, 2001. a
Meredith, N. P., Horne, R. B., Lam, M. M., Denton, M. H., Borovsky, J. E., and Green, J. C.: Energetic electron precipitation during high-speed solar wind stream driven storms, J. Geophys. Res., 116, A05223, https://doi.org/10.1029/2010JA016293, 2011. a
Morris, R. J., Murphy, D. J., Klekociuk, A. R., and Holdsworth, D. A.: First complete season of PMSE observations above Davis, Antarctica, and their relation to winds and temperatures, Geophys. Res. Lett., 34, L05805, https://doi.org/10.1029/2006GL028641, 2007. a
NASA: OMNIWeb, available at: http://omniweb.gsfc.nasa.gov, last access: 15 April 2019. a
Nussbaumer, V., Fricke, K. H., Langer, M., Singer, W., and von Zahn, U.: First simultaneous and common volume observations of noctilucent clouds and polar mesosphere summer echoes by lidar and radar, J. Geophys. Res., 101, 19161–19168, https://doi.org/10.1029/96JD01213, 1996. a
Rapp, M. and Lübken, F.-J.: Polar mesosphere summer echoes (PMSE): Review of observations and current understanding, Atmos. Chem. Phys., 4, 2601–2633, https://doi.org/10.5194/acp-4-2601-2004, 2004. a, b, c
Rapp, M., Gumbel, J., Lübken, F. J., and Latteck, R.: D region electron number density limits for the existence of polar mesosphere summer echoes, J. Geophys. Res.-Atmos., 107, 4187, https://doi.org/10.1029/2001JD001323, 2002. a
Reid, I. M., Czechowsky, P., Ruester, R., and Schmidt, G.: First VHF radar measurements of mesopause summer echoes at mid-latitudes, Geophys. Res. Lett., 16, 135–138, https://doi.org/10.1029/GL016i002p00135, 1989. a
Sheth, R., Kudeki, E., Lehmacher, G., Sarango, M., Woodman, R., Chau, J., Guo, L., and Reyes, P.: A high-resolution study of mesospheric fine structure with the Jicamarca MST radar, Ann. Geophys., 24, 1281–1293, https://doi.org/10.5194/angeo-24-1281-2006, 2006. a
Stober, G., Matthias, V., Jacobi, C., Wilhelm, S., Höffner, J., and Chau, J. L.: Exceptionally strong summer-like zonal wind reversal in the upper mesosphere during winter 2015/16, Ann. Geophys., 35, 711–720, https://doi.org/10.5194/angeo-35-711-2017, 2017. a, b, c
Stober, G., Sommer, S., Schult, C., Latteck, R., and Chau, J. L.: Observation of Kelvin–Helmholtz instabilities and gravity waves in the summer mesopause above Andenes in Northern Norway, Atmos. Chem. Phys., 18, 6721–6732, https://doi.org/10.5194/acp-18-6721-2018, 2018. a, b
Thomas, L., Astin, I., and Prichard, I. T.: The characteristics of VHF echoes from the summer mesopause region at mid-latitudes, J. Atmos. Terr. Phys., 54, 969–977, https://doi.org/10.1016/0021-9169(92)90063-Q, 1992. a
Thomas, L., Marsh, A. K. P., Wareing, D. P., Astin, I., and Chandra, H.: VHF echoes from the midlatitude mesosphere and the thermal structure observed by lidar, J. Geophys. Res., 101, 12867–12877, https://doi.org/10.1029/96JD00218, 1996. a
Tsurutani, B. T., Gonzalez, W. D., Gonzalez, A. L. C., Guarnieri, F. L., Gopalswamy, N., Grande, M., Kamide, Y., Kasahara, Y., Lu, G., Mann, I., McPherron, R., Soraas, F., and Vasyliunas, V.: Corotating solar wind streams and recurrent geomagnetic activity: A review, J. Geophys. Res., 111, A07S01, https://doi.org/10.1029/2005JA011273, 2006. a, b
Turunen, E., Verronen, P. T., Seppälä, A., Rodger, C. J., Clilverd, M. A., Tamminen, J., Enell, C.-F., and Ulich, T.: Impact of different energies of precipitating particles on NOx generation in the middle and upper atmosphere during geomagnetic storms, J. Atmos. Sol.-Terr. Phys., 71, 1176–1189, https://doi.org/10.1016/j.jastp.2008.07.005, 2009. a
Zecha, M., Bremer, J., Latteck, R., Singer, W., and Hoffmann, P.: Properties of midlatitude mesosphere summer echoes after three seasons of VHF radar observations at 54∘ N, J. Geophys. Res.-Atmos., 108, 8439, https://doi.org/10.1029/2002JD002442, 2003. a, b
Zeller, O. and Bremer, J.: The influence of geomagnetic activity on mesospheric summer echoes in middle and polar latitudes, Ann. Geophys., 27, 831–837, https://doi.org/10.5194/angeo-27-831-2009, 2009. a, b
Zeller, O., Hoffmann, P., Bremer, J., and Singer, W.: Mesosphere summer echoes, temperature, and meridional wind variations at mid- and polar latitudes, J. Atmos. Sol.-Terr. Phys., 71, 931–942, https://doi.org/10.1016/j.jastp.2009.03.013, 2009. a, b, c