the Creative Commons Attribution 4.0 License.
the Creative Commons Attribution 4.0 License.
 | 14 Jan 2019
Impact of mineral dust on shortwave and longwave radiation: evaluation of different vertically resolved parameterizations in 1-D radiative transfer computations
María José Granados-Muñoz
Michael Sicard
Roberto Román
Jose Antonio Benavent-Oltra
Rubén Barragán
Gerard Brogniez
Cyrielle Denjean
Marc Mallet
Paola Formenti
Benjamín Torres
Lucas Alados-Arboledas
Aerosol radiative properties are investigated in southeastern Spain during a dust event on 16–17 June 2013 in the framework of the ChArMEx/ADRIMED (Chemistry-Aerosol Mediterranean Experiment/Aerosol Direct Radiative Impact on the regional climate in the MEDiterranean region) campaign. Particle optical and microphysical properties from ground-based sun/sky photometer and lidar measurements, as well as in situ measurements on board the SAFIRE ATR 42 French research aircraft, are used to create a set of different levels of input parameterizations, which feed the 1-D radiative transfer model (RTM) GAME (Global Atmospheric ModEl). We consider three datasets: (1) a first parameterization based on the retrievals by an advanced aerosol inversion code (GRASP; Generalized Retrieval of Aerosol and Surface Properties) applied to combined photometer and lidar data, (2) a parameterization based on the photometer columnar optical properties and vertically resolved lidar retrievals with the two-component Klett–Fernald algorithm, and (3) a parameterization based on vertically resolved optical and microphysical aerosol properties measured in situ by the aircraft instrumentation. Once retrieved, the outputs of the RTM in terms of both shortwave and longwave radiative fluxes are compared against ground and in situ airborne measurements. In addition, the outputs of the model in terms of the aerosol direct radiative effect are discussed with respect to the different input parameterizations. Results show that calculated atmospheric radiative fluxes differ no more than 7 % from the measured ones. The three parameterization datasets produce a cooling effect due to mineral dust both at the surface and the top of the atmosphere. Aerosol radiative effects with differences of up to 10 W m−2 in the shortwave spectral range (mostly due to differences in the aerosol optical depth) and 2 W m−2 for the longwave spectral range (mainly due to differences in the aerosol optical depth but also to the coarse mode radius used to calculate the radiative properties) are obtained when comparing the three parameterizations. The study reveals the complexity of parameterizing 1-D RTMs as sizing and characterizing the optical properties of mineral dust is challenging. The use of advanced remote sensing data and processing, in combination with closure studies on the optical and microphysical properties from in situ aircraft measurements when available, is recommended.
- Article
(2783 KB) -
Supplement
(222 KB) - BibTeX
- EndNote


The radiative effect by atmospheric aerosol is estimated to produce a net cooling effect of the Earth's climate. However, an accurate quantification of this cooling is extremely difficult. In fact, the aerosol radiative effect (ARE) is affected by large uncertainties. Due to the direct aerosol–radiation interaction, the ARE is estimated to be −0.27 W m−2 on average at the global scale, with an uncertainty range of −0.77 to −0.23 W m−2; whereas the radiative effect related to cloud adjustments due to aerosols is −0.55 W m−2 (−1.33 to −0.06 W m−2; Boucher et al., 2013), which is the largest unknown in the radiative forcing of the atmosphere. The extent to which the ARE uncertainty range reported is due to physical processes or due to the measurement uncertainty itself is still hard to quantify.
In previous studies, the AREs in longwave (LW) spectral range were commonly neglected due to the complexity of an accurate quantification of the optical properties in this spectral range (Roger et al., 2006; Mallet et al., 2008; Sicard et al., 2012). However, the contribution of the LW component to the ARE is nonnegligible for large aerosol particles, i.e., marine aerosol or mineral dust (e.g., Markowicz et al., 2003; Vogelmann et al., 2003; Otto et al., 2007; Perrone and Bergamo, 2011; Sicard et al., 2014a, b; Meloni et al., 2018).
The contribution of mineral dust to the ARE in the infrared spectral range is especially relevant because of its large size and abundance (Meloni et al., 2018). Mineral dust is estimated to be the most abundant aerosol type in the atmosphere by mass (e.g., Ginoux et al., 2012; Choobari et al., 2014), with global emission between 1000 and 3000 Mt yr−1 (Zender et al., 2004; Zender, 2003; Shao et al., 2011). The high temporal and spatial variability in dust concentrations and the variability in their microphysical and optical properties present a significant challenge to our understanding of how these particles impact the environment (Dubovik et al., 2002). Many measurements worldwide have been made using different approaches, including satellites, which can provide global coverage of mineral dust properties. However, the retrievals of particle properties are still affected by large uncertainties (Levy et al., 2013) and the information on mineral dust properties is quite scarce (Formenti et al., 2011).
One of the areas frequently influenced by mineral dust is the Mediterranean Sea region, affected by dust intrusions from the close by Sahara or the Middle East region (Moulin et al., 1998; Israelevich et al., 2012; Gkikas et al., 2013) producing significant perturbations to the shortwave (SW) and the LW radiation balance (di Sarra et al., 2011; Papadimas et al., 2012; Perrone et al., 2012; Meloni et al., 2015) as well as the regional climate (Nabat et al., 2015). The ARE in the Mediterranean region can be responsible for a strong cooling effect both at the surface (or bottom of the atmosphere, BOA) and at the top of the atmosphere (TOA). The so-called forcing efficiency (FE), which is defined as the ratio between the ARE and the aerosol optical depth (AOD) for the SW spectral component ranges between −150 and −160 W m−2 for solar zenith angles (SZAs) in the range 50–60∘ (di Biagio et al., 2009), being able to reach values larger than 200 W m−2 at the BOA during strong dust events in the Mediterranean region (Gómez-Amo et al., 2011). The LW component accounts for an effect of up to 53 % of the SW component and with an opposite sign (di Sarra et al., 2011; Perrone et al., 2012; Meloni et al., 2015).
The Aerosol Direct Radiative Impact on the regional climate in the MEDiterranean region (ADRIMED) field campaign within the Chemistry-Aerosol Mediterranean Experiment (ChArMEx, http://charmex.lsce.ipsl.fr, last access: 25 January 2018) took place in the Mediterranean region from 11 June to 5 July 2013 (Mallet et al., 2016). It aimed at characterizing the different aerosol particles and their radiative effects using airborne and ground-based measurements collected in the Mediterranean Basin, with special focus on the western region. In particular, two ChArMEx/ADRIMED flights, F30 and F31 from the French ATR 42 environmental research aircraft of SAFIRE (http://www.SAFIRE.fr, last access: 25 January 2018), took place above southeastern Spain during a Saharan dust episode on 16 and 17 June 2013.
In this paper, we present an analysis of the mineral dust radiative properties during this particular episode and take advantage of the thorough database that is available. Multiple datasets are used as input in a radiative transfer model (RTM) to evaluate the influence of the different measurements and data processing in the retrieved direct ARE. The model used here is the Global Atmospheric ModEl (GAME; Dubuisson et al., 1996, 2005), which allows for calculating both the solar and thermal infrared fluxes. An evaluation against aircraft in situ measurements of radiative fluxes is also presented.
Two main goals are pursued: (i) the quantification of the direct ARE for two case studies within a dust transport episode and (ii) the evaluation of the model estimate sensitivity to the aerosol input used.
The paper is structured as follows: Sect. 2 includes a description of both the ground-based and in situ aircraft instrumentation and a short description of the retrieval algorithms used for the present study, Sect. 3 is devoted to the description of GAME and the input datasets used here, and results are presented in Sect. 4; finally, a short summary and concluding remarks are included in Sect. 5.
2.1 Ground-based measurements
Ground-based measurements used in this work were carried out at the Andalusian Institute for Earth System Research (IISTA-CEAMA) of the University of Granada, Spain (lat 37.16, long −3.61; 680 m a.s.l.) by the Atmospheric Physics Group of the University of Granada (GFAT-UGR). This experiment site is located in the western Mediterranean basin, near the African continent (∼200 km). Therefore, long-range transport of mineral dust particles from north Africa is a main source of natural atmospheric aerosol in the region (e.g., Lyamani et al., 2005; Valenzuela et al., 2012). The station is also affected by long-range transported smoke (Ortiz-Amezcua et al., 2017) and fresh smoke from nearby biomass burning (Alados-Arboledas et al., 2011). Anthropogenic sources such as pollution from Europe, the Iberian Peninsula, and the Mediterranean Sea (Pérez-Ramírez et al., 2016) also affect the station. Local sources are mainly road traffic and central heating systems (Titos et al., 2017).
IISTA-CEAMA station is equipped with a CE-318-4 (Cimel Electronique) sun/sky photometer, which belongs to the AERONET network (Holben et al., 1998). This instrument performs direct solar irradiance measurements, used to derive AOD, and sky radiance measurements both measured at least at the following nominal wavelengths (λ): 440, 670, 870, and 1020 nm. The AOD product provided by AERONET has uncertainties of ±0.01 for λ>440 nm and of ±0.02 for λ<440 nm (Holben et al., 1998; Eck et al., 1999). AERONET also provides aerosol optical and microphysical properties such as columnar particle size distribution (PSD), real and imaginary parts of the refractive indices (RRI and IRI, respectively), asymmetry factor (g), and single scattering albedo (SSA) using the AOD and sky radiance values in an inversion algorithm (Dubovik and King, 2000; Dubovik et al., 2006). For the present study, AERONET Version 2 Level 1.5 (Level 2.0 when available) data are used. The uncertainty in the retrieval of SSA is ±0.03 for high aerosol load (AOD440>0.4) and SZAs >50∘; while for measurements with low aerosol load (AOD440<0.2), the retrieval accuracy of SSA drops down to 0.02–0.07 (Dubovik and King, 2000). For high aerosol load and SZAs >50∘, errors are about 30 %–50 % for the IRI. For particles in the size range µm (r being the aerosol radius), errors in PSD retrievals are around 10 %–35 %, while for sizes lower than 1 µm and higher than 7 µm retrieval errors rise up to 80 %–100 %. The inversion code provides additional variables such as the volume concentration; effective radius, reff; and geometric standard deviation of the equivalent lognormal distribution, σ, for fine and coarse modes of the retrieved PSD that will be used in the current study.
The multiwavelength aerosol Raman lidar MULHACEN, based on a customized version of LR331D400 (Raymetrics S.A.) is operated at Granada station as part of EARLINET/ACTRIS (European Aerosol Research Lidar Network/Aerosols, Clouds, and Trace Gases Research Infrastructure Network; https://www.actris.eu/default.aspx, last access: 15 June 2018; Pappalardo et al., 2014) since April 2005. The system has a monostatic biaxial configuration, which usually requires an overlap correction to minimize the incomplete overlap effect (Navas-Guzmán et al., 2011). The system emits vertically to the zenith by means of a pulsed Nd:YAG laser, with second- and third-harmonic generators, that emits simultaneously at 1064, 532, and 355 nm. The receiving system consists of several detectors, which can split the radiation according to the three elastic channels at 355, 532 (parallel- and perpendicular-polarized; Bravo-Aranda et al., 2013), and at 1064 nm; two nitrogen Raman channels at 387 and 607 nm; and a water vapor Raman channel at 408 nm (Navas-Guzmán et al., 2014). The aerosol backscatter coefficient profiles (βaer(z,λ), z being the vertical height) obtained from the multiwavelength lidar were calculated with the Klett–Fernald method (Fernald et al., 1972; Fernald, 1984; Klett, 1981, 1985). For the retrieval of the aerosol extinction coefficient profiles (αaer(z,λ)), a height-independent lidar ratio (LR) obtained by forcing the vertical integration of αaer(z,λ) to the AOD from the AERONET photometer (Landulfo et al., 2003) was assumed. The assumption of a constant LRs introduces uncertainty in αaer(z,λ) retrievals, especially when different types of aerosol appear at different layers. In our case, the LR used for the Klett–Fernald retrieval are very similar to those provided by GRASP (see Benavent-Oltra et al., 2017). Considering the different uncertainty sources, total uncertainty in the profiles obtained with the Klett–Fernald method is usually 20 % for βaer(z,λ) and 25 %–30 % for αaer(z,λ) profiles (Franke et al., 2001).
Additionally, surface temperature and pressure are continuously monitored at IISTA-CEAMA by a meteorological station located 2 m above the ground. At the same location, the global and diffuse downward radiative fluxes for the SW component are continuously measured with a CM11 pyranometer (Kipp & Zonen) and diffuse downward radiative fluxes for the LW component are measured with a precision infrared radiometer pyrgeometer (Eppley), both being instruments regularly calibrated at the site (Antón et al., 2012, 2014).
2.2 Airborne measurements
The SAFIRE ATR 42 aircraft performed two overpasses above Granada on 16 (flight F30) and 17 June (flight F31) in 2013 during the ChArMEx/ADRIMED campaign. During F30, the SAFIRE ATR 42 descended performing a spiral trajectory from 14:15 to 14:45 UTC; whereas during flight F31, the aircraft ascended in the early morning (from 07:15 to 07:45 UTC) at around 20 km from Granada station (see Fig. 1 from Benavent-Oltra et al., 2017). Additional flight details can be found in previous studies (Denjean et al., 2016; Mallet et al., 2016; Benavent-Oltra et al., 2017; Román et al., 2018).
The airborne instrumentation includes a scanning mobility particle sizer (SMPS) and an ultra-high sensitivity aerosol spectrometer (UHSAS) for measuring aerosol number size distribution in the submicron range. The forward-scattering spectrometer probe model 300 (FSSP-300) and the GRIMM optical particle counter (sky-OPC 1.129) were used to measure the optical size distributions in the diameter nominal size range between 0.28 and 20 µm and between 0.3 and 32 µm, respectively. A nephelometer (TSI Inc, model 3563) was used to measure the particle scattering coefficient at 450, 550, and 700 nm, and a cavity attenuated phase shift extinction monitor (CAPS-PMex, Aerodyne Inc.) was employed to obtain the aerosol extinction coefficient (αaer) at 530 nm. For more details on the aircraft instrumentation see Denjean et al. (2016) and references therein. The PLASMA (Photomètre Léger Aéroporté pour la Surveillance des Masses d'Air) system, which is an airborne sun-tracking photometer, was additionally used to obtain AOD with wide spectral coverage (15 channels between 0.34 and 2.25 µm) with an accuracy of approximately 0.01, as well as the vertical profiles of the aerosol extinction coefficient (Karol et al., 2013; Torres et al., 2017).
Airborne radiative fluxes (F) were measured with Kipp & Zonen CMP22 pyranometers and CGR4 pyrgeometers. Upward and downward SW fluxes (↑FSW and ↓FSW) were measured in the spectral range 297–3100 nm by two instruments located above and below the aircraft fuselage. The same setup was used for the pyrgeometers, which provided the LW upward and downward radiative fluxes (↑FLW and ↓FLW) for wavelengths larger than 4 µm. Both pyranometers and pyrgeometers were calibrated in January 2013 and data were corrected for the temperature dependence of the radiometer's sensitivity following Saunders et al. (1992).
Radiation measurement data from the aircraft were filtered out for large pitch and roll angles and corrected from the rapid variations in the solar incidence angle around the SZA due to the aircraft attitude (pitch and roll). This correction also depends on aircraft heading angle and solar position. It should be noted that, beforehand, roll and pitch offsets must be determined (the axis sensor is not necessarily vertical on average during a horizontal leg). Cosine errors were taken into account. Finally, data were corrected from variations in the SZA during the flight to ease the comparison with GAME retrievals. After these various corrections, an estimated uncertainty of ±5 W m−2 is considered to affect the data, taking into account the accuracy of the calibration and the acquisition system together with the consistency of airborne measurements (Meloni et al., 2018).
2.3 The GRASP code
The GRASP (Generalized Retrieval of Aerosol and Surface Properties) code (Dubovik et al., 2011, 2014) provides aerosol optical and microphysical properties in the atmosphere by combining the information from a variety of remote sensors (e.g., Kokhanovsky et al., 2015; Espinosa et al., 2017; Torres et al., 2017; Román et al., 2017, 2018; Chen et al., 2018). In our case, GRASP was used to invert simultaneously coincident lidar data (range-corrected signal, RCS, at 355, 532, and 1064 nm) and sun/sky photometer measurements (AOD and sky radiances both from AERONET at 440, 675, 870, and 1020 nm) providing a detailed characterization of the aerosol properties, both column-integrated and vertically resolved. It is worthy to note that this GRASP scheme, based on Lopatin et al. (2013), presents the main advantage that it allows for retrieving aerosol optical and microphysical properties for two distinct aerosol modes, namely fine and coarse. The αaer, βaer, SSA (all at 355, 440, 532, 675, 870, 1020, and 1064 nm), and aerosol volume concentration (VC) profiles obtained as output from GRASP will be used as input to GAME in the present study, together with the column-integrated PSD properties (namely reff and σ for fine and coarse modes). A more in-depth analysis of GRASP output data retrieved using the lidar and sun/sky photometer data at Granada station for the two inversions coinciding with the aircraft overpasses during flights F30 and F31 during ChArMEx/ADRIMED campaign can be found in Benavent-Oltra et al. (2017).
3.1 GAME description
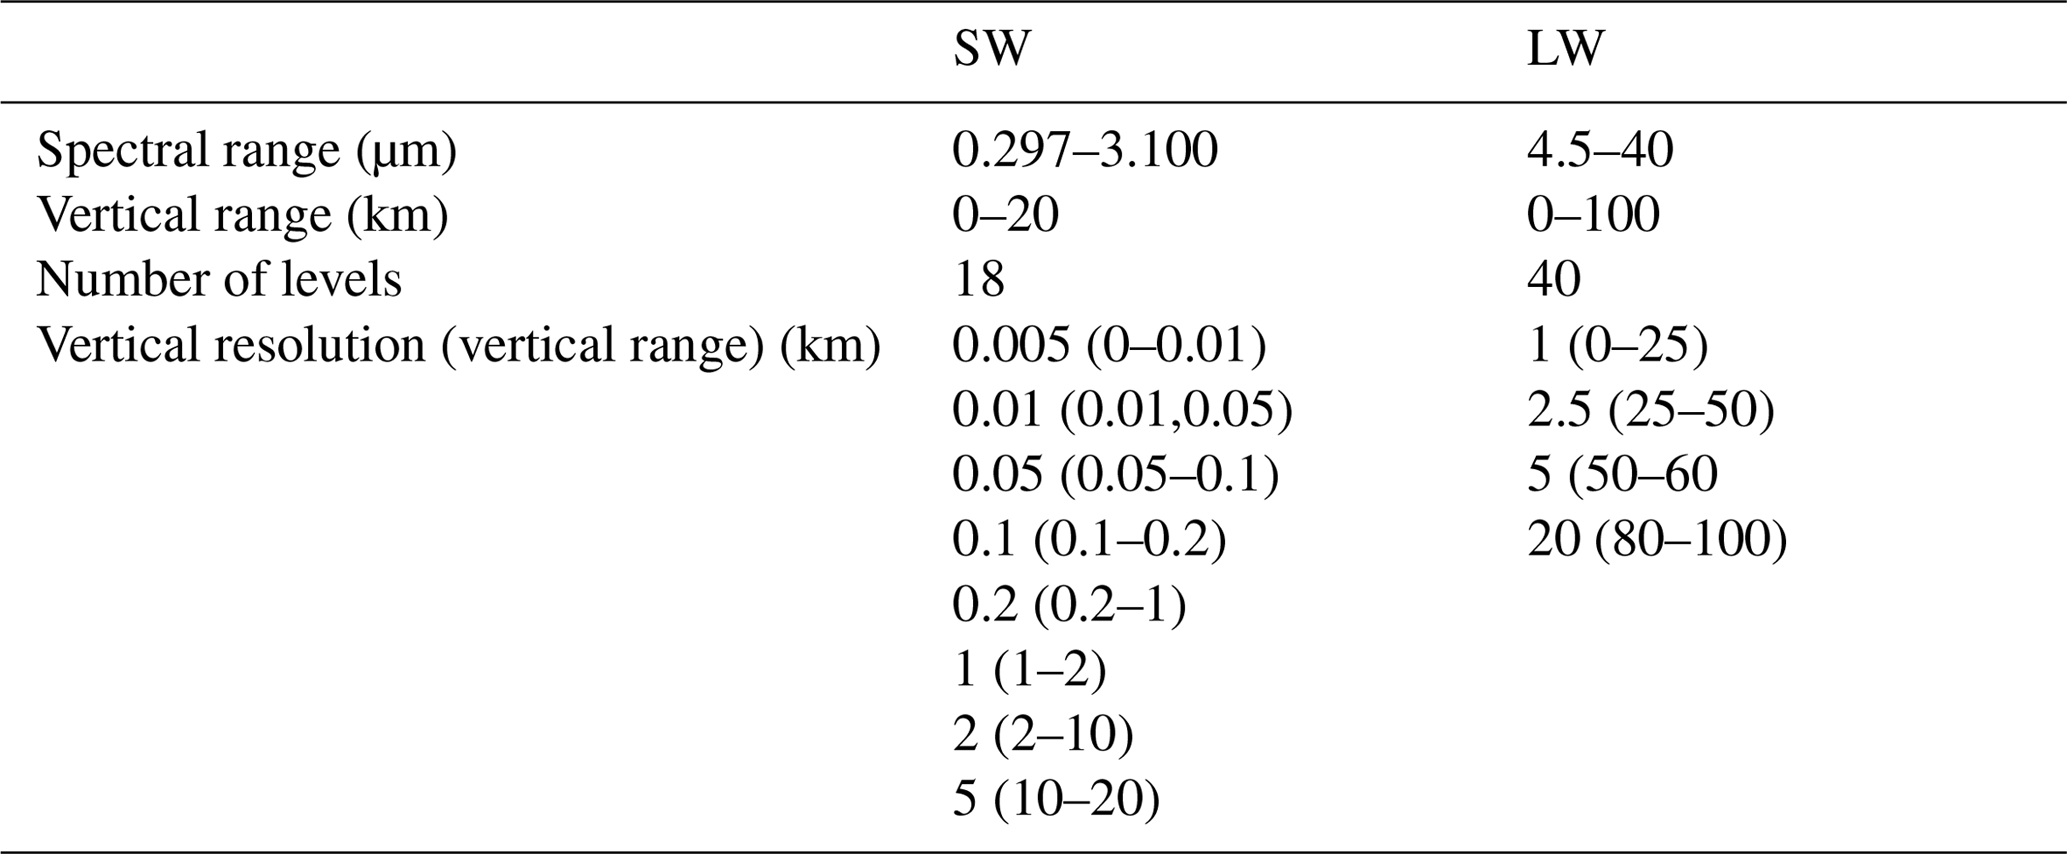
The GAME code is widely described by Dubuisson et al. (2004, 2005) and Sicard et al. (2014a). It is a modular RTM that allows for calculating upward and downward radiative fluxes at different vertical levels from the ground up to 20 km (100 km) in the SW (LW) spectral range. The solar and thermal infrared fluxes are calculated in two adjustable spectral ranges, which in this study were fixed to match those of the aircraft radiation measurements (namely 297–3100 nm for the SW and 4.5–40 µm for the LW) by using the discrete ordinates method (Stamnes et al., 1988). Note that the GAME code has a variable spectral sampling in the SW (depending on the spectral range considered) and a fixed spectral sampling (115 values) in the LW spectral range (Table 1).
Table 1Summary of main GAME properties for the SW and LW spectral ranges. The altitude range corresponding to the different vertical resolution values is indicated between parentheses.
3.2 GAME input data parameterization
The two considered SAFIRE ATR 42 flights, F30 and F31, took place on 16 and 17 June 2013, respectively, coinciding with ground-based lidar and sun/sky photometer measurements performed at the station. On these days, mineral dust with origin in the Sahara region (southern Morocco near the border with Algeria) reached Granada after ∼4 days of traveling, according to back-trajectory analysis (see Supplement Fig. S1) and the results presented in Denjean et al. (2016). A homogenous dust layer reaching up to 5 km a.g.l. was observed on 16 June, whereas on 17 June the dust layer was decoupled from the boundary layer and located between 2 and 4.5 km a.g.l. (Benavent-Oltra et al., 2017). A very similar vertical structure was observed for the same dust event above Minorca (Renard et al., 2018). Daily maps of Meteosat Second Generation-derived AOD over the Mediterranean from 15 to 18 June during the dust event shown in Fig. 4 of Renard et al. (2018) show the regional extension of the plume over the western Mediterranean region. On 16 June, the F30 flight above Granada site took place between 14:15 and 14:45 UTC coincident with the lidar measurements. The corresponding SZA at 14:30 UTC was 31.49∘. The sun/sky photometer microphysics data were not available until 16:22 UTC, even though the retrieved AOD and its spectral dependence (represented by the Ångström exponent) were very stable between the time of the lidar measurements and the time of the sun/sky photometer inversion. On 17 June, the F31 flight occurred in the early morning (07:15 to 07:45 UTC, with SZA =61.93∘ at 07:30 UTC), and simultaneous lidar and sun/sky photometer data were available. Unfortunately, the airborne vertical profile of extinction by the CAPS measurements was not available during this second flight. Clouds were detected by the lidar on 17 June after 15:00 UTC. Furthermore, a sky camera and the ground-based pyranometer and pyrgeometer data indicate cloud contamination (but not in the zenith) in the radiation data much earlier (around 09:00 UTC), also preventing satellite retrievals in the region.
A summary of the experimental data used as input for GAME calculations during these two case studies is presented in Table 2. This input includes surface parameters and atmospheric profiles of meteorological variables, main gas concentrations, and aerosol properties. The aerosol properties used in the present study are parameterized using three different datasets, based on the different instrumentation and retrievals available, i.e., Dataset 1 (DS1), Dataset 2 (DS2) and Dataset 3 (DS3). A more detailed description of the different parameters is provided next.
Table 2Summary of the data sources used to obtain the input data parameterizations for GAME computations both in the SW and LW spectral ranges, including the surface parameters (albedo, alb, and land-surface temperature, LST), profiles of meteorological variables, and main gases and the aerosol parameters. For the aerosol parameters (aerosol extinction, αaer; single scattering albedo, SSA; and asymmetry parameter, g) three different datasets are used (DS1, DS2, and DS3) based on different instrumentation and retrievals. The indications below the sources of the aerosol parameters indicate whether the parameter is column-integrated (col) or if it is vertically resolved (z) and the number of wavelengths at which it is given (nλ).

3.2.1 Surface parameters and profiles of meteorological variables
The surface parameters required for GAME are the surface albedo (alb(λ)) and land-surface temperature (LST). The alb(λ) for the SW range is obtained from the sun/sky photometer data using the AERONET retrieval at 440, 675, 880, and 1020 nm, and for the LW from the integrated emissivity between 4 and 100 µm provided by the Single Scanner Footprint (SSF) Level2 products of the CERES (Clouds and the Earth's Radiant Energy System (http://ceres.larc.nasa.gov/, last access: 10 December 2018) instrument (Table 3). LST values are obtained from MODIS (Moderate Resolution Imaging Spectroradiometer) 1 km daily level-3 data (Wan, 2014) on 16 June. Unfortunately, on 17 June MODIS data were not available due to the presence of clouds and the local surface temperature was obtained from temperature measurements at the Granada site, where the meteorological station is located at 2 m above the ground. LST and alb(λ) values used for the two analyzed cases are included in Table 3.
Table 3Surface albedo, alb(λ), values provided by AERONET for the SW spectral range and by CERES for the LW. Land-surface temperature (LST) on 16 June was obtained from MODIS, whereas on 17 June it was estimated from the meteorological station at the Granada site. These surface parameters are common to all parameterizations.
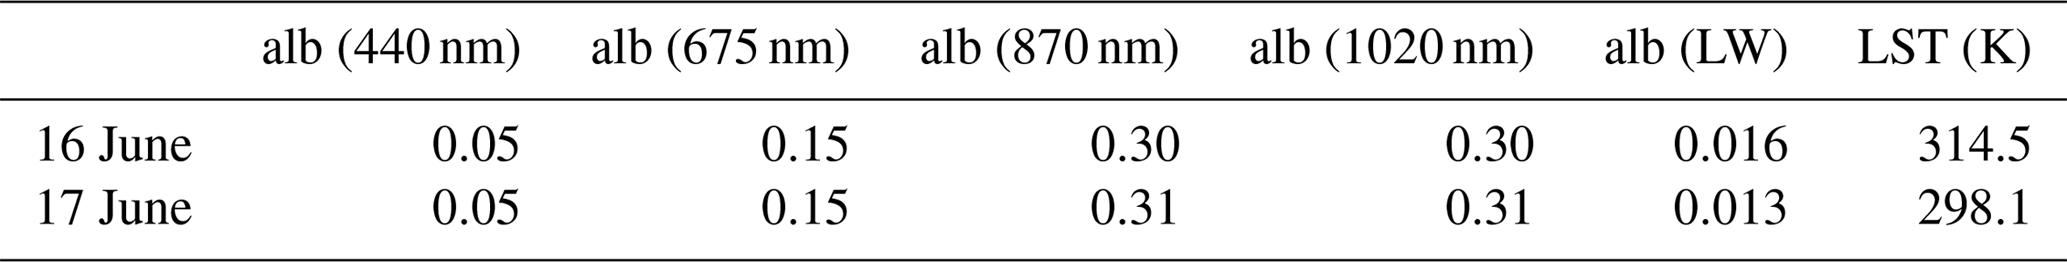
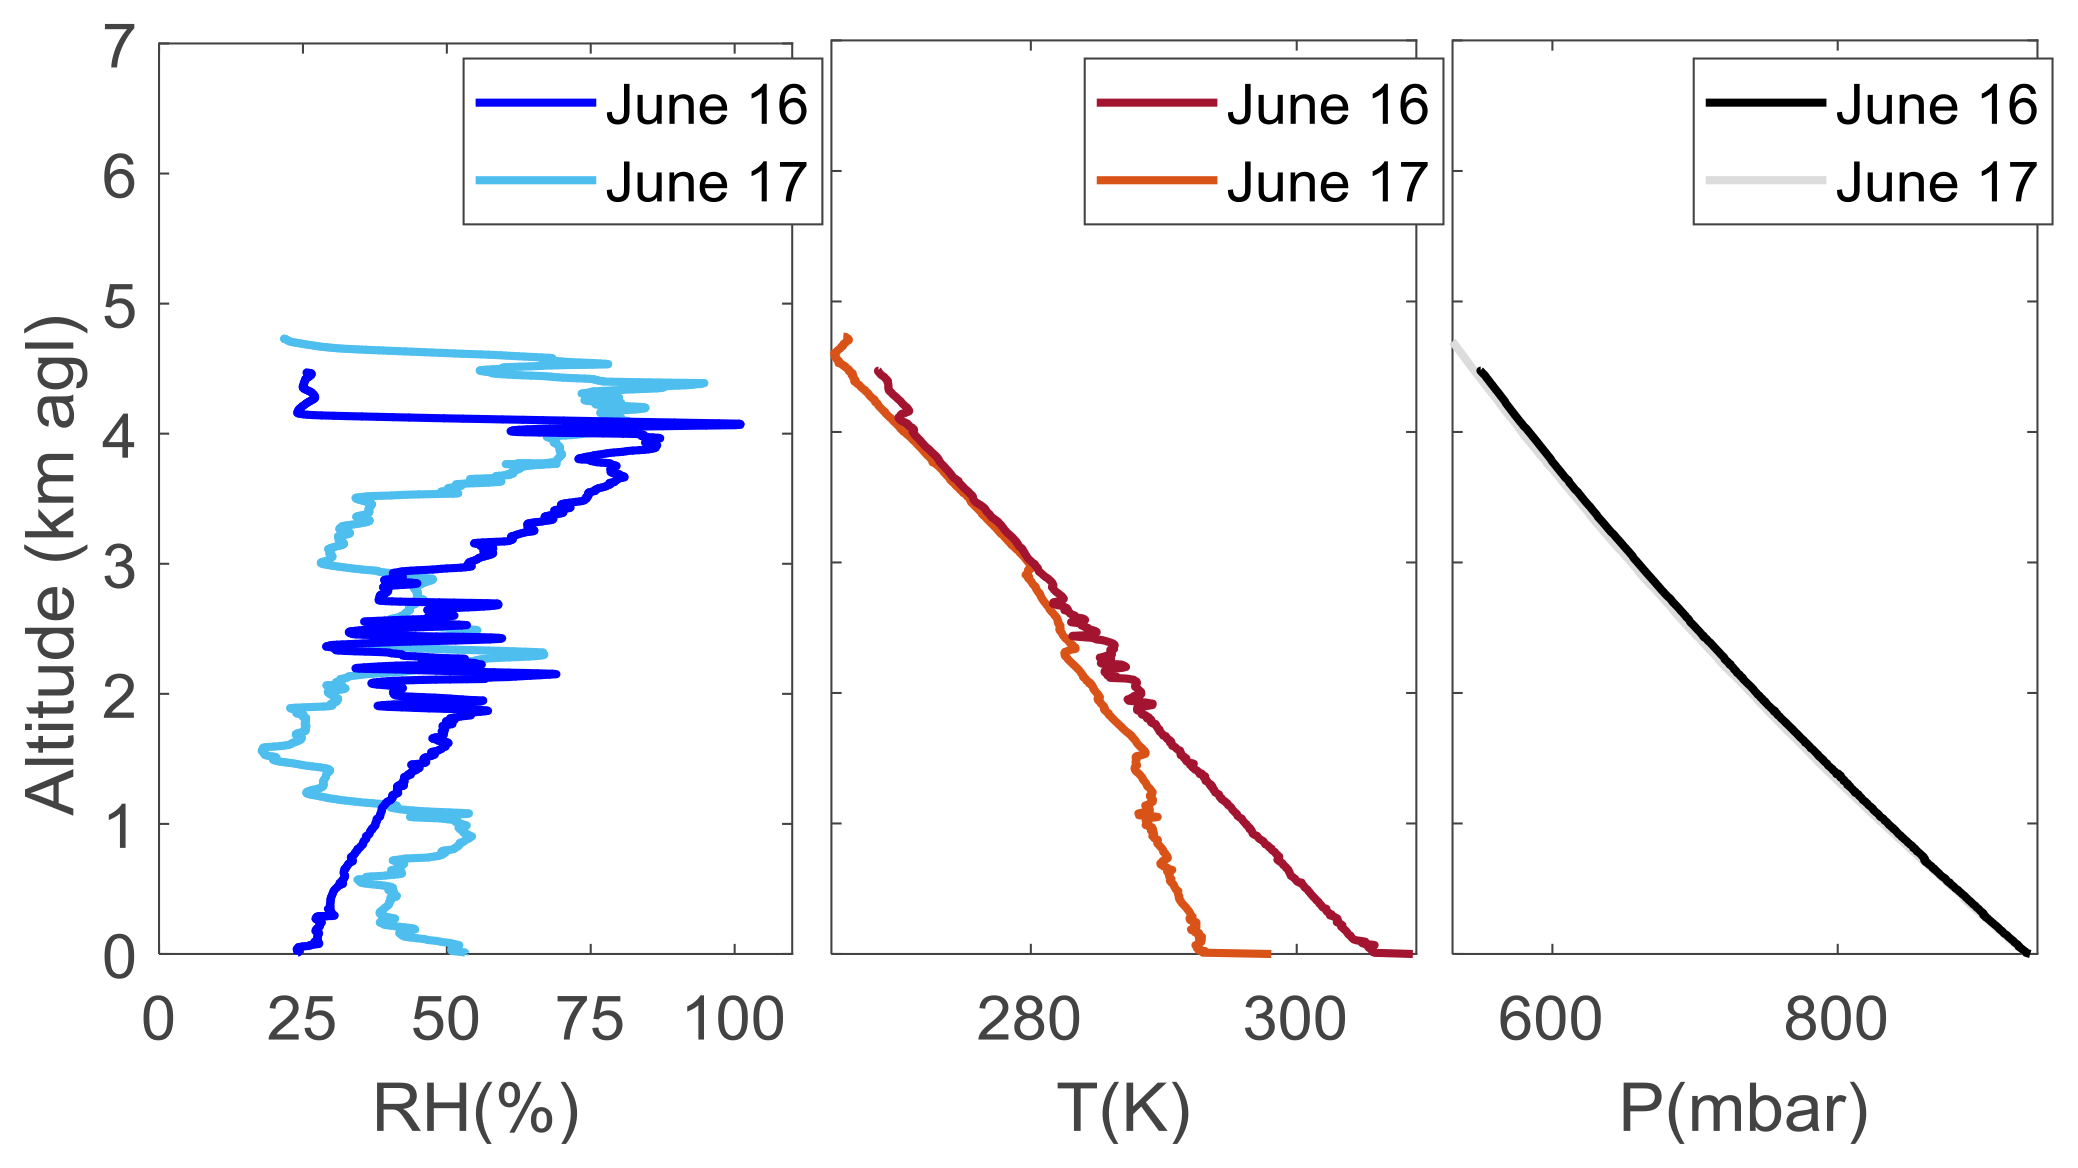
Figure 1Relative humidity (RH), temperature (T), and pressure (P) profiles measured on board the ATR during flights F30 (16 June) and F31 (17 June).
Figure 1 shows the pressure (P), temperature (T), and relative humidity (RH) profiles obtained from the SAFIRE ATR 42 measurements. Data from the meteorological station located at IISTA-CEAMA are used to complete these profiles at the surface level; whereas at altitudes above the aircraft flight, a scaled US standard atmosphere is used for completion. The concentration profiles of the main absorbing gases (O3, CH4, N2O, CO, and CO2) are also taken from the US standard atmosphere, while for the gaseous absorption coefficients the HITRAN database is used (as in Sicard et al., 2014a, b). Variations in the concentration profiles of the main absorbing gases have low impact of the radiative fluxes and the ARE, thus small uncertainty is introduced by this approach. A sensitivity test performed in the present study, varying the O3 profiles up to double concentrations, indicates maximum differences of 4 W m−2 in the FSW and 3.6 W m−2 in the case of the FLW. For the ARE, differences are negligible (below 0.2 W m−2).
3.2.2 Aerosol parameterization
As for the aerosol parameterization, αaer(λ,z), SSA(λ,z), and g(λ,z) are required as GAME input data (Table 2). For the SW wavelengths, these properties can be obtained from the measurements performed with the instrumentation available during the campaign; namely the lidar, the sun/sky photometer, and the in situ instrumentation on board the aircraft. On the other hand, direct measurements of the aerosol properties in the LW are not so straightforward and thus scarce. Hence, the aerosol LW radiative properties are calculated by a Mie code included as a module in GAME. According to Yang et al. (2007), the dust particles nonsphericity effect at the thermal infrared wavelengths is not significant on the LW direct ARE, thus the shape of the mineral dust can be assumed as spherical for the Mie code retrievals introducing negligible uncertainties.
For the SW simulations, we run GAME using three different aerosol input datasets, i.e., DS1, DS2, and DS3 (Table 2), in order to evaluate their influence on the ARE calculations. DS1 relies on a parameterization based on the advanced postprocessing GRASP code, which combines lidar and sun/sky photometer data to retrieve aerosol optical and microphysical property profiles; DS2 relies on Klett–Fernald lidar inversions and AERONET products and corresponds to a reference parameterization (easily reproducible at any station equipped with a single- or multiwavelength lidar and an AERONET sun/sky photometer and without the need of an advanced postprocessing algorithm); and DS3 relies on in situ airborne measurements and corresponds to an alternative parameterization to DS1 and DS2.
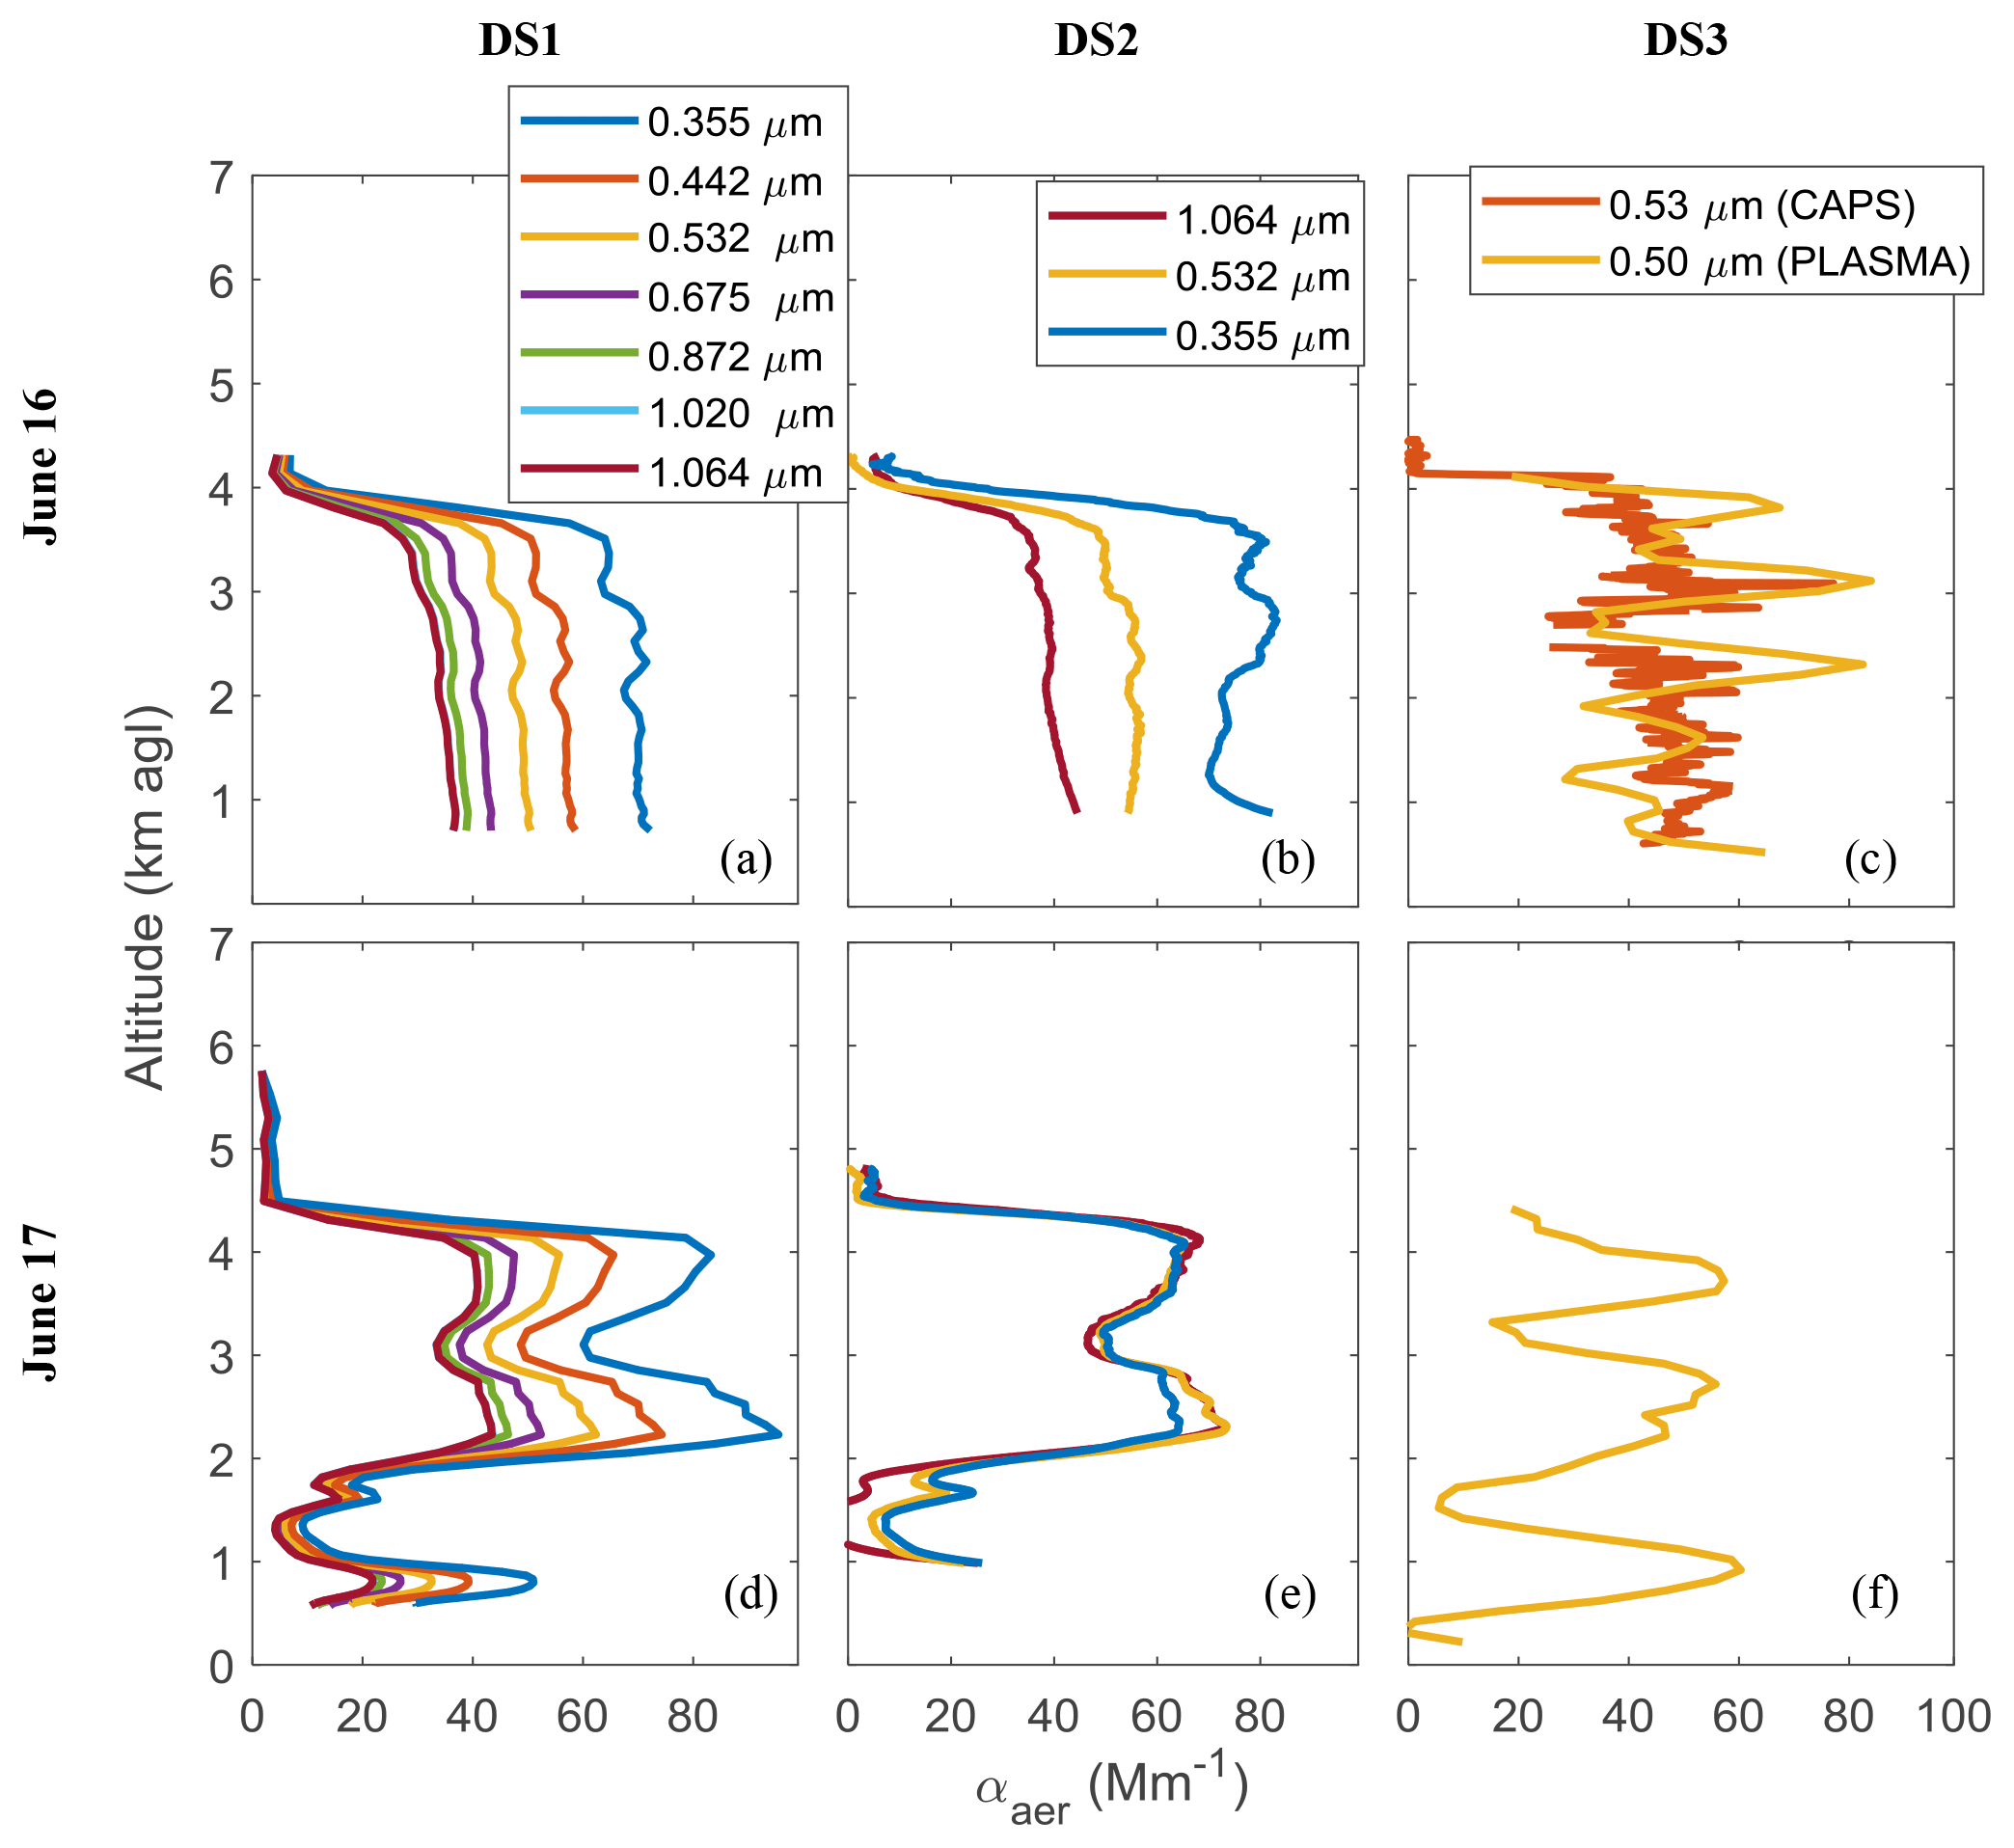
Figure 2Profiles of αaer obtained from GRASP/DS1 (a, d), Klett/DS2 (b, e), and aircraft in situ/DS3 measurements (c, f) on 16 June (a, b, c) and 17 June (d, e, f).
Figure 2 shows αaer profiles on 16 June (top row) and 17 (bottom row) obtained using the three different approaches. For DS1 (Fig. 2a and d), αaer profiles at seven different wavelengths obtained with GRASP are used as input data in GAME. In DS2 (Fig. 2b and e), the αaer profiles are obtained from the lidar data using Klett–Fernald retrievals and adjusting the lidar ratio to the AERONET retrieved AODs, as mentioned in Sect. 2.1. Finally, for DS3 (Fig. 2c and f) the αaer values are obtained from the aircraft in situ measurements (CAPS and PLASMA data on 16 June and PLASMA on 17 June). A detailed analysis and discussion on the comparison between αaer profiles provided by the aircraft measurements, GRASP, and the lidar system at Granada is already included in Benavent-Oltra et al. (2017). In general, the lidar, GRASP, and the CAPS data are in accordance, observing the same aerosol layers and similar values, with differences within 20 %. GRASP slightly overestimates CAPS data by 3 Mm−1 on average, whereas the differences with PLASMA are larger, reaching 30 % (or 11 Mm−1). In the case of the Klett–Fernald retrieval, values are lower than those retrieved with GRASP by up to 19 %. Considering that the uncertainty in αaer is around 30 % for both GRASP and the Klett–Fernald retrieval and 3 % for the CAPS data, this discrepancy is well below the combined uncertainty in the different datasets. Differences in the αaer profiles translate into differences in the integrated extinction and, hence, into differences in the AOD values used as input in the radiative flux retrievals. The AOD values presented here (included in Table 4) are obtained by integrating the αaer profiles at 550 nm from the surface up to the considered top of the aerosol layer (4.3 km on 16 June and 4.7 km on 17 June). In GRASP retrieved αaer profiles, values above this top of the aerosol layer are slightly larger than zero since GRASP takes into account stratospheric aerosols by an exponential decay (Lopatin et al., 2013), thus the approach used here to calculate the AOD leads to lower values compared to the column-integrated AOD provided by the sun photometer. Differences among the three datasets are more noticeable on 16 June, when the AOD for DS1 is 0.05 lower than for DS2 and DS3; whereas on 17 June the maximum difference is 0.03, obtained between DS1 and DS2. The AOD values at 550 nm reveal that GRASP input data (DS1) and to a lesser extent the aircraft in situ data (DS3) underestimate the aerosol load in the analyzed dust layer compared to AERONET (DS2) due to the differences in the retrieval techniques, e.g., although AERONET provides integrated AOD for the whole column, low αaer values above the aerosol layer are neglected for the AOD calculations in DS1 and DS3.
Table 4Column-integrated number concentration (N), effective radii (reff), and standard deviation (σ) of fine and coarse aerosol modes and AOD at 550 nm for DS1, DS2, and DS3 on 16 and 17 June.
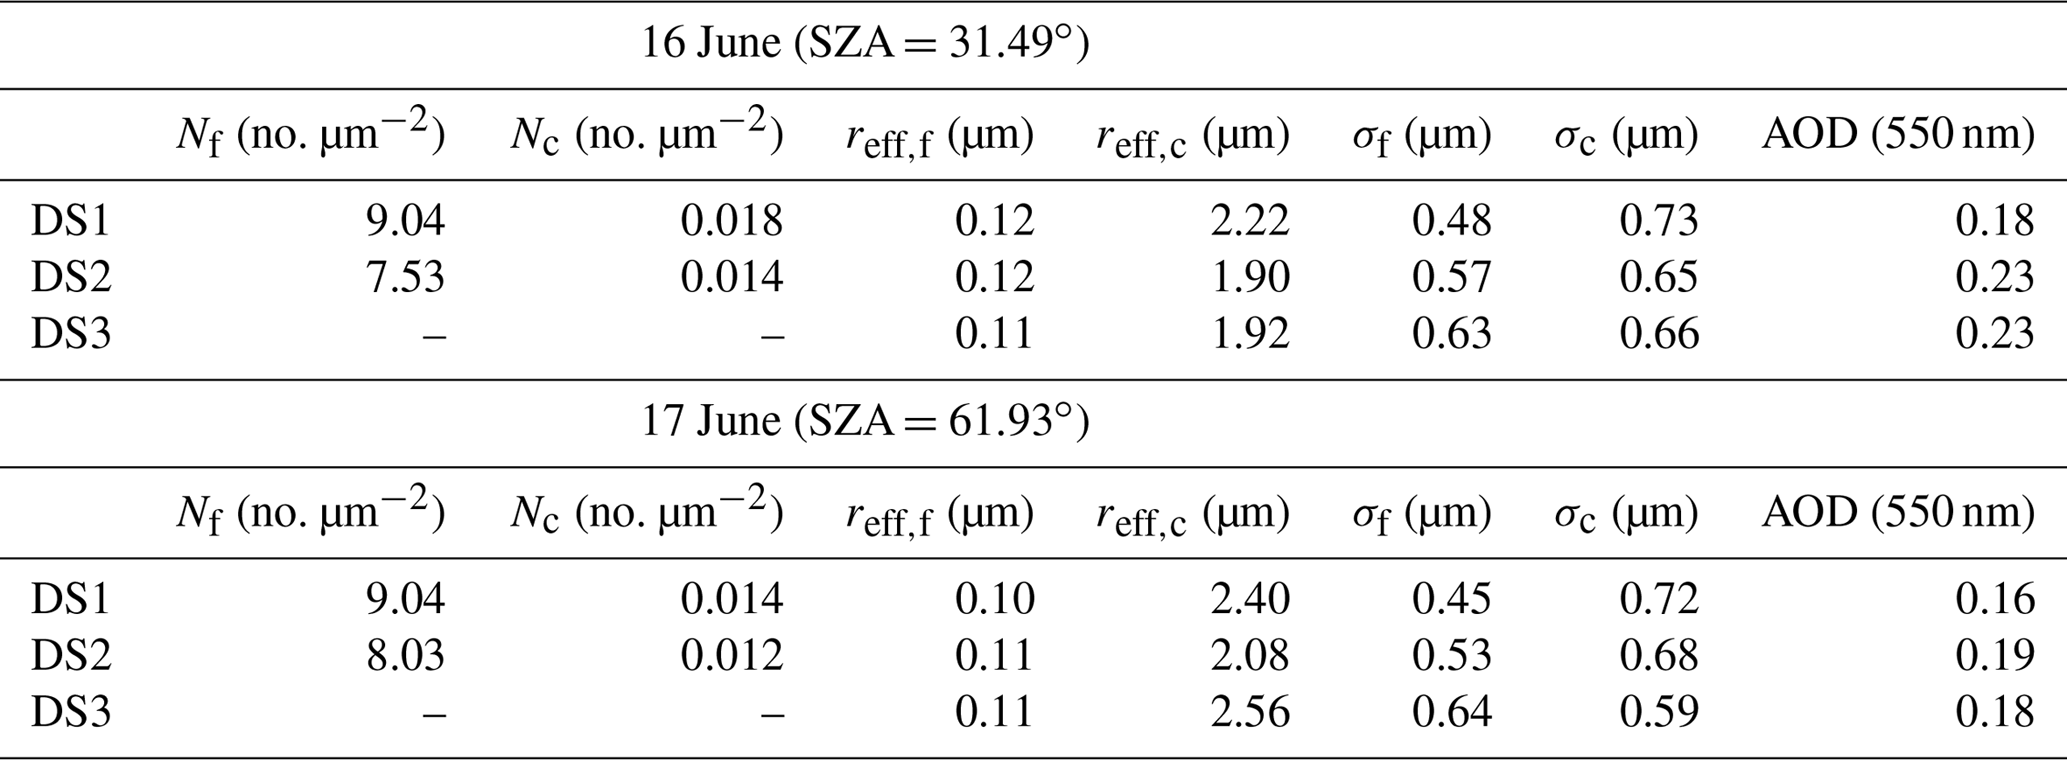
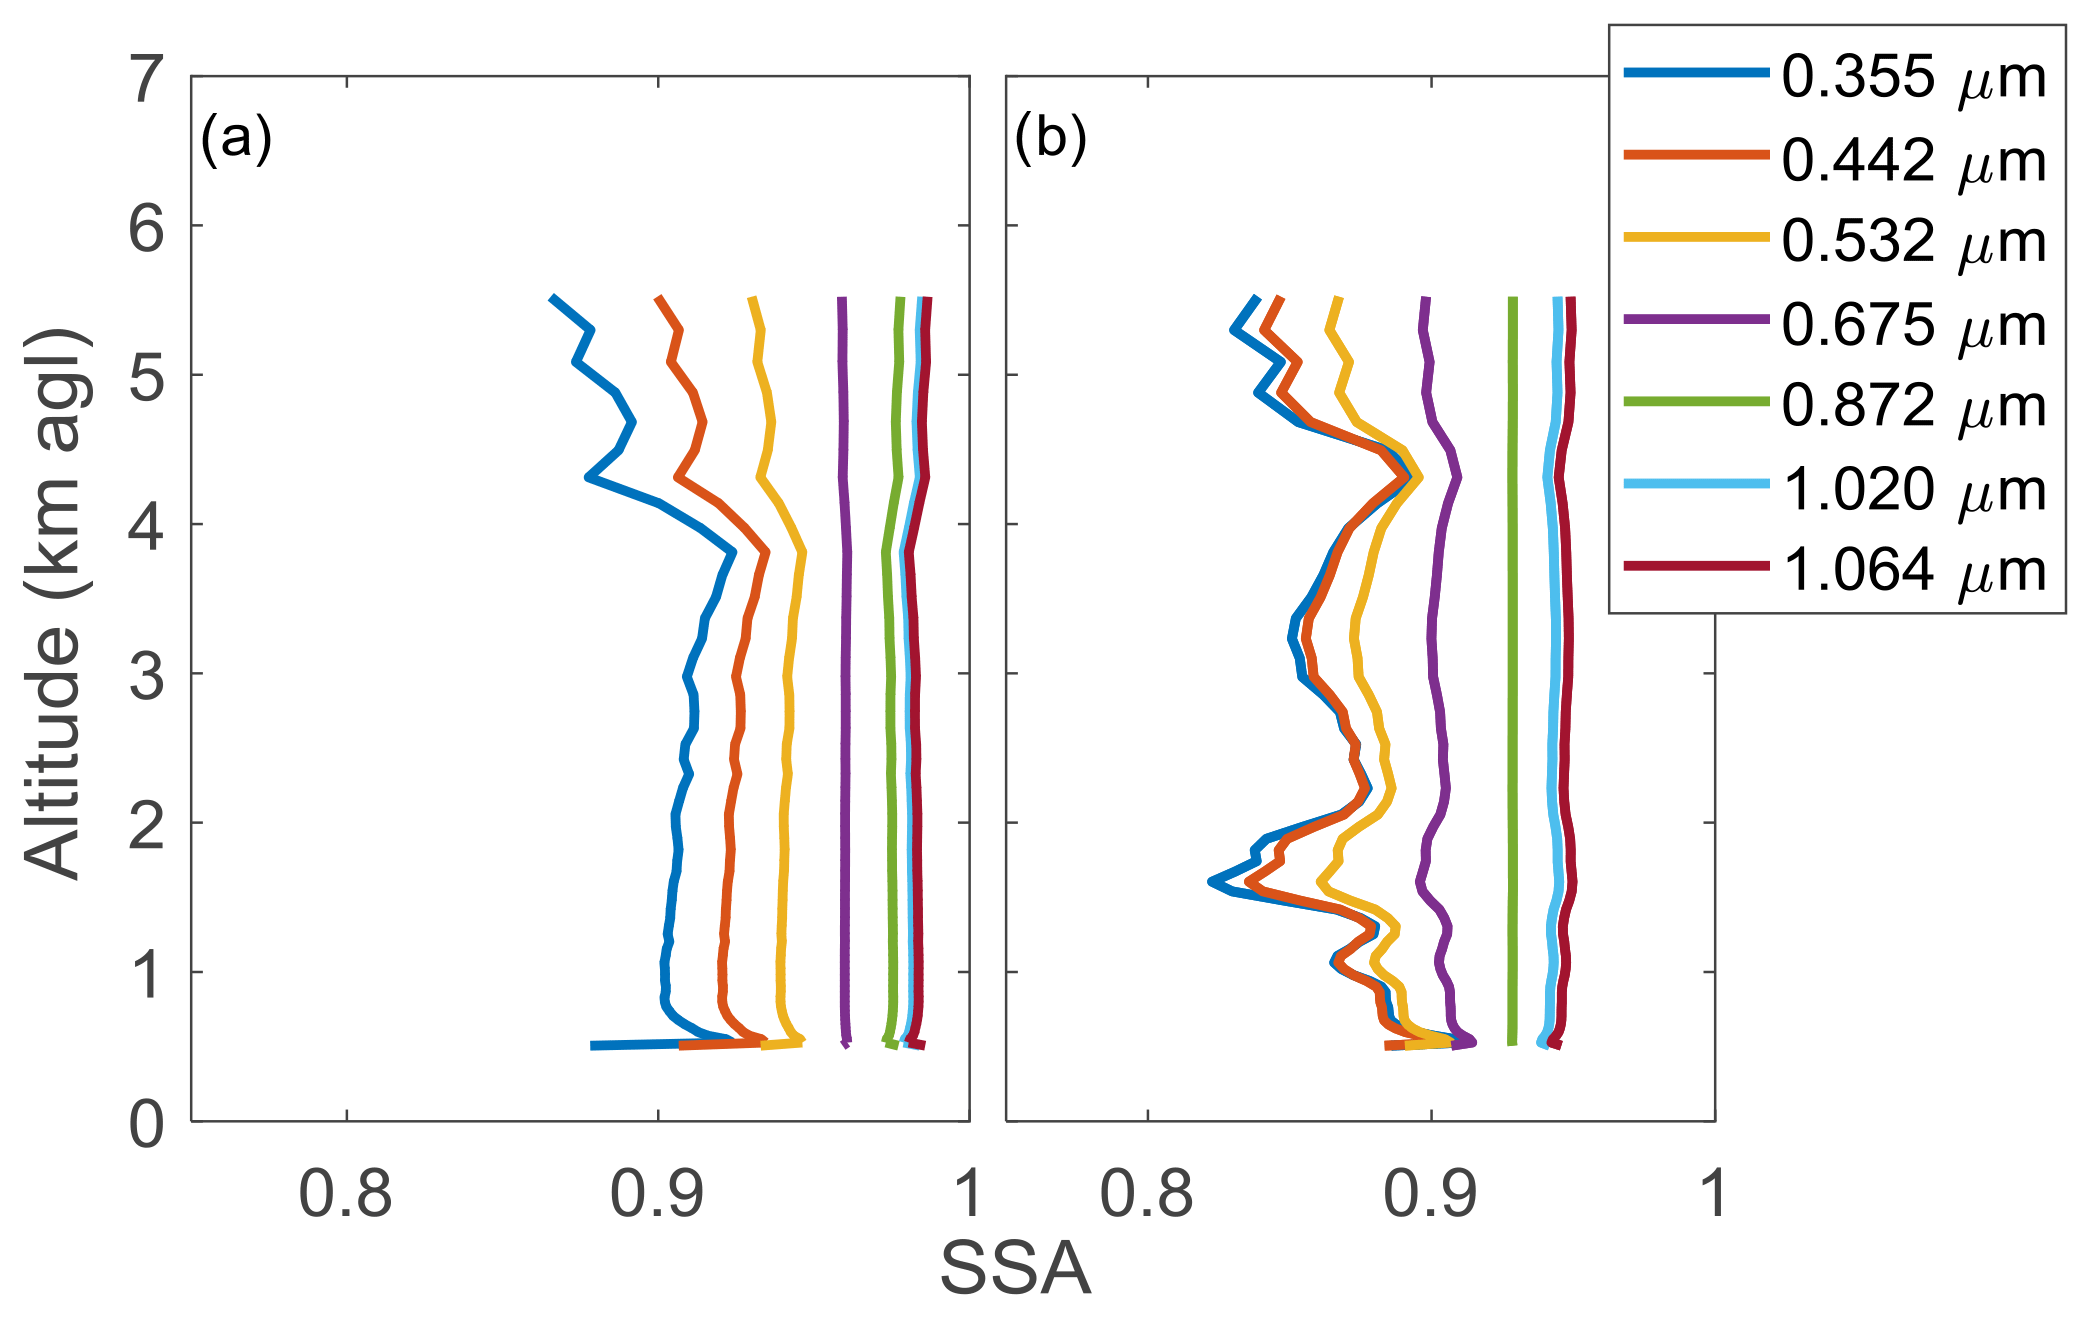
Figure 3 presents the SSA values retrieved by the GRASP algorithm, used as input for GAME in DS1, on 16 (F30, Fig. 3a) and 17 June (F31, Fig. 3b). The mean SSA at 440 nm is equal to 0.92 on 15 June, whereas on 17 June it is 0.85. On 17 June the SSA profiles present lower values and more variation with height than on 16 June; the lower SSA values indicate the presence of more absorbing particles on 17 June. The vertical variation on 17 June is associated with the presence of two different layers, whereas a more homogeneous dust layer is observed on 16 June. For DS2, the SSA are taken from AERONET columnar values and assumed to be constant with height (Fig. 4a). The SSA at 440 nm was 0.89 and 0.83 on 16 and 17 June, respectively; as already observed in Fig. 3, SSA values are lower on 17 June due to the intrusion of more absorbing particles. For DS3, SSA values at 530 nm are obtained from the nephelometer and the CAPS or PLASMA on board the ATR. In order to reduce the uncertainty in the measured data, only averaged values for the column will be considered, being 0.88 and 0.83 on 16 and 17 June, respectively (Fig. 4). Therefore, differences of up to 0.04 and 0.02 are observed on 16 and 17 June, respectively, among the SSA values obtained with the three datasets. Despite these differences, the retrieved SSA values obtained here are within the range of typical values for dust aerosols (Dubovik et al., 2002; Lopatin et al., 2013) and differences are still within the uncertainty limits, which range between 0.02 and 0.07 depending on the aerosol load for AERONET data (Dubovik and King, 2000) and is 0.04 for the aircraft values. In the case of g values, the same data are used for the three aerosol input datasets. Multispectral values of g are taken from AERONET columnar values and assumed to be constant with height (Fig. 4b).

Figure 4(a) AERONET/DS2 column-integrated (circles) and aircraft/DS3 averaged (diamonds) SSA values on 16 June at 16:22 UTC and 17 June at 07:20 UTC. (b) AERONET g values for the same periods.
Summing up, for the SW aerosol parametrization in GAME three datasets are tested. In DS1, GRASP-derived spectral profiles at seven wavelengths of the aerosol extinction and SSA are used. In DS2, the Klett retrieved extinction profiles at three wavelengths are used together with the AERONET SSA columnar values at four wavelengths, which are assumed to be constant with height. For DS3, one extinction profile at 550 nm and a column-averaged single-wavelength value of the SSA from the airborne measurements are considered. In the three cases, the column-integrated AERONET asymmetry parameter at four wavelengths is assumed to be constant with height and used as input.
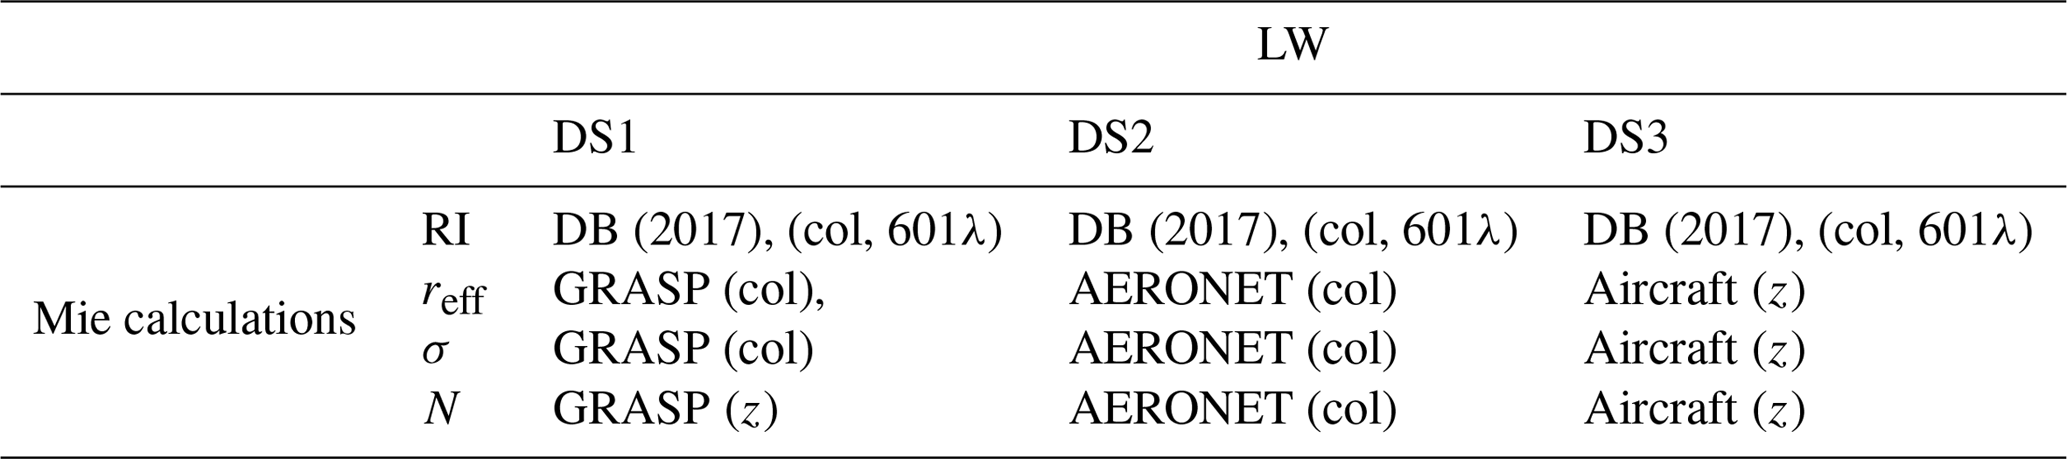
For the LW calculations, the Mie code is used to obtain αaer(λ,z), SSA(λ,z), and g(λ,z) from the information on the aerosol PSD, complex refractive index (RI), and density, following a similar approach to that used in previous studies (Meloni et al., 2015, 2018; Peris-Ferrús et al., 2017). A summary of the aerosol parameters used in the Mie calculations is included in Table 5. Three different datasets are also used for the aerosol parameterization in the LW calculations. In this case, the sensitivity of the model to the PSD used is tested. A similar scheme to that presented for the SW is used, where DS1 relies on GRASP retrievals, DS2 on AERONET products, and DS3 relies on in situ airborne measurements.
Table 5Summary of the data used to obtain αaer(λ,z), SSA(λ,z), and g(λ,z) in the LW spectral range from Mie calculations, i.e., the refractive index, RI; effective radius, reff; geometric standard deviation, σ; and number concentration, N. Three different datasets are used (DS1, DS2, and DS3) based on different particle size distribution (PSD) data used. The indications below the sources of the aerosol parameters indicate whether the parameter is column-integrated (col) or if it is vertically resolved (z) and the number of wavelengths at which it is given (nλ). DB (2017) stands for Di Biagio et al. (2017).
The spectral real and imaginary parts of the RI of mineral dust in the LW are obtained from Di Biagio et al. (2017), using the Morocco source, and assumed constant with height. The analysis by Di Biagio et al. (2017) only covers the spectral range 3–16 µm so an extrapolation assuming the spectral dependence presented in Krekov (1993) for shorter and longer wavelengths is performed. This assumption is not exempt from uncertainty, since the refractive index presents a certain variability associated with the different nature of mineral dust properties. For example, the use of the refractive index provided for the Algerian and Mauritanian sources from Di Biagio et al. (2017) leads to variations in the ARE of 0.8 and 0.3 W m−2 at the BOA and the TOA, respectively. Additionally, vertical variations in the refractive index are also a source of uncertainty in the obtained radiative fluxes. The mineral dust particle density is assumed to be 2.6 g cm−3 (Hess et al., 1998). Regarding the PSD, three parameters (namely the effective radii, reff; standard deviation, σ; and the numeric concentrations, N) for fine and coarse modes are used. The fine mode comprises particles within the diameter range 0.1–1 µm, whereas for the coarse mode the range 1–30 µm is considered. A third mode at about 30 µm was detected in Renard et al. (2018) for the same dust event using balloon-borne measurements with concentrations up to 10−4 particles cm−3. However, this giant mode is not considered in our study due to the lack of data above Granada. Considering the relevance of large particles for the ARELW (i.e., Perrone and Bergamo, 2011; Sicard et al., 2014a, b; Meloni et al., 2018), neglecting this giant mode may contribute to increase the uncertainties in GAME estimations. However, simulations with GAME assuming the presence of a third mode of similar characteristics to the one observed by Renard et al. (2018) indicate that variations in the ARE are negligible in this case (lower than 0.1 W m−2). Even for much higher concentrations (10−1 particles cm−3), variations in the ARE of just 0.3 W m−2 at the BOA and 0.15 W m−2 at the TOA are obtained.
In the case of DS1, N values are obtained from the volume concentration profiles provided by GRASP assuming spherical particles in the range between 0.05 and 15 µm radii (Fig. 5). Values of reff and σ provided by GRASP (Table 4) are column-integrated and thus assumed to be constant with height. This is also the case for DS2, in which the PSD parameters are column-integrated values provided by the AERONET retrieval in Granada (see Table 4).
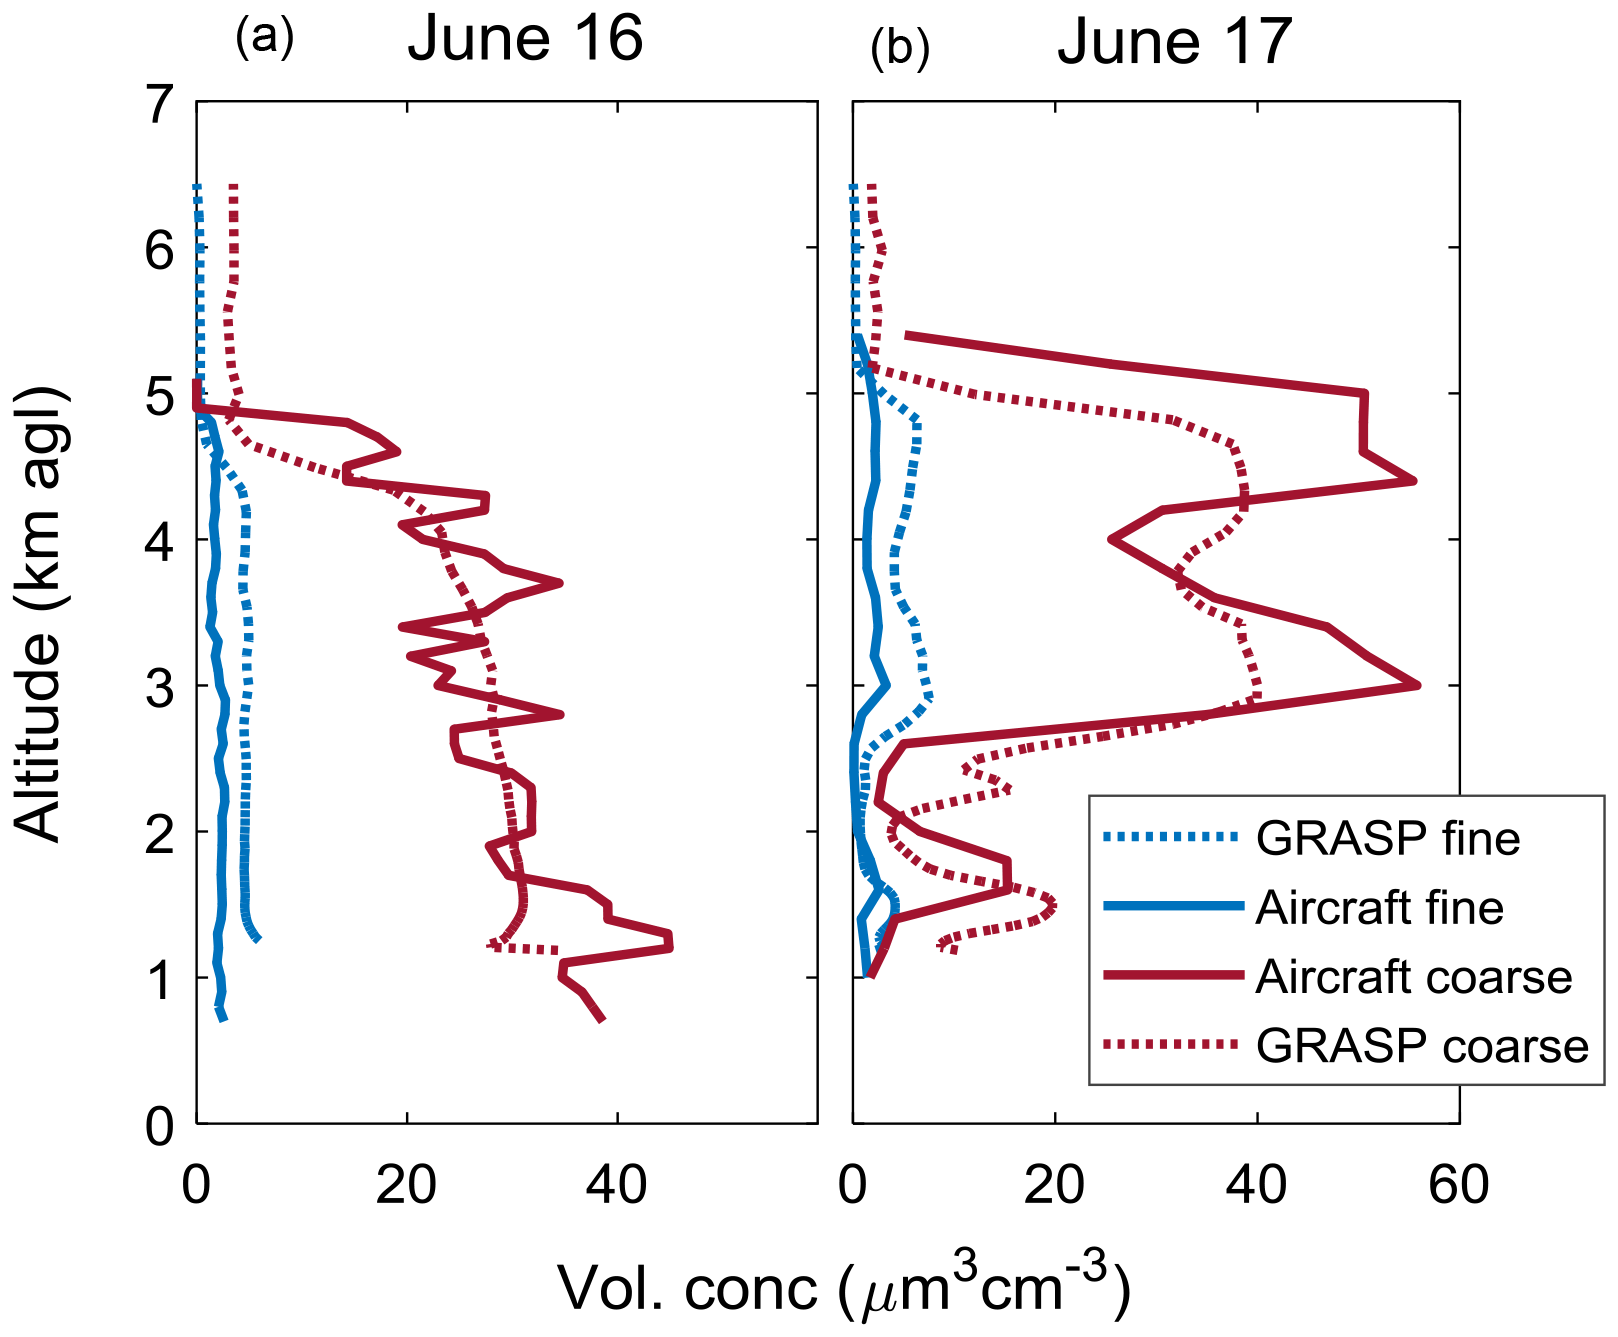
Figure 5Profiles of aerosol volume concentration for the fine (blue) and coarse (red) mode obtained from GRASP/DS1 (dotted line), and aircraft in situ/DS3 measurements (solid line) on 16 June (a) and 17 June (b).
For DS3, the volume concentration (or the equivalent N), r, and σ profiles for the fine and coarse modes (Fig. 5) are calculated from the data provided by the aircraft in situ measurements in the range between 0.02 and 40 µm diameter. Benavent-Oltra et al. (2017) found a general good accordance between the volume concentration profiles measured by the instrumentation on board the SAFIRE ATR 42 and retrieved with GRASP, with differences in the total volume concentration profiles for the dust layers lower than 8 µm−3 cm−2 (20 %), which fall within the combined uncertainty. Nonetheless differences are still noticeable, especially in the fine mode. On 17 June, GRASP overestimates the aircraft measurements for the fine mode and underestimates them for the coarse mode, which in turn results in a quite different fine to coarse concentration ratio for DS1 and DS3. Additionally, a slight shift is observed in the vertical structure of the aerosol layers. Differences are mostly technical, i.e., the GRASP retrieval is based on 30 min averaged lidar profiles while the aircraft provide instantaneous measurements, but they can also be partially caused by the discrepancies between the vertical aerosol distribution above Granada (sampled by the lidar) and the concentration measured during the aircraft trajectory as they are not exactly coincident. In addition, for 16 June, there is a 2 h time difference between the sun/sky photometer retrieval used in GRASP calculations and the airborne measurements, which can lead to slight differences in the aerosol properties despite the homogeneity of the dust event during this period. In the following, we quantify the impact these differences may introduce in the calculations of F.
3.2.3 GAME output data
As a result of the simulation, GAME provides vertical profiles of radiative fluxes in the shortwave (FSW) and longwave (FLW) spectral ranges. The net flux can be calculated from the obtained profiles for both spectral ranges as
where the upward and downward arrows are for upward and downward fluxes, respectively. From the obtained radiative flux profiles, the direct ARE profiles are calculated according to the following equation:
where Fw and Fo are the radiative fluxes with and without aerosols, respectively. The direct ARE can be obtained for the SW (ARESW) and the LW (ARELW) spectral ranges.
4.1 SW radiative fluxes
Figure 6 shows the radiative flux profiles for the SW spectral range obtained with GAME using the three different input datasets described in Sect. 3, as well as the Net FSW. The radiative fluxes measured by the pyranometer on board the SAFIRE ATR 42 are also included in the figure. The three GAME simulations show similar values with differences below 8 W m−2 on average, which represents less than 1 % variation. The differences in the obtained fluxes are mostly due to the differences in the aerosol load considered depending on the inputs. Even though the differences in the AOD among the different datasets are small (lower than 0.05), they can lead to differences in FSW and ultimately in the ARESW. In order to quantify these differences, we performed a sensitivity test by varying the AOD while the other parameters were kept constant. We observed a maximum variation in the FSW of 6.5 W m−2 (0.7 %) at the surface, decreasing with height, for changes in the AOD of up to 0.05, which is the difference we observe between the AOD for DS2 and DS1 on 16 June. This result partly explains the differences among the three datasets. In addition, a sensitivity test performed by exclusively varying the SSA indicates that more absorbing particles are related to less ↓FSW at the surface, namely a variation of 1 % is observed at the BOA for a decrease in the SSA of 0.03. The influence of the SSA decreases with height and is negligible at the TOA. For the ↑FSW, a decrease of 0.8 % is observed at the BOA if more absorbing particles are present, but in this case the influence at the TOA is larger (2.2 %). In our case, the larger AOD assumed for DS2 on both days (see Table 4 and Fig. 2), causes the ↓FSW to be slightly lower compared to DS1. For DS3 the AOD is similar to DS2, but the SSA values used, which are relatively smaller compared to those measured by AERONET (see Fig. 4), lead to lower values of the radiative fluxes than for DS2. The vertical distribution of the SSA also influences the radiative fluxes in the SW component as demonstrated in previous studies (Gómez-Amo et al., 2010; Guan et al., 2010), contributing to explain the differences observed among the three datasets analyzed here.
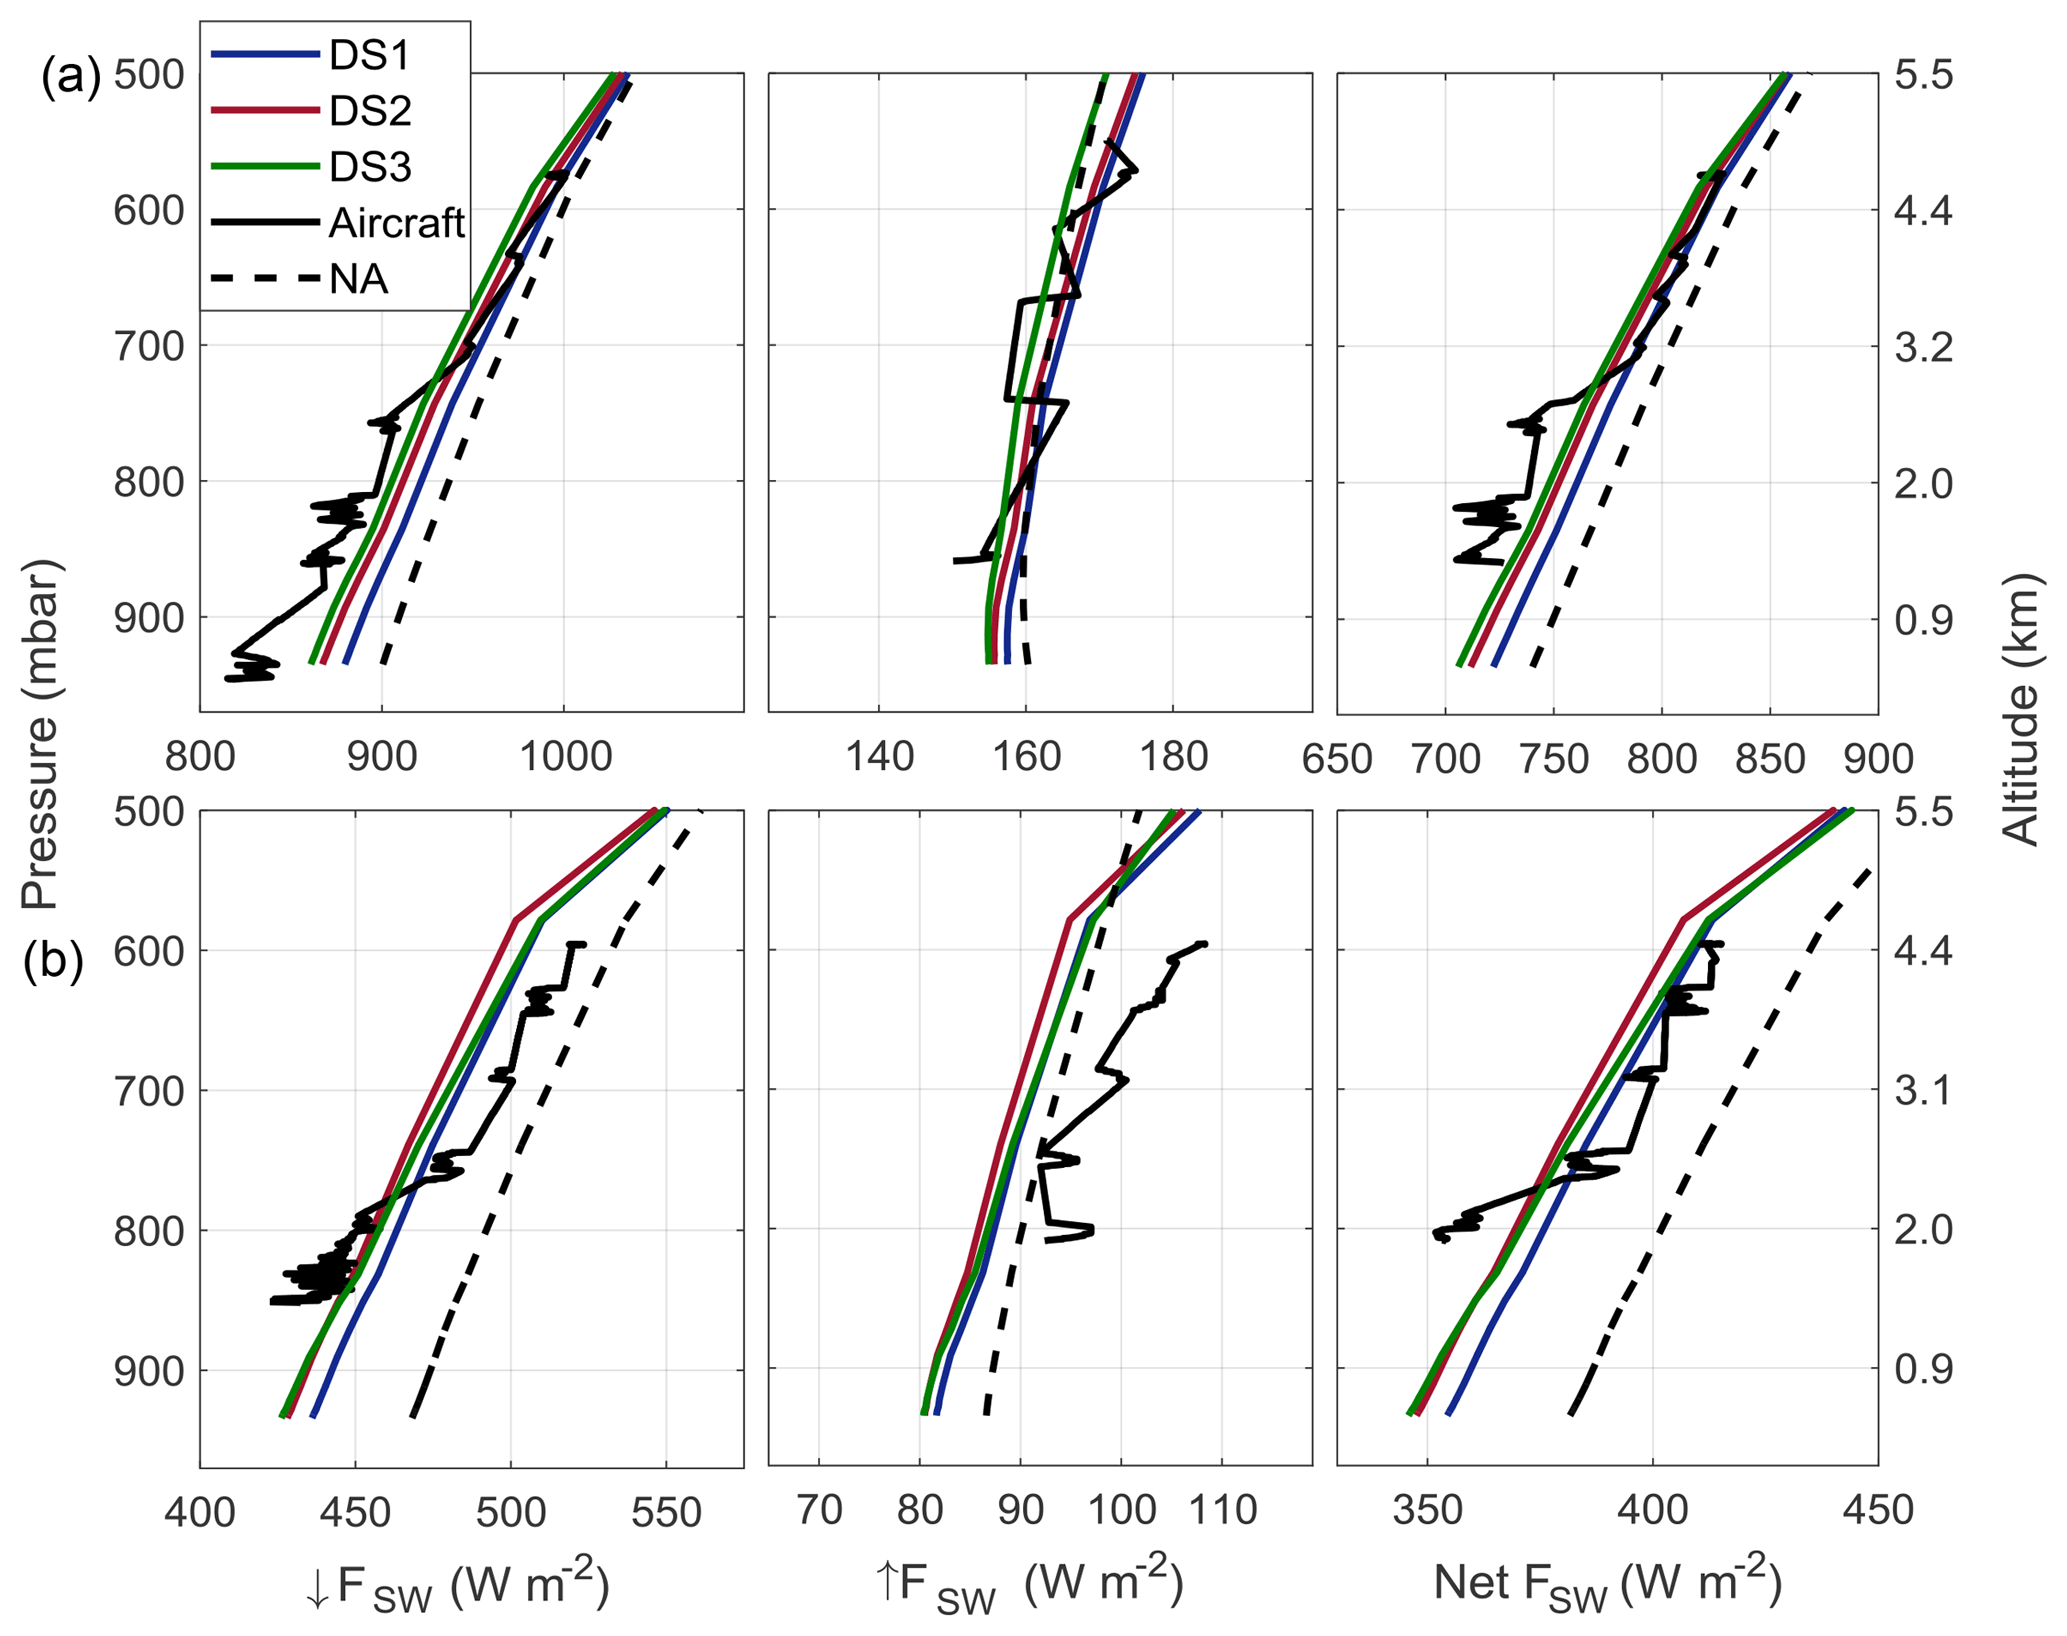
Figure 6Radiative fluxes for the SW spectral range for 16 June (a) and 17 June (b) simulated with GAME using different input aerosol datasets (DS1 in blue, DS2 in red, and DS3 in green). The black lines are the aircraft in situ measurements distant from about 20 km. The black dashed lines represent the radiative fluxes without the aerosol component (NA).
The evaluation against the aircraft measurements shows larger differences for altitudes below 2.5 km (∼860 mbar) on 16 June, whereas a better agreement is found above. On 17 June, no ↑FSW aircraft data are available below 2 km. Relative differences between the model and the aircraft measured data (calculated as are well below 7 %, being the largest discrepancies observed for the ↓FSW. Differences among the three GAME outputs and the aircraft pyranometer are lower than 5 % for the Net FSW on both days. Considering the very different approaches followed by the model and the direct measurements by the airborne pyranometer (i.e., vertical resolution, temporal sampling, and data acquisition and processing) – together with the uncertainty in the pyranometer (5 W m−2) and the estimated uncertainty in the model outputs that can be as large as 19 W m−2) – these differences are quite reasonable. A conclusive result on which input dataset provides a better performance is unlikely because of the comparable results obtained with the three datasets.
The values at the surface (or BOA) and at the TOA for the different radiative fluxes can also be evaluated against different instruments: measurements for the ↓FSW at the surface are available from the sun photometer; AERONET provides values for the ↓FSW and ↑FSW at both the BOA and TOA. The time series for these measurements corresponding to 16–17 June and the results obtained with GAME for the different datasets are shown in Fig. 7. AERONET surface radiative fluxes have been extensively validated at several sites around the world (e.g., García et al., 2008) and, in addition, all AERONET sun photometers are mandatorily calibrated once a year. Thus, in order to compare GAME results with AERONET data, we have performed additional simulations for the time of the closest AERONET measurement on 16 June (at 16:22 UTC), assuming that the aerosol parameterization is constant with time between the flight time and the photometer measurement. The ↓FSW values at the surface obtained with GAME are 564.8, 551.8, and 547.0 W m−2 for DS1, DS2, and DS3, respectively, close to the 531.4 W m−2 provided by AERONET. On 17 June, GAME simulations at 07:40 UTC (instead of 07:30 UTC, which is the time of the flight) provide ↓FSW at the surface of 466.3, 468.3, and 456.4 W m−2, very similar to the AERONET value of 463.7 W m−2.

Figure 7Time series of the ↑FSW at the TOA (a) and ↓FSW at the BOA (b) for the period 16–17 June. The purple dots are AERONET fluxes, and GAME output data for different inputs are represented by the blue circles (DS1), red crosses (DS2), and green crosses (DS3).
At the TOA, the ↑FSW between GAME and AERONET are in quite good agreement on both days. On 16 June, the ↑FSW values obtained with GAME simulations are equal to 152.0, 153.0, and 148.5 W m−2, and with AERONET they are equal to 146.2 W m−2. On 17 June, the obtained values with GAME are 133.6, 136.6, and 130.9 W m−2 for DS1, DS2, and DS3, and 131.6 W m−2 for AERONET.
The ARESW profiles, calculated by using Eq. (2) and GAME simulations for the three input datasets, are shown in Fig. 8, together with the simultaneous values provided by AERONET on 17 June at the BOA and TOA. Comparing the three GAME simulations, we can see that the low discrepancies in the F profiles from Fig. 6 lead to variations in the ARESW of 10 %–27 % (3–10 W m−2) over the averaged profile depending on the input dataset used. The variations in the ARESW values are tightly connected to differences in the AOD considered as input in the model, as already observed in previous studies (Sicard et al., 2014a; Lolli et al., 2018; Meloni et al., 2018). The SSA and the vertical distribution of the aerosol also plays an important role, as observed for DS3, which shows a profile that is quite different from DS2 despite the AOD being quite close for both datasets.
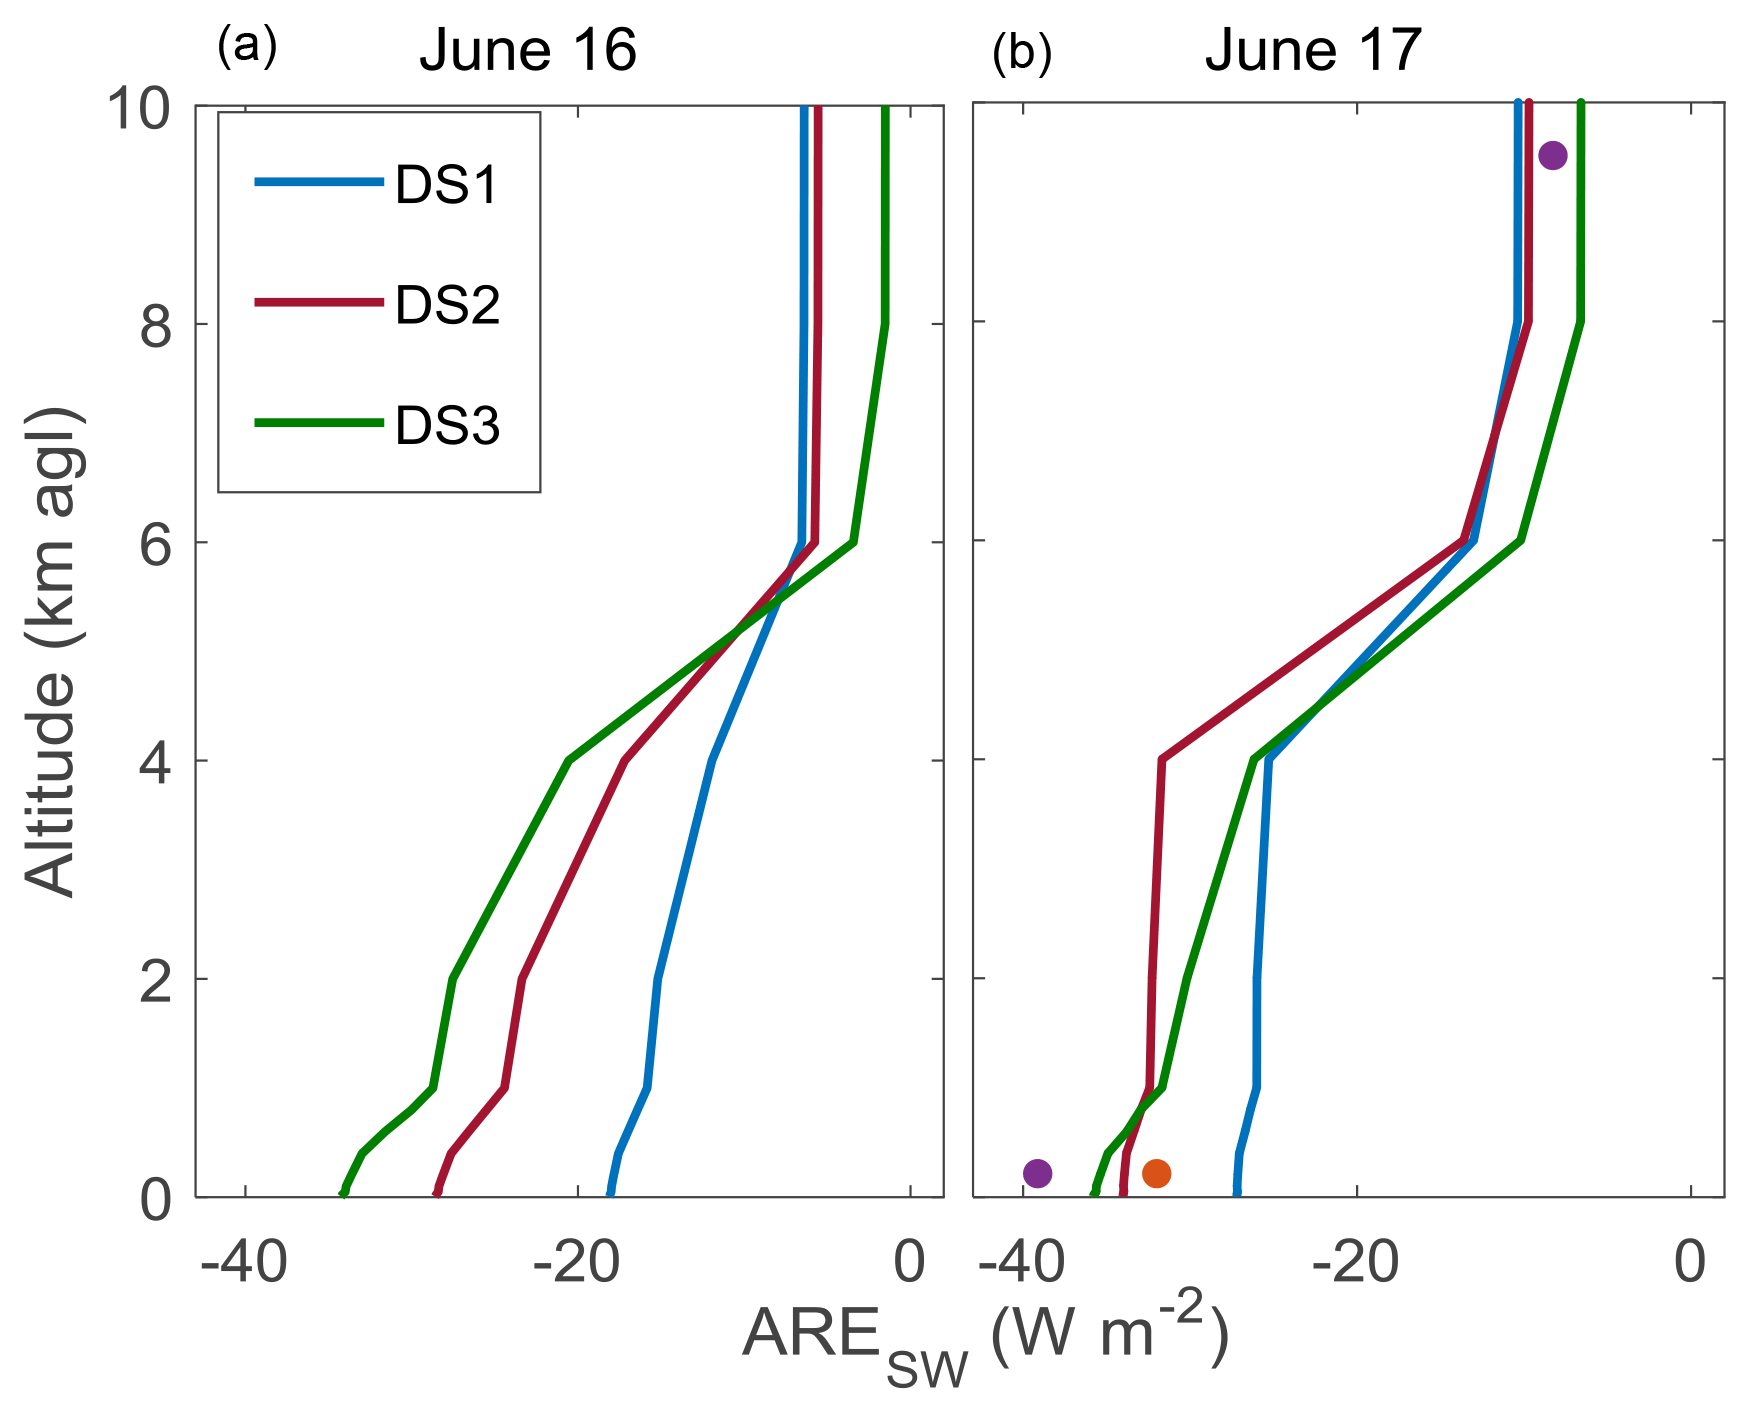
Figure 8ARE profiles in the SW spectral range simulated using DS1 (blue line), DS2 (red line), and DS3 (green line) as aerosol input data in GAME for 16 June (a) and 17 June (b). The purple dots represent the ARE provided by AERONET (AE) at the BOA and the TOA and the orange dot, the AERONET corrected for the surface albedo effect (AE-C; see text) ARE at the BOA.
Differences are also observed when comparing ARESW values obtained from GAME to those retrieved by AERONET. Contrary to GAME simulations, AERONET does not consider the vertical distribution of the aerosols when calculating the ARESW, and the definition of the ARESW at the BOA (BOAARESW) is slightly different. Indeed, AERONET BOAARESW is calculated as the difference between the downward fluxes with and without aerosols, the difference between the upward fluxes (reflected by the Earth) being neglected. Considering this, we can correct the BOAARESW provided by AERONET by multiplying by a factor 1−alb(λ). The corrected BOAARESW value on 17 June is thus −31.9 W m−2, which is within the range of values provided by GAME at the surface. All discrepancies observed here are mostly intrinsic to the different techniques used for the acquisition of the data and the retrieval algorithms. The effect of the data processing has also been observed in previous studies (Lolli et al., 2018). Moreover, the sensitivity tests performed reveal that an increase in the AOD of 0.05 can lead to a stronger effect of the ARE both at the BOA (up to 6.7 W m−2) and the TOA (up to 2.5 W m−2), and more absorbing particles (decrease in the SSA of 0.03) lead to more ARE at the BOA and less at the TOA (4 and 2 W m−2 in absolute terms, respectively). Therefore, the differences among the datasets are within the estimated uncertainty.
The ARESW values obtained at the BOA and TOA for the three datasets and the averaged value, as well as the FE, are included in Table 6. Both at the BOA and TOA, the ARESW has a cooling effect, as expected for mineral dust in this region according to values obtained in the literature (e.g., Sicard et al., 2014a; Sicard et al., 2016; Mallet et al., 2016). Differences among the three datasets lead to variations in the ARESW of up to 30 % (or 20 % for the FE), observing larger variability on 16 June. The values of the ARESW and the FESW are highly dependent on the SZA and a straightforward comparison with previous studies is not simple. Nonetheless, the values obtained for this case are within the range of previous values observed in the western Mediterranean region for similar values of SZA, e.g., FE between −263.4 and −157.1 W m−2 at the BOA and −23.8 and −86.2 W m−2 for SZA =60∘ or ARE values ranging between −93.1 and −0.5 W m−2 at the BOA and between −34.5 and +8.5 W m−2 at the TOA for different SZA values (e.g., Gómez-Amo et al., 2011; Sicard et al., 2014a, b; Barragan et al., 2017).
Table 6ARE (and FE indicated between parenthesis) at the BOA and the TOA for the SW spectral range obtained with GAME using as inputs DS1, DS2, and DS3 for 16 and 17 June 2013. The averaged values and standard deviation are also included.

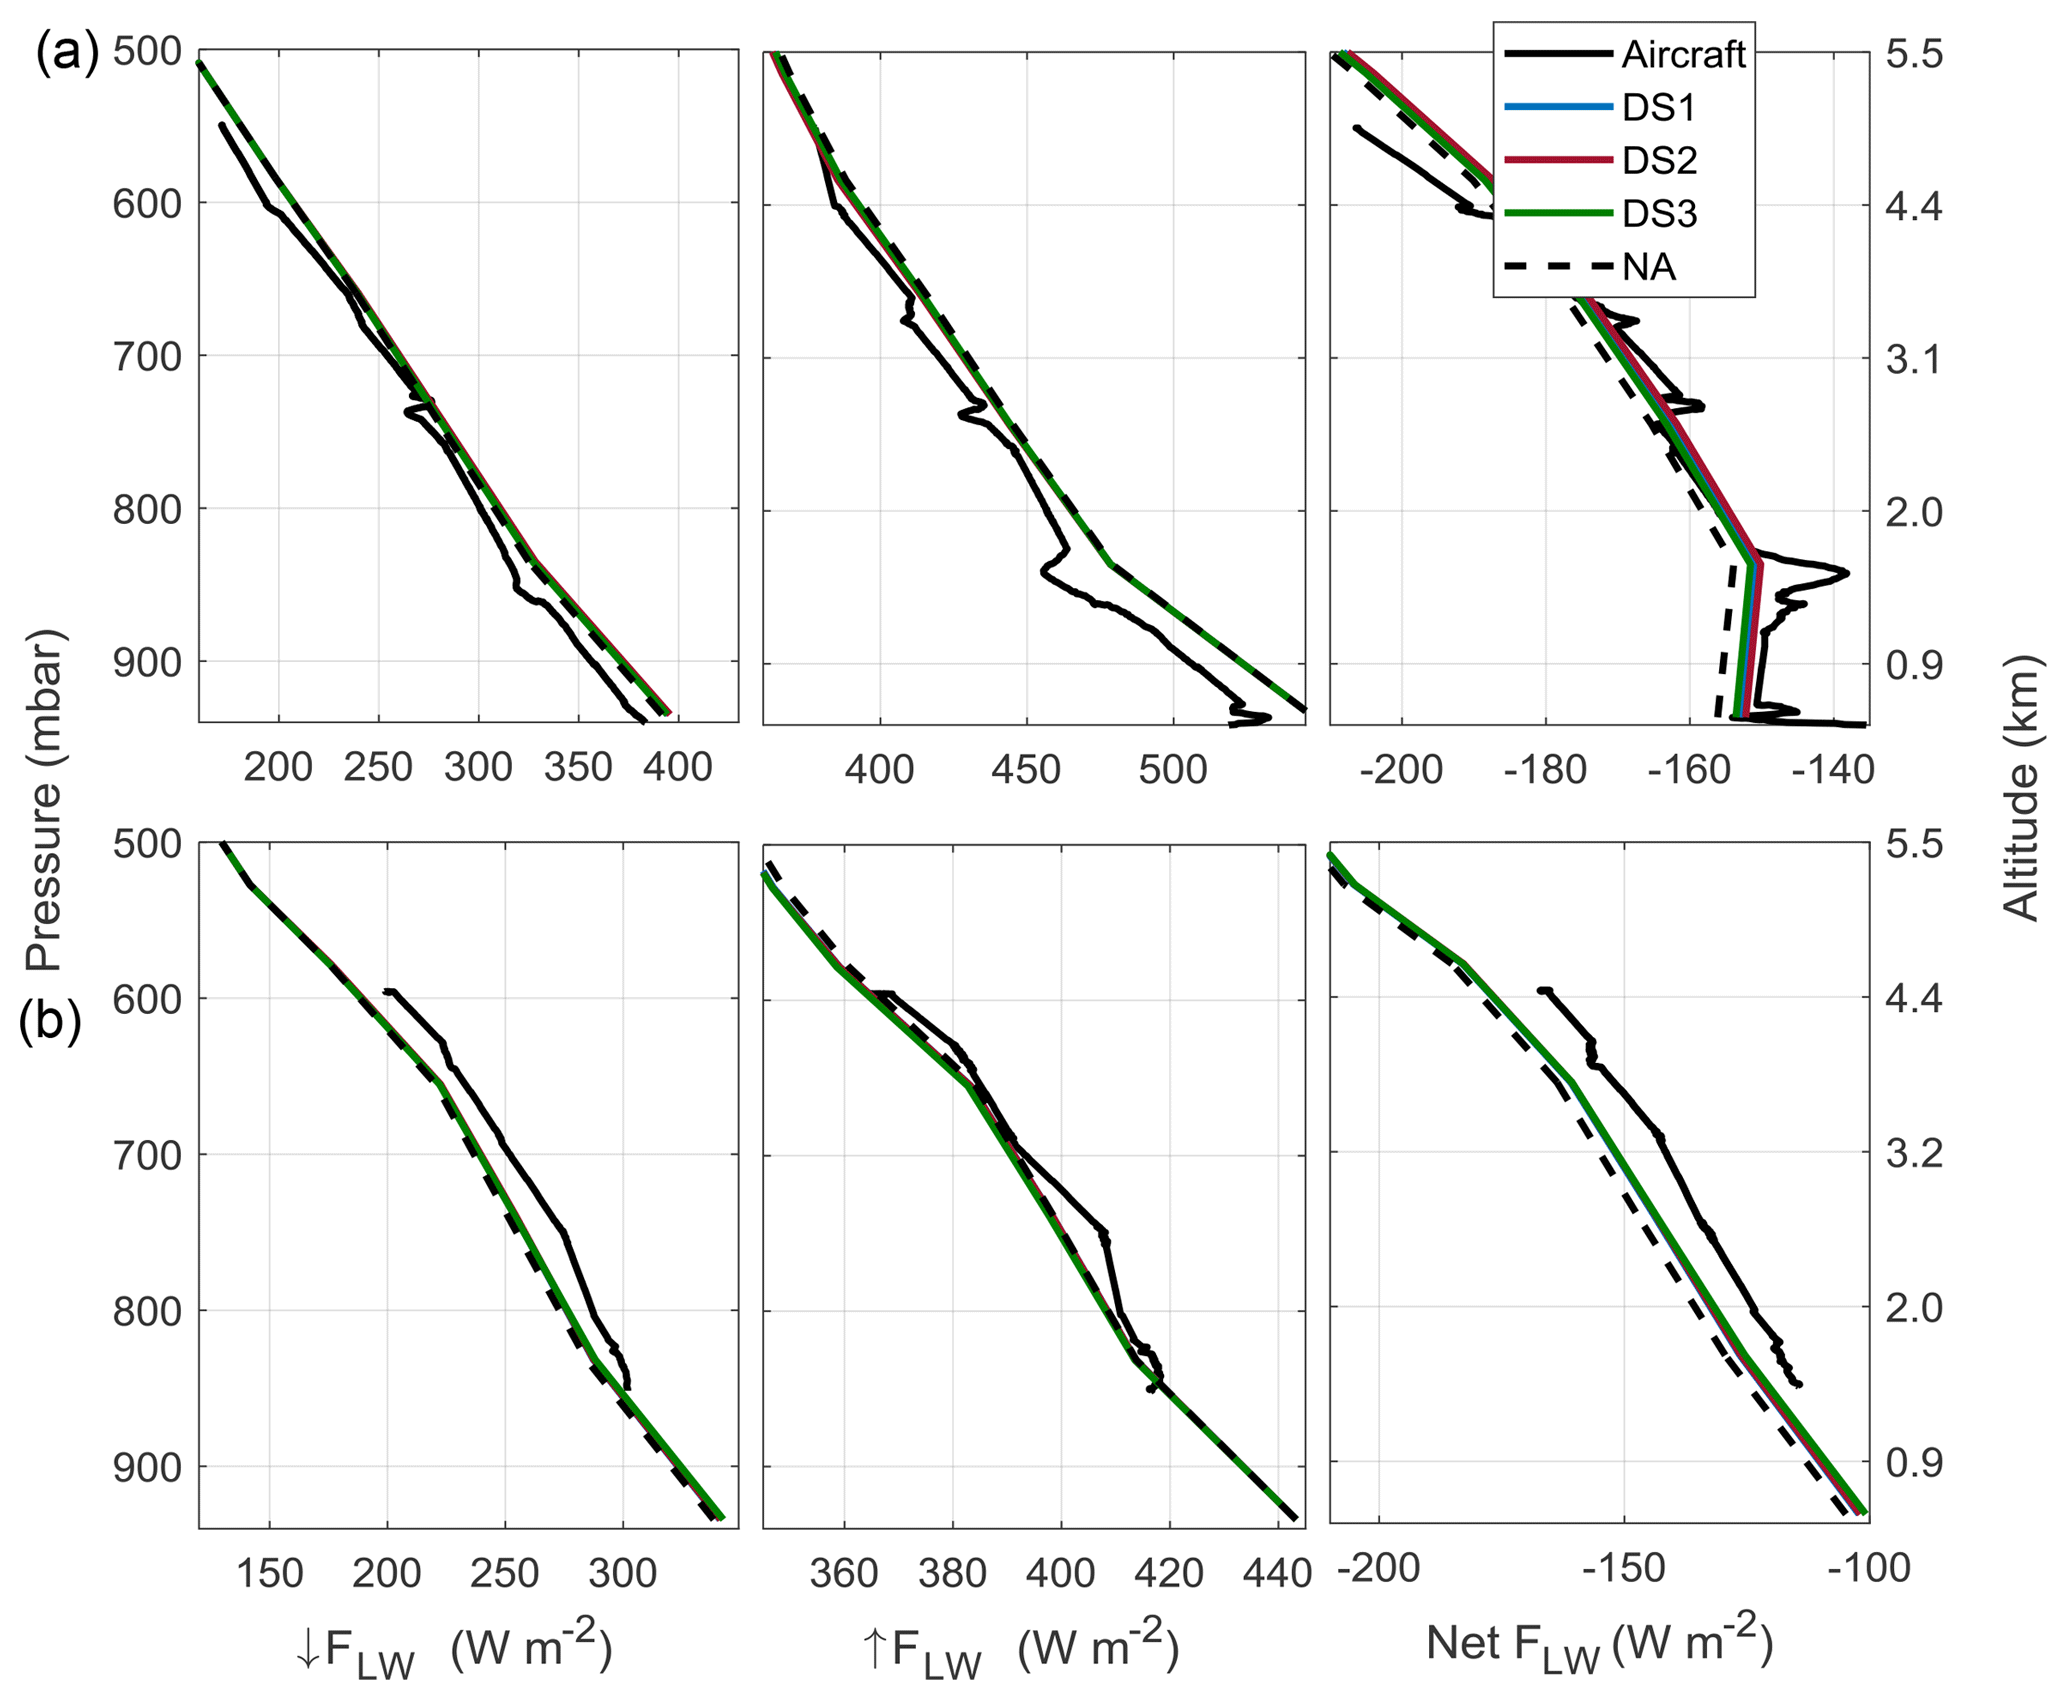
Figure 9Radiative fluxes for the LW spectral range for 16 June (a) and 17 June (b) simulated with GAME using different input aerosol datasets (DS1 in blue, DS2 in red, and DS3 in green). The black line represents the aircraft in situ measurements. The dashed black lines represent the radiative fluxes without the aerosol component (NA).
4.2 LW radiative fluxes
Figure 9 shows FLW calculated with GAME after obtaining the aerosol properties in the LW spectral range from Mie calculations for the three mentioned datasets (see Sect. 3.2.2). FLW values measured by pyrgeometers located on board the ATR are also shown.
In general, differences in the FLW are always lower than 6 % (lower than 10 W m−2 on average), with the airborne values being overestimated by the model on 16 June and underestimated on 17 June. On this latter day, larger differences are observed on the Net FLW compared to 16 June, which might be explained by the inaccurate value of LST used due to the lack of precise data. A sensitivity test performed by increasing the air surface temperature measured at the meteorological station by 5 K indicates that ↑FLW increases its value up to 30 W m−2 at the surface, and around 10 W m−2 from 1 km onwards, which is nonnegligible. This would lead to an overestimation of the aircraft measured values, but still within a 6 % difference. This highlights the need for accurate LST measurements for radiation simulations in the LW spectral range. Additionally, a sensitivity test performed by assuming a 10 % uncertainty in the PSD parameters (reff, N, and σ) leads to an estimated uncertainty in the FLW retrieved by GAME of around 1.2 W m−2. As stated before, the assumption of the refractive index can also introduce variations as large as 0.8 W m−2. Considering the uncertainty in the pyrgeometer, the fact that the aircraft and the model present different vertical resolutions and time samplings, and the uncertainties due to the use of the standard atmosphere or the parameterization of the surface properties, the obtained differences are not significant.
Table 7ARE (and FE indicated between parenthesis) at the BOA and the TOA for the LW spectral range obtained with GAME using as inputs DS1, DS2, and DS3 for 16 and 17 June 2013. The averaged values and standard deviation are also included. The last three columns include variations (Δ) in AOD, rc, and ARE at the BOA between 16 and 17 June for the three datasets.
A comparison of GAME results against the observations from the ground-based pyrgeometer at the Granada station is included in Fig. 10. At the BOA, the longwave radiation measured by the pyrgeometer is in quite good agreement with GAME calculations on 16 June, with differences within 1 W m−2. However, GAME overestimates the pyrgeometer data by 5 W m−2 (1.3 %) on 17 June. This difference on 17 June, even though larger than on 16 June, is still within the uncertainty limits.
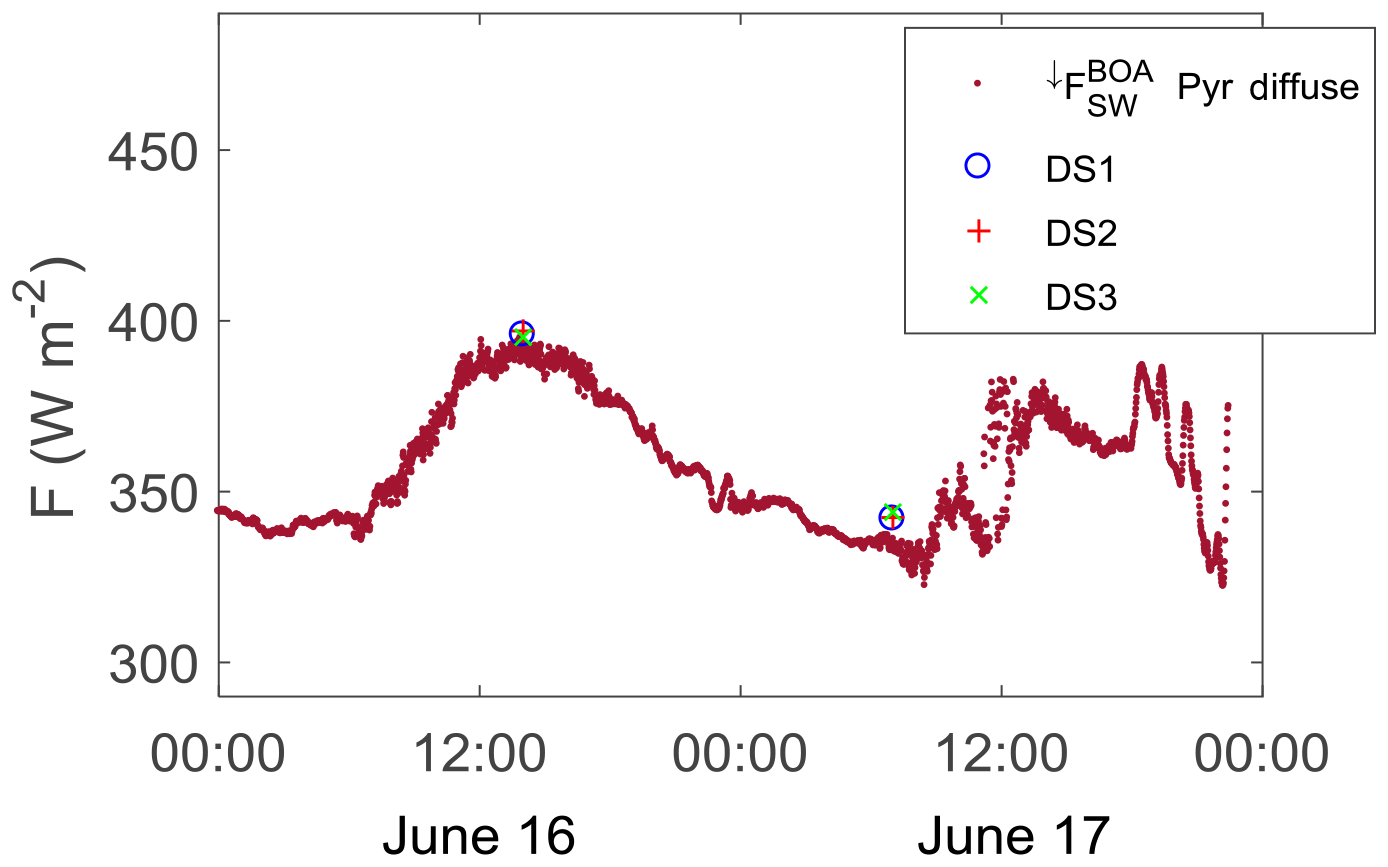
Figure 10Time series of the ↓FLW at the BOA during the period 16–17 June. Surface measurements of diffuse (red) radiation from the ground-based pyranometer at the Granada station are included. GAME output data for different inputs are represented by the blue circles (DS1), red (DS2), and green (DS3) crosses.
As for the ARELW, Fig. 11 shows the profiles obtained with GAME using the three datasets as inputs. Values at the BOA and TOA for each dataset and the average values are included in Table 7, together with the FE. Opposite to the SW, the ARELW produces a heating effect both at the BOA and TOA with positive values. The slight differences in the FLW in Fig. 9 due to the use of different aerosol input datasets lead to variations of up to 2 W m−2 in the BOAARELW (ranging from 20 % to 26 %), which needs to be considered in the interpretation of the results and reduced for a better estimate of the direct ARE. Despite this, values obtained for this dust event (3.2 W m−2 on average for both days) are in agreement with previous studies performed for mineral dust in the infrared region (Sicard et al., 2014a, b) and the FE obtained are comparable to those reported by Meloni et al. (2018). It is extremely interesting to look at the differences between the two days in terms of AOD (ΔAOD) and the effective radius for the coarse mode, reff,c, (Δreff,c) and their implication for the differences in the ARELW at the BOA (ΔBOAARELW). For DS1, ΔAOD (Δreff,c) is −0.02 (+0.18 µm), which produces a decrease in BOAARELW (ΔBOAARE W m−2). For DS2, ΔAOD (Δreff,c) is −0.04 (+0.18 µm), which produces a decrease in BOAARELW (ΔBOAARE W m−2). If we relate these variations to the sensitivity study of Sicard et al. (2014a), the expected ARELW increase due to the increase in the coarse mode radii is counterbalanced by the ARELW decrease when AOD decreases in both cases. Oppositely, for DS3 the ΔAOD (Δrc) is −0.05 (+0.64 µm), producing an increase in BOAARELW (ΔBOAARE W m−2). Here, the large increase in the coarse mode radius dominates over the AOD decrease. Sicard et al. (2014a) indeed show that the largest positive gradient of ARELW occurs for median radii ranging from 0.1 to 2.0 µm. For DS3 the increase in BOAARELW produced by a positive Δrc is larger than the decrease in BOAARELW that would have produced ΔAOD alone. At the TOA, same trends, but much less marked, are observed.
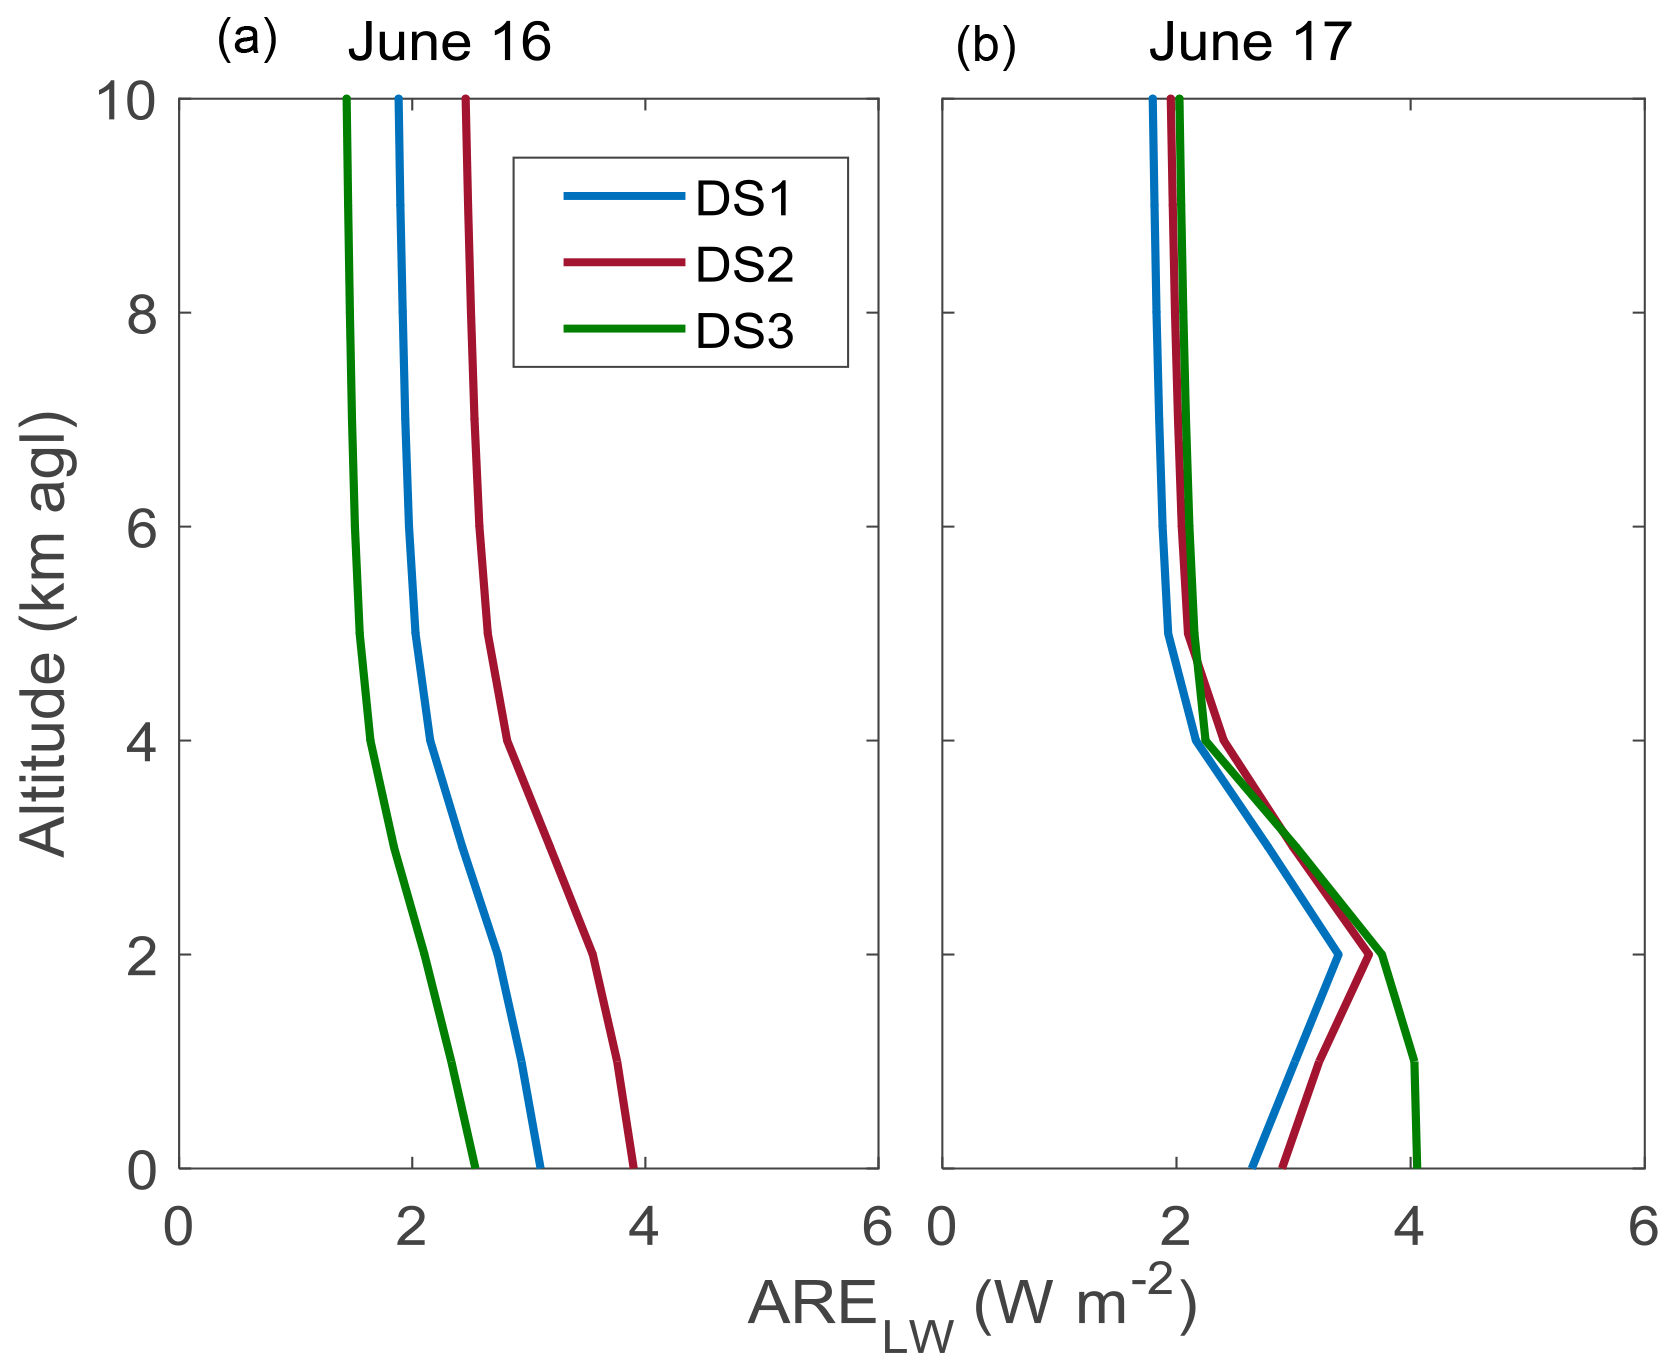
Figure 11Direct ARE profiles in the LW spectral range simulated using DS1 (blue line), DS2 (red line), and DS3 (green line) as aerosol input data in GAME for 16 June (a) and 17 June (b).
Table 8ARE (and FE indicated between parenthesis) at the BOA and the TOA for the total (SW+LW) spectral range obtained with GAME using DS1, DS2, and DS3 as inputs for 16 and 17 June 2013. The averaged values and standard deviation are also included.
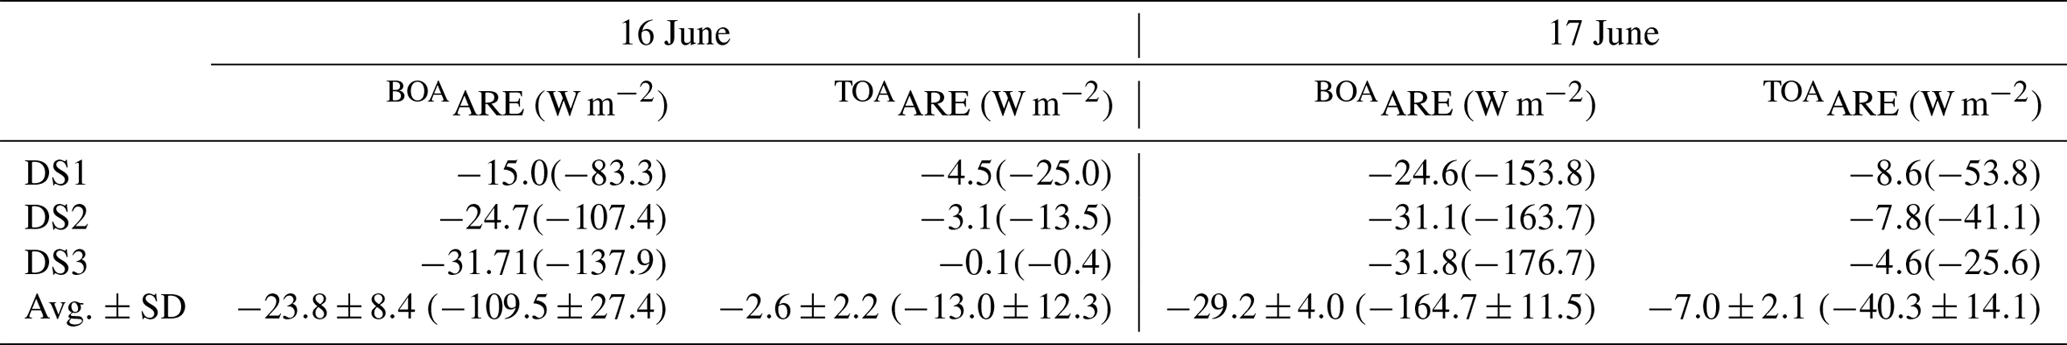
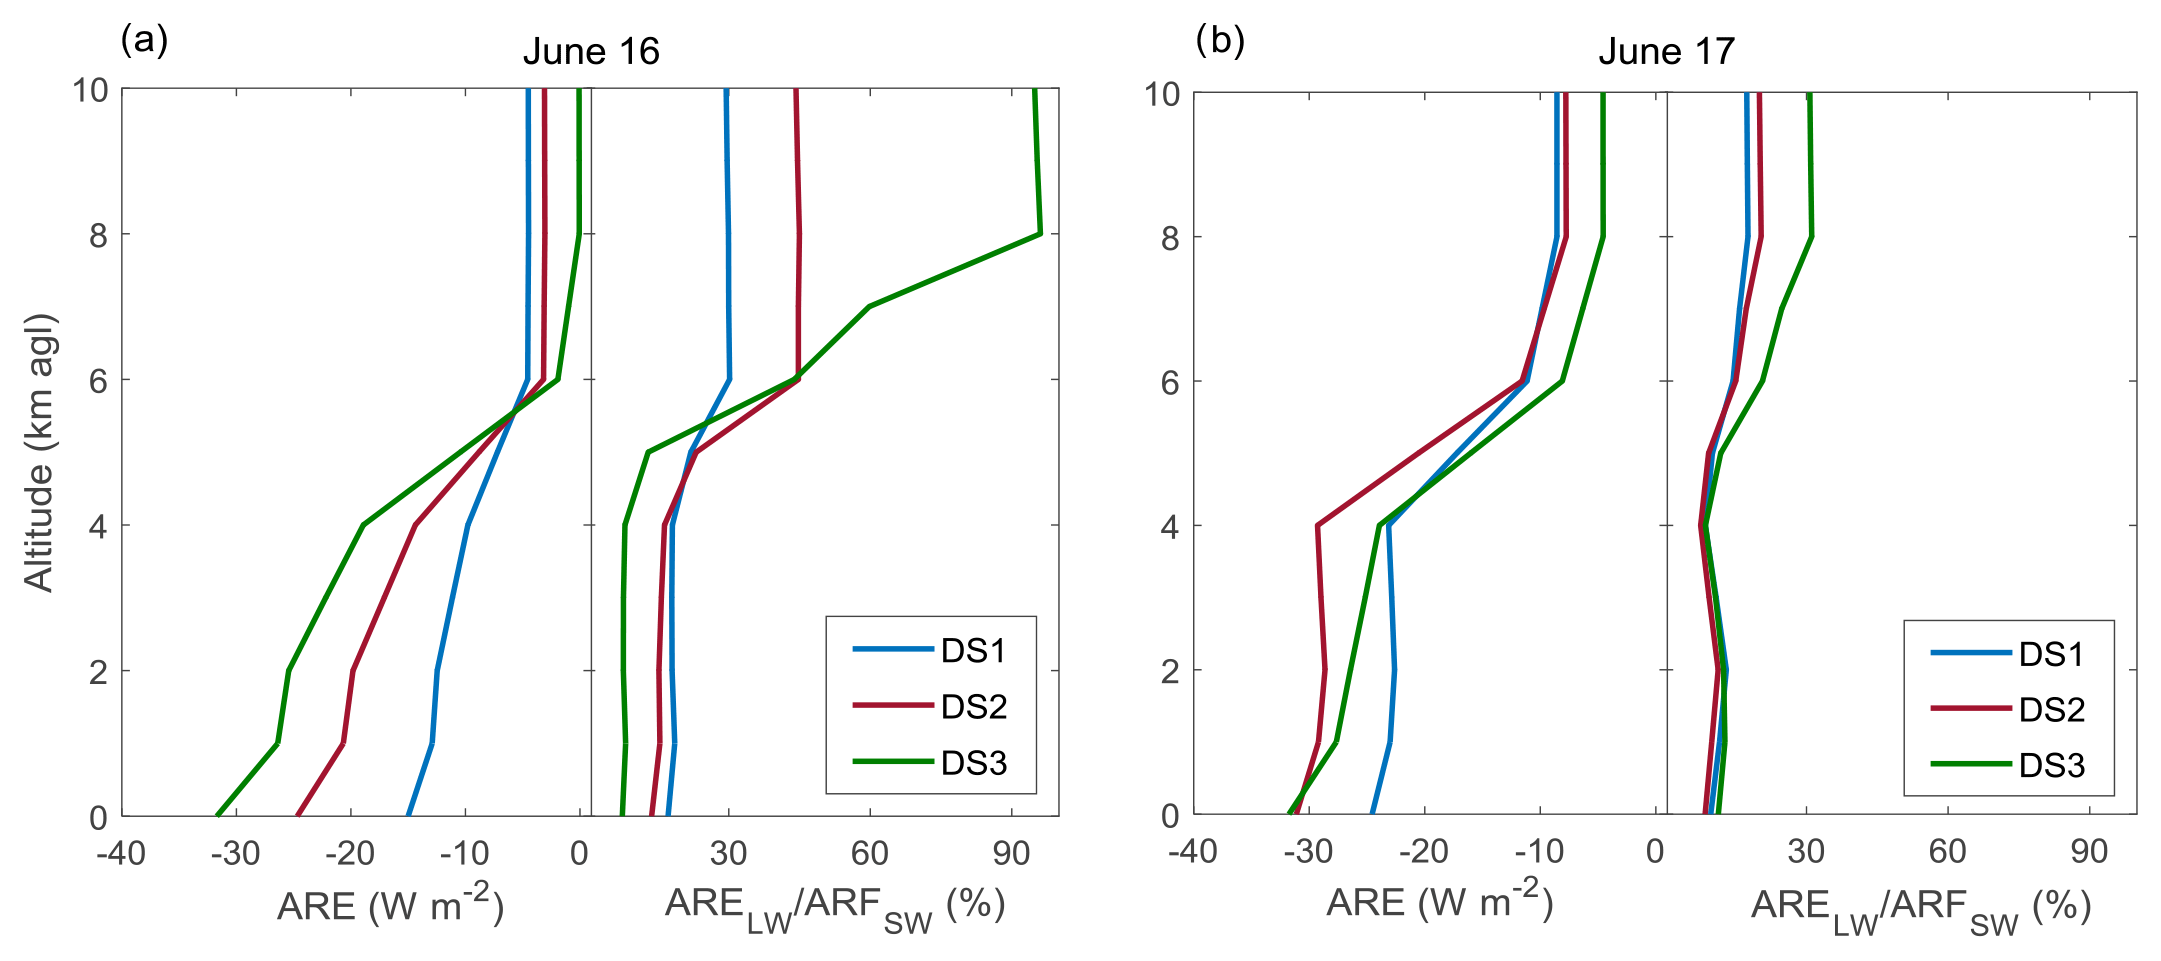
Figure 12Direct ARE for the total spectrum (a) and the ratio between the ARE LW and the ARE SW in percentage for DS1 (blue), DS2 (red), and DS3 (green) on 16 June at 14:30 UTC (a) and 17 June at 07:30 UTC (b).
4.3 Total mineral dust radiative effect
The total ARE, including both the SW and LW component, is included in Fig. 12 and Table 8. As observed, mineral dust produces a net cooling effect both at the surface and the TOA on both days. Depending on the input dataset used for the aerosol properties, values can change by up to 15 W m−2. On average, the BOAARE (BOAFE) values are () and () W m−2, and the TOAARE (TOAFE) are equal to () and () W m−2 on 16 and 17 June, respectively. These values of the FE are comparable to those reported in the literature (Di Biagio et al., 2009; Meloni et al., 2015). The total averaged ARE values are 15 % and 13 % lower than for the SW spectral range, confirming that the LW fraction cannot be neglected. The ARELW represents approximately 20 % of the ARESW near the surface (except for DS3 on 16 June), and reaches up to 50 % at higher altitudes where the total ARE is quite low (see 16 June in Fig. 12). Overall these ARELW to ARESW ratios are in agreement with those found at the BOA in previous studies for the Mediterranean region, which ranged between 9 % and 26 % (di Sarra et al., 2011; Perrone and Bergamo 2011; Sicard et al., 2014a; Meloni et al., 2015). As for the TOA, larger ratios are obtained there on 16 June, but it is worthy to note that results are not directly comparable to previous studies because of the differences in SZA and the different vertical resolution in GAME for the SW and LW components above 4 km, which may lead to numeric artifacts in the obtained results.
A moderate Saharan dust event affecting the western Mediterranean region during the ChArMEx/ADRIMED campaign on June 2013 was extensively monitored by ground-based and aircraft instrumentation above the Granada experimental site. Radiative fluxes and mineral dust ARE both in the solar and infrared spectral ranges are calculated for this event with the RTM GAME. Three different aerosol input datasets are used by the GAME RTM in order to evaluate the impact of different input data in GAME calculations.
For the SW, very low variability with the input aerosol data (less than 1 %) is observed for the radiative fluxes. The evaluation of GAME-calculated radiative fluxes against the aircraft data reveals differences between the model fluxes and the measurements below 7 %, with better agreement at altitudes above the planetary boundary layer. The differences between the retrievals with the three aerosol datasets are quite insignificant, especially taking into account the different approaches followed by the model and the pyranometers and the estimated uncertainties for both the measured data (5 W m−2) and the model (around 12 W m−2). Thus a conclusion on which input dataset provides a better performance is unlikely. The small differences between GAME radiative flux retrievals lead to variations in the ARESW of up to 33 %, mostly driven by the differences in the aerosol vertical distribution and load, followed by the SSA.
For the LW component, the effect of aerosol on the radiative properties is lower compared to the SW, but certainly nonnegligible and of opposite sign. GAME retrievals using the three aerosol datasets reveal differences in the fluxes lower than 2 W m−2 (less than 1 %). The comparison with the pyrgeometer data measured at the ATR reveals, however, differences around 7 %. The influence of the assumed CO2, O3, and the water vapor profiles and LST are needed to fully explain this discrepancy between the aircraft and the simulated profiles.
The total ARE, including both the SW and LW components, confirms that mineral dust produces a cooling effect both at the surface and the TOA, as already reported in the literature. On average, the ARELW represents 20 % of the ARESW at the surface, therefore clearly indicating that global model estimates need to consider the complete spectrum to avoid an overestimation of the mineral dust cooling effect.
Additionally, it is necessary to be aware of the effects of using different measurement techniques and processing methodologies when calculating aerosol radiative properties. Even though the differences observed here when using different aerosol datasets are slight, they still exist and a homogenization of the techniques to feed global models would be beneficial for a better estimate of the ARE and a reduced uncertainty.
Part of the data used in this publication were obtained as part of the AERONET and EARLINET networks and are publicly available. For additional data or information please contact the authors.
The supplement related to this article is available online at: https://doi.org/10.5194/acp-19-523-2019-supplement.
MJGM and MS designed the study and wrote the manuscript with contributions from all authors. MJGM, RR, JABO, CD, GB, PF, and BT provided data and performed data analysis. RB provided the initial version of the model. All authors have given approval to the final version of the manuscript.
The authors declare that they have no conflict of interest.
This article is part of the special issue “CHemistry and AeRosols Mediterranean EXperiments (ChArMEx) (ACP/AMT inter-journal SI)”. It is not associated with a conference.
This work is part of the ChArMEx project supported by CNRS-INSU, ADEME,
Météo-France, and CEA in the framework of the multidisciplinary
program MISTRALS (Mediterranean Integrated STudies at Regional And Local
Scales;
http://mistrals-home.org/, last access: 15 January 2018). Lidar
measurements were supported by the ACTRIS (Aerosols, Clouds, and Trace Gases
Research Infrastructure Network) Research Infrastructure Project funded by
the European Union's Horizon 2020 research and innovation program under grant
agreement no. 654109. The Barcelona team acknowledges the Spanish Ministry of
Economy and Competitiveness (project
TEC2015-63832-P) and EFRD (European Fund for Regional Development); the
Department of Economy and Knowledge of the Catalan autonomous government
(grant 2014 SGR 583) and the Unidad de Excelencia Maria de Maeztu (project
MDM-2016-0600) financed by the Spanish Agencia Estatal de Investigación.
The authors also thank the Spanish Ministry of Science, Innovation and
Universities (ref. CGL2017-90884-REDT). This work was also supported by the
Juan de la Cierva-Formación program (grant FJCI-2015-23904). Paola
Formenti and Cyrielle Denjean acknowledge the support of the French National
Research Agency (ANR) through the ADRIMED program (contract
ANR-11-BS56-0006). Airborne data were obtained using the aircraft managed by
SAFIRE, the French facility for airborne research, an infrastructure of the
French National Center for Scientific Research (CNRS), Météo-France
and the French National Centre for Space Studies (CNES). The authors
acknowledge the use of the GRASP inversion algorithm
(http://www.grasp-open.com, last access: 30 June 2018). The authors
also kindly acknowledge Philippe Dubuisson (Laboratoire d'Optique
Atmosphérique, Université de Lille, France) for the use of GAME model
and Rosa Delia García Cabrera for her advice during the preparation of
this manuscript.
Edited by: François Dulac
Reviewed by: three anonymous referees
Alados-Arboledas, L., Müller, D., Guerrero-Rascado, J. L., Navas-Guzmán, F., Pérez-Ramírez, D., and Olmo, F. J.: Optical and microphysical properties of fresh biomass burning aerosol retrieved by Raman lidar, and star-and sun-photometry, Geophys. Res. Lett., 38, L01807, https://doi.org/10.1029/2010GL045999, 2011.
Antón, M., Valenzuela, A., Cazorla, A., Gil, J. E., Fernández-Gálvez, J., Lyamani, H., Foyo-Moreno, I., Olmo, F. J., and Alados-Arboledas, L.: Global and diffuse shortwave irradiance during a strong desert dust episode at Granada (Spain), Atmos. Res., 118, 232–239, https://doi.org/10.1016/j.atmosres.2012.07.007, 2012.
Antón, M., Valenzuela, A., Mateos, D., Alados, I., Foyo-Moreno, I., Olmo, F. J., and Alados-Arboledas, L.: Longwave aerosol radiative effects during an extreme desert dust event in southeastern Spain, Atmos. Res., 149, 18–23, https://doi.org/10.1016/j.atmosres.2014.05.022, 2014.
Barragan, R., Sicard, M., Totems, J., Léon, J. F., Dulac, F., Mallet, M., Pelon, J., Alados-Arboledas, L., Amodeo, A., Augustin, P., Boselli, A., Bravo-Aranda, J. A., Burlizzi, P., Chazette, P., Comerón, A., D'Amico, G., Dubuisson, P., Granados-Muñoz, M. J., Leto, G., Guerrero-Rascado, J. L., Madonna, F., Mona, L., Muñoz-Porcar, C., Pappalardo, G., Perrone, M. R., Pont, V., Rocadenbosch, F., Rodriguez-Gomez, A., Scollo, S., Spinelli, N., Titos, G., Wang, X., and Sanchez, R. Z.: Spatio-temporal monitoring by ground-based and air- and space-borne lidars of a moderate Saharan dust event affecting southern Europe in June 2013 in the framework of the ADRIMED/ChArMEx campaign, Air Qual. Atmos. Hlth., 10, 261–285, https://doi.org/10.1007/s11869-016-0447-7, 2017.
Benavent-Oltra, J. A., Román, R., Granados-Muñoz, M. J., Pérez-Ramírez, D., Ortiz-Amezcua, P., Denjean, C., Lopatin, A., Lyamani, H., Torres, B., Guerrero-Rascado, J. L., Fuertes, D., Dubovik, O., Chaikovsky, A., Olmo, F. J., Mallet, M., and Alados-Arboledas, L.: Comparative assessment of GRASP algorithm for a dust event over Granada (Spain) during ChArMEx-ADRIMED 2013 campaign, Atmos. Meas. Tech., 10, 4439–4457, https://doi.org/10.5194/amt-10-4439-2017, 2017.
Boucher, O., Randall, D., Artaxo, P., Bretherton, C., Feingold, G., Forster, P., Kerminen, V., Kondo, Y., Liao, H., Lohmann, U., Rasch, P., Satheesh, S., Sherwood, S., Stevens, B., Zhang, X., Qin, D., Plattner, G., Tignor, M., Allen, S., Boschung, J., Nauels, A., Xia, Y., Bex, V., Midgley, P., Boucher, O., and Randall, D.: Clouds and Aerosols, in: Climate Change 2013 – The Physical Science Basis, 571–658, 2013.
Bravo-Aranda, J. A., Navas-Guzmán, F., Guerrero-Rascado, J. L., Pérez-Ramírez, D., Granados-Muñoz, M. J., and Alados-Arboledas, L.: Analysis of lidar depolarization calibration procedure and application to the atmospheric aerosol characterization, Int. J. Remote Sens., 34, 3543–3560, https://doi.org/10.1080/01431161.2012.716546, 2013.
Chen, C., Dubovik, O., Henze, D. K., Lapyonak, T., Chin, M., Ducos, F., Litvinov, P., Huang, X., and Li, L.: Retrieval of desert dust and carbonaceous aerosol emissions over Africa from POLDER/PARASOL products generated by the GRASP algorithm, Atmos. Chem. Phys., 18, 12551–12580, https://doi.org/10.5194/acp-18-12551-2018, 2018.
Choobari, O. A., Zawar-Reza, P., and Sturman, A.: The global distribution of mineral dust and its impacts on the climate system: A review, Atmos. Res., 138, 152–165, https://doi.org/10.1016/j.atmosres.2013.11.007, 2014.
Denjean, C., Cassola, F., Mazzino, A., Triquet, S., Chevaillier, S., Grand, N., Bourrianne, T., Momboisse, G., Sellegri, K., Schwarzenbock, A., Freney, E., Mallet, M., and Formenti, P.: Size distribution and optical properties of mineral dust aerosols transported in the western Mediterranean, Atmos. Chem. Phys., 16, 1081–1104, https://doi.org/10.5194/acp-16-1081-2016, 2016.
Di Biagio, C., di Sarra, A., Meloni, D., Monteleone, F., Piacentino, S., and Sferlazzo, D.: Measurements of Mediterranean aerosol radiative forcing and influence of the single scattering albedo, J. Geophys. Res., 114, D06211, https://doi.org/10.1029/2008JD011037, 2009.
Di Biagio, C., Formenti, P., Balkanski, Y., Caponi, L., Cazaunau, M., Pangui, E., Journet, E., Nowak, S., Caquineau, S., Andreae, M. O., Kandler, K., Saeed, T., Piketh, S., Seibert, D., Williams, E., and Doussin, J.-F.: Global scale variability of the mineral dust long-wave refractive index: a new dataset of in situ measurements for climate modeling and remote sensing, Atmos. Chem. Phys., 17, 1901–1929, https://doi.org/10.5194/acp-17-1901-2017, 2017.
di Sarra, A., Di Biagio, C., Meloni, D., Monteleone, F., Pace, G., Pugnaghi, S., and Sferlazzo, D.: Shortwave and longwave radiative effects of the intense Saharan dust event of 25–26 March 2010 at Lampedusa (Mediterranean Sea), J. Geophys. Res.-Atmos., 116, D23209, https://doi.org/10.1029/2011JD016238, 2011.
Dubovik, O. and King, M. D.: A flexible inversion algorithm for retrieval of aerosol optical properties from Sun and sky radiance measurements, J. Geophys. Res.-Atmos., 105, 20673–20696, https://doi.org/10.1029/2000JD900282, 2000.
Dubovik, O., Holben, B. N., Lapyonok, T., Sinyuk, A., Mishchenko, M. I., Yang, P., and Slutsker, I.: Non-spherical aerosol retrieval method employing light scattering by spheroids, Geophys. Res. Lett., 29, 54-1–54-4, https://doi.org/10.1029/2001GL014506, 2002.
Dubovik, O., Sinyuk, A., Lapyonok, T., Holben, B. N., Mishchenko, M., Yang, P., Eck, T. F., Volten, H., Muñoz, O., Veihelmann, B., van der Zande, W. J., Leon, J. F., Sorokin, M., and Slutsker, I.: Application of spheroid models to account for aerosol particle nonsphericity in remote sensing of desert dust, J. Geophys. Res.-Atmos., 111, D11208, https://doi.org/10.1029/2005JD006619, 2006.
Dubovik, O., Herman, M., Holdak, A., Lapyonok, T., Tanré, D., Deuzé, J. L., Ducos, F., Sinyuk, A., and Lopatin, A.: Statistically optimized inversion algorithm for enhanced retrieval of aerosol properties from spectral multi-angle polarimetric satellite observations, Atmos. Meas. Tech., 4, 975–1018, https://doi.org/10.5194/amt-4-975-2011, 2011.
Dubovik, O., Lapyonok, T., Litvinov, P., Herman, M., Fuertes, D., Ducos, F., Lopatin, A., Chaikovsky, A., Torres, B., Derimian, Y., Huang, X., Aspetsbergr, M., and Federspiel, C.: GRASP: a versatile algorithm for characterizing the atmosphere, SPIE Newsroom, 25, https://doi.org/10.1117/2.1201408.005558, 2014.
Dubuisson, P., Buriez, J. C., and Fouquart, Y.: High spectral resolution solar radiative transfer in absorbing and scattering media: Application to the satellite simulation, J. Quant. Spectrosc. Ra., 55, 103–126, https://doi.org/10.1016/0022-4073(95)00134-4, 1996.
Dubuisson, P., Dessailly, D., Vesperini, M., and Frouin, R.: Water vapor retrieval over ocean using near-infrared radiometry, J. Geophys. Res.-Atmos., 109, D19106, https://doi.org/10.1029/2004JD004516, 2004.
Dubuisson, P., Giraud, V., Chomette, O., Chepfer, H., and Pelon, J.: Fast radiative transfer modeling for infrared imaging radiometry, J. Quant. Spectrosc. Ra., 95, 201–220, https://doi.org/10.1016/j.jqsrt.2004.09.034, 2005.
Eck, T. F., Holben, B. N., Reid, J. S., Dubovik, O., Smirnov, A., O'Neill, N. T., Slutsker, I., and Kinne, S.: Wavelength dependence of the optical depth of biomass burning, urban, and desert dust aerosols, J. Geophys. Res.-Atmos., 104, 31333–31349, https://doi.org/10.1029/1999JD900923, 1999.
Espinosa, W. R., Remer, L. A., Dubovik, O., Ziemba, L., Beyersdorf, A., Orozco, D., Schuster, G., Lapyonok, T., Fuertes, D., and Martins, J. V.: Retrievals of aerosol optical and microphysical properties from Imaging Polar Nephelometer scattering measurements, Atmos. Meas. Tech., 10, 811–824, https://doi.org/10.5194/amt-10-811-2017, 2017.
Fernald, F. G.: Analysis of atmospheric lidar observations, available at: https://www.osapublishing.org/DirectPDFAccess/12641A7B-F076-A356-C26E134E8E22E7F2_27314/ao-23-5-652.pdf?da=1&id=27314&seq=0&mobile=no (last access: 26 April 2018), 1984.
Fernald, F. G., Herman, B. M., and Reagan, J. A.: Determination of Aerosol Height Distributions by Lidar, J. Appl. Meteorol., 11, 482–489, https://doi.org/10.1175/1520-0450(1972)011<0482:DOAHDB>2.0.CO;2, 1972.
Formenti, P., Schütz, L., Balkanski, Y., Desboeufs, K., Ebert, M., Kandler, K., Petzold, A., Scheuvens, D., Weinbruch, S., and Zhang, D.: Recent progress in understanding physical and chemical properties of African and Asian mineral dust, Atmos. Chem. Phys., 11, 8231–8256, https://doi.org/10.5194/acp-11-8231-2011, 2011.
Franke, K., Ansmann, A., Müller, D., Althausen, D., Wagner, F., and Scheele, R.: One-year observations of particle lidar ratio over the tropical Indian Ocean with Raman lidar, Geophys. Res. Lett., 28, 4559–4562, https://doi.org/10.1029/2001GL013671, 2001.
García, O. E., Díaz, A. M., Expósito, F. J., Díaz, J. P., Dubovik, O., Dubuisson, P., Roger, J.-C., Eck, T. F., Sinyuk, A., Derimian, Y., Dutton, E. G., Schafer, J. S., Holben, B. N., and García, C. A.: Validation of AERONET estimates of atmospheric solar fluxes and aerosol radiative forcing by groundbased broadband measurements, J. Geophys. Res., 113, D21207, https://doi.org/10.1029/2008JD010211, 2008.
Ginoux, P., Prospero, J. M., Gill, T. E., Hsu, N. C., and Zhao, M.: Global-scale attribution of anthropogenic and natural dust sources and their emission rates based on MODIS Deep Blue aerosol products, Rev. Geophys., 50, RG3005, https://doi.org/10.1029/2012RG000388, 2012.
Gkikas, A., Hatzianastassiou, N., Mihalopoulos, N., Katsoulis, V., Kazadzis, S., Pey, J., Querol, X., and Torres, O.: The regime of intense desert dust episodes in the Mediterranean based on contemporary satellite observations and ground measurements, Atmos. Chem. Phys., 13, 12135–12154, https://doi.org/10.5194/acp-13-12135-2013, 2013.
Gómez-Amo, J. L., diSarra, A., Meloni, D., Cacciani, M., and Utrillas, M. P.: Sensitivity of shortwave radiative fluxes to the vertical distribution of aerosol single scattering albedo in the presence of a desert dust layer, Atmos. Environ., 44, 2787–2791, 2010.
Gómez-Amo, J. L., Pinti, V., Di Iorio, T., di Sarra, A., Meloni, D., Becagli, S., Bellantone, V., Cacciani, M., Fuà, D., and Perrone, M. R.: The June 2007 Saharan dust event in the central Mediterranean: Observations and radiative effects in marine, urban, and sub-urban environments, Atmos. Environ., 45, 5385–5393, 2011.
Guan, H., Schmid, B., Bucholtz, A., and Bergstrom, R.: Sensitivity of shortwave radiative flux density, forcing, and heating rate to the aerosol vertical profile, J. Geophys. Res., 115, D06209, https://doi.org/10.1029/2009JD012907, 2010.
Hess, M., Koepke, P., and Schult, I.: Optical Properties of Aerosols and Clouds: The Software Package OPAC, B. Am. Meteorol. Soc., 79, 831–844, https://doi.org/10.1175/1520-0477(1998)079<0831:OPOAAC>2.0.CO;2, 1998.
Holben, B. N., Eck, T. F., Slutsker, I., Tanré, D., Buis, J. P., Setzer, A., Vermote, E., Reagan, J. A., Kaufman, Y. J., Nakajima, T., Lavenu, F., Jankowiak, I., and Smirnov, A.: AERONET – A federated instrument network and data archive for aerosol characterization, Remote Sens. Environ., 66, 1–16, https://doi.org/10.1016/S0034-4257(98)00031-5, 1998.
Israelevich, P., Ganor, E., Alpert, P., Kishcha, P., and Stupp, A.: Predominant transport paths of Saharan dust over the Mediterranean Sea to Europe, J. Geophys. Res.-Atmos., 117, D02205, https://doi.org/10.1029/2011JD016482, 2012.
Karol, Y., Tanré, D., Goloub, P., Vervaerde, C., Balois, J. Y., Blarel, L., Podvin, T., Mortier, A., and Chaikovsky, A.: Airborne sun photometer PLASMA: concept, measurements, comparison of aerosol extinction vertical profile with lidar, Atmos. Meas. Tech., 6, 2383–2389, https://doi.org/10.5194/amt-6-2383-2013, 2013.
Klett, J. D.: Stable analytical inversion solution for processing lidar returns, Appl. Optics, 20, 211–220, https://doi.org/10.1364/AO.20.000211, 1981.
Klett, J. D.: Lidar inversion with variable backscatter/extinction ratios, Appl. Optics, 24, 1638, https://doi.org/10.1364/AO.24.001638, 1985.
Kokhanovsky, A. A., Davis, A. B., Cairns, B., Dubovik, O., Hasekamp, O. P., Sano, I., Mukai, S., Rozanov, V. V., Litvinov, P., Lapyonok, T., Kolomiets, I. S., Oberemok, Y. A., Savenkov, S., Martin, W., Wasilewski, A., Di Noia, A., Stap, F. A., Rietjens, J., Xu, F., Natraj, V., Duan, M., Cheng, T., and Munro, R.: Space-based remote sensing of atmospheric aerosols: the multi-angle spectro-polarimetric frontier, Earth Sci. Rev., 145, 85–116, 2015.
Krekov, G. M.: Models of atmospheric aerosols, in: Aerosol effects on climate, edited by: Jennings, S. G., University of Arizona Press, Tucson, AZ, 9–72, 1993.
Landulfo, E., Papayannis, A., Artaxo, P., Castanho, A. D. A., de Freitas, A. Z., Souza, R. F., Vieira Junior, N. D., Jorge, M. P. M. P., Sánchez-Ccoyllo, O. R., and Moreira, D. S.: Synergetic measurements of aerosols over S~́ao Paulo, Brazil using LIDAR, sunphotometer and satellite data during the dry season, Atmos. Chem. Phys., 3, 1523–1539, https://doi.org/10.5194/acp-3-1523-2003, 2003.
Levy, R. C., Mattoo, S., Munchak, L. A., Remer, L. A., Sayer, A. M., Patadia, F., and Hsu, N. C.: The Collection 6 MODIS aerosol products over land and ocean, Atmos. Meas. Tech., 6, 2989–3034, https://doi.org/10.5194/amt-6-2989-2013, 2013.
Lolli, S., Madonna, F., Rosoldi, M., Campbell, J. R., Welton, E. J., Lewis, J. R., Gu, Y., and Pappalardo, G.: Impact of varying lidar measurement and data processing techniques in evaluating cirrus cloud and aerosol direct radiative effects, Atmos. Meas. Tech., 11, 1639–1651, https://doi.org/10.5194/amt-11-1639-2018, 2018.
Lopatin, A., Dubovik, O., Chaikovsky, A., Goloub, P., Lapyonok, T., Tanré, D., and Litvinov, P.: Enhancement of aerosol characterization using synergy of lidar and sun-photometer coincident observations: the GARRLiC algorithm, Atmos. Meas. Tech., 6, 2065–2088, https://doi.org/10.5194/amt-6-2065-2013, 2013.
Lyamani, H., Olmo, F. J., and Alados-Arboledas, L.: Saharan dust outbreak over southeastern Spain as detected by sun photometer, Atmos. Environ., 39, 7276–7284, https://doi.org/10.1016/j.atmosenv.2005.09.011, 2005.
Mallet, M., Pont, V., Liousse, C., Gomes, L., Pelon, J., Osborne, S., Haywood, J., Roger, J., Dubuisson, P., Mariscal, A., Thouret, V., and Goloub, P.: Aerosol direct radiative forcing over Djougou (northern Benin) during the African Monsoon Multidisciplinary Analysis dry season experiment (Special Observation Period-0), J. Geophys. Res., 113, D00C01, https://doi.org/10.1029/2007JD009419, 2008.
Mallet, M., Dulac, F., Formenti, P., Nabat, P., Sciare, J., Roberts, G., Pelon, J., Ancellet, G., Tanré, D., Parol, F., Denjean, C., Brogniez, G., di Sarra, A., Alados-Arboledas, L., Arndt, J., Auriol, F., Blarel, L., Bourrianne, T., Chazette, P., Chevaillier, S., Claeys, M., D'Anna, B., Derimian, Y., Desboeufs, K., Di Iorio, T., Doussin, J.-F., Durand, P., Féron, A., Freney, E., Gaimoz, C., Goloub, P., Gómez-Amo, J. L., Granados-Muñoz, M. J., Grand, N., Hamonou, E., Jankowiak, I., Jeannot, M., Léon, J.-F., Maillé, M., Mailler, S., Meloni, D., Menut, L., Momboisse, G., Nicolas, J., Podvin, T., Pont, V., Rea, G., Renard, J.-B., Roblou, L., Schepanski, K., Schwarzenboeck, A., Sellegri, K., Sicard, M., Solmon, F., Somot, S., Torres, B., Totems, J., Triquet, S., Verdier, N., Verwaerde, C., Waquet, F., Wenger, J., and Zapf, P.: Overview of the Chemistry-Aerosol Mediterranean Experiment/Aerosol Direct Radiative Forcing on the Mediterranean Climate (ChArMEx/ADRIMED) summer 2013 campaign, Atmos. Chem. Phys., 16, 455–504, https://doi.org/10.5194/acp-16-455-2016, 2016.
Markowicz, K. M., Flatau, P. J., Vogelmann, A. M., Quinn, P. K., and Welton, E. J.: Clear-sky infrared aerosol radiative forcing at the surface and the top of the atmosphere, Q. J. Roy. Meteor. Soc., 129, 2927–2947, https://doi.org/10.1256/003590003769682110, 2003.
Meloni, D., Junkermann, W., di Sarra, A., Cacciani, M., De Silvestri, L., Di Iorio, T., Estellés, V., Gómez-Amo, J. L., Pace, G., and Sferlazzo, D. M.: Altitude-resolved shortwave and longwave radiative effects of desert dust in the Mediterranean during the GAMARF campaign: Indications of a net daily cooling in the dust layer, J. Geophys. Res., 120, 3386–3407, https://doi.org/10.1002/2014JD022312, 2015.
Meloni, D., di Sarra, A., Brogniez, G., Denjean, C., De Silvestri, L., Di Iorio, T., Formenti, P., Gómez-Amo, J. L., Gröbner, J., Kouremeti, N., Liuzzi, G., Mallet, M., Pace, G., and Sferlazzo, D. M.: Determining the infrared radiative effects of Saharan dust: a radiative transfer modelling study based on vertically resolved measurements at Lampedusa, Atmos. Chem. Phys., 18, 4377–4401, https://doi.org/10.5194/acp-18-4377-2018, 2018.
Moulin, C., Lambert, C. E., Dayan, U., Masson, V, Ramonet, M., Bousquet, P., Legrand, M., Balkanski, Y. J., Guelle, W., Marticorena, B., Bergametti, G., and Dulac, F.: Satellite climatology of African dust transport in the Mediterranean atmosphere, J. Geophys. Res., 103, 13137–13144, https://doi.org/10.1029/98JD00171, 1998.
Nabat, P., Somot, S., Mallet, M., Michou, M., Sevault, F., Driouech, F., Meloni, D., di Sarra, A., Di Biagio, C., Formenti, P., Sicard, M., Léon, J.-F., and Bouin, M.-N.: Dust aerosol radiative effects during summer 2012 simulated with a coupled regional aerosol–atmosphere–ocean model over the Mediterranean, Atmos. Chem. Phys., 15, 3303–3326, https://doi.org/10.5194/acp-15-3303-2015, 2015.
Navas-Guzmán, F., Rascado, J. L. G., and Arboledas, L. A.: Retrieval of the lidar overlap function using Raman signals, Opt. Pura Apl., 44, 71–75, 2011.
Navas-Guzmán, F., Fernández-Gálvez, J., Granados-Muñoz, M. J., Guerrero-Rascado, J. L., Bravo-Aranda, J. A., and Alados-Arboledas, L.: Tropospheric water vapour and relative humidity profiles from lidar and microwave radiometry, Atmos. Meas. Tech., 7, 1201–1211, https://doi.org/10.5194/amt-7-1201-2014, 2014.
Ortiz-Amezcua, P., Guerrero-Rascado, J. L., Granados-Muñoz, M. J., Benavent-Oltra, J. A., Böckmann, C., Samaras, S., Stachlewska, I. S., Janicka, L., Baars, H., Bohlmann, S., and Alados-Arboledas, L.: Microphysical characterization of long-range transported biomass burning particles from North America at three EARLINET stations, Atmos. Chem. Phys., 17, 5931–5946, https://doi.org/10.5194/acp-17-5931-2017, 2017.
Otto, S., de Reus, M., Trautmann, T., Thomas, A., Wendisch, M., and Borrmann, S.: Atmospheric radiative effects of an in situ measured Saharan dust plume and the role of large particles, Atmos. Chem. Phys., 7, 4887–4903, https://doi.org/10.5194/acp-7-4887-2007, 2007.
Papadimas, C. D., Hatzianastassiou, N., Matsoukas, C., Kanakidou, M., Mihalopoulos, N., and Vardavas, I.: The direct effect of aerosols on solar radiation over the broader Mediterranean basin, Atmos. Chem. Phys., 12, 7165–7185, https://doi.org/10.5194/acp-12-7165-2012, 2012.
Pappalardo, G., Amodeo, A., Apituley, A., Comeron, A., Freudenthaler, V., Linné, H., Ansmann, A., Bösenberg, J., D'Amico, G., Mattis, I., Mona, L., Wandinger, U., Amiridis, V., Alados-Arboledas, L., Nicolae, D., and Wiegner, M.: EARLINET: towards an advanced sustainable European aerosol lidar network, Atmos. Meas. Tech., 7, 2389–2409, https://doi.org/10.5194/amt-7-2389-2014, 2014.
Pérez-Ramírez, D., Lyamani, H., Smirnov, A., O'Neill, N. T., Veselovskii, I., Whiteman, D. N., Olmo, F. J., and Alados-Arboledas, L.: Statistical study of day and night hourly patterns of columnar aerosol properties using sun and star photometry, in: Remote Sensing of Clouds and the Atmosphere XXI (Vol. 10001, p. 100010K), International Society for Optics and Photonics, 2016.
Peris-Ferrús, C., Gomez-Amo, J. L., Marcos, C., Freile-Aranda, M. D., Utrillas, M. P., and Martínez-Lozano, J. A.: Heating rate profiles and radiative forcing due to a dust storm in the Western Mediterranean using satellite observations, Atmos. Environ., 160, 142–153, 2017.
Perrone, M. R. and Bergamo, A.: Direct radiative forcing during Sahara dust intrusions at a site in the Central Mediterranean: Anthropogenic particle contribution, Atmos. Res., 101, 783–798, https://doi.org/10.1016/j.atmosres.2011.05.011, 2011.
Perrone, M. R., Tafuro, A. M., and Kinne, S.: Dust layer effects on the atmospheric radiative budget and heating rate profiles, Atmos. Environ., 59, 344–354, https://doi.org/10.1016/J.ATMOSENV.2012.06.012, 2012.
Renard, J.-B., Dulac, F., Durand, P., Bourgeois, Q., Denjean, C., Vignelles, D., Couté, B., Jeannot, M., Verdier, N., and Mallet, M.: In situ measurements of desert dust particles above the western Mediterranean Sea with the balloon-borne Light Optical Aerosol Counter/sizer (LOAC) during the ChArMEx campaign of summer 2013, Atmos. Chem. Phys., 18, 3677–3699, https://doi.org/10.5194/acp-18-3677-2018, 2018.
Roger, J., Mallet, M., Dubuisson, P., Cachier, H., Vermote, E., Dubovik, O., and Despiau, S.: A synergetic approach for estimating the local direct aerosol forcing: Application to an urban zone during the Expérience sur Site pour Contraindre les Modeles de Pollution et de Transport d'Emission (ESCOMPTE) experiment, J. Geophys. Res., 111, d13208, https://doi.org/10.1029/2005JD006361, 2006.
Román, R., Torres, B., Fuertes, D., Cachorro, V. E., Dubovik, O., Toledano, C., Cazorla, A., Barreto, A., Bosch, J. L., Lapyonok, T., González, R., Goloub, P., Perrone, M. R., Olmo, F. J., and Alados-Arboledas, L.: Remote sensing of lunar aureole with a sky camera: Adding infomration in the nocturnal retreival of aerosol properties with GRASP code, Remote Sens. Environ., 196, 238–252, https://doi.org/10.1016/j.rse.2017.05.013, 2017.
Román, R., Benavent-Oltra, J. A., Casquero-Vera, J. A., Lopatin, A., Cazorla, A., Lyamani, H., Denjean, C., Fuertes, D., Pérez-Ramírez, D., Torres, B., Toledano, C., Dubovik, O., Cachorro, V. E., de Frutos, A. M., Olmo, F. J., and Alados-Arboledas, L.: Retrieval of aerosol profiles combining sunphotometer and ceilometer measurements in GRASP code, Atmos. Res., 204, 161–177, https://doi.org/10.1016/j.atmosres.2018.01.021, 2018.
Saunders, R. W., Brogniez, G., Buriez, J. C., Meerkotter, R., and Wendling, P.: A comparison of measured and modeled broadband fluxes from aircraft data during the ICE '89 field experiment, J. Atmos. Ocean. Tech., 9, 391–406, https://doi.org/10.1175/1520-0426(1992)009<0391:ACOMAM>2.0.CO;2, 1992.
Shao, Y., Wyrwoll, K. H., Chappell, A., Huang, J., Lin, Z., McTainsh, G. H., Mikami, M., Tanaka, T. Y., Wang, X., and Yoon, S.: Dust cycle: An emerging core theme in Earth system science, Aeolian Res., 2, 181–204, https://doi.org/10.1016/j.aeolia.2011.02.001, 2011.
Sicard, M., Mallet, M., García-Vizcaíno, D., Comerón, A., Rocadenbosch, F., Dubuisson, P., and Muñoz-Porcar, C.: Intense dust and extremelly fresh biomass burning in Barcelona, Spain: characterization of their optical properties and estimation of their radiative forcing, Environ. Res. Lett., 7, 034016, https://doi.org/10.1088/1748-9326/7/3/034016, 2012.
Sicard, M., Bertolín, S., Mallet, M., Dubuisson, P., and Comerón, A.: Estimation of mineral dust long-wave radiative forcing: sensitivity study to particle properties and application to real cases in the region of Barcelona, Atmos. Chem. Phys., 14, 9213–9231, https://doi.org/10.5194/acp-14-9213-2014, 2014a.
Sicard, M., Bertolín, S., Muñoz, C., Rodríguez, A., Rocadenbosch, F., and Comerõn, A.: Separation of aerosol fine- and coarse-mode radiative properties: Effect on the mineral dust longwave, direct radiative forcing, Geophys. Res. Lett., 41, 6978–6985, https://doi.org/10.1002/2014GL060946, 2014b.
Sicard, M., Barragan, R., Dulac, F., Alados-Arboledas, L., and Mallet, M.: Aerosol optical, microphysical and radiative properties at regional background insular sites in the western Mediterranean, Atmos. Chem. Phys., 16, 12177–12203, https://doi.org/10.5194/acp-16-12177-2016, 2016.
Stamnes, K., Tsay, S.-C., Wiscombe, W., and Jayaweera, K.: Numerically stable algorithm for discrete-ordinate-method radiative transfer in multiple scattering and emitting layered media, Appl. Optics, 27, 2502, https://doi.org/10.1364/AO.27.002502, 1988.
Titos, G., del Águila, A., Cazorla, A., Lyamani, H., Casquero-Vera,J. A., Colombi, C., Cuccia, E., Gianelle, V., Alastuey, A., and Alados-Arboledas, L.: Spatial and temporal variability of carbonaceous aerosols: assessing the impact of biomass burning in the urban environment, Sci. Total Environ., 578, 613–625, 2017.
Torres, B., Dubovik, O., Fuertes, D., Schuster, G., Cachorro, V. E., Lapyonok, T., Goloub, P., Blarel, L., Barreto, A., Mallet, M., Toledano, C., and Tanré, D.: Advanced characterisation of aerosol size properties from measurements of spectral optical depth using the GRASP algorithm, Atmos. Meas. Tech., 10, 3743–3781, https://doi.org/10.5194/amt-10-3743-2017, 2017.
Valenzuela, A., Olmo, F. J., Lyamani, H., Antón, M., Quirantes, A., and Alados-Arboledas, L.: Aerosol radiative forcing during African desert dust events (2005–2010) over Southeastern Spain, Atmos. Chem. Phys., 12, 10331–10351, https://doi.org/10.5194/acp-12-10331-2012, 2012.
Vogelmann, A. M., Flatau, P. J., Szczodrak, M., Markowicz, K. M., and Minnett, P. J.: Observations of large aerosol infrared forcing at the surface, Geophys. Res. Lett., 30, 1655, https://doi.org/10.1029/2002GL016829, 2003.
Wan, Z.: New refinements and validation of the collection-6 MODIS land-surface temperature/emissivity product, Remote Sens. Environ., 140, 36–45, https://doi.org/10.1016/j.rse.2013.08.027, 2014.
Yang, P., Feng, Q., Hong, G., Kattawar, G. W., Wiscombe, W. J., Mishchenko, M. I., Dubovik, O., Laszlo, I., and Sokolik, I. N.: Modeling of the scattering and radiative properties of nonspherical dust-like aerosols, J. Aerosol Sci., 38, 995–1014, https://doi.org/10.1016/j.jaerosci.2007.07.001, 2007.
Zender, C. S.: Mineral Dust Entrainment and Deposition (DEAD) model: Description and 1990s dust climatology, J. Geophys. Res., 108, 4416, https://doi.org/10.1029/2002JD002775, 2003.
Zender, C. S., Miller, R. L. R. L., and Tegen, I.: Quantifying mineral dust mass budgets: Terminology, constraints, and current estimates, Eos Trans. Am. Geophys. Union, 85, 509, https://doi.org/10.1029/2004EO480002, 2004.