the Creative Commons Attribution 4.0 License.
the Creative Commons Attribution 4.0 License.
 | 16 Apr 2019
Characterization of organic aerosols from a Chinese megacity during winter: predominance of fossil fuel combustion
Md. Mozammel Haque
Kimitaka Kawamura
Dhananjay K. Deshmukh
Cao Fang
Wenhuai Song
Bao Mengying
PM2.5 aerosol samples were collected from the Chinese megacity of Nanjing (32.21∘ N, 118.73∘ E) during winter and analyzed for a total of 127 compounds from 12 organic compound classes. The most abundant classes of compounds were n-alkanes (mean concentration of 205 ng m−3), followed by fatty acids (76.3 ng m−3), polycyclic aromatic hydrocarbons (PAHs; 64.3 ng m−3), anhydrosugars (56.3 ng m−3), fatty alcohols (40.5 ng m−3) and phthalate esters (15.2 ng m−3), whereas hydroxy-/polyacids (8.33 ng m−3), aromatic acids (7.35 ng m−3), hopanes (4.19 ng m−3), primary sugars and sugar alcohols (4.15 ng m−3), lignin and resin products (2.94 ng m−3), and steranes (2.46 ng m−3) were less abundant. The carbon preference index of n-alkanes (0.83–1.38) indicated that they had a strong fossil fuel combustion origin. Diagnostic concentration ratios of organic tracers suggested that PAHs and hopanes originated mostly from coal burning and traffic emissions, respectively, in the Nanjing urban area. Positive matrix factorization analysis demonstrated that fossil fuel combustion was the major pollution source (28.7 %), followed by emissions from biomass burning (17.1 %), soil dust (14.5 %) and plastic burning (6.83 %) for Nanjing winter aerosols, although the contribution of secondary oxidation products (32.9 %) was the most abundant. Most of the compounds generally showed higher concentrations at nighttime compared with daytime; this was due to the accumulation process associated with inversion layers and the enhancement of emissions from heavy trucks at night. We conclude that fossil fuel combustion largely influences the winter organic aerosols in urban Nanjing. Based on the comparison of this study's results with previous research, we found that pollution levels in organic aerosols have decreased in the urban Nanjing atmosphere over the last decade.
- Article
(3658 KB) -
Supplement
(647 KB) - BibTeX
- EndNote


Particulate matter (PM) is comprised of a wide variety of chemical components, which are derived from a broad range of sources and processes in the atmosphere (Seinfeld and Pandis, 2006). Organic aerosol (OA) is one of the major constituents of airborne particulates, accounting for up to 70 % of the fine aerosol mass. OA can play a crucial role in the radiative forcing of the Earth and more generally in the environment (Kanakidou et al., 2005). Over the last 2 decades, more attention has been paid to identifying OA optical and cloud formation properties that link OA directly to the hydrological cycle and, in turn, to sustainability issues (Dusek et al., 2006; Riipinen et al., 2012). OA can affect the climate, air quality, human health, visibility and ecosystems on local, regional and global scales (Salma et al., 2017). Several studies have reported that OA plays an important role in both the direct and indirect aerosol forcing, affecting the Earth's radiation balance and global air quality (Cooke et al., 1999; Lohmann et al., 2000; Jacobson, 2001; Chung and Seinfeld, 2002). The addition of organic matter (OM) to aerosol particles can make the aerosol surfaces more hydrophilic or hydrophobic based on the mixing state and aerosol composition, which subsequently modifies the cloud condensation nuclei (CCN) activity of particles. Furthermore, aerosols have a particularly strong influence on air quality (in addition to human health and climate) in urban areas due to the extensive anthropogenic emissions and favorable meteorological conditions that are generally present (Watson, 2002).
There are two major sources of atmospheric aerosols: primary emissions and secondary aerosol formation. Primary organic aerosols (POAs) are directly derived from various sources such as biomass burning, fossil fuel combustion, dust particles, microbial activity and plant material, whereas secondary organic aerosols (SOAs) are formed via the oxidation of organic species in the atmosphere. Various types of volatile organic compounds (VOCs) are emitted from natural and anthropogenic sources into the atmosphere and can be further photooxidized by OH, NOx and O3 to form SOA (Haque et al., 2016). Both POA and SOA can also contribute to the organic particulate matter (PM) formation in the atmosphere, which can significantly control the physicochemical properties of aerosol particles (Kanakidou et al., 2005). An understanding of the chemical characterization and the contributions of various sources of aerosol particles is essential in order to resolve the role and potential impacts of OA in the atmosphere. Moreover, as previously stated, OA poses adverse physiological effects to human health such as asthma, bronchitis, cancer and heart disease (Pope et al., 2009; Ramírez et al., 2011).
The large emissions of atmospheric particles from China have a major effect on regional and global climate changes (Huebert et al., 2003). Atmospheric pollution in China is a serious problem due to the country's rapid industrialization and urbanization. Globally, one-fourth of anthropogenic POAs originate in China (Cooke et al., 1999). Many studies have been performed to characterize inorganic aerosols from China due to the significant anthropogenic emissions involved (Wang et al., 2011; He et al., 2012; Zheng et al., 2015; Li et al., 2017); however, OAs in Chinese megacities are still poorly understood (Guo et al., 2003; Bi et al., 2003; Yao et al., 2003).
Nanjing is a highly industrialized megacity located in eastern China, which has a population of over 8 million, and suffers from a critical air pollution problem. Previous studies such as Wang et al. (2002a, b) have reported that the aerosol mass of fine particles (<2.5 µm) in the Nanjing atmosphere is about 2–4 times higher than that recommended by United States Environmental Protection Agency (USEPA) regulations. The average concentration of PM2.5 in Nanjing aerosols during the sampling period for this study was 66±33 µg m−3, whereas the Chinese National Ambient Air Quality and WHO standard levels are 35 and 25 µg m−3, respectively (Liu et al., 2016; Shen et al., 2014); this indicates that the air quality in Nanjing is still unacceptable compared with Chinese and WHO standard levels.
The highest PM2.5 concentrations have been observed in China during winter due to the enhancement of anthropogenic emissions from fossil fuel combustion and biomass burning in addition to unfavorable meteorological conditions, i.e., the frequent development of inversion layers (Zhang and Cao, 2015). Ma et al. (2016) also reported PM2.5 concentrations in China from 2004–2013 and found that winter was the most polluted season. To better understand the molecular composition and sources of OAs in a Chinese urban area during winter, an aerosol sampling campaign was carried out on a night and day basis in the megacity of Nanjing from 11 December 2014 to 11 January 2015. The objective of this study was to determine more than 100 organic compounds including aliphatic lipids, sugar compounds, polycyclic aromatic hydrocarbons (PAHs), hopanes, lignin and resin products, aromatic acids, polyacids and steranes in the aerosol particles from Nanjing. The chemical characteristics, diurnal patterns and potential sources of these compounds are then discussed in comparison with previous studies conducted a decade ago.
2.1 Sample collection
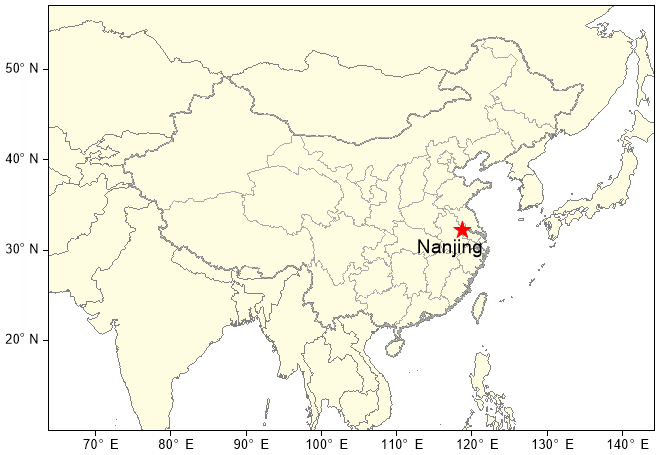
PM2.5 sampling was performed from the rooftop of a six-story building at Nanjing University of Information Science and Technology, Nanjing, China, using a medium volume sampler (Laoshan, Quingdao, China) from 11 December 2014 to 11 January 2015 (Fig. 1). Daytime and nighttime sampling was conducted from 09:30 to 21:00 LT and 21:30 to 09:00 LT, respectively. A total of 62 samples were collected on prebaked (450 ∘C for 6 h) quartz-fiber filters (80 mm) with an air flow rate of 100 L min−1. After sampling, the filter samples were wrapped with aluminum foil, transported to the laboratory and stored at −20 ∘C until the analysis.
2.2 Analysis of polar organics
Several polar organic compounds containing COOH and OH groups were analyzed by gas chromatography–mass spectrometry (GC-MS) using solvent extraction followed by a trimethylsilyl (TMS)-derivatization technique (Table S1 in the Supplement). Filter aliquots (6.28 cm2) were extracted three times with 5 mL of dichloromethane ∕ methanol mixture (2:1) under ultrasonication for 10 min. The solvent extracts were filtered through quartz wool packed in a Pasteur pipette to remove all insoluble matrixes, concentrated using a rotary evaporator under vacuum and then totally dried under a gentle nitrogen stream. The dried extracts were derivatized with 50 µL of N,O-bis-(trimethylsilyl)trifluoroacetamide (BSTFA) plus 1 % trimethylsilyl chloride and 10 µL of pyridine in a glass vial (1.5 mL) with a Teflon-lined screw cap at 70 ∘C for 3 h. The C13 n-alkane (diluted in n-hexane) was used as an internal standard (1.43 ng µ L−1) prior to injection into the GC-MS for identification. Detailed information on the chemical analysis is interpreted elsewhere (Wang and Kawamura, 2005).
The derivatives were analyzed using a Hewlett-Packard (HP) model 6890 GC coupled to a HP model 5973 mass selective detector (MSD). The sample was injected into a splitless mode with the injector temperature at 280 ∘C. The GC oven temperature was set at 50 ∘C for 2 min, increased from 50 to 120 ∘C at 30 ∘C min−1, and then increased to 300 ∘C at 6 ∘C min−1 with a final isothermal hold at 300 ∘C for 16 min. The GC separation was performed on a DB-5MS fused silica capillary column (30 m long × 0.25 mm inner diameter × 0.5 µm film thickness) with a helium carrier gas (rate 1.0 mL min−1). The mass spectrometer was conducted at 70 eV in an electron impact (EI) mode with a scan range of 50–650 Daltons (Da).
The organic components were determined by comparison with the retention times and mass spectra of authentic standards as well as literature and National Institute of Standards and Technology (NIST) library data of mass fragmentation patterns (Medeiros and Simoneit, 2008). The GC-MS relative response factor (RRF) of each compound was calculated using authentic standards and surrogate compounds. We performed a recovery experiment three times and acquired an average value of more than 80 % for target compounds. The field-blank filters (n=5) were analyzed using the same procedures as described above. The target species were not found in the blank filters. The analytical errors based on replicate analyses (n=5) were <10 %.
2.3 Analysis of nonpolar organics
Nonpolar organics, including n-alkanes, PAHs, hopanes and steranes were analyzed using a thermal desorption gas chromatography–mass spectrometry (TD-GC-MS) technique. It should be noted that higher recoveries (>90 %) were obtained for nonpolar organics using TD-GC-MS compared with the TMS-derivatization/GC-MS (<70 %) technique. The filter aliquots (3 mm diameter) were cut into two pieces, placed into a TD quartz tube (78 mm long × 4 mm inner diameter) and spiked with internal standard mixture (isotope-labeled reference compounds) for quantification. The internal standards consisted of three deuterated PAHs, e.g., Nap-d8, Ace-d10 and Phe-d10.
Thermal desorption was performed using an Agilent GC-MS system (models 7890B/5977A). A capillary column (HP-5MS UI, 5 % biphenyl ∕ 95 % dimethylsiloxane, 30 m long × 0.25 mm inner diameter × 0.25 µm film thickness) was used to separate the target compounds. The GC oven temperature was programmed from 35 ∘C (3 min) to 120 ∘C at 10 ∘C min−1, ramped from 120 to 146 ∘C at 4 ∘C min−1 and continued to 310 ∘C at 8 ∘C min−1, where it was then held at 310 ∘C for 16 min. The sample on the filter punch was inserted into the TD tube at the initial temperature of 35 ∘C before running and was manually increased up to 300 ∘C at 12 ∘C s−1 after the analysis began. The column flow rate was 2 mL min−1 and the split flow was 10 mL min−1 for the first 3 min, after which the column and split flow rate were then changed to 1 and 25 mL min−1, respectively. The electron ionization mass spectra (70 eV) were conducted in a scan mode range of 50–650 Da. The temperatures of the ion source, quadruples and transfer line were set to 310, 150 and 310 ∘C, respectively.
2.4 Carbonaceous component analysis
Organic carbon (OC) and elemental carbon (EC) were measured using a Sunset Laboratory carbon analyzer following the IMPROVE (Interagency Monitoring of Protected Visual Environments) thermal–optical evolution protocol and assuming carbonate carbon to be insignificant in the sample (Boreddy et al., 2018). An area of 1.54 cm2 of each quartz filter sample was inserted into a quartz boat inside the thermal desorption chamber of the analyzer, and then stepwise heating was performed.
A filter cut of 3.14 cm2 of each sample was extracted with 20 mL organic-free ultrapure water (resistivity >18.2 MΩ cm, Sartorius arium 611 UV) under ultrasonication for 30 min. The water extracts were then passed through a membrane disc filter to remove the insoluble filter matrixes and were analyzed for water-soluble organic carbon (WSOC) using a total organic carbon (TOC) analyzer (Shimadzu, TOC-Vcsh) (Boreddy et al., 2018). The analytical errors in the triplicate analyses were within 5 % for all carbonaceous components, and the concentrations reported here were corrected using the field blanks.
2.5 Major inorganic ion analysis
An area of 5.07 cm2 of each quartz filter sample was extracted with 10.0 mL ultrapure water (>18.2 Ω) under ultrasonication (30 min). The extract solution was filtered through a membrane disc filter (Millex-GV, Millipore) with a 0.22 µm pore size to remove insoluble materials and then analyzed for inorganic ions using ion chromatography on a Thermo Fisher Scientific ICS-5000 (USA) equipped with a gradient pump (SP), a conductivity detector/chromatography compartment (DC) and an automated sampler (AS-DV). The cations were measured by an IonPac CS12A analytical column and an IonPac CG12A guard column with an eluent of aqueous methanesulfonic acid (MSA, 30 mM L−1) and a flow rate of 1 mL min−1. In contrast, anions were separated on an IonPac AS11-HC analytical column and an IonPac AG11-HC guard column with an eluent of sodium hydroxide (NaOH) gradient at a flow rate of 1.5 mL min−1 (0–3 min, 0.5 mM L−1; 3–5 min, 0.5–5 mM L−1; 5–15 min, 5–30 mM L−1; 15–20 min 0.5 mM L−1).
3.1 Diurnal variations and meteorological conditions
No significant difference was observed between day and night for organic compounds in winter aerosols from the Nanjing urban area (Fig. 2, Tables 1 and S1). Nevertheless, concentrations of organic compounds at nighttime were slightly higher than during the day in most cases. It is notable that the planetary boundary layer height (PBLH) is generally lower at nighttime than during the day, causing higher concentrations of aerosol particles at night. Interestingly, we found high loadings of organics in a daytime sample collected on 15 December when the PBLH was high (632 m), whereas lower levels of organics were observed at nighttime on 14 December (PBLH =82.2 m) (Figs. 3 and S1b in the Supplement).

Figure 2Concentrations of organic compound classes detected in the Nanjing aerosols. PAHs refers to polycyclic aromatic hydrocarbons. The inset panel represents the corresponding compounds for which the concentrations are low.
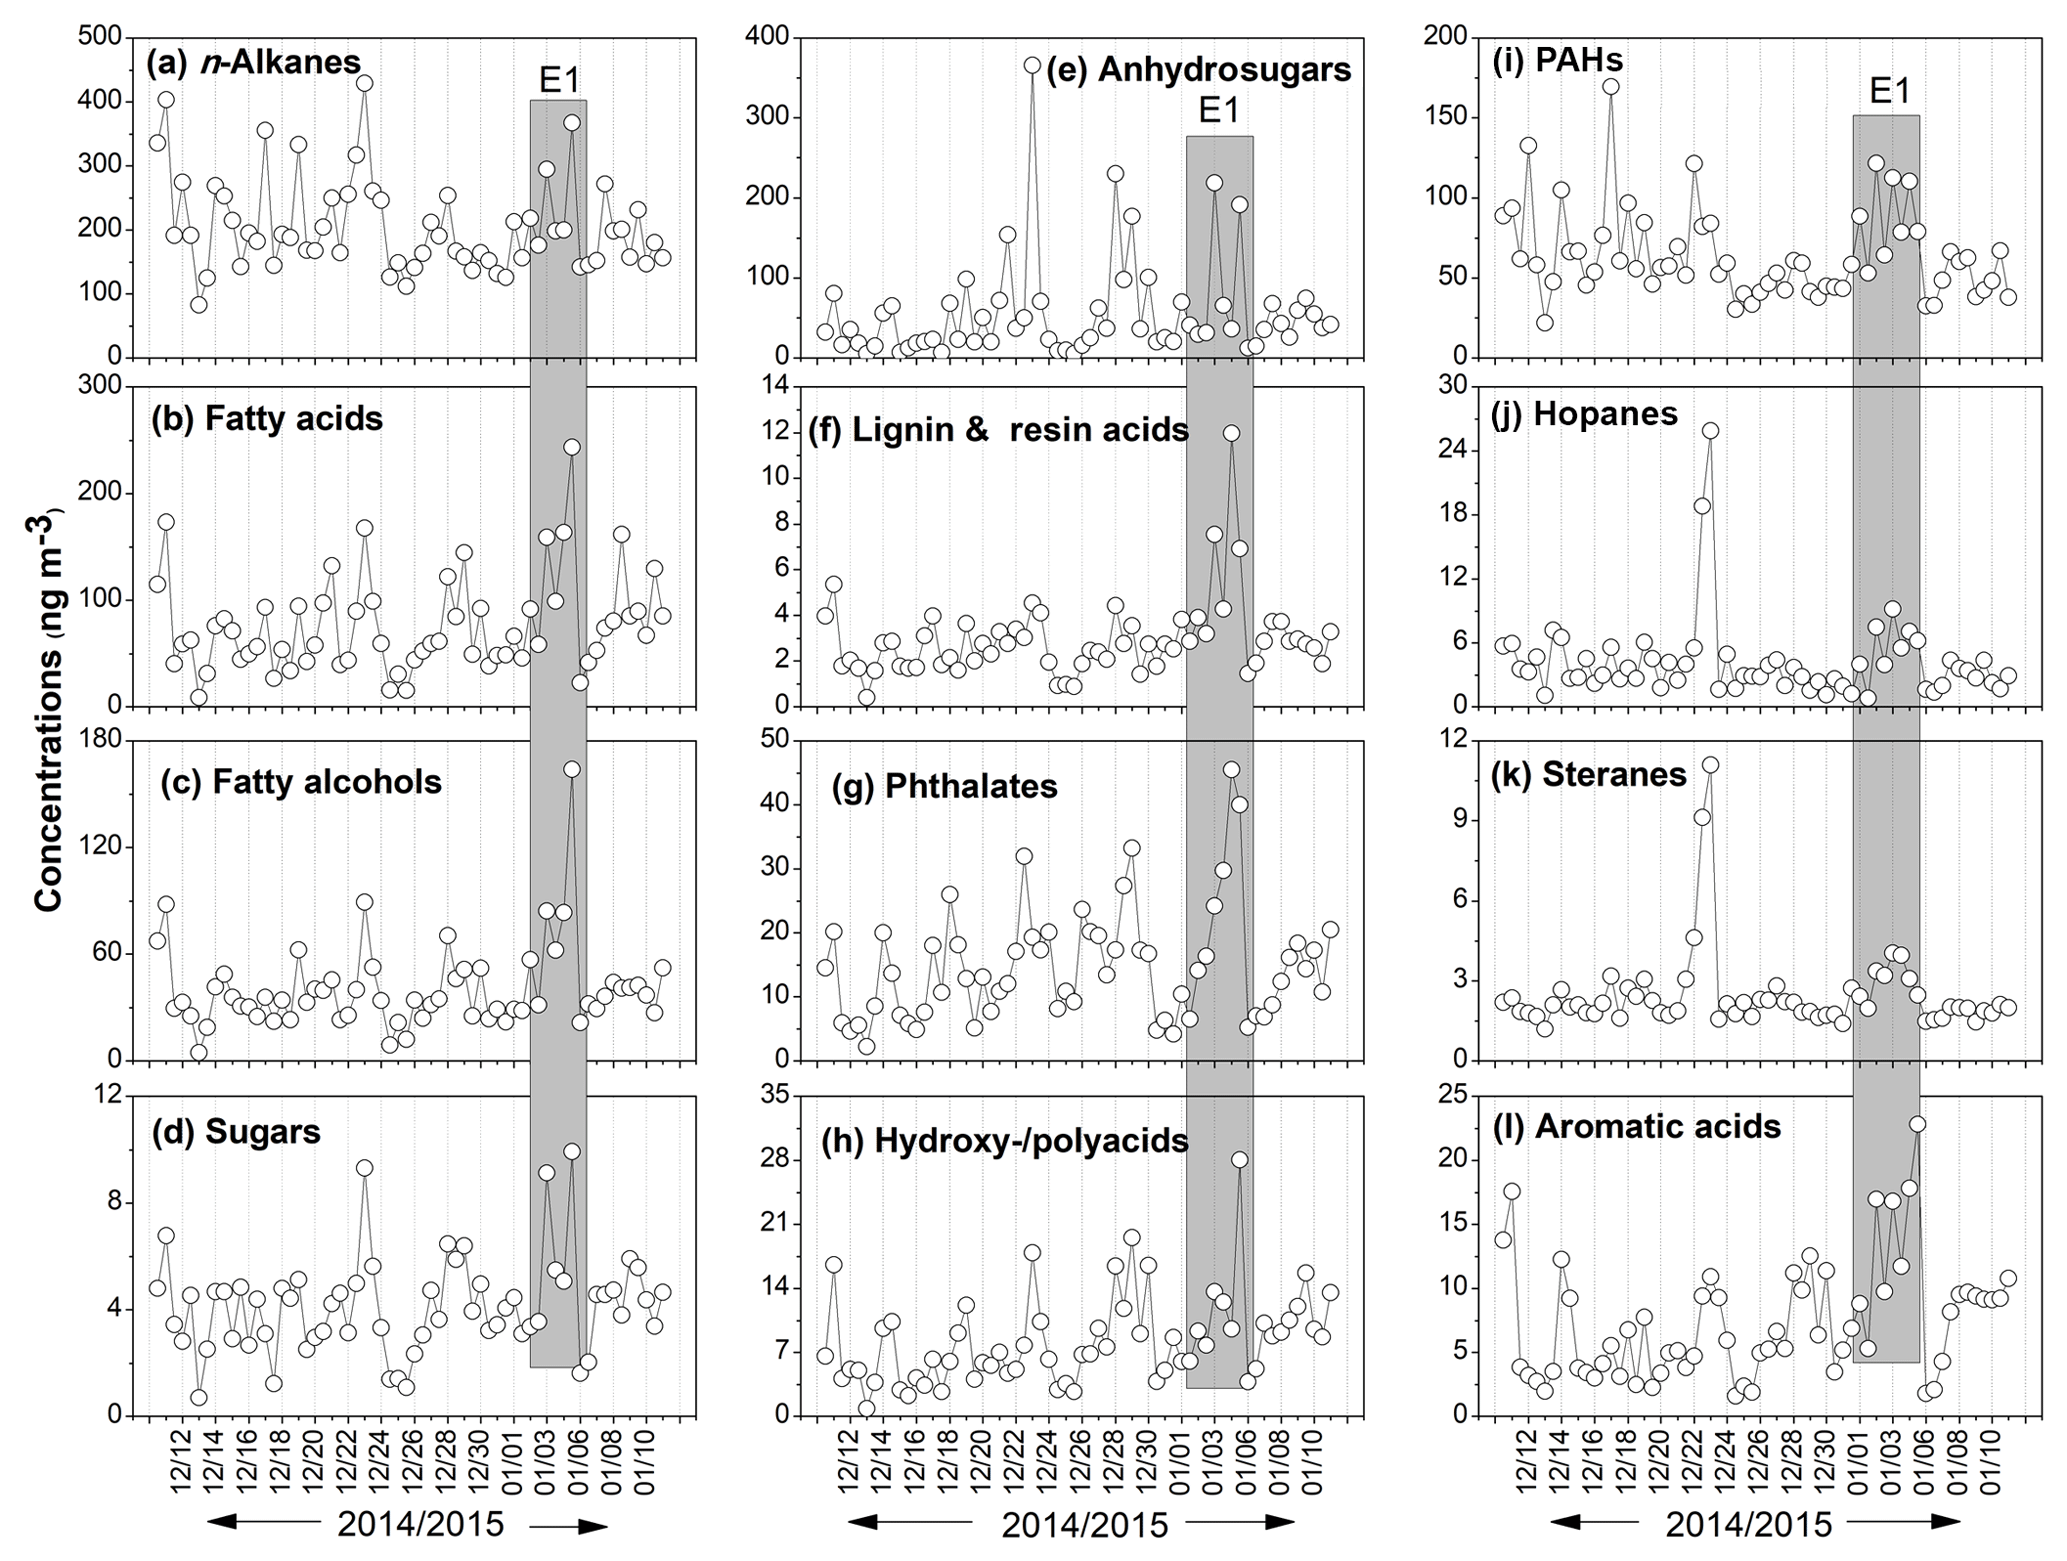
Figure 3Temporal variations in the concentrations of organic compound classes detected in the Nanjing urban aerosols.
We observed one episode (E1) from 2 to 5 January, during which PM2.5 and all organic compounds showed similar temporal variations with high loadings (Fig. 3). Notably, NO2 showed high concentration during E1, whereas relative humidity (RH) and ozone (O3) levels were not high (Fig. S1). Our results suggest that NO2 influences the organic molecular compositions in urban aerosols. It is noteworthy that the major source of NO2 is vehicular exhaust (Kendrick et al., 2015); however, coal combustion can also emit NOx into the atmosphere (Chang et al., 2018). Previous studies have also reported that NOx could affect SOA formation (Kanakidou et al., 2005; Zhang et al., 2015; Mochizuki et al., 2015). Moreover, PAHs, hopanes and steranes showed another episode on 23 and 24 December 2014, most likely due to a coal combustion event. It should be noted that higher RH (81–88 %) and PM2.5 levels (152–226 µg m−3) caused a reduction in visibility on 29 December (1.7 km), 10 January (1.8 km) and 11 January (1.6 km), which might have been due to haze formation. It is remarkable that the levels of organics were not high during these periods (Figs. 3 and S1). These results imply that NO2 derived from fossil fuel combustion plays an important role in the formation of OAs in the atmosphere in Nanjing.
3.2 Carbonaceous components
The results of the OC, EC and WSOC analyses are shown in Table 1. The respective values of OC and EC were found to be 8.76–40.0 µg m−3 (mean 18.6 µg m−3) and 2.41–30.3 µg m−3 (mean 8.25 µg m−3) at daytime, and 2.98–40.1 µg m−3 (mean 19.1 µg m−3) and 0.87–22.9 µg m−3 (mean 8.86 µg m−3) at nighttime. We found that the day and night variations of OC and EC were not significant. The mass ratio of OC to EC (OC∕EC) is often used to characterize fossil fuel and biomass burning emissions. Several investigators have used OC∕EC ratios to classify the sources of carbonaceous aerosols (Ram et al., 2008; Sandradewi et al., 2008; Saarikoski et al., 2008). A higher OC∕EC ratio implies that the major source of carbonaceous species is biomass burning, whereas lower ratios are characteristic of emissions from fossil fuel combustion. Sandradewi et al. (2008) documented an average OC∕EC ratio of 1.1 for vehicular emissions and 7.3 for wood burning emissions. Saarikoski et al. (2008) reported OC∕EC ratios of 0.71 for vehicular emissions and 6.6 for biomass burning. Furthermore, Watson et al. (2001) proposed OC∕EC ratios of 1.1 for vehicular emissions, 2.7 for coal combustion and 9.0 for biomass burning emissions. The OC∕EC ratios in this study ranged from 1.30 to 3.80 with a mean value of 2.40, which is comparable to the abovementioned values for coal combustion and vehicular emissions. These results suggest that fossil fuel combustion is the major source of carbonaceous aerosols in urban Nanjing.
Table 1Mean concentrations of identified organic compound classes (ng m−3) and carbonaceous components (µg m−3) in the atmospheric aerosol samples (PM2.5) from Nanjing, China.
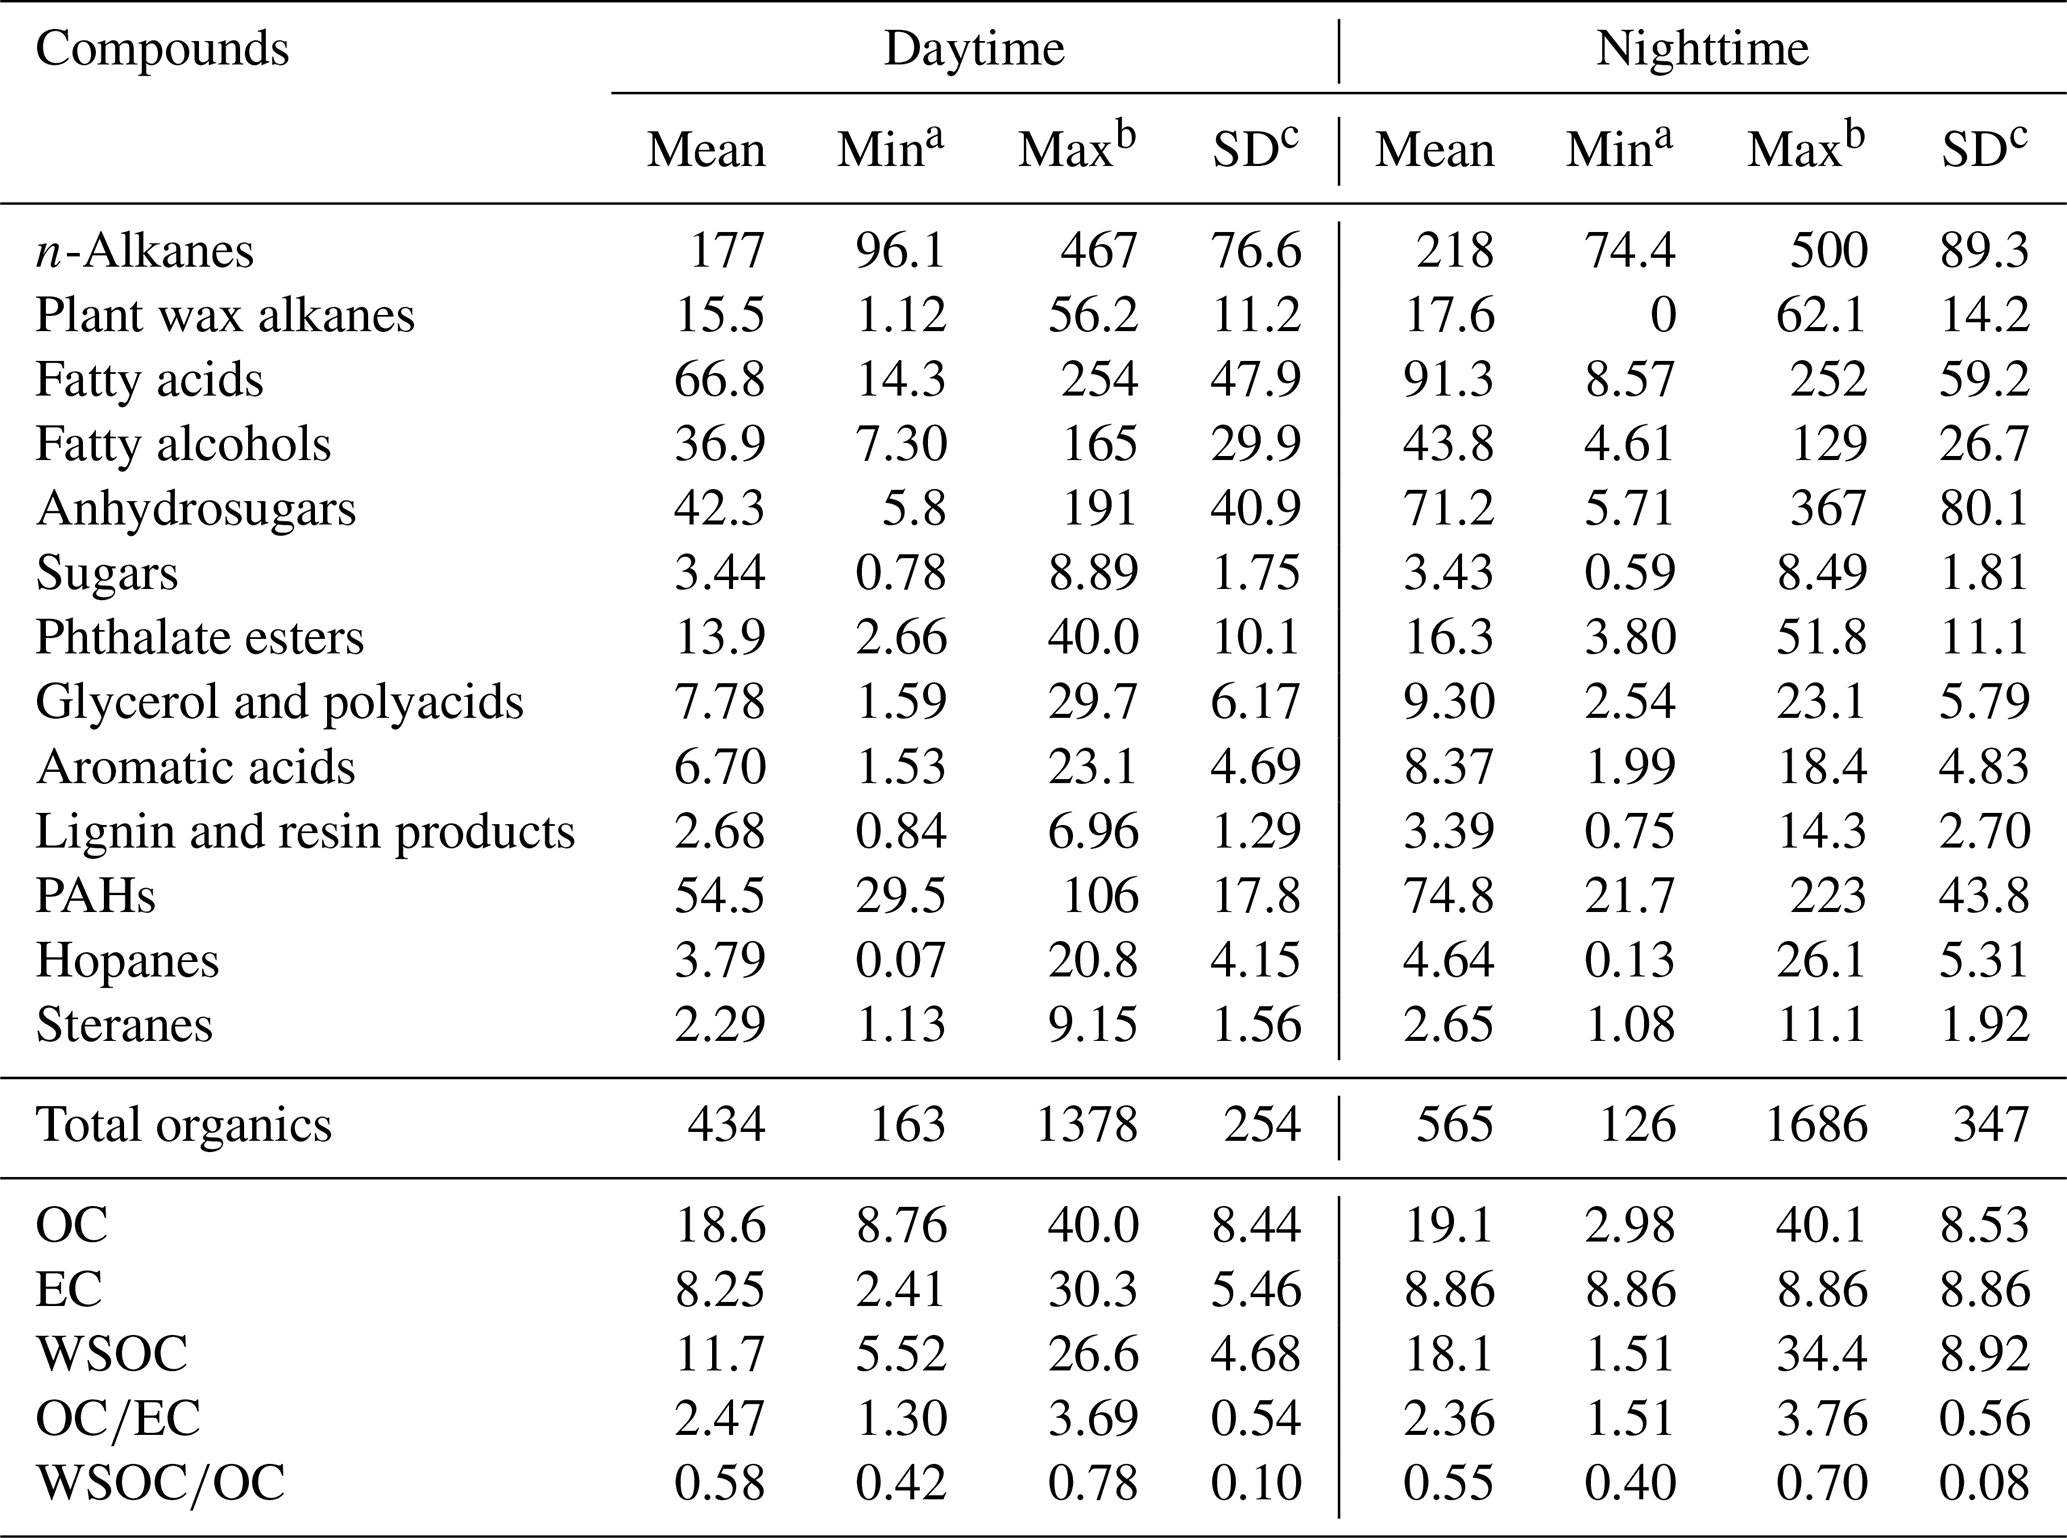
a Minimum. b Maximum. c Standard deviation. (OC refers to organic carbon, EC refers to elemental carbon and WSOC refers to water-soluble organic carbon.)
OC∕EC ratios are also used to differentiate the relative contribution of primary vs. secondary sources: high OC∕EC ratios (>2.0) have been reported for aerosols with significant SOA contributions (Kunwar and Kawamura, 2014; Pani et al., 2017). The OC∕EC ratio in this study was 2.40 on average, suggesting the significant contribution of SOA in Nanjing aerosols, which is consistent with positive matrix factorization (PMF) results (see Sect. 3.4). The concentration range of WSOC was 5.52–26.6 µg m−3 (mean 11.7 µg m−3) at daytime and 2.51–20.2 µg m−3 (mean 11.8 µg m−3) at night. The WSOC∕OC ratio is often used to discuss SOA formation via the photochemical aging of atmospheric aerosol particles. WSOC∕OC ratios exceeding 0.4 indicate aged aerosols with a significant contribution from SOA (Boreddy et al., 2018). The average WSOC∕OC ratio of 0.64 in the present study indicated that OAs in Nanjing were relatively aged. Moreover, air mass back trajectories also indicated that some air masses originated from polluted regions over North China, suggesting SOA formation during long-range transport (Fig. S5).
3.3 Organic molecular compositions
We detected 12 organic compound classes, including sugars, lignin and resin acids, fatty acids, fatty alcohols, n-alkanes, PAHs, hopanes, steranes, glycerol and polyacids, phthalate esters, and aromatic acids in the aerosol samples from Nanjing. The total concentrations of organics were 424 ng m−3 at daytime and 555 ng m−3 at nighttime on average with the predominance of n-alkanes followed by fatty acids, PAHs, anhydrosugars, fatty alcohols, phthalate esters, glycerol and polyacids, aromatic acids, sugars, hopanes, lignin and resin acids, and steranes (Fig. 2). Table S1 shows the values of the identified organic compounds. Levoglucosan was the dominant species followed by C16 and C24 fatty acids, and C29 n-alkane (Table S1).
3.3.1 Aliphatic lipid components
The lipid compounds, e.g., fatty acids, fatty alcohols and n-alkanes mainly originate from marine or microbial detritus, terrestrial higher plant waxes and fossil fuel combustion. Homologues of n-alkanes (C13–C39) were detected at higher concentrations at nighttime (74.8–535 ng m−3, mean value of 228 ng m−3) than during daytime (97.6–497 ng m−3, mean value of 184 ng m−3) with a maximum at C29 (14.0 ng m−3 during daytime and 17.9 ng m−3 during nighttime) in Nanjing aerosols (Tables 1 and S1, Fig. 4a). These concentrations are comparable to those reported from urban cities in Hong Kong (195 ng m−3) and Shanghai (259 ng m−3) (Wang et al., 2006), but much higher than the western North Pacific region (0.11–14.1 ng m−3; Kawamura et al., 2003). Concentration levels of n-alkanes in this study are not significantly different from previous studies in Nanjing (112–265 ng m−3, mean value of 172 ng m−3 during daytime; 61.0–503 ng m−3 and a mean value of 278 ng m−3 at nighttime; Table 2; Wang and Kawamura, 2005).
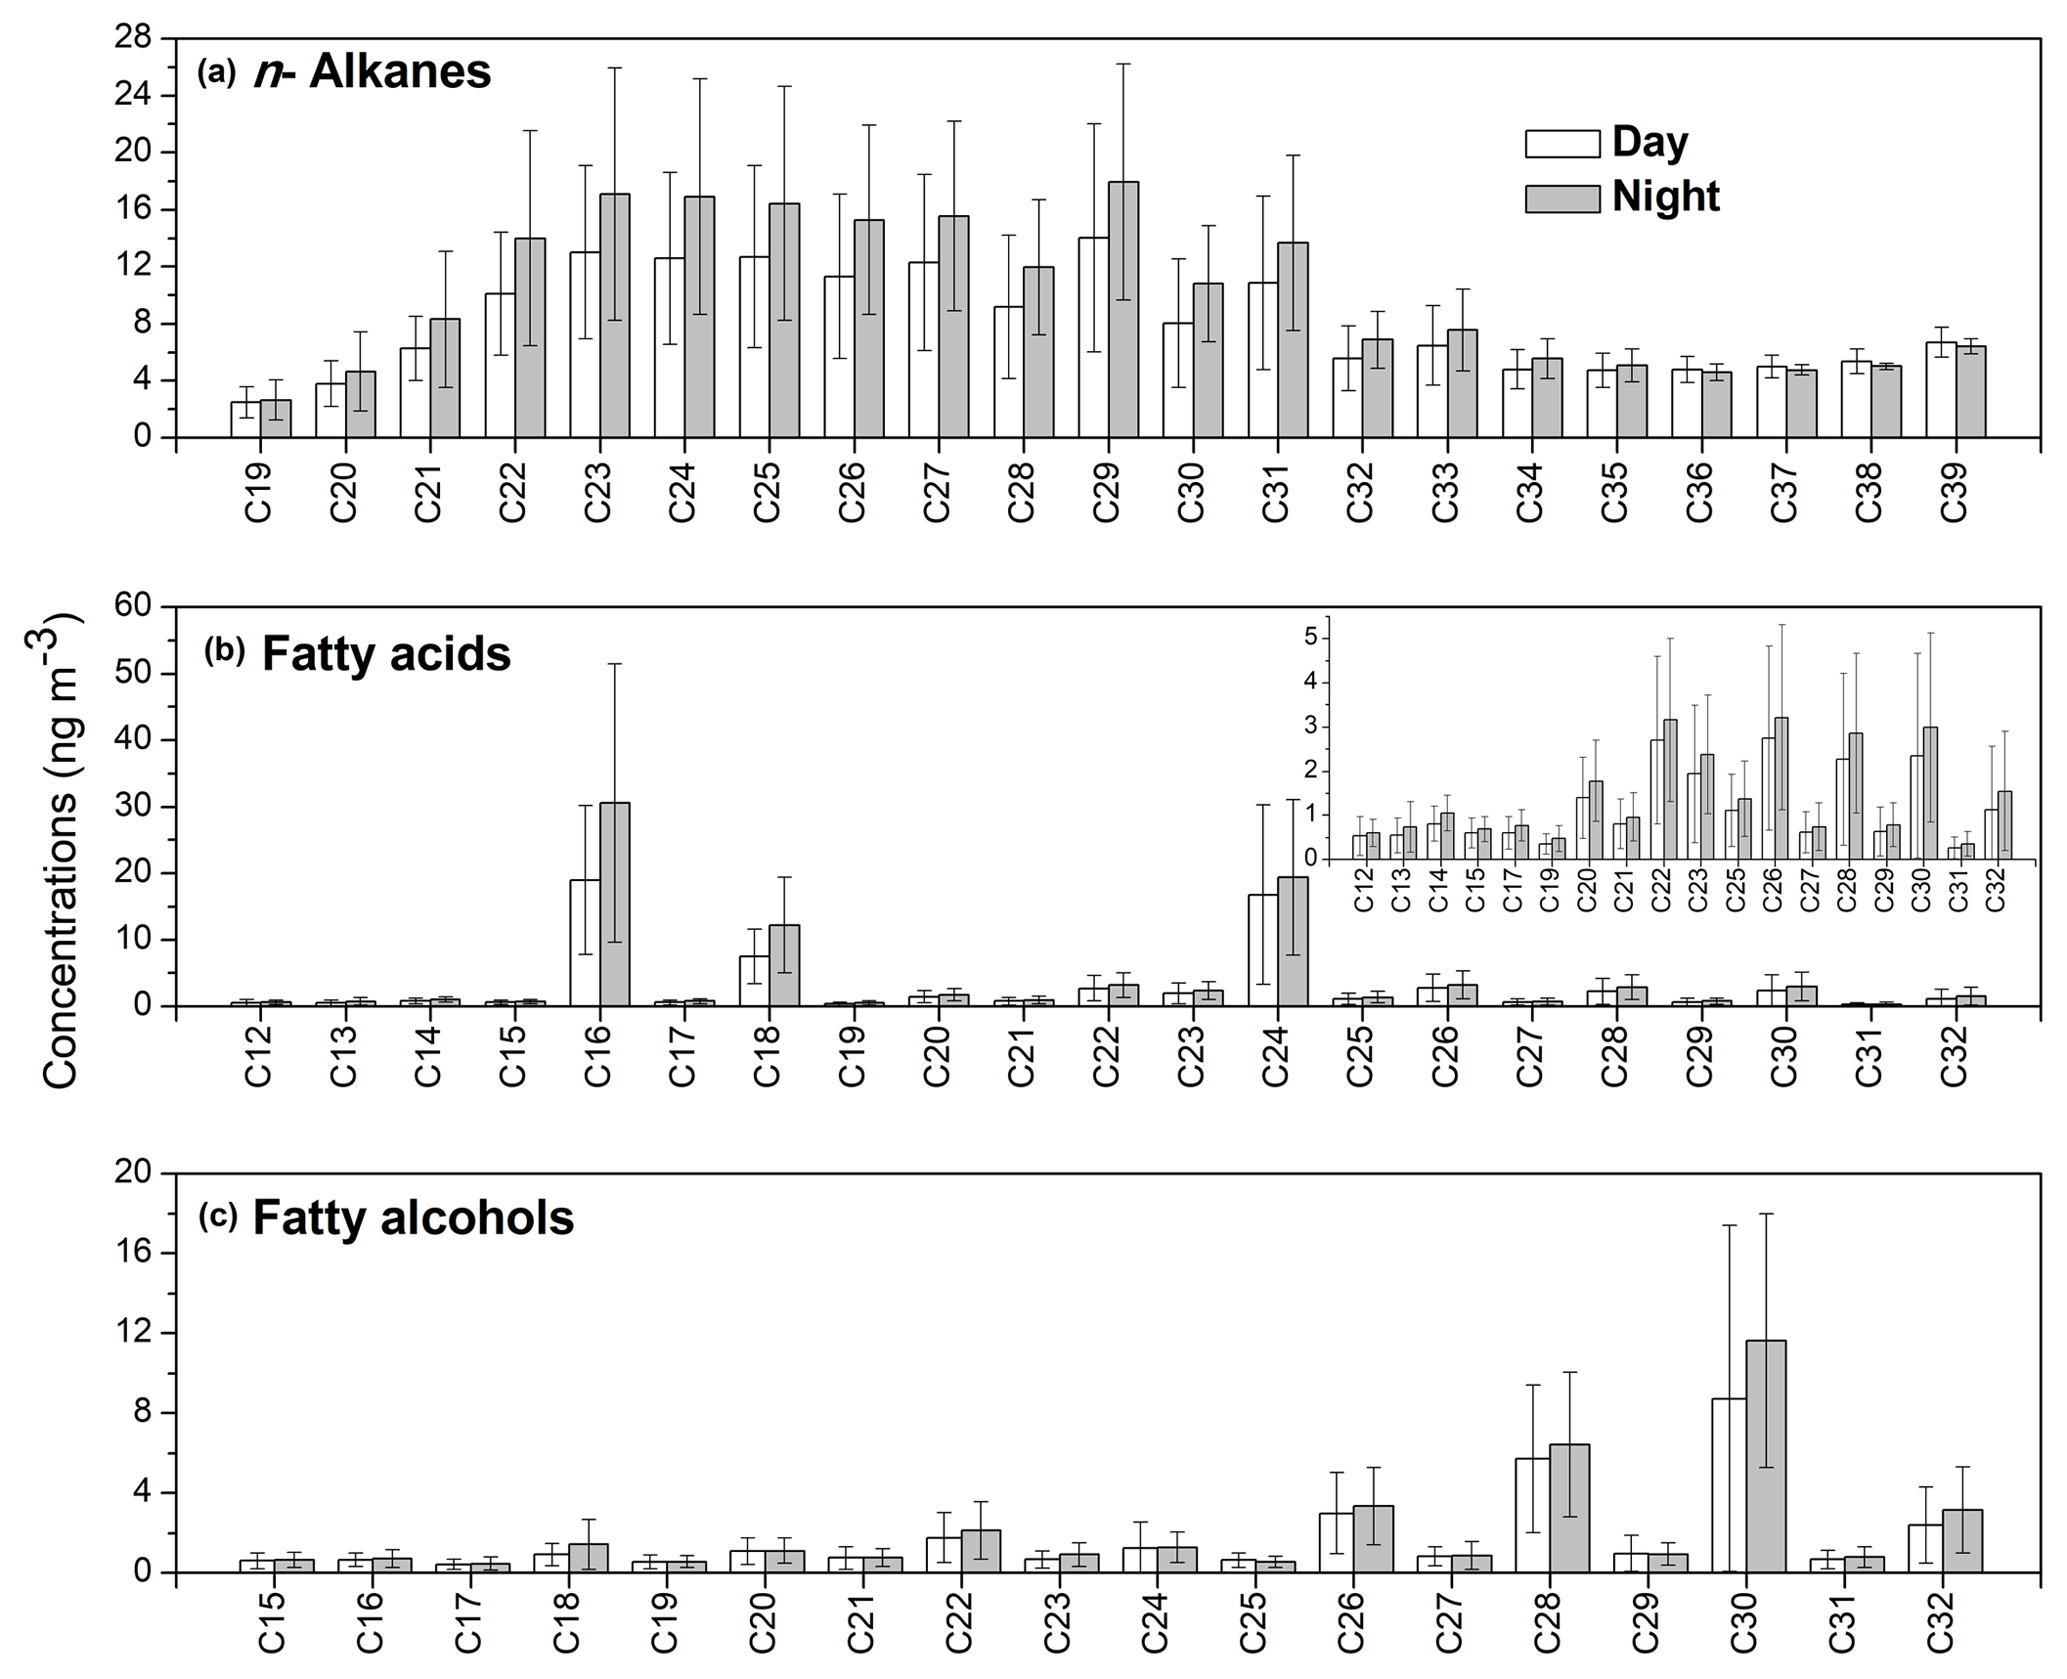
Figure 4Molecular distributions of (a) n-alkanes, (b) fatty acids and (c) fatty alcohols in PM2.5 aerosols collected from Nanjing, China. The inset panel in (b) represents the correspondence carbon of fatty alcohols for which the concentrations are low.
Table 2Comparisons of the average concentrations (ng m−3) of organic tracers in Nanjing aerosols with those measured during the 2004–2005 winter period.
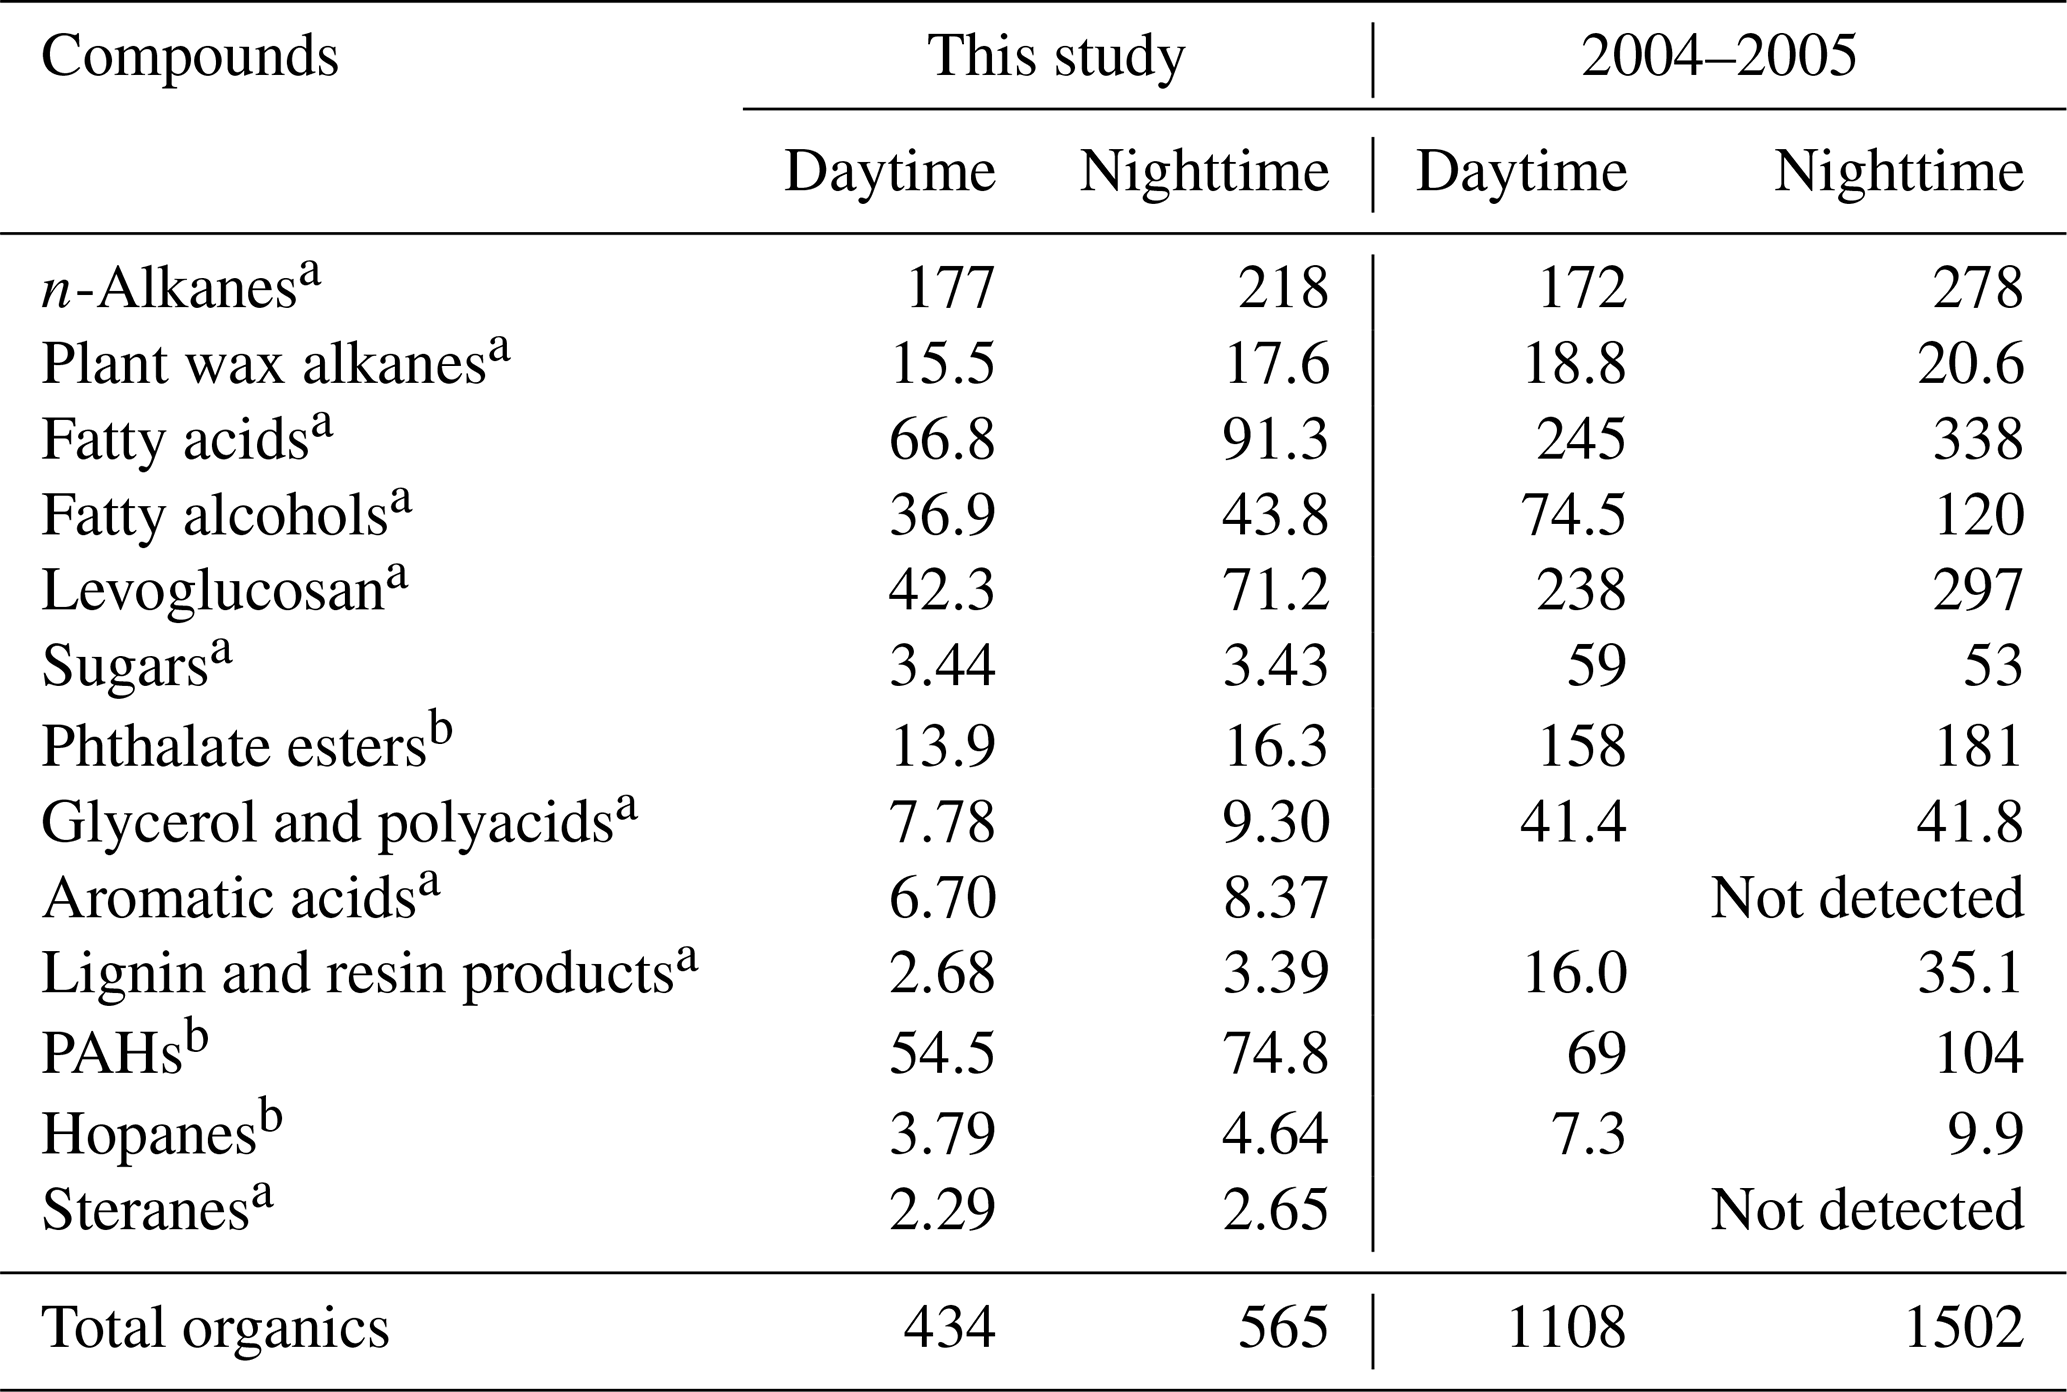
a Wang and Kawamura, 2005; b Wang et al., 2007a.
Biogenic n-alkanes showed stronger odd/even carbon number predominance with a carbon preference index (CPI) of >5, whereas for anthropogenic n-alkanes the CPI value is usually close to unity (Simoneit et al., 1991a, 2004c). CPI values obtained in this study ranged from 1.18 to 1.32 (mean 1.28) at daytime and 1.10 to 1.37 (1.24) at nighttime, which is close to unity. This result suggests that the major contributor of n-alkanes is anthropogenic activity such as fossil fuel combustion, with less contribution from higher plants in Nanjing aerosols. The present CPI values are similar to those from other Chinese urban areas (mean 1.16; Wang et al., 2006) and Tokyo (1.10–2.80, mean 1.50; Kawamura et al., 1995). On the contrary, higher CPI values have been reported for Mt. Tai (4.60; Fu et al., 2008) and Chichijima aerosols (4.50; Kawamura et al., 2003), where n-alkanes mainly originated from terrestrial higher plant waxes. Plant wax-derived n-alkanes are estimated as the excess of odd homologues minus adjacent even homologues (Simoneit et al., 1991b, 2004c), and are attributable to vascular plant waxes (Tables 1 and S1). Concentration ranges of higher plant wax-derived n-alkanes were 2.12–48.1 ng m−3 (mean 15.5 ng m−3) at daytime and 0.86–58.9 ng m−3 (mean 17.6 ng m−3) at night, both of which are much lower than total n-alkanes, indicating that n-alkanes in the Nanjing urban area are derived mainly from fossil fuel combustion.
A homologous series of C12 : 0–C32 : 0 saturated fatty acids, including two unsaturated fatty acids (C18 : 1 and C18 : 2), were identified in Nanjing samples. The values of total fatty acids ranged from 14.3 to 254 ng m−3 (mean 66.8 ng m−3) during daytime, whereas they ranged from 8.59 to 252 ng m−3 (mean 91.3 ng m−3) at night. It is notable that fatty acids are less abundant than n-alkanes in Nanjing samples (Fig. 2). The molecular distributions of fatty acids show a strong even carbon number predominance with Cmax at C16 : 0 and C24 : 0 (Table S1 and Fig. 4b). CPI values of fatty acids are found to be 5.41 in daytime samples and 5.52 in nighttime samples. A similar distribution pattern has been proposed for marine and continental aerosols (Mochida et al., 2002; Kawamura et al., 2003; Fu et al., 2008). Lower molecular weight (LMW) fatty acids (< C20 : 0) originate from various sources, e.g., vascular plants, microbial sources and marine phytoplankton, whereas high molecular weight (HMW) fatty acids (> C20 : 0) are derived from terrestrial higher plant waxes (Kawamura et al., 2003; Kolattukudy, 1976; Simoneit, 1978). Biomass burning, motor vehicles and cooking can also be important sources of fatty acids in urban areas (Fu et al., 2010). The value of C18 : 1 was observed to be lower during the day than at nighttime, suggesting an enhanced emission to the atmosphere at night and a higher oxidation rate during daytime (Kawamura and Gagosian, 1987).
Concentration ranges of C12–C34 fatty alcohols were 7.30–165 ng m−3 (mean 36.9 ng m−3) during daytime and 4.61–129 ng m−3 (mean 43.8 ng m−3) at nighttime (Table S1 and Fig. 2). Their molecular distributions are characterized by a strong even-to-odd carbon number predominance with Cmax at C28 or C30 (Fig. 4c). We found that the CPI values of fatty alcohols in Nanjing aerosols (2.56–10.3, mean value of 5.22 at daytime; 3.06–15.5, mean value of 6.32 at nighttime) are lower than those of aerosols from Chennai, India (9.75±2.94; Fu et al., 2010) and Mt. Tai, China (CPIs 7.95–66.5, mean value of 25.6 at daytime; 12.2–53.4, mean value of 22.8 at nighttime; Fu et al., 2008). HMW fatty alcohols (> C20) are dominant in terrestrial higher plants, soils and loess deposits, whereas LMW fatty alcohols (< C20) are dominant in marine biota and soil microbes (Simoneit et al., 1991b). Moreover, a large amount of fatty alcohols in addition to fatty acids and n-alkanes can also be derived from biomass burning (Simoneit, 2002). A positive correlation was observed between fatty alcohols and levoglucosan (r=0.60, p<0.001), indicating that fatty alcohols partly originate from biomass burning in Nanjing winter aerosols (Fig. S2c). This conclusion is further supported by the factors resolved by PMF analysis, where a high loading of fatty alcohols was found with the biomass burning tracer levoglucosan.
3.3.2 Biomass burning tracers
Levoglucosan, galactosan and mannosan belong to a class of anhydrosugars that are produced by the pyrolysis of cellulose and hemi-cellulose (Simoneit, 2002). Levoglucosan is a unique tracer of biomass burning, and has been reported in urban (Wang et al., 2006; Fu et al., 2010; Yttri et al., 2007), marine (Simoneit et al., 2004b; Ding et al., 2013) and polar regions (Stohl et al., 2007; Fu et al., 2009). Levoglucosan is a relatively stable species in atmospheric aerosols and may be transported long distances (Mochida et al., 2010). We found that levoglucosan is one of the most abundant single tracers among all of the identified compounds in the present study, with a concentration range of 4.79–179 ng m−3 (mean 38.4 ng m−3) during daytime and 4.96–354 ng m−3 (mean 66.0 ng m−3) at night (Tables 1 and S1, Fig. 5a), although the values are lower than previous results reported in Nanjing (Wang and Kawamura, 2005).
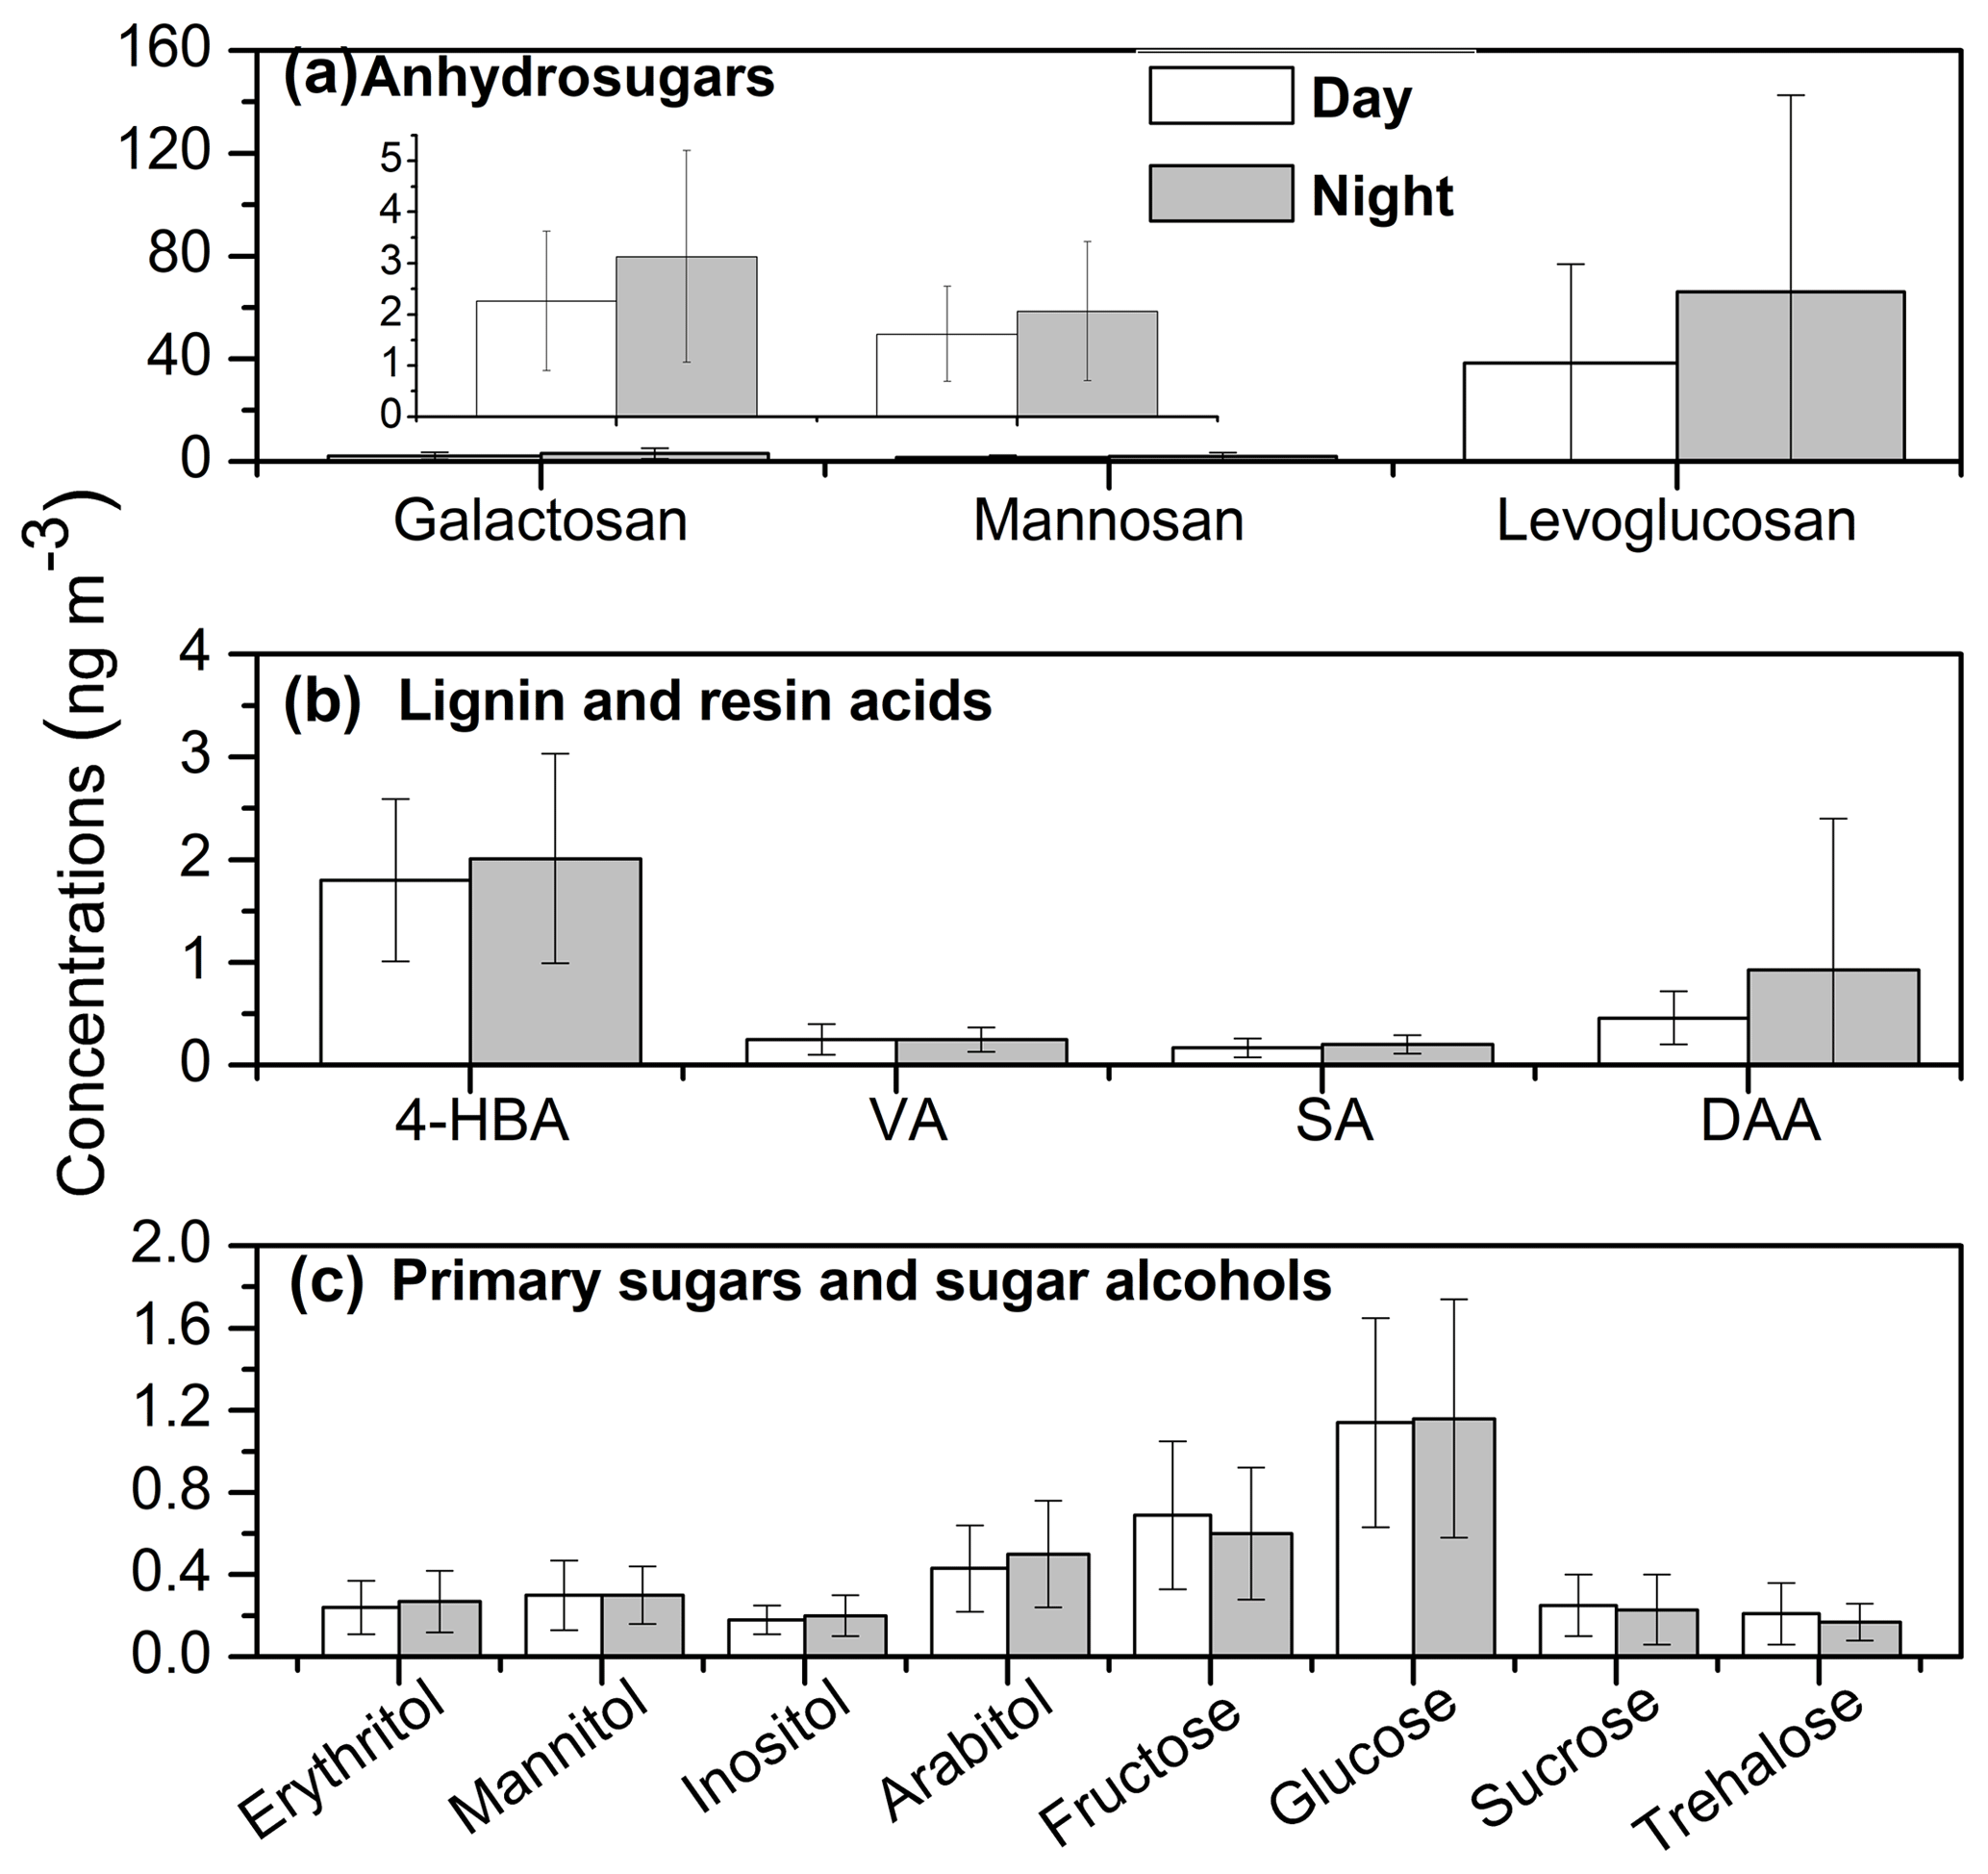
Figure 5Molecular distributions of (a) anhydrosugars, (b) lignin and resin acids and (c) sugars/sugar alcohols in Nanjing aerosols. (4-HBA refers to 4-hydroxybenzoic acid, VA refers to vanillic acid, SA refers to syringic acid and DAA refers to dehydroabietic acid).
Levoglucosan could account for up to 90 % of total sugars in Chinese urban aerosols (Wang et al., 2006). The contribution of levoglucosan to OC and WSOC was 0.02–0.51 % (mean 0.09 %) and 0.03–0.57 % (mean 0.13 %) during daytime and 0.02–0.48 % (mean 0.13 %) and 0.03–0.78 % (mean 0.22 %) at nighttime, respectively. Galactosan and mannosan were also detected in the aerosol samples. The amount of galactosan was found to be 0.65–7.47 ng m−3 (mean 2.26 ng m−3) during daytime and 0.48–7.75 ng m−3 (mean 3.13 ng m−3) at nighttime, whereas those of mannosan were 0.36–4.30 ng m−3 (mean 1.62 ng m−3) during daytime and 0.27–5.73 ng m−3 (mean 2.06 ng m−3) at nighttime (Table S1 and Fig. 5a). Levoglucosan showed similar temporal trends and strong correlations with galactosan (r=0.87, p<0.001) and mannosan (r=0.84, p<0.001) (Fig. S2a). It should be noted that the levoglucosan level in this study was 4–6 times lower than that of a previous study in Nanjing (Table 2; Wang and Kawamura, 2005). This result implies that winter biomass burning emissions have decreased significantly over the last decade in the Nanjing area.
We detected four lignin and resin products, i.e., 4-hydroxybenzoic, vanillic, syringic and dehydroabietic acids, which have been used as biomass burning tracers (Simoneit et al., 2004c). Lignin is a wood polymer, which can produce phenolic acids during burning, whereas dehydroabietic acid is more specific to conifer resin (Simoneit, 2002). We found that 4-hydroxybenzoic acid was dominant among all lignin and resin products identified in Nanjing samples (Fig. 5b). The concentration ranges of 4-hydroxybenzoic, vanillic and syringic acids in day and nighttime samples were 0.65–4.31 ng m−3 (mean 1.80 ng m−3) and 0.62–4.96 ng m−3 (mean 2.01 ng m−3), 0.04–0.92 ng m−3 (mean 0.25 ng m−3) and 0.08–0.66 ng m−3 (mean 0.25 ng m−3), and 0.04–0.57 ng m−3 (mean 0.17 ng m−3) and 0.05–0.43 ng m−3 (mean 0.20 ng m−3), respectively. The value of dehydroabietic acid was observed to be 0.11–1.16 ng m−3 (mean 0.46 ng m−3) during daytime and 0.00–8.29 ng m−3 (mean 0.93 ng m−3) at nighttime. The levels of lignin and resin acids in this study were 1–10 orders of magnitude lower than those from India (Fu et al., 2010) and China (Wang et al., 2006). Lignin products showed strong correlations with levoglucosan (r= 0.60–0.72, p<0.001), suggesting similar sources and origins. In contrast, there is no correlation of dehydroabietic acid with levoglucosan (r=0.07), indicating a different source of dehydroabietic acid in Nanjing aerosols. The low concentrations of dehydroabietic acid imply that boreal conifer forest fires are not important for the Nanjing aerosols.
3.3.3 Primary sugars and sugar alcohols
Sugar compounds are considered to be tracers for primary biological aerosol particles, which are water-soluble and thus contribute to WSOC in aerosol particles (Elbert et al., 2007; Medeiros et al., 2006; Yttri et al., 2007). Four primary sugars (glucose, fructose, trehalose and sucrose) and four sugar alcohols (erythritol, arabitol, mannitol and inositol) were identified in the aerosol samples from Nanjing. The sugar compounds are generated from microorganisms (pollen, fungi and bacteria), plants, flowers, the resuspension of surface soil and unpaved road dust (Graham et al., 2003; Simoneit et al., 2004a; Yttri et al., 2007). They can also originate from biomass burning. Total concentrations of primary sugars measured were 0.78–7.02 ng m−3 (mean 2.90 ng m−3) at daytime and 0.50–6.58 ng m−3 (mean 2.98 ng m−3) at nighttime, whereas those of sugar alcohols were 0.30–2.90 ng m−3 (mean 1.16 ng m−3) during daytime and 0.19–2.75 ng m−3 (mean 1.27 ng m−3) at nighttime.
Most primary sugars exhibited higher concentrations at daytime than at night, except for glucose (Fig. 5c). Graham et al. (2003) proposed that fructose and glucose along with sucrose are emitted as fern spores, pollen and other “giant” bioaerosol particles during daytime. Glucose showed a significant correlation with levoglucosan (r=0.75, p<0.001; Fig. S2d), indicating that it is associated with biomass burning, which may explain the high levels of glucose at nighttime, whereas other primary sugars only showed weak correlations with levoglucosan (r= 0.05–0.09). Biomass burning as a source of glucose has also been proposed by Fu et al. (2008). Trehalose is mostly derived from microorganisms such as bacteria, fungi and yeast as well as to a lesser degree from higher plants and invertebrates (Medeiros et al., 2006). It is also considered to be a product of unpaved road dust and the resuspension of surface soil (Simoneit et al., 2004b; Wang and Kawamura, 2005).
On the contrary, all sugar alcohols showed higher concentrations at nighttime than during the day, whereas the scenario was reversed for primary sugars. Significant correlations were observed between sugar alcohols and levoglucosan (r= 0.51–0.75, p<0.001), suggesting a contribution from biomass burning to primary bioaerosol particles, which could explain their higher concentrations at nighttime. Previous articles have proposed that a huge amount of sugars and sugar alcohols can be emitted via the combustion of green vegetation from temperate forests (Medeiros and Simoneit, 2008). The sugar polyols are mainly produced from microbial sources, e.g., fungi and bacteria. They can also be released from the bark of trees, leaves and branches. The values of sugar compounds in this study are lower than values reported from other Chinese urban areas (Wang et al., 2006).
3.3.4 Polycyclic aromatic hydrocarbons (PAHs)
PAHs have severe negative effects on human health due to their genotoxicity and carcinogenicity. These aromatic compounds are mainly emitted from anthropogenic activities, including biomass burning, coal combustion, vehicular emissions and natural gas combustion. PAHs showed a weak positive correlation with levoglucosan (r=0.20), suggesting that there is no serious contribution from biomass burning activities to PAHs in Nanjing aerosols. A total of seventeen PAHs were identified in the Nanjing samples with concentrations ranging from 29.5 to 106 ng m−3 (mean 54.5 ng m−3) at daytime and 21.7–223 ng m−3 (mean 72.5 ng m−3) at nighttime (Tables 1 and S1, Fig. 2). The higher concentrations of PAHs at nighttime might be due to the lower dispersion of the boundary layer at night (Fig. 6a). Furthermore, household coal combustion significantly contributes to the air quality in China during winter (Kerimray et al., 2017). Dropping nighttime temperatures due to a cold weather, especially in rural areas, result in the use of a large amount of coal for house heating. Furthermore, heavy-duty trucks, which are only permitted by the local government to work at night, as well as coal combustion would also contribute to higher concentrations of PAHs in the nighttime air. Our values are 3–4 times higher than those found in Hong Kong (14 ng m−3) but lower than those in Beijing winter aerosols (208 ng m−3) (Wang et al., 2006). Fluoranthene was found as a dominant PAH (mean 8.24 ng m−3) in Nanjing aerosol samples followed by chrysene (mean 6.72 ng m−3), pyrene (mean 6.42 ng m−3) and benzo(b)fluoranthene (BbF; mean 5.85 ng m−3) (Fig. 6a).
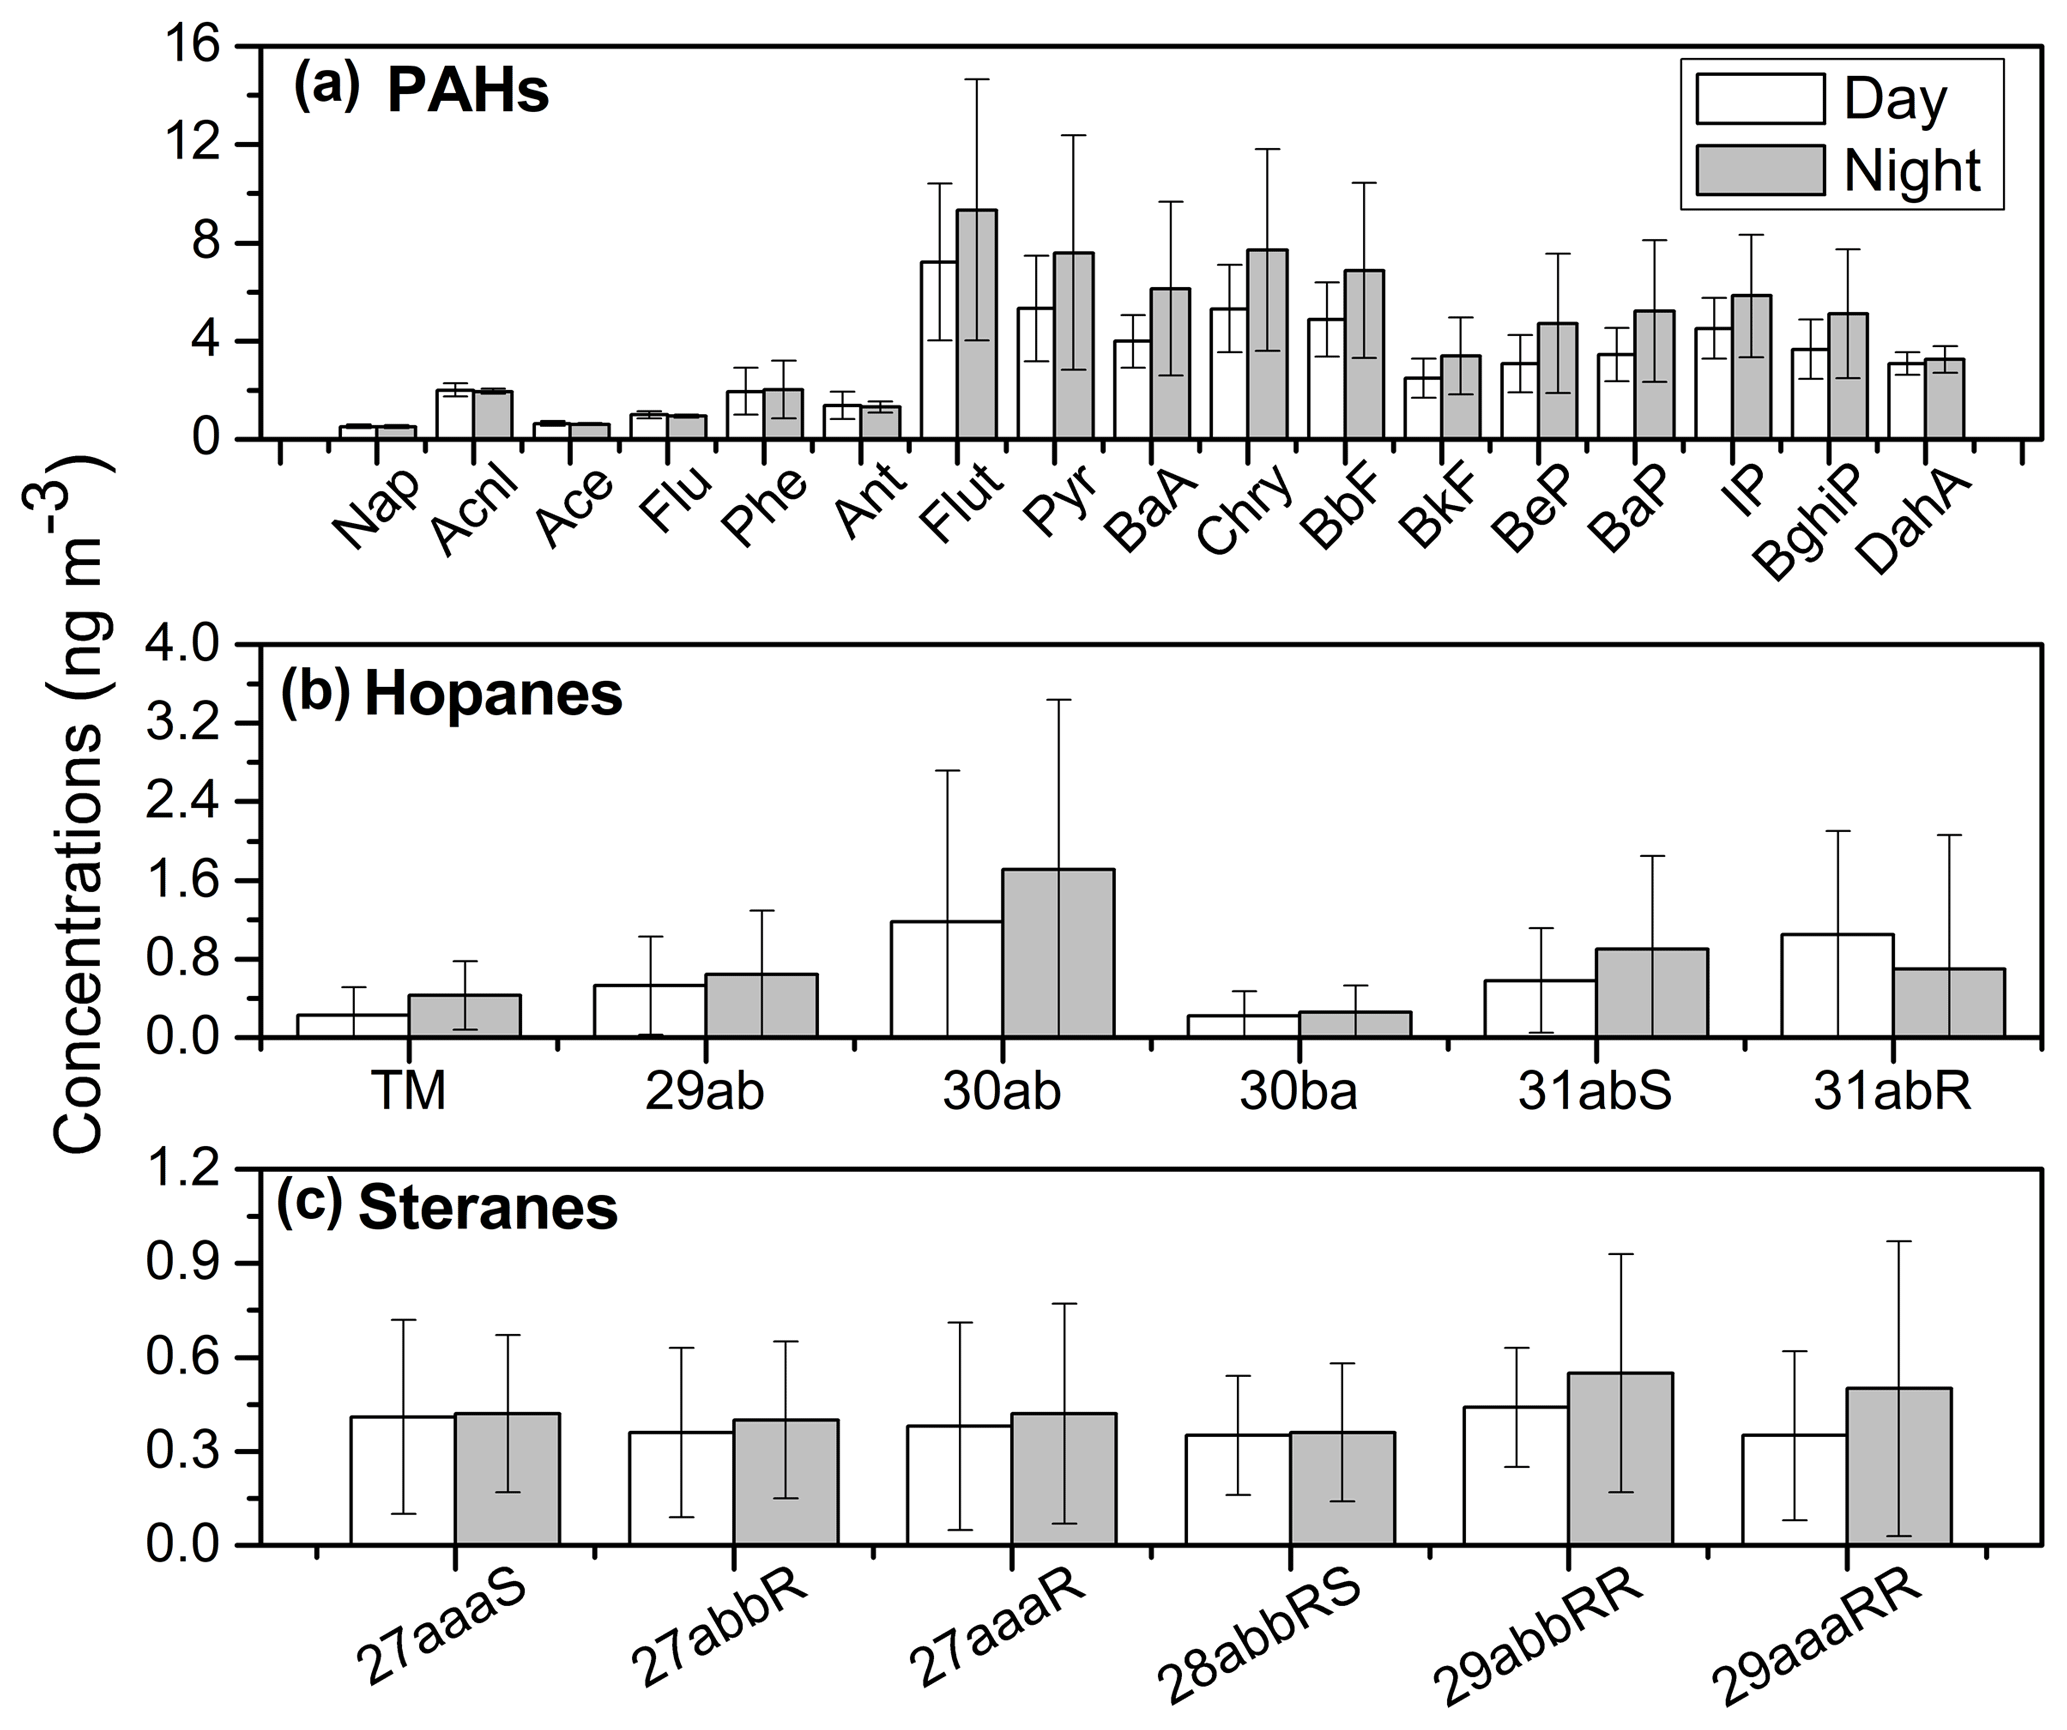
Figure 6Molecular distributions of (a) PAHs, (b) hopanes and (c) steranes in winter aerosols from Nanjing, China. (The abbreviation of the PAHs listed are as follows: Nap – napthalene; Acnl – acenaphthylene; Ace – acenapthene; Flu – fluorene; Phe – phenanthrene; Ant – anthracene; Flut – fluoranthene; Pyr – pyrene; BaA – benzo(a)anthracene; Chry – chrysene; BbF – benzo(b)fluoranthene; BkF – benzo(k)fluoranthene; BeP – benzo(e)pyrene; BaP – benzo(a)pyrene; IP – indeno(1,2,3-cd)pyrene; BghiP – benzo(ghi)perylene; and DahA – Dibenzo(a,h) anthracene). TM refers to 17α(H)-22,29,30-Trisnorhopane.
PAHs can be further photooxidized to form SOA, i.e., phthalic acid in the atmosphere (Zhang et al., 2016). Ding et al. (2007) proposed that PAHs could be degraded during long-range transport. Therefore, the ratios of PAH isomer pairs can be used to interpret the chemical aging of PAHs in the atmosphere. Benzo[a]anthracene (BaA) and benzo(a)pyrene (BaP) are expected to be degraded more easily than their isomers during transportation due to their higher reactivity. Thus, lower ratios (<1.0) of benzo[a]anthracene (BaA) ∕ chrysene (Chry) and benzo(a)pyrene (BaP) ∕ benzo(e)pyrene (BeP) indicate relatively more photochemical processing of PAHs. In this study, the ratios of BaA ∕ Chry and BaP ∕ BeP were calculated to be 0.79 and 0.88, respectively; these values imply that the PAHs of Nanjing aerosols were aged due to the atmospheric transportation from long distances.
Characteristic ratios of PAHs are indicative of their specific sources. Previous studies (Wang et al., 2007a, 2009; Bi et al., 2005) have pointed out that the concentration ratios of indeno(1,2,3-cd)pyrene to benzo(ghi)perylene (IP ∕ BghiP), and benzo(ghi)perylene to benz(e)pyrene (BghiP ∕ BeP), are indicative of different emission sources (Table 3). Ratios of IP ∕ BghiP around 0.22, 0.50 and 1.3 are attributable to gasoline, diesel and coal combustion sources, respectively. Conversely, a BghiP ∕ BeP ratio of 2.0 indicates vehicle exhaust and 0.8 indicates coal combustion emissions (Grimmer et al., 1983; Ohura et al., 2004). Furthermore, fluoranthene ∕ (fluoranthene + pyrene) (Flut ∕ (Flut + Pyr)) ratios of 0.46–0.56 indicate vehicular emissions, especially from catalytic converter-equipped automobiles (0.44), whereas IP ∕ (BghiP + IP) ratios of 0.18, 0.37 and 0.56 represent vehicle emissions, diesel emissions, and coal combustion, respectively (Bi et al., 2005).
Table 3Diagnostic concentration ratios of biomarkers for source identification from fossil fuel combustions including gasoline and diesel cars.
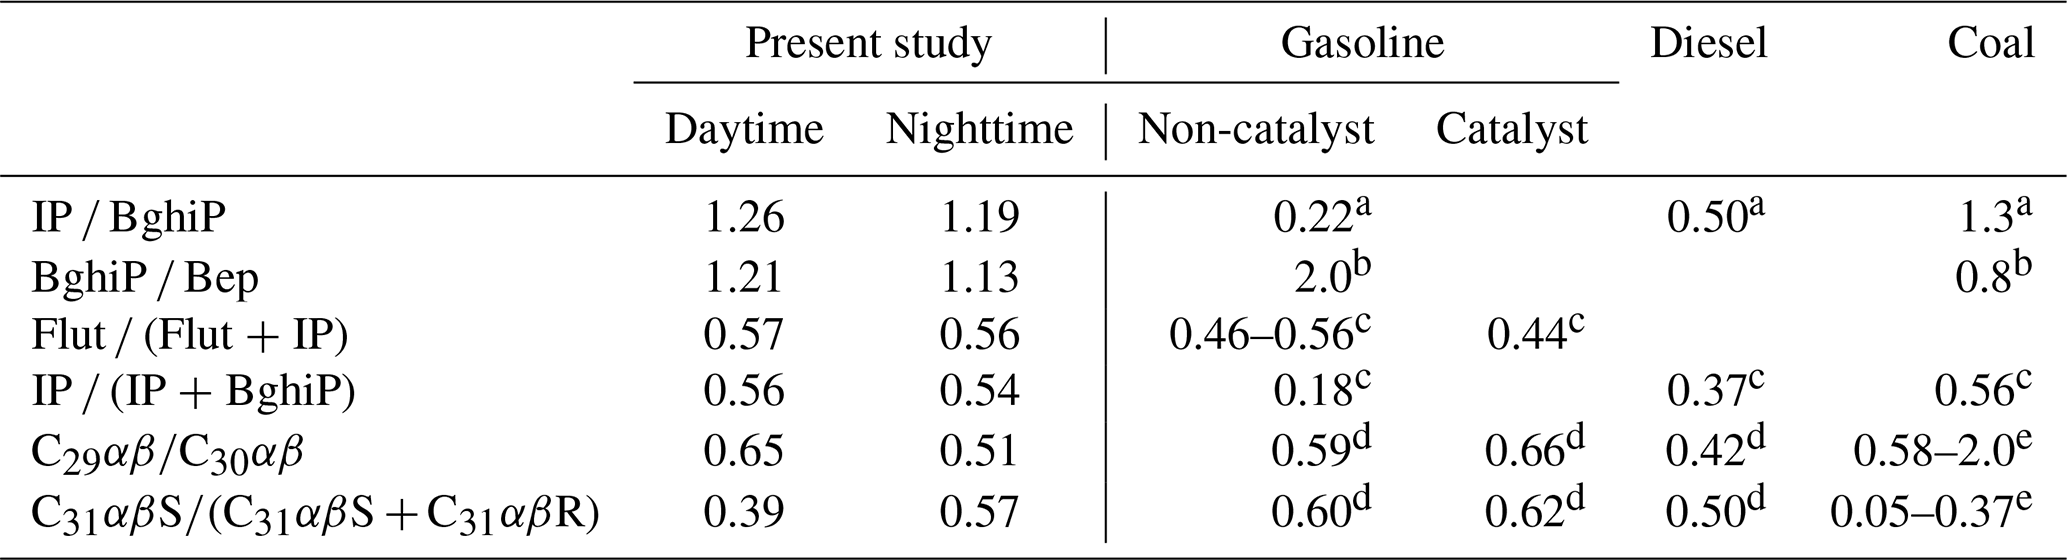
a Grimmer et al. (1983). b Ohura et al. (2004). c Bi et al. (2005). d Rogge et al. (1993a). e Oros and Simoneit (2000).
In this study, we found the ratios of IP ∕ BghiP, Bghi ∕ Bep, Flut ∕ (Flut + Pyr) and IP ∕ (IP + BghiP) to be 1.23, 1.17, 0.56 and 0.55, respectively. These ratios are closer to those of coal burning emissions than vehicle exhausts, and imply that the PAH components in Nanjing winter aerosols are mainly derived from coal combustion. The PAH compositions reported in our study are different from those found in Sacramento (Kleeman et al., 2008), Los Angeles and London (Finlayson-Pitts and Pitts Jr., 2000), where BghiP ∕ BeP ratios were 5.6, 3.5 and 1.7, respectively, and vehicular emissions were the major PAH source. The PAH concentrations in Nanjing aerosols found in this study are lower than those found in a previous study of Nanjing samples collected in 2004 (Table 2; Wang et al., 2007a) and one-fourth of those collected during a study in 2001 (214 ng m−3; Yang et al., 2005), which indicates that the local air quality in Nanjing has improved since 2001.
3.3.5 Hopanes and steranes
Hopane and sterane isomers are considered to be biomarkers of fossil fuel emissions, which belong to the higher boiling fraction of crude oil and are more resistant to degradation than n-alkanes. These isomers are found in high concentrations and originate from the crude oil and engine oil, which means that they consequently occur in vehicle exhaust from unburned lubricating oil residues and road dust (Ding et al., 2009). Six hopane compounds were identified in the Nanjing urban samples (Table S1) with higher levels at nighttime (0.13–26.1 ng m−3, mean 4.16 ng m−3) and lower levels at daytime (0.09–20.8 ng m−3, mean 3.78 ng m−3) (Fig. 2). The concentrations of hopane in the present study are comparable with those from other Chinese cities and Tokyo (0.7–15 ng m−3; 5.5 ng m−3; Wang et al., 2006). Wang et al. (2009) reported that concentrations of hopanes in the urban samples were 2 orders of magnitude higher than those in mountain samples, whereas hopanes were not detectable in marine samples.
The diagnostic ratios of hopanes can differentiate their sources (Table 3). 17α(H)-21β(H)-29−norhopane (C29αβ)∕17α(H)-21β(H)-hopane (C30αβ) ratios of 0.59–0.66, 0.42, and 0.58–2.0 denote gasoline, diesel and coal burning emissions, respectively (Rogge et al., 1993a; Oros and Simoneit, 2000). In addition, ratios of 17α(H)-21β(H)-22S-homohopane/(17α(H)-21β(H)-22S-homohopane + 17α(H)-21β(H)-22R-homohopane) [C31αβS∕(C31αβS + C31αβR)] ranging from 0.60 to 0.62, 0.50, and 0.05 to 0.37 indicate gasoline, diesel and coal burning emissions, respectively (Rogge et al., 1993a; Oros and Simoneit, 2000). We observed that concentration ratios of C29αβ∕C30αβ and C31αβS∕(C31αβS + C31αβR) in this study are 0.58 and 0.48, respectively, which are closer to those of vehicular emissions than coal combustion. Thus, hopanes in Nanjing aerosol are predominantly emitted from traffic emissions due to the rapid increase in the use of automobiles in Chinese megacities.
A series of steranes were also identified in the present study. Concentration ranges of total steranes were 1.14–9.16 ng m−3 (mean 2.29 ng m−3) during daytime and 1.09–11.1 ng m−3 (mean 2.64 ng m−3) during nighttime. The diurnal distribution patterns of steranes showed remarkable similarity to hopanes. A strong correlation coefficient was also observed between steranes and hopanes (r=0.94, p<0.001), indicating similar emission sources (Fig. S3d). This is reasonable because homologues of hopanes and steranes are very stable and have similar atmospheric fates (Ding et al., 2009). In contrast, PAHs showed positive correlations with hopanes and steranes with a lower correlation coefficient (r=0.42, p<0.001), indicating somewhat similar sources.
3.3.6 Phthalates
Phthalates are common additives widely used as a softener or plasticizer in polyvinylchloride (PVC) and synthetic polymers, respectively. They can be emitted into the atmosphere via the evaporation process due to their weak bonding in the polymer. Phthalates have potential negative health effects due to their endocrine disrupting and carcinogenic properties (Sidhu et al., 2005). It is necessary to carefully consider phthalates as toxic components in the aerosol particles; however, few studies have reported their atmospheric distribution over China (Fu et al., 2008; Wang et al., 2006, 2007a). Four phthalate esters, i.e., diethyl (DEP), di-iso-butyl (DiBP), di-n-butyl (DnBP) and di-(2-ethylhexyl) (DEHP) phthalates were characterized in this study with total concentrations of 13.9 ng m−3 (range from 2.66 to 40.0 ng m−3) during daytime and 16.3 ng m−3 (range from 3.79 to 51.8 ng m−3) at nighttime (Fig. 7a). DnBP (mean 8.07 ng m−3) was the dominant tracer, followed by DEHP (mean 4.00 ng m−3) , DiBP (mean 2.59 ng m−3) and DEP (mean 0.14 ng m−3). The levels of phthalates in this study are 4–20 times lower than those that were proposed in other Chinese megacities in 2006 (Wang et al., 2006), although they are comparable to those observed in Paris, France (8.2 ng m−3; Teil et al., 2006), Sweden (3.7 ng m−3; Thuren and Larsson, 1990), and Texas, USA (2.1 ng m−3; Weschler, 1984).
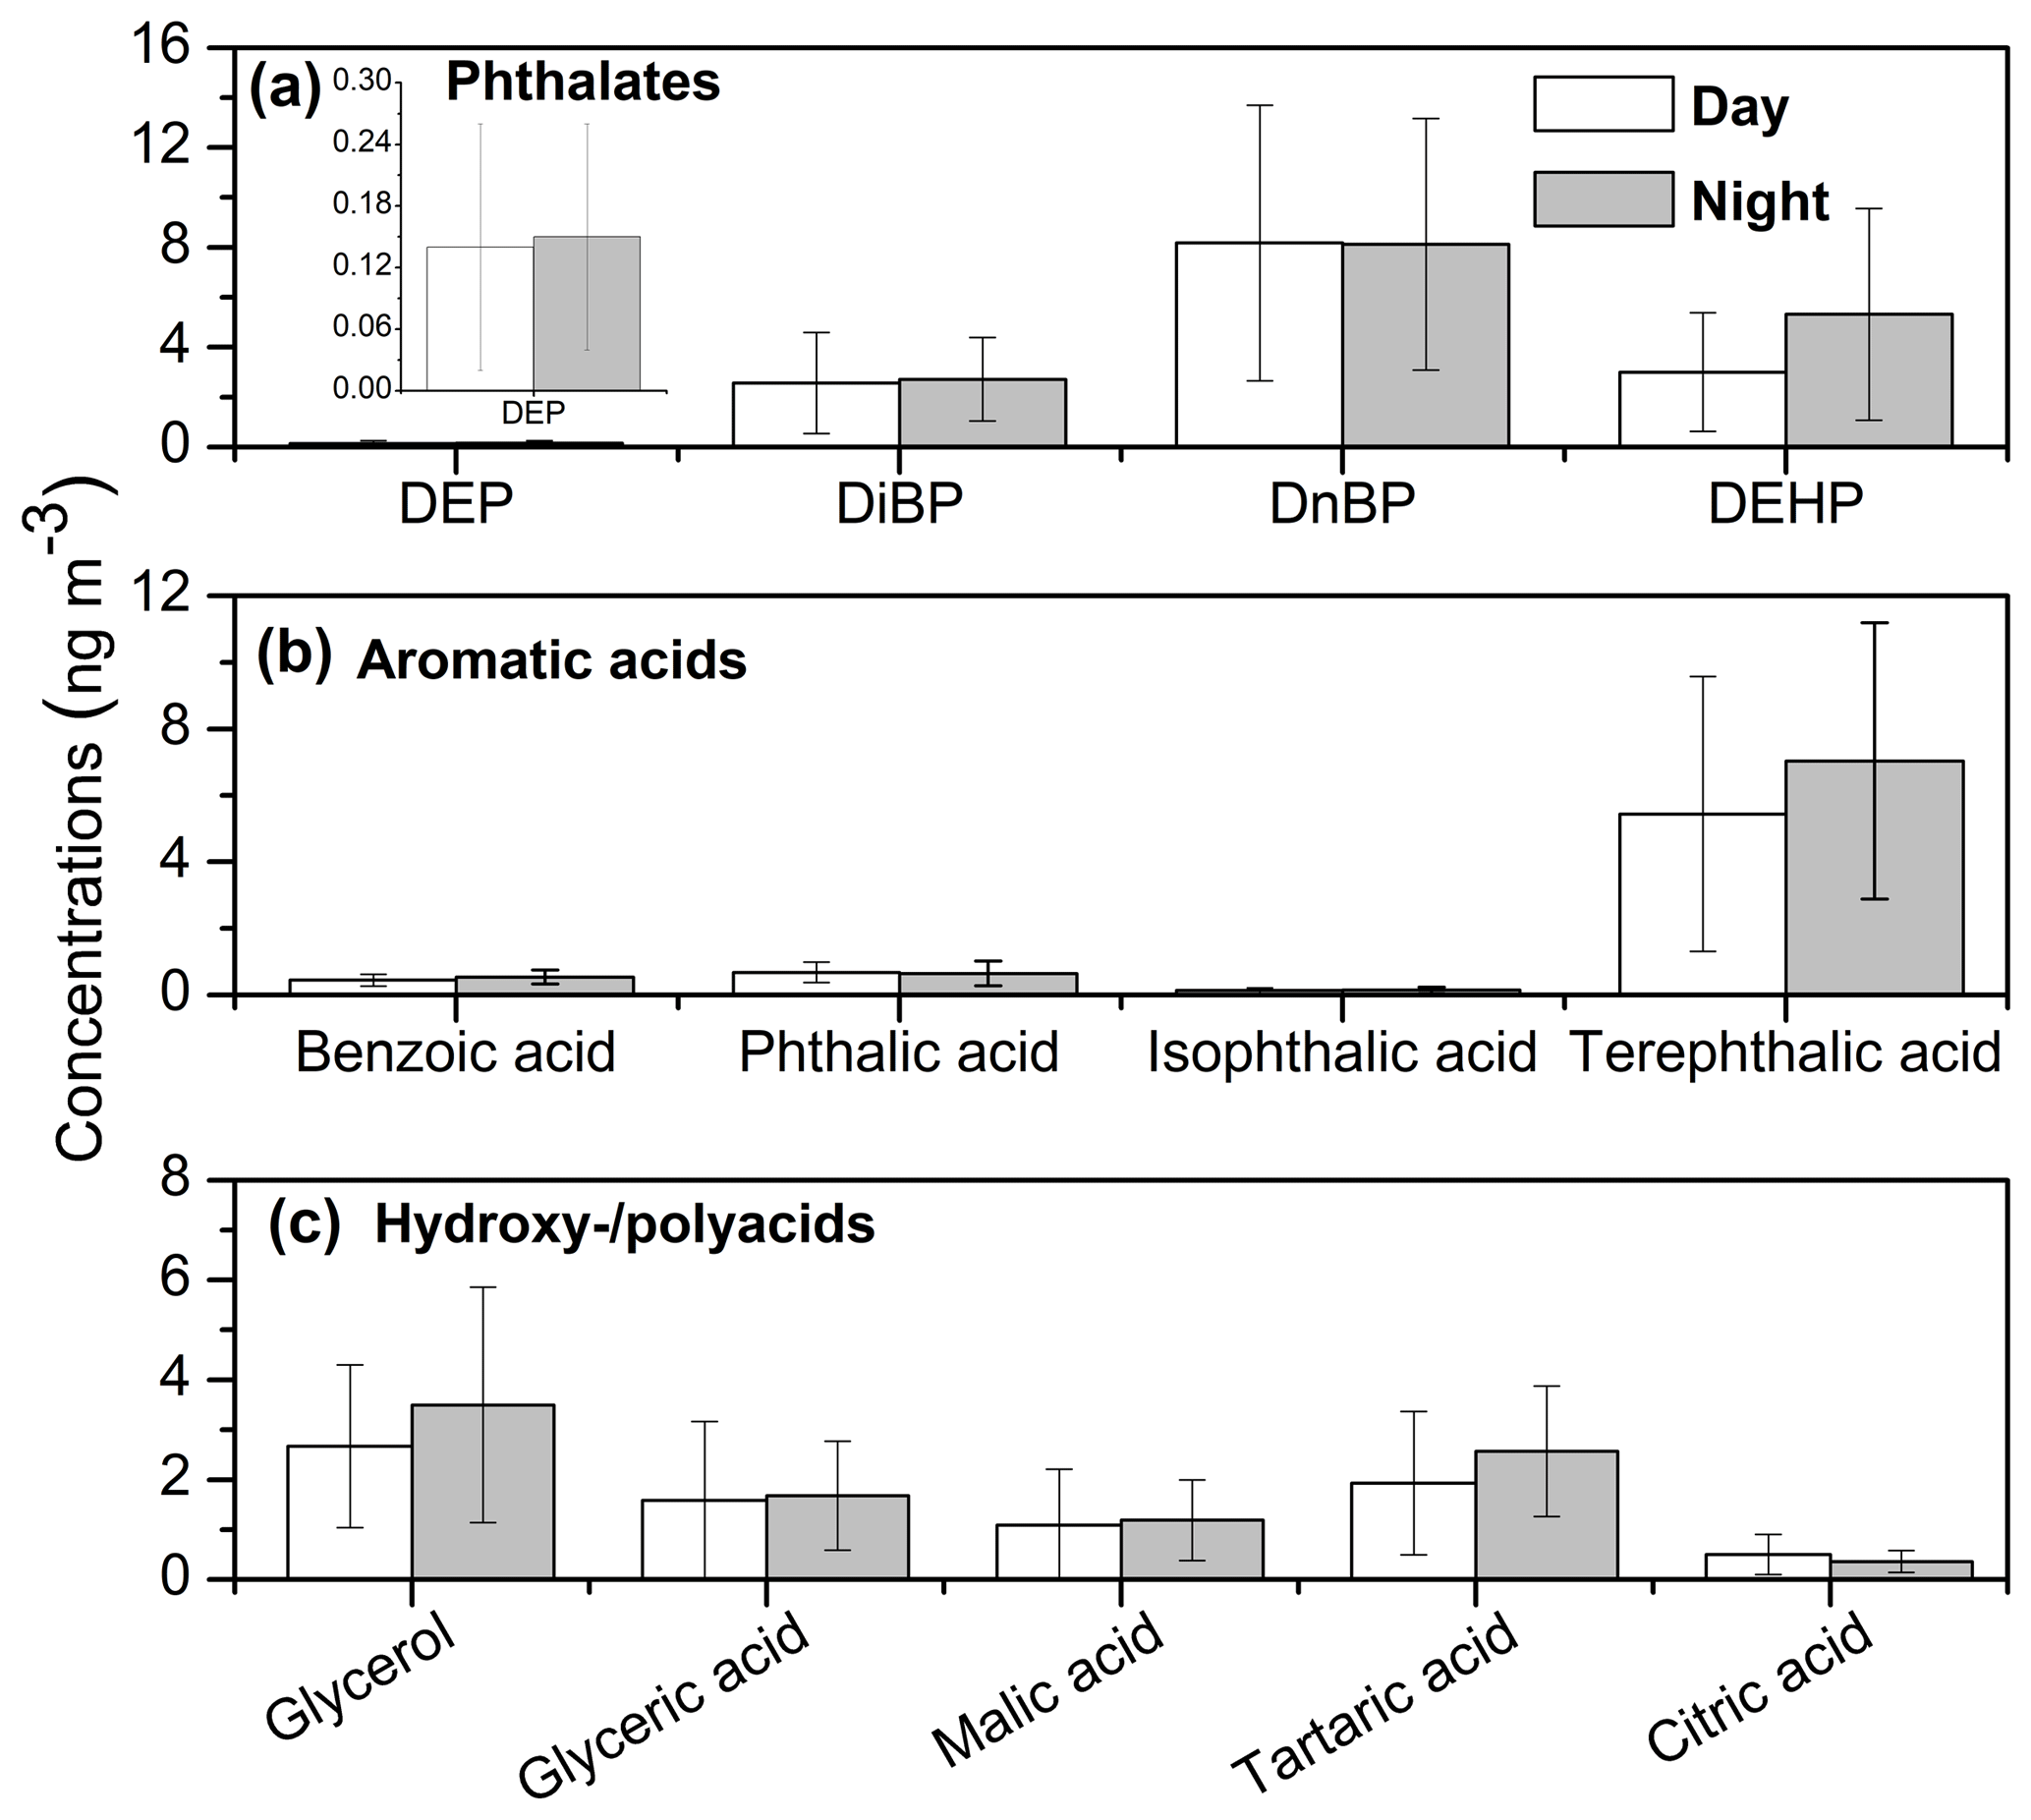
Figure 7Molecular distributions of (a) phthalates, (b) aromatic acids and (c) hydroxy-/polyacids in Nanjing aerosols (DEP refers to diethyl phthalate, DiBP refers to di-iso-butyl phthalate, DnBP refers to di-n-butyl phthalate and DEHP refers to di-(2-ethylhexyl) phthalate).
The evaporation of phthalates can be accelerated under high ambient temperature conditions. The higher values of phthalates found in Nanjing aerosols at nighttime compared with daytime values is the opposite behavior to that seen with respect to Mt. Tai aerosols (Fu et al., 2008) due to the decreased PBLH at nighttime. Moreover, there was no significant difference in temperature between day and night during the campaign in Nanjing (Fig. S1). Significant correlations were found between DEP and DiBP (r=0.85, p<0.001) as well as DiBP and DnBP (r=0.87, p<0.001; Fig. S4a and b), suggesting that these compounds are commonly used as plasticisers in China and are released into the atmosphere in the same way. It should be noted that the concentration level of phthalates in this study was 1–2 orders of magnitude lower than those found in Nanjing aerosols collected in 2004 (mean 230 ng m−3; Wang et al., 2007a), suggesting a significant improvement in the local air quality in Nanjing regarding plastic emission.
3.3.7 Aromatic acids
We detected benzoic acid and three phthalic acids in the urban aerosols from Nanjing with total concentrations of 6.70 ng m−3 (1.53–23.1 ng m−3) during daytime and 8.37 ng m−3 (1.99–18.5 ng m−3) at night (Fig. 7b). These acids can play a significant role in increasing the formation of new particles in the atmosphere (Zhang et al., 2004). Benzoic acid ranged from 0.17 to 0.95 ng m−3 (mean 0.45 ng m−3) at daytime and from 0.24 to 1.22 ng m−3 (mean 0.54 ng m−3) at night (Table S1), which is 1 and 4 orders of magnitude lower than the concentration in summertime aerosol at Mt. Tai and wintertime aerosol in tropical India, respectively (Fu et al., 2008, 2010). Benzoic acid is primarily emitted from automobiles (Rogge et al., 1993b; Kawamura et al., 2000) but has also been proposed as a secondary component via the photooxidation of several aromatic hydrocarbons (Fu et al., 2010).
Total phthalic acids varied from 1.40 to 21.9 ng m−3 (mean 6.25 ng m−3) during daytime and 1.76 to 16.8 ng m−3 (mean 7.83 ng m−3) during nighttime. Their concentrations were lower than those found during aircraft measurements over China in summer (17±13 ng m−3; Wang et al., 2007b) but higher than measurements from the northwestern Pacific (mean 1.5 ng m−3; Simoneit et al., 2004a). The molecular distributions of phthalic acids showed the dominance of terephthalic acid (Fig. 7b), which accounted for 82 % of total aromatic acids in the Nanjing samples. Phthalic acids are SOA products produced from several PAHs (Oliveira et al., 2007; Fine et al., 2004). It is noteworthy that PAHs mostly produce phthalic acids over the North China Plain (Fu et al., 2008). Terephthalic acid can also be derived from burning plastics (Fu et al., 2010).
Aromatic acids showed positive correlations with four- and five-ring PAHs (r=0.56, p<0.001) and phthalates (r=0.71, p<0.001) (Fig. S3c), suggesting that they are primarily derived from PAHs. Furthermore, aromatic acids showed significant correlations with oxidation products of polyacids (r=0.83, p<0.001; Fig. S4c), indicating that the secondary oxidation process is a major source of aromatic acids. However, higher concentrations of aromatic acids at nighttime may not be explained by photochemical oxidation. We propose two explanations for the high level of SOA products at nighttime: (1) SOA products are formed during long-range atmospheric transport that is consistent with aged PAHs in the aerosols as discussed above (Sect. 3.3.4); (2) NOx can play an important role in oxidizing PAHs at night when the NOx concentration is high (Offenberg et al., 2007; Henze et al., 2008). However, further studies are needed to justify the influence of NOx on the atmosphere in Nanjing.
3.3.8 Hydroxy-/polyacids
Glycerol and several polyacids were identified in all of the samples from Nanjing (Table S1). Glycerol is a primary product of a metabolic reaction of soil organisms, whereas polyacids are produced secondarily by the photooxidation of organic precursors (Simoneit et al., 2004c). Glycerol did not show a significant correlation with polyacids (r= 0.21–0.38), implying that the two have different sources (i.e., primary and secondary). Kawamura and Ikushima(1993) and Matsunaga et al. (1999) reported that malic acid is a photooxidation product of succinic acid, which is one of the photooxidation products of biogenic unsaturated fatty acids (BUFAs) in the atmosphere. Moreover, SOA tracers, including malic and tartaric acids, are produced by the photochemical oxidation of isoprene (Claeys et al., 2004).
The concentration range of glycerol was 0.66–5.99 ng m−3 (mean 2.67 ng m−3) during daytime and 0.73–8.72 ng m−3 (mean 3.50 ng m−3) at night. Glycerol is a dominant component in this group (Table S1 and Fig. 7c), which is consistent with the previous report regarding Nanjing aerosol from the 2004–2005 period, whereas the present concentration level is lower than that reported (Wang and Kawamura, 2005). Concentrations ranges of total polyacids were 1.21–23.5 ng m−3 (mean 5.1 ng m−3) during daytime and 2.05–11.2 ng m−3 (mean 5.80 ng m−3) at night, among which tartaric acid (mean 2.18 ng m−3) was dominant (Fig. 7c). Tartaric acid presented a positive correlation with levoglucosan (r=0.75, p<0.001; Fig. S2b), suggesting the influence of biomass burning. Significant correlations were found among all polyacids (r= 0.50–0.75, p<0.001), indicating similar source or formation pathway. Polyacids showed a strong correlation with WSOC (r=0.85, p<0.001; Fig. S4d), indicating their water-soluble and hygroscopic nature in addition to their possible influence on the CCN activity of aerosol particles. It should be noted that secondary oxidation products are formed during long-range atmospheric transport, which could explain the high values of polyacids at night. This result is consistent with the high WSOC∕OC ratio in Nanjing aerosols (see Sect. 3.2) as well as the air mass back trajectories (Fig. S5).
3.4 Source apportionment of organic aerosols using PMF
Positive matrix factorization (PMF5.0, USEPA) analysis was performed in this study in order to better understand the sources of the identified components. It is a statistical source apportionment model widely used to verify underlying covariance among chemical parameters (Paatero and Tapper, 1994; Jaeckels et al., 2007). Detailed information regarding the PMF model can be found elsewhere (Paatero, 1997; Paatero and Tapper, 1994). The PMF model was applied to apportion ambient PM to motor vehicle and wood combustion emission, SOA, and two-point sources using organic molecular markers (Jaeckels et al., 2007). This model has also been extensively used for identifying source profiles and source contributions of PM-based elemental and organic marker data (Song et al., 2001; Buzcu et al., 2003; Jaeckels et al., 2007; Jia et al., 2010). The analytical errors estimated for the measured values of chemical species in PMF analysis are 10 %. The detected organic compound classes were subjected to source apportionment evaluation to carry out the classification of sources using the model. PMF model application resolved five source factors based on Q values that contributed to ambient PM2.5 in this study. OC, EC and some inorganic ions were also used to investigate possible different sources. We used PM2.5 as the sum of total variables during the model convergence. Figure 8 shows composition source profiles for the five factors resolved by PMF analysis, where Factor 3 is a dominant source.

Figure 8Composition profiles (percentage of the total of each species) for the five factors resolved using a PMF based on data from Nanjing winter aerosols from 11 December 2014 to 11 January 2015. (TA refers to terephthalic acid, DEHP refers to di-(2-ethylhexyl) phthalate, FA refers to fatty acid and FAlc refers to fatty alcohol.)
Factor 1 is dominated by levoglucosan (69 %) followed by fatty alcohol (C30) (56 %), arabitol (44 %) and n-alkane (C29) (34 %). Factor 1 is associated with biomass burning, as levoglucosan is a specific tracer of biomass burning. Moreover, fatty alcohols, fatty acids, n-alkanes and sugar compounds can also be emitted from biomass burning. Biomass materials, including rice and wheat straws and cotton stems, are widely used for domestic cooking in rural areas around Nanjing, particularly in the evening. Therefore, particles from biomass burning are abundantly released into the atmosphere and then transported to the Nanjing urban area. This idea is consistent with the high loadings of biomass burning tracers during nighttime.
Factor 2 is enriched (75 %) by the non-sea-salt fraction of calcium (nss-Ca2+), suggesting that the component is associated with soil dust for which nss-Ca2+ is a specific tracer (Athanasopoulou et al., 2010; Brahney et al., 2013). The infrastructure in many urban areas in China is currently undergoing construction, which can produce dust particles that are largely emitted into the atmosphere. Factor 3 is attributed to secondary oxidation products because the dominant species in this source profile is malic acid (69 %), which is a secondary oxidation product as described above (see Sect. 3.3.8).
Factor 4 was abundantly loaded by fluoranthene (79 %), C30αβ (64 %) and C29 (50 %) which are representative PAHs, hopanes and n-alkanes, respectively, implying that this factor originated from fossil fuel combustion. It should be noted that n-alkanes also showed a loading in Factor 1, suggesting that n-alkanes are partly associated with biomass burning. PAHs can be emitted from fossil fuel combustion and biomass burning activities. However, we observed that PAHs are mainly derived from fossil fuel combustion in Nanjing (see Sect. 3.3.4). Furthermore, n-alkanes can originate from fossil fuel combustion and higher plant waxes, although fossil fuel was the dominant source for n-alkanes in Nanjing aerosols (see Sect. 3.3.1). Hopanes are emitted from the vehicular exhaust as well as coal burning. Low-quality coals are extensively used in urban and rural areas in China for cooking and house heating. Many power plants in Chinese cities also used a large amount of coal to produce energy. The use of vehicles has also increased severely in China, and can emit hopanes into the atmosphere. Factor 5 is dominated by di-(2-ethylhexyl) phthalate (DEHP) (63 %) followed by terephthalic acid (35 %), which can be associated with plastic burning. Terephthalic acid is a secondary oxidation product and can also be emitted from the open burning of plastics as discussed above.
PMF results can be further utilized to calculate the relative contributions of sources to the amount of ambient OC or PM2.5 using a multiple linear regression between the isolated factor strengths and measured OC or PM2.5 (Song et al., 2001). Results of this analysis are presented in Fig. 9, where source contributions to PM2.5 are calculated. Fossil fuel combustion was the dominant source (28.7 %), considering the primary source, followed by emissions of biomass burning (17.1 %), soil dust (14.5 %) and plastic burning (6.83 %) during the study period. However, secondary oxidation products showed the highest contribution (32.9 %) to PM2.5 in Nanjing which was most likely due to long-range atmospheric transport. These results indicate that fossil fuel combustion is an important contributor to Nanjing aerosol during winter. Wang and Kawamura (2005) reported that fossil fuel combustion (52 %) was the largest contributor to total organics followed by biomass burning (14 %) and SOA (10 %) from Nanjing, whereas coal combustion was found to contribute 39.5 % to PM2.1 in Nanjing in 2010 (Chen et al., 2015). Gao et al. (2013) pointed out that coal combustion was the dominant (58 %) contributor to PM2.5 followed by biomass burning (31 %) and vehicular emissions (11 %) in the Pearl River Delta region (two urban, two suburban and two rural sites) for samples collected in 2009. The comparison of current results with previous studies implies that the contribution of fossil fuel combustion and biomass burning emissions in China have decreased significantly over the past decade. However, pollution levels in China are still severe compared with the National and WHO standards as discussed above (Sect. 1).
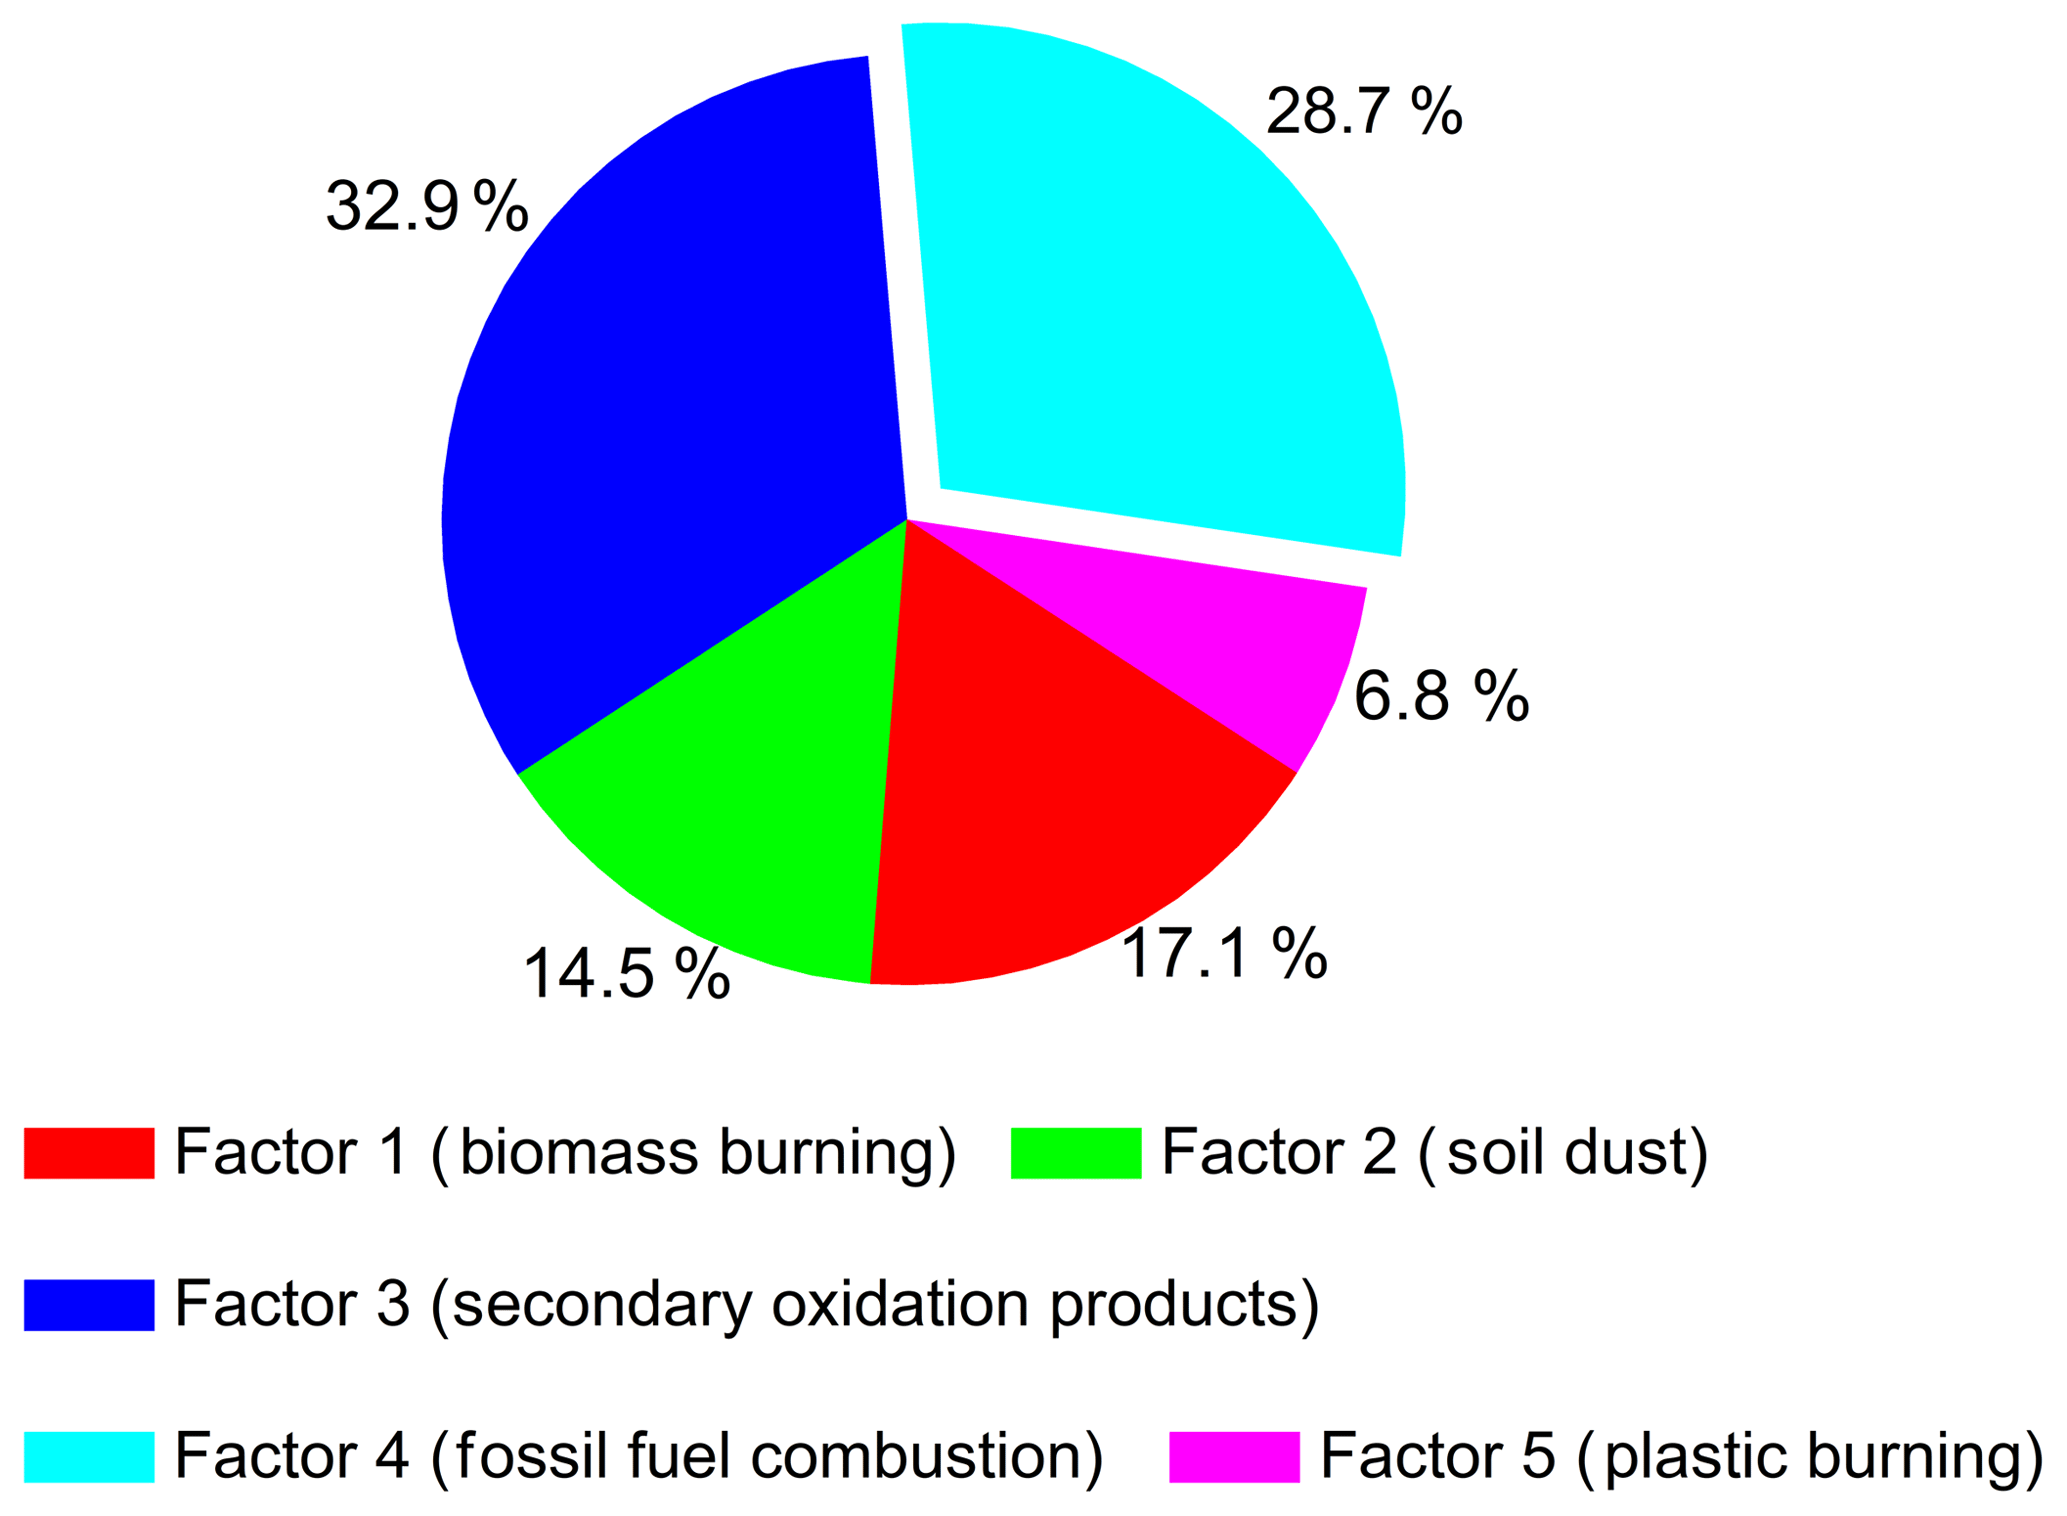
Figure 9Pie diagram showing the estimated source contributions of five factors resolved by PMF to the PM2.5 in Nanjing aerosols.
We collected PM2.5 aerosol samples during winter 2014–2015 from Nanjing, an urban area located in eastern China. A total of 12 organic compound classes were identified in the aerosol samples, with n-alkanes being the dominant compound class, followed by fatty acids, PAHs, anhydrosugars, fatty alcohols and phthalate esters. The concentrations of organic compounds were slightly higher in nighttime samples due to the lower PBLH and higher emissions from heavy-duty trucks as well as coal and biomass burning during the night.
The molecular signature of n-alkanes with a weak odd-carbon number predominance and a maxima of C29 (mean CPI: 1.18) implies significant emissions from fossil fuel combustion. On the contrary, microbial and plant waxes are the major source of fatty acids and fatty alcohols in this study. Fatty alcohols are also significantly emitted from biomass burning. The biomass burning tracer, levoglucosan was the dominant species among the detected compounds. Levoglucosan and other biomass burning tracers mainly originated from domestic cooking and heating during the study period. Concentrations of secondary oxidation products, including aromatic acids and polyacids, reached a maximum during nighttime possibly due to the influence of NOx or long-range atmospheric transport.
The diagnostic ratios of the tracer compounds suggest that coal burning is the major source of PAHs, whereas hopanes are abundantly emitted from traffic emissions into the Nanjing atmosphere. PMF analysis demonstrated that secondary oxidation products are the dominant contributor (32.9 %) to PM2.5, whereas fossil fuel combustion is an important source (28.7 %) in Nanjing winter aerosols. The concentrations of organic tracers in this study are lower than those previously reported in Nanjing aerosols collected in 2004–2005. The air quality in Nanjing may have improved over last decade; however, fossil fuel combustion emissions have not decreased to a satisfactory level and still control the composition of wintertime OAs in Nanjing's atmosphere.
The data used in this paper are available upon the request from the corresponding author.
The supplement related to this article is available online at: https://doi.org/10.5194/acp-19-5147-2019-supplement.
YLZ designed the research. WS and BM collected the aerosol samples. MMH and DKD performed the analysis of organic tracers. CF analyzed the carbonaceous components and major ions. MMH wrote the paper under the guidance of YLZ and KK. All authors were actively involved in the discussion of the paper.
The authors declare that they have no conflict of interest.
This article is part of the special issue “Regional transport and transformation of air pollution in eastern China”. It is not associated with a conference.
We acknowledge the Natural Scientific Foundation of China (grant nos. 91643109, 41603104 and 41761144056) and the Japan Society for the Promotion of Science (grant no. 24221001) for financial support. This study is also partly supported by the Natural Science Foundation of Jiangsu Province (grant no. BK20180040) and the Jiangsu innovation and entrepreneurship team.
This paper was edited by Jianmin Chen and reviewed by two anonymous referees.
Athanasopoulou, E., Tombrou, M.,Russell, A. G.. Karanasiou, A., Eleftheriadis, K., and Dandou, A.: Implementation of road and soil dust emission parameterizations in the aerosol model CAMx: Applications over the greater Athens urban area affected by natural sources, J. Geophys. Res., 115, D17301, https://doi.org/10.1029/2009JD013207, 2010.
Bi, X., Sheng, G., Peng, P., Chen, Y., Zhang, Z., and Fu, J.: Distribution of particulate- and vapor-phase n-alkanes and polycyclic aromatic hydrocarbons in urban atmosphere of Guangzhou, China, Atmos. Environ., 37, 289–298, 2003.
Bi, X., Sheng, G., Peng, P., Chen, Y., and Fu, J.: Size distribution of n-alkanes and polycyclic aromatic hydrocarbons (PAHs) in urban and rural atmospheres of Guangzhou, China, Atmos. Environ., 39, 477–487,, 2005.
Boreddy, S. K. R., Haque, M. M., and Kawamura, K.: Long-term (2001–2012) trends of carbonaceous aerosols from a remote island in the western North Pacific: an outflow region of Asian pollutants, Atmos. Chem. Phys., 18, 1291–1306, https://doi.org/10.5194/acp-18-1291-2018, 2018.
Brahney, J., Ballantyne, A. P., Sievers, C., and Neff, J. C.: Increasing Ca2+ deposition in the western US: The role of mineral aerosols, Aeolian Res., 10, 77–87, 2013.
Buzcu, B., Fraser, M. P., Kulkarni, P., and Chellam, S.: Source identification and apportionment of fine particulate matter in Houston, TX, using positive matrix factorization, Environ. Eng. Sci., 20, 533–545, 2003.
Chang, Y., Zhang, Y., Tian, C., Zhang, S., Ma, X., Cao, F., Liu, X., Zhang, W., Kuhn, T., and Lehmann, M. F.: Nitrogen isotope fractionation during gas-to-particle conversion of NOx to in the atmosphere – implications for isotope-based NOx source apportionment, Atmos. Chem. Phys., 18, 11647–11661, https://doi.org/10.5194/acp-18-11647-2018, 2018.
Chen, P., Wang, T., Hu, X., and Xie, M: Chemical Mass Balance Source Apportionment of Size-Fractionated Particulate Matter in Nanjing, China, Aerosol Air Qual. Res., 15, 1855–1867, 2015.
Chung, S. H. and Seinfeld, J. H.: Global distribution and climate forcing of carbonaceous aerosols, J. Geophys. Res., 107, 4407, https://doi.org/10.1029/2001JD001397, 2002.
Claeys, M., Graham, B., Vas, G., Wang, W., Vermeylen, R., Pashynska, V., Cafmeyer, J., Guyon, P., Andreae, M. O., Artaxo, P., and Maenhaut, W.: Formation of secondary organic aerosols through photooxidation of isoprene, Science, 303, 1173–1176, 2004.
Cooke, W. F., Liousse, C., Cachier, H., and Feichter, J.: Construction of a fossil fuel emission data set for carbonaceous aerosol and implementation and radiative impact in the ECHAM4 model, J. Geophys. Res., 104, 22137–22162, 1999.
Ding, L. C., Fu, K., Wang, D. K. W., Dann, T., and Austin, C. C.: A new direct thermal desorption-GC/MS method: Organic speciation of ambient particulate matter collected in Golden, BC, Atmos. Environ., 43, 4894–4902, 2009.
Ding, X., Wang, X. M., Xie, Z. Q., Xiang, C. H., Mai, B. X., Sun, L. G., Zheng, M., Sheng, G. Y., Fu, J. M., and Pöschl, U.: Atmospheric polycyclic aromatic hydrocarbons observed over the North Pacific Ocean and the Arctic area: Spatial distribution and source identification, Atmos. Environ., 41, 2061–2072, 2007.
Ding, X., Wang, X., Xie, Z., Zhang, Z., and Sun, L.: Impacts of siberian biomass burning on organic aerosols over the north pacific ocean and the arctic: Primary and secondary organic tracers, Environ. Sci. Technol., 47, 3149–3157, 2013.
Dusek, U., Frank, G. P., Hildebrandt, L., Curtius, J., Schneider, J., Walter, S., Chand, D., Drewnick, F., Hings, S., Jung, D., Borrmann, S., and Andreae, M. O.: Size matters more than chemistry for cloud-nucleating ability of aerosol particles, Science, 312, 1375–1378, 2006.
Elbert, W., Taylor, P. E., Andreae, M. O., and Pöschl, U.: Contribution of fungi to primary biogenic aerosols in the atmosphere: wet and dry discharged spores, carbohydrates, and inorganic ions, Atmos. Chem. Phys., 7, 4569–4588, https://doi.org/10.5194/acp-7-4569-2007, 2007.
Fine, P. M., Chakrabarti, B., Krudysz, M., Schauer, J. J., and Sioutas, C.: Diurnal variations of individual organic compound constituents of ultrafine and accumulation mode particulate matter in the Los Angeles basin, Environ. Sci. Technol., 38, 1296–1304, 2004.
Finlayson-Pitts, B. J. and Pitts Jr., J. N.: Chemistry of the Upper and Lower Atmosphere, Academic Press, San Diego, 2000.
Fu, P. Q., Kawamura, K., Okuzawa, K., Aggarwal, S. G., Wang, G., Kanaya, Y., and Wang, Z.: Organic molecular compositions and temporal variations of summertime mountain aerosols over Mt. Tai, North China Plain, J. Geophys. Res., 113, D19107, https://doi.org/10.1029/2008JD009900, 2008.
Fu, P. Q., Kawamura, K., and Barrie, L. A.: Photochemical and other sources of organic compounds in the Canadian high Arctic aerosol pollution during winter-spring, Environ. Sci. Technol., 43, 286–292, 2009.
Fu, P. Q., Kawamura, K., Pavuluri, C. M., Swaminathan, T., and Chen, J.: Molecular characterization of urban organic aerosol in tropical India: contributions of primary emissions and secondary photooxidation, Atmos. Chem. Phys., 10, 2663–2689, https://doi.org/10.5194/acp-10-2663-2010, 2010.
Gao, B., Guo, H., Wang, X. M., Zhao, X. Y., Ling, Z. H., and Zhang, Z.: Tracer-based source apportionment of polycyclic aromatic hydrocarbons in PM2.5 in Guangzhou southern China, using positive matrix factorization (PMF), Environ. Sci. Pollut. R., 20, 2398–2409, 2013.
Graham, B., Guyon, P., Taylor, P. E., Artaxo, P., Maenhaut, W., Glovsky, M. M., Flagan, R. C., and Andreae, M. O.: Organic compounds present in the natural Amazonian aerosol: Characterization by gas chromatography-mass spectrometry, J. Geophys. Res., 108, 4766, https://doi.org/10.1029/2003JD003990, 2003.
Grimmer, G., Jacob, J., and Noujack, K. W.: Profile of the polycyclic aromatic hydrocarbons from lubricating oils. Inventory by GC/MS-PAH in environmental materials, part 1., Fresen. Z. Anal. Chem., 314, 13–19, 1983.
Guo, Z. G., Sheng, L. F., Feng, J. L., and Fang, M.: Seasonal variation of solvent extractable organic compounds in the aerosols in Qingdao, China, Atmos. Environ., 37, 1825–1834, https://doi.org/10.1016/S1352-2310(03)00064-5, 2003.
Haque, M. M., Kawamura, K., and Kim, Y.: Seasonal variations of biogenic secondary organic aerosol tracers in ambient aerosols from Alaska, Atmos. Environ., 130, 95–104, https://doi.org/10.1016/j.atmosenv.2015.09.075, 2016.
He, K., Zhao, Q., Ma, Y., Duan, F., Yang, F., Shi, Z., and Chen, G.: Spatial and seasonal variability of PM2.5 acidity at two Chinese megacities: insights into the formation of secondary inorganic aerosols, Atmos. Chem. Phys., 12, 1377–1395, https://doi.org/10.5194/acp-12-1377-2012, 2012.
Henze, D. K., Seinfeld, J. H., Ng, N. L., Kroll, J. H., Fu, T.-M., Jacob, D. J., and Heald, C. L.: Global modeling of secondary organic aerosol formation from aromatic hydrocarbons: high- vs. low-yield pathways, Atmos. Chem. Phys., 8, 2405–2420, https://doi.org/10.5194/acp-8-2405-2008, 2008.
Huebert, B. J., Bates, T., Russell, P. B., Shi, G. Y., Kim, Y. J., Kawamura, K., Carmichael, G., and Nakajima, T.: An overview of ACE-Asia: Strategies for quantifying the relationships between Asian aerosols and their climatic impacts, J. Geophys. Res., 108, 8633, https://doi.org/10.1029/2003JD003550, 2003.
Jacobson, M. Z.: Global direct radiative forcing due to multicomponent anthropogenic and natural aerosols, J. Geophys. Res., 106, 1551–1568, https://doi.org/10.1029/2000JD900514, 2001.
Jaeckels, J. M., Bae, M. S., and Schauer, J. J.: Positive matrix factorization (PMF) analysis of molecular marker measurements to quantify the sources of organic aerosols, Environ. Sci. Technol., 41, 5763–5769, 2007.
Jia, Y. L., Clements, A. L., and Fraser, M. P.: Saccharide composition in atmospheric particulate matter in the southwest US and estimates of source contributions, J. Aerosol Sci., 41, 62–73, https://doi.org/10.1016/j.jaerosci.2009.08.005, 2010.
Kanakidou, M., Seinfeld, J. H., Pandis, S. N., Barnes, I., Dentener, F. J., Facchini, M. C., Van Dingenen, R., Ervens, B., Nenes, A., Nielsen, C. J., Swietlicki, E., Putaud, J. P., Balkanski, Y., Fuzzi, S., Horth, J., Moortgat, G. K., Winterhalter, R., Myhre, C. E. L., Tsigaridis, K., Vignati, E., Stephanou, E. G., and Wilson, J.: Organic aerosol and global climate modelling: a review, Atmos. Chem. Phys., 5, 1053–1123, https://doi.org/10.5194/acp-5-1053-2005, 2005.
Kawamura, K. and Gagosian, R. B.: Implications of ω-oxocarboxylic acids in the remote marine atmosphere for photo-oxidation of unsaturated fatty acids, Nature, 325, 330–332, 1987.
Kawamura, K. and Ikushima, K.: Seasonal changes in the distribution of dicarboxylic acids in the urban atmosphere, Environ. Sci. Technol., 27, 2227–2235, 1993.
Kawamura, K., Kosaka, M., and Sempéré, R.: Distributions and seasonal changes of hydrocarbons in urban aerosols and rainwaters, Chikyukagaku (Geochemistry), 29, 1–15, 1995.
Kawamura, K., Steinberg, S., and Kaplan, I. R.: Homologous series of C1–C10 monocarboxylic acids and C1–C6 carbonyls in Los Angeles air and motor vehicle exhausts, Atmos. Environ., 34, 4175–4191, 2000.
Kawamura, K., Ishimura, Y., and Yamazaki, K.: Four years' observations of terrestrial lipid class compounds in marine aerosols from the western North Pacific, Global Biogeochem. Cy., 17, 1003, https://doi.org/10.1029/2001GB001810, 2003.
Kendrick, C. M., Koonce, P., and George, L. A.: Diurnal and seasonal variations of NO, NO2 and PM2.5 mass as a function of traffic volumes alongside an urban arterial, Atmos. Environ., 122, 133–141, https://doi.org/10.1016/j.atmosenv.2015.09.019, 2015.
Kerimray, A., Luis, R.-S., Torkmahalleh, M. A., Hopke, P. K., and Gallachóir, B. P. Ó.: Coal use for residential heating: Patterns, health implications and lessons learned, Energy Sustain. Dev., 40, 19–30, 2017.
Kleeman, M. J., Riddle, S. G., and Jakober, C. A.: Size distribution of particle-phase molecular markers during a severe winter pollution episode, Environ. Sci. Technol., 42, 6469–6475, 2008.
Kolattukudy, P. E.: Chemistry and Biochemistry of Natural Waxes, Elsevier, New York, 1976.
Kunwar, B. and Kawamura, K.: One-year observations of carbonaceous and nitrogenous components and major ions in the aerosols from subtropical Okinawa Island, an outflow region of Asian dusts, Atmos. Chem. Phys., 14, 1819–1836, https://doi.org/10.5194/acp-14-1819-2014, 2014.
Li, M., Zhang, Q., Kurokawa, J.-I., Woo, J.-H., He, K., Lu, Z., Ohara, T., Song, Y., Streets, D. G., Carmichael, G. R., Cheng, Y., Hong, C., Huo, H., Jiang, X., Kang, S., Liu, F., Su, H., and Zheng, B.: MIX: a mosaic Asian anthropogenic emission inventory under the international collaboration framework of the MICS-Asia and HTAP, Atmos. Chem. Phys., 17, 935–963, https://doi.org/10.5194/acp-17-935-2017, 2017.
Liu, J., Han, Y., Tang, X., Zhu, J., and Zhu, T: Estimating adult mortality attributable to PM2.5 exposure in China with assimilated PM2.5 concentrations based on a ground monitoring network, Sci. Total Environ., 568, 1253–1262, https://doi.org/10.1016/j.scitotenv. 2016.05.165, 2016.
Lohmann, U., Feichter, J., Penner, J., and Leaitch, R.: Indirect effect of sulfate and carbonaceous aerosols: A mechanistic treatment, J. Geophys. Res., 105, 12193–12206, https://doi.org/10.1029/1999JD901199, 2000.
Matsunaga, S., Kawamura, K., Nakatsuka, T., and Ohkouchi, N.: Preliminary study on laboratory photochemical formation of low molecular weight dicarboxylic acids from unsaturated fatty acid (oleic acid), Researches in Organic Geochemistry, 14, 19–25, 1999.
Ma, Z., Hu, X., Sayer, A. M., Levy, R., Zhang, Q., Xue, Y., Tong, S., Bi, J., Huang, L., Liu, Y.: Satellite-based spatiotemporal trends in PM2.5 concentrations: China, 2004–2013, Environ. Health Perspect., 124, 184–192, https://doi.org/10.1289/ehp.1409481, 2016.
Medeiros, P. M. and Simoneit, B. R. T.: Source profiles of organic compounds emitted upon combustion of green vegetation from temperate climate forests, Environ. Sci. Technol., 42, 8310–8316, 2008.
Medeiros, P. M., Conte, M. H., Weber, J. C., and Simoneit, B. R. T.: Sugars as source indicators of biogenic organic carbon in aerosols collected above the Howland Experimental Forest, Maine, Atmos. Environ., 40, 1694–1705, 2006.
Mochida, M., Kitamori, Y., Kawamura, K., Nojiri, Y., and Suzuki, K.: Fatty acids in the marine atmosphere: Factors governing their concentrations and evaluation of organic films on sea-salt particles, J. Geophys. Res., 107, 4325, https://doi.org/10.1029/2001JD001278, 2002.
Mochida, M., Kawamura, K., Fu, P., and Takemura, T.: Seasonal variation of levoglucosan in aerosols over the western North Pacific and its assessment as a biomass-burning tracer, Atmos. Environ., 44, 3511–3518, 2010.
Mochizuki, T., Miyazaki, Y., Ono, K., Wada, R., Takahashi, Y., Saigusa, N., Kawamura, K., and Tani, A.: Emissions of biogenic volatile organic compounds and subsequent formation of secondary organic aerosols in a Larix kaempferi forest, Atmos. Chem. Phys., 15, 12029–12041, https://doi.org/10.5194/acp-15-12029-2015, 2015.
Offenberg, J., Lewis, C., Lewandowski, M., Jaoui, M.,Kleindienst, T. E., and Edney, E. O.: Contributions of Toluene and α-Pinene to SOA formed in an irradiated toluene/α-Pinene/NOx/air mixture: Comparison of results using 14C content and SOA organic tracer methods, Environ. Sci. Technol., 41, 3972–3976, 2007.
Ohura, T., Amagai, T., Fusaya, M., and Matsushita, H.: Polycyclic Aromatic Hydrocarbons in Indoor and Outdoor Environments and Factors Affecting Their Concentrations, Environ. Sci. Technol., 38, 77–83, https://doi.org/10.1021/es030512o, 2004.
Oliveira, C., Pio, C., Alves, C., Evtyugina, M., Santos, P., Goncalves, V., Nunes, T., Silvestre, A. J. D., Palmgren, F., Wahlin, P., and Harrad, S.: Seasonal distribution of polar organic compounds in the urban atmosphere of two large cities from the North and South of Europe, Atmos. Environ., 41, 5555–5570, 2007.
Oros, D. R. and Simoneit, B. R. T.: Identification and emission rates of molecular tracers in coal smoke particulate matter, Fuel, 79, 515–536, https://doi.org/10.1016/S0016-2361(99)00153-2, 2000.
Paatero, P.: Least squares formulation of robustnon-negative factor analysis, Chemometr. Intell. Lab., 37, 23–35, 1997.
Paatero, P. and Tapper, U.: Positive Matrix Factorization – A Nonnegative Factor Model With Optimal Utilization of Error-Estimates of Data Values, Environmetrics, 5, 111–126, https://doi.org/10.1002/env.3170050203, 1994.
Pani, S. K., Lee, C. T., Chou, C. C. K., Shimada, K., Hatakeyama, S., Takami, A., Wang, S. H., and Lin, N. H.: Chemical Characterization of Wintertime Aerosols over Islands and Mountains in East Asia: Impacts of the Continental Asian Outflow, Aerosol Air Qual. Res., 17, 3006–3036, 2017.
Pope, C. A., Ezzati, M., and Dockery, D. W.: Fine-particulate air pollution and life expectancy in the United States, New. Engl. J. Med., 360, 376–386, 2009.
Ram, K., Sarin, M. M., and Hegde, P.: Atmospheric abundances of primary and secondary carbonaceous species at two high-altitude sites in India: Sources and temporal variability, Atmos. Environ., 42, 6785–6796, 2008.
Ramírez, N., Cuadras, A., Rovira, E., Marcé, R. M., and Borrull, F.: Risk assessment related to atmospheric polycyclic aromatic hydrocarbons in gas and particle phases near industrial sites, Environ. Health Persp., 119, 1110–1116, 2011.
Riipinen, I., Yli-Juuti, T., Pierce, J. R., Petaja, T., Worsnop, D. R., Kulmala, M., and Donahue, N. M.: The contribution of organics to atmospheric nanoparticle growth, Nat. Geosci., 5, 453–458, 2012.
Rogge, W. F., Mazurek, M. A., Hildemann, L. M., Cass, G. R., and Simoneit, B. R. T.: Quantification of urban organic aerosols at a molecular level: Identification, abundance and seasonal variation, Atmos. Environ. A-Gen., 27, 1309–1330, 1993a.
Rogge, W. F., Hildemann, L. M., Mazurek, M. A., Cass, G. R., and Simoneit, B. R. T.: Sources of Fine Organic Aerosol. 2. Noncatalyst and Catalyst-Equipped Automobiles and Heavy-Duty Diesel Trucks, Environ. Sci. Technol., 27, 636–651, https://doi.org/10.1021/es00041a007, 1993b.
Saarikoski, S., Timonen, H., Saarnio, K., Aurela, M., Järvi, L., Keronen, P., Kerminen, V.-M., and Hillamo, R.: Sources of organic carbon in fine particulate matter in northern European urban air, Atmos. Chem. Phys., 8, 6281–6295, https://doi.org/10.5194/acp-8-6281-2008, 2008.
Salma, I., Németh, Z., Weidinger, T., Maenhaut, W., Claeys, M., Molnár, M., Major, I., Ajtai, T., Utry, N., and Bozóki, Z.: Source apportionment of carbonaceous chemical species to fossil fuel combustion, biomass burning and biogenic emissions by a coupled radiocarbon–levoglucosan marker method, Atmos. Chem. Phys., 17, 13767–13781, https://doi.org/10.5194/acp-17-13767-2017, 2017.
Sandradewi, J., Prevot, A. S. H., Weingartner, E., Schmidhauser, R., Gysel, M., and Baltensperger, U.: A study of wood burning and traffic aerosols in an Alpine valley using a multi-wavelength Aethalometer, Atmos. Environ., 42, 101–112, 2008.
Seinfeld, J. H. and Pandis, S. N.: Atmospheric Chemistry and Physics: From Air Pollution to Climate Change, John Wiley & Sons, New York, 2nd edn., 1232 pp., ISBN-13: 978-0-471-72018-8, 2006.
Shen, G. F., Yuan, S. Y., Xie, Y., Xia, S. J., Li L., Yao, Y. K., Qiao, Y. Z., Zhang, J., Zhao, Q. Y., Ding, A. J., Li, B., and Wu, H. S: Ambient levels and temporal variations of PM2.5 and PM10 at a residential site in the mega-city, Nanjing, in the western Yangtze River Delta, China, J. Environ. Sci. Heal. A, 49, 171–178, 2014.
Sidhu, S., Gullett, B., Striebich, R., Klosterman, J., Contreras, J., and DeVito, M.: Endocrine disrupting chemical emissions from combustion sources: diesel particulate emissions and domestic waste open burn emissions, Atmos. Environ., 39, 801–811, 2005.
Simoneit, B. R. T.: The organic chemistry of marine sediments, in: Chemical Oceanography, edited by: Riley, J. P. and Chester, R., Academic Press, New York, 1978.
Simoneit, B. R. T.: Biomass burning-a review of organic tracers for smoke from incomplete combustion, Appl. Geochem., 17, 129–162, 2002.
Simoneit, B. R. T., Cardoso, J. N., and Robinson, N.: An assessment of terrestrial higher molecular weight lipid compounds in aerosol particulate matter over the south Atlantic from about 30–70∘ S, Chemosphere, 23, 447–465, 1991a.
Simoneit, B. R. T., Sheng, G. Y., Chen, X. J., Fu, J. M., Zhang, J., and Xu, Y. P.: Molecular marker study of extractable organic-matter in aerosols from urban areas of China, Atmos. Environ. A-Gen., 25, 2111–2129, 1991b.
Simoneit, B. R. T., Elias, V. O., Kobayashi, M., Kawamura, K., Rushdi, A. I., Medeiros, P. M., Rogge, W. F., and Didyk, B. M.: Sugars-dominant water-soluble organic compounds in soils and characterization as tracers in atmospheric particulate matter, Environ. Sci. Technol., 38, 5939–5949, 2004a.
Simoneit, B. R. T., Kobayashi, M., Mochida, M., Kawamura, K., and Huebert, B. J.: Aerosol particles collected on aircraft flights over the northwestern Pacific region during the ACE-Asia campaign: Composition and major sources of the organic compounds, J. Geophys. Res., 109, D19S09, https://doi.org/10.1029/2004JD004565, 2004b.
Simoneit, B. R. T., Kobayashi, M., Mochida, M., Kawamura, K., Lee, M., Lim, H. J., Turpin, B. J., and Komazaki, Y.: Composition and major sources of organic compounds of aerosol particulate matter sampled during the ACE-Asia campaign, J. Geophys. Res., 109, D19S10, https://doi.org/10.1029/2004JD004598, 2004c.
Song, X. H., Polissar, A. V., and Hopke, P. K.: Sources of fine particle composition in the northeastern US, Atmos. Environ., 35, 5277–5286, 2001.
Stohl, A., Berg, T., Burkhart, J. F., Fjǽraa, A. M., Forster, C., Herber, A., Hov, Ø., Lunder, C., McMillan, W. W., Oltmans, S., Shiobara, M., Simpson, D., Solberg, S., Stebel, K., Ström, J., Tørseth, K., Treffeisen, R., Virkkunen, K., and Yttri, K. E.: Arctic smoke – record high air pollution levels in the European Arctic due to agricultural fires in Eastern Europe in spring 2006, Atmos. Chem. Phys., 7, 511–534, https://doi.org/10.5194/acp-7-511-2007, 2007.
Teil, M. J., Blanchard, M., and Chevreuil, M.: Atmospheric fate of phthalate esters in an urban area (Paris–France), Sci. Total Environ., 354, 212–223, 2006.
Thuren, A. and Larsson, P.: Phthalate esters in the Swedish atmosphere, Environ. Sci. Technol., 24, 554–559, 1990.
Wang, G. and Kawamura, K.: Molecular characteristics of urban organic aerosols from Nanjing: A case study of a mega-city in China, Environ. Sci. Technol., 39, 7430–7438, 2005.
Wang, G., Huang, L., Gao, S., Gao, S., and Wang, L.: Measurements of PM10 and PM2.5 in urban area of Nanjing, China and the assessment of pulmonary deposition of particle mass, Chemosphere, 48, 689–695, https://doi.org/10.1016/S0045-6535(02)00197-2, 2002a.
Wang, G., Kawamura, K., Lee, S., Ho, K. F., and Cao, J. J.: Molecular, seasonal, and spatial distributions of organic aerosols from fourteen Chinese cities, Environ. Sci. Technol., 40, 4619–4625, 2006.
Wang, G. H., Kawamura, K., Zhao, X., Li, Q. G., Dai, Z. X., and Niu, H. Y.: Identification, abundance and seasonal variation of anthropogenic organic aerosols from a mega-city in China, Atmos. Environ., 41, 407–416, https://doi.org/10.1016/J.Atmosenv.2006.07.033, 2007a.
Wang, G., Kawamura, K., Hatakeyama, S., Takami, A., Li, H., and Wang, W.: Aircraft measurement of organic aerosols over China, Environ. Sci. Technol., 41, 3115–3120, https://doi.org/10.1021/es062601h, 2007b.
Wang, G., Kawamura, K., Xie, M., Hu, S., Gao, S., Cao, J., An, Z., and Wang, Z.: Size-distributions of n-alkanes, PAHs and hopanes and their sources in the urban, mountain and marine atmospheres over East Asia, Atmos. Chem. Phys., 9, 8869–8882, https://doi.org/10.5194/acp-9-8869-2009, 2009.
Wang, G., Niu, S., Liu, C., and Wang, L.: Identification of dicarboxylic acids and aldehydes of PM10 and PM2.5 aerosols in Nanjing, China, Atmos. Environ., 36, 1941–1950, https://doi.org/10.1016/S1352-2310(02)00180-2, 2002b.
Wang, S., Xing, J., Jang, C., Zhu, Y., Full, J. S., and Hao, J.: Impact Assessment of Ammonia Emissions on Inorganic Aerosols in East China Using Response Surface Modeling Technique, Environ. Sci. Technol., 45, 9293–9300, 2011.
Watson, J. G.: Visibility: Science and Regulation, J. Air Waste Manage., 52, 628–713, 2002.
Watson, J. G., Chow, J. C., and Houck, J. E.: PM2.5 chemical source profiles for vehicle exhaust, vegetative burning, geological material, and coal burning in Northwestern Colorado during 1995, Chemosphere, 43, 1141–1151, 2001.
Weschler, C. J.: Indoor–outdoor relationships for non-polar organic constituents of aerosol particles, Environ. Sci. Technol., 18, 648–652, 1984.
Yang, H., Yu, J. Z., Ho, S. S. H., Xu, J. H., Wu, W. S., Wan, C. H., Wang, X. D., Wang, X. R., and Wang, L. S.: The chemical composition of inorganic and carbonaceous materials in PM2.5 in Nanjing, China, Atmos. Environ., 39, 3735–3749, 2005.
Yao, X., Lau, A. P. S., Fang, M., Chan, C. K., and Hu, M.: Size distributions and formation of ionic species in atmospheric particulate pollutants in Beijing, China: 2 – Dicarboxylic acids, Atmos. Environ., 37, 3001–3007, https://doi.org/10.1016/S1352-2310(03)00256-5, 2003.
Yttri, K. E., Dye, C., and Kiss, G.: Ambient aerosol concentrations of sugars and sugar-alcohols at four different sites in Norway, Atmos. Chem. Phys., 7, 4267–4279, https://doi.org/10.5194/acp-7-4267-2007, 2007.
Zhang, R. Y., Suh, I., Zhao, J., Zhang, D., Fortner, E. C., Tie, X. X., Molina, L. T., and Molina, M. J.: Atmospheric new particle formation enhanced by organic acids, Science, 304, 1487–1490, 2004.
Zhang, Q. J., Beekmann, M., Freney, E., Sellegri, K., Pichon, J. M., Schwarzenboeck, A., Colomb, A., Bourrianne, T., Michoud, V., and Borbon, A.: Formation of secondary organic aerosol in the Paris pollution plume and its impact on surrounding regions, Atmos. Chem. Phys., 15, 13973–13992, https://doi.org/10.5194/acp-15-13973-2015, 2015.
Zhang, Y. and Cao, F.: Fine particulate matter (PM2.5) in China at a city level, Scientific Reports, 5, 14884, https://doi.org/10.1038/srep14884, 2015.
Zhang, Y.-L. and Kawamura, K.: New directions: Need for better understanding of source and formation process of phthalic acid in aerosols as inferred from aircraft observations over China, Atmos. Environ., 140, 147–149, 2016.
Zheng, B., Zhang, Q., Zhang, Y., He, K. B., Wang, K., Zheng, G. J., Duan, F. K., Ma, Y. L., and Kimoto, T.: Heterogeneous chemistry: a mechanism missing in current models to explain secondary inorganic aerosol formation during the January 2013 haze episode in North China, Atmos. Chem. Phys., 15, 2031–2049, https://doi.org/10.5194/acp-15-2031-2015, 2015.