the Creative Commons Attribution 4.0 License.
the Creative Commons Attribution 4.0 License.
 | 09 Apr 2019
Measurements of spectral irradiance during the solar eclipse of 21 August 2017: reassessment of the effect of solar limb darkening and of changes in total ozone
Germar Bernhard
Boyan Petkov
Measurements of spectral irradiance between 306 and 1020 nm were performed with a GUVis-3511 multi-channel filter radiometer at Smith Rock State Park, Oregon, during the total solar eclipse of 21 August 2017. The radiometer was equipped with a shadowband, allowing the separation of the global (sun and sky) and direct components of solar radiation. Data were used to study the wavelength-dependent changes in solar irradiance at Earth's surface. Results were compared with theoretical predictions using three different parameterizations of the solar limb darkening (LD) effect, which describes the change in the solar spectrum from the Sun's center to its limb. Results indicate that the LD parameterization that has been most widely used during the last 15 years underestimates the LD effect, in particular at UV wavelengths. The two alternative parameterizations are based on two independent sets of observations from the McMath–Pierce solar telescope. When these parameterizations are used, the observed and theoretical LD effects agree to within 4 % for wavelengths larger than 400 nm and occultation of the solar disk of up to 97.8 %. Maximum deviations for wavelengths between 315 and 340 nm are 7 %. These somewhat larger differences compared to the visible range may be explained with varying aerosol conditions during the period of observations. The aerosol optical depth (AOD) and its wavelength dependence was calculated from measurements of direct irradiance. When corrected for the LD effect, the AOD decreases over the period of the eclipse: from 0.41 to 0.34 at 319 nm and from 0.05 to 0.04 at 1018 nm. These results show that AODs can be accurately calculated during an eclipse if the LD effect is corrected. The total ozone column (TOC) was derived from measurements of global irradiance at 306 and 340 nm. Without correction for the LD effect, the retrieved TOC increases by 20 DU between the first and second contact of the eclipse. With LD correction, the TOC remains constant to within natural variability (±2.6 DU or ±0.9 % between first and second contact and ±1.0 DU or ±0.3 % between third and fourth contact). In contrast to results of observations from earlier solar eclipses, no fluctuations in TOC were observed that could be unambiguously attributed to gravity waves, which can be triggered by the supersonic speed of the Moon's shadow across the atmosphere. Furthermore, systematic changes in the ratio of direct and global irradiance that could be attributed to the solar eclipse were not observed, in agreement with results of three-dimensional (3-D) radiative transfer (RT) models. Our results advance the understanding of the effects of solar LD on the spectral irradiance at Earth's surface, the variations in ozone during an eclipse, and the partitioning of solar radiation in direct and diffuse components.
- Article
(7792 KB) -
Supplement
(6275 KB) - BibTeX
- EndNote


A total solar eclipse could be observed on 21 August 2017 across the United States, from Oregon in the west to South Carolina in the east (Pasachoff, 2017). We performed measurements of global (direct sun plus sky) and diffuse (sky only) spectral irradiance during this event with a GUVis-3511 multi-channel radiometer, which was equipped with a shadowband to separate the two components. Data collected during this campaign can be used for studying processes initiated in the atmosphere by the passing of the Moon's shadow and for validating three-dimensional (3-D) radiative transfer (RT) calculations that simulate the irradiance at Earth's surface during the period of totality (Emde and Mayer, 2007). Similar observations have been used during previous solar eclipses to study wavelength-dependent changes in spectral irradiance (Blumthaler et al., 2006; Kazadzis et al., 2007; Kazantzidis et al., 2007), the change in the ratio of diffuse and direct irradiance over the period of the eclipse (Zerefos et al., 2000, 2001), short-term and longer-lasting fluctuations in the total ozone column (TOC; Antón et al., 2010; Kazadzis et al., 2007; Kazantzidis et al., 2007; Mateos et al., 2014; Mims and Mims, 1993; Zerefos et al., 2000, 2001, 2007), variations in the NO2 column (Adams et al., 2010), and comparison of measurements during totality with 3-D RT model results (Kazantzidis et al., 2007). We revisit some of these issues by focusing on the wavelength dependence of solar limb darkening (LD), ozone observations, and the changing direct and diffuse radiation. For example, some observations of changes in the TOC during an eclipse are contradictory. Increasing TOCs were reported for measurements from Dobson spectrophotometers (Bojkov, 1968) and Norsk institutt for luftforskning (NILU) UV multifilter instruments (Antón et al., 2010), while measurements with Brewer spectrophotometers generally decrease as an eclipse progresses (Kazadzis et al., 2007). These differences cannot be explained with a real change in TOC but must be an artifact from either measurement or data processing.
Our measurements were also used to assess the quality of data of the GUVis-3511 radiometer, which is a relatively new instrument type. For this purpose, a new method to calibrate the instrument was developed and is described in detail in the Supplement to this publication. Data from the campaign are available for download and can, for example, be used to study variations in radiation during totality with 3-D RT simulations.

Figure 1Panorama as seen from instrument location. Mountains are located in the west (W), north (N), and northeast and extend up to 12.5∘ above the horizon. Trees restrict the horizon in eastern (E) direction by up to 9∘. There is little (<5∘) obstruction towards the south (S). The green arrow marks the mountain used for calibrating the elevation scale (red lines).
The total eclipse was observed at Smith Rock State Park, located in Oregon between Bend and Madras. The partial eclipse started at 16:06:27 UT (first contact, local time of 9:06:27 PDT – Pacific Daylight Time) and ended at 18:41:02 UT (fourth contact, 11:41:02 PDT). Totality occurred for 1 min and 25 s, between 17:19:42 (second contact, 10:19:42 PDT) and 17:21:07 UT (third contact, 10:21:07 PDT). All times from here onward refer to UT. The GUVis-3511 radiometer was set up at 44.362950∘ N and 121.139667∘ W, 867 m a.s.l. The site was approximately 37 km south of the centerline of the Moon's shadow (e.g., the line where the duration of totality is the longest). The ground surrounding the instrument was covered by dry grass. The park's prominent mountain peaks were mostly in the west, north, and northeast of the instrument (Fig. 1) and extended up to 12.5∘ above the horizon. The average extension was 5.75∘. By assuming isotropic sky radiance distribution, we determined that objects above the horizon reduced the (cosine-weighted) diffuse irradiance by about 1.1 %. Data were not corrected for this effect.
The state of Oregon experienced a total of 1069 reported wildfires in 2017, burning a total area of 451 863 acres or 1829 km2 (https://en.wikipedia.org/wiki/2017_Oregon_wildfires, last access: 30 August 2018). There were several active wildfires in the vicinity of the observation site, and the air was filled with smoke and aerosols during the days preceding the eclipse. However, a few hours before the start of the eclipse, the wind direction changed and the aerosol loading decreased substantially. Aerosol optical depths (AODs) measured shortly before and after the eclipse period are discussed in Sect. 7.3. The sky was free of clouds in the direction of the Sun, with small clouds lingering only near the horizon.
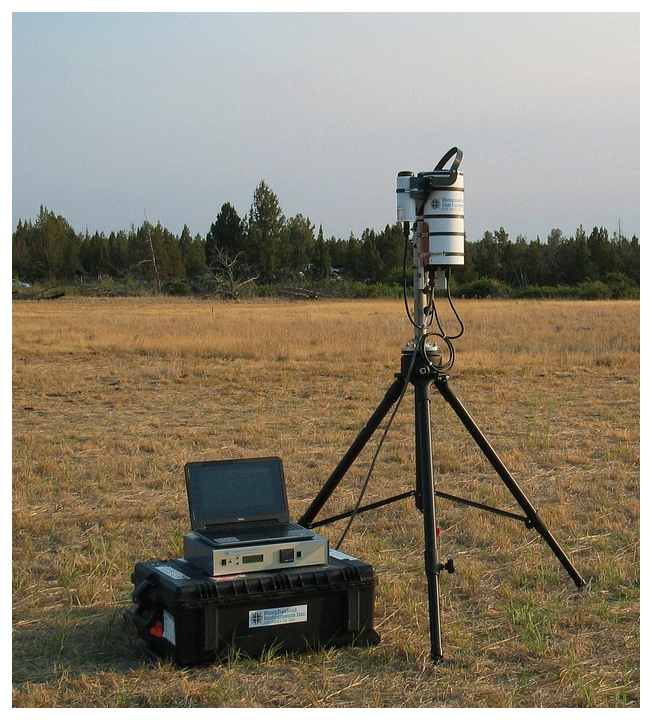
Figure 2Setup of the GUVis-3511 radiometer at Smith Rock State Park. The radiometer (white cylinder), BioSHADE assembly, and BioGPS are mounted on a tripod. Shown next to the instrument is the laptop for recording the data, the instrument's control unit, and a black case containing the power source.
Measurements were performed with a GUVis-3511 multi-channel filter radiometer (Seckmeyer et al., 2010) designed and built by Biospherical Instruments Inc. (BSI). The system was set up on a sturdy tripod (Fig. 2) and powered by a 12 V dry-cell car battery and a sine-wave inverter.
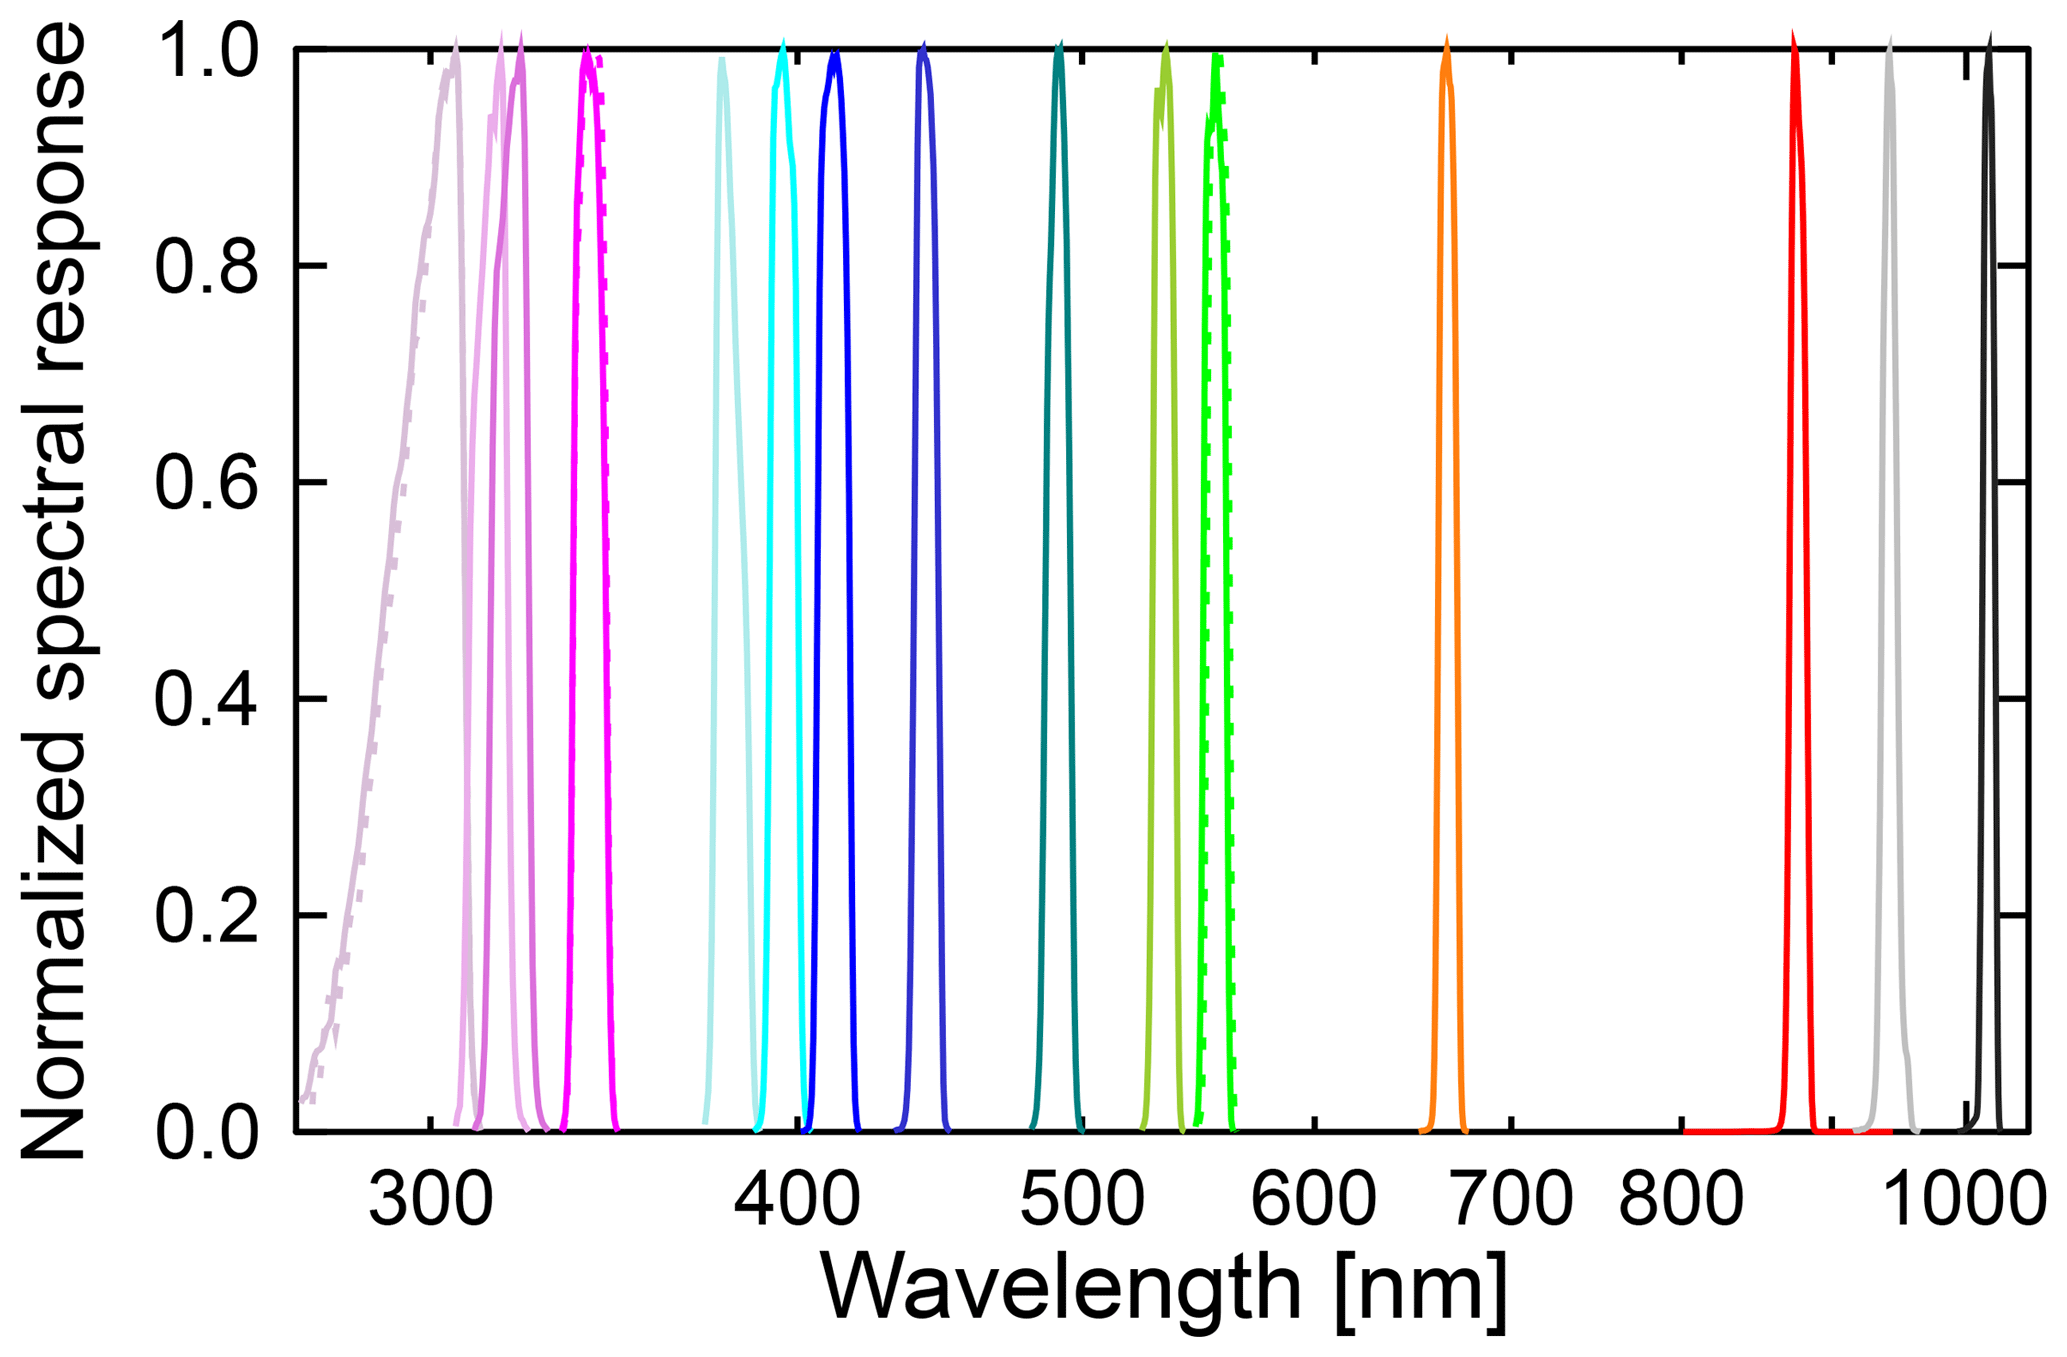
Figure 3Normalized spectral response functions of the GUVis-3511 radiometer discussed in this study. Functions were measured with BSI's spectral tester (Bernhard et al., 2005a) and corrected for the finite bandpass of the tester using a simple deconvolution routine also described by Bernhard et al. (2005a). Color coding is identical to that in Fig. 8. Note that the x axis is logarithmic to emphasize the UV range. A version of the figure, plotted separately for UV, visible, and IR wavelengths, is part of the Supplement.
The instrument was equipped with 18 channels with the following nominal wavelengths (nm): 305, 305, 313, 320, 340, 340, 380, 395, 412, 443, 490, 532, 555, 555, 665, 875, 940, and 1020. The spectral bandwidth of all channels is approximately 10 nm full width at half maximum (FWHM), with the exception of the two channels at 305 nm, which have a bandwidth of 18.5 nm. Spectral response functions of these channels are shown in Fig. 3 and were used for the calibration of the instrument (Sect. 4 and Supplement). Data from a 19th channel measuring photosynthetic active radiation (PAR) were not used in this study. Each channel uses a hard-coated, ion-assisted deposition interference filter plus bandpass filters for additional out-of-band rejection that are coupled to a “microradiometer” (Morrow et al., 2010). Microradiometers consist of a silicon photodiode, three-stage preamplifier, 24 bit analogue-to-digital converter, microprocessor, and an addressable digital port. Data streams from the 19 microradiometers were combined and transmitted via a USB interface to a laptop computer. Measurements at 305, 340, and 555 nm were performed with two channels using either a standard production photodiode (model S1226 from Hamamatsu) or an alternative photodiode (model S12698 from Hamamatsu), respectively, for evaluation purposes. The instrument's internal temperature was stabilized to 40±0.5 ∘C.
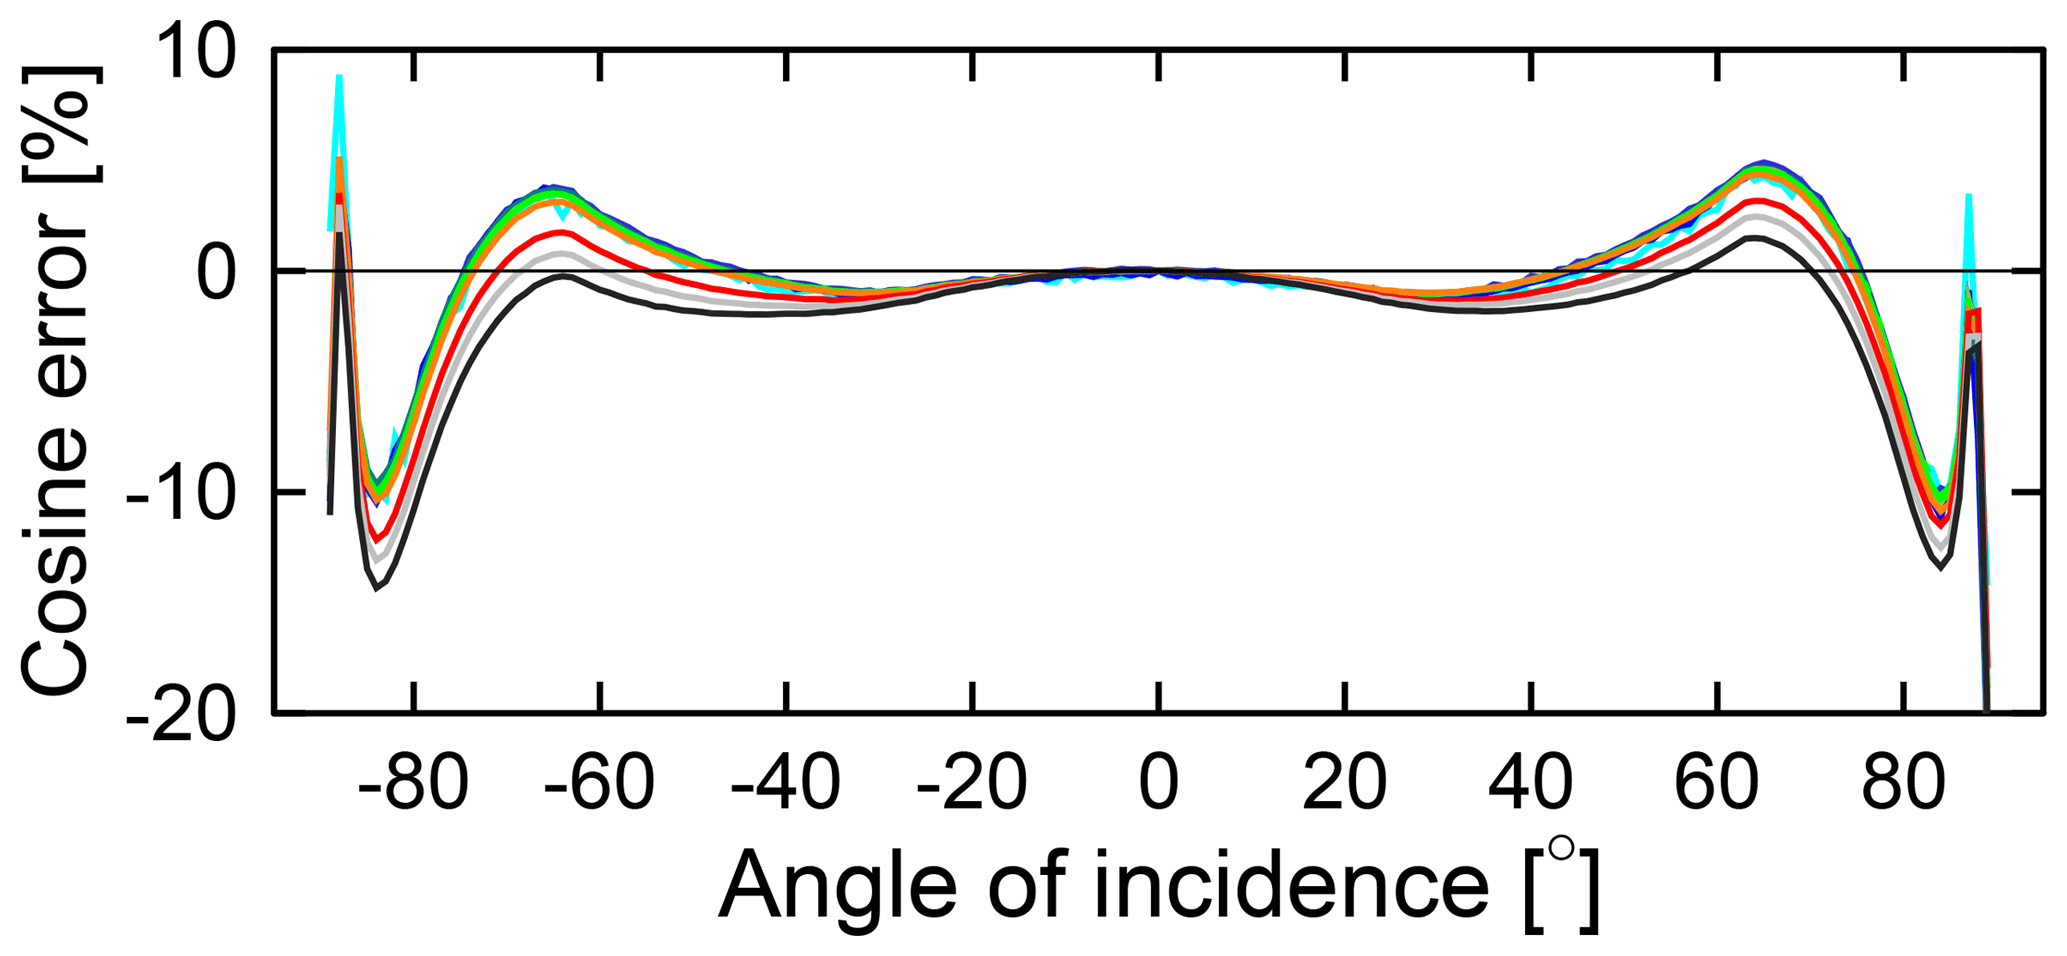
Figure 4Cosine error of the GUVis-3511 radiometer in one azimuthal plane at wavelengths between 395 and 1020 nm. Color coding is identical to that of Fig. 8. Measurements performed at the orthogonal plane are similar. Measurements at wavelengths below 395 nm are affected by noise and are not shown for clarity. (A figure with cosine errors in the UV is provided in the Supplement.)
The filtered microradiometers point at the center of an irradiance collector, which features a composite diffuser made of layers of generic and porous polytetrafluoroethylene (PTFE) sheets (Hooker et al., 2012). This design leads to relatively small cosine errors (Seckmeyer and Bernhard, 1992) also in the infrared (IR), where the scattering properties of traditional PTFE diffusers are typically degraded. The directional response of the collector is virtually independent of wavelength for wavelengths smaller than 800 nm; for larger wavelengths, the response is slightly lower (Fig. 4). Measurements of the cosine error at wavelengths below 395 nm are affected by noise due the low UV output of the incandescent lamp used for the characterization. Corrections for the cosine error of UV channels described further below are based on the measured cosine error at 395 nm. Cosine errors of all channels are smaller than ±5 % for incidence angles smaller than 78∘. The error in measuring isotropic radiation is smaller than 0.3 % for wavelengths smaller than 800 nm and −1.8 % (worst case) for the 1020 nm channel.
The radiometer was equipped with a computer-controlled shadowband, called BioSHADE (Morrow et al., 2010). The band obstructs a wedge of the sky with a width of 15∘ when the band is vertical and 13∘ when it is horizontal. The band can either be “stowed” below the instrument's diffuser for measuring global spectral irradiance or move slowly over the instrument to collect data for calculating the direct spectral irradiance from the solar beam with an algorithm developed for the BioSHADE (Morrow et al., 2010; Witthuhn et al., 2017). In brief, the algorithm first determines the spectral irradiance when the centers of diffuser, shadowband, and Sun are collinear. This is the spectral irradiance from the sky minus the portion of the sky that is shaded by the band. Next, the spectral irradiance from the direct sun plus the unshaded portion of the sky is obtained by analyzing several seconds of measurements when the shade from the band is close to the diffuser but not in contact with it. These measurements are then combined with the directional test data (Fig. 4) and measurements of global spectral irradiance to calculate cosine-error-corrected global and direct spectral irradiances. The algorithm compensates for the effect of the relatively large width of the shadowband, resulting in AOD data that have similar accuracy than those of traditional shadowband radiometers, which use measurements on either side of the Sun to correct for the portion of the sky that is obscured by the band. For example, side-band measurements of the multifilter rotating shadowband radiometer (MFRSR) are typically performed at 9∘ from the center of the Sun (Krotkov et al., 2005) and therefore may not adequately measure circumsolar radiation. Our algorithm alleviates this problem. The uncertainty of our method was estimated by Witthuhn et al. (2017). The AOD can be retrieved with an uncertainty of 0.02 for all channels within a 95 % confidence interval.
For observing the solar eclipse, the band was programmed to perform one shadowband sweep every 2 min, between 14:36 and 19:30. Within each 2 min window, this configuration resulted in 45 s of global spectral irradiance measurements (with the shadowband stowed and applying a sampling rate of 1 Hz) and 75 s of data during which the band rotated by 180∘. The sampling rate was set to 15 Hz during these “sweeps” to adequately resolve the short period when the band's shadow moves over the diffuser. The system is also equipped with a GPS receiver, termed BioGPS, which was used to determine the geoposition specified in Sect. 2.
The GUVis-3511 radiometer was calibrated using a new method described in the Supplement of this publication. Calibrated measurements report the solar spectral irradiance at the instrument's collector at a spectral resolution of 1 nm. More specifically, calibrated measurements resemble measurements of a hypothetical spectroradiometer with a slit function s(λ), where s(λ) is a triangular function with a bandwidth of 1 nm FWHM. For the channels with nominal wavelengths of 305 and 313 nm, the instrument was vicariously calibrated against measurements of a SUV-100 spectrometer, which has a spectral resolution of 1 nm. All other channels were calibrated using a calibration lamp traceable to a standard issued by the US National Institute of Standards and Technology. The calibration methods takes into account that the bandwidth of GUVis-3511 channels is about 10 nm FWHM (18.5 nm for the channels at 305 nm). The calibration was further optimized for the conditions (solar zenith angle, TOC, AOD, etc.) at the measurement site. Details of this optimization are provided in the Supplement. Results indicated that it is advantageous to calibrate the channels with nominal wavelengths of 305 and 313 nm for spectral irradiance at 306 and 315 nm, respectively, and measurements reported in the following are therefore referenced to these two wavelengths. Both direct and global irradiance measurements were corrected for the cosine error of the instrument's collector as described by Morrow et al. (2010), based on the measured cosine error (Fig. 4) and the ratio of direct and global irradiance extracted from the shadowband measurements. Finally, an uncertainty budget was established. Expanded (k=2, equivalent to a confidence interval of 95 %) uncertainties for the 305 and 313 nm channels are 7.5 % and 7.3 %, respectively. Expanded uncertainties of all other channels, with the exception of the 940 nm channel, are 2.7 %. An uncertainty budget for the 940 nm channel is not provided here because of the large effect of water vapor on measurements at this wavelength. Measurements of this channel should therefore be interpreted with caution.
Secondary data products derived from the measurements of the GUVis-3511 include the AOD and TOC.
5.1 Aerosol optical depth
Aerosol optical depth τa was calculated from calibrated direct measurements and Beer–Lambert's law:
where the following apply.
-
is the response-weighted direct irradiance measured by the instrument (see Supplement for definition).
-
is the extraterrestrial solar spectrum as defined in Sect. S1.1.1 of the Supplement at 1 astronomical unit (AU), weighted with the response functions of the GUVis-3511.
-
ρ scales the extraterrestrial solar spectrum from 1 AU to the Sun–Earth distance applicable to 21 August 2017.
-
τr is the Rayleigh optical depth calculated with Eq. (30) of Bodhaine et al. (1999).
-
μr is the Rayleigh air mass factor, calculated according to Kasten and Young (1989).
-
τo is the ozone optical depth derived from the ozone absorption cross section by Bass and Paur (1985), assuming a TOC of 298 DU.
-
μo is the ozone air mass factor calculated with Eq. (11) of Bernhard et al. (2005b), assuming an ozone layer height of 22 km.
-
μa is the aerosol air mass factor calculated with Eq. (11) of Bernhard et al. (2005b), assuming an aerosol layer 2 km above the surface.
Aerosol optical depth τa is reported at the centroid wavelength (Seckmeyer et al., 2010) of each channel. Aerosol optical depth was not calculated for the two 305 nm channels because of the large bandwidth of these channels and the strong interference with ozone absorption at this wavelength. Both factors lead to large uncertainties.
5.2 Total ozone column
The TOC during the eclipse was derived from measurements of response-weighted global irradiance measured by the GUVis-3511 (see Supplement for definition of . Specifically, ratios of were compared with similar ratios in look-up tables that were calculated with an RT model (also described in the Supplement) as a function of solar zenith angle (SZA) and TOC. The following three wavelength pairs were used: (1) λL=340 nm, λS=305 nm; (2) λL=340 nm, λS=313 nm; and (3) λL=313 nm, λS=305 nm. This method was first proposed by Stamnes et al. (1991) and was further validated by Bernhard et al. (2003, 2005b). The application of the method to GUV instruments was described by Bernhard et al. (2005a). By analyzing the sensitivity of TOC to changes in the irradiance ratio and by quantifying the noise in the measurements of the 305 and 340 nm channels (wavelength pair 1), we determined that our measurements are able to detect changes in ozone of 0.14 DU (0.05 %) at the start and 0.10 DU (0.03 %) at the end of the eclipse at the 95 % confidence level for constant aerosol conditions. The additional uncertainty in TOC values due to changing AODs was determined to be 1.5 DU (0.5 %). While TOCs could also be derived from direct irradiances, these measurements are not discussed here due to the relatively large uncertainty in calculating direct irradiance from shadowband data at wavelengths in the UV-B (280–315 nm), in particular at large SZAs.
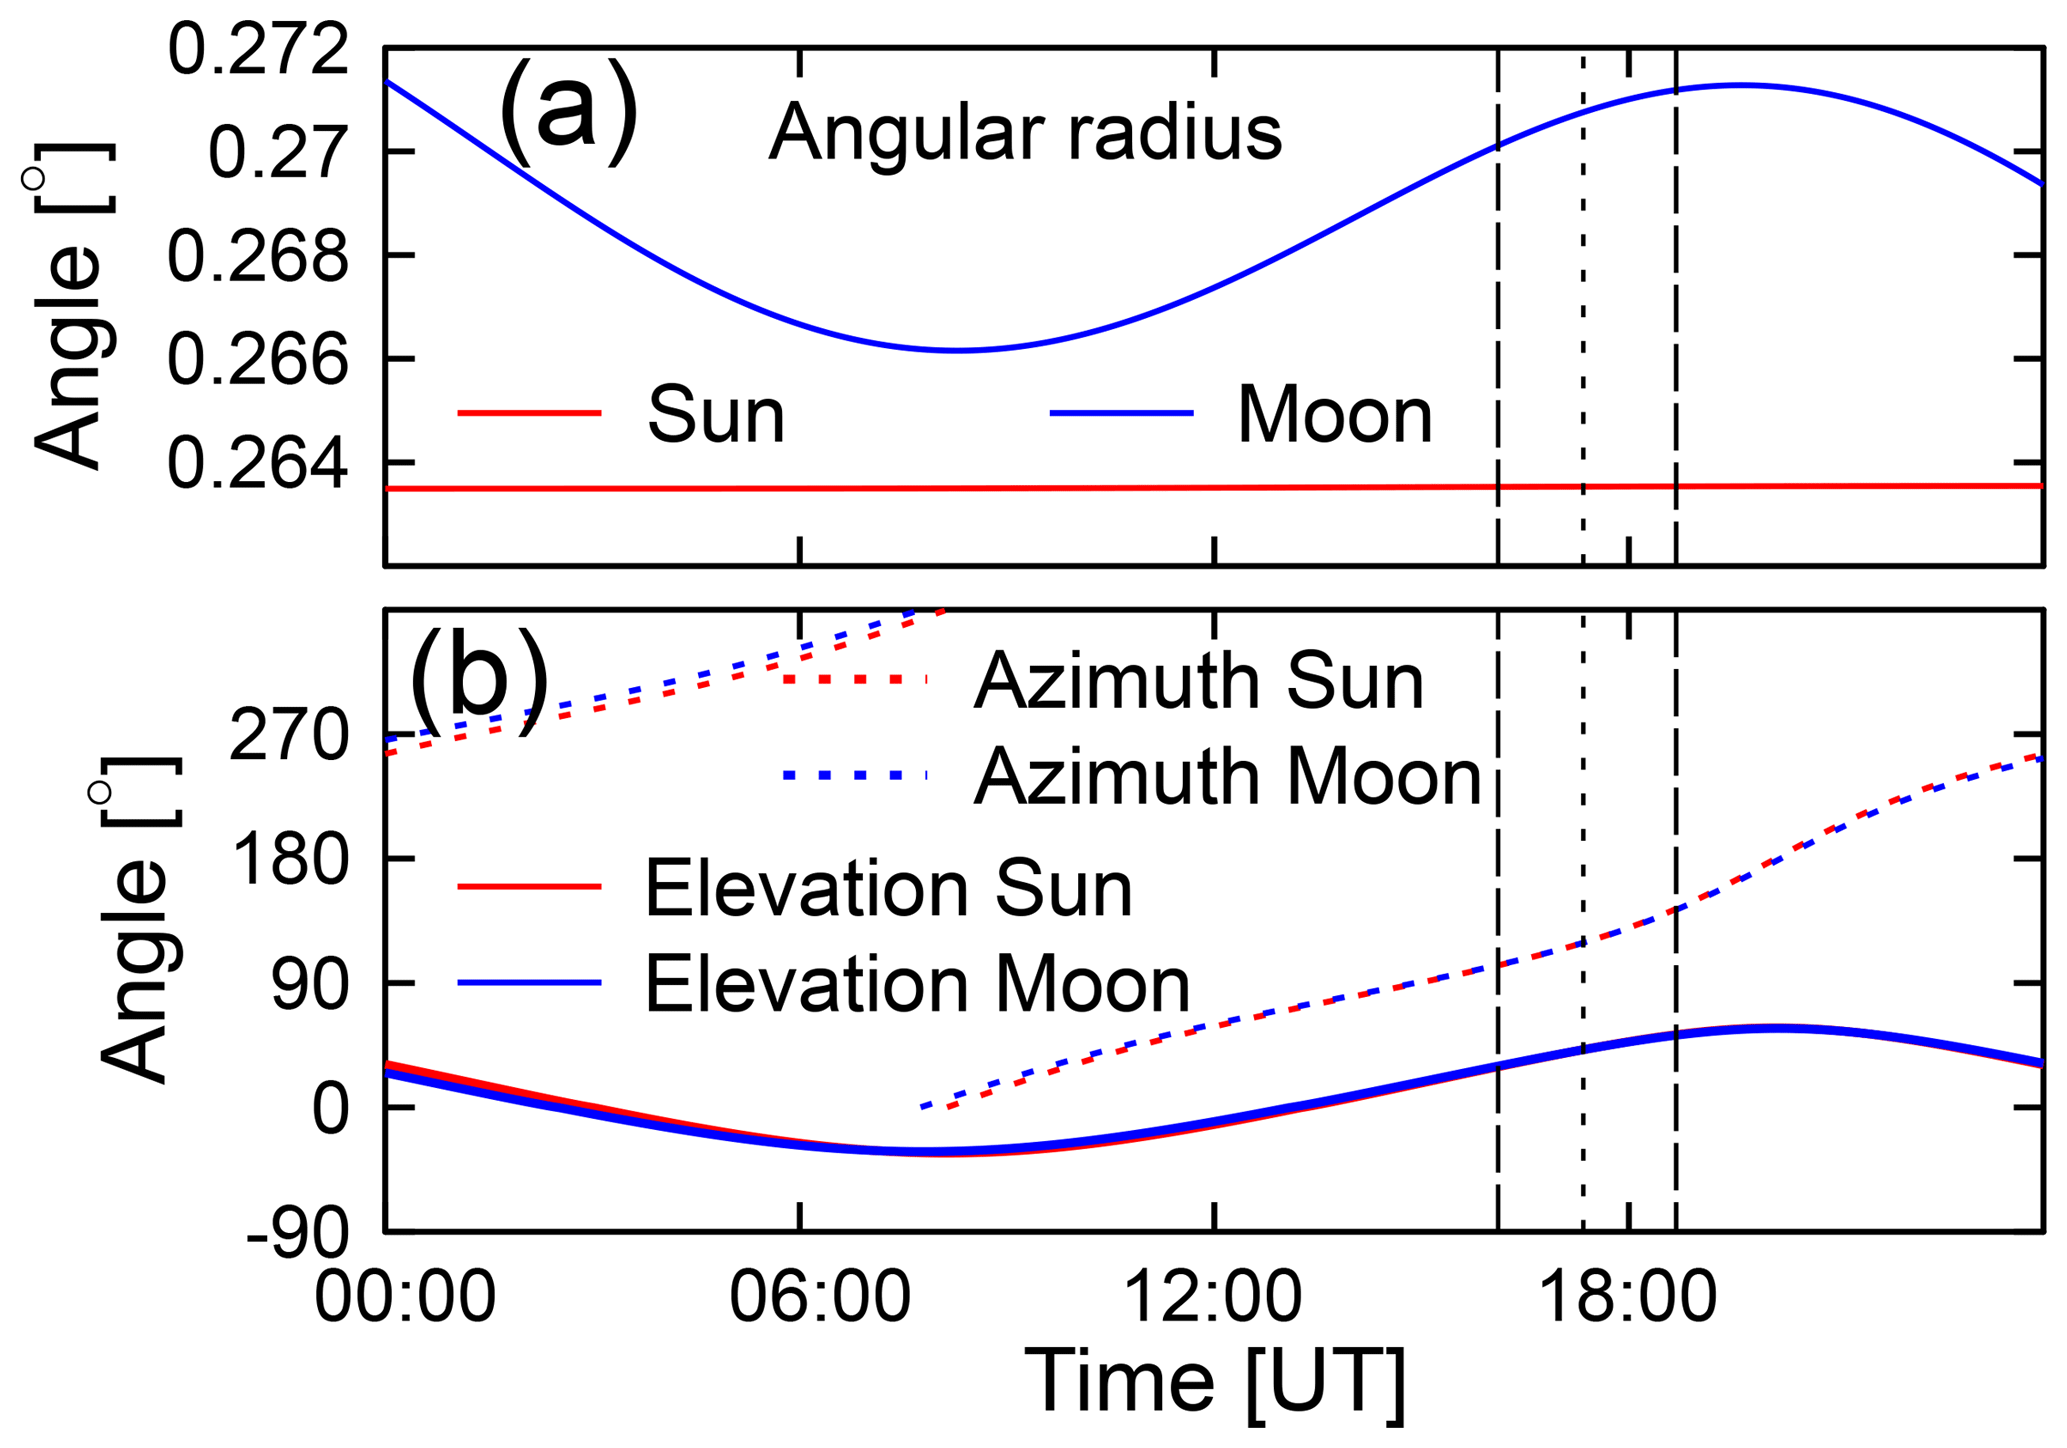
Figure 5(a) Apparent angular radii of Sun and Moon on 21 August 2017. The apparent radius of the Sun is virtually constant over time, while the radius of the Moon varies considerably during the day due to the rotation of the Earth, which changes the distance between two hypothetical observers standing on the Earth and the Moon. (b) Corresponding solar and lunar elevation and azimuth angles. Note the conversion of the curves at the time of maximum eclipse (short-dashed vertical line). Long-dashed lines indicate the times of the first and fourth contact.
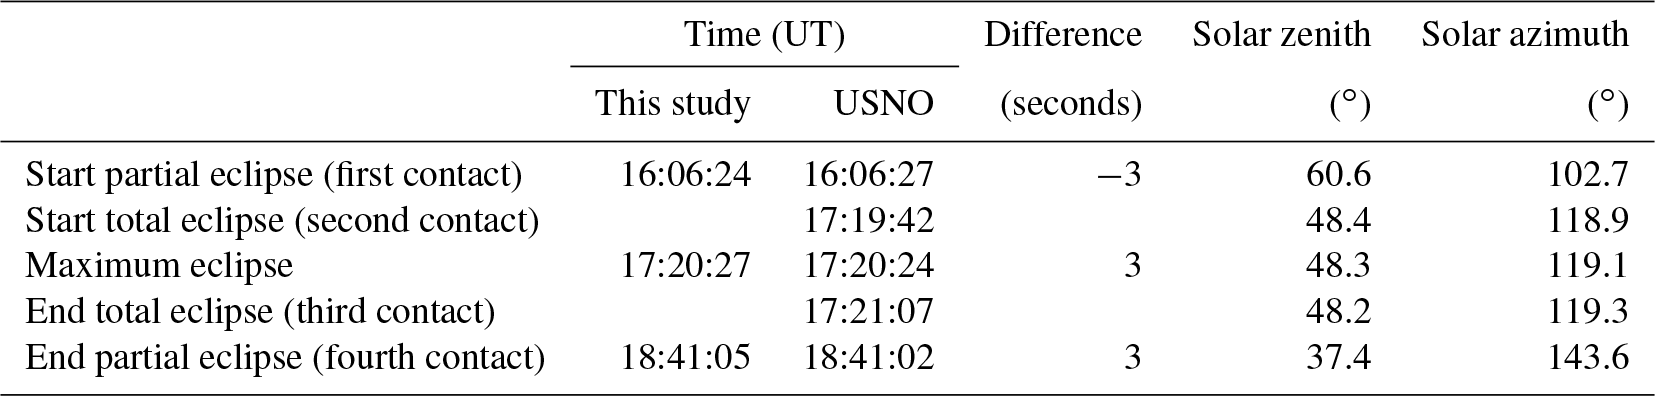
Table 1Comparison of eclipse calculations in this study and by USNO.
The interpretation of measurements performed during the solar eclipse requires very accurate calculations of the relative distance between Sun and Moon and angular diameters of both celestial bodies. Such calculations are provided by the HORIZONS online solar system data and ephemeris computation service of the Jet Propulsion Laboratory (https://ssd.jpl.nasa.gov/?horizons, last access: 13 January 2018). From the many parameters made available through this system in time intervals of 1 min, we used the elevation, azimuth, and angular radius of the Sun (θS, ϕS, and δS) and Moon (θM, ϕM, and δM), calculated the angular distance ξ between the Sun and Moon via
and interpolated these measurements to the times of our measurements (Fig. 5). The eclipse begins and ends when , and the maximum eclipse is observed when ξ is at its minimum. The start (first contact), “maximum eclipse”, and end (fourth contact) times calculated with this method were compared with solar eclipse data calculated with an online calculator provided by the Astronomical Applications Department of the US Naval Observatory (USNO) at http://aa.usno.navy.mil/data/docs/Eclipse2017.php (15 January 2018). Results of our calibration and those by the USNO are compared in Table 1 and agree to within ±3 s, giving confidence in our calculations. Note that the period between first contact and maximum is about 6.5 min shorter than the period between maximum and fourth contact.
The fraction of the solar disk seen by the GUVis-3511 and the change in the extraterrestrial spectrum as function of time during the progression of the eclipse were calculated with the algorithm by Koepke et al. (2001). Koepke et al. (2001) uses a simple analytical formula to describe the wavelength dependence of solar LD, which only considers the temperature at the Sun's surface (Waldmeier, 1941). We also use two other parameterizations of the LD functions that are based on data collected by the McMath–Pierce solar telescope of the National Solar Observatory on Kitt Peak. Specifically, the function Γλ(r) defined in Eq. (2.1) of Koepke et al. (2001) was replaced with the polynomial
where the angle of incidence ψ is defined in Fig. 6, and the coefficients ak(λ) were derived from measurements at Kitt Peak. The quantity Γλ(r) used by Koepke et al. (2001) depends on the distance r between a point on the solar disk and the center of Sun, relative to the radius of the Sun, RS (Fig. 6). The angle ψ was calculated from r using basic trigonometry.

Figure 6Limb darkening geometry. The Sun is centered at point O and has the radius R. The observer is at point P at a distance RSE from the center of the Sun and is looking at point S on the surface of the Sun. From the point of view of the observer, S is at an angle δr relative to the center of the Sun, and the Sun's limb is at angle δS. The angular radius of the solar disk as viewed by the observer is RS, and the angular radius associated with S is r. ψ is the angle between the Sun's normal at S and the line between S and P.
Two sets of coefficients ak(λ) were used in this study. The first set was developed by Pierce and Slaughter (1977; PS) and Pierce et al. (1977; PSW) using measurements collected between 1974 and 1976 near a minimum of solar activity. These coefficients are tabulated in Table IV of PS (wavelength range 303.327–729.675 nm) and Table IV of PSW (740.46–1046.7 nm). The second set was published by Neckel (2005), using measurements performed in 1986 and 1987 near the following solar minimum, and these coefficients are listed in Table I of Neckel (2005; 300–1100 nm). Both sets of data were collected with the observatory's large vertical spectrograph, which consists of a double monochromator with prism pre-disperser. Measurements across the solar disk were taken by stopping the telescope drive to let the Sun pass across the entrance port of the radiometer.
We note that different parameterizations are used by Neckel (2005) for the wavelength ranges 300.00–372.98 nm, 385.00–422.57 nm, and 422.57–1100 nm, but no parameterization is provided for the range of 372.98–385.00 nm because this range is affected by the Balmer “jump” in the absorption of the hydrogen atom resulting in a large uncertainty in the solar LD function in this wavelength range. We compare our measurements at 380 nm with the parameterization developed for the 385.00–422.57 nm range.
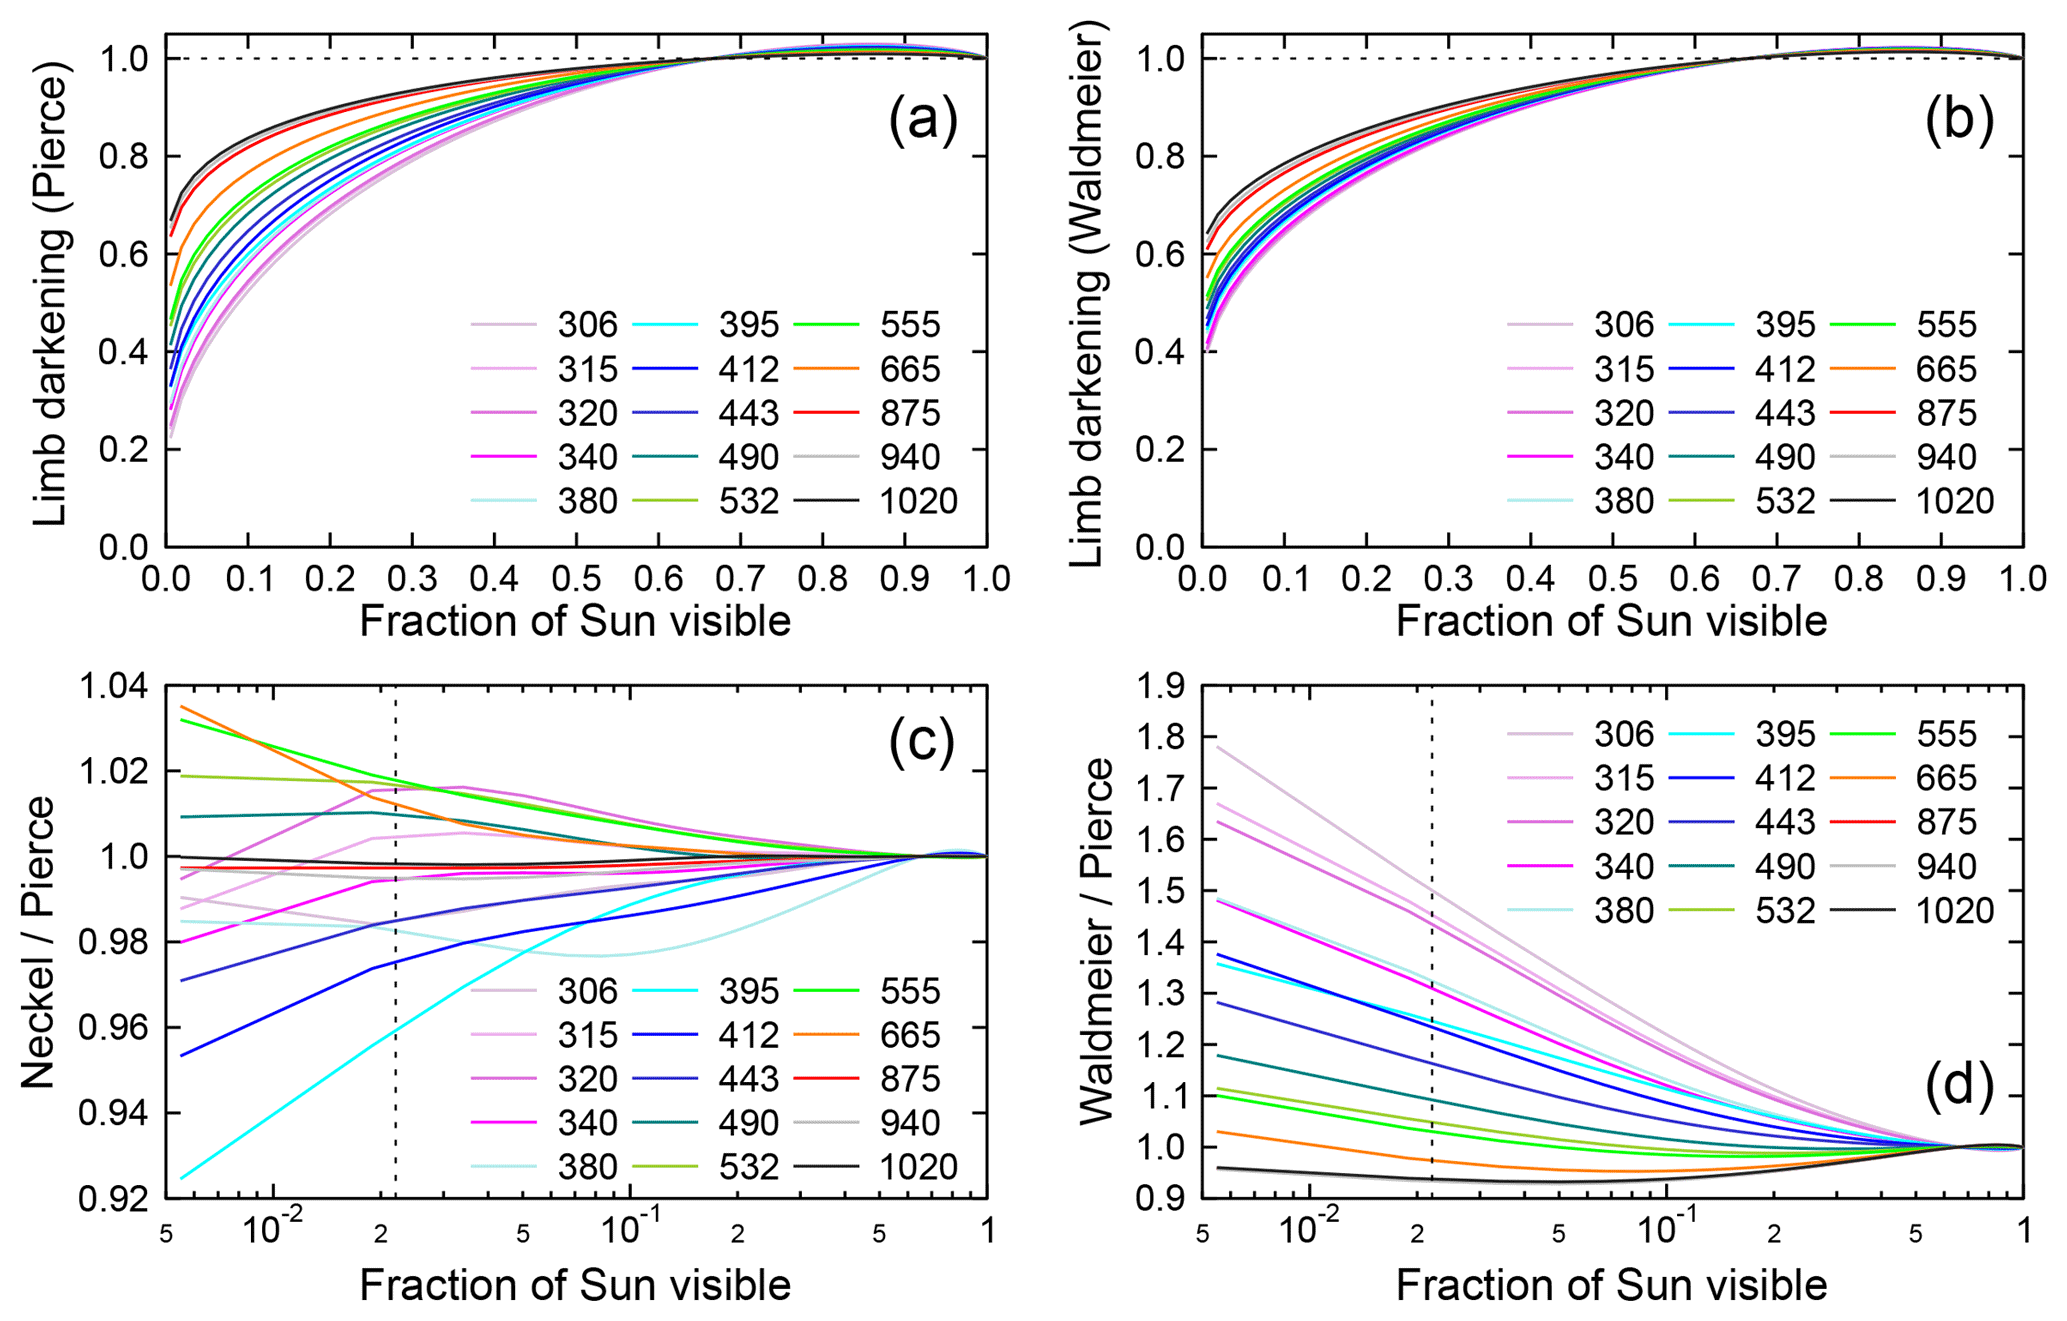
Figure 7Comparison of the solar LD effect calculated with the parameterizations by Pierce, Neckel, and Waldmeier. (a, b) Ratios of the extraterrestrial solar spectral irradiance during the eclipse to the spectral irradiance from a hypothetical Sun without LD, plotted versus the fraction of the Sun that is visible. (a) and (b) are based on the parameterizations by Pierce and Waldmeier, respectively. (c, d) Ratios of LD effect calculated by the parameterizations by Neckel and Pierce (c) and by Waldmeier and Pierce (d). The vertical broken line indicates the minimum fraction of 0.022 (2.2 % of the Sun's disk) that could be assessed with our measurements.
Figure 7 compares results of the three parameterizations, referred to in the following as the parameterizations by Waldmeier, Pierce, and Neckel. Figure 7a is based on the parameterization by Pierce and shows ratios of the extraterrestrial solar spectral irradiance during the eclipse to the spectral irradiance that would be expected if the Sun were a uniformly bright star. Results are plotted versus the fraction of the Sun's area that is visible (0 = Sun completely occluded by Moon, 1 = Sun completely visible). The LD effect is strongly dependent on wavelength: when the Sun is almost completely eclipsed, the spectral irradiance at 306 nm is reduced to about 22 % of the intensity that would be expected from purely geometrical considerations, whereas the spectral irradiance at 1020 nm is only reduced to about 67 %. Figure 7a also indicates that the LD effect is slightly positive when 66 % or more of the Sun's area is visible. In these cases, the Moon occludes the darker, outer parts of the Sun, and the average intensity of the visible area is therefore larger than that of a hypothetical, uniformly bright star.
Figure 7b shows similar results but is based on the parameterization by Waldmeier. For wavelengths larger than 500 nm, the LD effect is similar to that calculated with the parameterization by Pierce. For smaller wavelengths, results derived with the parameterization by Waldmeier indicate a much weaker LD effect.
Figure 7c shows the ratio of the LD effect calculated with the parameterization by Neckel and Pierce. Results for the two parameterizations agree to within ±2.3 % when 5 % or more of the Sun is visible. The largest difference of 7.6 % is observed at 395 nm when only 0.6 % of the Sun is still visible. On the other hand, results between the Waldmeier and Pierce parameterizations differ by as much as a factor of 1.78 (Fig. 7d).
In this section, we validate the solar LD parameterizations by the three methods discussed in Sect. 6; present the ratio of direct-to-global irradiance; show the AOD and TOC derived from our measurements before, during, and after the eclipse; and compare measurements near and during totality with reconstructed measurements for the same period but without the Moon occluding the Sun.
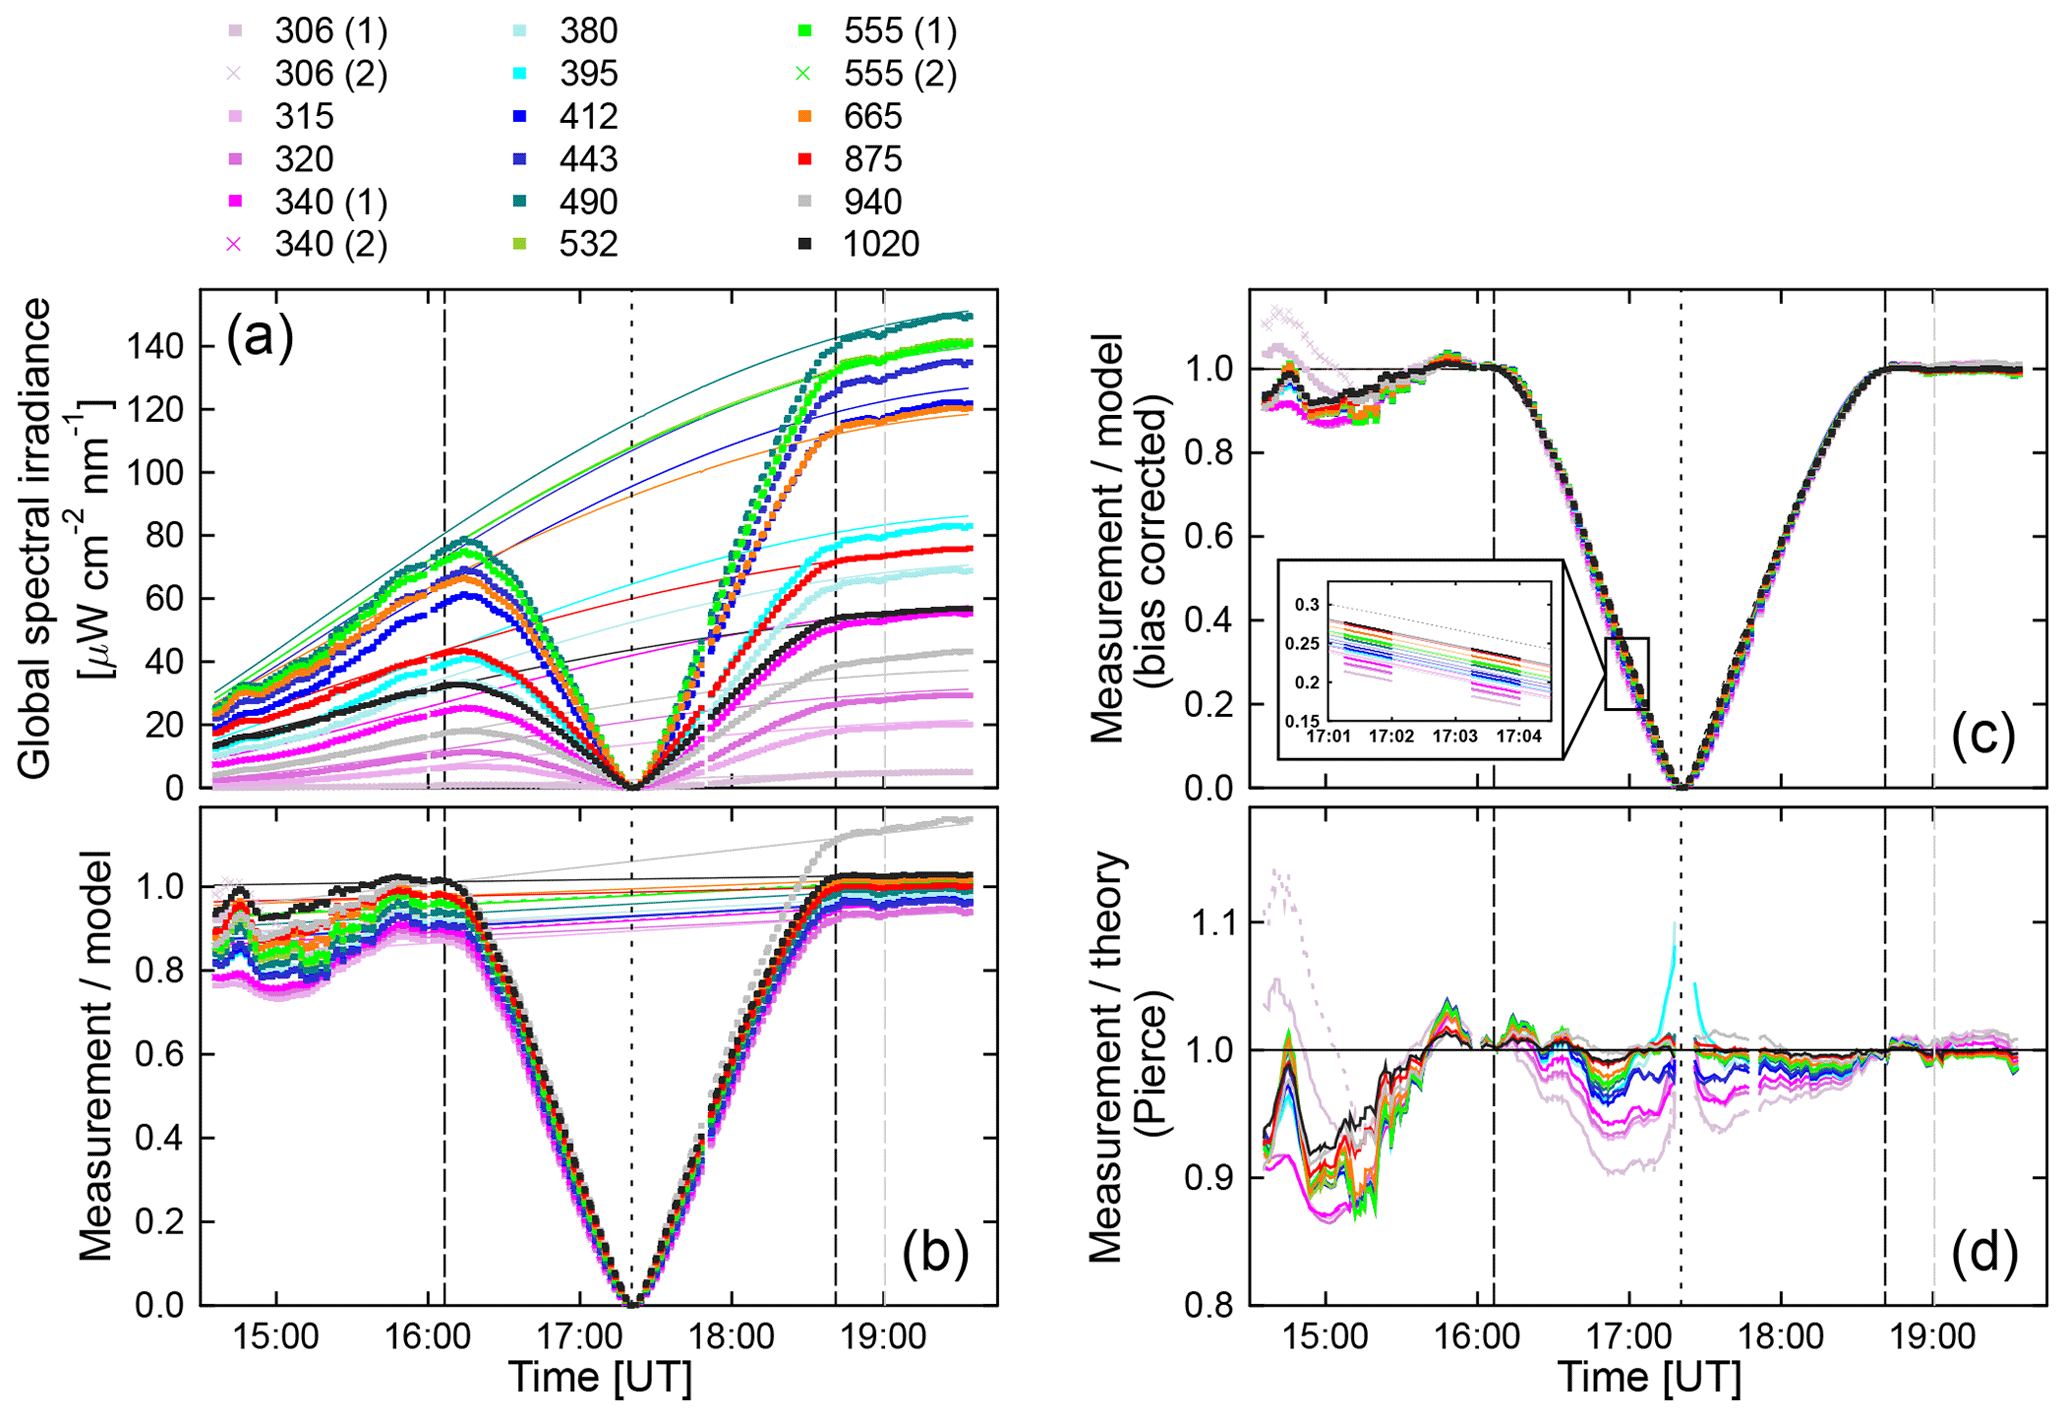
Figure 8Comparison of the solar LD effect derived from measurements of global spectral with theoretical predictions based on the parameterizations by Pierce. (a) Measurements of global spectral irradiance (symbols) and results of the RT calculations described in Sect. S1.1.1 of the Supplement (lines). Only every 20th data point is plotted for clarity. (b) Ratio of measurement and model (symbols). Lines connect the ratios at the times of the first and fourth contact, which are indicated by the vertical long-dashed lines. (c) Ratio of measurement and model, corrected for the bias between measurement and model (symbols). The insert shows this ratio for times between 17:01:00 and 17:04:30. The theoretical LD effect calculated with the parameterizations by Pierce is also shown and indicated with lines. (d) Ratio of bias-corrected measurements (symbols in c) and theoretical prediction (lines in c). Ratios for the alternative channels at 306, 340, and 555 nm are indicated with broken lines and are virtually indistinguishable from those using the standard photodiode, which are indicated by solid lines. The time of maximum eclipse is indicated by the short-dashed black line. The dashed grey line specifies the time of 19:00:30 for which the AOD used by the model calculations was derived. The legend on top of the figure indicates spectral irradiance (in nm).
7.1 Effect of solar limb darkening
Theoretical predictions of the solar LD effect described in Sect. 6 were compared with the LD effect derived from our measurements (Fig. 8). To account for the change in SZA, data were first compared with results of the RT model described in the Supplement. Model input parameters (e.g., AOD) are based on the measurement at 19:00:30 (shortly after the end of the eclipse) as described in Sect. 7.3. The only model parameter changing as a function of time is the SZA. Figure 8a shows a comparison of measurements of global spectral irradiance (symbols) and these model calculations (thin lines). The agreement between measurement and model for times outside the period of the eclipse is reasonable but not perfect. The ratio of measurement and model is shown in Fig. 8b. At 19:00:30 (i.e., the time relevant for the input parameters of the RT calculations) the ratio varies between 0.958 and 1.027, except at 315 and 320 nm (where the ratio is 0.932) and at 940 nm (ratio of 1.139) due to the uncertainty of the water vapor column affecting this wavelength. The discrepancy between measurement and model at the start of the eclipse is generally larger, likely due to the change in the AOD, which was not considered by the model. To correct for the difference between measurement and model, linear functions were constructed to match the ratio of measurement and model at the times of the first and fourth contact (thin lines in Fig. 8b). This correction assumes that changes in the atmospheric constituents (aerosols, ozone, etc.) led to a linear change in the atmospheric transmission over the period of the eclipse. Next, ratios of measurement and model were normalized by dividing by these linear functions. The resulting bias-corrected ratios represent the LD effect derived from our measurements (symbols in Fig. 8c). Thin lines in that figure show the theoretical LD effect calculated with the parameterization by Pierce. The insert of Fig. 8c shows both datasets for the time between 17:01:00 and 17:04:30, indicating that there is almost perfect agreement for wavelengths larger than 400 nm, but measurements at UV wavelengths are below the theoretical prediction.
Lastly, the measured LD effect was divided by the theoretical data, and the resulting ratios are shown in Fig. 8d. For wavelengths larger than 400 nm, measurement and theory agree better than ±4.0 %. When excluding the period between 16:44 and 17:00, which was affected the most by aerosols during the duration of the eclipse, the agreement is to within ±2.5 %. For times outside of ±7 min from totality, measurement, and theory for 380 and 395 nm also agree within this range. The larger discrepancy closer to totality is likely caused by the uncertainty of the theoretical prediction due to the Balmer jump affecting these wavelengths. The discrepancy between measurement and theory for wavelengths below 380 nm (306–340 nm) becomes larger than 3 % as totality is approached, with the smallest wavelengths showing the largest change (e.g., the ratio is 0.90 for 306 nm at 17:01). For these wavelengths, the discrepancy is generally larger before totality than after totality. We suspect that this asymmetry is caused by changing aerosols and note that the measured LD effect is lower than the theoretical prediction, both for wavelengths affected by ozone absorption (306, 315, and 320 nm) and wavelengths not affected by ozone absorption (340 nm). Hence, the larger discrepancy at these UV wavelengths (and the asymmetry relative to totality) cannot solely be caused by ozone absorption in the atmosphere. Results for wavelengths that were measured independently by two channels (306, 340, and 555 nm) are virtually indistinguishable, suggesting that calibrations were applied consistently and that both types of photodiodes used for these channels led to practically identical results.
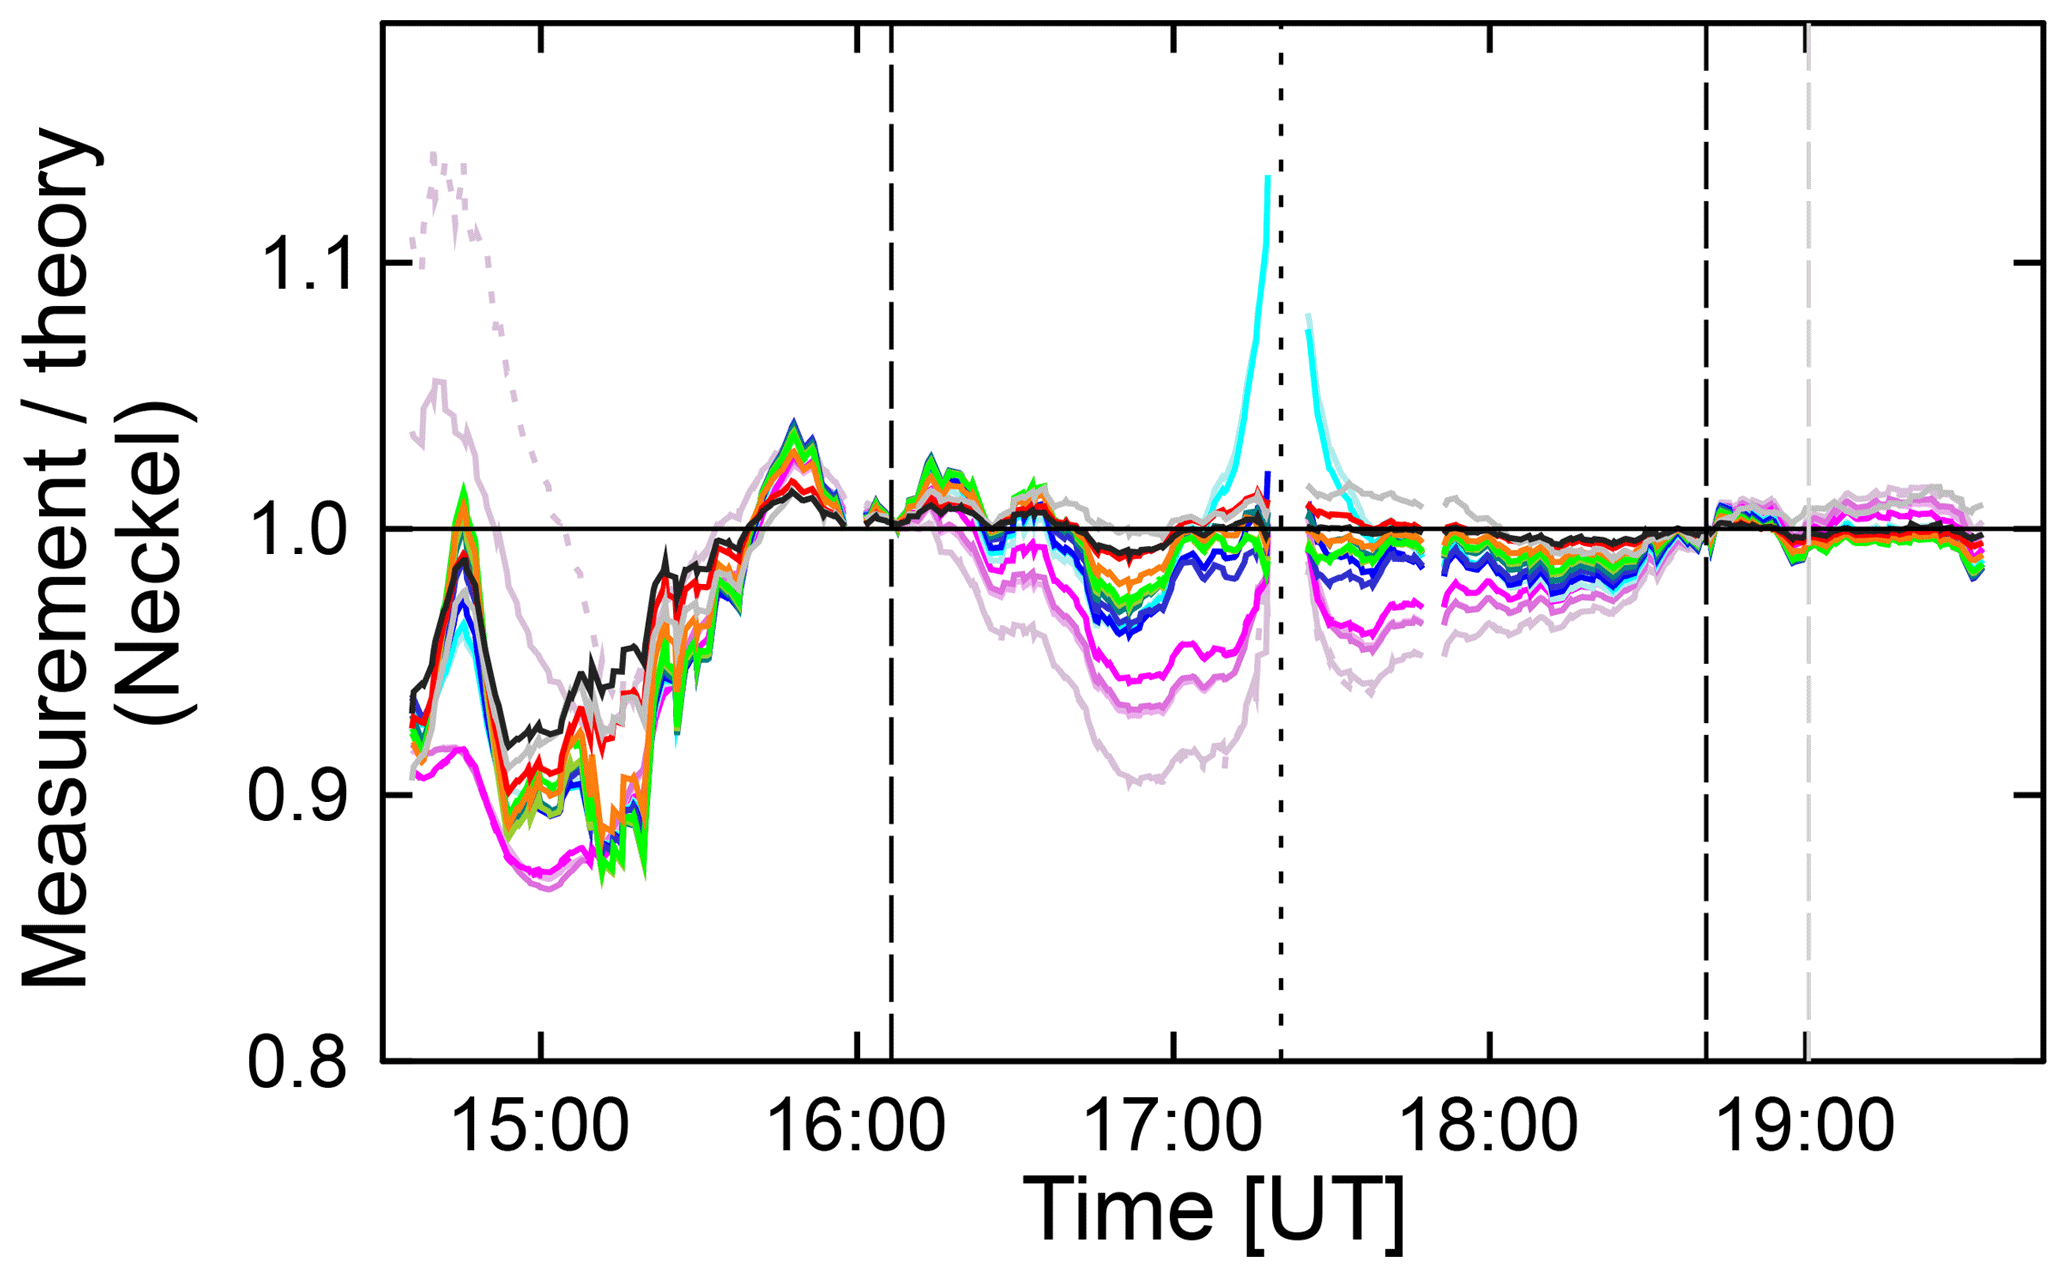
Figure 9Similar to Fig. 8d, but with theoretical LD effect parameterized based on Neckel instead of Pierce.
Figure 9 compares the measured LD effect with the theoretical prediction based on the parameterization by Neckel instead of Pierce. Results shown in Figs. 8d and 9 are very similar, and differences are within the uncertainties of the measurements and the change in the atmospheric extinction due to the variability of the aerosol load. Despite the similarity of the two figures, there is one difference worth noting. For 380 and 395 nm, discrepancies calculated for the parameterization by Neckel are larger than those derived from the parameterizations by Pierce. This is not surprising considering that Neckel does not provide coefficients for the wavelength range of 372.98–385.00 nm because of the uncertainty from the Balmer jump. As described in Sect. 6, our parameterization for the LD effect at 380 nm is based on Neckel's coefficients for the 385.00–422.57 nm range and therefore subject to uncertainties.
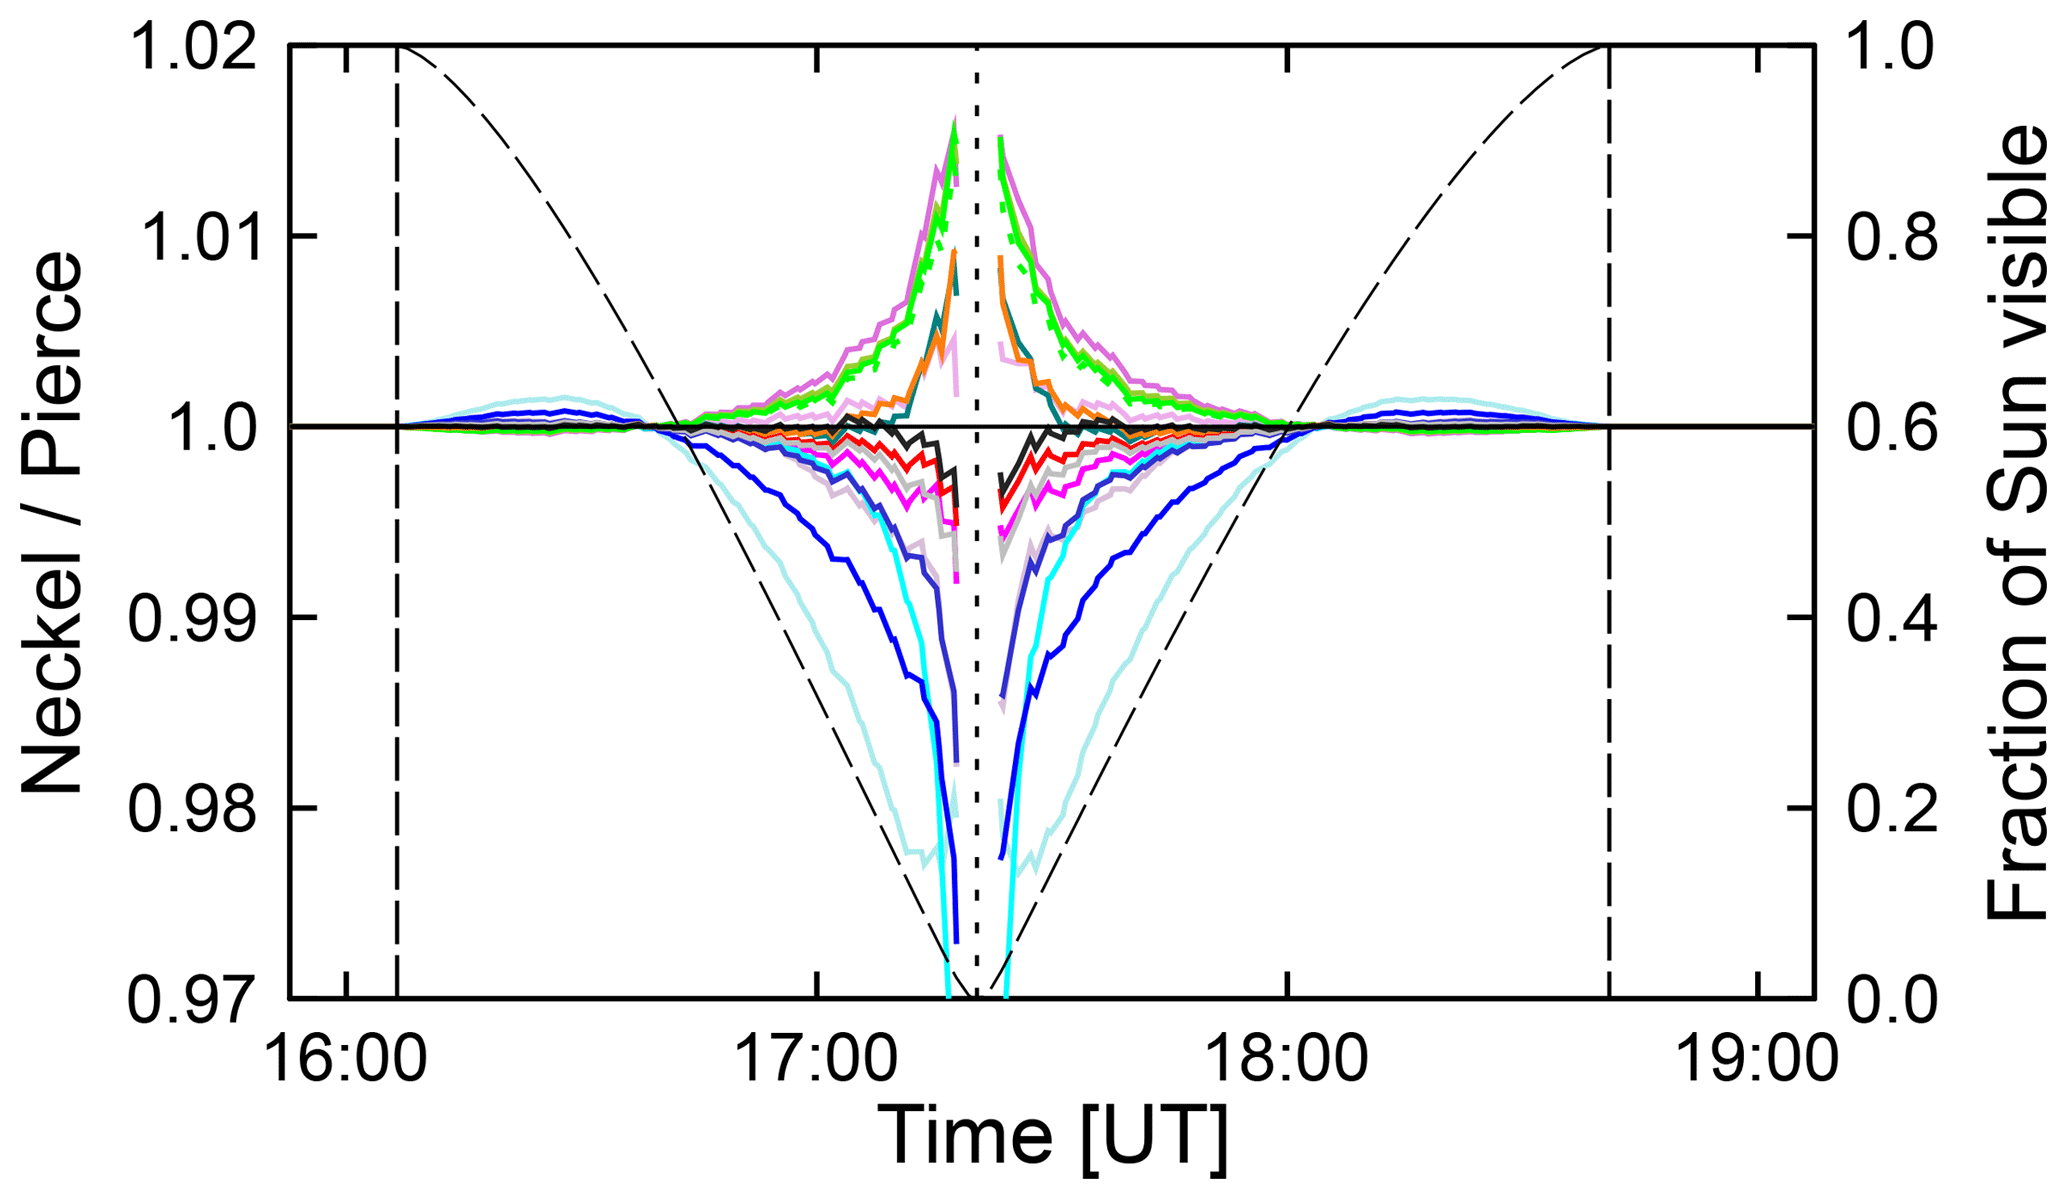
Figure 10Ratio of the LD effect calculated with the parameterizations by Neckel and Pierce. The color coding is identical with that used in Fig. 8. The dashed line indicates the fraction of the Sun's disk that is visible and is referenced to the right axis. Vertical dashed lines indicate the first and fourth contact.
Figure 10 shows the ratio of the LD effect calculated with the parameterizations by Neckel and Pierce. Figure 10 is based on the same data as those used for Fig. 7c but are plotted versus time instead of the fraction of the Sun not obstructed by the Moon. Results of the parameterization are virtually identical if 60 % or more of the Sun is visible. Discrepancies increase as the Sun becomes more and more occluded and are largest at 380 and 395 nm, with a maximum difference of about 3 %. There is generally no systematic dependence on wavelength.
Lastly, when we compared our observations with theoretical prediction based on the parameterization by Waldmeier, observations were lower than theory by up to 37 % at 306 nm, 24 % at 340 nm, and 19 % at 412 nm. For longer wavelengths, differences were in the ±8 % range. These differences are well outside the uncertainty of our measurements, confirming that the parameterization by Waldmeier is too simple, in particular in the UV range.
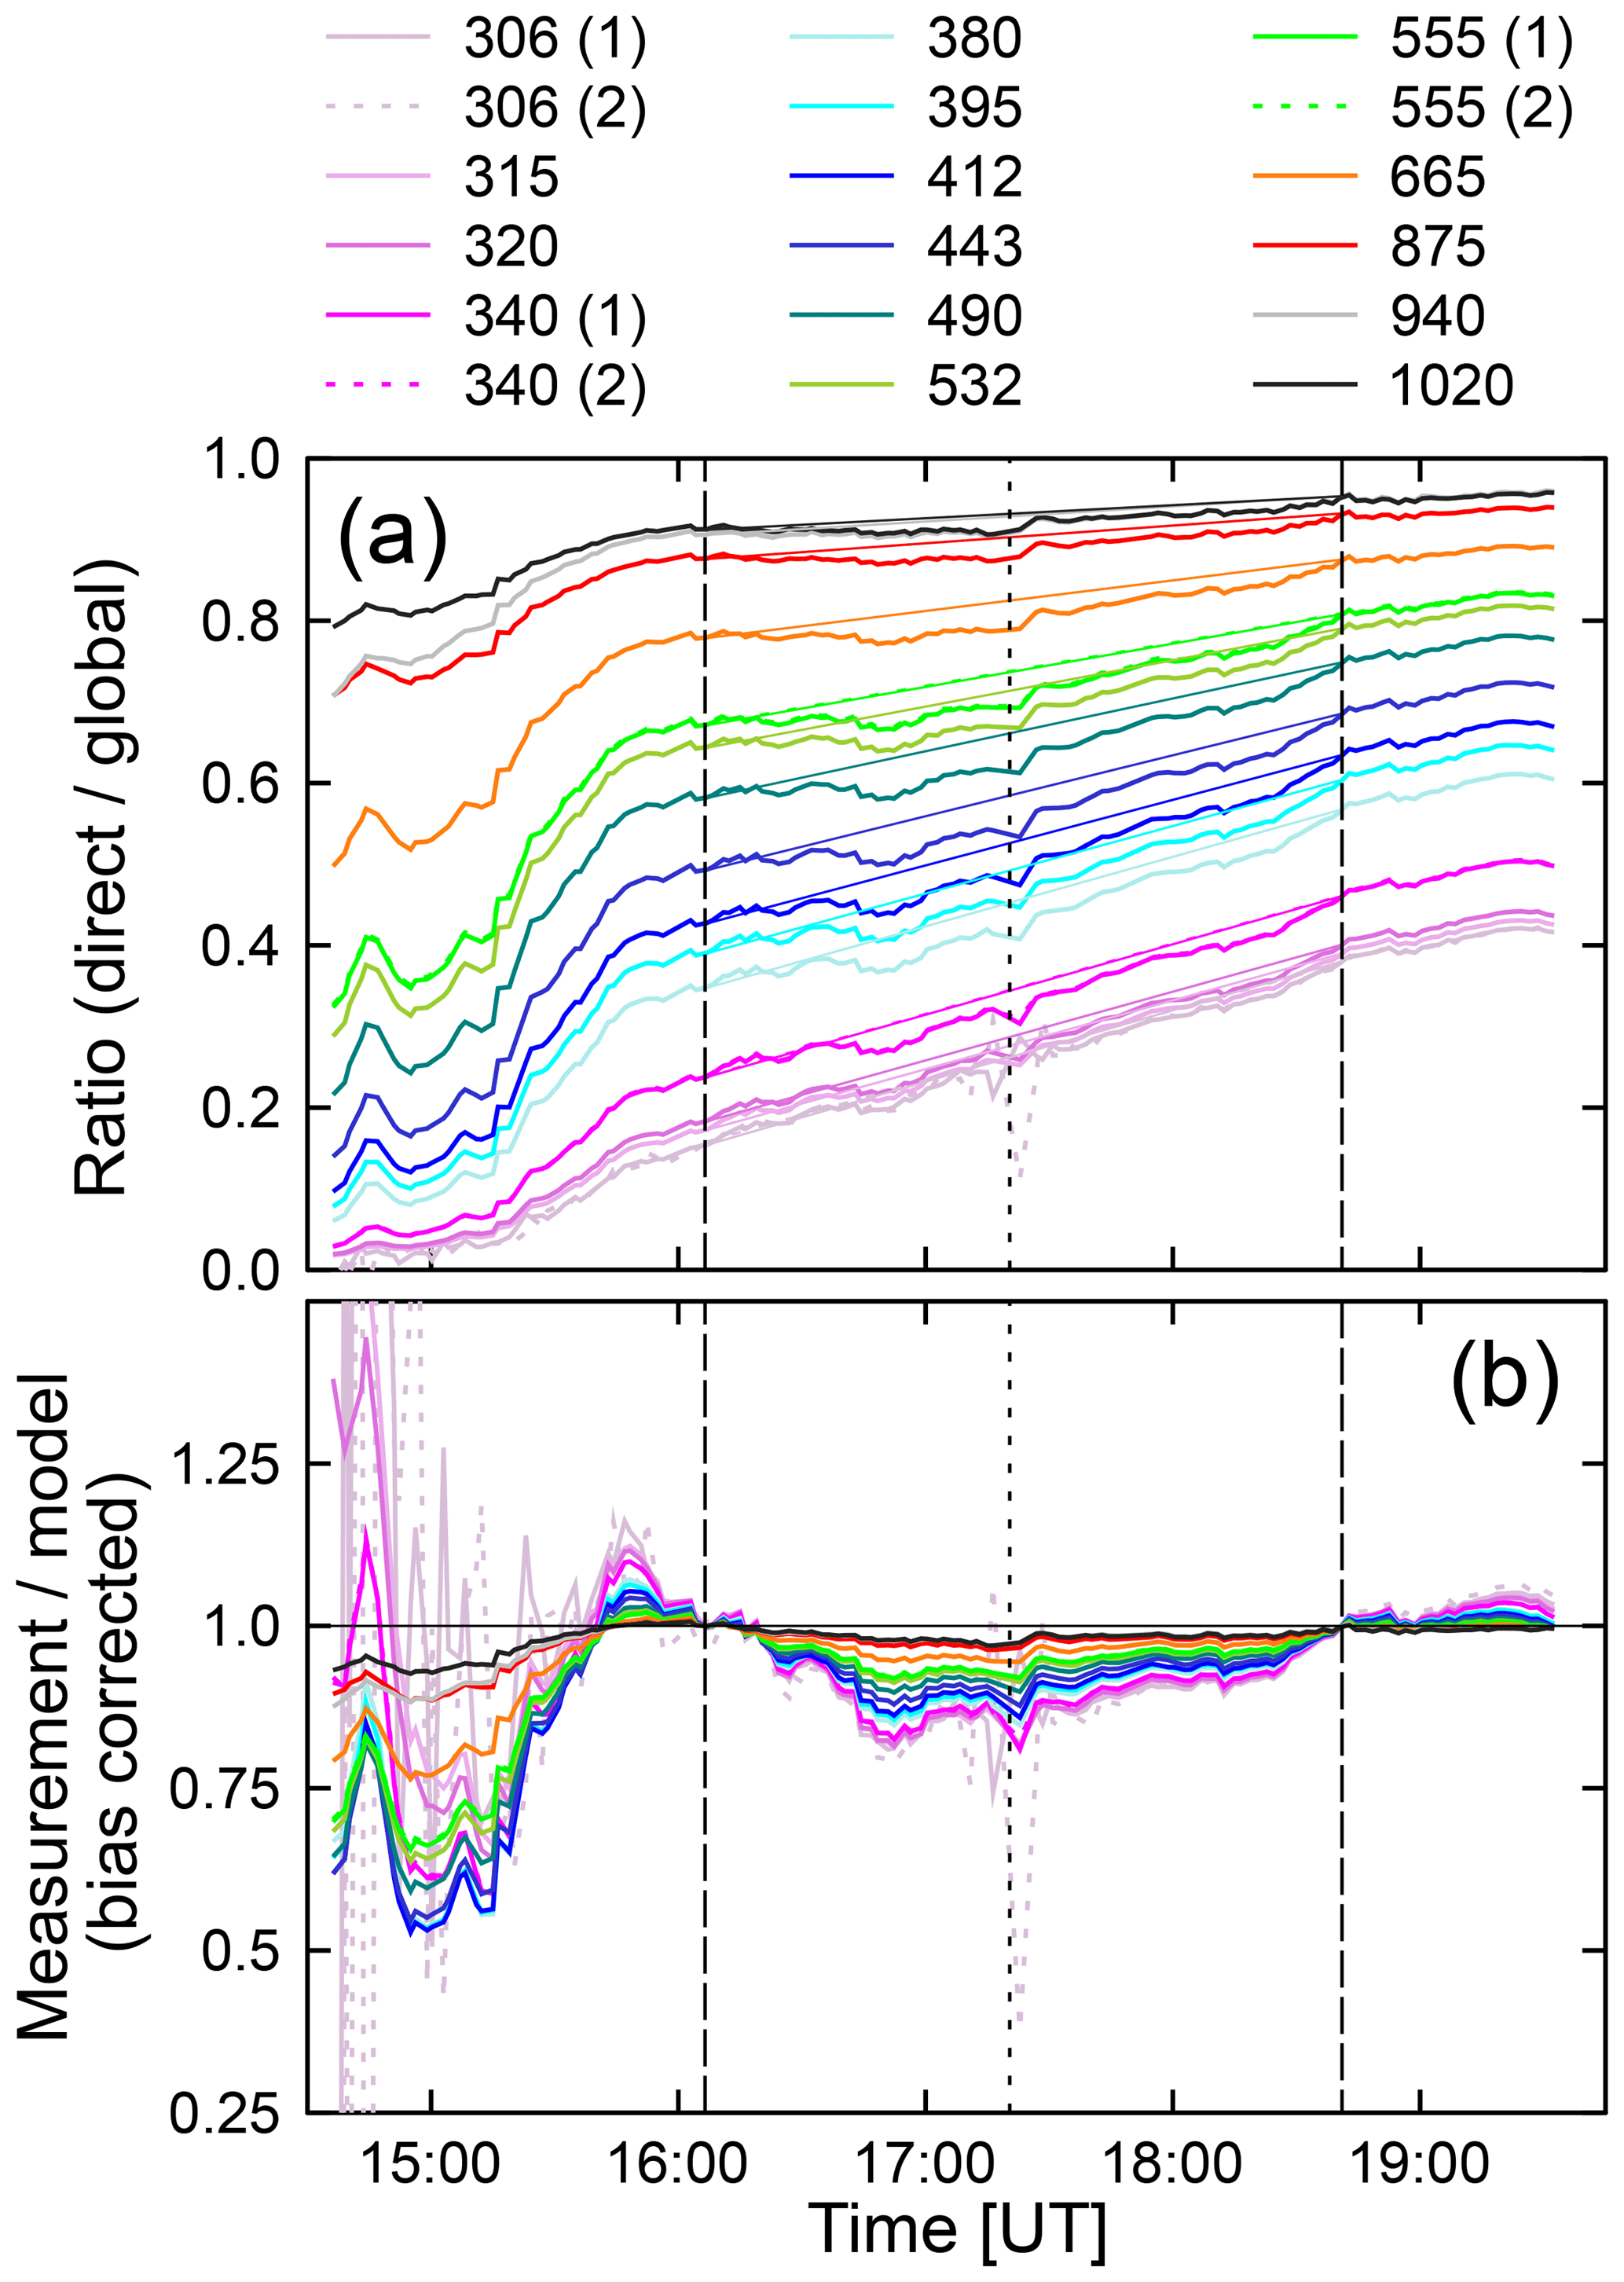
Figure 11(a) Ratio of direct-to-global spectral irradiance. Measurements are shown as heavy lines. Thin lines connect measurements at the start of end of the eclipse and are drawn to guide the eye. (b) Ratio of the measured and modeled direct-to-global ratios, corrected for the bias between measurement and model. Numbers (1) and (2) in the legend indicate the channel number for channels equipped with identical wavelengths.
7.2 Direct-to-global ratio
Figure 11a shows the ratio of direct spectral irradiance (derived from shadowband data) and global spectral irradiance (see Supplement for definition of symbols). The general upward slope is due to the change in SZA between morning and noon, and the steep slope between 15:15 and 15:45 is due to a decrease in aerosols, as discussed in Sect. 7.3. Thin lines in Fig. 11a connect measurements at the start of end of the eclipse and are drawn to guide the eye. Note that direct measurements are not available between 200 s before the second contact and 105 s after the third contact.
The measured direct-to-global ratio was compared with the modeled direct-to-global ratio using the same method as that employed in Sect. 7.1. In brief, the measured direct-to-global ratio was divided by the modeled direct-to-global ratio. To correct for the difference between measurement and model, linear functions were again constructed to match the ratios of measurement and model at the times of the first and fourth contact. Finally, the ratios were normalized by dividing with these linear functions. The resulting bias-corrected ratios of the measured and modeled direct-to-global ratio are shown in Fig. 11b and are denoted RDG(λi).
Before 15:00, the measured direct-to-global ratio is smaller than 0.03 at wavelengths in the UV-B, and values of RDG(λi) are subject to large uncertainties at these wavelengths. Before 15:20, RDG(λi) varies between 0.55 and 0.87 for wavelengths in the visible range, indicating that the measured direct-to-global ratio is 13 % to 45 % below the modeled one. These low values can be attributed to increased aerosol loading prior to the start of the eclipse. After the start of the eclipse (first contact), values of RDG(λi) start to drop to reach a local minimum at 16:52, approximately 30 min before the eclipse maximum. The decline has a clear wavelength dependence, with wavelengths in the UV-B decreasing the most (up to 20 %), followed by wavelengths in the visible (up to 15 %) and IR (up to 3.5 %) ranges. After this local minimum, RDG(λi) slowly increases during the remainder of the eclipse.
The change in RDG(λi) over the period of the eclipse could either be caused by processes initiated by the occlusion of the Sun or by variability from aerosols. Aerosols effects are more likely because any eclipse effect should conspicuously peak at the time of totality, not 30 min earlier. The wavelength dependence of RDG(λi) is also characteristic of aerosol effects (Sect. 7.3). In addition, the minimum values of RDG(λi) during the eclipse are well within the range of values observed prior to the eclipse, which could be unambiguously attributed to aerosols.
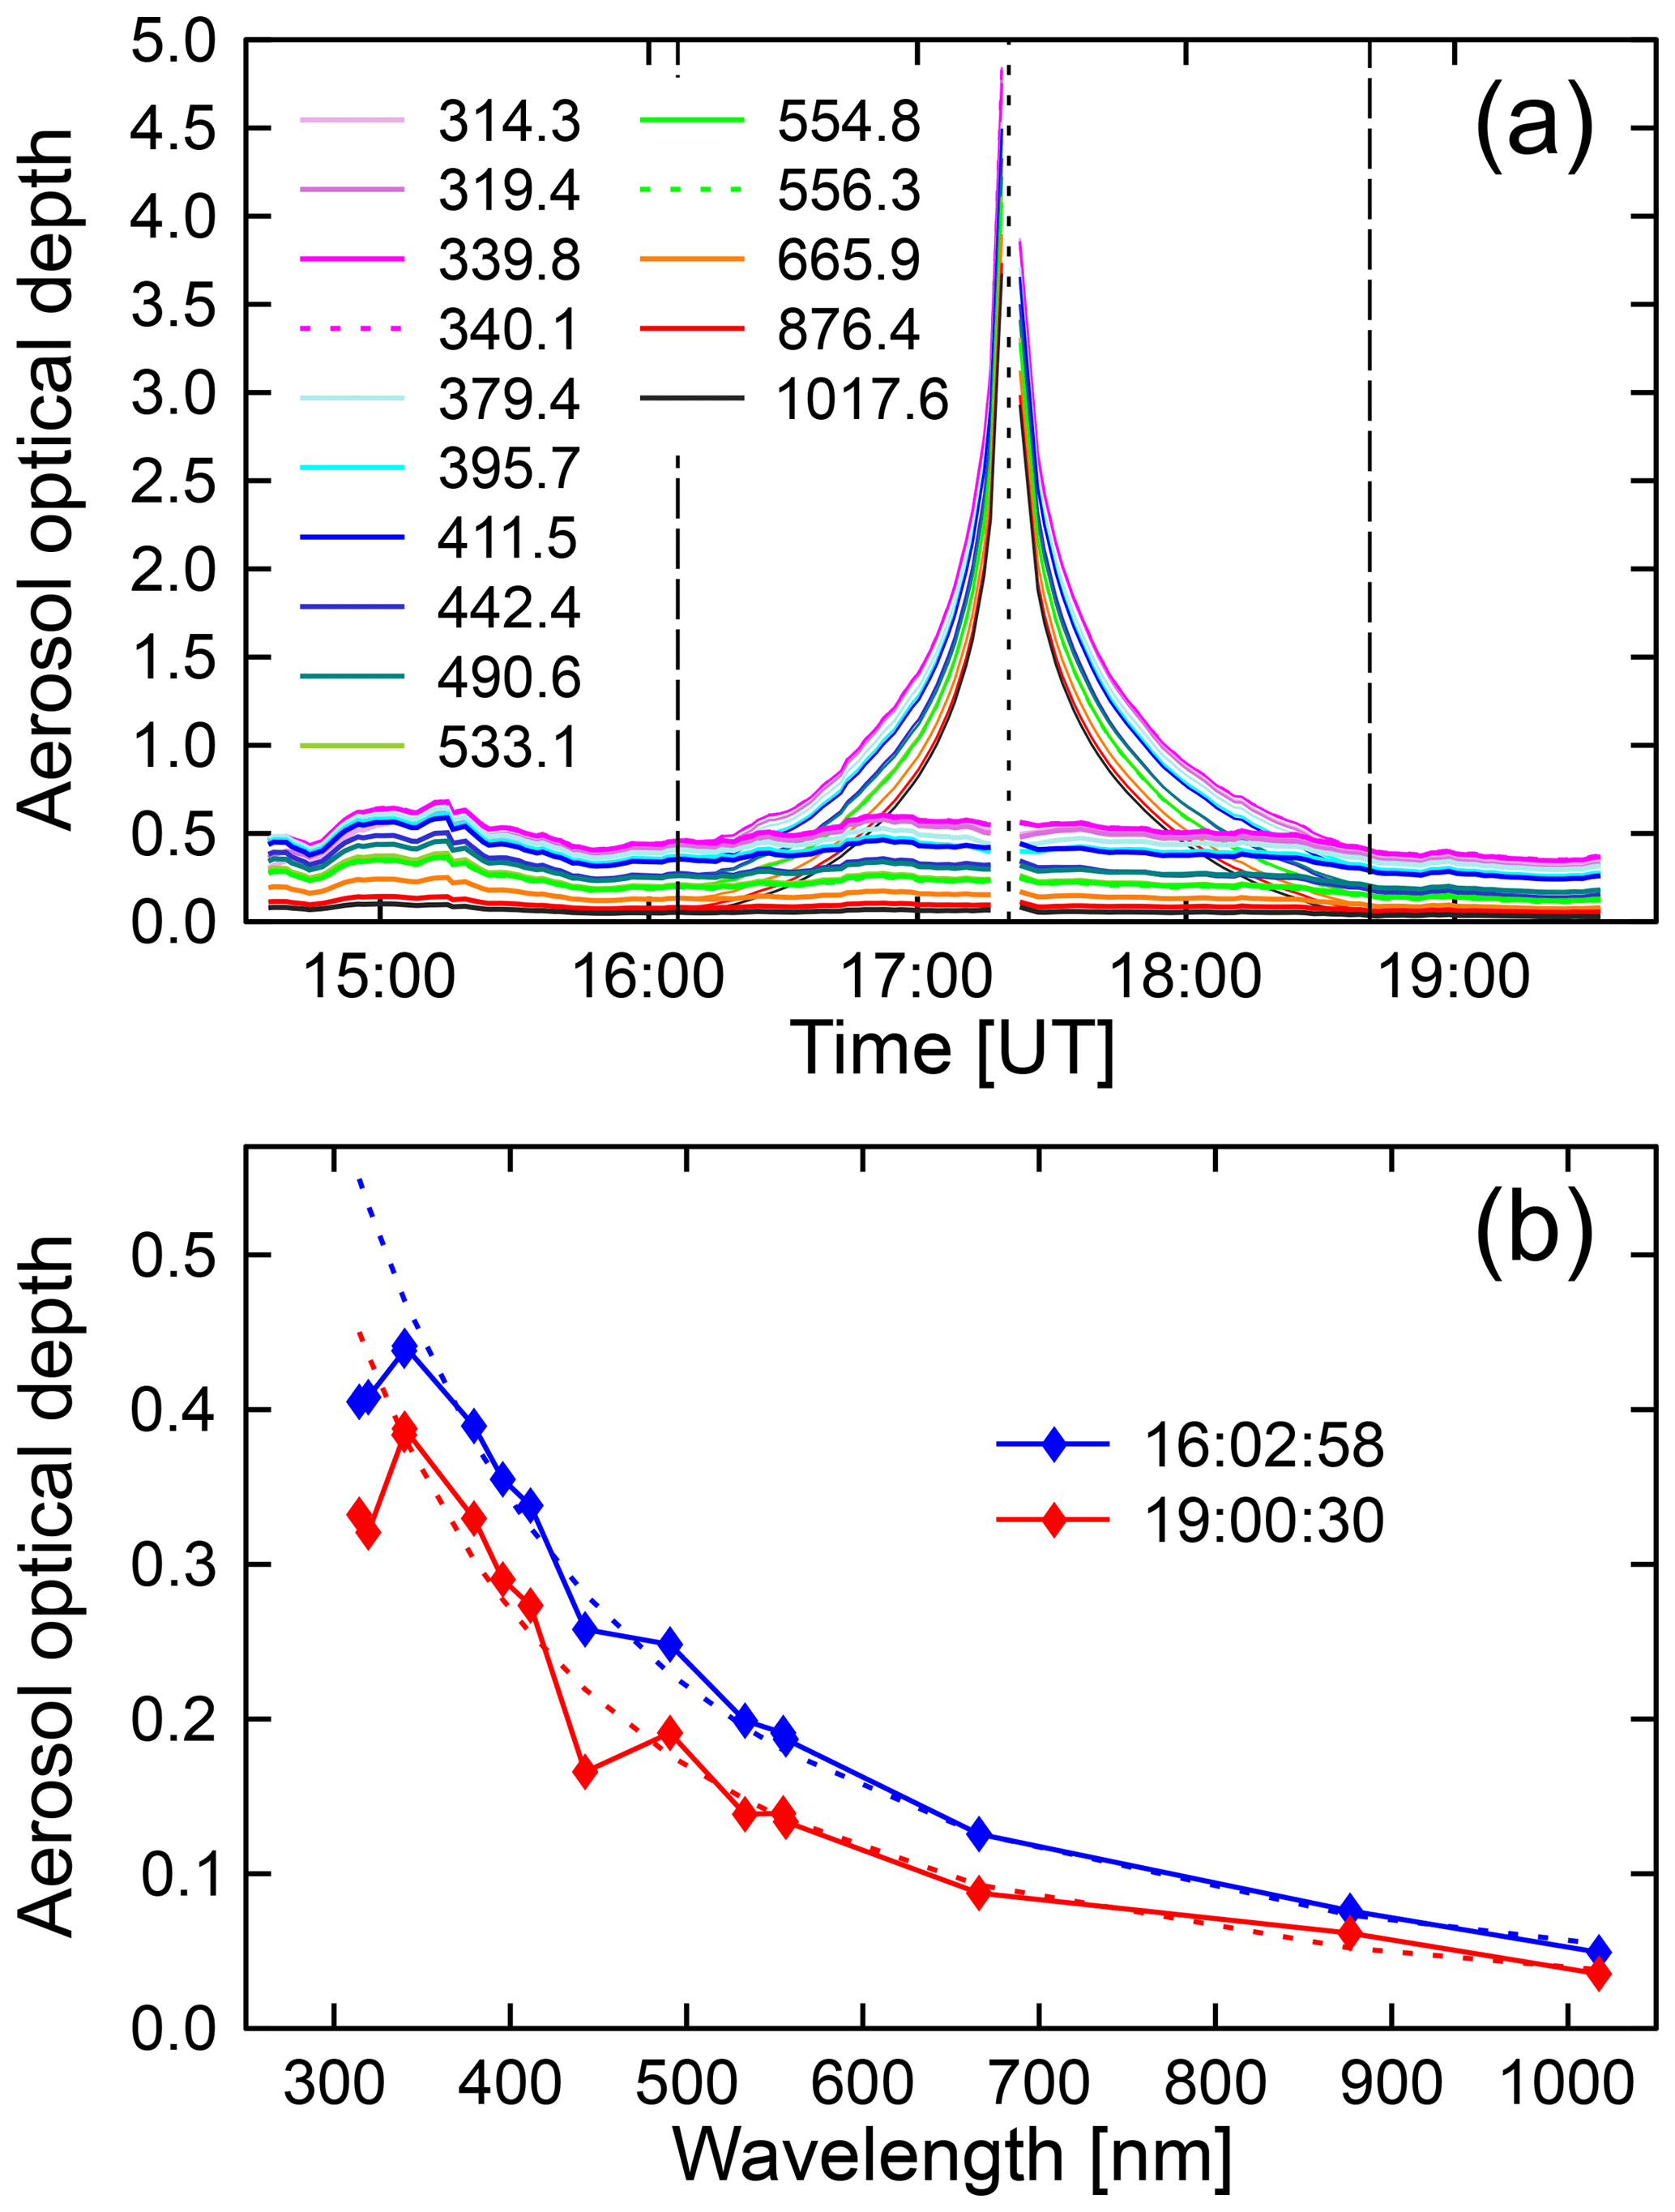
Figure 12Aerosol optical depth. (a) AOD measured by the GUVis-3511 radiometer at Smith Rock as a function of time. Thin lines indicate AODs measured without LD correction, while thick lines indicate AODs corrected using the LD parameterization by Pierce. Long-dashed lines indicate the start and end times of the eclipse, and the short-dashed line indicates the time at totality. Without LD correction, the reduced irradiance during the eclipse period is incorrectly attributed to aerosols, leading to a spurious spike at the time of totality. With LD correction, the effect of the eclipse is not noticeable in the AOD data. The legend indicates the centroid wavelengths of the GUV's channels. (b) Aerosol optical depth as a function of wavelength shortly before (16:02:58) and after the eclipse (19:00:30). Dashed lines indicate Ångström function fits to the data based on measurements of the AODs between 339.8 and 1017.6 nm.
7.3 Aerosol optical depth
The AOD was calculated with Eq. (1) from direct spectral irradiance, which in turn was derived from data collected during shadowbanding. The standard algorithm computing AODs does not take into account that a solar eclipse is occurring and (incorrectly) attributes the reduced direct irradiance during the eclipse to increased extinction of radiation by aerosols. The result (thin lines in Fig. 12a) is the large spike in the AOD, peaking at the time of totality. Calculations were repeated by first scaling the direct spectral irradiance with the LD effect using the parameterization by Pierce (Sect. 6) and then feeding the scaled irradiances in the AOD algorithm. Results corrected for the LD effect (thick lines in Fig. 12a) indicate that the AOD was increasing between the first contact and 16:52 (from 0.41 to 0.58 at 319 nm and from 0.05 to 0.07 at 1018 nm) and then monotonically decreasing to 0.34 at 319 nm and 0.04 at 1018 nm at the end of the eclipse. Corrected results do not have a spurious spike near the time of totality.
AOD measurements before and after the eclipse were used to characterize the aerosol loading of the atmosphere. Before 15:45, AODs were variable due to aerosols from nearby wildfires. Figure 12b shows the AOD as a function of wavelength shortly before (16:02:58) and after the eclipse (19:00:30). AODs were somewhat lower after the eclipse compared to the start. An Ångström function of the type , where the wavelength λ is provided in µm, was fitted to the data using channels between 340 and 1020 nm, excluding the channel at 940 nm. Values of the Ångström coefficient were α=1.96 and β=0.057 for the measurement at 16:02:58 and α=2.1 and β=0.0394 for the measurement at 19:00:30. The second set of coefficients was used for the RT calculations discussed in Sect. S1.1.1 of the Supplement. Ångström exponents α on the order of 2.0 may seem large; however, O'Neil et al. (2002) have demonstrated that values of α=2 are typical for aerosols originating from forest fires. Deviations of the measured AODs from the Ångström parameterizations shown in Fig. 12b are smaller than 0.02, with the exception of the AODs at 314.3, 319.4, and 442.4 nm. Measured AODs are up to 0.15 smaller than the parameterization at these wavelengths. The reason for these discrepancies is unknown; however, differences between AODs at the three wavelengths relative to AODs at adjacent wavelengths are larger at 19:00:30 than 16:02:58. As measurements at the two times were processed in the same way, it seems unlikely that the discrepancies are caused by a measurement artifact.

Figure 13Total ozone column measured by GUVis-3511 and OMI. For “uncorrected” data, the spike in TOC during the period of the eclipse is an artifact that can be attributed to solar LD. The effect is only marginally reduced when using the LD correction based on the parameterization by Waldmeier. By using either the parameterizations by Pierce or Neckel, variability in TOC during the eclipse is reduced to ±2.6 DU (±0.9 %).
7.4 Total ozone column
The total ozone column was calculated from GUVis-3511 measurements, as described in Sect. 5.2. Results obtained from the 305 nm ∕ 340 nm wavelength pair are discussed below. Similar results calculated with the 305 nm ∕ 313 nm and 313 nm ∕ 340 nm wavelength pairs are presented in Sect. S2 of the Supplement. Data were first processed without taking into account that the solar LD effects reduce the extraterrestrial spectrum more strongly in the UV-B than at 340 nm. Processing was repeated by scaling the raw data with the three parameterizations of the LD effect described in Sect. 6. Figure 13 compares these results with measurements by the space-borne Ozone Monitoring Instrument (OMI). (Of note, OMI data for 21 August 2017 are not available for the pixel that contains our measurement site. However, the average of OMI measurement within ±1∘ in latitude and ±5∘ in longitude is 297.9 DU, with a standard deviation of 2.1 DU.) The TOC measured by the GUVis-3511 was 293 DU shortly before the start of the eclipse and 294 DU shortly after the end, suggesting that the eclipse had no lasting effect on atmospheric ozone concentrations. Measured TOCs without LD correction spiked during the eclipse, resulting in 316 DU shortly before totality. When correcting the data using the LD parameterization by Waldmeier, the height of the peak is reduced to 312 DU (a 1.3 % reduction). When using either the parameterizations by Neckel or Pierce, the effect of the eclipse on measured TOCs almost disappears, in particular for the period between the third and fourth contact. The increase in TOC of about 5 DU between 16:00 and 17:00 can partly be explained by increasing AODs over this period, which cause a high bias in the ozone retrievals. The results shown in Fig. 13 can be explained with the wavelength dependence of LD. The stronger reduction of the extraterrestrial irradiance at 305 nm compared to 340 nm caused by the LD effect is interpreted by the algorithm as a larger TOC. Once the LD effect is removed, the TOC remains constant to within ±2.6 DU or ±0.9 %. Results obtained with the 305 nm ∕ 313 nm and 313 nm ∕ 340 nm wavelength pairs (Sect. S2 of the Supplement) corroborate these findings.
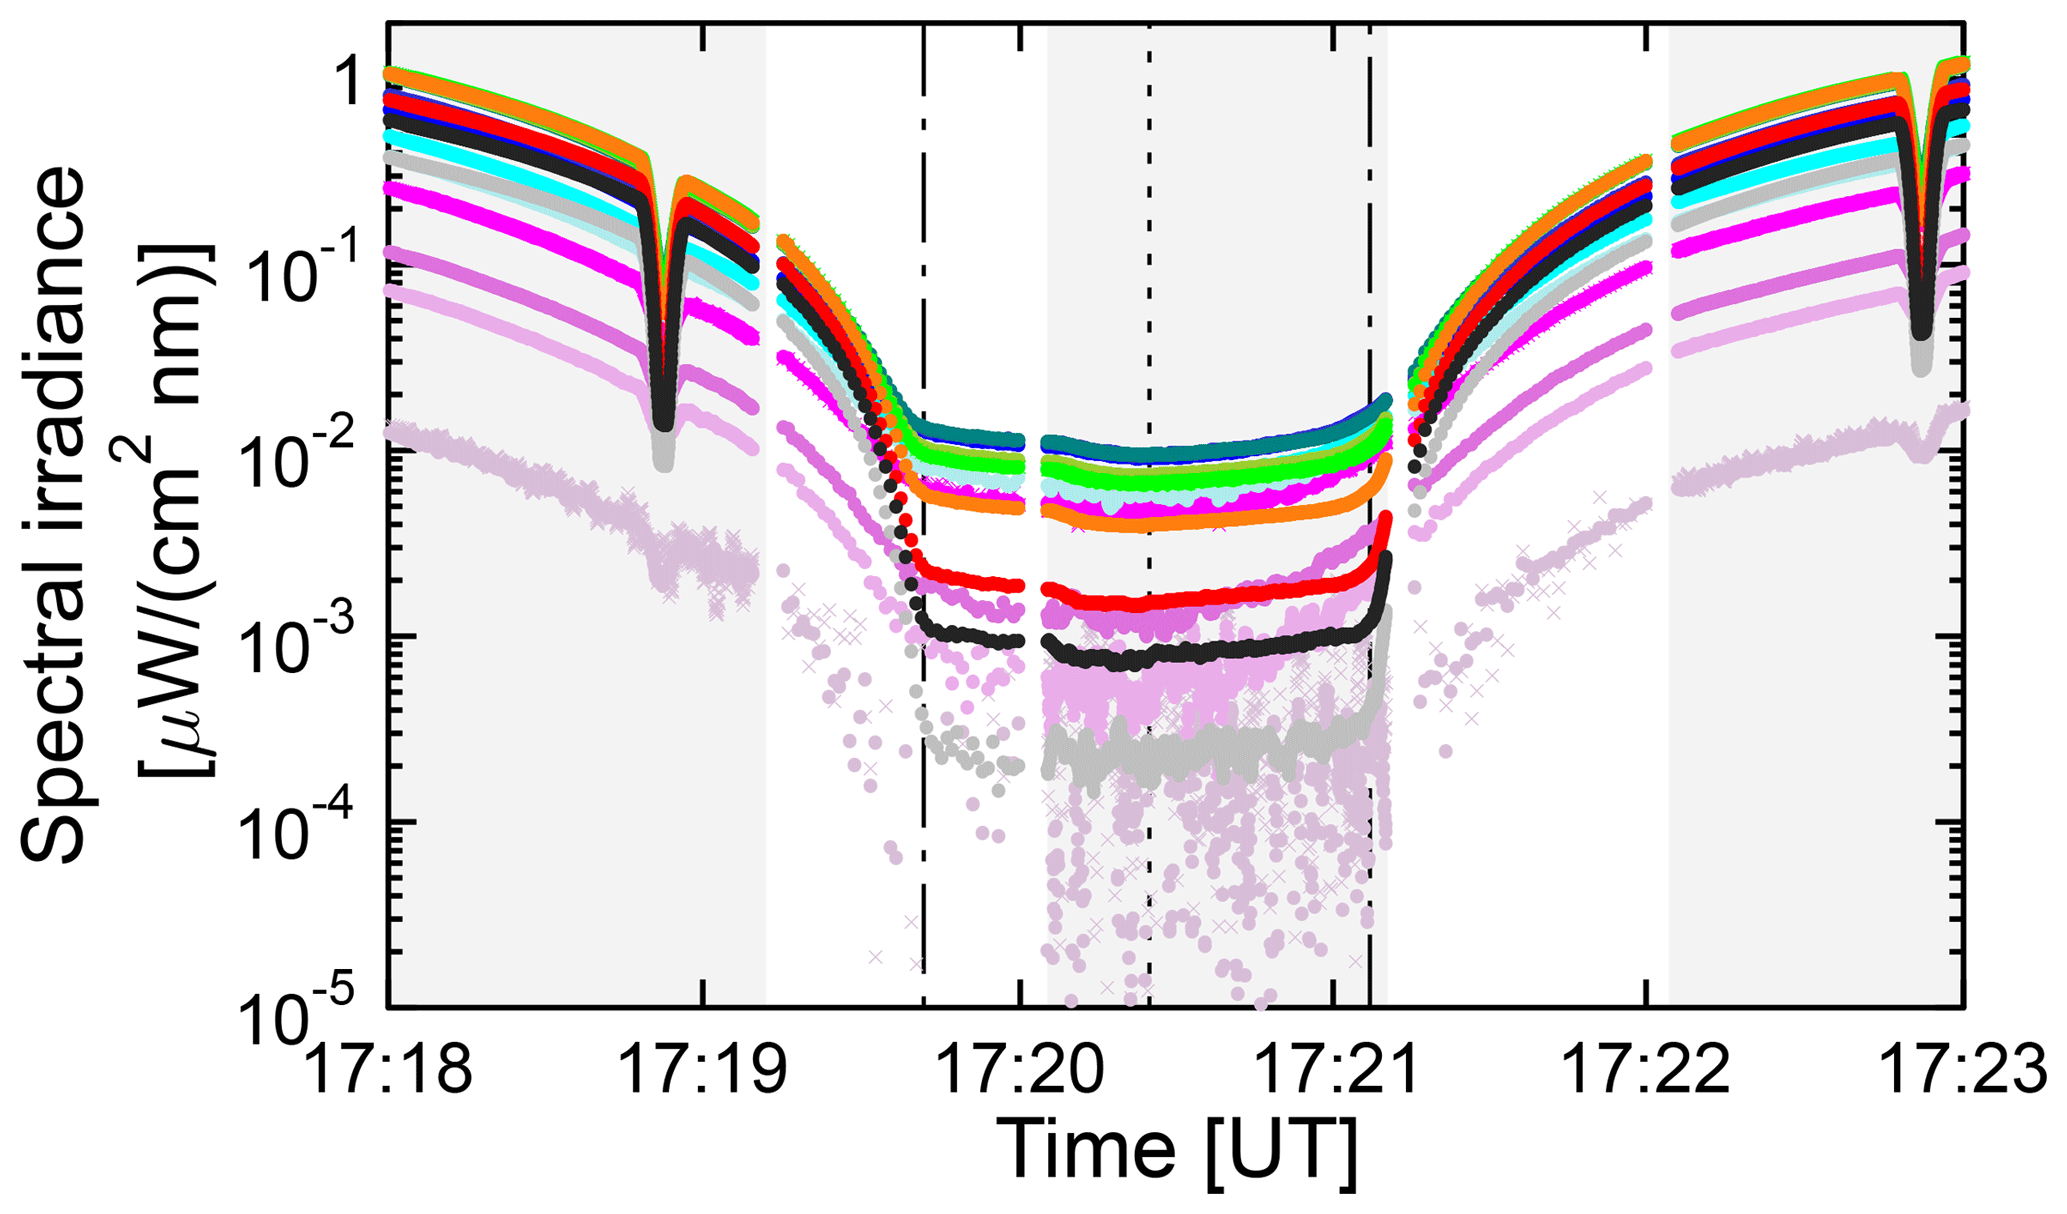
Figure 14Spectral irradiance measured between about 1.5 min before the second contact and about 2 min after the third contact. The color coding is identical with that used in Fig. 8. Grey shading indicates times of shadowbanding. The times of the second and third contact are indicated by dotted–dashed lines, and the short-dashed line marks the time of maximum totality.
7.5 Measurements near and during totality
Figure 14 shows measurements between about 1.5 min before the second contact and about 2 min after the third contact. The measurement protocol was not changed during this period and the radiometer was therefore shadowbanding during a large part of totality (between 17:20:05 and 17:21:11). Periods when shadowbanding was active are indicated by grey shading in Fig. 14. At 17:18:53 (before second contact) and 17:22:53 (after third contact) the shadowband blocked the direct sun, leading to a strong decreases in the measured spectral irradiance. In contrast, the effect of the shadowband is barely noticeable during totality, although the small dip in the spectral irradiance between 17:20:10 and 17:20:40 can be attributed to the blocking of sky light by the band. Shadowband data are considerably noisier than global irradiance measurements because of the difference in integration times (1 s for global irradiance and 1/15 s for shadowband measurements). To compensate for this effect, shadowband data shown in Fig. 14 are a running average of 15 measurements. In addition, shadowband measurements were scaled with a cosine error correction factor calculated for isotropic incident radiation but were not corrected for the shading of sky light by the band.
Measurements of global spectral irradiance are available between 17:19:15, through the second contact, and until 17:20:20. These measurements were cosine-error corrected without taking into account the change in the direct-to-global ratio at the beginning of totality. Despite this approximation, there is no obvious discontinuity at 17:20:20, when global irradiance measurements transition into shadowband data. During the last half-minute before the second contact, spectral irradiances in the UV and visible range decrease by about 1 order of magnitude. The decrease in the IR wavelengths is considerably larger, with a change of about 2 and 2.5 orders of magnitude at 1020 and 940 nm, respectively. The wavelength dependence of these changes can be explained with the wavelength dependence of Rayleigh scattering, which makes it less likely for photons entering the atmosphere outside the Moon's shadow to travel to the area of the umbra. The long path length also amplifies absorption by gases (ozone, NO2, and H2O) and aerosols. Spectral irradiance at 940 nm, which is affected by water vapor absorption, decreases therefore more rapidly than spectral irradiance at 1020 nm, which is absorbed much less. Measurements at 306 nm are below the detection limit during totality.
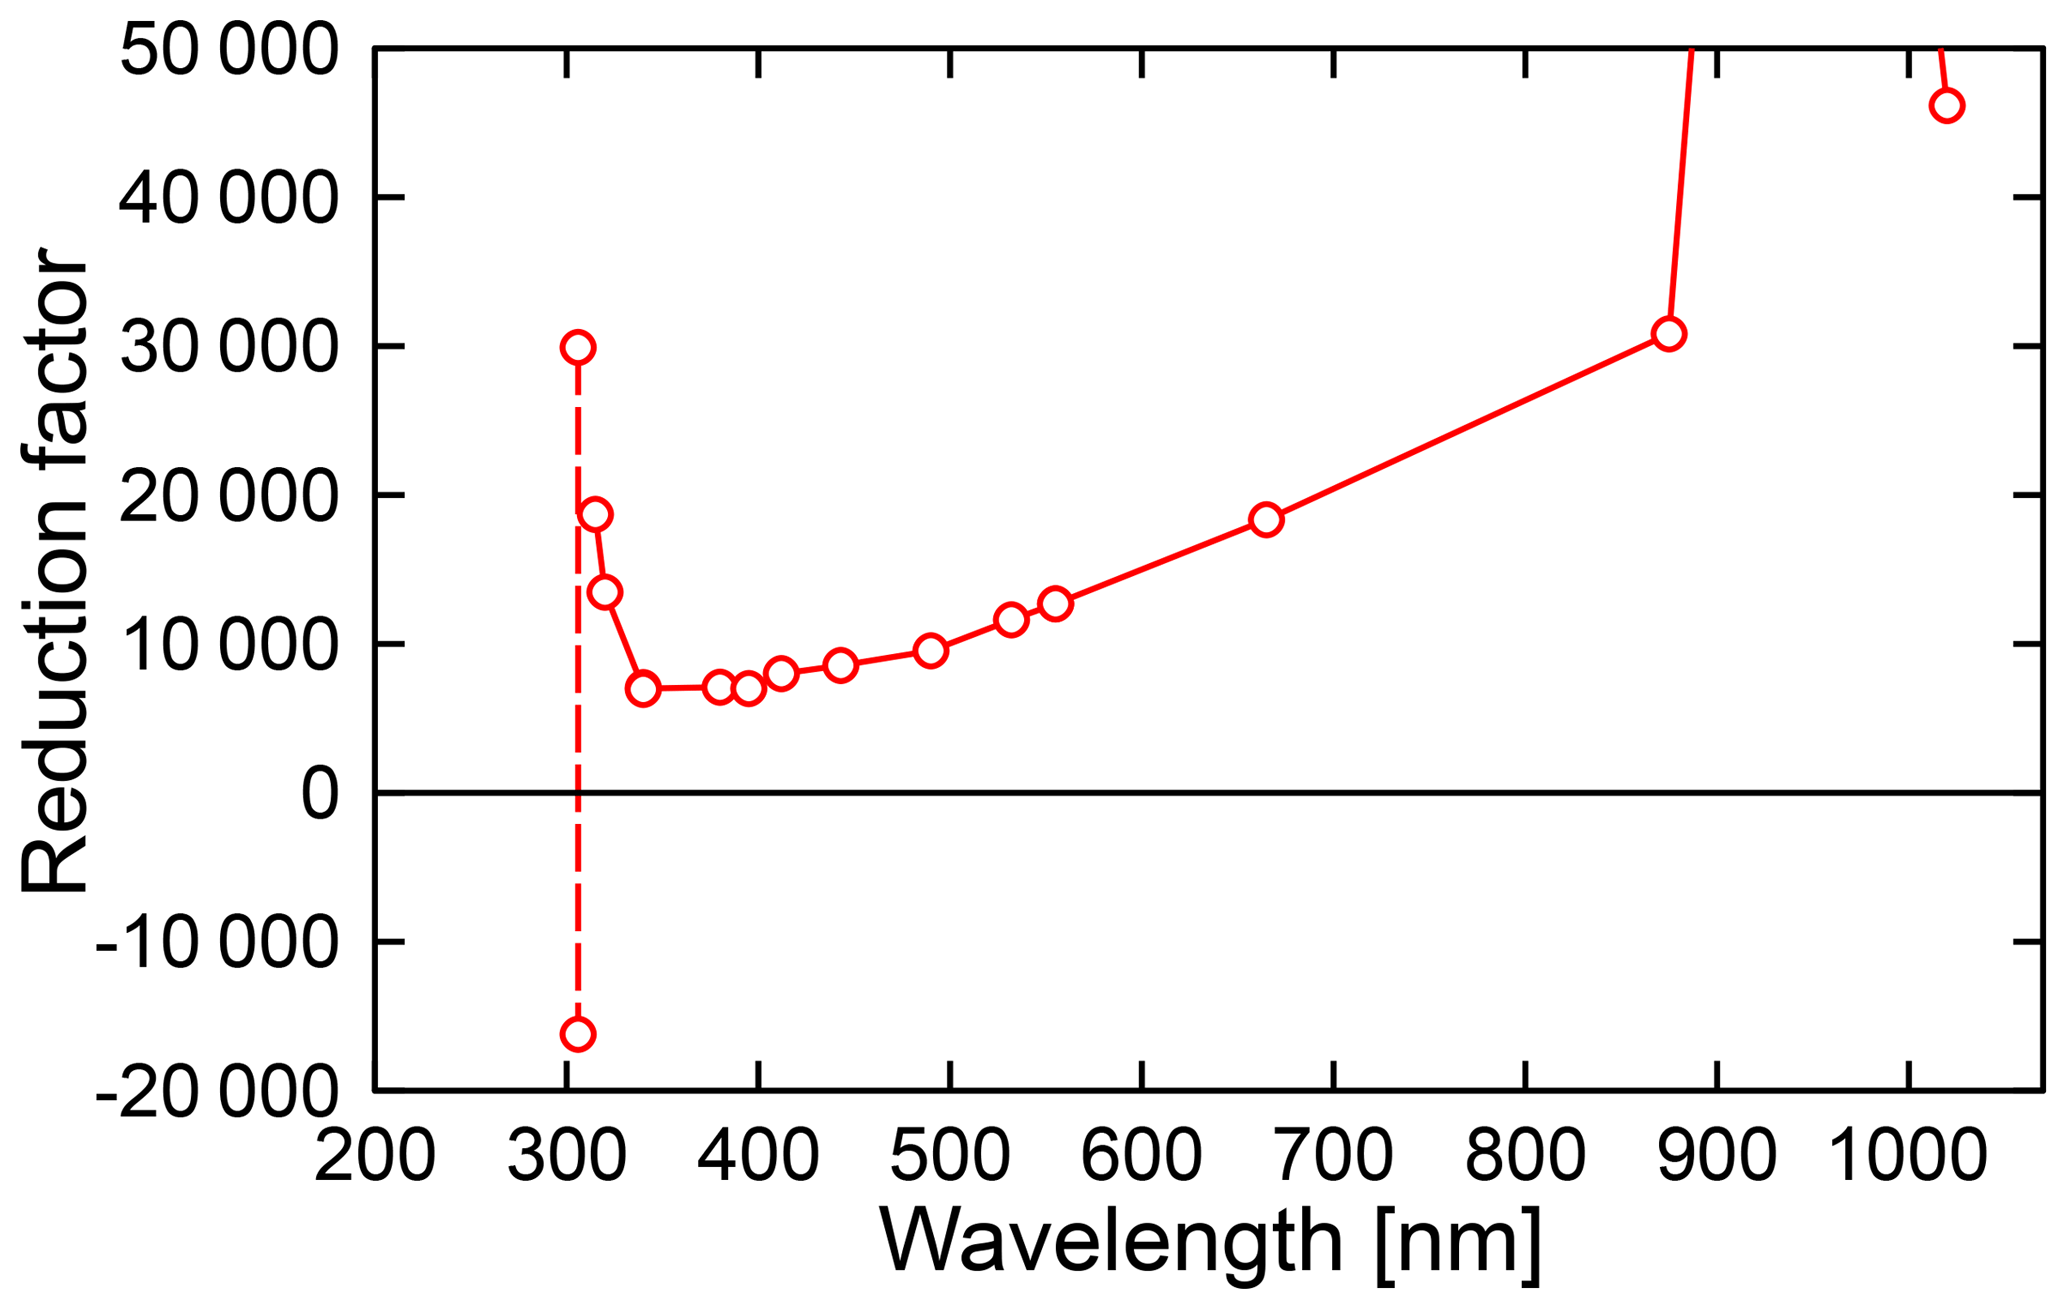
Figure 15Factor to quantify the reduction of spectral irradiance during totality relative to spectral irradiance from the unoccluded Sun. Measurements of the two channels at 306 nm are below the detection limit during totality, and the factors calculated for two channels (connected by a dashed line) are therefore greatly different and meaningless. Factors for the other wavelengths with two channels (340 and 555 nm) are virtually identical. The reduction factor for 940 nm is 136 650.
The difference of the global spectral irradiance observed during totality relative to the unoccluded Sun was quantified with the data shown in Fig. 8c. Specifically, the bias-corrected ratio of measurement and the model averaged over the period of 17:19:50 and 17:20:00 (i.e., the last 10 s of global spectral irradiance measurements during totality before the start of the shadowbanding sequence) was compared to the respective ratio at the fourth contact, which is one by design. Figure 15 shows the so-calculated reduction factors. Factors decrease strongly between 315 and 340 nm, followed by a gradual increase from 340 to 1020 nm. Spectral irradiance is reduced by a factors of 18 700 at 315 nm, 7000 at 340 nm, 18 340 at 665 nm, 136 650 at 940 nm, and 46 150 at 1020 nm. The relatively high factors in the UV-B and at 940 nm are caused by ozone and water vapor absorption, respectively. The average reduction for the channels in the visible range (412–665 nm) is 11 460. For comparison, the irradiance from the full moon is about a factor of 400 000 smaller than that of the Sun (Macdonald, 2012). Hence, the visible irradiance during totality is still a factor of 35 larger than the irradiance from the full Moon. This estimate is in agreement with empirical observations. For example, the light during totality is still bright enough to perceive colors, while this is barely possible with moonlight.
Some of the findings of this paper are in conflict with results from similar publications discussing solar eclipses that have occurred in the past. These pertain to the magnitude of the LD correction, changes in the diffuse-to-direct ratio observed during an eclipse, and TOC variations during an eclipse. The three issues are discussed below, followed by a discussion of the value of eclipse data for validating the performance of radiometers.
8.1 Magnitude of solar limb darkening
The excellent agreement (better than 4.0 % overall and better than 2.5 %, excluding the period most affected by aerosols) between the solar LD effect derived from our measurements and theoretical predictions for wavelengths above 400 nm suggests that the parameterizations of LD by Pierce and Neckel are correct to within the measurement uncertainty for this wavelength range. The larger discrepancies below 400 nm are likely caused by aerosol effects and systematic errors in these parameterization. Specifically, Neckel uses different coefficients for the wavelengths ranges 300–372.98 nm, 385.00–422.57 nm and 422.57–1100 nm because of the Balmer jump. The electronic transitions from the second atomic shell to shells higher than 6 occur at wavelengths between 410.2 (transition 2>6) and 364.6 nm (Balmer break). The hypothesis of possible systematic errors in the LD data by Neckel is supported by the relatively large noise in data at UV wavelengths presented by Neckel (2005), which formed the basis of LD parameterizations used here.
Our results indicate that the LD parameterization by Waldmeier is too simple to accurately describe the change in the radiance across the solar disk, in particular in the UV range. Several recent papers (e.g., Blumthaler et al., 2006; Emde and Mayer, 2007; Kazadzis et al., 2007; Kazantzidis et al., 2007) have used the method by Koepke et al. (2001) combined with the LD darkening parameterization by Waldmeier. Some conclusions in those papers should therefore be reconsidered. For example, Kazadzis et al. (2007) calculated the TOC during the total eclipse of 29 March 2006 at Kastellorizo, Greece, from direct irradiance measurements of a Brewer spectrophotometer. By combining the method by Koepke et al. (2001) with the parameterization by Waldmeier (1941), they calculated negligible LD corrections of less than 0.01 % for their ozone retrievals. (Of note, the maximum correction using the parameterization by Waldmeier for our data – grey line in Fig. 13 – is 1.3 %, which is much larger than the correction of 0.01 % quoted by Kazadzis et al., 2007. The reason for this discrepancy is unknown; however, the wavelengths used in our TOC retrieval – 306 and 340 nm – are different from the Brewer wavelengths, which range between 306.2 and 320.1 nm.)
Kazantzidis et al. (2007) have analyzed ratios of global spectral irradiance (305 nm ∕ 380 nm, 312 nm ∕ 380 nm, 340 nm ∕ 380 nm, and PAR∕380 nm) that were measured with NILU-UV filter radiometers at three locations in Greece during the total solar eclipse of 29 March 2006. These measured ratios were compared with theoretical predictions based on the algorithm by Koepke et al. (2001) and the LD parameterization by Waldmeier. As the eclipse progressed, the model underestimated the measured spectral effect, capturing only half of the observed change. For example, measured ratios of spectral irradiances at 340 and 380 nm were 10 % lower close to totality compared to similar ratios calculated for the first and fourth contact. The theoretical calculation only predicted a decrease of 5 %. Our results suggests that discrepancies between the measured and modeled ratios reported by Kazantzidis et al. (2007) can partly be attributed to limitations of the LD parameterization by Waldmeier used in their model.
8.2 Variations of direct-to-global ratio
Relative to model calculations for the unoccluded Sun, direct-to-global ratios during the eclipse decreased by up to 20 % in the UV-B, 15 % in the visible and 3.5 % in the IR (Fig. 11b) ranges. The largest decrease was observed about 30 min before totality. The timing of this decrease and its spectral dependence suggest that changes in aerosol amounts are the main driver for the observed drop in the ratio. However, aerosol effects are difficult to decouple from processes initiated by the occlusion of the Sun or artifacts of the algorithm used to calculate the direct irradiance from shadowband data.
According to theoretical calculations by Emde and Mayer (2007), eclipse effects that affect direct and diffuse radiation differently are smaller than 1 % for times 10 min away from totality and smaller than 4 % for times 105 s away from totality (i.e., the shortest time to totality available from our shadowband measurements). These theoretical calculations also agree with the conclusion by Sharp et al. (1971) that “sky light may be considered as attenuated sunlight up to at least 99.8 % obscuration.” These theoretical results disagree with the results by Zerefos et al. (2000, 2001), who suggest that the erythemal (sunburning) diffuse irradiance was declining at a slower rate than the erythemal direct irradiance during the solar eclipse observed in Thessaloniki, Greece, on 11 August 1999. The largest difference was observed at the time of the eclipse maximum, when 88 % of the solar disk was obscured and the ratio of diffuse to direct irradiance was increased by approximately 50 % relative to the change expected from calculations with a one-dimensional radiative transfer model. For comparison, the increase in the diffuse-to-direct ratio calculated at 315 nm from our measurements was only 31 % and did not peak at the time of totality. The available evidence from our observations and 3-D RT model calculations suggests that a measurement artifact may have contributed to the large change in the diffuse-to-direct ratio reported by Zerefos et al. (2000, 2001).
8.3 Total ozone column variations during an eclipse
In contrast to the increase that is apparent in our uncorrected TOC measurements shown in Fig. 13, the ozone retrievals by Kazadzis et al. (2007) show a decrease in TOC during the eclipse. Kazadzis et al. (2007) attribute this apparent reduction in TOC to contamination of the Brewer's direct measurements by diffuse radiation in the instrument's field of view, quoting a previous conclusion by Zerefos et al. (2000, 2001). We find this conclusion surprising considering that changes in the direct-to-diffuse ratio during an eclipse are small according to theoretical calculations by Emde and Mayer (2007), with the exception of a short (<5 min) period before and after the period of totality. We speculate that the observed drop in Brewer TOC measurements during an eclipse is partly caused by the fact that Brewer data are typically calculated from four instead of two wavelengths, as it is the case for our results. Using more than two wavelengths has the advantage that aerosol effects can be reduced (Basher, 1982). However, this method could potentially lead to errors if wavelength-dependent changes in irradiance caused by the LD effect are incorrectly attributed to aerosols. For example, using a LD correction method based on the NLTE spectral synthesis code (Tagirov et al., 2017), Gröbner et al. (2017) provide evidence that the spurious drop in Brewer TOC measurements is primarily due to LD effects. Of note, the LD correction applied to Dobson spectrophotometer data from the solar eclipse of 20 May 1966 discussed by Bojkov (1968) reduces the TOC (calculated from the Dobson C pair) by up to 6 %, in good agreement with our calculations.
Chimonas and Hines (1971) hypothesized that the Moon's shadow, as it travels at supersonic speeds across the atmosphere during a solar eclipse, induces “bow waves” (a type of gravity waves) due to sudden cooling of the atmosphere at altitudes between 10 and 60 km, where the ozone layer normally converts solar UV radiation to heat. Ionospheric bow waves with wavelengths between 300 and 400 km and a period of about 25 min, which manifested themselves as electron content disturbances, have indeed been observed during the solar eclipse of 21 August 2017 (Zhang et al., 2017). If these bow waves had affected the ozone layer, these oscillations should have been detectable with our sampling frequency of one TOC value every 2 min.
Using data measured during the solar eclipse of 11 August 1999, Zerefos et al. (2000) observed an oscillation with a period of 20 min in erythemal irradiance before and after the time of the eclipse with a peak-to-peak variation of about 1 %. Zerefos et al. (2000) attributed these oscillation to fluctuations in total ozone caused by eclipse-induced gravity waves. A variation of ±0.5 % in erythemal irradiance would require a variation in total ozone of similar magnitude (McKenzie et al., 2011). In a similar analysis, using data from the 29 March 2006 solar eclipse, Zerefos et al. (2007) reports oscillations in TOC with a peak-to-peak amplitude of 2.0 %–3.5 % and periods ranging between 30 and 40 min. However, these measurements also indicate an unrealistic drop in the TOC from 295 to 225 DU between the beginning and the maximum of the eclipse, followed by an increase to 300 DU. This artifact is attributed to the contamination of direct irradiance measurements (which are used for the ozone retrieval) by diffuse radiation. It is concerning that the magnitude of this artifact (75 DU or 25 %) exceeds the magnitude attributed to the bow wave by a factor of 10. Mims and Mims (1993) report that TOC measurements taken during the total solar eclipse of 11 July 1991 show fluctuations in ozone with a peak-to-peak amplitude of up to 5 DU (1.7 %), which began 700 s after the third contact. However also these observations were affected by incomplete LD correction, resulting in TOC changes of 26 DU (about 9 %) over the course of the eclipse. Finally, Kazantzidis et al. (2007) discuss TOC measurements performed with NILU-UV filter radiometers at several locations in Greece during the total solar eclipse of 29 March 2006. They did not observe any periodic fluctuations in TOC and only report a small increase in TOC of about 5 DU as the visible fraction of the Sun decreases from ∼60 % to ∼20 %. This small change could be caused by incomplete correction of the LD effect.
Our data do not support the observation of Zerefos (2000, 2007) and Mims and Mims (1993) that bow waves from the Moon's shadow lead to oscillations in TOC with a peak-to-peak amplitude exceeding 1.5 %. For example, between 17:36 and 18:36, LD-corrected TOC data decreased by 1 DU (0.33 %) with no obvious oscillations. Between 18:38 and the end of the measurements at 19:32, TOC remained constant to within 0.3 DU (0.10 %). These small variations are well within the natural variability of the TOC and the uncertainty of our TOC retrieval of 1.5 DU (0.5 %), which is mainly caused by the effect of changing aerosols on ozone calculations. The lack of an effect is not surprising considering that diurnal variations in ozone are small. For example, at the Mauna Loa observatory (19.5∘ S), the day–night difference of the ozone profile is smaller than ±2 % for altitudes up to 45 km, where 99 % of the ozone column is located (Parrish et al., 2014). Since day–night changes below and above 30 km have a different sign and partly cancel each other out, the effect on TOC is small. It would be surprising if TOC variations over the relatively short period of a solar eclipse driven by bow waves were larger than variations caused by the diurnal cycle. Despite the results by Zerefos (2000, 2007) and Mims and Mims (1993), we feel that the question of whether or not bow waves from the Moon's shadow can lead to variations in TOC is still up for debate. This debate could be settled by performing LD-corrected measurements of TOC with different instrument types during one of the upcoming solar eclipses. If such measurements were to show fluctuations in TOC with the same magnitude and timing, the effect of bow waves on TOC could be convincingly demonstrated.
8.4 Validation of GUVis-3511 measurements
The GUVis-3511 is a relatively new instrument and the measurements discussed here present a unique opportunity to examine some aspects of the instrument's performance. For example, as radiation levels decrease and increase by more than 4 orders of magnitude over the course of the eclipse (Fig. 15), the linearity of the measurements can be assessed. The GUVis-3511 uses a 24 bit amplifier with three gains, providing a dynamic range of over 11 orders of magnitude. Measurements of channels with wavelengths larger than 400 nm change by 8.5 orders of magnitude between dark measurements (collector of the instrument capped) and full sunlight and, at some point, have to switch between “high” and “medium” gains to extend the ADC's dynamic range of about 7 orders of magnitude. Nonlinearities have been noted for legacy instruments when the gain changes and may manifest themselves as steps in the ratio of the instrument's measurements and a smoothly varying reference. Because every channel changes the gain at a different time, such step changes would also occur at different times. While ratios of measurement and theory shown in Figs. 8d and 9 do exhibit some step changes of up to 0.5 % (e.g., when global measurements resume after shadowbanding), such steps occur simultaneously for all channels. We estimate from this analysis that the nonlinearity caused by gain changes is smaller than 0.1 %, and there is also no evidence of nonlinearity at other times.
Measurements during totality (Fig. 14) suggest that the detection limit of the GUVis-3511 radiometer is about 10−4 µW cm−2 nm−1. This detection limit is comparable with that of scanning spectroradiometers with photomultiplier tube (PMT) detectors, which are considered to be the most accurate instrument for observing the solar irradiance at Earth's surface (Seckmeyer et al., 2001). While multi-channel filter radiometers such as the GUVis-3511 do not have the wavelength resolution of these spectroradiometers, they have a superior sampling rate than these instruments (e.g., 1 Hz versus 5 min for one spectrum) and are therefore better suited to study fast-changing phenomena such as the rapid change in irradiance close to the second or third contact.
Measurements of spectral irradiance during the total solar eclipse of 21 August 2017 were used to validate parameterizations of solar LD and to assess the effects of the eclipse on the ratio of direct-to-global irradiance, AOD, and TOC. For wavelengths longer than 400 nm, the change in global spectral irradiance over the period of the eclipse agrees to within ±4.0 % with theoretical predictions that were derived from two independent parameterizations of solar LD by Pierce and Neckel. When excluding a 16 min period, which was likely affected by excess amounts of aerosols, the agreement is to within ±2.5 %. Between 315 and 400 nm, differences between observation and theory are smaller than 5.5 % and increase to about 9 % at 306 nm. In the visible and infrared ranges, these differences are similar in magnitude before and after totality. For wavelengths between 306 and 340 nm, the difference is larger between the first and second contact than between the third and fourth contact. Most of this asymmetry is likely caused by changing aerosol conditions.
Several recent papers (e.g., Blumthaler et al., 2006; Emde and Mayer, 2007; Kazadzis et al., 2007) have used the LD parameterization by Waldmeier, which does not consider the wavelength dependence of hydrogen absorption in the Sun's photosphere. When we compared our observations with data derived from this parameterization, observations were lower than theory by up to 37 % at 306 nm and 19 % at 412 nm. For longer wavelengths, differences were in the ±8 % range. These differences are well beyond the uncertainty of our observations, suggesting that the parameterization by Waldmeier is too simple and should not be used.
Results shown in Fig. 13 illustrate that accurate TOC measurements during a solar eclipse can only be achieved if the wavelength dependence of LD is appropriately corrected. Without correction, TOC values derived from the 305 nm ∕ 340 nm wavelength pair increase with increasing solar occultation and are too high by 23 DU (or 8.2 %) shortly before the second contact. Using the LD correction by Waldmeier, this bias is reduced to 19 DU. When data are corrected using the parameterization by either Pierce or Neckel, TOC measurements stay constant to within ±2.6 DU during the duration of the eclipse. Our conclusion that the LD correction is important contradicts findings of several recent papers, which determined that the LD effect is either less than 0.01 % (Blumthaler et al., 2006; Kazadzis et al., 2007), 1 % (Zerefos et al., 2000), or less than 1.6 % (Kazantzidis et al., 2007). As a result, TOC measurements reported in these papers show spurious changes over the course of an eclipse.
Our data do not support the conclusions by Zerefos (2000, 2007) that gravity or bow waves, which are set off by the Moon's shadow moving at supersonic over the atmosphere, lead to variations the TOC. For example, variations in TOC are smaller than ±1.0 DU (±0.33 %) between the third and fourth contact and smaller than ±0.15 DU (±0.05 %) between the fourth contact and the end of our measurements. These variations are well within the natural variability and the uncertainty of our measurements.
There is no clear evidence that the solar eclipse drives changes in the ratio of direct-to-global irradiance for the period accessible from our measurements (i.e., up to 200 s before the second contact and 105 s after the third contact). The observed decline in this ratio (up to 20 % in the UV-B, 15 % in the visible, and 3.5 % in the IR ranges) can be explained with variability from aerosols stemming from wildfires. Invariance of this ratio is expected from theory (Emde and Mayer 2007) but contradicts results by Zerefos et al. (2000), who determined that the ratio of diffuse-to-direct erythemal irradiance increased by 50 % during the eclipse studied by Zerefos et al. (2000), peaking at the time of the eclipse maximum.
During totality, the global spectral irradiance was decreased by factors of 18 700 at 315 nm, 7000 at 340 nm, 18 340 at 665 nm, 136 650 at 940 nm, and 46 150 at 1020 nm. The average reduction for channels in the visible range (412–665 nm) is 11 460, which is about a factor of 35 smaller than the ratio of about 400 000 between the irradiance from the Sun and the full Moon.
Results also confirmed that the GUVis-3511 radiometer is an excellent instrument for observing the fast-changing radiation levels during an eclipse, with a detection limit of 10−4 µW cm−2 nm−1. By implementing a new calibration method developed for the specific conditions during the eclipse, measurements with low uncertainty (e.g., 2.7 % for wavelengths between 320 and 875 nm) can be achieved. Comparisons between measurement and theory did not indicate any signs of nonlinearity over the dynamic range of about 4 orders of magnitude between full sunlight and totality.
Lastly, data from the campaign are available as a Supplement and can be used to study the rapid change in irradiance during the transition from a partial to a total eclipse with the help of a 3-D RT model like that developed by Emde and Mayer (2007). During this transition, the radiation field changes fundamentally as the Sun's direct component is removed and the illumination becomes entirely diffuse. During totality, the irradiance at the surface will become also more sensitive to the topography (e.g., the mountains surrounding the measurement sites; Fig. 1), surface albedo (and its spectral dependence), and the distribution of ozone in the atmosphere (the ozone profile). These aspects will be discussed in a follow-on publication.
Calibrated data and data used to draw Figs. 3, 8, and 14 are available as a Supplement.
The supplement related to this article is available online at: https://doi.org/10.5194/acp-19-4703-2019-supplement.
GB designed and executed the measurements, performed the data analysis, and wrote the paper. BP contributed to the implementation of the solar limb darkening parameterizations by Pierce and Neckel and contributed to writing the paper.
GB is employed by Biospherical Instruments Inc., which is also the manufacturer of the GUVis-3511 radiometer described in this paper.
Germar Bernhard thanks Biospherical Instrument Inc. for supporting this activity and Anne Hoppe for her encouragement to travel to Oregon and her help in setting up the experiment. We thank Bjørn Johnsen from the Norwegian Radiation Protection Authority (now the Norwegian Radiation and Nuclear Safety Authority) for performing spectral response measurements of the GUVis-3511 radiometer used in this campaign. We also thank Bernhard Mayer and Paul Ockenfuß from the Ludwig-Maximilians-Universität München, Munich, Germany, for discussing our results and for their valuable suggestions. Lastly, we thank two anonymous reviewers and Forrest M. Mims III for their comments, which greatly improved the paper.
This paper was edited by Stelios Kazadzis and reviewed by two anonymous referees.
Adams, C., McLinden, C. A., Strong, K., and Umlenski, V.: Ozone and NO2 variations measured during the 1 August 2008 solar eclipse above Eureka, Canada with a UV-visible spectrometer, J. Geophys. Res., 115, D19310, https://doi.org/10.1029/2010JD014424, 2010.
Antón, M., Serrano, A., Cancillo, M. L., Vaquero, J. M., and Vilaplana J. M.: Solar irradiance and total ozone over El Arenosillo (Spain) during the solar eclipse of 3 October 2005, J. Atmos. Sol.-Terr. Phy., 72, 789–793, https://doi.org/10.1016/j.jastp.2010.03.025, 2010.
Basher, R. E.: Review of the Dobson spectrophotometer and its accuracy, WMO Global Ozone Res. Monit. Proj. Rep. 13, World Meteorol. Organ., Geneva, Switzerland, 1982.
Bass, A. and Paur, R. J.: The ultraviolet cross sections of ozone: The measurement, in: Atmospheric Ozone, edited by: Zerefos, C., Ghazi, A., and Reidel, D., Norwell, Mass, 606–616, 1985.
Bernhard, G., Booth, C. R., and McPeters, R. D.: Calculation of total column ozone from global UV spectra at high latitudes, J. Geophys. Res., 108, 4532, https://doi.org/10.1029/2003JD003450, 2003.
Bernhard, G., Booth, C. R., and Ehramjian, J. C.: Version 2 data of the National Science Foundation's Ultraviolet Radiation Monitoring Network – South Pole, J. Geophys. Res., 109, D21207, https://doi.org/10.1029/2004JD004937, 2004.
Bernhard, G., Booth, C. R., and Ehramjian, J. C.:. Real-time ultraviolet and column ozone from multichannel ultraviolet radiometers deployed in the National Science Foundation's ultraviolet monitoring network, Opt. Eng., 44, 041011-1, https://doi.org/10.1117/1.1887195, 2005a.
Bernhard, G., Evans, R. D., Labow, G. J., and Oltmans, S. J.: Bias in Dobson total ozone measurements at high latitudes due to approximations in calculations of ozone absorption coefficients and air mass, J. Geophys. Res., 110, D10305, https://doi.org/10.1029/2004JD005559, 2005b.
Blumthaler, M., Bais, A., Webb, A., Kazadzis, S., Kift, R., Kouremeti, N., Schallhart, B., and Kazantzidis, A.: Variations of solar radiation at the Earth's surface during the total solar eclipse of 29 March 2006, in: Remote Sensing of Clouds and the Atmosphere XI, p. 6362, International Society for Optics and Photonics, 2006.
Bodhaine, B. A., Wood, N. B., Dutton, E. G., and Slusser, J. R.: On Rayleigh optical depth calculations, J. Atmos. Ocean. Tech., 16, 1854–1861, 1999.
Bojkov, R. D.: The ozone variations during the solar eclipse of 20 May 1966, Tellus, 20, 417–421, https://doi.org/10.1111/j.2153-3490.1968.tb00382.x, 1968.
Chimonas, G. and Hines, C. O.: Atmospheric gravity waves induced by a solar eclipse, J. Geophys. Res., 76, 7003–7005, https://doi.org/10.1029/JA075i004p00875, 1971.
Emde, C. and Mayer, B.: Simulation of solar radiation during a total eclipse: a challenge for radiative transfer, Atmos. Chem. Phys., 7, 2259–2270, https://doi.org/10.5194/acp-7-2259-2007, 2007.
Gröbner, J., Kazadzis, S., Kouremeti, N., Doppler, L., Tagirov, R., and Shapiro, A. I.: Spectral solar variations during the eclipse of 20 March 2015 at two European sites, in: AIP Conference Proceedings, 1810, 080008, https://doi.org/10.1063/1.4975539, 2017.
Hooker, S. B., Bernhard, G., Morrow, J. H., Booth, C. R., Comer, T., Lind, R. N., and Quang, V.: Optical Sensors for Planetary Radiant Energy (OSPREy): calibration and Validation of Current and Next-Generation NASA Missions, NASA Goddard Space Flight Center, NASA/TM–2011–215872, 2012.
Kasten, F. and Young, A. T.: Revised optical air mass tables and approximation formula, Appl. Opt., 28, 4735–4738, https://doi.org/10.1364/AO.28.004735, 1989.
Kazadzis, S., Bais, A., Blumthaler, M., Webb, A., Kouremeti, N., Kift, R., Schallhart, B., and Kazantzidis, A.: Effects of total solar eclipse of 29 March 2006 on surface radiation, Atmos. Chem. Phys., 7, 5775–5783, https://doi.org/10.5194/acp-7-5775-2007, 2007.
Kazantzidis, A., Bais, A. F., Emde, C., Kazadzis, S., and Zerefos, C. S.: Attenuation of global ultraviolet and visible irradiance over Greece during the total solar eclipse of 29 March 2006, Atmos. Chem. Phys., 7, 5959–5969, https://doi.org/10.5194/acp-7-5959-2007, 2007.
Koepke, P., Reuder, J., and Schween, J.: Spectral variation of the solar radiation during an eclipse, Meteorol. Z., 10, 179–186, https://doi.org/10.1127/0941-2948/2001/0010-0179, 2001.
Krotkov, N. A., Bhartia, P. K., Herman, J. R., Slusser, J. R., Labow, G. J., Scott, G. R., Janson, G. T., Eck, T., and Holben, B. N.: Aerosol ultraviolet absorption experiment (2002 to 2004), Part 1: Ultraviolet multifilter rotating shadowband radiometer calibration and intercomparison with CIMEL sunphotometers, Opt. Eng., 44, 041004-1–041004-17, 2005.
Mateos, D., Antón, M., and Vaquero, J. M.: Influence of solar eclipse of 3 November 2013 on the total ozone column over Badajoz, Spain, J. Atmos. Sol.-Terr. Phy., 112, 43–46, https://doi.org/10.1016/j.jastp.2014.02.005, 2014.
Macdonald, L.: Our Sun, in: How to Observe the Sun Safely, Springer, New York, 1–16, https://doi.org/10.1007/978-1-4614-3825-0_1, 2012.
McKenzie, R. L., Aucamp, P. J., Bais, A. F., Björn, L. O., Ilyas, M., and Madronich, S.: Ozone depletion and climate change: impacts on UV radiation, Photochem. Photobiol. Sci., 10, 182–198, https://doi.org/10.1039/C0PP90034F, 2011.
Mims III, F. M. and Mims, E. R.: Fluctuations in column ozone during the total solar eclipse of 11 July 1991, Geophys. Res. Lett., 20, 367–370, https://doi.org/10.1029/93GL00493, 1993.
Morrow, J. H., Hooker, S. B., Booth, C. R., Bernhard, G., Lind, R. N., and Brown, J. W.: Advances in measuring the apparent optical properties (AOPs) of optically complex waters, NASA/TM–2010–215856, National Aeronautics and Space Administration, Goddard Space Flight Center, 2010.
Neckel, H.: Analytical Reference Functions F(λ) for the Sun's Limb Darkening and Its Absolute Continuum Intensities (λ300 to 1100 m), Sol. Phys., 229, 13–33, https://doi.org/10.1007/s11207-005-4081-z, 2005.
O'Neill, N. T., Eck, T. F., Holben, B. N., Smirnov, A., Royer, A., and Li, Z.: Optical properties of boreal forest fire smoke derived from Sun photometry, J. Geophys. Res., 107, 4125, https://doi.org/10.1029/2001JD000877, 2002.
Parrish, A., Boyd, I. S., Nedoluha, G. E., Bhartia, P. K., Frith, S. M., Kramarova, N. A., Connor, B. J., Bodeker, G. E., Froidevaux, L., Shiotani, M., and Sakazaki, T.: Diurnal variations of stratospheric ozone measured by ground-based microwave remote sensing at the Mauna Loa NDACC site: measurement validation and GEOSCCM model comparison, Atmos. Chem. Phys., 14, 7255–7272, https://doi.org/10.5194/acp-14-7255-2014, 2014.
Pasachoff, J. M.: The Great Solar Eclipse of 2017, Sci. Am., 317, 54–61, https://10.1038/scientificamerican0817-54, 2017.
Pierce, A. K. and Slaughter, C. D.: Solar limb darkening, Sol. Phys., 51, 25–41, https://doi.org/10.1007/BF00240442, 1977.
Pierce, A. K., Slaughter, C. D., and Weinberger, D.: Solar limb darkening in the interval 7404–24 018 Å, II. Sol. Phys., 52, 179–189, https://doi.org/10.1007/BF00935800, 1977.
Seckmeyer, G. and Bernhard, G.:. Cosine error correction of spectral UV-irradiances, in: Atmospheric Radiation, 2049, 140–152, International Society for Optics and Photonics, https://doi.org/10.1117/12.163505, 1993.
Seckmeyer, G., Bais, A., Bernhard, G., Blumthaler, M., Booth, C. R., Disterhoft, P., Erikson, P., McKenzie, R. L., Miyauchi, M., and Roy, C.: Instruments to measure solar ultraviolet radiation, Part 1: Spectral instruments, World Meteorological Report 125, WMO TD 1066, 2001.
Seckmeyer, G., Bais, A., Bernhard, G., Blumthaler, M., Johnsen, B., Lantz, K., and McKenzie, R.: Instruments to measure solar ultraviolet radiation, Part 3: Multi-channel filter instruments, World Meteorological Organization Global Atmosphere Watch, Report 190, WMO TD 1537, 2010.
Sharp, W. E., Silverman, S. M., and Lloyd, J. W. F.: Summary of sky brightness measurements during eclipses of the sun, Appl. Opt., 10, 1207–1210, https://doi.org/10.1364/AO.10.001207, 1971.
Stamnes, K., Slusser, J., and Bowen, M.: Derivation of total ozone abundance and cloud effects from spectral irradiance measurements, Appl. Opt., 30, 4418–4426, https://doi.org/10.1364/AO.30.004418, 1991.
Tagirov, R. V., Shapiro, A. I., and Schmutz, W.: NESSY: NLTE spectral synthesis code for solar and stellar atmospheres, Astron. Astrophys., 603, https://doi.org/10.1051/0004-6361/201628574, 2017.
Waldmeier, M.: Ergebnisse und Probleme der Sonnenforschung, Probleme der kosmischen Physik, Akad. Verlagsges., Becker & Erler, Leipzig, Germany, 264 pp., 1941.
Witthuhn, J., Deneke, H., Macke, A., and Bernhard, G.: Algorithms and uncertainties for the determination of multispectral irradiance components and aerosol optical depth from a shipborne rotating shadowband radiometer, Atmos. Meas. Tech., 10, 709–730, https://doi.org/10.5194/amt-10-709-2017, 2017.
Zerefos, C. S., Balis, D. S., Meleti, C., Bais, A. F., Tourpali, K., Kourtidis, K., K. Vanicek, K., Cappellani, F., Kaminski, U., Colombo, T., and Stübi, R.: Changes in surface solar UV irradiances and total ozone during the solar eclipse of 11 August 1999, J. Geophys. Res., 105, 26463–26473, https://doi.org/10.1029/2000JD900412, 2000.
Zerefos, C. S., Balis, D. S., Zanis, P., Meleti, C., Bais, A. F., Tourpali, K., Melas, D., Ziomas I., Galani, E., Kourtidis, K., Papayannis, A., and Gogosheva, Z.:. Changes in surface UV solar irradiance and ozone over the Balkans during the eclipse of 11 August 1999, Adv. Space Res., 27, 1955–1963, https://doi.org/10.1016/S0273-1177(01)00279-4, 2001.
Zerefos, C. S., Gerasopoulos, E., Tsagouri, I., Psiloglou, B. E., Belehaki, A., Herekakis, T., Bais, A., Kazadzis, S., Eleftheratos, C., Kalivitis, N., and Mihalopoulos, N.: Evidence of gravity waves into the atmosphere during the March 2006 total solar eclipse, Atmos. Chem. Phys., 7, 4943–4951, https://doi.org/10.5194/acp-7-4943-2007, 2007.
Zhang, S.-R., Erickson, P. J., Goncharenko, L. P., Coster, A. J., Rideout, W., and Vierinen, J.: Ionospheric bow waves and perturbations induced by the 21 August 2017 solar eclipse, Geophys. Res. Lett., 44, 12067–12073, https://doi.org/10.1002/2017GL076054, 2017.