the Creative Commons Attribution 4.0 License.
the Creative Commons Attribution 4.0 License.
 | 03 Apr 2019
Satellite data reveal a common combustion emission pathway for major cities in China
Avelino F. Arellano
Benjamin Gaubert
Kazuyuki Miyazaki
Helen M. Worden
Extensive fossil fuel combustion in rapidly developing cities severely affects air quality and public health. We report observational evidence of decadal changes in the efficiency and cleanness of bulk combustion over large cities in mainland China. In order to estimate the trends in enhancement ratios of CO and SO2 to NO2 (ΔCO∕ΔNO2 and ΔSO2∕ΔNO2) and infer emergent bulk combustion properties over these cities, we combine air quality retrievals from widely used satellite instruments across 2005–2014. We present results for four Chinese cities (Shenyang, Beijing, Shanghai, and Shenzhen) representing four levels of urban development. Our results show a robust coherent progression of declining to growing ΔCO∕ΔNO2 relative to 2005 ( to yr−1) and slowly declining ΔSO2∕ΔNO2 ( to % yr−1) across the four cities. The coherent progression we find is not evident in the trends of emission ratios reported in Representative Concentration Pathway (RCP8.5) inventory. This progression is likely due to a shift towards cleaner combustion from industrial and residential sectors in Shanghai and Shenzhen that is not yet seen in Shenyang and Beijing. This overall trend is presently obfuscated by China's still relatively higher dependence on coal. Such progression is well-correlated with economic development and traces a common emission pathway that resembles evolution of air pollution in more developed cities. Our results highlight the utility of augmenting observing and modeling capabilities by exploiting enhancement ratios in constraining the time variation in emission ratios in current inventories. As cities and/or countries continue to socioeconomically develop, the ability to monitor combustion efficiency and effectiveness of pollution control becomes increasingly important in assessing sustainable control strategies.
Please read the corrigendum first before continuing.
-
Notice on corrigendum
The requested paper has a corresponding corrigendum published. Please read the corrigendum first before downloading the article.
-
Article
(3467 KB)
- Corrigendum
-
Supplement
(1453 KB)
-
The requested paper has a corresponding corrigendum published. Please read the corrigendum first before downloading the article.
- Article
(3467 KB) - Corrigendum
-
Supplement
(1453 KB) - BibTeX
- EndNote


Urban agglomeration, particularly megacities (i.e., cities with > 10 million inhabitants), are expected to continue growing (in size and number) over the coming decades (Jalkanen, 2012; World Bank, 2015). Anthropogenic activities are most intense in megacities, accompanied by immense energy consumption mainly in the form of fossil fuel combustion (Mage et al., 1996; Kennedy et al., 2015). These lead to enhanced emissions of air pollutants, greenhouse gases, and waste energy, largely impacting air quality (AQ), climate, and ecosystems (Baklanov et al., 2016; Lelieveld et al., 2015). At present, estimates of city- to national-scale emissions from fossil fuel combustion remain uncertain, especially in rapidly developing regions where combustion is still poorly characterized due to the lack of detailed information on energy use, combustion practices, and pollution control strategies (Streets et al., 2013; Creutzig et al., 2015). This is also confounded by larger uncertainties on other sources of pollution that may be associated with urbanization (e.g., deforestation, agriculture, and fires). These alone prevent us from accurately assessing the changes in atmospheric composition due to anthropogenic activities at scales that are relevant to AQ, energy, and environmental policy (National Academies of Sciences, Engineering, and Medicine, 2016).
Such is the case for cities in China even with the scientific attention the country has received in the past decades. As China grew into the world's second largest economy, its rapid development resulted in substantial emissions (Richter et al., 2005) and more frequent occurrences of severe pollution events in many of its megacities, most notably Beijing (Guo et al., 2014). These affect not only local AQ and public health but are also reported to impact the hemispheric to global atmospheric environment (Lin et al., 2014; Verstraeten et al., 2015). Along with the growth of these cities is a growing body of evidence of decreasing emissions and associated pollution levels in some cities in China. This points to important changes in AQ as a result of development, AQ management, and regional to national socioeconomic initiatives embodied within its Five-Year Plans (FYP) (Reuter et al., 2014; Krotkov et al., 2016; van der A et al., 2017; Sun et al., 2018; Koukouli et al., 2018). However, these changes in AQ as a result of efforts to control air pollution are still obfuscated at present by the increase in combustion activities, along with uncertainties in bottom-up emission inventories and diversity in economic structure and growth across cities (Wang and Hao, 2012; Mi et al., 2017). Monitoring these reductions at the city scale remains a challenge, especially when narrowly viewed within the context of a single pollutant, and more so when attributing them to a particular emission sector.
Fossil fuel emissions from an evolving megacity follow a pattern that can be potentially monitored and refined, by combining observational constraints on combustion activity (abundance of combustion products) with efficiency and effectiveness of pollution control strategies or “cleanness” (enhancement ratios of these products) (Silva and Arellano, 2017; Silva et al., 2013; Hassler et al., 2016; Tang et al., 2018, 2019), alongside information on the state of socioeconomic development (e.g., gross domestic product (GDP) or income) and a priori estimates from bottom-up emission inventories. In particular, the cleanness of combustion of a known fossil fuel type can be determined stoichiometrically by measuring the relative abundance of intermediate products such as carbon monoxide (CO), nitrogen oxides (NOx), sulfur dioxides (SO2), and soot particles with final products like carbon dioxide (CO2). Please see the Methods section for more details. Most of these products are currently monitored as criteria pollutants by surface measurement networks and as tracers of pollution by satellite remote sensing (Streets et al., 2013; Duncan et al., 2014). In fact, these combustion products are revealed in space as very distinct bulk enhancements over a megacity metropolitan location in marked spatial contrast with the city's surroundings (Bechle et al., 2011; Lamsal et al., 2013). At a scale of a megacity being monitored from space, these enhancements are analogous to smoke plumes coming from a stationary smokestack. And so, observations of these megacity plumes enable us to monitor bulk anthropogenic activity and transboundary pollution. They have also been used in recent years to refine the spatiotemporal distribution of emissions (Lamsal et al., 2013; Hakkarainen et al., 2016; Ding et al., 2017); to indicate bulk combustion efficiency, inter-megacity differences, and fire phase (Silva et al., 2013; Silva and Arellano, 2017; Tang and Arellano, 2017); and to infer fossil fuel CO2 emissions (Konovalov et al., 2016) among others. From an annual to decadal standpoint, it is reasonable to interpret the long-term changes in spatial covariations between these observed pollutant enhancements within the megacity to reflect dominant shifts in bulk combustion characteristics (e.g., changes in fuel mixture and technology practice), which can then be indicative of an emission pathway for a given megacity (e.g., Parrish et al., 2002; Parrish, 2006; Russell et al., 2012; Silva et al., 2013; Hassler et al., 2016; Silva and Arellano, 2017). Data sampling and collocation issues, as well as retrieval information content and chemical nonlinearities between these pollutants, do not quite manifest at decadal scales more than emission changes, especially when treated as a smokestack in the analysis.
In this study, our goal is to uncover space-based evidence of dominant shifts in the cleanness of bulk combustion of large cities across the recent decade (through these ratios), associate these shifts with particular sectors, and identify a common emission pathway across these cities. Along the same line of studies on environmental Kuznets curves (EKC, Stern, 2004) and human development (Lamb et al., 2014), we attempt to connect this pathway to economic growth by finding a power-law relationship between the ratios observed for each major city in China and the city's GDP per capita. As cities in China grow, emissions from fossil fuel combustion evolve accordingly depending on the rate and type of socioeconomic development, technological innovation, and environmental policies (Chan and Yao, 2008; Bechle et al., 2011; Zhang et al., 2012; Wang and Hao, 2012; He and Wang, 2012; Luo et al., 2014; Koukouli et al., 2018; Sun et al., 2018). This evolution however cannot be reflected at shorter timescales. As a basis for comparison, pollution controls adopted in developed countries like the United States and Europe, which followed a progression from first controlling SO2, CO, and then NOx (Crippa et al., 2016), reflect some aspects of decadal-scale sustainable development that can be brought to light in the case of China.
We analyze the emergent patterns of the cleanness of bulk combustion in the past decade (2005–2014), based on enhancement ratios between intermediate products of combustion (ΔCO∕ΔNO2 and ΔSO2∕ΔNO2) observed within each megacity and urban agglomeration in China. We use gridded monthly-averaged satellite retrievals of total columns of CO from Measurement of Pollution In The Troposphere (MOPITT), tropospheric columns of NO2 from Ozone Monitoring Instrument (OMI), and planetary boundary layer (PBL) columns of SO2 from OMI to derive monthly estimates of these ratios. We conduct spatial regression analysis and subsequently derive estimates of the decadal trends of these ratios using time series analysis. We then compare these trend estimates to inferred trends from a couple of model-derived abundance ratios and several emission ratios from current bottom-up emission inventories, including estimates based on the Representative Concentration Pathways scenario (RCP8.5) (Riahi et al., 2011). We also conduct a simple inverse analysis to update the contribution of major emission sectors in RCP8.5 to fit our estimates of decadal changes in enhancement ratios. Section 2 describes data and methods used in this study. Results and discussions are presented in Sect. 3. Section 4 is summary and implication of this study.
2.1 Study region
We consider all 31 provincial capitals and five special cities (Beijing, Shanghai, Shenzhen, Tianjin, and Chongqing) in mainland China for our analysis. These cities comprise the main urban agglomerations in the country (see Fig. 1 for coverage). For purposes of finding long-term emergent patterns on its emission characteristics, we focus our analysis to 12 representative urban agglomerations. These 12 cities cover the four economic regions of China (i.e., east coast: Beijing, Tianjin, Shanghai, Guangzhou, Shenzhen; central China: Wuhan, northeast China: Harbin, Shenyang; and western China: Chengdu, Chongqing, Xian, Hohhot). Based on prior information from RCP8.5 and the National Bureau of Statistics of China (http://data.stats.gov.cn, last access: 22 March 2019), these cities already exhibit largely diverse pollution and economic development attributes illustrated in Fig. 1 as differences in magnitude, sectoral, and temporal distribution of emissions and GDP per capita for 2005 to 2014 between these cities. Our goal is to assess whether the long-term patterns that are seen in these a priori emission estimates are consistent with observations. We also consider Los Angeles and other large cities in the United States (New York City, Chicago, Houston, Phoenix, Boston, Seattle, and Miami) for comparison.
Table 1List of satellite products and emission inventories used in this study. All these datasets are re-gridded into if not originally at this resolution. This version of CHASER–LETKF does not provide emissions of SO2.
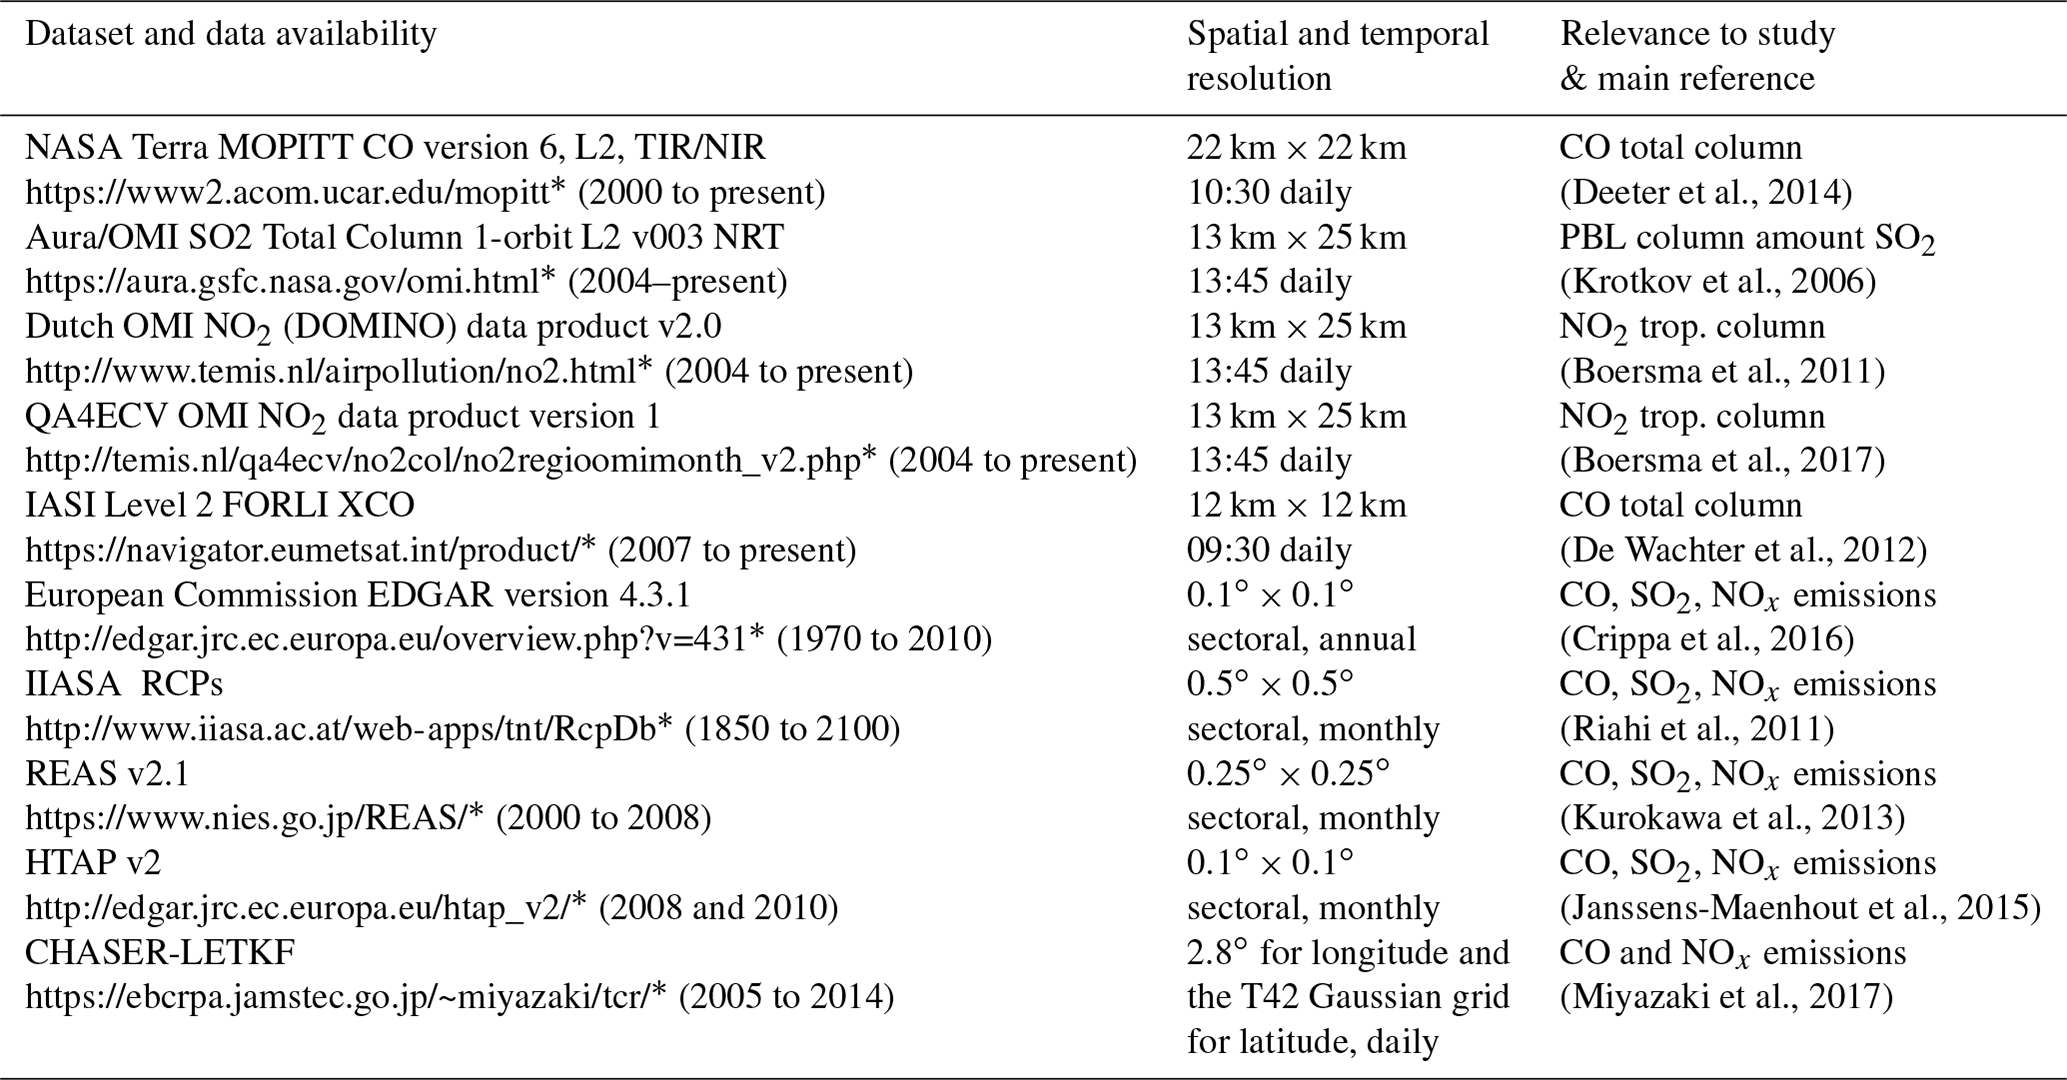
* Last access date: 22 March 2019.
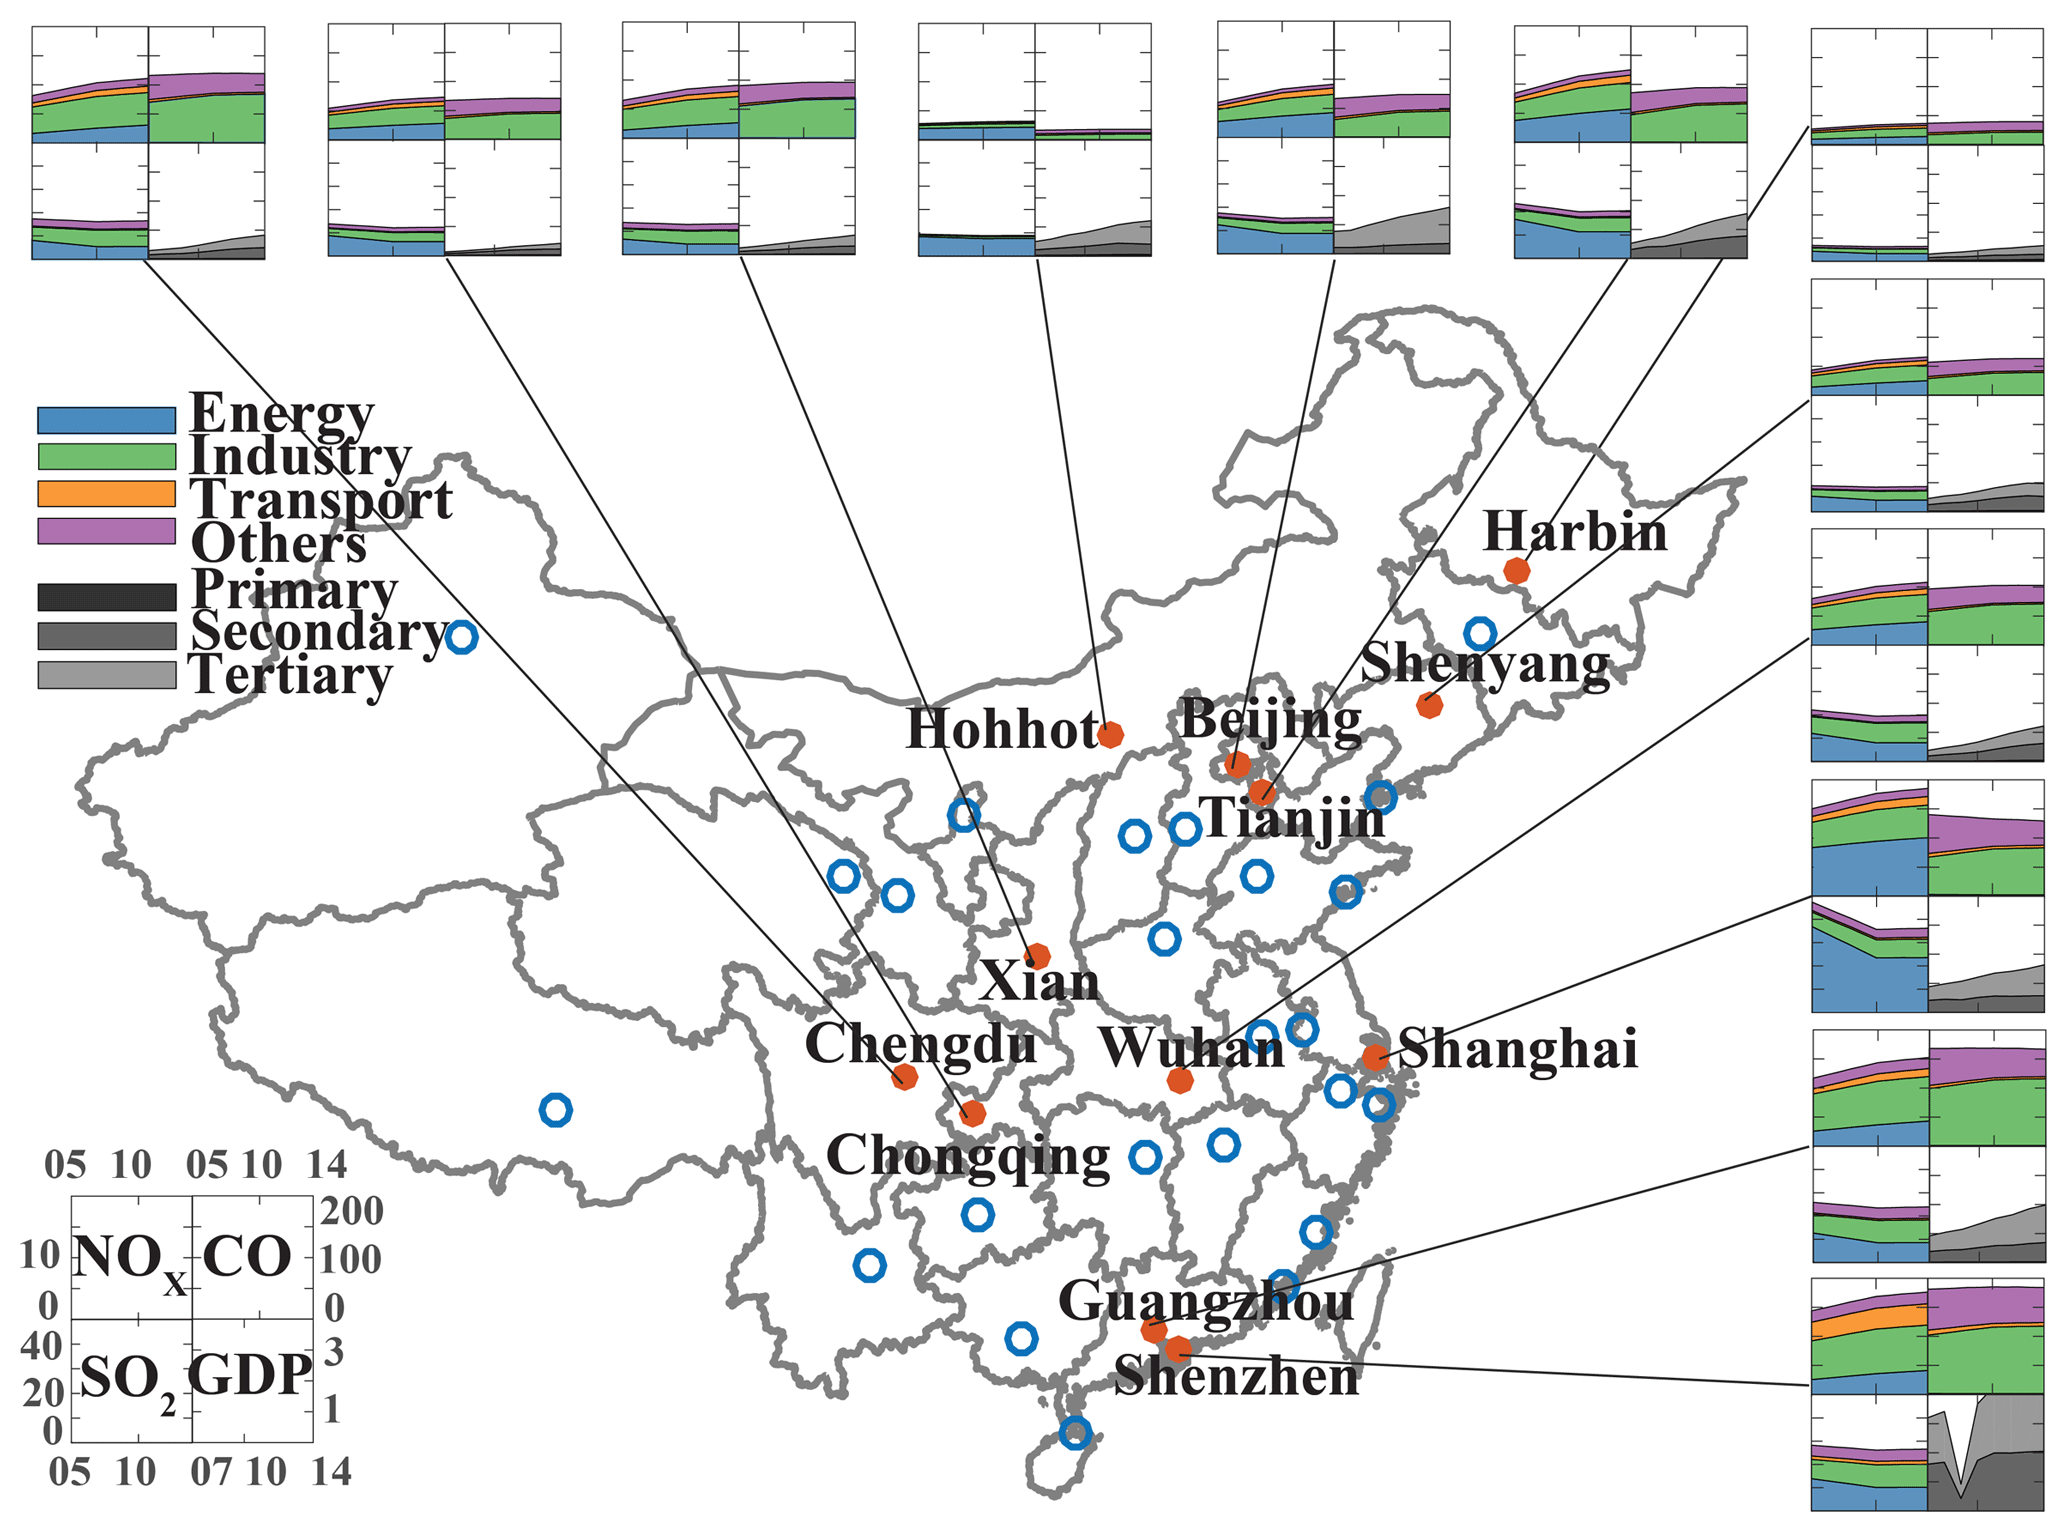
Figure 1Time series (2005–2014) of RCP8.5 combustion-related emissions of NOx (first quad), CO (second quad), and SO2 (third quad) all in units of grams per year per square meter and GDP per capita (fourth quad) in units of CNY 105 per capita per year for each of the 12 select major cities (red dots) in mainland China. The scales of each quadrant are indicated in the legend (lower left of the map). The total emissions for each combustion product are broken down into four major sectors: energy, industry, land transport, and others, which is the sum of agriculture, residential and commercial, and waste treatment and disposal). The GDP per capita is also broken down into primary (direct use of natural resources), secondary (industry and manufacturing), and tertiary (service) sectors. Each blue dot corresponds to one of the 36 designated provincial capital and special cities in mainland China.
2.2 Data
The main datasets used in this study are summarized in Table 1. This includes multiple satellite retrievals, representative emission inventories, and a couple of model simulations and chemical reanalysis.
2.2.1 Satellite retrievals and data processing
We use the NASA Terra Measurement of Pollution In The Troposphere (MOPITT) version 6, Level 2, multispectral (thermal infrared/near infrared) retrievals of carbon monoxide (CO) total columns for CO (Deeter et al., 2014), tropospheric column retrievals from NASA Aura, Dutch Ozone Monitoring Instrument NO2 (DOMINO) v2.0 for NO2 (Boersma et al., 2011) and the Ozone Monitoring Instrument (OMI) planetary boundary layer (PBL) SO2, version 3, Level 2 (Krotkov et al., 2006). We collect daily MOPITT CO, OMI NO2, and OMI SO2 retrievals that are available within a area around each city center. This radius is selected to cover the extent of each city based on NO2 footprints (Bechle et al., 2011; Lamsal et al., 2013) and geopolitical maps of city boundaries. We grid each set of retrievals into grids that commensurate to the finest retrieval resolution among MOPITT and OMI. We then average them across each month to minimize spatiotemporal collocation issues (see Table 1 for differences in sampling of MOPITT and OMI). As a result, there are 400 points for each species (CO, SO2, NO2) per city and month. We note that these retrievals have been used in the past to study decadal changes for individual (or a pair of) pollutants but not to derive enhancement ratios (e.g., Krotkov et al., 2016). While CO retrieved from thermal infrared (TIR) radiances is mostly sensitive to free tropospheric CO, it has also been reported to be capable of observing lower tropospheric CO, especially when retrieved jointly from TIR and near-infrared (NIR) radiances (Worden et al., 2010; Deeter et al., 2014). We recognize, however, that retrievals of SO2 from OMI have been reported to exhibit low sensitivity to weak SO2 signals, in particular to less than 30 to 70 kTon yr−1 of point source emissions (Krotkov et al., 2016). While our spatial and temporal smoothing, along with anchoring our SO2 analysis with NO2 data (please see later description of our regression analysis), should help in enhancing the SO2 signal from cities with low SO2 emissions, these SO2 retrievals are useful as large SO2 abundances are still observed across the majority of cities in China (Krotkov et al., 2016). We also use CO retrievals from the Infrared Atmospheric Sounding Interferometer (IASI), Level 2 (De Wachter et al., 2012), and tropospheric column NO2 from FP7 QA4ECV OMI v1 (Boersma et al., 2017) to verify consistency in our trend estimates.
Table 2Summary of percent rate of change for select cities in China and the United States. Numbers that follow the ± sign are standard errors.
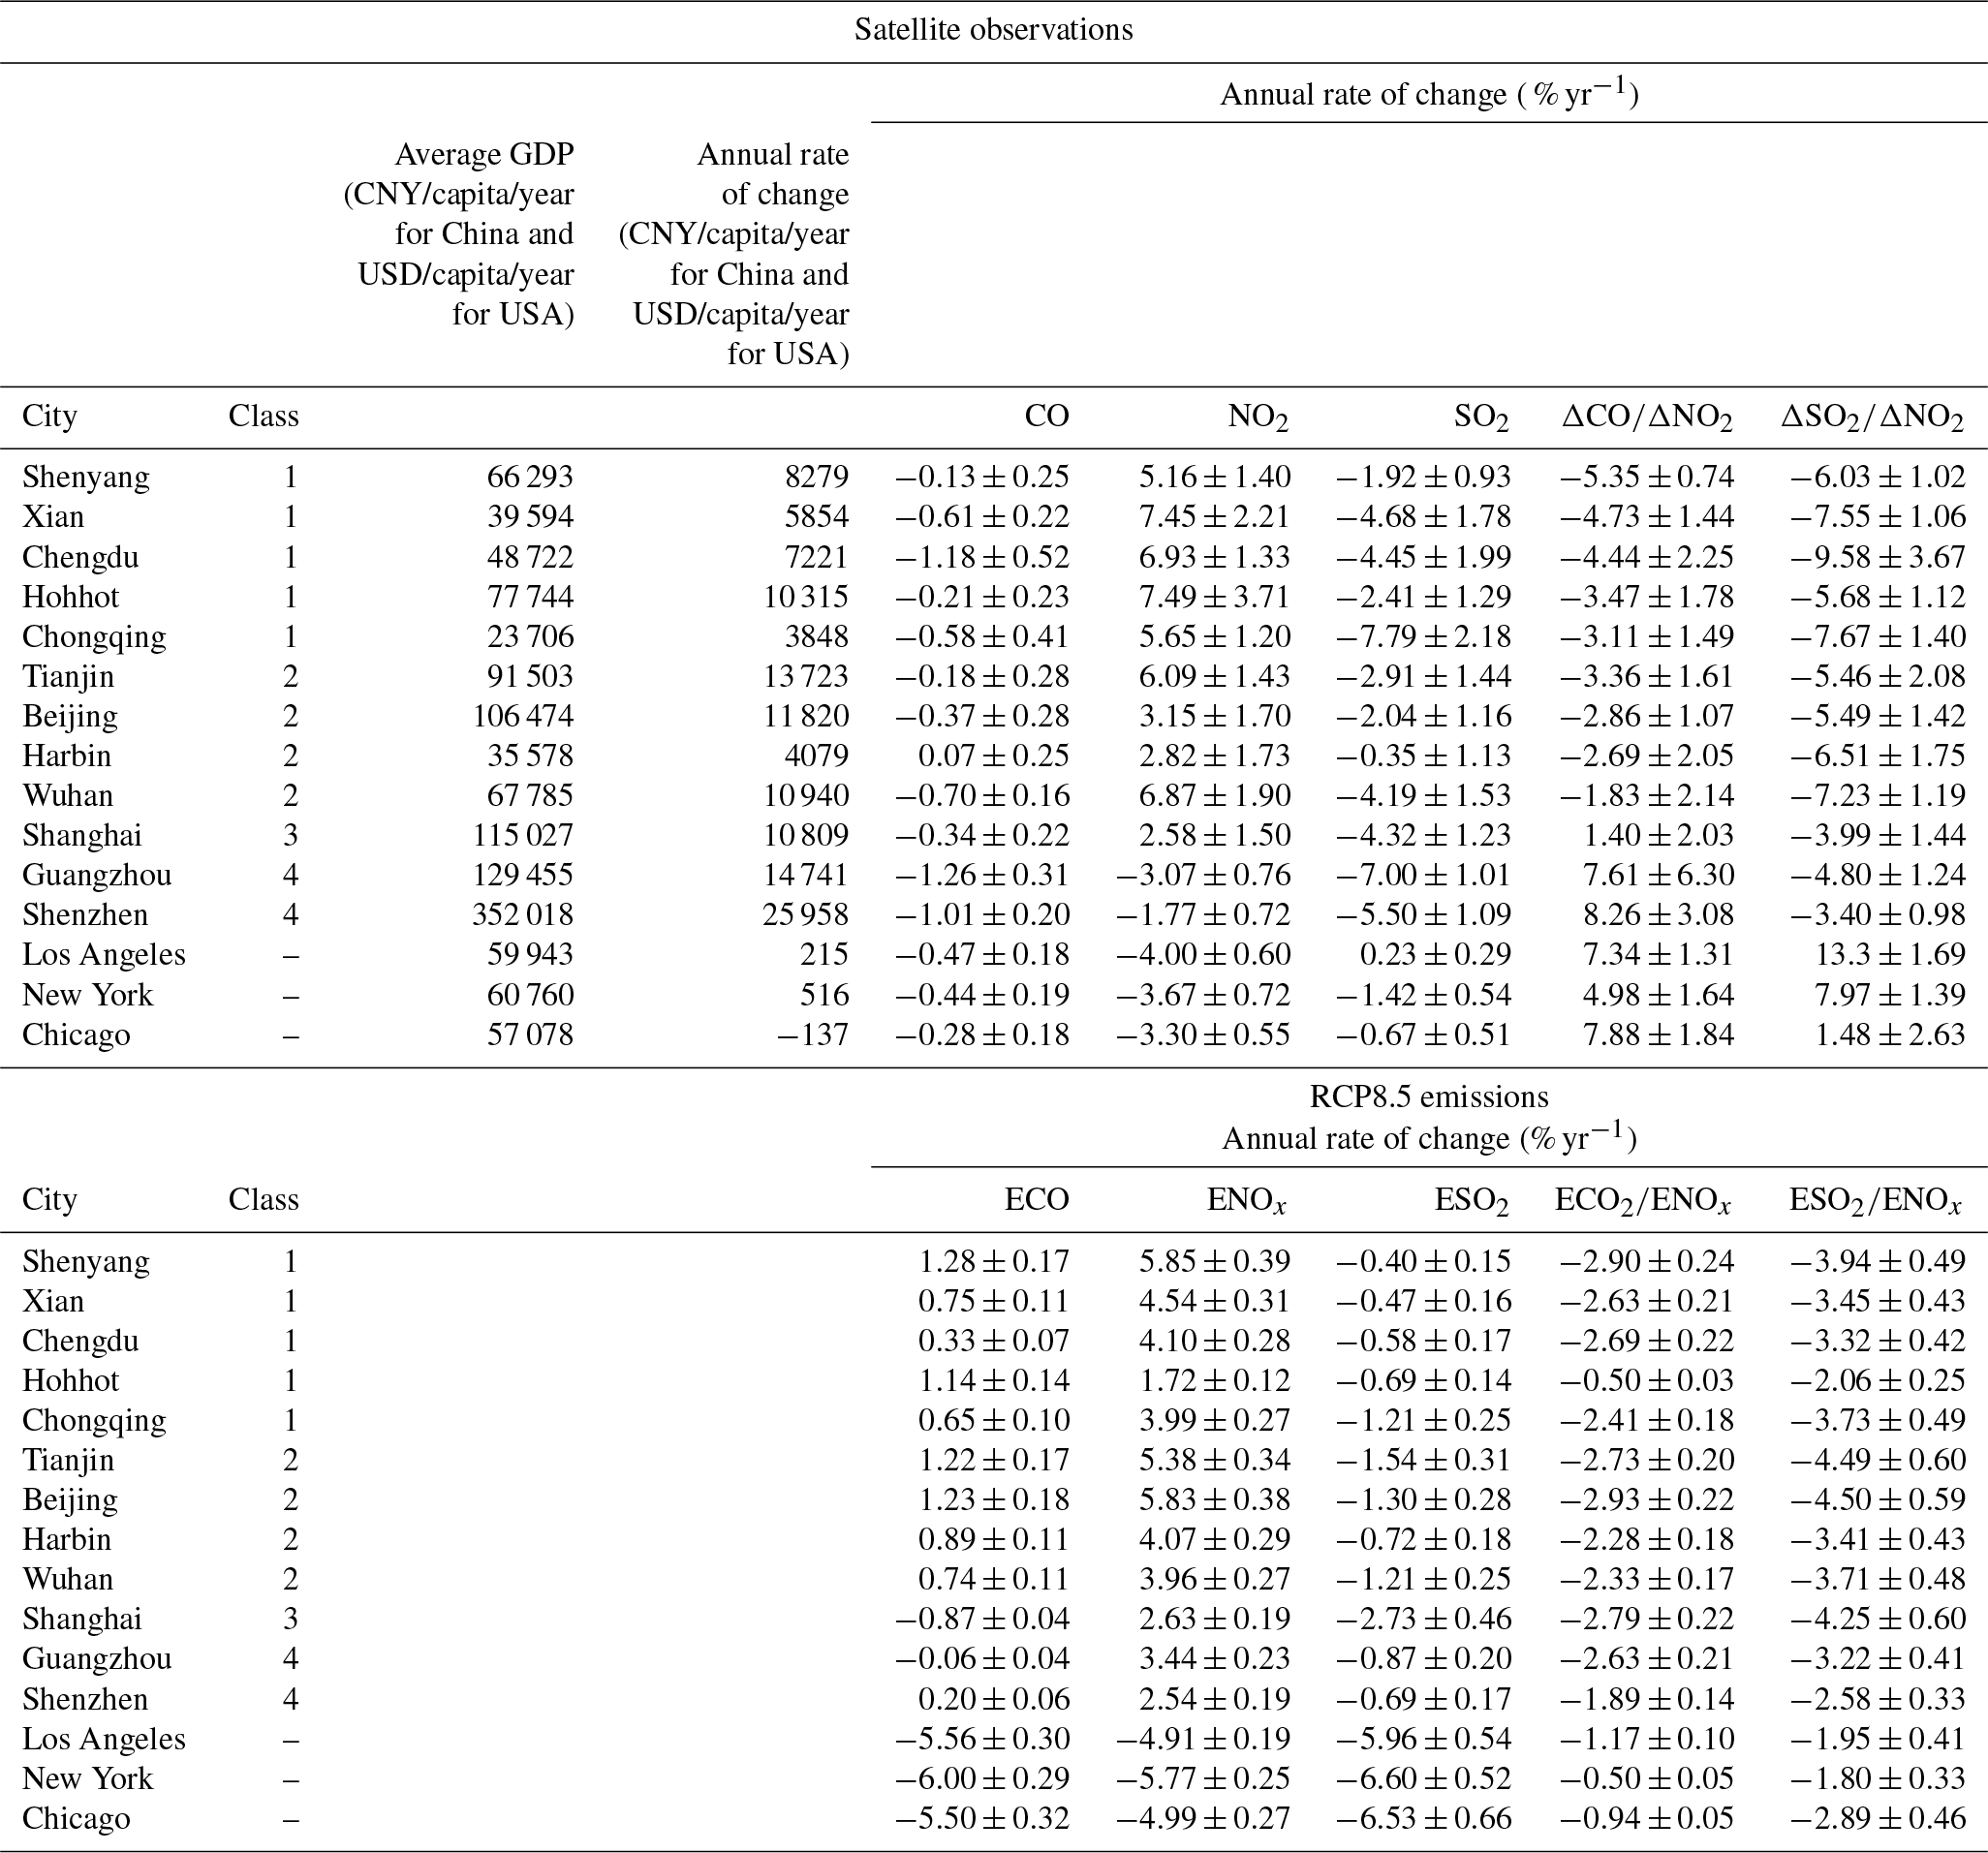
We note that using area to represent cities does lead to slight overlap over Guangzhou and Shenzhen, Beijing, and Tianjin. This does not affect our analyses of emission inventories because we apply geopolitical maps of city boundaries to calculate emissions for each city (see Sect. 2.2.2). This does have an impact on our analyses of satellite observations because we use all the grids in the area to conduct the spatial regression. However, we do not expect the overlap to significantly change our results because (1) the overlapped area is relatively small; (2) the overlapped cities are sometimes considered together as a whole region because of their similarities and connections (for example, the Jing-Jin-Ji megalopolis and the Pearl River Delta); and (3) the overlapped cities are in the same classes with similar patterns based on our analyses (i.e., Beijing and Tianjin are both in class 2, while Guangzhou and Shenzhen are both in class 4; Table 2).
2.2.2 Emission inventories and model simulations
Multiple bottom-up emission inventories for CO, NO2, and SO2 are analyzed, namely the Emission Database for Global Atmospheric Research (EDGAR; Crippa et al., 2016), Representative Concentration Pathways (RCP8.5; Riahi et al., 2011), Regional Emission inventory in ASia (REAS) version 2.1 (Kurokawa et al., 2013), and Hemispheric Transport of Air Pollution (HTAP; Janssens-Maenhout et al., 2015). We also use top-down emission estimates of CO and NO2 from the Tropospheric Chemical Reanalysis (TCR) based on the CHASER–LETKF assimilation system (Miyazaki et al., 2017). Since these emission inventories have different spatial resolutions (see details in Table 1) and are available in the form of fluxes (units in kilograms per square meter per second), we upscale or downscale them by simply regridding into 0.1∘ by 0.1∘ cells similar to our approach for satellite data to facilitate comparison. We then consider all cells within the 2∘ by 2∘ area around the city center. For annual emissions, we only take the sum of all cells within the geopolitical boundary of the city (see Fig. 2). All of the cities extend to an area less than the 2∘ by 2∘ that we set as our city domain.
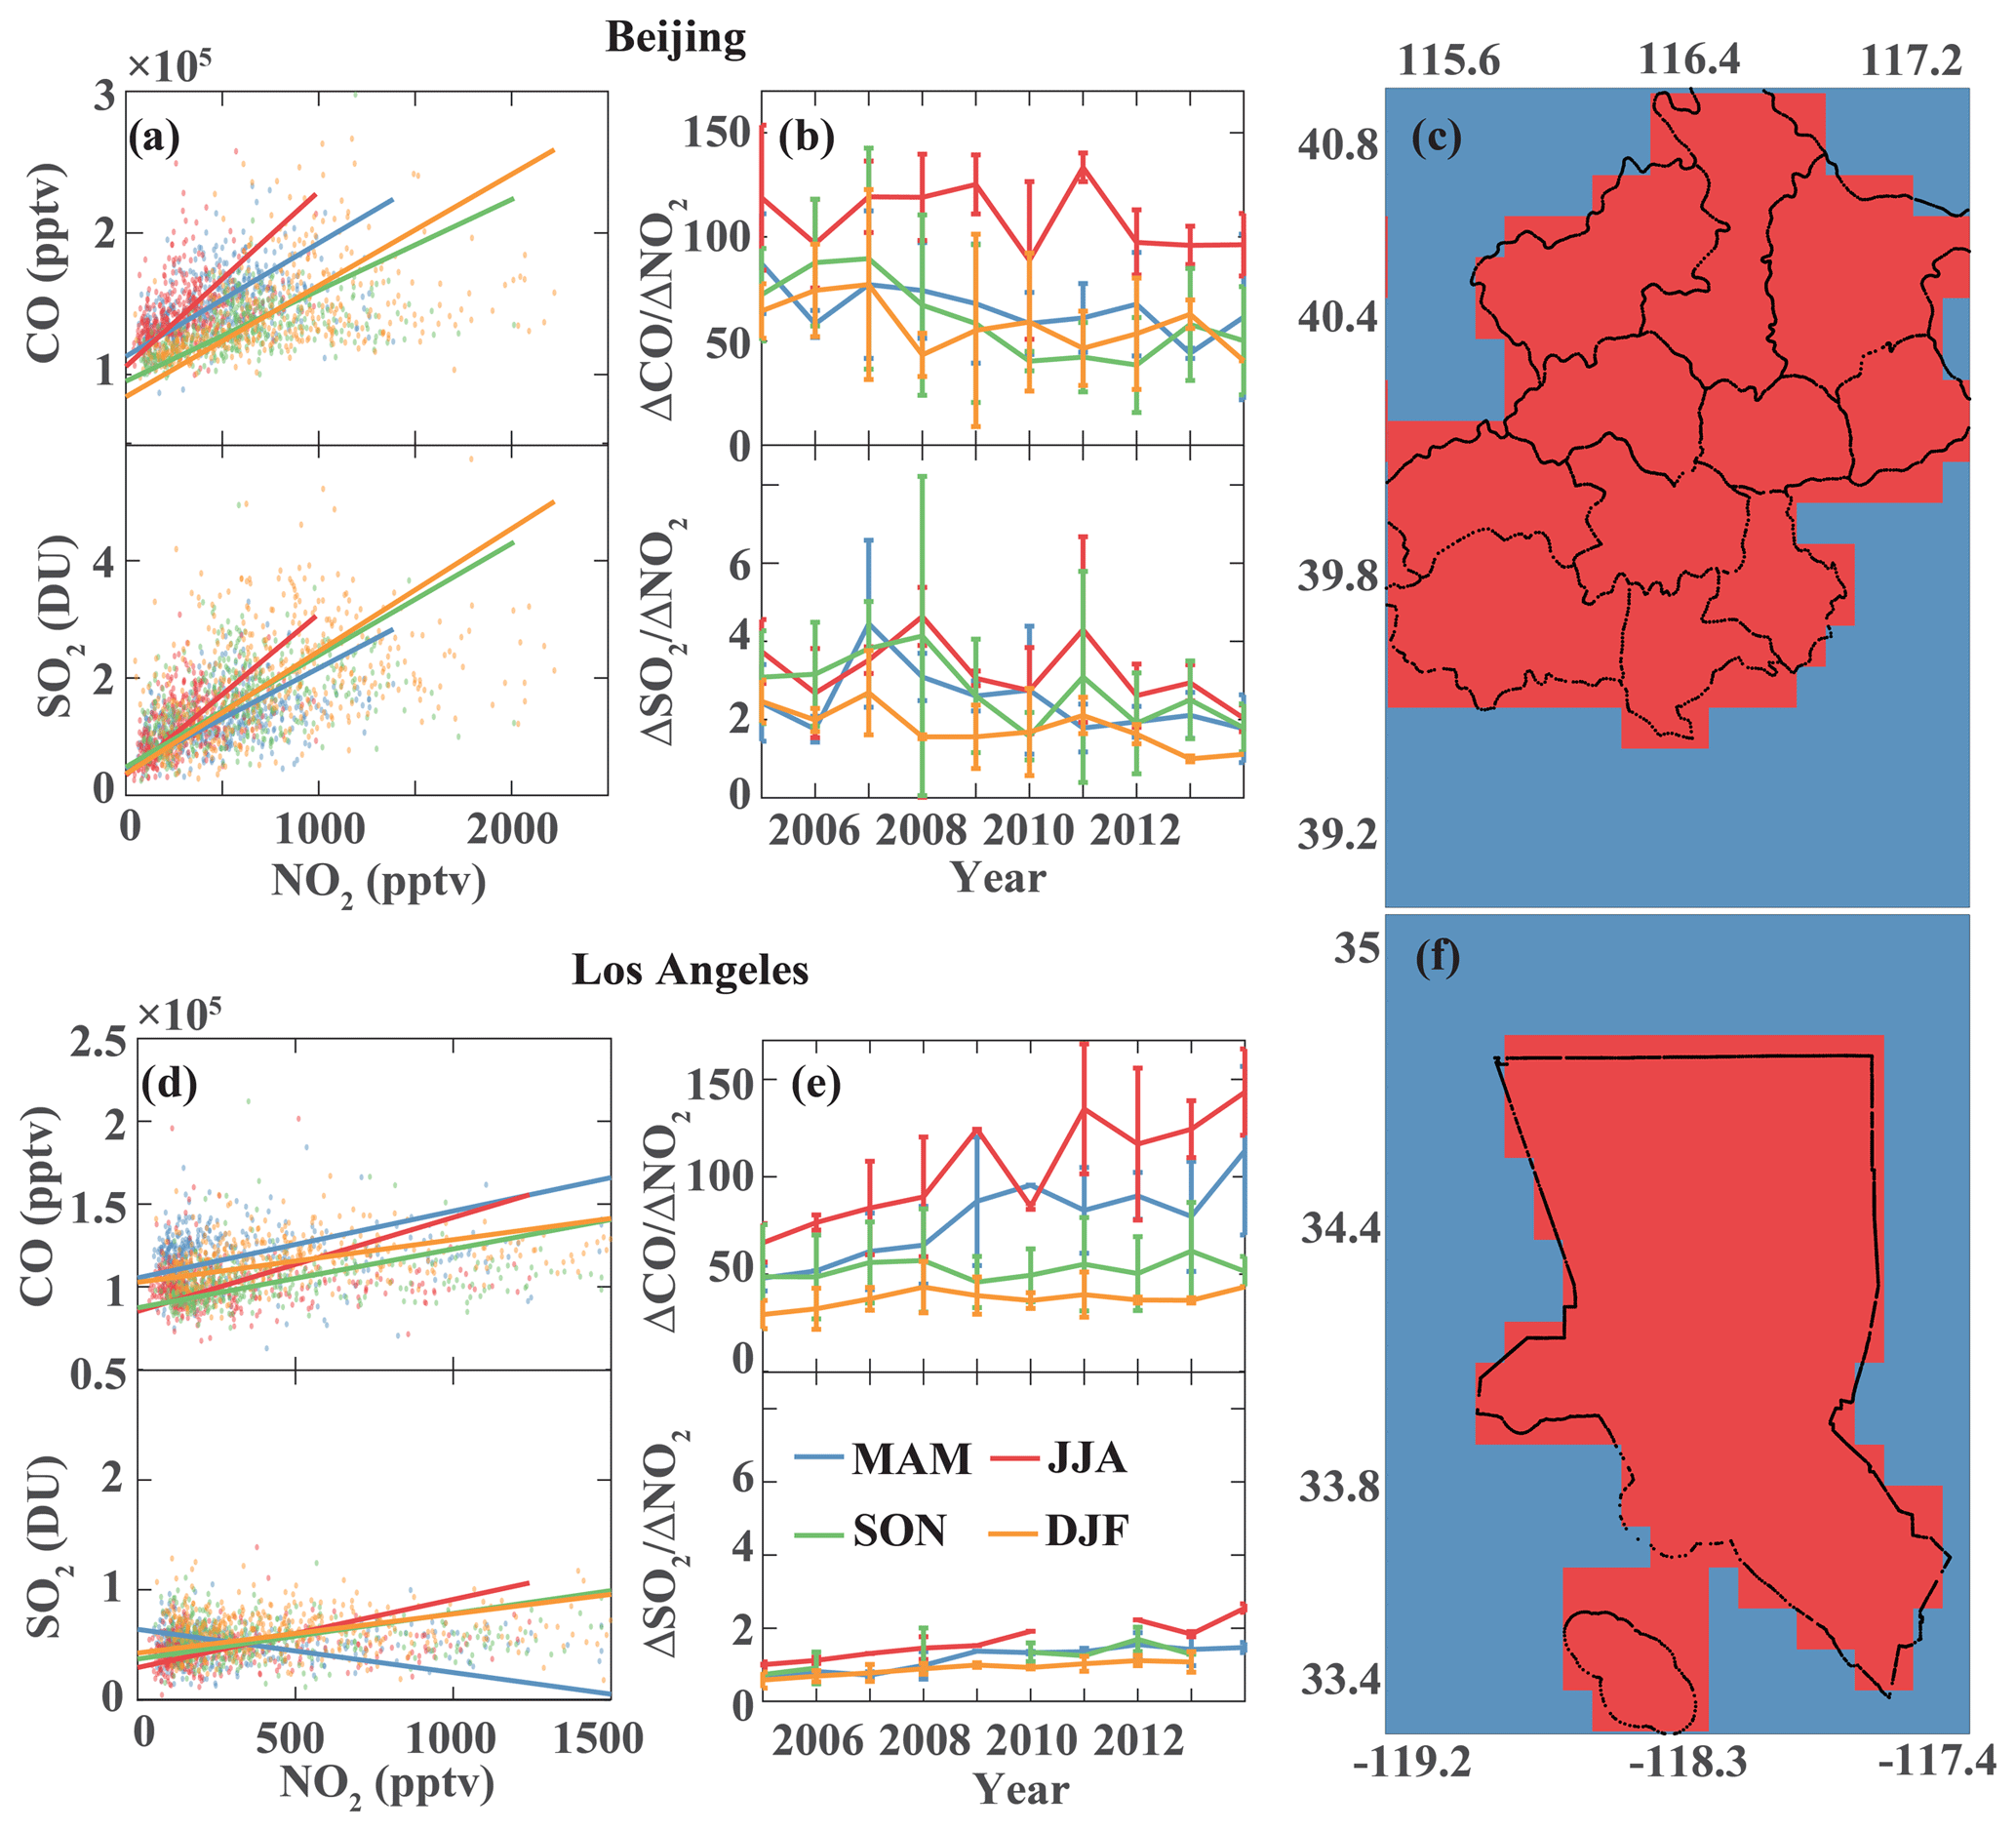
Figure 2Spatial regression analysis of satellite retrievals of CO and SO2 to NO2 by season (blue: March–May, MAM; red: June–August, JJA; green: September–November, SON; orange: December–February, DJF). The left column shows an example of scatter plots and linear regression for Beijing (a, b, c) and Los Angeles (d, e, f). The center column corresponds to the changes across 2005 to 2014 in the ratios calculated for a given season. The rightmost column panels show the city domain () with the geopolitical extent of the city of Beijing and Los Angeles.
We also use model data for CO and NO2 from the Community Atmosphere Model with Chemistry (CAM-chem; Gaubert et al., 2016) and TCR to derive CO and NO2 abundance ratios associated with the bottom-up emissions used in these models (i.e., RCP in CAM-Chem and EDGAR in CHASER). The associated retrieval averaging kernels and prior information are applied to the daily-averaged model CO and NO2 vertical profiles of mixing ratios from CAM-chem and CHASER, along with appropriate spatial interpolation and/or partial column integrations. Since the spatial resolution (about 2–3∘) of CAM-chem and CHASER outputs that we analyze are far coarser than 0.1∘, we only consider the associated abundance ratio rather than deriving enhancement ratio across the months when non-stationarity and nonlinearity issues are more likely to exist.
2.3 Deriving enhancement ratios using spatial regression analysis
For each city, we regress the gridded monthly-average CO and SO2 to NO2 to calculate monthly enhancement ratios (ΔCO∕ΔNO2 and ΔSO2∕ΔNO2). We use NO2 as our control variable as NO2 has the shortest lifetime (hours) among these products. Except for lightning, NOx is mostly produced from high-temperature anthropogenic combustion processes. And because of its short lifetime, it is observed as distinctly and spatiotemporally local surface enhancements, with relatively very low background concentrations. Along with the availability of NO2 retrievals from satellites at fine spatial scales and over long periods, NO2 allows us to effectively identify intra-megacity combustion activities and define the urban extent (Bechle et al., 2011; Lamsal et al., 2013; Hakkarainen et al., 2016). In other words, NO2 is a good proxy for combustion activity. We use a reduced major axis regression (Smith, 2009) to estimate the slopes (Δy∕Δx) representing enhancement ratio across the spatial extent of the megacity and intercept (ybg) for CO and SO2 representing the background levels when there is no combustion (within the megacity and free tropospheric contribution). This follows the approach introduced by Fujita et al. (1992) and Parrish et al. (2002). However, we note that we use the spatial covariations of these species relative to NO2 rather than their temporal covariations as in previous studies. Please see Sect. 3 for implications of this approach. We only consider statistically significant and positive slopes as we are focusing on sources and not sinks of these combustion products. These monthly ratios are then averaged across the year for analysis and archived for time series (decadal) analysis (see Sect. 3). Note that they can be considered to be comparable to emission ratios when observations are taken at or near the source and if they are normalized to account for air mass variations (Fujita et al., 1992; Parrish et al., 2002; Parrish, 2006; Hassler et al., 2016). Here, we normalize all ratios to 2005 values.
It is important to note that we view each large city as a big smokestack that emits an aggregate of combustion products that can then be observed by satellite remote sensing as column-integrated quantities. The spatial (0.1∘) covariation in this aggregate within the 2∘ radius is interpreted as a bulk characteristic of spatially heterogeneous combustion sources within the megacity. Monthly enhancement ratios are hence interpreted as the linear sensitivity in CO or SO2 to intra-megacity spatial variations in combustion activity as defined by NO2. We emphasize that these enhancement ratios are not derived using time covariations but spatial covariations to minimize potential non-stationarities (e.g., differences in lifetimes between species) and influence of free tropospheric signatures in MOPITT CO, which should be reflected as part of a larger-scale contribution to CObg in this analysis given that we anchor the regression on OMI NO2. Possible confounding factors such as biogenic sources of CO in a megacity are also minimized in our analysis by treating CO data only when NO2 is observed since NO2 is not largely co-emitted from CO biogenic sources. Although spatial and temporal smoothing can minimize the effect of lightning (NOx) and fires (NOx and CO) since they are emitted intermittently relative to anthropogenic combustion, our findings must be interpreted to represent changes in bulk combustion cleanness over a megacity rather than specific combustion cleanness.
2.4 Time series analysis and curve fitting
The focus of this work is to study the long-term changes in the spatial covariations of these monthly-averaged ratios of CO and SO2 to NO2, as expressed in terms of enhancement ratios. We hypothesize that at a decadal scale the changes in covariations reflect the dominant changes in megacity emission characteristics. We use two approaches to calculate the decadal trend in our normalized estimates of these ratios. For linear trend analyses, we use robust regression using iteratively reweighted least squares (Holland and Welsch, 1977). This minimizes the influence of outliers relative to a traditional least-squares fit, especially when the relationship is not fully linear. We also use another trend analysis algorithm in our subsequent inverse analysis. Instead of using the annual mean values and estimating the linear trend across 2005–2014, we estimate the associated decadal trends in ΔCO∕ΔNO2 and ΔSO2∕ΔNO2 using the seasonal trend decomposition with LOESS (locally weighted scatterplot smoothing) or seasonal-trend decomposition using LOESS (STL) algorithm (Cleveland et al., 1990). This algorithm separates the seasonal, interannual, and decadal contributions of monthly ratios. We use the smoothing windows for the decadal, interannual, and seasonal trends of 121, 25, and 5 months, respectively, based on analysis of CO decadal trends in Jiang et al. (2018). As in Gaubert et al. (2017), we test several other windows and found consistent temporal patterns across cities. For nonlinear curve fitting, we use robust least-square regressions with the least absolute residuals (LAR) method (within the cftool function in MATLAB) to fit a power-law function to the annual-mean ratios and GDP per capita. This method also minimizes the influence of extreme values on the fit.
2.5 Inverse analysis
We conduct an inverse analysis of the long-term trends in monthly enhancement ratios to further expound our findings by associating the overall changes with sectoral changes. In this case, we are interested in finding the decadal contribution of the time series (2005–2014) of monthly statistically significant enhancement ratios that are derived from our previous regression and time series analysis. We decompose the a priori estimate of the monthly emission ratio of CO to NOx (and SO2 to NOx) from RCP8.5 as a product of (a) ratio of effective emission factors for each of the four sectors (namely energy, industry, transport, and others) and (b) fractional contribution of NO2 emissions from each sector to the total NO2 emissions for all four sectors. We then use a two-step Monte Carlo-based Bayesian inversion method to estimate effective emission factors and fractional contribution of NO2 emissions from each sector. Please refer to Appendix A for a short derivation of this decomposition and Appendix B for details of the inverse analysis.
3.1 Observed patterns of enhancement ratios in Chinese and US cities
In this subsection, we present observed patterns of enhancement ratios in Chinese and US cities. We firstly show spatial regression analysis of satellite retrievals of the ratio of CO and SO2 to NO2 by season (taking Beijing and Los Angeles for demonstration) in Fig. 2. Although naturally produced CO and NO2 like biogenic CO and lightning NOx introduce a strong seasonality in these ratios even within the megacity, we find that when we average the monthly ratios using only the months corresponding to a particular season (i.e., more fires and lightning during the summer), we still find a similar temporal pattern (albeit different in magnitude) in derived ΔCO∕ΔNO2 and ΔSO2∕ΔNO2 (see Fig. 2). This is reasonable as these CO as well as SO2 enhancements are dominantly from combustion-related processes that co-emit NO2 by our study design, pointing to the robustness of analyzing annual-mean ΔCO∕ΔNO2 and ΔSO2∕ΔNO2.

Figure 3Changes in annual-mean enhancement ratios (black) from MOPITT and OMI retrievals of ratios of CO to NO2 (top) and SO2 to NO2 (bottom) for select cities in China and the US relative to 2005. Its associated emission ratios (ECO∕ENOx and ESO2∕ENOx) from RCP8.5 (red) and EDGAR4.2 (blue) and the top-down estimate from CHASER (orange) and model-simulated abundance ratios from CHASER (purple) and CAM-Chem (green) chemistry transport models are superimposed. Gray areas are 90 % confidence intervals of the linear fit (black lines). The four Chinese cities represent the four classes/levels of urban development across 12 selected cities in China.
Shown in Fig. 3 are linear trends of annual-mean ΔCO∕ΔNO2 and ΔSO2∕ΔNO2 relative to 2005 values in four Chinese cities. These cities are representative of a certain level of urban development across mainland China. The four levels in this study are defined using broad clustering between the average GDP per capita per year and the rate of change in ΔCO∕ΔNO2 that is derived from satellite observations. This is shown in Table 2, where a general rule resulting from this analysis would be a classification mainly based on GDP per capita per year, except for Harbin and Wuhan. Combustion-related activities in Shenyang, Beijing, Shanghai, and Shenzhen can be characterized to follow a progression from heavy to light manufacturing, export processing, and service industries (Chan and Yao, 2008). For this analysis, Shenyang, Beijing, Shanghai, and Shenzhen represent the progression across the 12 select cities of increasing GDP per capita along with decreasing to increasing ΔCO∕ΔNO2 ( to % yr−1) and decreasing rate of ΔSO2∕ΔNO2 reductions ( to % yr−1) relative to 2005 (Fig. 3 and Table 2). This pattern in enhancement ratios is not evident in the rate of change in CO, SO2, and NO2 column abundance, for which we find increasing rate of decrease in CO ( to yr−1) and SO2 ( to yr−1) abundance, along with a decreasing rate of increase in NO2 abundance from Shenyang ( % yr−1) to Shenzhen (1.8±0.7 % yr−1) (Table 2). This is consistent with previous studies of these species. In fact, we find a decreasing-to-increasing pattern in the derived enhancements of CO due to combustion (i.e., ), across these four levels of development.
We have minimized the influence of interannual variations due to meteorology (e.g., changes in air mass) by analyzing molar ratios (e.g., moleCO∕moleNO2) rather than absolute molar concentrations (e.g., moleCO∕moleair; Parrish et al., 2002, 2006). As the co-emitted species (i.e., CO, SO2, and NO2) are subject to the same meteorological conditions (affecting transport, dilution, and lifetime), their enhancement ratios are expected to be less sensitive to meteorology compared to the absolute molar concentrations. This is supported by the fact that decadal ΔCO∕ΔNO2 as well as ΔSO2∕ΔNO2 for different seasons have similar trends (Fig. 2). Previous studies have also proven that the ratios compared to the concentrations themselves are relatively immune to changing meteorological conditions, and can provide insights into the magnitude and temporal trends of the emissions (Parrish et al., 2002, 2006, 2009; Silva et al., 2013; Hassler et al., 2016). In addition, they can be directly compared to the corresponding emission ratios under certain circumstances. However, we note that even though the ratios derived from satellite observations are relatively less sensitive to meteorology, the methodology cannot eliminate all the impacts from meteorology. The enhancement ratios may be impacted by the meteorological conditions because lifetimes of different air pollutants may respond to meteorological conditions differently. Nevertheless, we believe such an impact should not influence our main conclusions for the following two reasons. (1) Our analysis focuses on decadal trends instead of short-term trends. As shown by a previous study, meteorology also plays an important role on relatively short timescales, but meteorology probably plays a lesser role in the longer-term trends (Krotkov et al., 2016). (2) The satellite retrieval samples are taken over the megacities (right above strong emission sources) instead of downwind of the pollution sources, making them more representative of megacity sources.
Normalizing these ratios to 2005 values should have also minimized the impact of the differences in the magnitude of these ratios between these cities. The impact of meteorology on inferred decadal trends through variations in columnar abundance is more evident when absolute magnitudes of single species are analyzed. In addition, potential drifts of biases in time (caused by systematic errors in the instrument and/or retrieval algorithm) cannot account for the differences in the temporal pattern that we find across these cities. Such biases should be commonly reflected in all cities, yet we see differences between cities. In fact, we find a very similar progression pattern when we use the Infrared Atmospheric Sounding Interferometer (IASI) CO retrievals (De Wachter et al., 2012) instead of MOPITT or OMI QA4ECV (Boersma et al., 2017) instead of OMI DOMINO. Interestingly, we find that the increasing enhancement ratio of CO to NO2 in Shenzhen (and to a lesser extent in Shanghai) remarkably resembles the relative changes in CO-to-NO2 ratios in more developed megacities (Los Angeles and New York) and several urban agglomerations in the United States (see Fig. 3e for Los Angeles and Table 2 and Fig. S1 in the Supplement for all other select cities). More importantly, the increasing pattern that we see in Los Angeles ( % yr−1) relative to 2005 is generally consistent with the increasing trend (4 % yr−1) after 2007 of a ground-based CO-to-NOx enhancement ratio in Los Angeles as reported by Hassler et al. (2016). It is a common understanding that modernization brings about larger energy use coupled with higher economic productivity but poorer environmental quality (i.e., increasing abundance of pollutants). However, the changes in lifestyle concomitant with human development result in a shift to fewer activities (including increased use of renewable energy), along with more efficient and cleaner combustion and changes in fuel types (coal to natural gas) (Mazur and Rosa, 1974). This eventually leads to increases in relative sensitivities of CO and SO2 to NO2. Similar to previous studies suggesting emissions of CO, SO2, and NO2 and their ratios can be indicators of modernization to some extent (Krotkov et al., 2006; Russell et al., 2012; Luo et al., 2014; Hassler et al., 2016), our finding on this progression in ΔCO∕ΔNO2 serves as satellite-based evidence of a dominant shift in the cleanness of bulk combustion in a more economically developed city within a developing country like China.
Conversely, there is no clear difference in the observed enhancement ratios (ΔSO2∕ΔNO2) and derived enhancements of SO2 due to combustion (ΔSO2comb) between cities. The sensitivity of SO2 to NO2 relative to 2005 in Shenzhen does not follow the increasing pattern in Los Angeles (Fig. 3b). Unlike ΔCOcomb, ΔSO2comb in all four Chinese cities still shows a decreasing trend relative to 2005 while ΔSO2comb in Los Angeles shows an increasing pattern consistent with its ΔCOcomb. There is a striking difference in absolute magnitudes in SO2 abundance between these cities (as has been reported), reflecting large-scale differences in combustion practice. Yet, the low SO2 abundance in Los Angeles also makes it difficult to detect possibly large SO2 point sources (Krotkov et al., 2016). Enhanced SO2 signal can still be detected as the spatial first-order derivatives of SO2 with NO2 at a megacity scale should not be largely (nonlinearly) influenced by its absolute magnitude. We find that there is a tighter correspondence between SO2 and NO2 abundance in Chinese cities than in US cities. This might suggest differences in fuel use as SO2 is mainly produced within a megacity from burning of sulfur-containing fossil fuel (mostly coal, oil, and natural gas) and to a smaller extent from industrial processes (e.g., smelting). Here, we postulate that the absence of an apparent shift in ΔSO2∕ΔNO2 across the four Chinese cities is due to continuing heavier reliance of these cities (and China) on coal burning relative to the United States (Wang and Hao, 2012; Bhattacharya et al., 2015; Qi et al., 2016; Yang et al., 2016; Sun et al., 2018; Zheng et al., 2018). In terms of the sectoral share, the majority of NOx emissions over the Los Angeles basin are from transport according to a recent fuel-based inventory (Hassler et al., 2016), whereas fossil fuel combustion (from power generation and industry) is the most dominant NOx source in China (Sun et al., 2018). In terms of the energy share, it was estimated that coal accounted for about 69 % and 23 % of the total primary energy consumption in China and the US in 2005, respectively. Actions including usage of low-sulfur coals, installation of flue gas desulfurization (FGD) facilities, and closing of small units have been taken to reduce coal-related emissions in China. The aforementioned procedure to reduce SO2 in China is most likely to be the dominant driving factor of the declining ΔSO2∕ΔNO2 (Li et al., 2018; Zheng et al., 2018). While there are ongoing activities regulating coal-related emissions, coal consumption in China has continued to increase in the past decade (Qi et al., 2016; Yang et al., 2016). In terms of mass, it has increased by 70 % from 2005 to 2014 (Korsbakken et al., 2016). Conversely, the use of coal in the US has been found to be slightly decreasing along with previous adoption of SO2 control technologies (Taylor et al., 2005). In addition, previous studies have reported recent reduction in NOx emissions over China since 2011 based on satellite observations and emission inventories (Liu et al., 2016; van der A. et al., 2017). The installation of selective catalytic reduction (SCR) equipment at power plants and new emissions standards for vehicles both contribute to the NOx emission reduction (Liu et al., 2016; van der A. et al., 2017; Wu et al., 2017). Conversely, based on our analysis of decadal trends (2005–2014), only NO2 over Shenzhen decreased overall in the decade, while 10-year average changes in NO2 over Shenyang, Beijing, and Shanghai were overall positive (Table 2). Intra-decadal changes as reported in Liu et al. (2016) (from increasing to decreasing NOx emissions around 2011) do not contradict the derived 10-year trend in this work, especially over Shenyang and Beijing where NOx emissions were still rapidly increasing during the first half of the decade (2005–2011). The changes in SO2 emissions and NO2 emissions together contribute to the trends of ΔSO2∕ΔNO2 that we found. Positive ΔNO2 and negative ΔSO2 produce negative ΔSO2∕ΔNO2 over the three cities; while negative ΔSO2 and negative ΔNO2 (albeit smaller in magnitude) still produce negative ΔSO2∕ΔNO2 but of smaller magnitude over Shenzhen than ΔSO2∕ΔNO2 over the other cities (Table 2). This indicates a stronger influence of the changes in SO2 emissions (as reflected in ΔSO2) in the decreasing trends of these ratios.
3.2 Inconsistencies with a priori estimates
The satellite-based ΔCO∕ΔNO2 patterns are inconsistent with emission- and model-based ratios (Figs. 3 and S1, Table 2). As previously introduced, estimates of the ratios of emissions can be related to observed ratios of enhancements when these observations are taken at or near the source. In this case, we assume that a megacity is a big smokestack emitting mostly combustion-related pollutants (i.e., CO, NO2, and SO2) that can be observed from space with MOPITT and OMI. In addition, NO2 is considered to be the dominant form of NOx that can be observed at this scale. From a global atmospheric chemistry modeling (chemistry transport models, CTMs) perspective, the associated abundance over megacities is represented as one to four discrete vertical column(s) assuming spatial resolution of these CTMs of 1 to 2∘. While recognizing the associated month-to-month variability in ΔCO∕ΔNO2 and expected differences in how these ratios should be compared, the trends in emission ratios relative to 2005 of CO to NOx from bottom-up emission inventories (EDGAR4.2 and RCP8.5) and top-down emission estimates (CHASER; Miyazaki et al., 2017) do not appear to follow the progression (i.e., decreasing to increasing ΔCO∕ΔNO2 relative to 2005 from Shenyang to Shenzhen; Fig. 3). This is also true for the ratios of CO to NO2 abundance from CAM-Chem and CHASER CTMs, which are mostly consistent (except in Los Angeles) with the trends of their associated emission ratios (i.e., CAM-Chem and CHASER emissions are based on the RCP8.5 and EDGARv4.2 inventories, respectively). The a posteriori emission ratios in Beijing from Miyazaki et al. (2017), which uses CHASER–LETKF to assimilate MOPITT CO and OMI NO2 retrievals among other retrievals, also appear to initially follow the emission ratios from EDGAR. Furthermore, the ratios of SO2 to NOx emissions from RCP8.5 follow the trend of ΔSO2∕ΔNO2 in Chinese cities but tend to diverge in Los Angeles, whereas the emission ratios from EDGAR exhibit a lack of trend in China and Los Angeles. A closer look at linear trends of the ratios for each sector in RCP8.5 (Fig. S2) reveals inconsistencies in the trends, which cannot be addressed by simple scaling activity levels in bottom-up inventories (Zheng et al., 2018). All these differences underscore the need to reduce uncertainties in representing time-varying emission activity and emission factors in CTM inputs. There is also a need to quantify errors in model physics and dynamics in transforming emissions to abundance, as well as in data assimilation and inverse methods in integrating observations into models including representativeness of these retrievals. Here we highlight the need to improve not only the accuracy but also the consistency of AQ predictions across pollutants in megacities. Initial results from an improved set of multi-species data assimilation runs using CHASER–LETKF show better agreement with the trends in ΔCO∕ΔNO2 (Miyazaki et al., 2017). Such improvements highlight an under-explored utility of available observational constraints on the changes in emission ratios. We emphasize here that while these differences are expected and have been previously reported, our findings highlight the need to focus on improving model treatments of the dynamic nature of emission factors in these megacities.
3.3 Combustion emission pathway for Chinese cities
We define the combustion emission pathway as a trajectory in time of the overall changes in emissions due to combustion with respect to socioeconomic development (e.g., Riahi et al., 2011; Steinberger et al., 2012; Li et al., 2016; Marangoni et al., 2017). In this section, we identify a common combustion emission pathway across these four levels of development and associate them with sectoral changes through inverse analysis. We will briefly describe the inverse analysis of the ratios in Sect. 3.3.1, present our findings on combustion emission pathway in Sect. 3.3.2, and elucidate the driving factors by means of time traces in sectoral emission ratios in Sect. 3.3.3.
3.3.1 Inverse analysis of the ratios
We conduct an inverse analysis of the ratios shown in Fig. 3 to further expound on these patterns, by associating them with sectoral changes. Please see details of the matrix–vector product and inversion methodology in Sect. 2.5 and Appendix B. The result of this inversion is a set of a posteriori time series estimates of sectoral CO-to-NOx and SO2-to-NOx ratios, such that the corresponding time series estimates of the total CO-to-NOx and SO2-to-NOx ratios match the decadal trends of ΔCO∕ΔNO2 and ΔSO2∕ΔNO2 inferred from these satellite retrievals. Again, we note that we use the STL-inferred decadal trend as the data to fit (not the monthly-mean ratios or the linear trend in Fig. 3), as these are the most appropriate data for analyzing long-term changes in emission sectors.
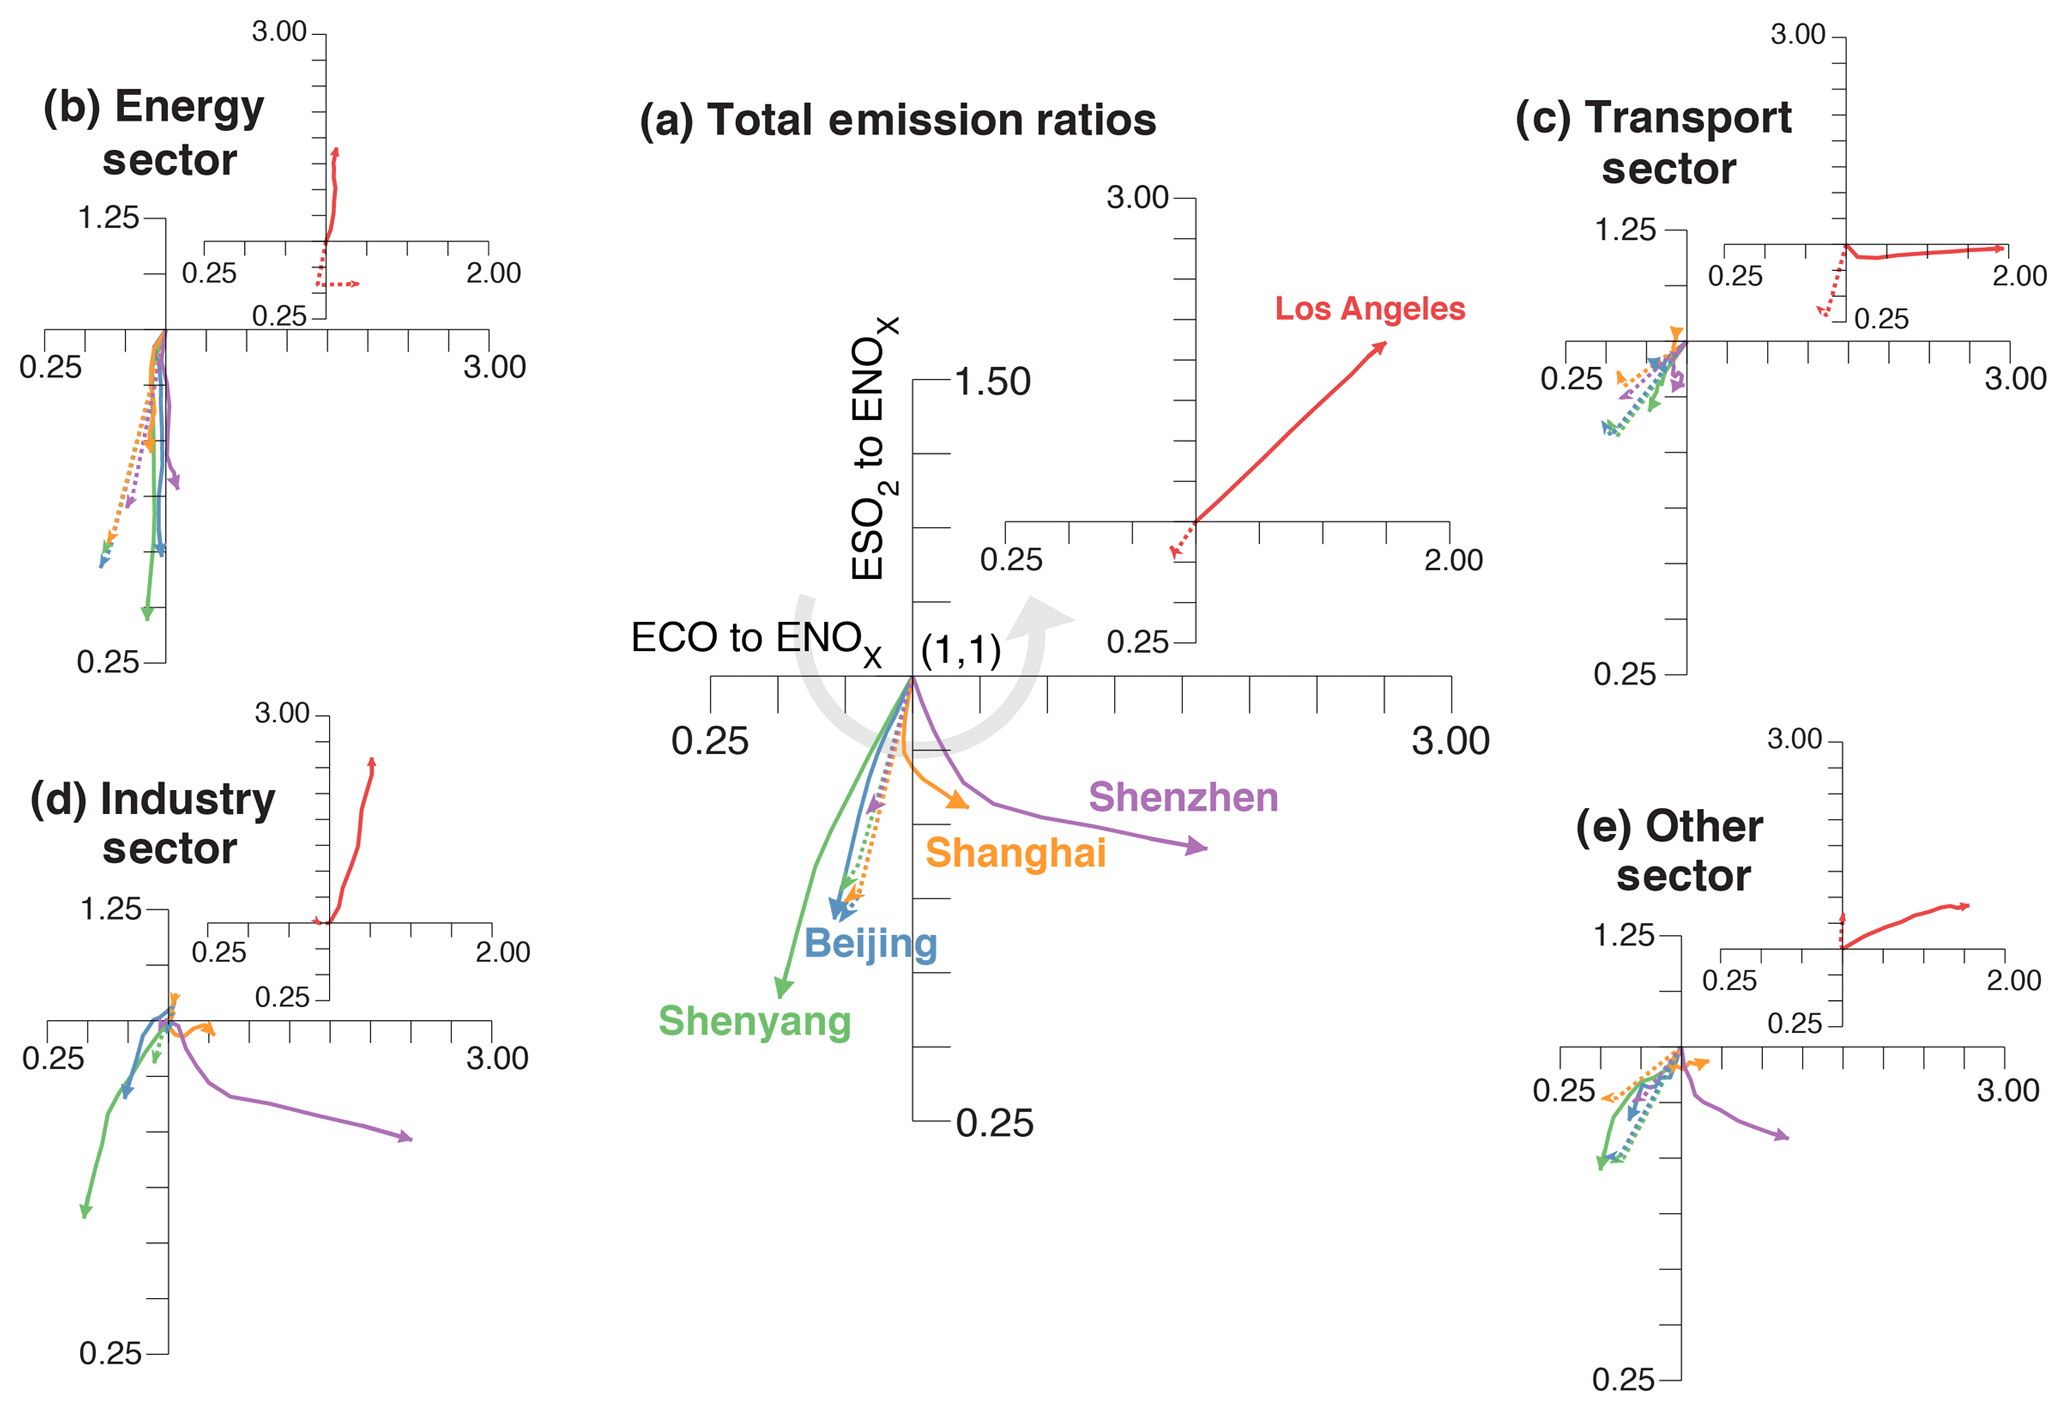
Figure 4Joint traces of the annual changes in a priori (dotted line) and a posteriori (solid line) estimates of ECO∕ENOx (x axis) and ESO2∕ENOx (y axis) relative to 2005 for the four selected Chinese cities (Shenyang: green; Beijing: blue; Shanghai: orange; Shenzhen: purple) representing four levels of urban development. These traces are presented as line arrows (with the origin at x=1, y=1 and endpoint corresponding to the years 2005 and 2014, respectively) for total emission ratios (a) and four sectoral ratios (b–e). The other sector is the sum of mostly residential and commercial areas along with agriculture and waste treatment and disposal. The inset for each panel represents the associated traces for Los Angeles, which is added as basis for comparison. In each panel, the different quadrants (lower left, lower right, and upper right) correspond to decreasing ECO∕ENOx and ESO2∕ENOx, increasing ECO∕ENOx but decreasing ESO2∕ENOx, and increasing ECO∕ENOx and ESO2∕ENOx relative to 2005, respectively. The gray semicircular arrow in panel (a) represents our suggested common combustion emission pathway for Chinese cities.
3.3.2 Combustion emission pathway
The results of our inverse analysis are presented in Fig. 4. This figure consists of five 2-D line plots of a posteriori (solid) and a priori (dashed) time series of SO2-to-NOx emission ratios (ESO2∕ENOx) on the y axis versus corresponding values of CO-to-NOx emission ratios (ECO2∕ENOx) on the x axis. The five plots correspond to the annual total (Fig. 4a) and sectoral emission ratios (Fig. 4b to e) of each of the four cities selected in Fig. 3. The time series, which is normalized to 2005 values, starts at the origin (1.1) and ends at the arrow tip of the line. Each 2-D plot also contains an inset showing the corresponding emission trajectory for Los Angeles. Figure 4a is similar to Fig. 3 but plotted jointly and with the a posteriori time series of emission ratios now corresponding to the time series of enhancement ratios (i.e., STL-inferred decadal trend). We find that the progression in combustion characteristics across these four cities is clearly evident from this diagram and very consistent with the linear trends in Fig. 3. In Shenyang, both ESO2∕ENOx and ECO2∕ENOx are decreasing relative to 2005 at a faster rate (as represented by the length of the line) than in Beijing. Conversely, we see a clear shift in Shanghai and most notably in Shenzhen to a slightly decreasing ESO2∕ENOx and increasing ECO2∕ENOx, leading their emission trajectories toward a different state of combustion cleanness. The combustion emission ratios in Los Angeles (and other cities in US) are, however, different than in Shanghai and Shenzhen. In particular, we find ESO2∕ENOx and ECO2∕ENOx in Los Angeles to be both linearly increasing relative to 2005 values. And so, there is a progression of decreasing to increasing sensitivities of CO and SO2 to NO2 from Shenyang to Shenzhen to Los Angeles (gray semicircular trace in Fig. 4a) relative to 2005 that appears to be related to socioeconomic development consistent with the current understanding of human development pathways (Lamb et al., 2014). In this case, it may be a consequence of air quality management practice and improved efficiency in China (Sun et al., 2018; van der A et al., 2017) and the US (Hassler et al., 2016; Russell et al., 2012). Altogether, this leads us to suggest a common combustion emission pathway for the megacities in mainland China, that begins with a reduction in SO2, followed by CO, and continues with a reduction in NOx and potentially in volatile organic compounds (VOCs) later on. To illustrate, we still see increases in NOx abundance in Shenyang although CO and SO2 are already decreasing, whereas in Shenzhen, we see NOx starting to decrease (at a faster rate) along with decreasing CO and SO2 abundance. The rate at which SO2, CO, and NO2 are decreasing is not at a level that is observed in Los Angeles. And so, while the satellite data reveal a combustion emission pathway in these Chinese megacities, these cities have yet to reach conditions that are at par with megacities in more developed cities in the US and Europe. It is worth noting that the a priori estimates from RCP8.5 do not follow this pathway, even for Los Angeles, suggesting inconsistencies and necessary updates on temporal changes in emission factors, effectiveness in pollution control technologies, and/or more information on fuel use mixtures in this emission inventory. It also appears that the pathway represented in RCP is similar to all cities and resembles the emission pathway for Beijing more.
3.3.3 Traces in sectoral emission ratios
Furthermore, the traces in sectoral emission ratios from RCP8.5 all point to decreasing ratios relative to 2005 and are primarily driven by the energy (transportation) sector, which constitutes more than one-third of NOx emissions in Chinese (US) cities (Fig. 4b to e). Our inversion results in slight adjustments in the Chinese energy emission pathway towards little to no changes in CO-to-NOx emission ratios (Fig. 4b). Adjustments from the transportation sector are also small in terms of direction and slower in terms of its rate of change relative to 2005 RCP values (Fig. 4c). This is certainly not the case in Los Angeles where CO-to-NOx and SO2-to-NOx ratios follow quite the opposite pathway of increasing ratios from the energy sector and increasing CO to NOx, with no change in SO2 to NOx from the transportation sector. This is expected in the United States because of cleaner fuel standards (Shindell et al., 2011; Zhang et al., 2012; Kheirbek et al., 2014; Yang et al., 2016; Paulot et al., 2017). Significant shifts on these ratios relative to 2005 are clearly evident from the industry and other (i.e., agriculture, residential, and waste) sectors in the cities in China (Fig. 4d and e). Shanghai and most notably Shenzhen show a shift to increasing CO-to-NOx ratio with a slightly decreasing SO2-to-NOx ratio that is not reflected in RCP8.5. The emission ratios from industry and other (mostly residential) sectors need to be adjusted significantly in our inversion to match the shifts in observed ΔCO∕ΔNO2 and ΔSO2∕ΔNO2 in these two cities. As mentioned earlier, tertiary (service) industries including export processing activities are more dominant in Shanghai and Shenzhen than in Shenyang. The shift in recent years to an increasing CO-to-NOx ratio reflects a larger rate of decrease in NOx levels than CO from the industrial and residential sectors of these cities. While a more detailed investigation is warranted to narrowly identify the activities and/or policies driving this shift (van der A et al., 2017), it is clear that changes in combustion activity alone cannot account for these shifts and that updates on emission factors for these sectors in RCP8.5 are needed. We find that these findings are robust across a suite of error assumptions in the inverse analysis. This update applies all the more to all sectors in RCP emissions for Los Angeles. Again, this is well-supported by studies like Hassler et al. (2016), where they reported an increasing CO-to-NOx enhancement ratio after 2007 in Los Angeles along with a 45 % decline of NOx emissions based on their fuel-based inventory. This is in contrast to decreasing RCP8.5-based MACCity emission ratios that they also reported for Los Angeles. This increase in enhancement ratios (similar to this work) is attributed to a combination of factors such as the decrease in NOx from freight traffic activity during the US recession and implementation of new NOx emission control technologies and regulations to meet Tier 2 emission standards on US light-duty vehicles. They also noted that differences in the trends of ΔCO∕ΔNO2 are still observed even between cities from developed countries like the US and Europe, as these cities differ in terms of transportation practices and lifestyles (e.g., increase in light-duty diesel vehicles). It is also now conceivable that ΔCO∕ΔNO2 can be further influenced by shifts in relative importance of emission sectors (e.g., VOCs in petrochemical and pharmaceutical industries) as activity decreases with efficiency, pollution is controlled, and lifestyle changes whenever cities evolve (McDonald et al., 2018). A recent study (Jiang et al., 2018) revealing an overestimation in the decrease in U.S. EPA NOx emissions based on OMI NO2 and MOPITT CO retrievals with U.S. EPA ground station measurements of NO2 also suggests potential changes in “bulk” combustion characteristics in urban regions of the United States. Along with these studies, our results suggest that regional to global emission inventories, which are used as input to predictive models of atmospheric composition, have to reflect (a) the evolution of air pollution for a given city (sectoral shifts) and (b) the differences in combustion practices from city to city in order to capture these observed magnitudes and variations in enhancement ratios.
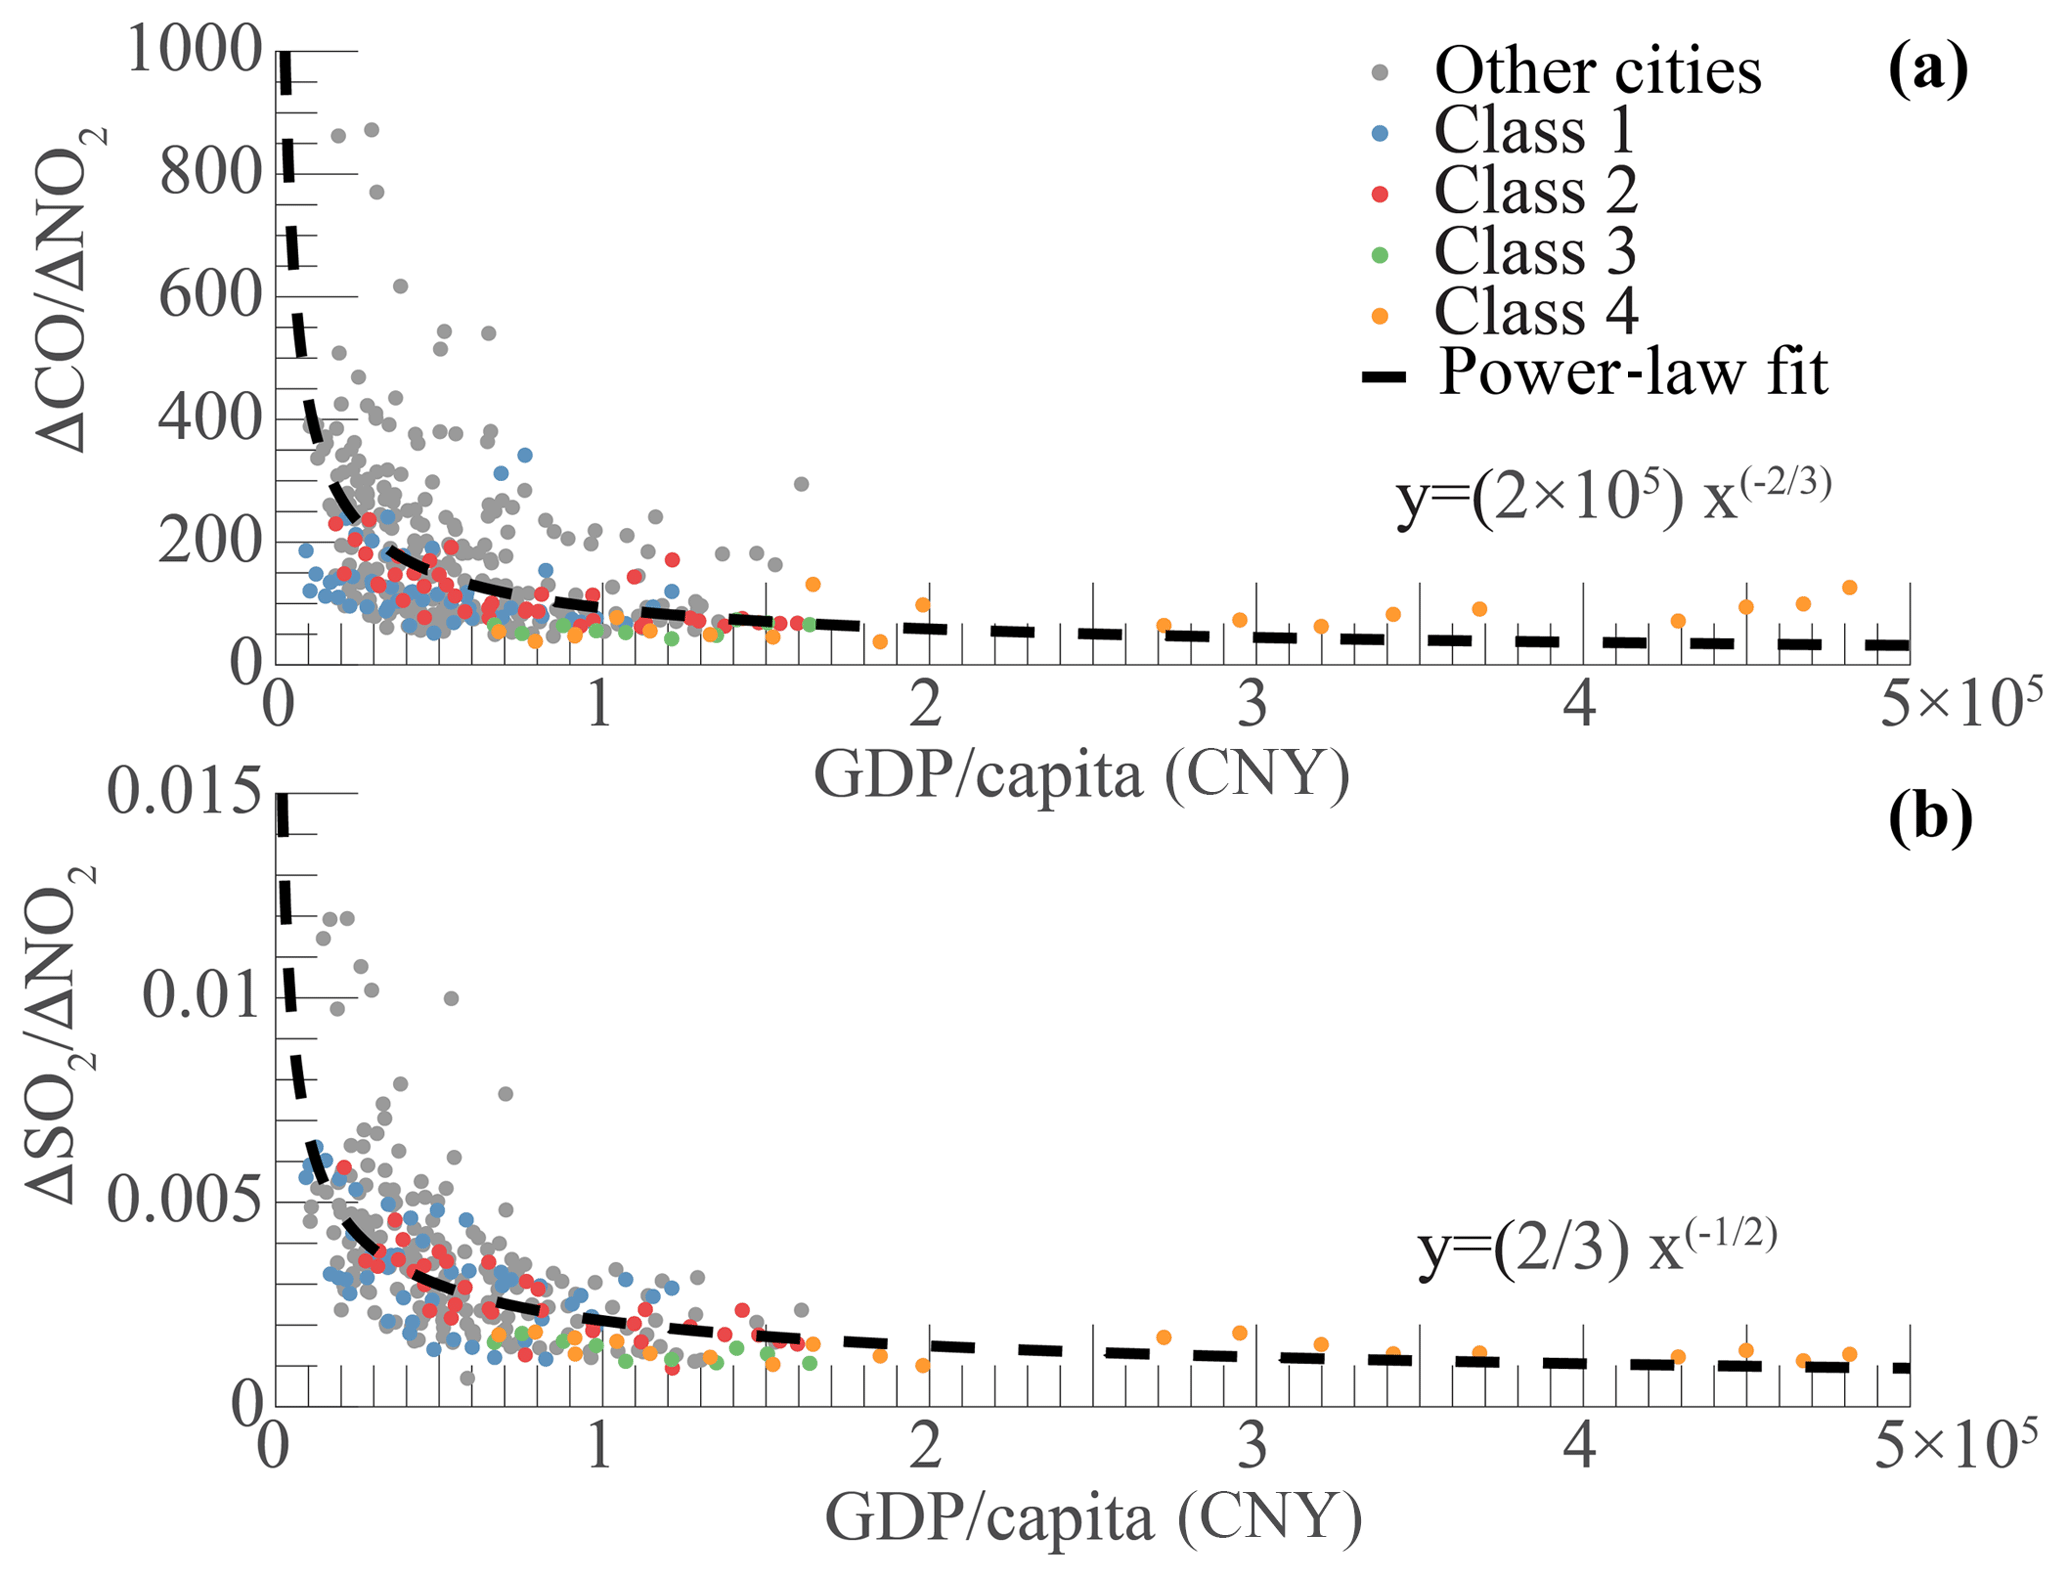
Figure 5Annual-mean enhancement ratios (in units of moles per mole) of CO to NO2 (a) and SO2 to NO2 (b) for all 36 provincial capitals and cities (2005 to 2014) as a function of its corresponding annual GDP per capita (in units of CNY per capita per year). The 12 select cities analyzed in this study are plotted in color, where each color represents four increasing levels or classes of urban development (e.g., Shenyang: Class 1; Beijing: Class 2; Shanghai: Class 3; Shenzhen: Class 4). The rest of the 36 cities are plotted in gray. Superimposed on panels (a) and (b) is a fitted curve (black dashed line) based on the power-law relationship of the data, which is indicated in the plot by its corresponding equation.

Figure 6Weekly (a) and seasonal (b) cycle of the satellite-based enhancement ratios averaged for the 12 cities in China (red) and for eight cities in the US (blue). The error bars stand for standard deviation across cities.
3.4 Socioeconomic dependence of urban enhancement ratios in China
Here, we attempt to connect these emission pathways to the larger pattern of economic growth across the 31 capital cities and five special cities in mainland China. We find in particular a power-law relationship between the observed annual-mean ΔCO∕ΔNO2 (and ΔSO2∕ΔNO2) and GDP per capita. This is not to derive an overall EKC for China, as this in fact requires a very long record of environmental quality, but specifically to investigate how economic development shapes how clean the bulk combustion in Chinese cities would be. These enhancement ratios complement abundance and/or emissions of pollutants as traditional measures of air pollution. Unlike Figs. 3 and 4, our focus is to illustrate the larger dependence of enhancement ratios on GDP per capita. As discussed in the Methods section, we relate the enhancement ratio of a megacity to the ratio of the product of emission factor (EFspecies) and effectiveness of control technology (1−CEspecies) for CO and NOx species in the case of ΔCO∕ΔNO2 for example. We use a robust least-squares regression with a least absolute residuals method to fit a curve of the form y=axk, where y is ΔCO∕ΔNO2 or ΔSO2∕ΔNO2 and x is GDP per capita. Our results are presented in Fig. 5a and b for ΔCO∕ΔNO2 and ΔSO2∕ΔNO2, respectively. The 12 cities considered in our analysis of emission pathways are marked with colors corresponding to its level of urban development described in the previous section. Note that the magnitudes of enhancement ratios derived from this work are a factor of 10 higher than ratios derived from ground-based networks. We attribute this discrepancy to differences in air mass and volume, representativeness, and vertical sensitivity between abundance retrieved as total or tropospheric columns and in situ and point samples in units of mixing ratios. Nevertheless, we find a strong power-law relationship with GDP per capita having k coefficients (R2=0.98) of negative two-thirds and negative one-half for ΔCO∕ΔNO2 and ΔSO2∕ΔNO2, respectively. Likely, the coefficients in ΔSO2∕ΔNO2 will converge to that in ΔCO∕ΔNO2 as changes in fuel type and SO2 controls should decrease SO2 abundance. While each city is unique and the evolution of air pollution may be different from city to city, there is also a clear signature of urbanization at the national level that reflects the influence of economic growth on the cleanness of bulk combustion. Similar power-law relationships (albeit different coefficients) have been reported in studies of urban growth and development (Bechle et al., 2011; Lamsal et al., 2013; Bettencourt, 2013), energy flows (Creutzig et al., 2015), and carbon emissions (Fragkias et al., 2013). Our results suggest that enhancement ratios scale with GDP per capita, with lower GDP per capita like Shenyang and other cities (gray dots) having higher enhancement ratios, while Shenzhen and other cities (yellow dots) with the highest GDP per capita in China are among the cities with the lowest enhancement ratios. As we have shown in Fig. 4 (and Table 2), the ratios in Shenzhen tend to increase with time (and GDP) but this increase has its limits and appears to be dwarfed by cities with the highest enhancement ratios. We note, however, that identifying a mechanistic rationale of these negative scaling coefficients is beyond the scope of this work and hence is not proposed. A unified relationship cannot also be established across countries as there are obvious differences in socioeconomic and air pollution conditions in China and the US that cannot be accounted for (Fig. 6). Nevertheless, we suggest incorporating this observation along with estimates of emissions into future scaling studies, especially as we move past RCPs and toward recent developments in building more realistic emission scenarios that integrate socioeconomic and environmental development pathways like the Shared Socioeconomic Pathways (SSPs; O'Neil et al., 2014).
The main goal of this work is to provide observational evidence from Earth-observing satellites of emission pathways of combustion-related air pollutants, as a result of urban growth in economically developing countries like China. A new observational perspective on monitoring one of the major consequences of urbanization is introduced, not to replace existing observing capabilities but to further exploit the information that is already available. Following the pioneering work by Parrish et al. (2002), the sensitivities of intermediate products of combustion can be derived from existing satellite retrievals of air quality (AQ) to inform changes in bulk combustion characteristics (and consequently emissions) of a megacity. This is especially relevant as the number of megacities continues to grow in the coming decades, mostly at locations that lack sufficient AQ monitoring capabilities. Enhancement ratios of CO to NO2 and SO2 to NO2 over megacities in mainland China that are derived from MOPITT and OMI satellite instruments show a coherent long-term progression in recent years of decreasing to increasing ratios relative to 2005. This is well-correlated with economic development. These trace a common emission pathway that resembles the evolution of air pollution in more developed cities in the United States, which is characterized by transitions in energy use and subsequent implementation of pollution control and regulation. Although we find cleaner combustion as cities in China develop consistent with their Five Year Plans, this is presently obfuscated by increasing fuel use, particularly its heavy reliance on coal. We propose the use of these enhancement ratios derived from existing satellite retrievals to complement existing surface AQ networks, including carbon-related satellite observing systems, in further constraining combustion efficiency and effectiveness of control technologies and policies. Augmenting existing capabilities (Saeki and Patra, 2017) is particularly relevant, especially with the aid of big data informatics and machine learning as well as the advent of activities focusing specifically on tracking fossil fuel emissions (like the CO2 Human Emissions project; https://www.che-project.eu, last access: 22 March 2019). While we recognize the current limitations of these retrievals (e.g., collocation, sensitivity), our findings appear to be robust across retrievals and methods and are supported by previous studies using these retrievals in a different way (Krotkov et al., 2016; Jiang et al., 2018) or ground measurements (Hassler et al., 2016). We strongly suggest that the capability to monitor relatively long-term changes in atmospheric composition has to be supported and continued with complementary new satellite and field missions and deployments (Streets et al., 2013; National Academies of Sciences, Engineering, and Medicine, 2016).
The relative importance of monitoring combustion efficiency and effectiveness of pollution control increases as a city and country continue to socioeconomically develop and become sustainable. Despite past and present studies (Mazur and Rosa, 1974; Lamb et al., 2014), it is only in the most recent years that we have developed comprehensive and integrated monitoring and prediction systems, which paved new measures of air pollution and new developments in emission scenarios like SSPs. For China, more detailed information on energy use and improved emission inventories is increasingly becoming available for assessment (Li et al., 2017; Zhong et al., 2017). As we also recognize some of the challenges to quantify socioeconomic variables such as the impact of international trade on air pollution (Lin et al., 2014), economic structural upgrading (Mi et al., 2017), greater utilization of renewable energy, and even metrics of performance (Ramaswami et al., 2013), from a physical science perspective, our results strongly support these new developments. We find inconsistencies between the long-term spatiotemporal patterns of emission ratios from RCP8.5 and model predictions of abundance ratios and the corresponding patterns derived from observed enhancement ratios. Scientific improvements in representing the evolution of air pollution (Lewis, 2018) and emission pathways (Mitchell et al., 2018) can be made by (1) considering observationally constrained time-varying emission factors and (2) confronting emissions and physical models with available data not only for their accuracy, but also for their consistency in representing both carbon and AQ-related combustion products.
The raw data used in this study are available online (links to satellite data and emission inventories can be found in Table 1. Annual GDP and population are directly taken from the China Statistical Yearbook compiled by the National Bureau of Statistics of China (http://www.stats.gov.cn/english/Statisticaldata/AnnualData/, National Bureau of Statistics of China, 2018)). Model outputs and reanalysis data are available from the authors upon request.
In a combustion process using a hydrocarbon fuel, CO and elemental carbon (e.g., soot or BC) are produced when combustion is incomplete; otherwise carbon in the fuel is oxidized to CO2 (Eq. 1). In addition, NO and NO2 are produced from the oxidation of nitrogen from the fuel itself and from decomposition of N2 in air at high temperatures (Flagan and Seinfeld, 2012). Sulfur dioxide (SO2) is also produced when the fuel used in the combustion process contains sulfur (such is the case for low-grade fuels).
Emissions of these intermediate products are typically expressed as
where Ex is the total mass of emissions for species x, EFx,s is its associated emission factor for a specific source/sector s, and As is the activity level of the source. CEx,s corresponds to effectiveness of control measure and is the effective emission factor. When we take the ratio of emissions (Eq. 2) of co-emitted species x and y,
this ratio can be expressed as the sum of the products of the ratio of effective emission factors () and the fractional contribution of emission sector f for species x (fx,s) (Eq. A3).
We decomposed the a priori estimate of monthly emission ratio of CO to NOx (and SO2 to NOx) from RCP8.5 as a product of (a) the ratio of effective emission factors for each of the four sectors, namely energy, industry, transport, and others (), and (b) fractional contribution of NO2 emissions from each sector to the total NO2 emissions (fx,s) for all four sectors s (s1: energy; s2: industry; s3: transport; s4: others). In matrix–vector form, this can be expressed as
or
We use a two-step Monte Carlo-based Bayesian inversion method to estimate both H and x of the following cities: Shenyang, Beijing, Shanghai, Shenzhen, and Los Angeles. We focus our analysis on the decadal trends of the RCP8.5 CO-to-NOx and SO2-to-NOx emission ratios using the decadal trends of ΔCO∕ΔNO2 and ΔSO2∕ΔNO2 as observational data (y). We use the decadal trend of enhancement ratios of CO to NO2 and SO2 to NO2 (derived using STL), calculate their annual averages normalized to 2005 values, and then take these as our observational (fitting) data. Our goal is to estimate H and x given y subject to the following constraints: (a) errors in H and x are 10 % and 25 % of their values, (b) errors in y are 5 % of its value, (c) error covariances of y and x are uncorrelated and diagonal (Se, Sa), and (d) the sum of x is unity. Since this is an under-determined inverse problem, we apply prior information on H and x using the RCP emissions (Ha, xa). We conduct our inverse analysis in two steps: (1) estimate the most likely H that results in estimates of x best fitting the decadal trend, (2) estimate x using the new estimate of H. For Step 1, first, we draw n=10 000 samples of H assuming its errors are normally distributed, with mean as its prior and covariance as the diagonal of its squared errors. Second, we use the maximum a posteriori (MAP) solution to the Bayesian problem to estimate x for every sample, i.e.,
We draw a new sample if any of the elements in are negative. Third, we take the mean of 100 H samples resulting in the lowest root-mean-square errors relative to the data. We use this mean as our new estimate of H (). For Step 2, we apply the same MAP solution using xa and to estimate and . Similar to a Kalman filter, we cycle this procedure for each year starting from 2006 to 2014. We use the new estimates of , , and for a given year as priors for the succeeding cycle with fixed inflation on the covariance of 1.25 to minimize filter divergence. We note that the additional constraints (positive , sum of is unity) minimize the indeterminacy of the problem. This is supported by post-inverse analysis diagnostics (i.e., averaging kernels) showing that elements of are resolved by the trend data. Since H is drawn based on Monte Carlo sampling, we do not have a diagnostic for the relative contributions of the prior and the data to H. We chose the mean across 100 H values resulting in estimates of with the lowest RMSEs relative to the data. The changes in relative to Ha can be explored in the sectoral changes shown in Fig. 4. This is especially the case for Shanghai and Shenzhen where the change in H is larger than the change in x.
The supplement related to this article is available online at: https://doi.org/10.5194/acp-19-4269-2019-supplement.
WT and AFA contributed equally to this work. The initial idea was provided by AFA and WT. CHASER–LETKF experiments were performed and provided by KM. CAM-chem modeling experiments were performed and provided by BG. Data analyses and result interpretation were performed by WT and AFA. HW provided key expert guidance on MOPITT CO. The paper was written by AFA and WT.
The authors declare that they have no conflict of interest.
This study is supported by NASA ACMAP grant NNX17AG39G. Kazuyuki Miyazaki's reanalysis is supported by JSPS KAKENHI grants 15K05296 and 18H01285. We acknowledge MOPITT, IASI, and OMI retrieval teams for CO, NO2, and SO2 data, respectively. We also thank the EDGAR, HTAP, REAS, and RCP data teams for the emission inventories. All the satellite data and emission inventories are available to the public online. We thank Kevin Bowman, Cenlin He, and Sam Silva for insightful discussions.
This paper was edited by Ilse Aben and reviewed by two anonymous referees.
Baklanov, A., Molina, L. T., and Gauss, M.: Megacities, air quality and climate, Atmos. Environ., 126, 235–249, 2016.
Bechle, M. J., Millet, D. B., and Marshall, J. D.: Effects of income and urban form on urban NO2: Global evidence from satellites, Environ. Sci. Technol., 45, 4914–4919, 2011.
Bettencourt, L. M.: The origins of scaling in cities, Science, 340, 1438–1441, 2013.
Bhattacharya, M., Rafiq, S., and Bhattacharya, S.: The role of technology on the dynamics of coal consumption–economic growth: New evidence from China, Appl. Energ., 154, 686–695, 2015.
Boersma, K. F., Eskes, H. J., Dirksen, R. J., van der A, R. J., Veefkind, J. P., Stammes, P., Huijnen, V., Kleipool, Q. L., Sneep, M., Claas, J., Leitão, J., Richter, A., Zhou, Y., and Brunner, D.: An improved tropospheric NO2 column retrieval algorithm for the Ozone Monitoring Instrument, Atmos. Meas. Tech., 4, 1905–1928, https://doi.org/10.5194/amt-4-1905-2011, 2011.
Boersma, K. F., Eskes, H., Richter, A., De Smedt, I., Lorente, A., Beirle, S., Van Geffen, J., Peters, E., Van Roozendael, M., and Wagner, T.: QA4ECV NO2 tropospheric and stratospheric vertical column data from OMI (Version 1.1) (data set), Royal Netherlands Meteorological Institute (KNMI), 2017.
Chan, C. K. and Yao, X.: Air pollution in mega cities in China, Atmos. Environ., 42, 1–42, 2008.
Cleveland, R. B., Cleveland, W. S., McRae, J. E., and Terpenning, I.: STL: A seasonal-trend decomposition, J. Off. Stat., 6, 3–73, 1990.
Creutzig, F., Baiocchi, G., Bierkandt, R., Pichler, P. P., and Seto, K. C.: Global typology of urban energy use and potentials for an urbanization mitigation wedge, P. Natl. Acad. Sci. USA, 112, 6283–6288, 2015.
Crippa, M., Janssens-Maenhout, G., Dentener, F., Guizzardi, D., Sindelarova, K., Muntean, M., Van Dingenen, R., and Granier, C.: Forty years of improvements in European air quality: regional policy-industry interactions with global impacts, Atmos. Chem. Phys., 16, 3825–3841, https://doi.org/10.5194/acp-16-3825-2016, 2016.
Deeter, M. N., Martínez-Alonso, S., Edwards, D. P., Emmons, L. K., Gille, J. C., Worden, H. M., Sweeney, C., Pittman, J. V., Daube, B. C., and Wofsy, S. C.: The MOPITT Version 6 product: algorithm enhancements and validation, Atmos. Meas. Tech., 7, 3623–3632, https://doi.org/10.5194/amt-7-3623-2014, 2014.
De Wachter, E., Barret, B., Le Flochmoën, E., Pavelin, E., Matricardi, M., Clerbaux, C., Hadji-Lazaro, J., George, M., Hurtmans, D., Coheur, P.-F., Nedelec, P., and Cammas, J. P.: Retrieval of MetOp-A/IASI CO profiles and validation with MOZAIC data, Atmos. Meas. Tech., 5, 2843–2857, https://doi.org/10.5194/amt-5-2843-2012, 2012.
Ding, J., van der A, R. J., Mijling, B., and Levelt, P. F.: Space-based NOx emission estimates over remote regions improved in DECSO, Atmos. Meas. Tech., 10, 925–938, https://doi.org/10.5194/amt-10-925-2017, 2017.
Duncan, B. N., Prados, A. I., Lamsal, L. N., Liu, Y., Streets, D. G., Gupta, P., Hilsenrath, E., Kahn, R. A., Nielsen, J. E., Beyersdorf, A. J., and Burton, S. P.: Satellite data of atmospheric pollution for US air quality applications: Examples of applications, summary of data end-user resources, answers to FAQs, and common mistakes to avoid, Atmos. Environ., 94, 647–662, 2014.
Flagan, R. C. and Seinfeld, J. H.: Fundamentals of air pollution engineering, Courier Corporation, 2012.
Fragkias, M., Lobo, J., Strumsky, D., and Seto, K.C.: Does size matter? Scaling of CO2 emissions and US urban areas, PLoS One, 8, e64727, https://doi.org/10.1371/journal.pone.0064727, 2013.
Fujita, E. M., Croes, B. E., Bennett, C. L., Lawson, D. R., Lurmann, F. W., and Main, H. H.: Comparison of emission inventory and ambient concentration ratios of CO, NMOG, and NOx in California's South Coast Air Basin, J. Air Waste Manage., 42, 264–276, 1992.
Gaubert, B., Arellano, A. F., Barré, J.,Worden, H. M., Emmons, L. K., Tilmes, S., Buchholz, R. R., Vitt, F., Raeder, K., Collins, N., Anderson, J. L., Wiedinmyer, C., Martinez Alonso, S., Edwards, D. P., Andreae, M. O., Hannigan, J. W., Petri, C., Strong, K., and Jones, N.: Toward a chemical reanalysis in a coupled chemistry-climate model: An evaluation of MOPITT CO assimilation and its impact on tropospheric composition, J. Geophys. Res.-Atmos., 121, 7310–7343, https://doi.org/10.1002/2016JD024863, 2016.
Gaubert, B., Worden, H. M., Arellano, A. F. J., Emmons, L. K., Tilmes, S., Barré, J., Alonso, S. M., Vitt, F., Anderson, J. L., Alkemade, F., and Houweling, S.: Chemical feedback from decreasing carbon monoxide emissions, Geophys. Res. Lett., 44, 9985–9995, 2017.
Guo, S., Hu, M., Zamora, M. L., Peng, J., Shang, D., Zheng, J., Du, Z., Wu, Z., Shao, M., Zeng, L., and Molina, M. J.: Elucidating severe urban haze formation in China, P. Natl. Acad. Sci. USA, 111, 17373–17378, 2014.
Hakkarainen, J., Ialongo, I., and Tamminen, J.: Direct space-based observations of anthropogenic CO2 emission areas from OCO2, Geophys. Res. Lett., 43, 11–400, 2016.
Hassler, B., McDonald, B. C., Frost, G. J., Borbon, A., Carslaw, D. C., Civerolo, K., Granier, C., Monks, P. S., Monks, S., Parrish, D. D., and Pollack, I. B.: Analysis of long-term observations of NOx and CO in megacities and application to constraining emissions inventories, Geophys. Res. Lett., 43, 9920–9930, 2016.
He, J. and Wang, H.: Economic structure, development policy and environmental quality: An empirical analysis of environmental Kuznets curves with Chinese municipal data, Ecol. Econ., 76, 49–59, 2012.
Holland, P. W. and Welsch, R. E.: Robust regression using iteratively reweighted least-squares, Commun. Stat. Theory, 6, 813–827, 1977.
Jalkanen, L.: WMO/IGAC impacts of megacities on air pollution and climate, Urban Climate, 1, 67–68, 2012.
Janssens-Maenhout, G., Crippa, M., Guizzardi, D., Dentener, F., Muntean, M., Pouliot, G., Keating, T., Zhang, Q., Kurokawa, J., Wankmüller, R., Denier van der Gon, H., Kuenen, J. J. P., Klimont, Z., Frost, G., Darras, S., Koffi, B., and Li, M.: HTAP_v2.2: a mosaic of regional and global emission grid maps for 2008 and 2010 to study hemispheric transport of air pollution, Atmos. Chem. Phys., 15, 11411–11432, https://doi.org/10.5194/acp-15-11411-2015, 2015.
Jiang, Z., McDonald, B. C., Worden, H., Worden, J. R., Miyazaki, K., Qu, Z., Henze, D. K., Jones, D. B., Arellano, A. F., Fischer, E. V., and Zhu, L.: Unexpected slowdown of US pollutant emission reduction in the past decade, P. Natl. Acad. Sci. USA, 115, 5099–5104, 2018.
Kennedy, C. A., Stewart, I., Facchini, A., Cersosimo, I., Mele, R., Chen, B., Uda, M., Kansal, A., Chiu, A., Kim, K. G., and Dubeux, C.: Energy and material flows of megacities, P. Natl. Acad. Sci. USA, 112, 5985–5990, 2015.
Kheirbek, I., Haney, J., Douglas, S., Ito, K., Caputo Jr., S., and Matte, T.: The public health benefits of reducing fine particulate matter through conversion to cleaner heating fuels in New York City, Environ. Sci. Technol., 48, 13573–13582, 2014.
Konovalov, I. B., Berezin, E. V., Ciais, P., Broquet, G., Zhuravlev, R. V., and Janssens-Maenhout, G.: Estimation of fossil-fuel CO2 emissions using satellite measurements of “proxy” species, Atmos. Chem. Phys., 16, 13509–13540, https://doi.org/10.5194/acp-16-13509-2016, 2016.
Korsbakken, J. I., Peters, G. P. and Andrew, R. M.: Uncertainties around reductions in China's coal use and CO2 emissions, Nat. Clim. Change, 6, 687–690, https://doi.org/10.1038/nclimate2963, 2016.
Koukouli, M. E., Theys, N., Ding, J., Zyrichidou, I., Mijling, B., Balis, D., and van der A, R. J.: Updated SO2 emission estimates over China using OMI/Aura observations, Atmos. Meas. Tech., 11, 1817–1832, https://doi.org/10.5194/amt-11-1817-2018, 2018.
Krotkov, N. A., Carn, S. A., Krueger, A. J., Bhartia, P. K., and Yang, K.: Band residual difference algorithm for retrieval of SO/sub 2/from the aura ozone monitoring instrument (OMI), IEEE T. Geosci. Remote, 44, 1259–1266, 2006.
Krotkov, N. A., McLinden, C. A., Li, C., Lamsal, L. N., Celarier, E. A., Marchenko, S. V., Swartz, W. H., Bucsela, E. J., Joiner, J., Duncan, B. N., Boersma, K. F., Veefkind, J. P., Levelt, P. F., Fioletov, V. E., Dickerson, R. R., He, H., Lu, Z., and Streets, D. G.: Aura OMI observations of regional SO2 and NO2 pollution changes from 2005 to 2015, Atmos. Chem. Phys., 16, 4605–4629, https://doi.org/10.5194/acp-16-4605-2016, 2016.
Kurokawa, J., Ohara, T., Morikawa, T., Hanayama, S., Janssens-Maenhout, G., Fukui, T., Kawashima, K., and Akimoto, H.: Emissions of air pollutants and greenhouse gases over Asian regions during 2000–2008: Regional Emission inventory in ASia (REAS) version 2, Atmos. Chem. Phys., 13, 11019–11058, https://doi.org/10.5194/acp-13-11019-2013, 2013.
Lamb, W. F., Steinberger, J. K., Bows-Larkin, A., Peters, G. P., Roberts, J. T., and Wood, F. R.: Transitions in pathways of human development and carbon emissions, Environ. Res. Lett., 9, 014011, 2014.
Lamsal, L. N., Martin, R. V., Parrish, D. D., and Krotkov, N. A.: Scaling relationship for NO2 pollution and urban population size: a satellite perspective, Environ. Sci. Technol., 47, 7855–7861, 2013.
Lelieveld, J., Evans, J. S., Fnais, M., Giannadaki, D., and Pozzer, A.: The contribution of outdoor air pollution sources to premature mortality on a global scale, Nature, 525, 367–371 https://doi.org/10.1038/nature15371, 2015.
Lewis, A.C.: The changing face of urban air pollution, Science, 359, 744–745, 2018.
Li, G., Fang, C., Wang, S., and Sun, S.: The effect of economic growth, urbanization, and industrialization on fine particulate matter (PM2.5) concentrations in China, Environ. Sci. Technol., 50, 11452–11459, 2016.
Li, M., Zhang, Q., Kurokawa, J.-I., Woo, J.-H., He, K., Lu, Z., Ohara, T., Song, Y., Streets, D. G., Carmichael, G. R., Cheng, Y., Hong, C., Huo, H., Jiang, X., Kang, S., Liu, F., Su, H., and Zheng, B.: MIX: a mosaic Asian anthropogenic emission inventory under the international collaboration framework of the MICS-Asia and HTAP, Atmos. Chem. Phys., 17, 935–963, https://doi.org/10.5194/acp-17-935-2017, 2017.
Li, M., Klimont, Z., Zhang, Q., Martin, R. V., Zheng, B., Heyes, C., Cofala, J., Zhang, Y., and He, K.: Comparison and evaluation of anthropogenic emissions of SO2 and NOx over China, Atmos. Chem. Phys., 18, 3433–3456, https://doi.org/10.5194/acp-18-3433-2018, 2018.
Lin, J., Pan, D., Davis, S. J., Zhang, Q., He, K., Wang, C., Streets, D. G., Wuebbles, D. J., and Guan, D.: China's international trade and air pollution in the United States, P. Natl. Acad. Sci. USA, 111, 1736–1741, 2014.
Liu, F., Zhang, Q., van der A, R. J., Zheng, B., Tong, D., Yan, L., Zheng, Y., and He, K.: Recent reduction in NOx emissions over China: Synthesis of satellite observations and emission inventories, Environ. Res. Lett., 11, 114002, https://doi.org/10.1088/1748- 9326/11/11/114002, 2016.
Luo, Y., Chen, H., Peng, C., Yang, G., Yang, Y., and Zhang, Y.: Relationship between air pollutants and economic development of the provincial capital cities in China during the past decade, PLoS One, 9, e104013, https://doi.org/10.1371/journal.pone.0104013, 2014.
Mage, D., Ozolins, G., Peterson, P., Webster, A., Orthofer, R., Vandeweerd, V., and Gwynne, M.: Urban air pollution in megacities of the world, Atmos. Environ., 30, 681–686, 1996.
Marangoni, G., Tavoni, M., Bosetti, V., Borgonovo, E., Capros, P., Fricko, O., Gernaat, D. E., Guivarch, C., Havlik, P., Huppmann, D., and Johnson, N.: Sensitivity of projected long-term CO2 emissions across the Shared Socioeconomic Pathways, Nat. Clim. Change, 7, 113–117, https://doi.org/10.1038/nclimate3199, 2017.
Mazur, A. and Rosa, E.: Energy and life-style, Science, 186, 607–610, 1974.
McDonald, B. C., De Gouw, J. A., Gilman, J. B., Jathar, S. H., Akherati, A., Cappa, C. D., Jimenez, J. L., Lee-Taylor, J., Hayes, P. L., McKeen, S. A., and Cui, Y. Y.: Volatile chemical products emerging as largest petrochemical source of urban organic emissions, Science, 359, 760–764, 2018.
Mi, Z., Meng, J., Guan, D., Shan, Y., Liu, Z., Wang, Y., Feng, K., and Wei, Y. M.: Pattern changes in determinants of Chinese emissions, Environ. Res. Lett., 12, 074003, https://doi.org/10.1088/1748-9326/aa69cf, 2017.
Mitchell, L. E., Lin, J. C., Bowling, D. R., Pataki, D. E., Strong, C., Schauer, A. J., Bares, R., Bush, S. E., Stephens, B. B., Mendoza, D., and Mallia, D.: Long-term urban carbon dioxide observations reveal spatial and temporal dynamics related to urban characteristics and growth, P. Natl. Acad. Sci. USA, 115, 2912–2917, 2018.
Miyazaki, K., Eskes, H., Sudo, K., Boersma, K. F., Bowman, K., and Kanaya, Y.: Decadal changes in global surface NOx emissions from multi-constituent satellite data assimilation, Atmos. Chem. Phys., 17, 807–837, https://doi.org/10.5194/acp-17-807-2017, 2017.
National Academies of Sciences, Engineering, and Medicine: The Future of Atmospheric Chemistry Research: Remembering Yesterday, Understanding Today, Anticipating Tomorrow. Washington, DC: The National Academies Press, https://doi.org/10.17226/23573, 2016.
National Bureau of Statistics of China: China Statistical Yearbook 2018, China Statistical Press, Beijing, available at: http://www.stats.gov.cn/english/Statisticaldata/AnnualData/ (last access: 22 March 2019), 2018.
O'Neill, B. C., Kriegler, E., Riahi, K., Ebi, K. L., Hallegatte, S., Carter, T. R., Mathur, R., and van Vuuren, D. P.: A new scenario framework for climate change research: the concept of shared socioeconomic pathways, Climatic Change, 122, 387–400, 2014.
Parrish, D. D.: Critical evaluation of US on-road vehicle emission inventories, Atmos. Environ., 40, 2288–2300, 2006.
Parrish, D. D., Trainer, M., Hereid, D., Williams, E. J., Olszyna, K. J., Harley, R. A., Meagher, J. F., and Fehsenfeld, F. C.: Decadal change in carbon monoxide to nitrogen oxide ratio in US vehicular emissions, J. Geophys. Res.-Atmos., 107, 4140, https://doi.org/10.1029/2001JD000720, 2002.
Paulot, F., Fan, S., and Horowitz, L. W.: Contrasting seasonal responses of sulfate aerosols to declining SO2 emissions in the Eastern US: Implications for the efficacy of SO2 emission controls, Geophys. Res. Lett., 44, 455–464, 2017.
Qi, Y., Stern, N., Wu, T., Lu, J., and Green, F.: China's post-coal growth, Nat. Geosci., 9, 564–566, https://doi.org/10.1038/ngeo2777, 2016.
Ramaswami, A. and Chavez, A.: What metrics best reflect the energy and carbon intensity of cities? Insights from theory and modeling of 20 US cities, Environ. Res. Lett., 8, 035011, https://doi.org/10.1088/1748-9326/8/3/035011, 2013.
Reuter, M., Buchwitz, M., Hilboll, A., Richter, A., Schneising, O., Hilker, M., Heymann, J., Bovensmann, H., and Burrows, J. P.: Decreasing emissions of NOx relative to CO2 in East Asia inferred from satellite observations, Nat. Geosci., 7, 792–795, https://doi.org/10.1038/ngeo2257, 2014.
Riahi, K., Rao, S., Krey, V., Cho, C., Chirkov, V., Fischer, G., Kindermann, G., Nakicenovic, N., and Rafaj, P.: RCP 8.5–A scenario of comparatively high greenhouse gas emissions, Climatic Change, 109, 33–57, https://doi.org/10.1007/s10584-011-0149-y, 2011.
Richter, A., Burrows, J. P., Nüß, H., Granier, C., and Niemeier, U.: Increase in tropospheric nitrogen dioxide over China observed from space, Nature, 437, 129–132, 2005.
Russell, A. R., Valin, L. C., and Cohen, R. C.: Trends in OMI NO2 observations over the United States: effects of emission control technology and the economic recession, Atmos. Chem. Phys., 12, 12197–12209, https://doi.org/10.5194/acp-12-12197-2012, 2012.
Saeki, T. and Patra, P. K.: Implications of overestimated anthropogenic CO2 emissions on East Asian and global land CO2 flux inversion, Geoscience Letters, 4, 9, https://doi.org/10.1186/s40562-017-0074-7, 2017.
Shindell, D., Faluvegi, G., Walsh, M., Anenberg, S. C., Van Dingenen, R., Muller, N. Z., Austin, J., Koch, D., and Milly, G.: Climate, health, agricultural and economic impacts of tighter vehicle-emission standards, Nat. Clim. Change, 1, 59–66, 2011.
Silva, S. and Arellano, A.: Characterizing regional-scale combustion using satellite retrievals of CO, NO2 and CO2, Remote Sensing, 9, 744, https://doi.org/10.3390/rs9070744,, 2017.
Silva, S. J., Arellano, A. F., and Worden, H. M.: Toward anthropogenic combustion emission constraints from space-based analysis of urban CO2∕CO sensitivity, Geophys. Res. Lett., 40, 4971–4976, 2013.
Smith, R. J.: Use and misuse of the reduced major axis for linefitting, Am. J. Phys. Anthropol., 140, 476–486, 2009.
Steinberger, J. K., Roberts, J. T., Peters, G. P., and Baiocchi, G.: Pathways of human development and carbon emissions embodied in trade, Nat. Clim. Change, 2, 81–85, https://doi.org/10.1038/nclimate1371, 2012.
Stern, D. I.: The rise and fall of the environmental Kuznets curve, World Dev., 32, 1419–1439, 2004.
Streets, D. G., Canty, T., Carmichael, G. R., de Foy, B., Dickerson, R. R., Duncan, B. N., Edwards, D. P., Haynes, J. A., Henze, D. K., Houyoux, M. R., and Jacob, D. J.: Emissions estimation from satellite retrievals: A review of current capability, Atmos. Environ., 77, 1011–1042, 2013.
Sun, W., Shao, M., Granier, C., Liu, Y., Ye, C. S., and Zheng, J. Y.: Long-Term Trends of Anthropogenic SO2, NOx, CO, and NMVOCs Emissions in China, Earth's Future, 6, 1112–1133, 2018.
Tang, W. and Arellano, F. A.: Investigating dominant characteristics of fires across the Amazon during 2005–2014 through satellite data synthesis of combustion signatures, J. Geophys. Res.-Atmos., 122, 1224–1245, 2017.
Tang, W., Arellano, A. F., DiGangi, J. P., Choi, Y., Diskin, G. S., Agustí-Panareda, A., Parrington, M., Massart, S., Gaubert, B., Lee, Y., Kim, D., Jung, J., Hong, J., Hong, J.-W., Kanaya, Y., Lee, M., Stauffer, R. M., Thompson, A. M., Flynn, J. H., and Woo, J.-H.: Evaluating high-resolution forecasts of atmospheric CO and CO2 from a global prediction system during KORUS-AQ field campaign, Atmos. Chem. Phys., 18, 11007–11030, https://doi.org/10.5194/acp-18-11007-2018, 2018.
Tang, W., Emmons, L. K., Arellano, A. F., Gaubert, B., Knote, C., Tilmes, S., Buchholz, R. R., Pfister, G. G., Diskin, G. S., Blake, D. R., Blake, N. J., Meinardi, S., DiGangi, J P., Choi, Y., Woo,J., He, C., Schroeder, J. R., Suh, I., Lee, H., Jo, H., Kanaya, Y., Jung, J., Lee, Y., and Kim, D.: Source contributions to carbon monoxide concentrations during KORUS-AQ based on CAM-chem model applications, J. Geophys. Res.-Atmos., 124, https://doi.org/10.1029/2018JD029151, 2019.
Taylor, M. R., Rubin, E. S., and Hounshell, D. A.: Control of SO2 emissions from power plants: A case of induced technological innovation in the US, Technol. Forecast. Soc., 72, 697–718, 2005.
van der A, R. J., Mijling, B., Ding, J., Koukouli, M. E., Liu, F., Li, Q., Mao, H., and Theys, N.: Cleaning up the air: effectiveness of air quality policy for SO2 and NOx emissions in China, Atmos. Chem. Phys., 17, 1775–1789, https://doi.org/10.5194/acp-17-1775-2017, 2017.
Verstraeten, W. W., Neu, J. L., Williams, J. E., Bowman, K. W., Worden, J. R., and Boersma, K. F.: Rapid increases in tropospheric ozone production and export from China, Nat. Geosci., 8, 690–695, https://doi.org/10.1038/ngeo2493, 2015.
Wang, S. and Hao, J.: Air quality management in China: Issues, challenges, and options, J. Environ. Sci., 24, 2–13, 2012.
Worden, H. M., Deeter, M. N., Edwards, D. P., Gille, J. C., Drummond, J. R., and Nédélec, P.: Observations of near-surface carbon monoxide from space using MOPITT multispectral retrievals, J. Geophys. Res.-Atmos., 115, D18314, https://doi.org/10.1029/2010JD014242, 2010.
World Bank: East Asia's Changing Urban Landscape: Measuring a Decade of Spatial Growth, Urban Development Series, Washington, DC: World Bank, https://doi.org/10.1596/978-1-4648-0363-5, 2015.
Wu, Y., Zhang, S., Hao, J., Liu, H., Wu, X., Hu, J., Walsh, M. P., Wallington, T. J., Zhang, K. M., and Stevanovic, S.: On-road vehicle emissions and their control in China: A review and outlook, Sci. Total Environ., 574, 332–349, 2017.
Yang, X., Wang, S., Zhang, W., Li, J., and Zou, Y.: Impacts of energy consumption, energy structure, and treatment technology on SO2 emissions: A multi-scale LMDI decomposition analysis in China, Appl. Energ., 184, 714–726, 2016.
Zhang, Q., He, K., and Huo, H.: Policy: cleaning China's air, Nature, 484, 161–162, 2012.
Zheng, B., Chevallier, F., Ciais, P., Yin, Y., Deeter, M. N., Worden, H. M., Wang, Y., Zhang, Q., and He, K.: Rapid decline in carbon monoxide emissions and export from East Asia between years 2005 and 2016, Environ. Res. Lett., 13, 044007, https://doi.org/10.1088/1748-9326/aab2b3, 2018.
Zhong, Q., Huang, Y., Shen, H., Chen, Y., Chen, H., Huang, T., Zeng, E. Y., and Tao, S.: Global estimates of carbon monoxide emissions from 1960 to 2013, Environ. Sci. Pollut. Res., 24, 864–873, 2017.
The requested paper has a corresponding corrigendum published. Please read the corrigendum first before downloading the article.
- Article
(3467 KB) - Full-text XML
- Corrigendum
-
Supplement
(1453 KB) - BibTeX
- EndNote