the Creative Commons Attribution 4.0 License.
the Creative Commons Attribution 4.0 License.
 | 02 Apr 2019
Vertical profiles of sub-3 nm particles over the boreal forest
Katri Leino
Janne Lampilahti
Pyry Poutanen
Riikka Väänänen
Antti Manninen
Stephany Buenrostro Mazon
Lubna Dada
Anna Franck
Daniela Wimmer
Pasi P. Aalto
Lauri R. Ahonen
Joonas Enroth
Juha Kangasluoma
Petri Keronen
Frans Korhonen
Heikki Laakso
Teemu Matilainen
Erkki Siivola
Hanna E. Manninen
Katrianne Lehtipalo
Veli-Matti Kerminen
Tuukka Petäjä
Markku Kulmala
This work presents airborne observations of sub-3 nm particles in the lower troposphere and investigates new particle formation (NPF) within an evolving boundary layer (BL). We studied particle concentrations together with supporting gas and meteorological data inside the planetary BL over a boreal forest site in Hyytiälä, southern Finland. The analysed data were collected during three flight measurement campaigns: May–June 2015, August 2015 and April–May 2017, including 27 morning and 26 afternoon vertical profiles. As a platform for the instrumentation, we used a Cessna 172 aircraft. The analysed flight data were collected horizontally within a 30 km distance from SMEAR II in Hyytiälä and vertically from 100 m above ground level up to 2700 m. The number concentration of 1.5–3 nm particles was observed to be, on average, the highest near the forest canopy top and to decrease with increasing altitude during the mornings of NPF event days. This indicates that the precursor vapours emitted by the forest play a key role in NPF in Hyytiälä. During daytime, newly formed particles were observed to grow in size and the particle population became more homogenous within the well-mixed BL in the afternoon. During undefined days with respect to NPF, we also detected an increase in concentration of 1.5–3 nm particles in the morning but not their growth in size, which indicates an interrupted NPF process during these undefined days. Vertical mixing was typically stronger during the NPF event days than during the undefined or non-event days. The results shed light on the connection between boundary layer dynamics and NPF.
Please read the corrigendum first before continuing.
-
Notice on corrigendum
The requested paper has a corresponding corrigendum published. Please read the corrigendum first before downloading the article.
-
Article
(4516 KB)
-
The requested paper has a corresponding corrigendum published. Please read the corrigendum first before downloading the article.
- Article
(4516 KB) - Corrigendum
- BibTeX
- EndNote


One of the most important sources of secondary aerosol particles in the atmosphere is new particle formation (NPF). NPF and subsequent growth is a globally observed phenomenon (Kulmala et al., 2004; Kulmala and Kerminen, 2008; Kerminen et al., 2018). It is still partly unclear where, when and how NPF occurs in the atmosphere. Aerosol measurements on board an aircraft can give information about the vertical, horizontal and spatial extent of the NPF in the lower atmosphere.
The planetary boundary layer (PBL) is a complex layer in the lowest part of the atmosphere, defined as the part of the troposphere that is directly connected to the Earth's surface through the exchange of momentum, heat and mass, and responds to surface forcing with a timescale of an hour or less (Stull, 2012). The PBL has a characteristic diurnal cycle, but the detailed development varies from day to day. Several meteorological, physical and chemical processes influence the spatial and temporal conditions inside the BL and thus the mixing strength and evolution of the boundary layer. This gives rise to complexity in defining the exact BLH and characterizing the typical BL structure or height at a given location.
Several airborne measurements have been conducted to investigate particle number concentrations and size distributions as well as NPF inside the PBL. Over Europe, Crumeyrolle et al. (2010) observed that the horizontal extent of NPF was about 100 km or larger during the EUCAARI campaign in 2008 (Kerminen et al., 2010), while Wehner et al. (2007) estimated a corresponding scale of up to 400 km with clear horizontal variability in NPF characteristics during the SATURN campaign in 2002. The number concentrations and size distributions of naturally charged particles (air ions) were under investigation during the EUCAARI-LONGREX campaign in May 2008 (Mirme et al., 2010). NPF was reported to take place throughout the whole BL, with particles more likely forming via neutral rather than ion-induced pathways inside the PBL.
One of the sinks of newly formed aerosol particles in the PBL is dry deposition, which is especially important for the smallest particles (Rannik et al., 2000; Lauros et al., 2011). Recently, Zha et al. (2018) studied the vertical profile of highly oxygenated organic compounds (HOMs), which are known precursors for aerosol formation (Ehn et al., 2014). They found that while the concentrations were similar below and above canopy (35 m) during well-mixed conditions, the concentrations were often clearly lower near the ground level during night-time, when temperature inversion occurred, probably due to changes in their sources and sinks (e.g. surface deposition) during stable conditions.
In addition to NPF near to the surface inside the PBL and NPF in the free troposphere (FT) (Bianchi et al., 2016), NPF has also been observed near clouds (Wehner et al., 2015). Siebert et al. (2004), Platis et al. (2016) and Chen et al. (2018) observed NPF to initiate on top of the boundary layer in a capping inversion followed by subsequent mixing of the freshly formed particles throughout the well-mixed boundary layer. Wehner et al. (2010) studied NPF in the residual layer and observed that turbulent mixing is likely to lead to a local super saturation of possible precursor gases, which is essential for NPF. The particles were formed in parts of the residual layer and subsequently entrained into the BL where they were detected at the surface.
NPF events frequently occur over the boreal forest region in southern Finland (Kulmala et al., 2001, 2013; Dal Maso et al., 2005). In addition to ground-based measurements at SMEAR II (61∘51′ N, 24∘17′ E; 181 m above sea level; Hari and Kulmala, 2005), which have been conducted continuously since 1996, airborne measurements of aerosol particles have also been carried out near the station since the year 2003 during several campaigns using a small aircraft (O'Dowd et al., 2009; Schobesberger et al., 2013) and a hot-air balloon (Laakso et al., 2007). Laakso et al. (2007) observed NPF to occur in the mixed BL, but also in the FT with no connection to BL nucleation. O'Dowd et al. (2009) observed NPF throughout the BL over SMEAR II, with the nucleation-mode number concentration peaking first above the forest canopy. Schobesberger et al. (2013) observed NPF inside the PBL. High concentrations of nucleation-mode particles were also found in the upper parts of the PBL, which indicates that nucleation does not necessarily occur only close to the surface. The vertical profiles of small particles in mixing BL at SMEAR II were also modelled by Boy et al. (2006). Their results predicted that the maximum of newly formed clusters and particle concentrations is located near the ground level.
In this study, we investigate the vertical variation of 1.5–3 and 3–10 nm particles from the ground level up to 3 km during different days in relation to the occurrence of NPF at the ground level, as well as the vertical mixing of a particle population within the evolving BL. The dataset was collected during three measurement flight campaigns, in spring 2015, August 2015 and in spring 2017, within a 30 km distance from SMEAR II. The results are compared to the data measured on the ground level at the station. Traditional NPF event classification is used to classify studied days as NPF events, non-events and undefined days (Dal Maso et al., 2005).
The questions we would like to answer are the following. What kind of characteristics do we have in the vertical profile of small particles? How do these profiles differ between the NPF event, non-event and undefined days? Where do new particles form, and how does the strength of turbulent mixing affect particle concentrations? What is the median concentration of small particles inside the BL during the NPF event, non-event and undefined days, and how well do the results agree with the values measured on the ground level?
2.1 Measurements on board Cessna
As a platform for aerosol instruments, we used a light one-engine Cessna FR172F aircraft. The measurement instruments were installed on an aluminium rack in the middle part of the plane inside the cabin (Fig. 1). A steel inlet line (with a 32 mm inner diameter) was mounted onto the top of the rack and lifted in and out of the window on the left side of the plane. The sample was collected from a 50 cm distance from the fuselage of the plane. The main flow in the steel tube was kept constant at 47 L min−1 during the measurement flight and was produced by suction in the venturi and forward motion of the airplane. Each instrument took the actual inlet flow from the central line of the main flow, minimizing the diffusional losses of the smallest particles. The measurements were performed with an airspeed of 125 km h−1. More details about the instrumentation and layout can be found in Schobesberger et al. (2013) and Väänänen et al. (2016). The data were collected within a 30 km distance from SMEAR II and the area is covered mainly by coniferous forest.

Figure 1The instrumentation rack was installed inside the cabin (a) and the sample air for the instrumentation was taken from a steel tube at a 50 cm distance from the fuselage of the plane (b). The main instruments (ultrafine CPC, PSM and SMPS) are shown in the figure.
2.2 Instrumentation
The main instrumentation for this study consisted of several different particle counters. An ultrafine condensation particle counter (uCPC, model TSI-3776) is an instrument that detects the total concentration of particles larger than about 3 nm in diameter. Particles larger than the threshold diameter are grown into large droplets by condensing butanol vapour onto their surface, after which they are detected optically with a laser-diode photodetector. The ultrafine CPC has an internal vacuum pump that draws the aerosol sample with a flow rate of 1.5 L min−1 into the instrument.
Airmodus Ltd has developed a mixing-type particle size magnifier (PSM). The instrument is able to directly detect sub-3 nm atmospheric particles using diethylene glycol (DEG) as a condensing fluid (Vanhanen et al., 2011). Compared with the typically used working fluids in CPCs, water and butanol, the advantages of using DEG as a condensing fluid are its lower saturation vapour pressure and higher surface tension, which enables it to detect particles down to 1 nm. The PSM requires a separate water or butanol counter (CPC) for optically detecting the grown particles. The PSM in this study was a model A10, operating with a butanol CPC (model TSI-3010). During the flight measurements presented here, the instrument was used in the fixed-saturator flow-rate mode, measuring the total particle concentration with a 1.5 nm cut-off size.
The instrumentation also included a custom-built scanning mobility particle sizer (SMPS), which measures the particle number size distribution in the diameter size range of 10–400 nm with a 2 min time resolution. Before the classification of an aerosol population, the particles are transported to a radioactive source in which they reach a constant bipolar charge equilibrium. The SMPS contains a differential mobility analyser (DMA, Hauke type), while particle number concentrations are measured with a butanol CPC (model TSI-3010).
The concentrations of water vapour (H2O) and carbon dioxide (CO2) were measured with a Li-Cor (LI-840) gas analyser located in the instrumentation rack. Basic meteorological variables, including the ambient temperature (with PT-100 temperature sensor), relative humidity (RH) (with Rotronic HygroClip-S sensor) and static pressure (with Vaisala PTB100B), were measured. Pressure was measured inside the plane while the temperature and RH sensor was located in the right wing of the plane. The location of the plane was recorded by a GPS receiver.
2.3 SMEAR II
The research Station for Measuring Ecosystem–Atmospheric Relations (SMEAR) II in Hyytiälä, southern Finland, was established in 1995 (see Hari and Kulmala, 2005). The station is equipped with several aerosol and gas instruments together with flux, irradiation and meteorological measurements. The long-term measurements provide reliable and comprehensive knowledge about ambient conditions at a relatively clean coniferous forest site. The station includes ground-based measurements, tower measurements at a 35 m height above the ground level right above the canopy and measurements conducted from a mast at different altitudes up to 128 m.
In this study, we mainly used particle data from the ground level as reference data to which we compare our flight measurement data. The number concentrations in the size range of 1.5–3 nm were calculated from the difference between the measured total particle concentration at the 1.5 nm cut-off size (from the PSM) and total concentration at the 3 nm cut-off size (from DMPS). The distance between the PSM and DMPS is vertically a few metres and horizontally a few tens of metres, which causes some uncertainties in 1.5–3 nm particle number concentrations, especially during poorly mixed BL times in the morning when the two instruments do not always measure the same air mass.
The sensible heat flux (SHF) was measured at a 23 m height, and we used these data to get qualitative information on the strength of vertical mixing in the measured air masses.
2.4 Data analysis
The particle number concentration in the size range of 1.5–3 nm was calculated as the difference of the total particle concentrations measured with the PSM and uCPC on board the Cessna. The cut-off sizes of these instruments were 1.5 and 3 nm. The cut-off size of the SMPS was 10 nm. The number concentration in the size range of 3–10 nm was calculated as the difference in the total particle number concentrations measured with uCPC and SMPS.
Total particle number concentrations measured on board the Cessna were first converted into standard temperature and pressure conditions (STP; 273.15 K, 100 kPa) and were then corrected with the maximum detection efficiency of the instrument based on laboratory calibrations. The maximum detection efficiency of the PSM used in airborne measurement was 0.75 and that of uCPC was 0.99. The maximum detection efficiencies of the PSMs used at the station were 0.8. Finally, the particle number concentrations were corrected with respect to diffusional losses in the inlet part (Fig. 1) and inside the sampling lines on the plane, assuming a constant correction factor for each size bin. The ground and tower data were assumed to have negligible inlet line losses because of core sampling (Kangasluoma et al., 2016). The correction factor for the inlet part was 0.716 for 1.5–3 nm particles and 0.720 for 3–10 nm particles based on simulation results using COMSOL multiphysics software. Penetration efficiencies through the sampling lines were 0.70 and 0.88 in the size ranges of 1.5–3 and 3–10 nm, respectively.
All the results presented here are reported vertically as metres above the ground level, and all the data were collected within a distance of 30 km from SMEAR II in Hyytiälä. A typical measurement flight includes a linear ascent from 100–200 m (a.g.l.) up to the FT region, 2500–3500 m, and a descent back to near the canopy top level.
In this study, we analysed altogether 53 measurement profiles during 18 days. The flights were conducted during three measurement campaigns: May–June 2015, August 2015 and April–May 2017, either in the morning (07:00–12:00 UTC+2) or in the afternoon (12:00–15:00). The days were classified as event, non-event or undefined days based on the NPF event classification method by Dal Maso et al. (2005).
Well-mixed boundary layers are capped by a stable layer. The boundary layer height (BLH) was visually estimated from the in situ measurements on board the Cessna aircraft for each vertical measurement profile. The BLH was estimated from the minimum vertical gradient in H2O and RH and the maximum vertical gradient in the potential temperature. The estimated BLH was evaluated visually with Doppler lidar profiles when possible (due to a very low lidar signal-to-noise ratio in the clean-air environment) and was found to agree very well. When the sun is rising, the mixing of air mass starts from near the ground, and aerosol particles originating from the surface get mixed upwards within the rising mixed layer. Inside the mixing layer, higher concentrations of H2O are sometimes seen when the turbulence mixes up the moisture from the surface. CO2 tends to be higher in the morning boundary layer due to respiration and decreases in the residual layer. The vertical profile of the potential temperature is almost constant in the surface mixed layer and rapidly increases with increasing altitude under stable conditions.
2.5 Uncertainties
As described above, all the results were converted into standard temperature and pressure (100 kPa, 273.15 K) conditions and corrected for the instrumental maximum detection efficiency and line losses according to the laboratory characterizations of the flight set-up. However, there are several factors causing uncertainties in the measured concentrations. The flight speed, main flow rate, air pressure, relative humidity and temperature change rapidly during a flight, which can cause variations in the inlet flows and the performance of the instruments. It is poorly known how the uCPC and PSM behave under quickly varying operational conditions. The reduced pressure at high altitudes may change the maximum detection efficiency and cut-off size of laminar-flow CPCs (e.g. Zhang and Liu, 1991; Herrman and Wiedensohler, 2001). The pressure effect on the PSM cut-off size has been observed to be small (<0.1 nm until 60 kPa) compared to the uncertainty caused by a changing relative humidity and particle composition (Kangasluoma et al., 2016). We measured up to altitudes with the pressure going down to ∼70 kPa, which gives an uncertainty of ±5 % for the aerosol flow rate of the CPC 3776 and thus directly for the concentrations, as shown by Takegawa et al. (2017), Fig. 3. In addition, we compared the concentrations measured by PSM, uCPC and SMPS in the FT where the occurrence of small particles (below 10 nm, which has been under discussion in this paper) is very low. These concentrations matched well with each other, so we may assume that the pressure effect on the measured concentrations for any of the instruments was not significant in our study.
Because of the uncertainties in the instrument cut-off sizes, the true size range for the 1.5–3 nm concentration may vary with altitude and between different flights. This would also slightly affect the particle sampling losses, which were here assumed to be constant for the whole size range, although in reality there is a size dependency. Because of these uncertainties in the determined concentrations, we should focus on the relative behaviour of median values rather than absolute concentrations.
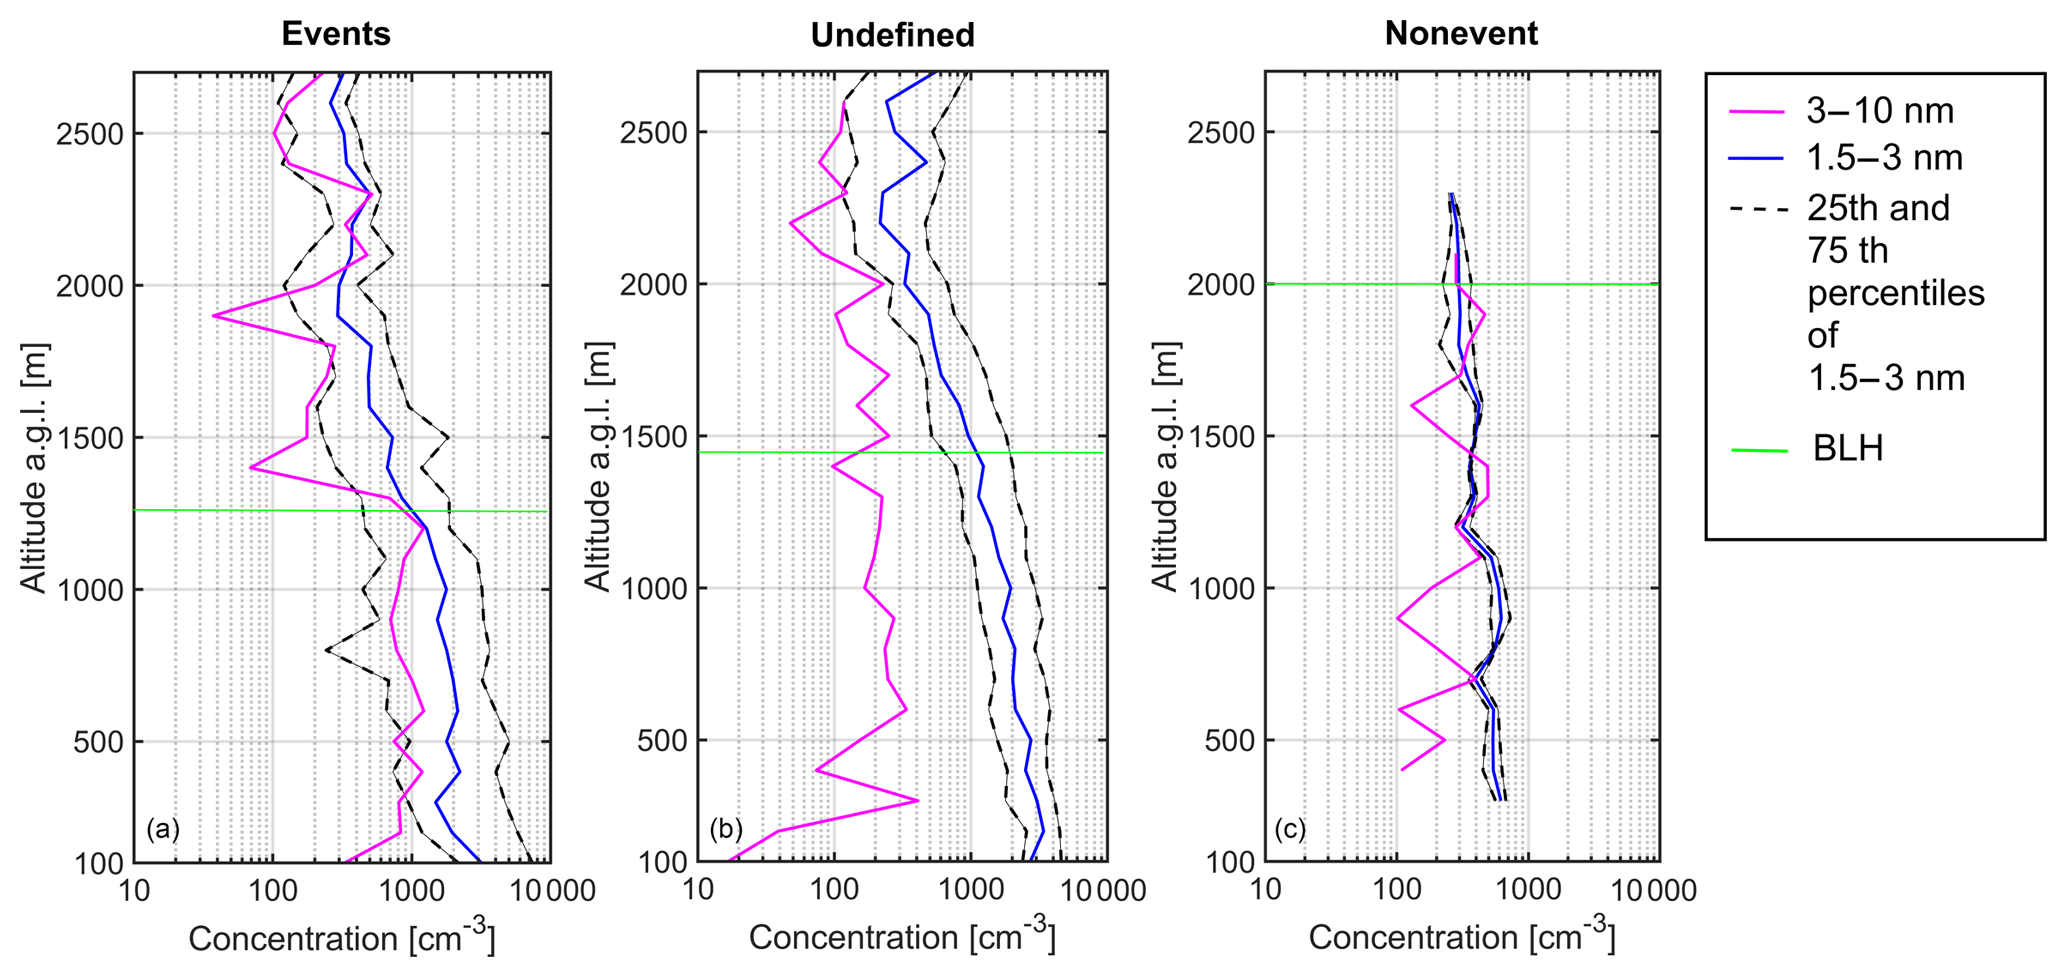
Figure 2All-day median particle concentrations in two size ranges, 3–10 nm (pink) and 1.5–3 nm (blue), and 25th and 75th percentiles (dashed lines) of the 1.5–3 nm particle concentration as a function of altitude for afternoon profiles over 17 event days (a), 34 undefined days (b) and 2 non-event days (c). The concentrations were calculated from the differences between three instruments (PSM, uCPC and SMPS) at different cut-off sizes: 1.5, 3 and 10 nm, respectively. The data were collected from near (<30 km) SMEAR II during spring and August flight measurement campaigns in 2015 and a spring campaign in 2017. Median boundary layer heights are marked by green lines.
The flight days were divided into event, non-event and undefined days based on the NPF event classification by Dal Maso et al. (2005). Based on this classification on the ground level, the vertical profiles of particles in the size ranges of 1.5–3 and 3–10 nm were studied separately on each type of day. During event and undefined days, we also looked at differences between the morning and afternoon. The number of flights during non-event days is low (two vertical profiles) because cloudiness makes the operation of the aircraft impossible. Non-event days are mostly cloudy in Hyytiälä (Dada et al., 2017).
For the flight days, when we have comparable particle data from the ground station, we calculated the median values of the 1.5–3 nm particle concentration both inside BL on board the Cessna and on the ground level. The boundary layer height was estimated for every vertical measurement profile.
3.1 General features and vertical profiles
The median values of particle concentrations, sensible heat flux, measurement height and estimated BLH were calculated for the 27 cases when comparable data were available at SMEAR II (Table 1). The values on board the aircraft (inside the BL) indicate the observations on board the Cessna, which means that the minimum limit for altitude was around 100 m from ground level. The values on the ground level were measured inside the forest canopy.
Table 1Numerical statistics for boundary layer height (BLH) and sensible heat flux (SHF), indicating the mixing of air mass, and concentrations of 1.5–3 nm particles together with median measurement heights during measurement flights in 2015 and 2017. The morning flights were conducted between 07:00 and 12:00 and afternoon flights at 12:00–15:00. The low number of flights during non-event days is caused by cloudiness, which makes the operation of the aircraft impossible.
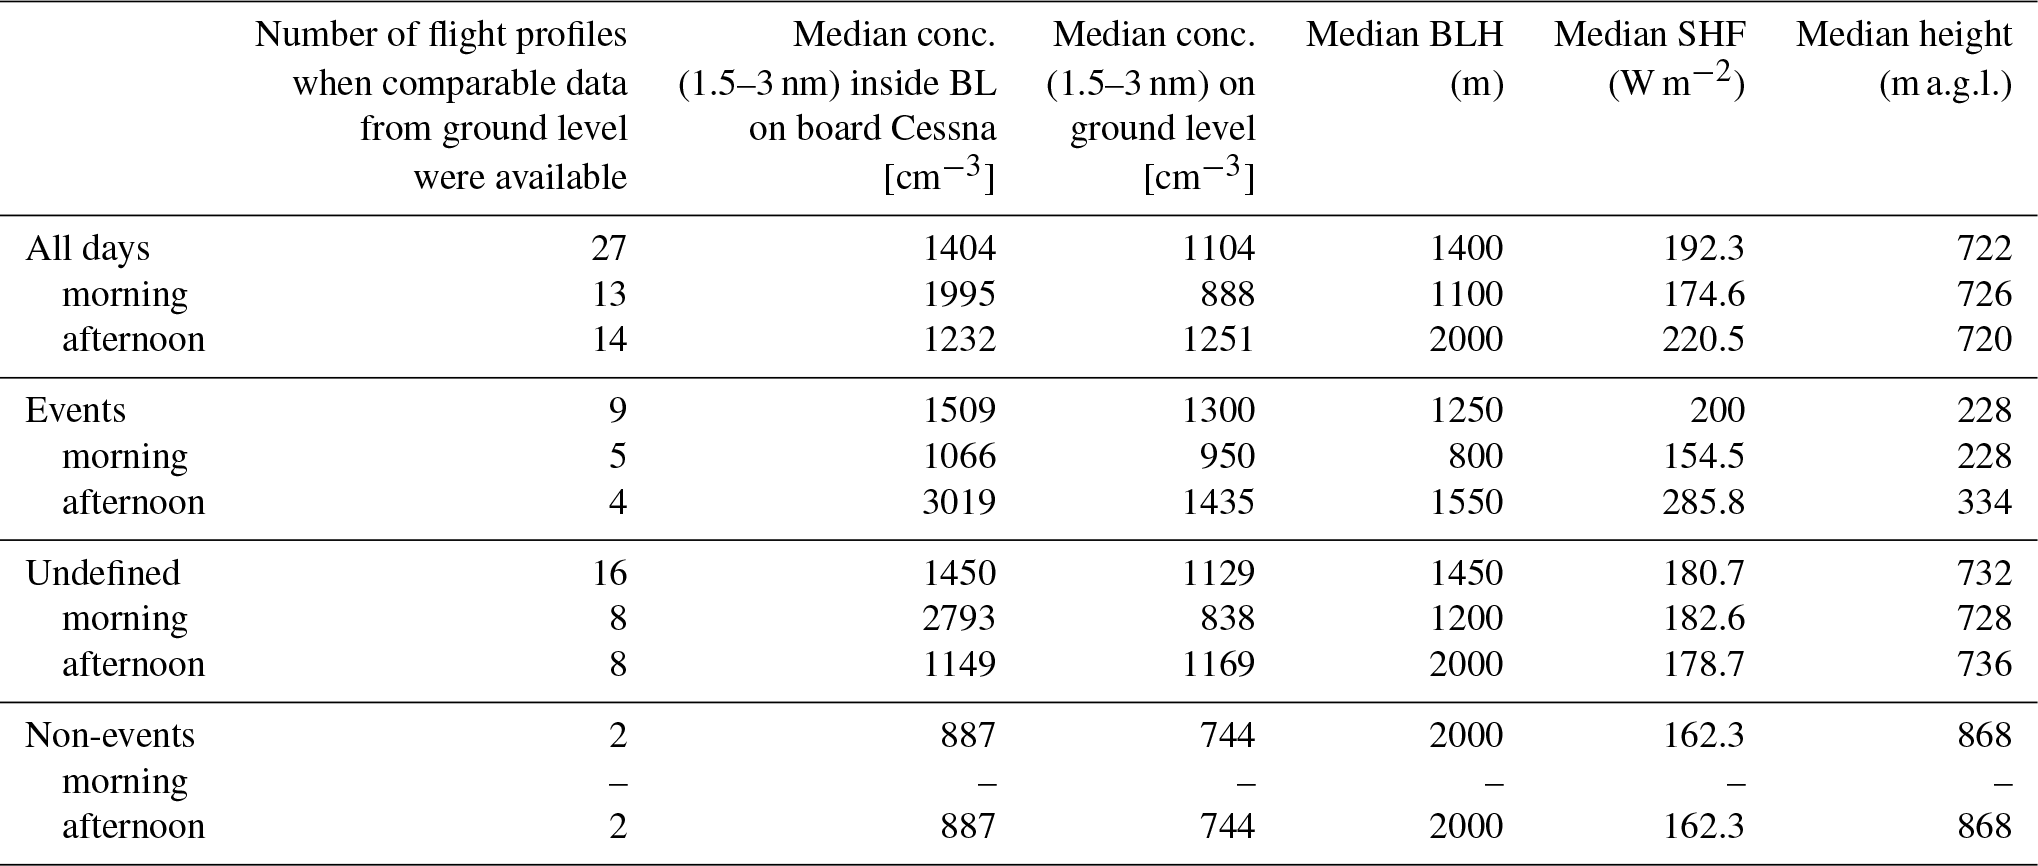
On average, we found that the concentrations of 1.5–3 nm particles were higher on board the aircraft (inside the BL) (1400 cm−3) than at the ground station level (1100 cm−3) (hereafter referred to as “ground”). The observation of having somewhat lower concentrations of small particles at the ground level is probably due to higher sinks of particles and their precursors inside the canopy compared with above-canopy air (Tammet et al., 2006; Zha et al., 2018). The values were the highest on NPF event days (1500 cm−3 on board the aircraft (inside the BL) and 1300 cm−3 on the ground) and undefined days (1450 cm−3 on board the aircraft (inside the BL) and 1130 cm−3 on the ground) and clearly the lowest on non-event days both on board the aircraft (inside the BL) (890 cm−3) and on the ground level (740 cm−3). It should be noted that two non-event profiles were measured during the same afternoon in the spring of 2015.
The median BLH of all the profiles was 1400 m, being lower in the morning (1100 m) and higher during the afternoon flights (2000 m). Indicative of stronger vertical mixing, the median value of the sensible heat flux was the highest on the NPF event days, especially during the afternoon (286 W m−2).
Figure 2 shows the median vertical profiles of the total particle number concentration in the size ranges of 1.5–3 and 3–10 nm separately for the NPF event days, undefined days and one non-event day. The profiles typically contain data from 100 up to 2700 m a.g.l. It is noticeable that the non-event profile consists of only two vertical profiles and that both of them were measured on the same afternoon. We found that airborne 1.5–3 nm particle concentrations were similar between the event and undefined days, whereas substantially lower concentrations were observed on non-event days. We also observed that during the event days there were clearly more 3–10 nm particles inside the BL (on board the aircraft) than during undefined days (Fig. 2a and b). The reason for this could be that during the undefined days the formation of sub-3 nm particles took place, yet the conditions were not suitable for particle growth to larger sizes (see Buenrostro Mazon et al., 2009; Kulmala et al., 2013). Our findings are consistent with earlier observations of high sub-3 nm particle concentrations in Hyytiälä on both event and undefined days compared with non-event days (Lehtipalo et al., 2009; Dada et al., 2017).
During NPF event days, the median and 25th and 75th percentiles show that the concentration of sub-3 nm particles was relatively the highest right above the canopy top. This indicates that the sources of particles and their precursor vapours are near the ground level. During the undefined days, the origin of sub-3 nm particles was not necessarily at the ground level, as their concentration decreased right above the ground level (from 100 to 200 m). In addition, reviewing the median values in Table 1, the concentration of 1.5–3 nm particles was observed to be higher inside the BL (on board the aircraft) during morning on undefined days (2800 cm−3) than during afternoon (1150 cm−3), opposite to event days (1070 and 3020 cm−3, respectively), which supports this hypothesis (Table 1). The concentrations of both sub-3 nm and 3–10 nm particles were very low during the non-event days and we did not observe any clear layers for these particles. However, it should be noted that our study included only two such profiles, since the flight measurements were not possible to conduct during non-event days due to meteorological conditions, especially cloudiness.
The measurement flights were conducted either in the morning (07:00–12:00, UTC+2) or in the afternoon (12:00–15:00). We studied the median vertical particle concentrations separately for those two times in order to estimate the effect of mixing strength on the vertical profile of particles on NPF event and undefined days. As expected based on observed SHF fluxes, we found that the concentrations of 1.5–3 nm particles inside the BL (on board the aircraft) were, on average, the most homogenous vertically during the afternoons of the NPF event days (Fig. 3).
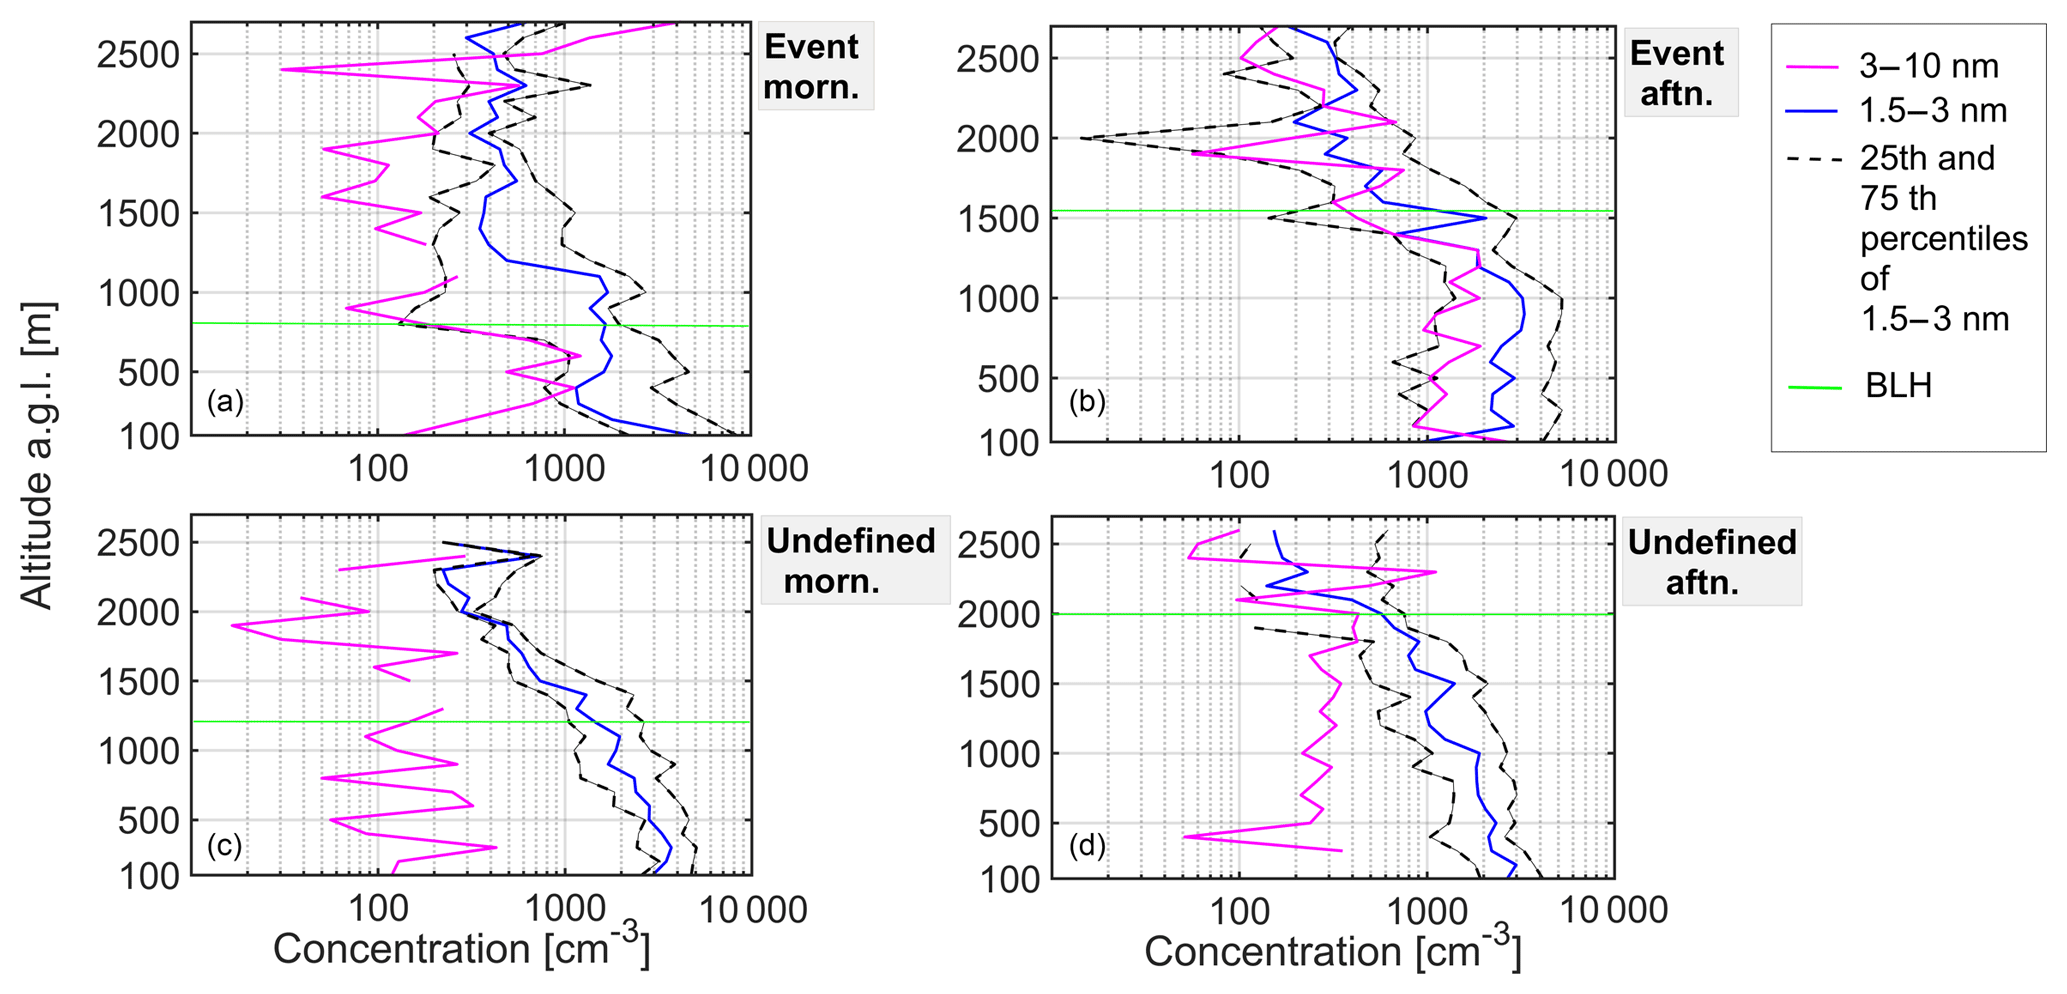
Figure 3Median concentrations in two size ranges (1.5–3 and 3–10 nm) and 25th and 75th percentiles of 1.5–3 nm particle concentration over measurement profiles during event and undefined days separately for morning (a, c) (07:00–12:00) and afternoon (b, d) (12:00–15:00). The median vertical profiles were defined over 9 event mornings, 8 event afternoons, 18 undefined mornings and 16 undefined afternoons. Median boundary layer heights are marked by green lines.
On NPF event days, we can see an interesting layer of 3–10 nm particles in the morning above the BL at 2400 m. From this layer, the particles can mix down into the evolving BL. A similar behaviour is seen on undefined days, when an increase in concentration of 1.5–3 nm particles is observed in the layer right below 2500 m in the morning and the particles are grown in size and mix downward until afternoon.
3.2 Diurnal variation of particle concentration at different altitudes in the lower atmosphere
We studied the median diurnal variation of total particle concentration (all particles >1.5 nm) and, separately, particle concentration in the size range 1.5–3 nm at different altitudes from 100 to 2700 m a.g.l. around the SMEAR II area. The study included 17 vertical measurement profiles during event days and 34 during undefined days. From Fig. 4a it can be seen that the total particle number concentration over all measurement profiles was the highest near the ground in the morning. The aerosol population mixed with cleaner air within the evolving BL after the morning, which led to a decreasing particle number concentration, whereas the concentration increased again towards the afternoon, presumably as a result of NPF. The highest particle number concentrations were observed at 11:30–14:30 inside the BL (on board the aircraft), which coincides with the peak time of NPF in Hyytiälä (Dada et al., 2018).
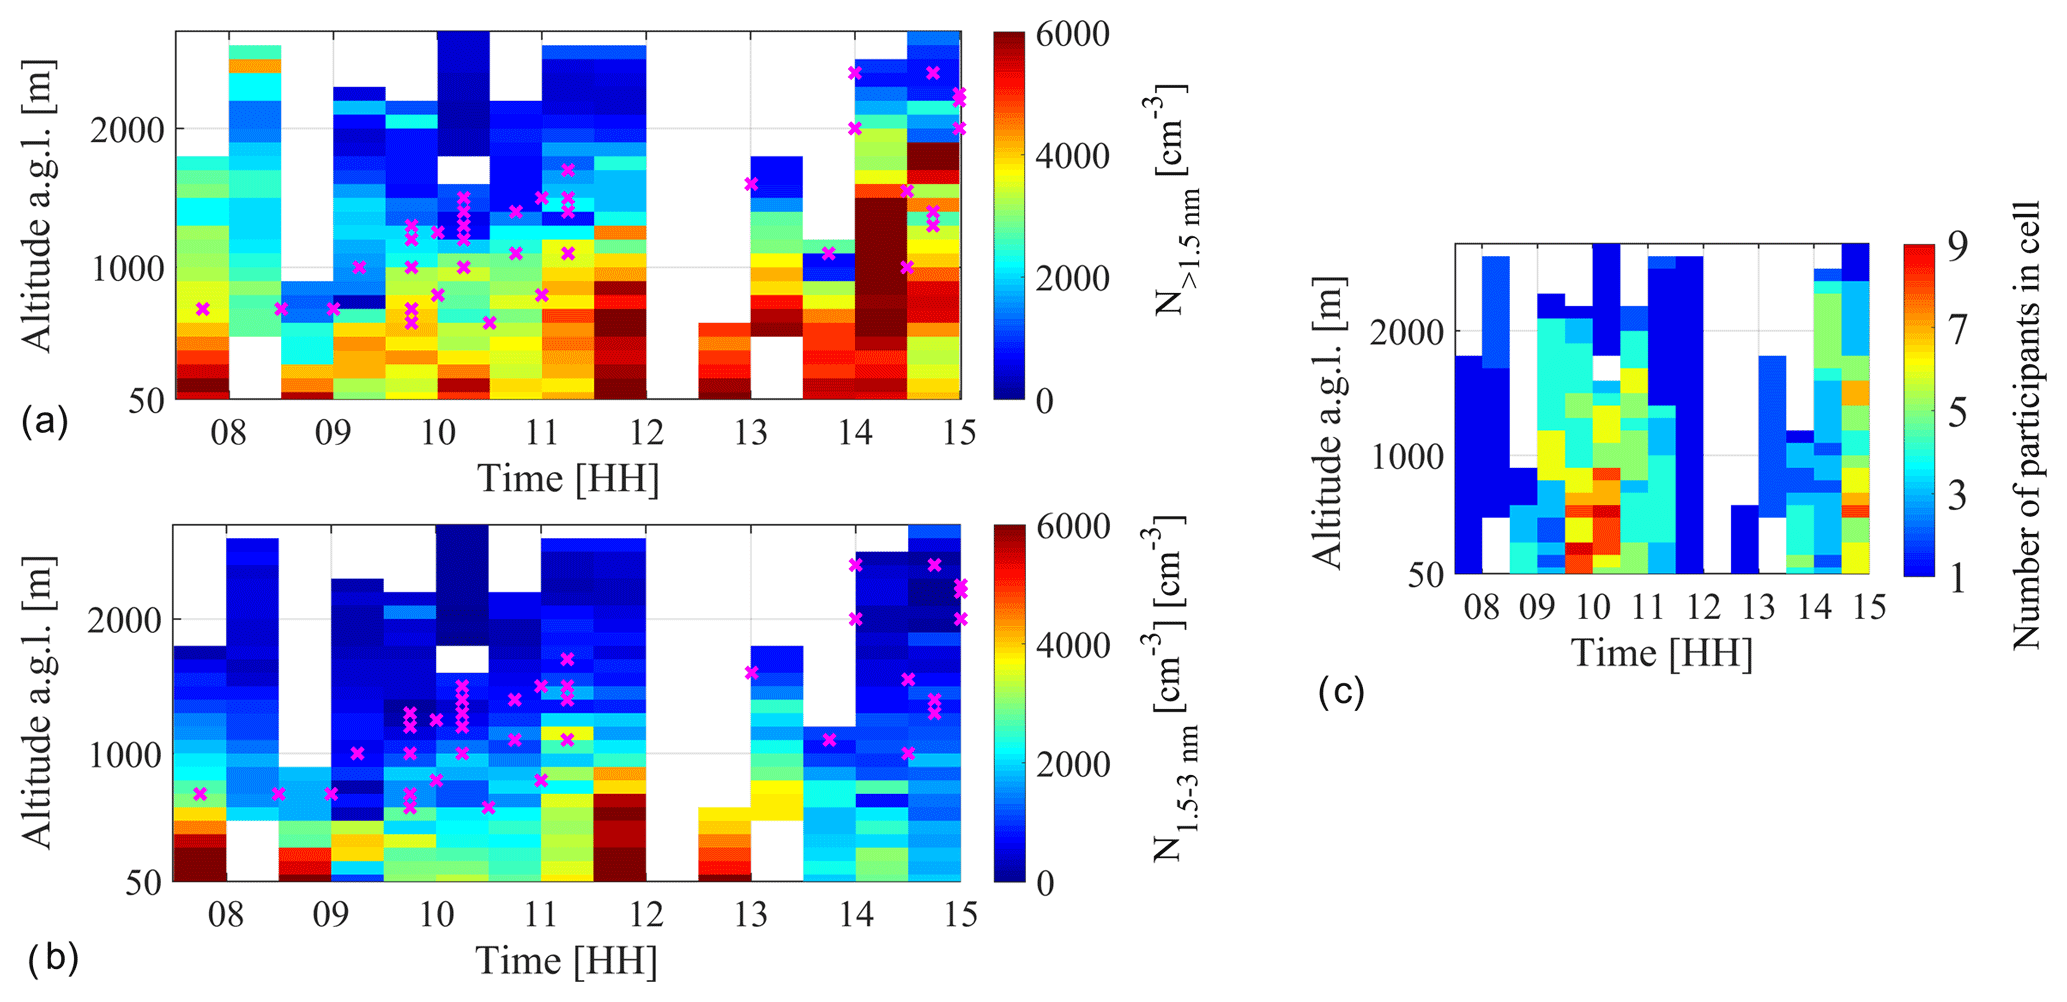
Figure 4Panel (a) shows median total particle number concentration at different altitudes calculated over 51 measurement flight profiles (for 17 event days and 34 undefined days) during spring and August 2015 and spring 2017 campaigns at a 30 km maximum distance from SMEAR II. The total particle number concentration was measured with PSM with a cut-off size of 1.5 nm. Colour scale indicates total number concentration. Panel (b) shows median particle number concentration in the size range of 1.5–3 nm at different altitudes. The value is defined as the difference of total number concentrations with different cut-off sizes: PSM (1.5 nm) and uCPC (3 nm). Panel (c) shows the number of data points in each cell of panels (a)–(b). Estimated boundary layer heights are marked as crosses in panels (a)–(b) over flight profiles. Each cell includes the median value of all measurement points inside the 100 m bin and 30 min.
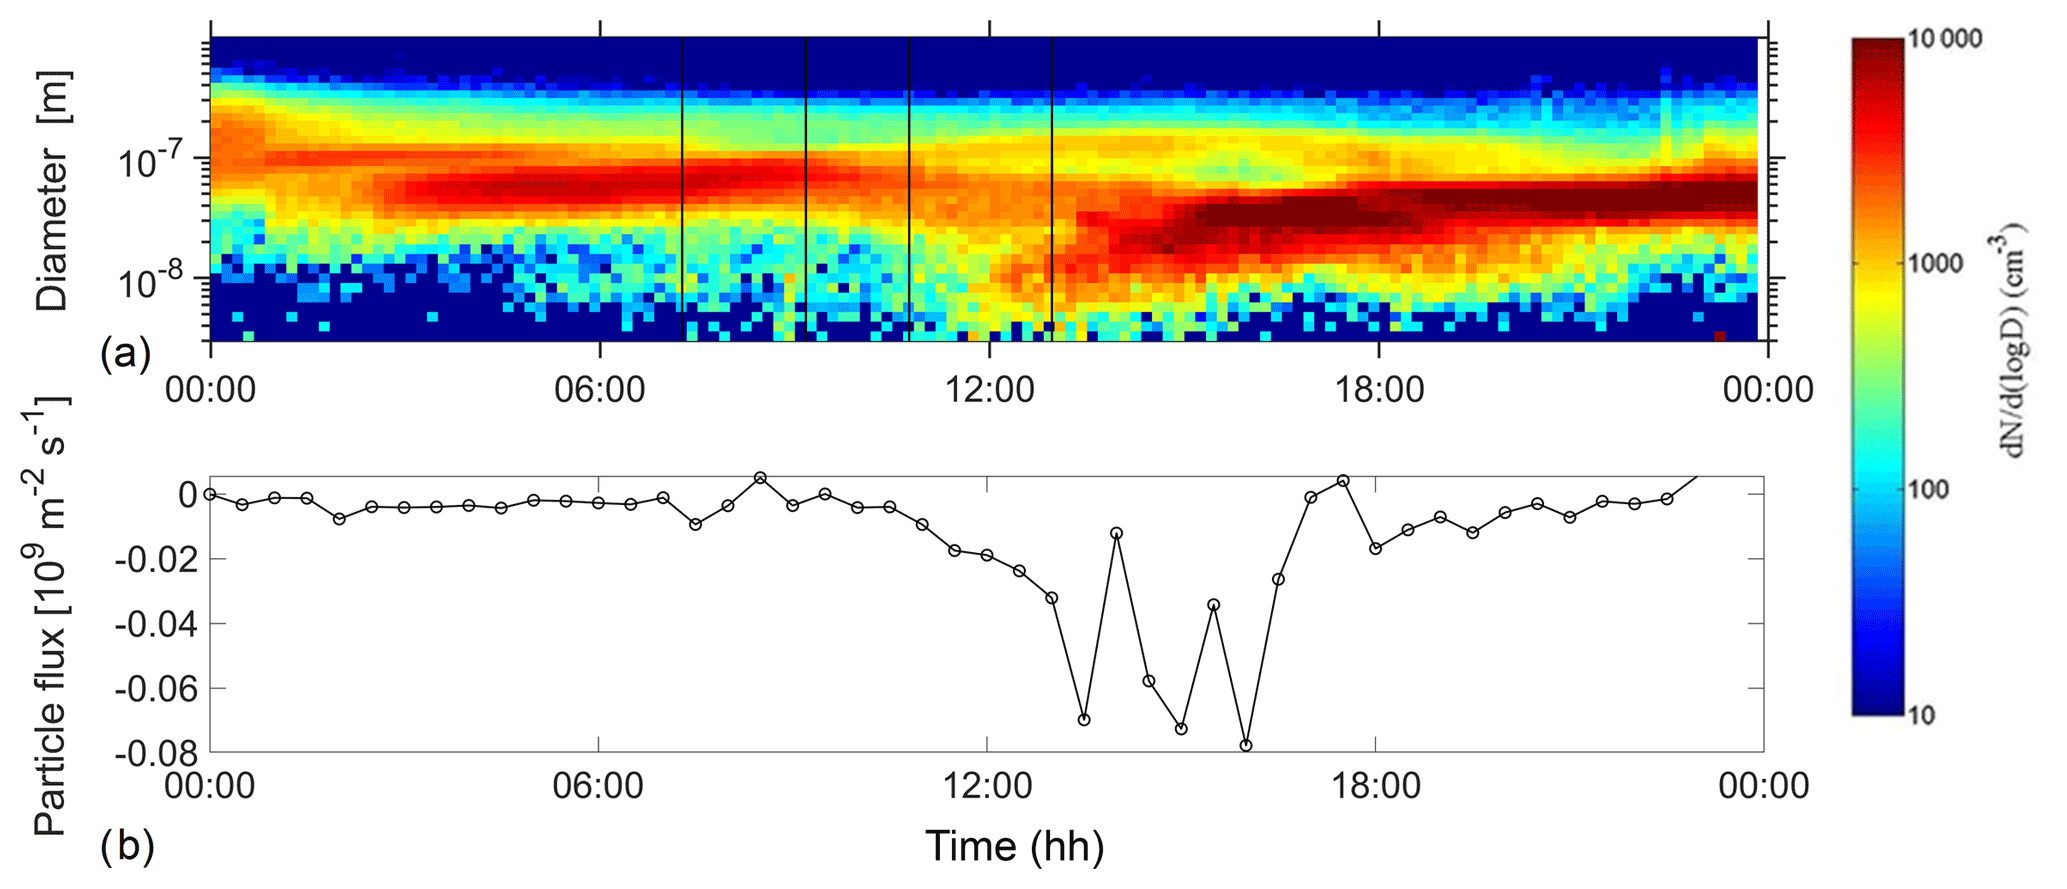
Figure 5New particle formation event at SMEAR II in Hyytiälä on 13 August 2015. Panel (a) shows the number size distribution measured by a differential mobility particle sizer at ground level inside the forest canopy. Start and end times of two measurement flights are marked by vertical lines in figure. Panel (b) shows the particle flux measured at 23 m a.g.l. at the station. Negative particle flux indicates particle flux downwards.
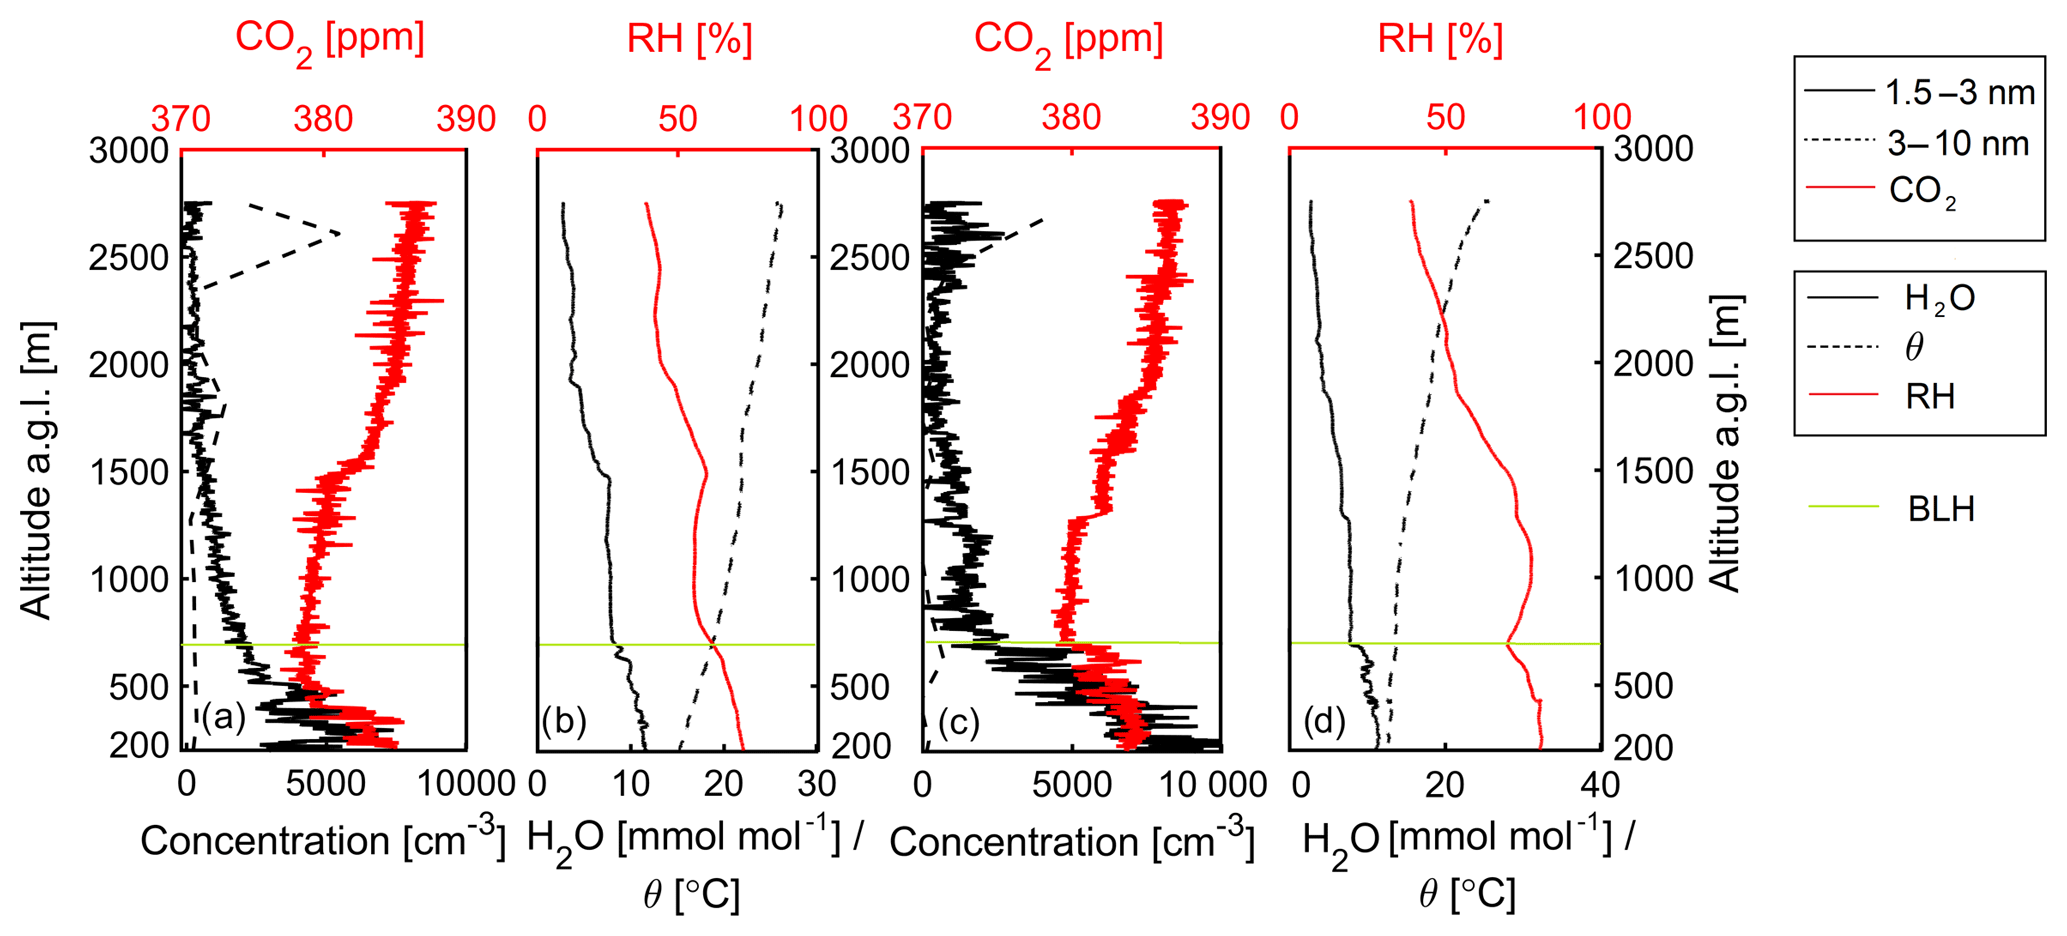
Figure 6Vertical profiles during the first measurement flight at 07:30–09:00 on 13 August 2015 (marked in Fig. 5). Panels (a) and (b) show data from the ascent and panels (c) and (d) from the descent. Panels (a) and (c) show the number concentration of 1.5–3 nm (black solid line) and 3–10 nm (dashed line) particles and the carbon dioxide concentration (red). Panels (b) and (d) show water vapour concentration (black), relative humidity (red) and potential temperature (dashes line) profiles. The green line is the estimated boundary layer height.
The sub-3 nm particle number concentrations (Fig. 4b) were the highest in the morning near the ground level, with a second maximum around noon. Later in the afternoon, the sub-3 nm particle concentration was clearly lower, probably because these particles apparently grew efficiently to larger sizes and contributed significantly to the total particle concentration (Yli-Juuti et al., 2011). Both total particles and sub-3 nm particles had the highest concentrations near the ground level throughout the day, even though especially the total particle population seems to have been spread within the whole mixed layer.
Figure 4c shows the data availability for this analysis. It is noticeable that the number of data in each 100 m 30 min cell varies considerably. In addition, one intense NPF event day with strong particle formation in the early morning dominated the distribution due to the low number of flights at around 07:00–08:00. Most of the data were collected either during the morning (08:30–11:30) or afternoon (13:30–15:00). As we know, the BLH, mixing of air and meteorological conditions can also differ significantly even within 1 day, especially between the NPF event and undefined days.
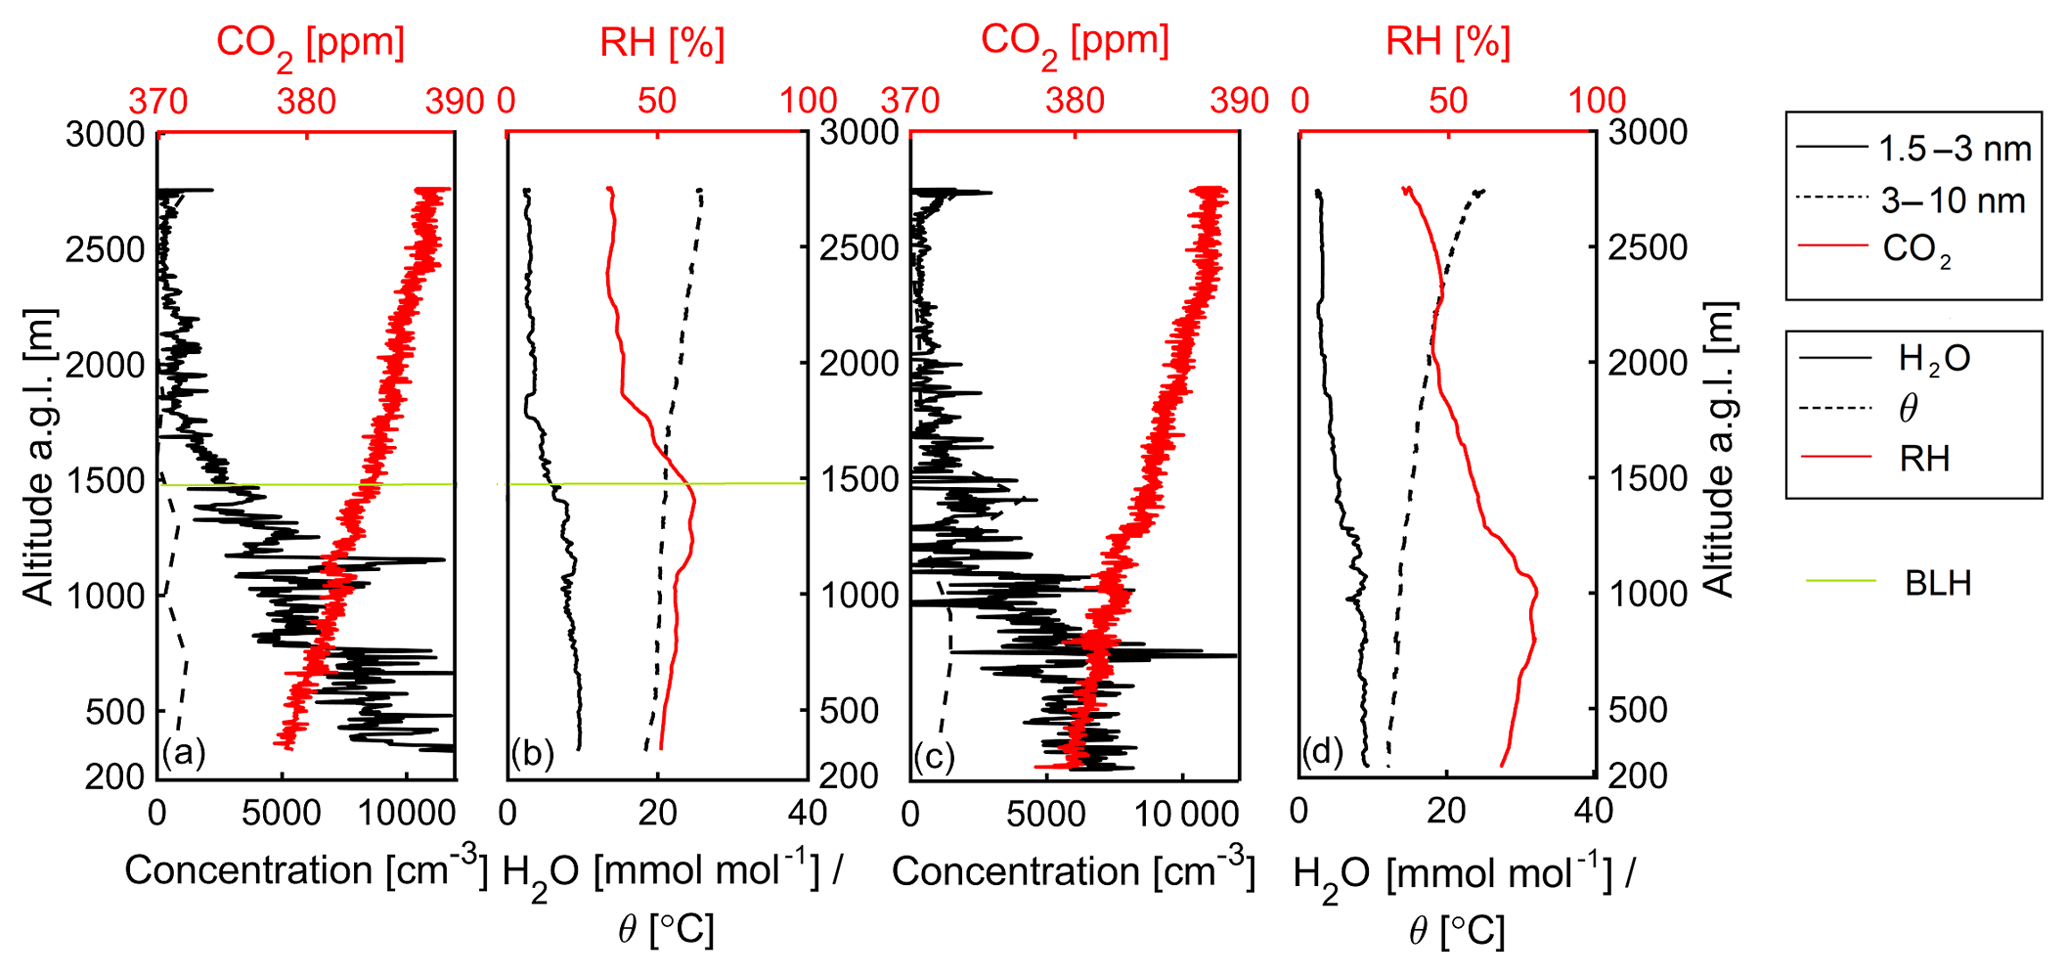
Figure 7Measurement profiles like in the previous figure, but during the second measurement flight on 13 August 2015 at 11:00–12:45
3.3 Case study – NPF in evolving BL
13 August 2015 was an intense NPF event day in Hyytiälä (Fig. 5a). During that day we conducted two measurement flights around SMEAR II and observed the particle concentration in size range of 1.5–3 nm to follow the development of BL and turbulent mixing (Figs. 6a, c, 7a, c). During the first measurement flight at 07:30–09:00, we observed a clear layer of 3–10 nm particles near the FT region above 2300 m. These particles were mixed down before the afternoon flight, as this population was no longer observed during that flight. The negative (downwards) particle flux at SMEAR II after 12:00 supports this hypothesis (Fig. 5b).
The estimated BLH was ∼500–700 m during the first flight in the morning and had risen up to 1500–1700 m by the afternoon flight. Below the FT, the vertical variation of the 1.5–3 nm particle concentration was larger compared to the stable conditions in the FT. The median concentration of 1.5–3 nm particles inside the BL (on board the aircraft) decreased from the morning flight (7300 cm−3 during the ascent and 6300 cm−3 during the descent; Fig. 6a and c) to the afternoon flight (∼2500 cm−3; Fig. 7a and c), whereas 3–10 nm particles seemed to behave in an opposite manner (350, 200, 850 and 1450 cm−3). The sub-3 nm particle concentrations were clearly higher inside the BL (on board the aircraft) than in the FT, and the concentration increased towards the ground. This is consistent with organic vapours emitted from the ground vegetation participating in NPF and growth (Kulmala et al., 2013; Ehn et al., 2014).
Small 1.5–3 nm particles were observed inside the convective BL on board a Cessna aircraft. On average, the highest concentrations of sub-3 nm particles were found during NPF event mornings above the forest canopy top. This points towards the forest being an important source of precursor vapours for newly formed particles. Due to convective mixing inside the BL, small particles near the ground started to mix up, while sub-10 nm particles mixed down from the FT region. Strong vertical mixing was more typical for the NPF event days than for the undefined and non-event days, especially during the afternoon. The concentration of sub-3 nm particles was clearly higher inside the BL (on board the aircraft) on both NPF event days and undefined days compared with one non-event day, but their vertical variation was somewhat different, reflecting the different mixing conditions. The event days also showed a clear increase in 3–10 nm particles in the afternoon, which was missing on undefined days when the NPF process had been interrupted.
We found that airborne and on-ground median concentrations of sub-3 nm particles were mostly in good agreement. Some differences still existed, which can be explained by poor vertical mixing of air, changes in air mass origins and regional variations. The concentrations of sub-3 nm particles on the ground were, on average, somewhat lower than airborne observations, which indicates a higher sink for these particles inside the forest canopy.
This study increases our understanding of the first steps of atmospheric NPF inside the whole BL and the connections between atmospheric mixing and NPF. The next step would be to investigate different formation pathways in more detail. To achieve this, it would be important to also determine the chemical composition of particles above the ground level so that we could more specifically assess the possible sources of the precursor gases. In addition, the contribution of mesoscale convection-induced movement, like roll vortices, to NPF is currently under investigation.
The flight data can be assessed at https://doi.org/10.5281/zenodo.2608897 (Leino et al., 2019).
Data measured at SMEAR II are available on the web page: https://avaa.tdata.fi/web/smart/ (last access: 27 March 2019).
Event classification is available from Katri Leino (katri.e.leino@helsinki.fi) upon request.
KL, JL and RV designed the experiments and installed the instrumentation. FK, ES, HL and TM took part in installation and instrumentation rack developments. The measurement flights were carried out by KL, JL, RV, PP, AM, LD, AN and DW. SBM made NPF event forecasts. PA, LA, JK, PK and JE helped with instrumentation calibrations. KL prepared the paper with contributions from all co-authors.
The authors declare that they have no conflict of interest.
This article is part of the special issue “Pan-Eurasian Experiment (PEEX)”. It is not associated with a conference.
This work was supported by the European Research Council via ERC Advanced Grant ATM-GTP (742206), the European Commission via project H2020-INFRAIA-2014-2015 and project ACTRIS-2 (Aerosols, Clouds, and Trace gases Research InfraStructure), the H2020 research and innovation 345 programme under grant agreement no. 689443 (ERAPLANET) via project iCUPE (Integrative and Comprehensive Understanding on Polar Environments), FP7 project BACCHUS (Impact of Biogenic versus Anthropogenic emissions on Clouds and Climate: towards a Holistic UnderStanding, FP7-603445), the Academy of Finland via Centre of Excellence in Atmospheric Sciences (272041) and NanoBiomass (307537).
This paper was edited by Aijun Ding and reviewed by three anonymous referees.
Boy, M., Hellmuth, O., Korhonen, H., Nilsson, E. D., ReVelle, D., Turnipseed, A., Arnold, F., and Kulmala, M.: MALTE – model to predict new aerosol formation in the lower troposphere, Atmos. Chem. Phys., 6, 4499–4517, https://doi.org/10.5194/acp-6-4499-2006, 2006.
Bianchi, F., Tröstl, J., Junninen, H., Frege, C., Henne, S., Hoyle, C. R., Molteni, U., Herrmann, E., Adamov, A., Bukowiecki, N., Chen, X., Duplissy, J., Gysel, M., Hutterli, M., Kangasluoma, J., Kontkanen, J., Kürten, A., Manninen, H. E., Münch, S., Peräkylä, O., Petäjä, T., Rondo, L., Williamson, C., Weingartner, E., Curtius, J., Worsnop, D. R., Kulmala, M., Dommen, J., and Baltensperger, U.: New particle formation in the free troposphere: A question of chemistry and timing, Science, 352, 1109–1112, https://doi.org/10.1126/science.aad5456, 2016.
Buenrostro Mazon, S., Riipinen, I., Schultz, D. M., Valtanen, M., Dal Maso, M., Sogacheva, L., Junninen, H., Nieminen, T., Kerminen, V.-M., and Kulmala, M.: Classifying previously undefined days from eleven years of aerosol-particle-size distribution data from the SMEAR II station, Hyytiälä, Finland, Atmos. Chem. Phys., 9, 667–676, https://doi.org/10.5194/acp-9-667-2009, 2009.
Chen, H., Hodshire, A. L., Ortega, J., Greenberg, J., McMurry, P. H., Carlton, A. G., Pierce, J. R., Hanson, D. R., and Smith, J. N.: Vertically resolved concentration and liquid water content of atmospheric nanoparticles at the US DOE Southern Great Plains site, Atmos. Chem. Phys., 18, 311–326, https://doi.org/10.5194/acp-18-311-2018, 2018.
Crumeyrolle, S., Manninen, H. E., Sellegri, K., Roberts, G., Gomes, L., Kulmala, M., Weigel, R., Laj, P., and Schwarzenboeck, A.: New particle formation events measured on board the ATR-42 aircraft during the EUCAARI campaign, Atmos. Chem. Phys., 10, 6721–6735, https://doi.org/10.5194/acp-10-6721-2010, 2010.
Dada, L., Paasonen, P., Nieminen, T., Buenrostro Mazon, S., Kontkanen, J., Peräkylä, O., Lehtipalo, K., Hussein, T., Petäjä, T., Kerminen, V.-M., Bäck, J., and Kulmala, M.: Long-term analysis of clear-sky new particle formation events and nonevents in Hyytiälä, Atmos. Chem. Phys., 17, 6227–6241, https://doi.org/10.5194/acp-17-6227-2017, 2017.
Dada, L., Chellapermal, R., Buenrostro Mazon, S., Paasonen, P., Lampilahti, J., Manninen, H. E., Junninen, H., Petäjä, T., Kerminen, V.-M., and Kulmala, M.: Refined classification and characterization of atmospheric new-particle formation events using air ions, Atmos. Chem. Phys., 18, 17883–17893, https://doi.org/10.5194/acp-18-17883-2018, 2018.
Dal Maso, M., Kulmala, M., Riipinen, I., Wagner, R., Hussein, T., Aalto, P. P., and Lehtinen, K. E. J.: Formation and growth of fresh atmospheric aerosols: eight years of aerosol size distribution data from SMEAR II, Hyytiälä, Finland, Boreal Environ. Res., 10, 323–336, 2005.
Ehn, M., Thornton, J. A., Kleist, E., Sipilä, M., Junninen, H., Pullinen, I., Springer, M., Rubach, F., Tillmann, R., Lee, B., Lopez-Hilfiker, F., Andres, S., Acir, I.-H., Rissanen, M., Jokinen, T., Schobesberger, S., Kangasluoma, J., Kontkanen, J., Nieminen, T., Kurtén, T., Nielsen, L. B., Jørgensen, S., Kjaergaard, H. G., Canagaratna, M., Maso, M. D., Berndt, T., Petäjä, T., Wahner, A., Kerminen, V.-M., Kulmala, M., Worsnop, D. R., Wildt, J., and Mentel, T. F.: A large source of low-volatility secondary organic aerosol, Nature, 506, 476–479, https://doi.org/10.1038/nature13032, 2014.
Hari, P. and Kulmala, M.: Station for Measuring Ecosystem-Atmosphere Relations (SMEAR II), Boreal Environ. Res., 10, 315–322, 2005.
Hermann, M. and Wiedensohler, A.: Counting efficiency of condensation particle counters at low-pressures with illustrative data from the upper troposphere, J. Aerosol Sci., 32, 975–991, https://doi.org/10.1016/S0021-8502(01)00037-4, 2001.
Kangasluoma, J., Franchin, A., Duplissy, J., Ahonen, L., Korhonen, F., Attoui, M., Mikkilä, J., Lehtipalo, K., Vanhanen, J., Kulmala, M., and Petäjä, T.: Operation of the Airmodus A11 nano Condensation Nucleus Counter at various inlet pressures and various operation temperatures, and design of a new inlet system, Atmos. Meas. Tech., 9, 2977–2988, https://doi.org/10.5194/amt-9-2977-2016, 2016.
Kerminen, V.-M., Petäjä, T., Manninen, H. E., Paasonen, P., Nieminen, T., Sipilä, M., Junninen, H., Ehn, M., Gagné, S., Laakso, L., Riipinen, I., Vehkamäki, H., Kurten, T., Ortega, I. K., Dal Maso, M., Brus, D., Hyvärinen, A., Lihavainen, H., Leppä, J., Lehtinen, K. E. J., Mirme, A., Mirme, S., Hõrrak, U., Berndt, T., Stratmann, F., Birmili, W., Wiedensohler, A., Metzger, A., Dommen, J., Baltensperger, U., Kiendler-Scharr, A., Mentel, T. F., Wildt, J., Winkler, P. M., Wagner, P. E., Petzold, A., Minikin, A., Plass-Dülmer, C., Pöschl, U., Laaksonen, A., and Kulmala, M.: Atmospheric nucleation: highlights of the EUCAARI project and future directions, Atmos. Chem. Phys., 10, 10829–10848, https://doi.org/10.5194/acp-10-10829-2010, 2010.
Kerminen, V.-M., Chen, X., Vakkari, V., Petäjä, T., Kulmala, M., and Bianchi, F.: Atmospheric new particle formation: a review of field observations, Environ. Res. Lett., 13, 103003, https://doi.org/10.1088/1748-9326/aadf3c, 2018.
Kulmala, M. and Kerminen, V.-M.: On the formation and growth of atmospheric nanoparticles, Atmos. Res., 90, 132–150, https://doi.org/10.1016/j.atmosres.2008.01.005, 2008.
Kulmala, M., Hämeri, K., Aalto, P. P., Mäkelä, J. M., Pirjola, L., Nilsson, E. D., Buzorius, G., Rannik, Ü., Dal Maso, M., Seidl, W., Hoffman, T., Janson, R., Hansson, H.-C., Viisanen, Y., Laaksonen, A., and O'Dowd, C. D.: Overview of the international project on biogenic aerosol formation in the boreal forest (BIOFAR), Tellus B, 53, 324–343, https://doi.org/10.1034/j.1600-0889.2001.530402.x, 2001.
Kulmala, M., Vehkamäki, H., Petäjä, T., Dal Maso, M., Lauri, A., Kerminen, V.-M., Birmili, W., and McMurry, P. H.: Formation and growth rates of ultrafine atmospheric particles: A review of observations, J. Aerosol Sci., 35, 143–176, https://doi.org/10.1016/j.jaerosci.2003.10.003, 2004.
Kulmala, M., Kontkanen, J., Junninen, H., Lehtipalo, K., Manninen, H. E., Nieminen, T., Petäjä, T., Sipilä, M., Schobesberger, S., Rantala, P., Franchin, A., Jokinen, T., Järvinen, E., Äijälä, M., Kangasluoma J., Hakala, J., Aalto, P. P., Paasonen, P., Mikkilä, J., Vanhanen, J., Aalto, J., Hakola, H., Makkonen, U., Ruuskanen, T., Mauldin, R. L., Duplissy, J., Vehkamäki, H., Bäck, J., Kortelainen, A., Riipinen, I., Kurtén, T., Johnson, M. V., Smith, J. N., Ehn, M., Mentel, T. F., Lehtinen, K. E. J., Laaksonen, A., Kerminen, V.-M., and Worsnop, D. R.: Direct observations of atmospheric aerosol nucleation, Science, 339, 943–946, https://doi.org/10.1126/science.1227385, 2013.
Laakso, L., Gronholm, T., Kulmala, L., Haapanala, S., Hirsikko, A., Lovejoy, E. R., Kazil, J., Kurten, T., Boy, M., Nilsson, E. D., Sogachev, A., Riipinen, I., Stratmann, F., and Kulmala, M.: Hot-air balloon as a platform for boundary layer profile measurements during particle formation, Boreal Environ. Res., 12, 279–294, 2007.
Lauros, J., Sogachev, A., Smolander, S., Vuollekoski, H., Sihto, S.-L., Mammarella, I., Laakso, L., Rannik, Ü., and Boy, M.: Particle concentration and flux dynamics in the atmospheric boundary layer as the indicator of formation mechanism, Atmos. Chem. Phys., 11, 5591–5601, https://doi.org/10.5194/acp-11-5591-2011, 2011.
Lehtipalo, K., Sipilä, M., Riipinen, I., Nieminen, T., and Kulmala, M.: Analysis of atmospheric neutral and charged molecular clusters in boreal forest using pulse-height CPC, Atmos. Chem. Phys., 9, 4177–4184, https://doi.org/10.5194/acp-9-4177-2009, 2009.
Leino, K., Lampilahti, J., Poutanen, P., Väänänen, R., Manninen, A., Buenrostro Mazon, S., Dada, L., Franck, A., Wimmer, D., Aalto, P. P., Ahonen, L., Enroth, J., Kangasluoma, J., Keronen, P., Korhonen, F., Laakso, H., Matilainen, T., Siivola, E., Manninen, H. E., Lehtipalo, K., Kerminen, V.-M., Petäjä, T., and Kulmala, M.: Airborne measurements of aerosols, trace gases and meteorological variables on board a Cessna 172 aircraft (2015 and 2017): dataset, Zenodo, https://doi.org/10.5281/zenodo.2608897, 2019.
Mirme, S., Mirme, A., Minikin, A., Petzold, A., Hõrrak, U., Kerminen, V.-M., and Kulmala, M.: Atmospheric sub-3 nm particles at high altitudes, Atmos. Chem. Phys., 10, 437–451, https://doi.org/10.5194/acp-10-437-2010, 2010.
O'Dowd, C. D., Yoon, Y. J., Junkermann, W., Aalto, P., Kulmala, M., Lihavainen, H., and Viisanen, Y.: Airborne measurements of nucleation mode particles II: boreal forest nucleation events, Atmos. Chem. Phys., 9, 937–944, https://doi.org/10.5194/acp-9-937-2009, 2009.
Platis, A., Altstäder, B., Wehner, B., Wildmann, N., Lampert, A., Hermann, M., Birmili, W., and Bange, J.: An observational case study on the influence of atmospheric boundary-layer dynamics on new particle formation, Bound.-Lay. Meteorol., 158, 67–92, https://doi.org/10.1007/s10546-015-0084-y, 2016.
Rannik, Ü., Petäjä, T., Buzorius, G., Aalto, P., Vesala, T., and Kulmala, M.: Deposition Velocities of Nucleation Mode Particles into a Scots Pine Forest, Environ. Chem. Phys., 22, 97–102, 2000.
Schobesberger, S., Väänänen, R., Leino, K., Virkkula, A., Backman, J., Pohja, T., Siivola, E., Franchin, A., Mikkila, J., Paramonov, M., Aalto, P. P., Krejci, R., Petaja, T., and Kulmala, M.: Airborne measurements over the boreal forest of southern Finland during new particle formation events in 2009 and 2010, Boreal Environ. Res., 18, 145–163, 2013.
Siebert, H., Stratmann, F., and Wehner, B.: First observations of increased ultrafine particle number concentrations near the inversion of a continental planetary boundary layer and its relation to ground-based measurements, Geophys. Res. Lett., 31, L09102, https://doi.org/10.1029/2003GL019086, 2004.,
Stull, R. B.: An introduction to boundary layer meteorology, Kluwer Academic Publishers, Dordrecht, 2012.
Takegawa, N., Iida, K., and Sakurai, H.: Modification and laboratory evaluation of a TSI ultrafine condensation particle counter (Model 3776) for airborne measurements, Aerosol Sci. Tech., 51, 235–245, https://doi.org/10.1080/02786826.2016.1261990, 2017.
Tammet, H., Hõrrak, U., Laakso, L., and Kulmala, M.: Factors of air ion balance in a coniferous forest according to measurements in Hyytiälä, Finland, Atmos. Chem. Phys., 6, 3377–3390, https://doi.org/10.5194/acp-6-3377-2006, 2006.
Väänänen, R., Krejci, R., Manninen, H. E., Manninen, A., Lampilahti, J., Buenrostro Mazon, S., Nieminen, T., Yli-Juuti, T., Kontkanen, J., Asmi, A., Aalto, P. P., Keronen, P., Pohja, T., O'Connor, E., Kerminen, V.-M., Petäjä, T., and Kulmala, M.: Vertical and horizontal variation of aerosol number size distribution in the boreal environment, Atmos. Chem. Phys. Discuss., https://doi.org/10.5194/acp-2016-556, in review, 2016.
Vanhanen, J., Mikkilä, J., Lehtipalo, K., Sipilä, M., Manninen, H., Siivola, E., Petäjä, T., and Kulmala, M.: Particle size magnifier for nano-CN detection, Aerosol Sci. Tech., 45, 533–542, https://doi.org/10.1080/02786826.2010.547889, 2011.
Wehner, B., Siebert, H., Stratmann, F., Tuch, T., Wiedensohler, A., Petäjä, T., Dal Maso, M., and Kulmala, M.: Horizontal homogeneity and vertical extent of new particle formation events, Tellus, 59, 362–371, https://doi.org/10.1111/j.1600-0889.2007.00260.x, 2007.
Wehner, B., Siebert, H., Ansmann, A., Ditas, F., Seifert, P., Stratmann, F., Wiedensohler, A., Apituley, A., Shaw, R. A., Manninen, H. E., and Kulmala, M.: Observations of turbulence-induced new particle formation in the residual layer, Atmos. Chem. Phys., 10, 4319–4330, https://doi.org/10.5194/acp-10-4319-2010, 2010.
Wehner, B., Werner, F., Ditas, F., Shaw, R. A., Kulmala, M., and Siebert, H.: Observations of new particle formation in enhanced UV irradiance zones near cumulus clouds, Atmos. Chem. Phys., 15, 11701–11711, https://doi.org/10.5194/acp-15-11701-2015, 2015.
Yli-Juuti, T., Nieminen, T., Hirsikko, A., Aalto, P. P., Asmi, E., Hõrrak, U., Manninen, H. E., Patokoski, J., Dal Maso, M., Petäjä, T., Rinne, J., Kulmala, M., and Riipinen, I.: Growth rates of nucleation mode particles in Hyytiälä during 2003–2009: variation with particle size, season, data analysis method and ambient conditions, Atmos. Chem. Phys., 11, 12865–12886, https://doi.org/10.5194/acp-11-12865-2011, 2011.
Zha, Q., Yan, C., Junninen, H., Riva, M., Sarnela, N., Aalto, J., Quéléver, L., Schallhart, S., Dada, L., Heikkinen, L., Peräkylä, O., Zou, J., Rose, C., Wang, Y., Mammarella, I., Katul, G., Vesala, T., Worsnop, D. R., Kulmala, M., Petäjä, T., Bianchi, F., and Ehn, M.: Vertical characterization of highly oxygenated molecules (HOMs) below and above a boreal forest canopy, Atmos. Chem. Phys., 18, 17437–17450, https://doi.org/10.5194/acp-18-17437-2018, 2018.
Zhang, Z. Q. and Liu, B. Y. H.: Performance of Tsi 3760 Condensation Nuclei Counter at Reduced Pressures and Flow-Rates, Aerosol Sci. Tech., 15, 228–238, https://doi.org/10.1080/02786829108959530, 1991.
The requested paper has a corresponding corrigendum published. Please read the corrigendum first before downloading the article.
- Article
(4516 KB) - Full-text XML