the Creative Commons Attribution 4.0 License.
the Creative Commons Attribution 4.0 License.
 | 28 Mar 2019
Monitoring and assimilation tests with TROPOMI data in the CAMS system: near-real-time total column ozone
Johannes Flemming
Klaus-Peter Heue
Christophe Lerot
Diego Loyola
Roberto Ribas
Pieter Valks
Michel van Roozendael
Walter Zimmer
The TROPOspheric Monitoring Instrument (TROPOMI) on board the Sentinel-5 Precursor (S5P) satellite launched in October 2017 yields a wealth of atmospheric composition data, including retrievals of total column ozone (TCO3) that are provided in near-real-time (NRT) and off-line. The NRT TCO3 retrievals (v1.0.0–v1.1.2) have been included in the data assimilation system of the Copernicus Atmosphere Monitoring Service (CAMS), and tests to monitor the data and to carry out first assimilation experiments with them have been performed for the period 26 November 2017 to 30 November 2018. The TROPOMI TCO3 data agree to within 2 % with the CAMS analysis over large parts of the globe between 60∘ N and 60∘ S and also with TCO3 retrievals from the Ozone Monitoring Instrument (OMI) and the Global Ozone Monitoring Experiment-2 (GOME-2) that are routinely assimilated by CAMS. However, the TCO3 NRT data from TROPOMI show some retrieval anomalies at high latitudes, at low solar elevations and over snow/ice (e.g. Antarctica and snow-covered land areas in the Northern Hemisphere), where the differences with the CAMS analysis and the other data sets are larger. These differences are particularly pronounced over land in the NH during winter and spring (when they can reach up to 40 DU) and come mainly from the surface albedo climatology that is used in the NRT TROPOMI TCO3 retrieval. This climatology has a coarser horizontal resolution than the TROPOMI TCO3 data, which leads to problems in areas where there are large changes in reflectivity from pixel to pixel, e.g. pixels covered by snow/ice or not. The differences between TROPOMI and the CAMS analysis also show some dependency on scan position.
The assimilation of TROPOMI TCO3 has been tested in the CAMS system for data between 60∘ N and 60∘ S and for solar elevations greater than 10∘ and is found to have a small positive impact on the ozone analysis compared to Brewer TCO3 data and an improved fit to ozone sondes in the tropical troposphere and to IAGOS aircraft profiles at West African airports. The impact of the TROPOMI data is relatively small because the CAMS analysis is already well constrained by several other ozone retrievals that are routinely assimilated. When averaged over the periods February–April and September–October 2018, differences between experiments with and without assimilation of TROPOMI data are less than 2 % for TCO3 and less than 3 % in the vertical for seasonal mean zonal mean O3 mixing ratios, with the largest relative differences found in the troposphere.


The Copernicus Atmosphere Monitoring Service (CAMS, https://atmosphere.copernicus.eu/, last access: 22 March 2019) produces daily global near-real-time (NRT) forecasts of atmospheric composition up to 5 days ahead and a range of other data sets on global and regional atmospheric composition, such as near-real-time estimates of fire emissions, reanalyses of atmospheric composition and greenhouse gas forecasts and analyses. To improve the quality of the global CAMS forecasts, the initial conditions for some of the chemical species, including ozone (O3), carbon monoxide (CO), nitrogen dioxide (NO2), sulfur dioxide (SO2) and for aerosols are improved by assimilating satellite retrievals of atmospheric composition using the 4-dimensional variations (4D-Var) data assimilation system (Benedetti et al., 2009; Inness et al., 2013, 2015; Massart et al., 2014) of the European Centre for Medium-Range Weather Forecasts (ECMWF).
A wealth of new atmospheric composition data has become available with the launch of the Sentinel-5 Precursor (S5P) satellite in October 2017. S5P carries the TROPOspheric Monitoring Instrument (TROPOMI), which provides high-resolution spectral measurements in the ultraviolet (UV), visible (Vis), near infrared (NIR) and shortwave-infrared (SWIR) parts of the spectrum. This wide spectral range allows several atmospheric trace gases to be retrieved, e.g. O3, NO2, SO2 and HCHO from the UV–Vis, and CO and CH4 from the SWIR part of the spectrum. These species are all included in the CAMS system, making TROPOMI the perfect instrument to provide observations for the CAMS NRT analysis at unprecedented horizontal resolution of about 3.5 km × 7 km for the TROPOMI UV–Vis and 7 km × 7 km for the SWIR products. In this paper, we evaluate TROPOMI NRT total column ozone (TCO3) retrievals (v1.0.0–v1.1.2) produced by the Deutsche Zentrum für Luft- und Raumfahrt (DLR) against the CAMS ozone analysis for the period 26 November 2017 to 30 November 2018 and carry out first assimilation tests with the TROPOMI TCO3 data in the CAMS system. The satellite was still in its commissioning phase until 24 April 2018, which was mainly used for functional testing, in-flight calibration and testing of processing chains. Nevertheless, observations were available in these early months and are included in our study as their quality was good enough to allow us to prepare the CAMS system for the new data.
Ozone plays an important role in tropospheric chemistry. Tropospheric ozone is a regional-scale pollutant and, at high concentrations near the surface, harmful to humans and vegetation. Photolysis of ozone, followed by reaction with water vapour, provides the primary source of the hydroxyl radical. Ozone is also a significant greenhouse gas, particularly in the upper troposphere (Hansen et al., 1997). Tropospheric ozone is formed when nitrogen oxides (NOx), CO and volatile organic compounds (VOCs) react in the presence of sunlight. In urban areas in the Northern Hemisphere (NH), high ozone levels usually occur during spring and summer. About 90 % of the total ozone amount resides in the stratosphere, a result of oxygen photolysis as first explained by Chapman (Chapman, 1930). This ozone layer absorbs a large part of the sun's harmful UV radiation. Anthropogenic chlorofluorocarbons led to a global decrease in the ozone total column, with potentially catastrophic consequences avoided thanks to the Montreal Protocol (Newman et al., 2009). Over Antarctica, ozone destruction during austral spring still leads to strong and rapid depletion of the ozone layer (“ozone hole”). There is evidence that the ozone hole is slowly recovering (Strahan and Douglass, 2018; Weber et al., 2018) and predictions suggest it should return to pre-1980s levels by the 2060s (Newman et al., 2006). Stratospheric ozone destruction also happens on a smaller scale over the Arctic in boreal spring (Manney et al., 2011), while ozone downward trends in the middle–low-latitude lower stratosphere are related to atmospheric dynamics (Chipperfield et al., 2018).
Ozone interacts with radiation and is therefore an important parameter in radiation schemes used in numerical weather prediction (NWP) models (e.g. Hogan et al., 2017), where an improved representation of the ozone field can lead to improvements in weather forecasting or climate simulations. Ozone and the assimilation of ozone retrievals was therefore included in the ECMWF Integrated Forecast System (IFS) system in the late 1990s (Hólm et al., 1999) and a stratospheric ozone parameterization based on Cariolle and Teyssèdre (2007) is still used in the operational ECMWF NWP system, where ozone retrievals and ozone sensitive radiances are assimilated (Dethof and Hólm, 2004; Dragani and McNally, 2011; Dragani, 2013). Because this stratospheric ozone parameterization does not provide realistic tropospheric ozone fields, a comprehensive tropospheric chemistry scheme is used in the CAMS system (Flemming et al., 2015, 2017).
It is hoped that by adding the assimilation of TROPOMI TCO3 NRT data to the CAMS system, CAMS ozone analyses and forecasts will be improved and resilience will be added to the system to protect against the loss of any of the older instruments with TCO3 retrievals that are currently assimilated by CAMS (see Table 1 below). In a first step, the TROPOMI TCO3 data are monitored passively with the CAMS system. This means they are included in the CAMS data assimilation system. The model fields are interpolated in time and space to the location of the observations and the model equivalents of the observations are calculated, allowing temporal and spatial statistics of the differences between the observations and collocated model fields to be determined. However, the data are not actively used in the assimilation at this stage and do not influence the analysis and subsequent forecast yet. In a second step, the active assimilation of the TROPOMI TCO3 data is tested and their impact on the CAMS ozone analysis is assessed by looking at independent validation data.
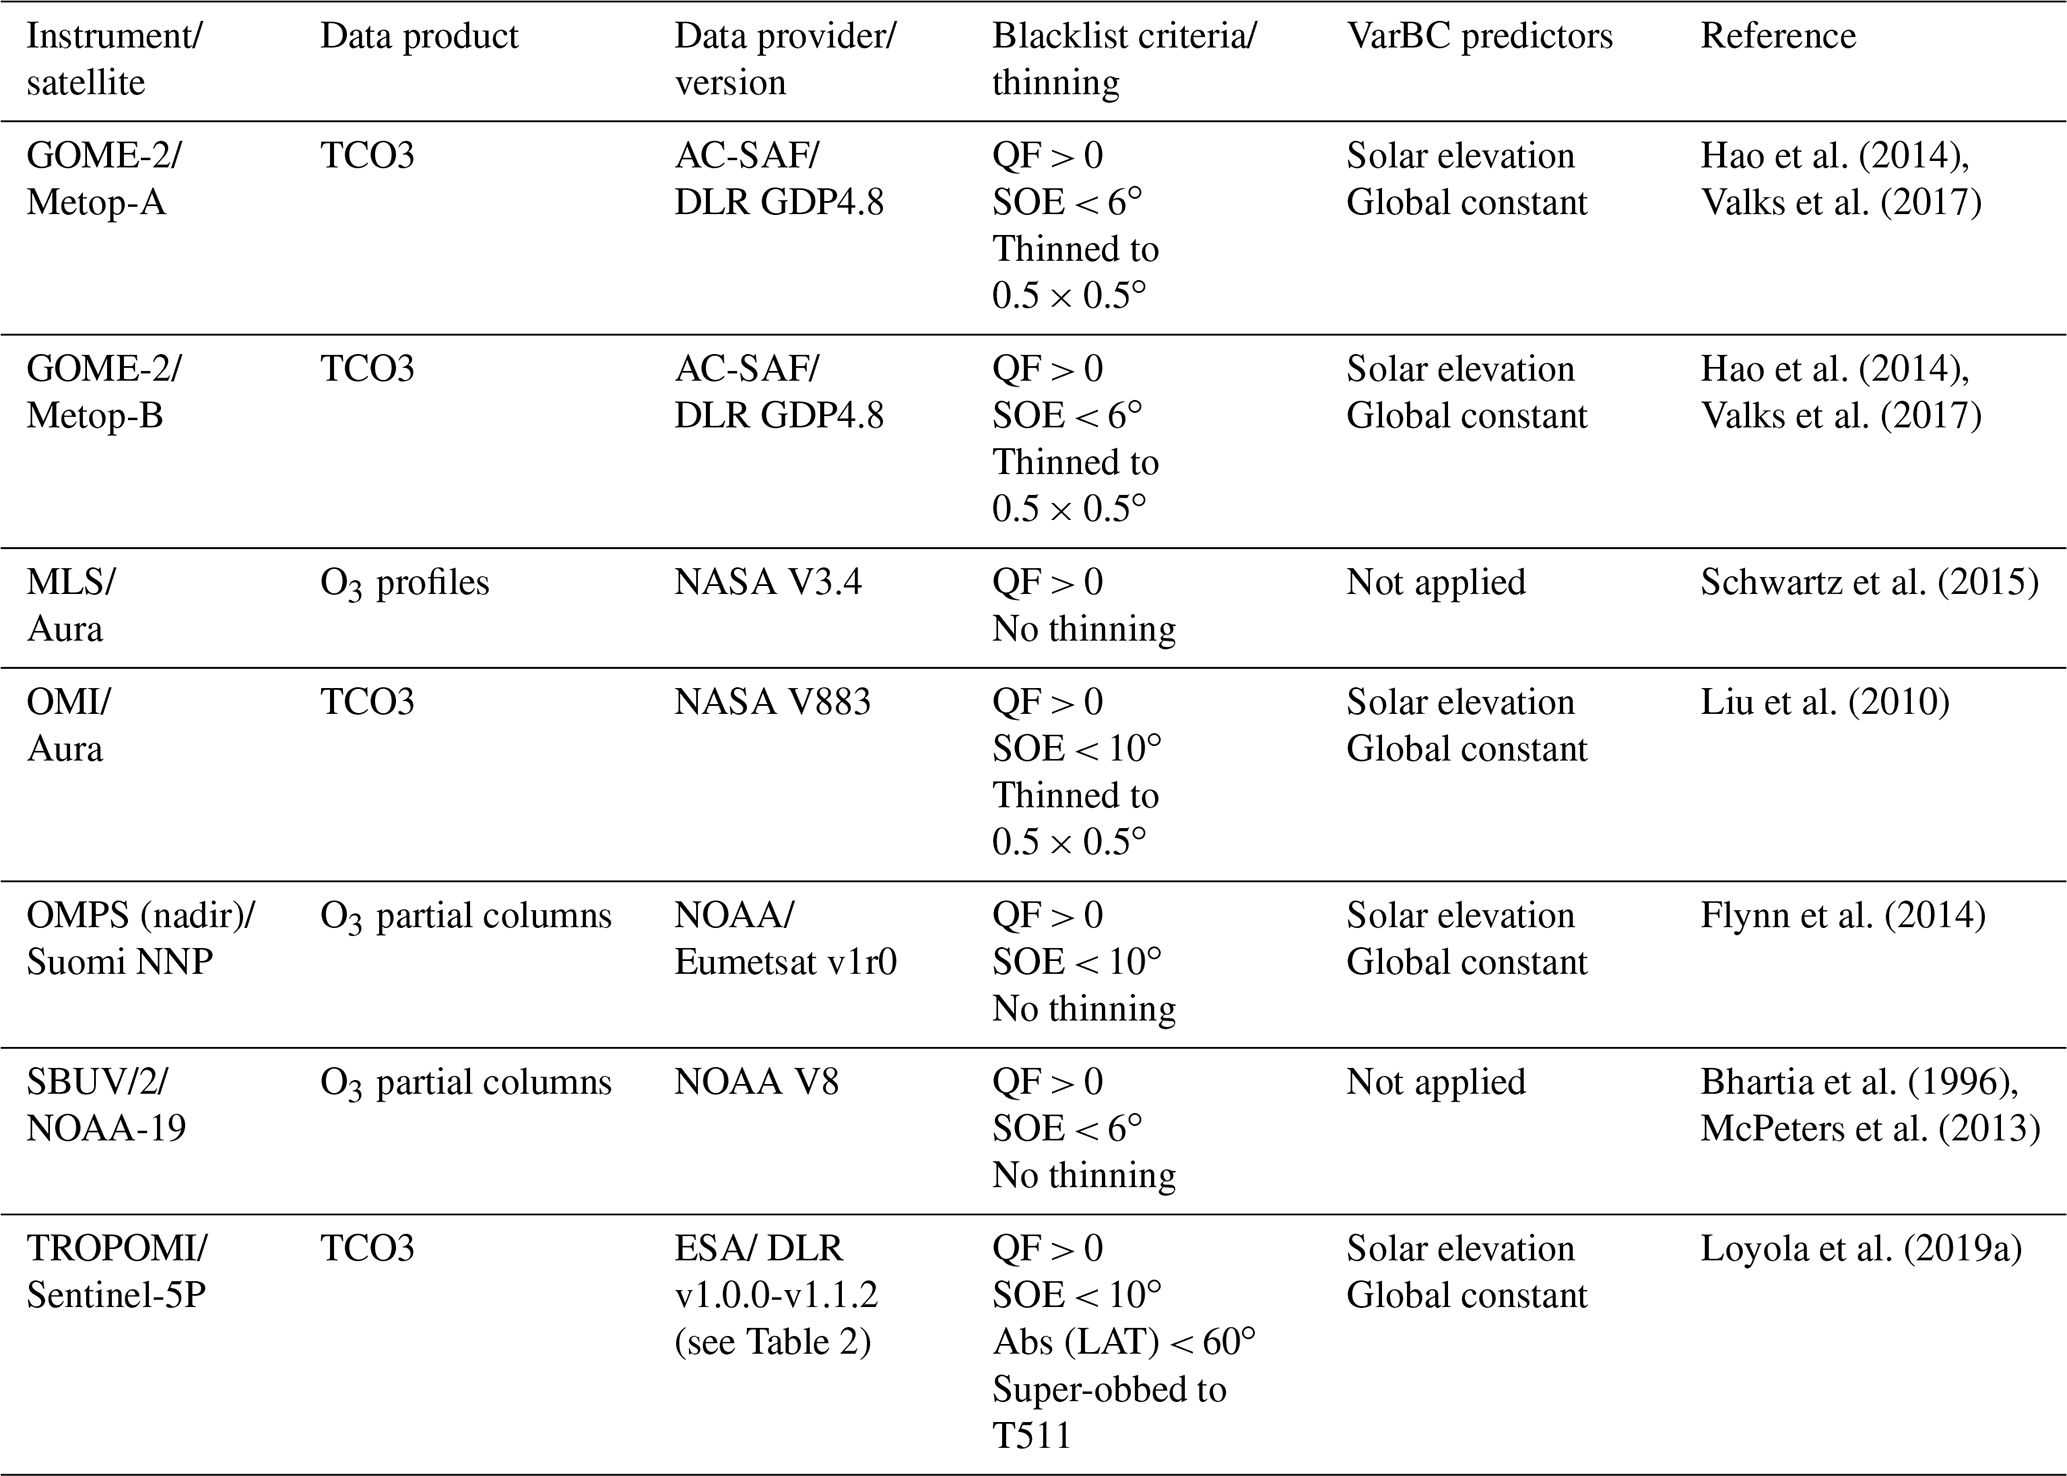
Table 1O3 satellite retrievals used in this paper. QF is quality flag given by data providers, SOE is solar elevation, LAT is latitude, VarBC is variational bias correction. The blacklist criteria describe when data were not used.
The differences between the observations and the model fields are called departures. We distinguish between first-guess departures (observations minus model first-guess field) and analysis departures (observations minus analysed field). The first-guess field is a forecast initialized from the previous analysis cycle that is not changed by the analysis increments of the current analysis cycle. If the model fields are stable the departures normally show a relatively smooth behaviour from day to day. Long-term monitoring of the departures can disclose errors and biases in the satellite data products, as well as errors or biases in the model. Because the departures are smaller than the absolute observation values, they show day-to-day changes better than when looking at the absolute model fields or observation values. A sudden jump in the departures on a global scale, which is larger than the instrument noise, can be an indication of problems in the observations or the model.
Including TROPOMI TCO3 data passively in the CAMS system enables us (1) to carry out a continuous quality assessment of the data, (2) to detect biases between different satellite retrievals (e.g. between TCO3 from TROPOMI and the Ozone Monitoring Instrument, OMI, or the Global Ozone Monitoring Experiment-2, GOME-2) and (3) allows us to monitor instrument and algorithm stability. The advantage of using an assimilation system to monitor satellite data is that it provides continuous global coverage and allows us to build up global and regional statistics quickly. If the monitoring shows the data to be of good quality (e.g. departures are stable, there are no sudden jumps, the biases with respect to the model are small), assimilation tests with the data usually follow.
This paper is structured in the following way. Section 2 describes the CAMS model and data assimilation system as well as the TROPOMI TCO3 NRT retrievals and how they are used in the CAMS system. Section 3 shows the results of monitoring experiments with the TROPOMI TCO3 data, results from first assimilation tests with the data and the validation of the resulting ozone analyses with independent observations. Section 4 gives the conclusions.
2.1 CAMS model and data assimilation system
The chemical mechanism of the IFS is an extended version of the Carbon Bond Mechanism 5 (CB05, Huijnen et al., 2010), originally implemented in the chemical transport model (CTM) Transport Model 5 (TM5), and is documented in Flemming et al. (2015, 2017). This is a tropospheric chemistry scheme, and for stratospheric ozone the chemical tendencies above the tropopause are computed by a parameterization based on Cariolle and Teyssèdre (2007). The spatial resolution of the model is approximately 40 km (T511 spectral and 0.35∘ × 0.35∘ grid), i.e. coarser than the 3.5 km × 7 km resolution of the TROPOMI TCO3 data. The CAMS system uses MACCity anthropogenic emissions (Granier et al., 2011), biomass burning emissions from the Global Fire Assimilation System (GFAS, Kaiser et al., 2012) and biogenic emissions from the MEGAN model (Guenther et al., 2006).
ECMWF IFS uses an incremental 4D-Var data assimilation system going back to Courtier et al. (1994). The data assimilation system for the atmospheric composition fields remains unchanged to the one described in Inness et al. (2015). The atmospheric composition fields are included in the control vector and minimized together with the meteorological control variables. The CAMS NRT system uses 12 h assimilation windows from 03:00 to 15:00 UTC and 15:00 to 03:00 UTC and two minimizations at spectral truncations T95 (∼210 km) and T159 (∼110 km).
Several ozone retrievals are assimilated in the CAMS NRT system (see Table 1). These include TCO3 retrievals from OMI on the Aura satellite and GOME-2 on the Meteorological Operational satellite programme (Metop)-A and -B satellites (referred to as GOME-2AB), O3 profile data from the Microwave Limb Sounder (MLS) and O3 partial columns from Solar Backscatter Ultra-Violet (SBUV/2) and from the Ozone Mapping and Profiler Suite (OMPS). The GOME-2 and OMI TCO3 retrievals are thinned to a horizontal resolution of 0.5∘ × 0.5∘ by randomly selecting an observation in a grid box. The MLS profiles and partial column SBUV/2 and OMPS data are used unthinned at present. The O3 retrievals assimilated in the CAMS system are total or partial column data, i.e. integrated layers bounded by a top and a bottom pressure. The model's background column value is calculated as a simple vertical integral between the top and the bottom pressure of the partial or total columns, at the time and location of the observations. Averaging kernels are currently not used for the assimilation of ozone retrievals in the CAMS system. It is planned to test their use in the future.
A variational bias correction (VarBC) scheme (Dee and Uppala, 2009), where biases are estimated during the analysis by including bias parameters in the control vector, was used for several of the O3 retrievals. In this scheme, the bias corrections are continuously adjusted to optimize the consistency with all information used in the analysis. VarBC is applied to the TCO3 retrievals from OMI and GOME-2 and to the partial column OMPS data, with solar elevation and a global constant as predictors, while the partial column SBUV/2 and the profile MLS data are used to anchor the bias correction, i.e. are assimilated without correction. Experience from past experiments has shown that it is important to have an anchor for the O3 bias correction, to avoid drifts in the O3 fields (Inness et al., 2013).
Variational quality control (Andersson and Järvinen, 1999) and first-guess quality checks are applied to all O3 data in the CAMS system. The variational quality control reduces the weight given to observations in the analysis if they have large background departures. In the first-guess quality check, observations are rejected if the square of the normalized background departure exceeds its expected variance by more than a predefined multiple (5 for most variables).
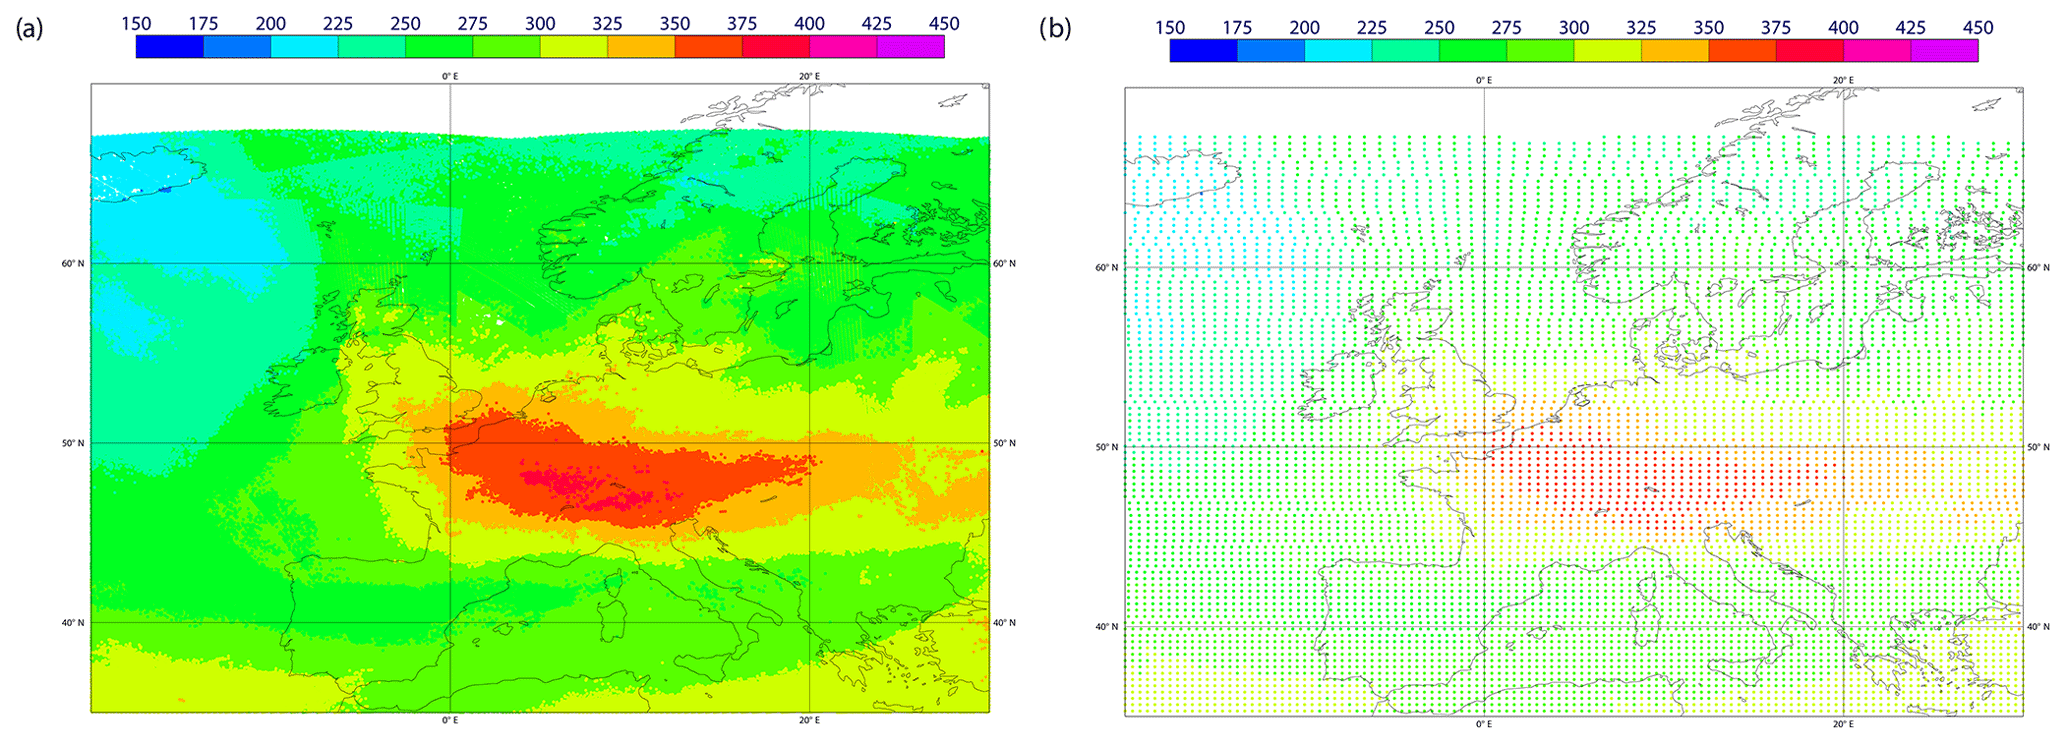
Figure 1TROPOMI NRT TCO3 in Dobson units (DU) at (a) full resolution and (b) super-obbed to the model resolution of T511 on 29 November 2017, 12:00 UTC over Europe.
2.2 TROPOMI TCO3 NRT retrievals
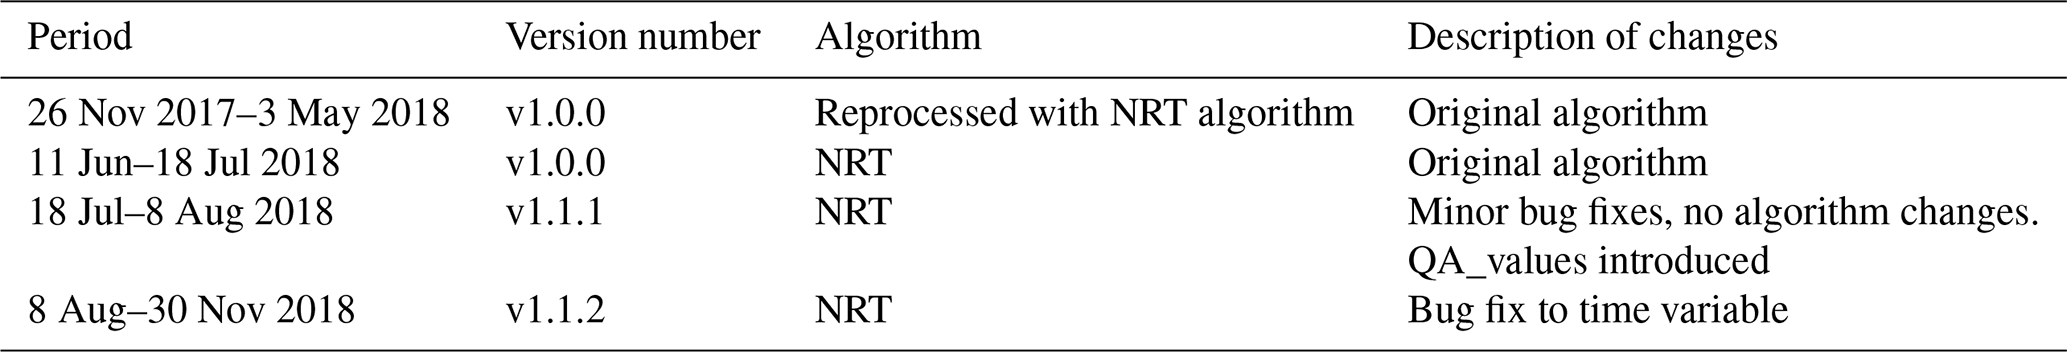
TROPOMI has a local overpass time of 13:30 UTC, a ground pixel size of 3.5 km × 7 km for TCO3 and other gases retrieved from the UV–Vis and a swath of 2600 km, and it provides daily global coverage with ∼14 orbits per day. For the work in this paper we use NRT TROPOMI TCO3 data (Loyola et al., 2019b). These include TROPOMI data (v1.0.0) for the period 26 November 2017 to 3 May 2018 v1.0.0 that were reprocessed with the NRT algorithm and NRT TROPOMI data v1.0.0–v1.1.2 for the period 11 June to 30 November 2018 (see Table 2). No data were acquired at ECMWF from 4 May to 10 June 2018 for technical reasons. The TROPOMI TCO3 retrieval is based on the GDP 4.x algorithm original developed for GOME (van Roozendael et al., 2006), adapted to SCIAMACHY (Lerot et al., 2009) and further improved for GOME-2 (Loyola et al., 2011; Hao et al., 2014). The major TCO3 algorithm updates for TROPOMI compared to the heritage algorithms used for GOME-2 are the more precise treatment of clouds as scattering layers (Loyola et al., 2018), an optimized wavelength for the calculation of air mass factors (328.2 nm instead of 325.5 nm), better a priori ozone profile information (including the tropospheric climatology by Ziemke et al., 2011) and a destriping correction. This destriping correction was introduced because total vertical ozone columns showed small striping structures. The correction factor is based on the ratio between the mean for individual rows and the mean for all rows over a certain region and period. We averaged the total columns within the tropics for January to April 2018 for all 450 rows individually and over all 450 rows, resulting in an array of 450 numbers, ranging between 0.99 and 1.015. Multiplying the VCD with the correction factor changes the result by about ±1 %. The correction factor has been rechecked but no update seemed necessary up to now. The TROPOMI retrieval is described in the S5P/TROPOMI Total Ozone ATBD (Spurr et al., 2018).
We use the following quality checks to remove any outliers of the TROPOMI TCO3 data. Data are only used in the following cases:
-
the value of the quality flag is given in the data (qa flag) between [0,100],
-
the ozone values are between [0,900 DU],
-
the surface altitude is between [−399,8850 m],
-
the cloud fraction is between [0,1],
-
the latitude is between
- a.
[,90∘] for the monitoring assimilation (Sect. 3.1)
- b.
[,60∘] in the active assimilation (Sect. 3.2).
- a.
Data that pass the above four checks are flagged as “good” and used for the studies presented in this paper. In the current TROPOMI TCO3 products v1.1.x (Pedergnana et al., 2018), the qa flag will allow the user to identify good quality data, but this was not yet the case in v1.0.0. For consistency with the earlier period the qa value filter was not applied for version 1.1.2 data in this study.
Because the horizontal resolution of TROPOMI data (3.5 km × 7 km) is higher than the model resolution of T511 (about 40 km × 40 km) the TROPOMI data are not spatially representative of the model grid boxes. To overcome this representativeness error, the data are converted to so-called “super-observations” before they are included in the CAMS system. For this super-obbing, the data are averaged to the T511 resolution of the model. The averaging is carried out for all good data and the errors of the data are averaged in the same way as the observations. The super-obbing reduces the random errors in the data. In the past a “random” thinning to 0.5∘ × 0.5∘ was used in the CAMS system and this is still applied to the TCO3 retrievals from GOME-2 and OMI. The super-obbing applied to TROPOMI data has the advantage that it does not simply throw out the majority of the observations but uses the information from all good data to create average observations. In future, super-obbing will also be tested for the other ozone data sets. An example of TROPOMI TCO3 NRT data at full resolution and super-obbed to T511 is shown in Fig. 1. The super-obbing reduces the number of good TROPOMI TCO3 data from about 15–16 million per day to about 500 000 while still making use of the information given by all good data.
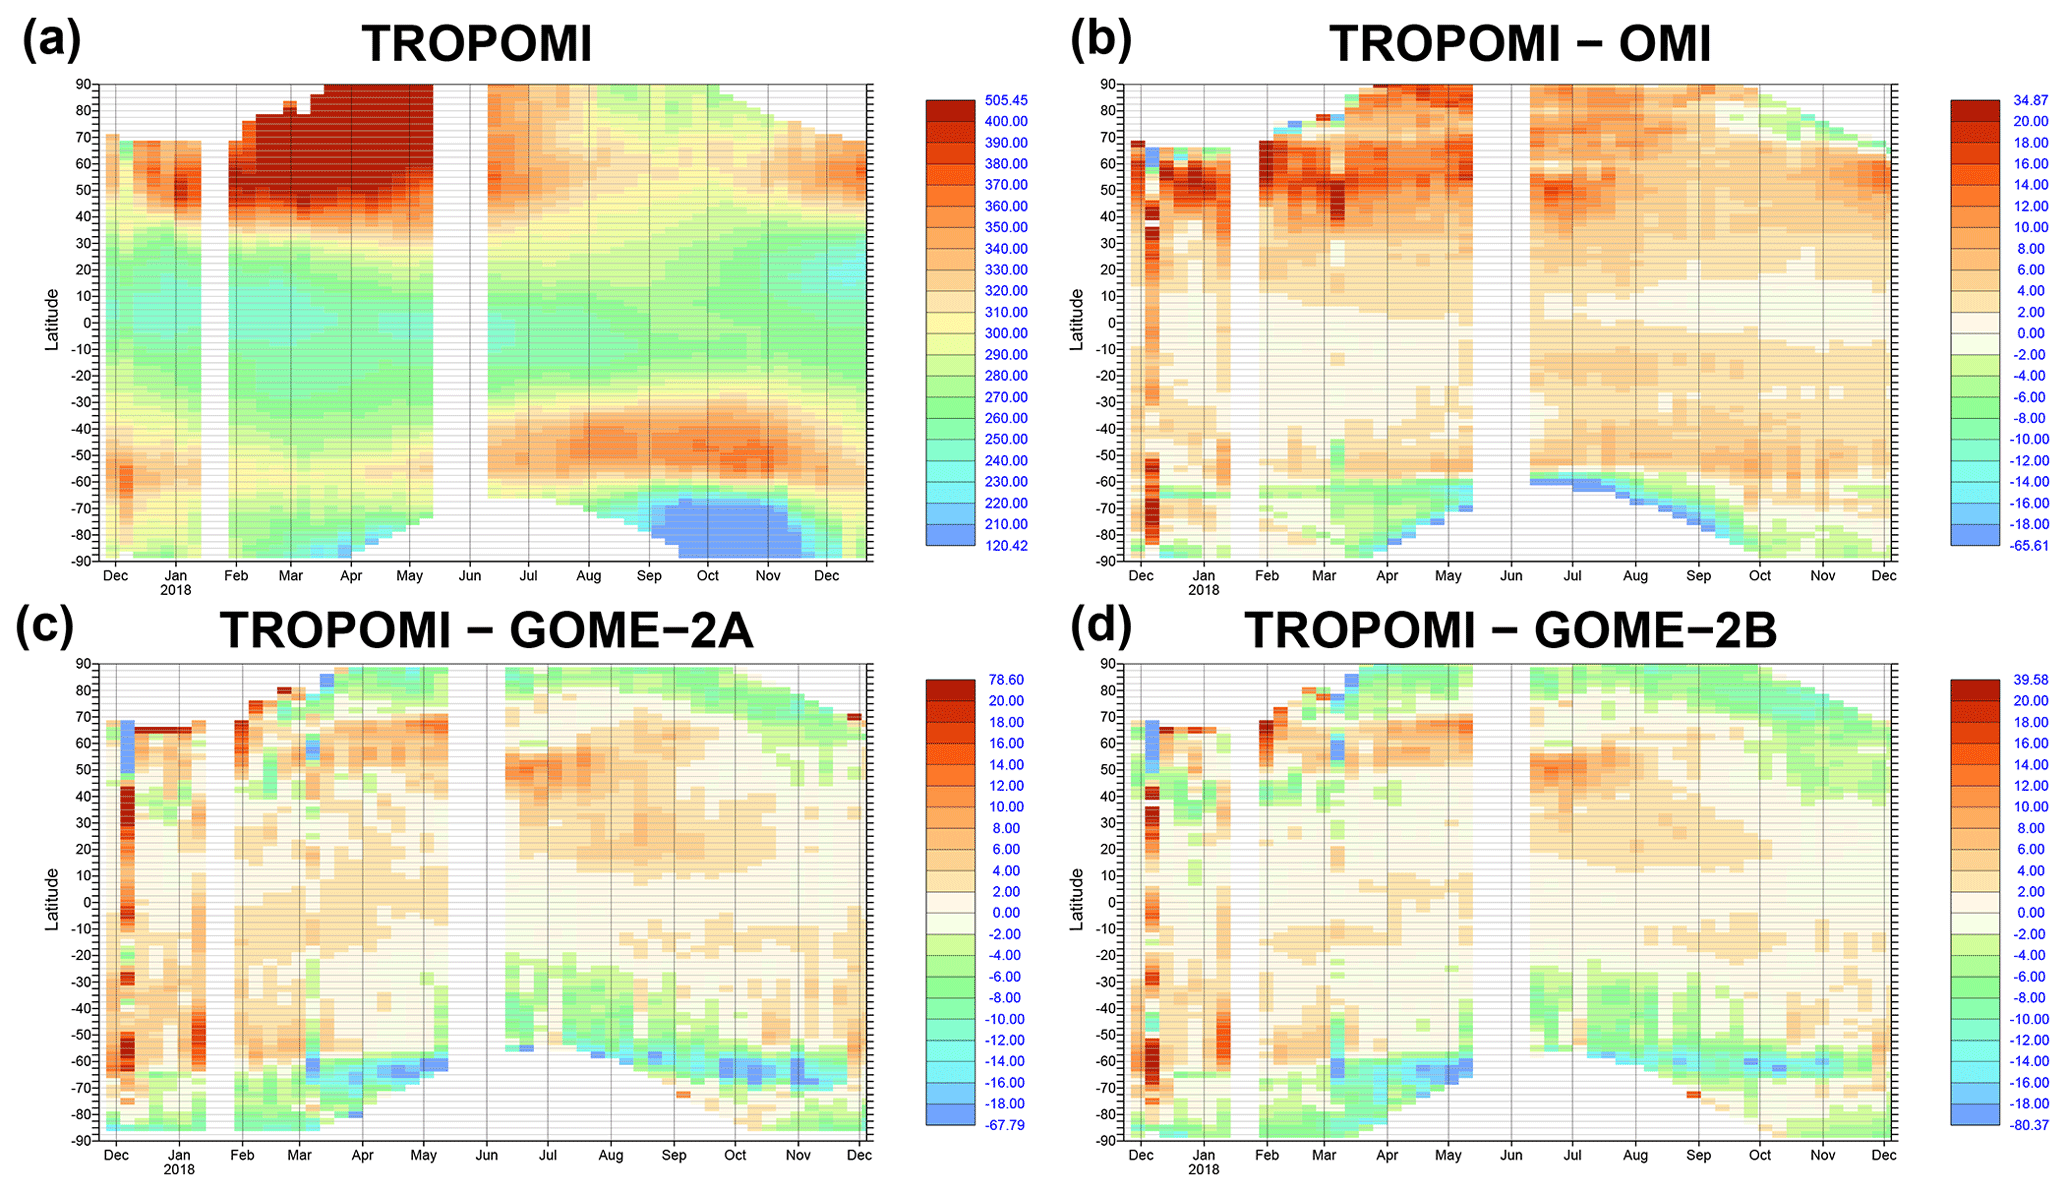
Figure 2(a) Time series of zonal mean weekly averaged TROPOMI NRT TCO3 for the period 26 November 2017 to 30 November 2018 and differences between (b) TROPOMI and OMI, (c) TROPOMI and GOME-2A and (d) TROPOMI and GOME-2B TCO3. Only good data are shown. All values are in DU.
Two experiments were run with NRT TROPOMI TCO3 data super-obbed to T511 horizontal resolution. In the first control experiment (CTRL, Sect. 3.1) the TROPOMI data were included passively; in the second one (ASSIM, Sect. 3.2) they were actively assimilated. The experiments cover the period from 26 November 2017 to 30 November 2018 and were run using CY45R1 of the CAMS system. We look at time series for the whole period and at fields averaged over the periods February to April (FMA) and September to November (SON) 2018.
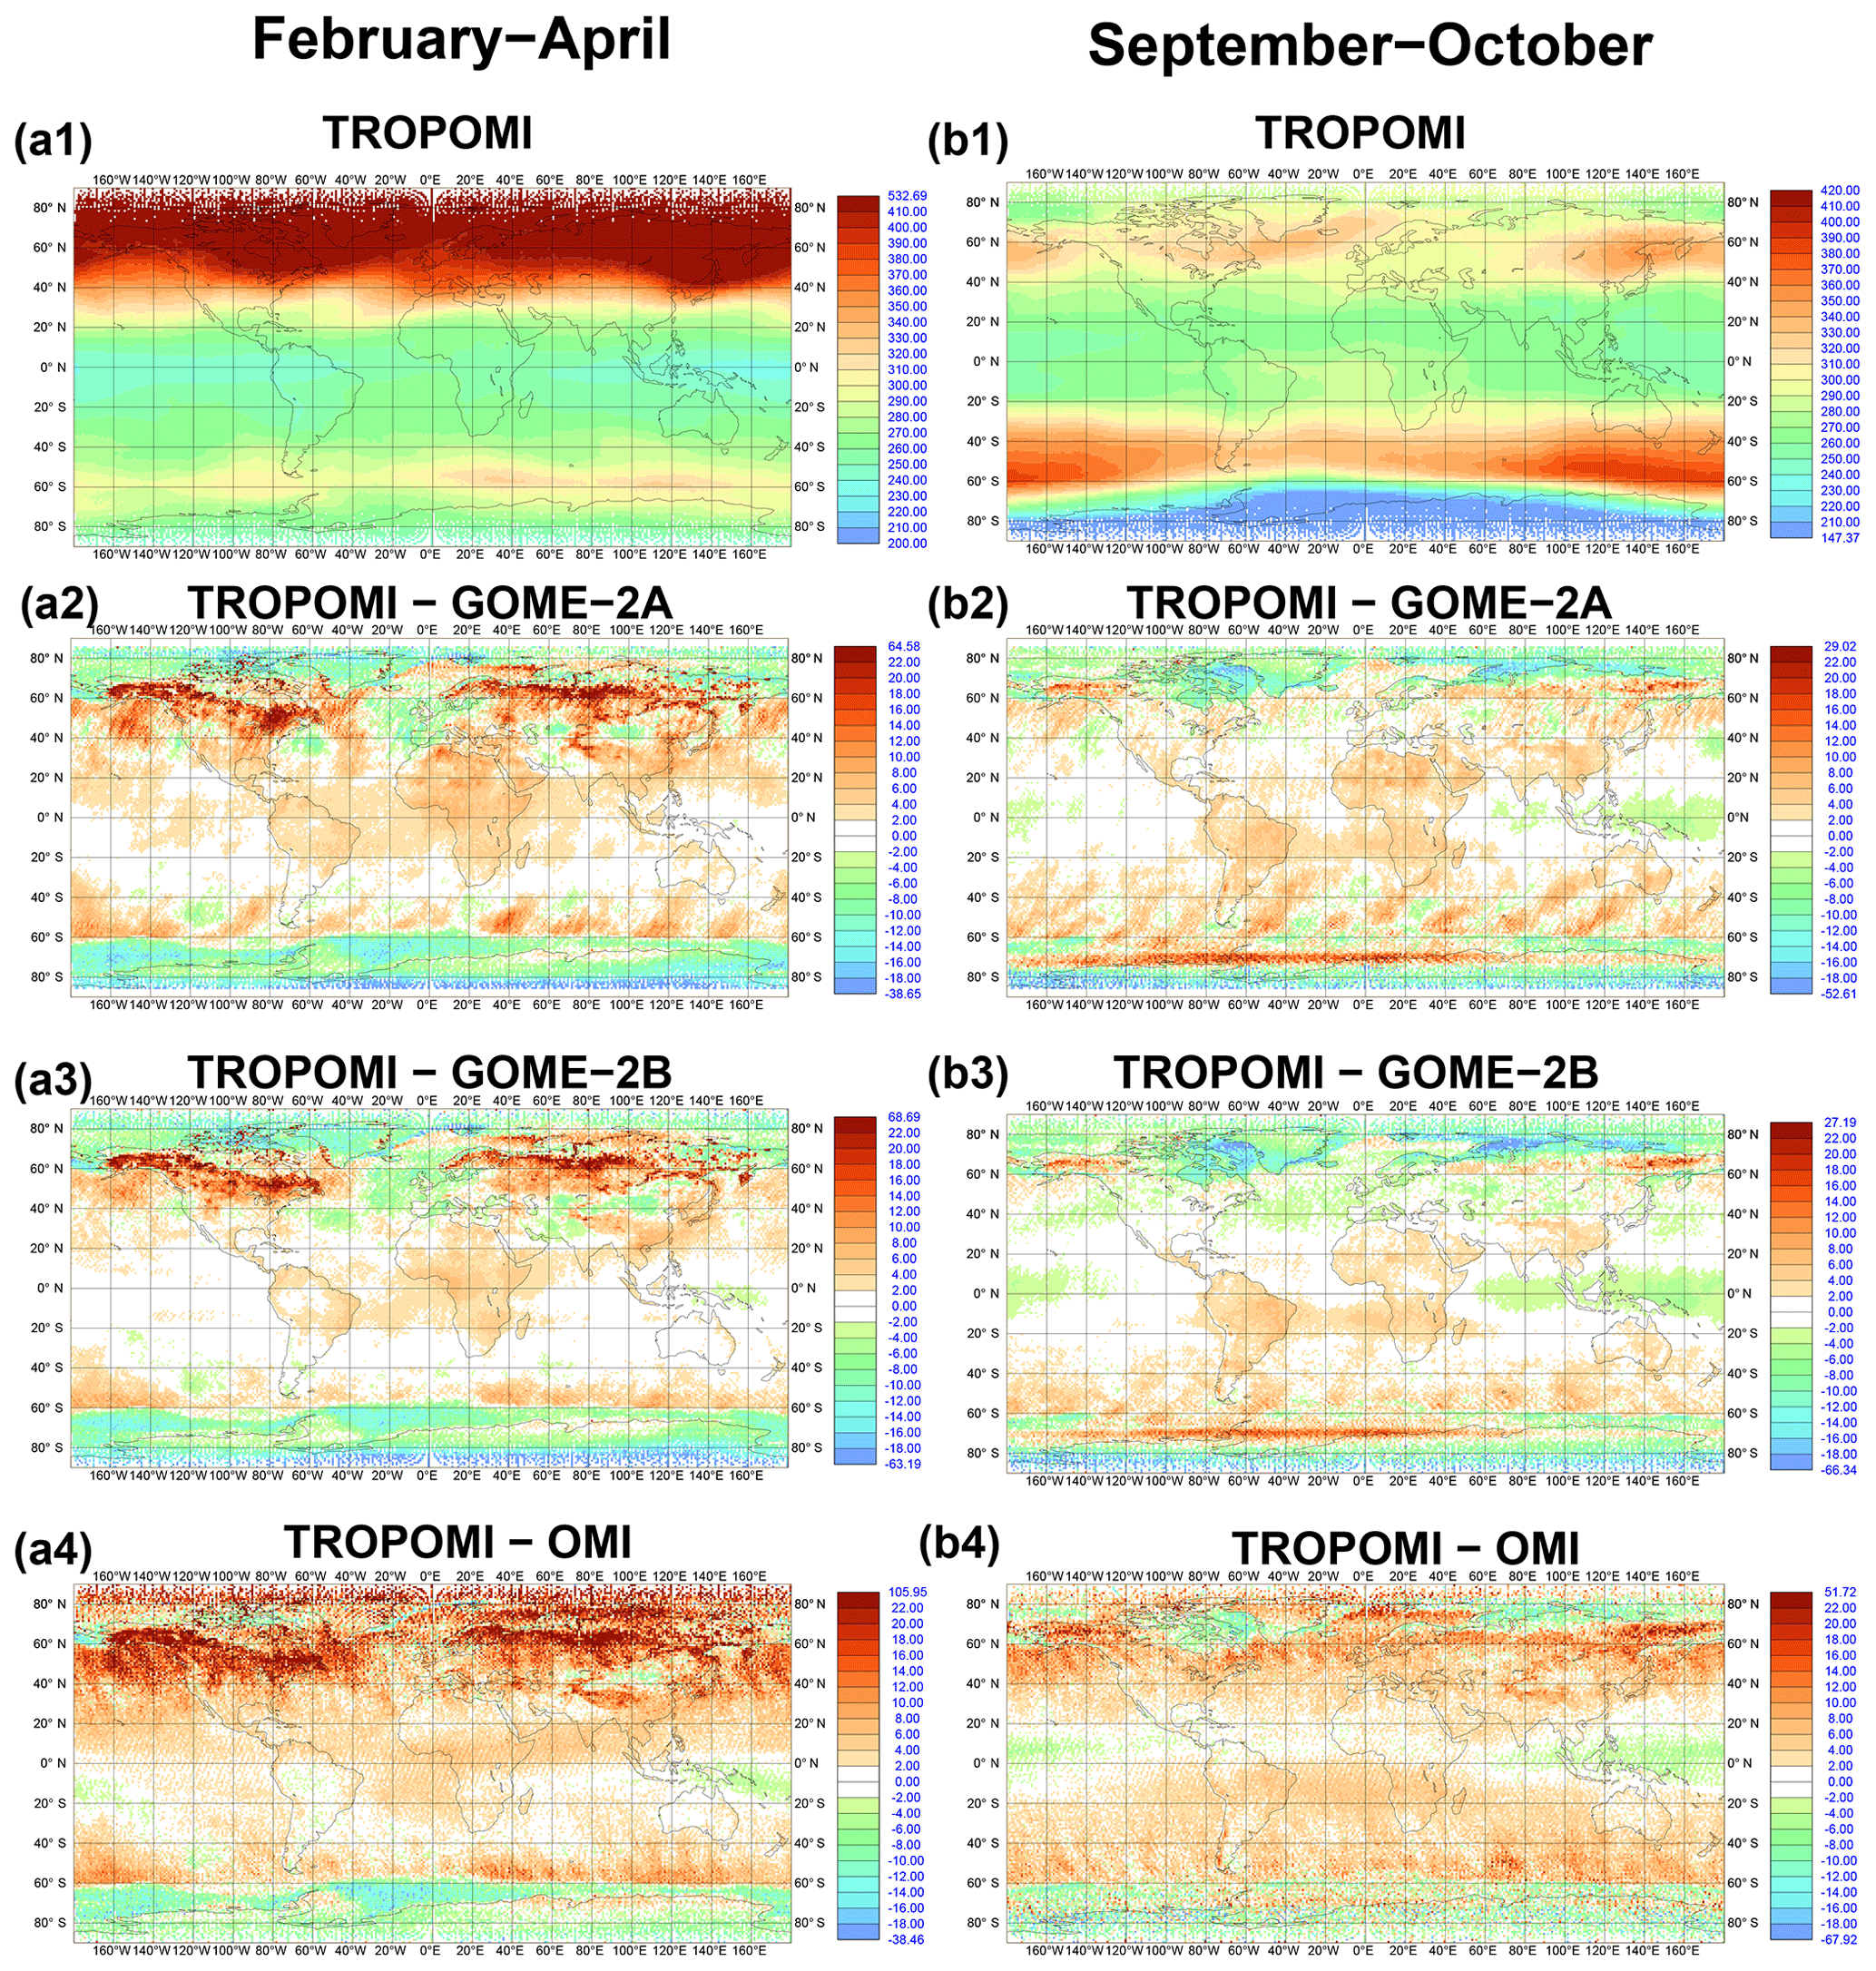
Figure 3Averages over (a) FMA 2018 and (b) SON 2018. (1) Mean TROPOMI TCO3 fields, differences between (2) TROPOMI minus GOME-2A, (3) TROPOMI minus GOME-2B and (4) TROPOMI minus OMI. Only good data are shown. All values are in DU.
3.1 Monitoring of TROPOMI TCO3 NRT data
Figure 2a shows a time series of zonal mean weekly averaged TCO3 values from TROPOMI for the period 26 November 2017 to 30 November 2018. The time series shows a realistic evolution of the ozone field with high column values in the NH during winter and spring, low values in the tropics throughout the year, higher values in the circum-Antarctic band and the lowest absolute values over the Antarctic during the ozone hole from August to November 2018. We also see a longer period without TROPOMI data in January 2018, when the instrument was undergoing calibration activities. From mid-February 2018 onwards (outside the data gap in May–June when data were not acquired by ECMWF) the number of data is more stable (not shown), except from 1 week with low data numbers in March. To assess the quality of the TROPOMI data they are compared with the other three TCO3 retrievals that are routinely assimilated in the CAMS NRT system, i.e. OMI and GOME-2AB in Fig. 2b–d. The TROPOMI NRT DOAS retrieval is a further development of the operational AC-SAF GOME-2AB DOAS; therefore a better agreement can be expected for the comparison for those sensors compared to OMI, where a different algorithm (TOMS-like) is applied. The differences between TROPOMI and OMI are positive (i.e. TROPOMI values higher than OMI) in most latitude bands throughout the time series. Negative differences (i.e. TROPOMI values lower than OMI) are found at the northern ends of the orbits from December 2017 to April 2018 and September to November 2018 and also south of 60∘ S, particularly from March to October when UV–Vis retrievals generally have larger problems because of the illumination conditions and the icy surfaces. On top of that, the TROPOMI retrievals have a larger bias at high latitudes because the current NRT algorithm uses a surface climatology that does not fully represent the actual snow/ice conditions. Over large parts of the time series the differences are below 4–6 DU, corresponding to less than 2 %. Larger departures are seen during some of the commissioning and differences of up to 20 DU are seen north of 40∘ N during the first half of the time series. However, TCO3 values are also larger at this time (Fig. 2a), so this still corresponds to agreements within about 5 %. The differences between TROPOMI and GOME-2AB (Fig. 2c and d) are smaller than the differences with OMI between 60∘ N and 60∘ S, but larger negative differences are found at the northern end of the orbits, especially south of 60∘ S. Again, larger departures are seen during some of the commissioning phase. Apart from these periods the differences between the TROPOMI and GOME-2AB data for latitudes between 60∘ N and 60∘ S are between 2 and 6 DU or less than about 2 %.
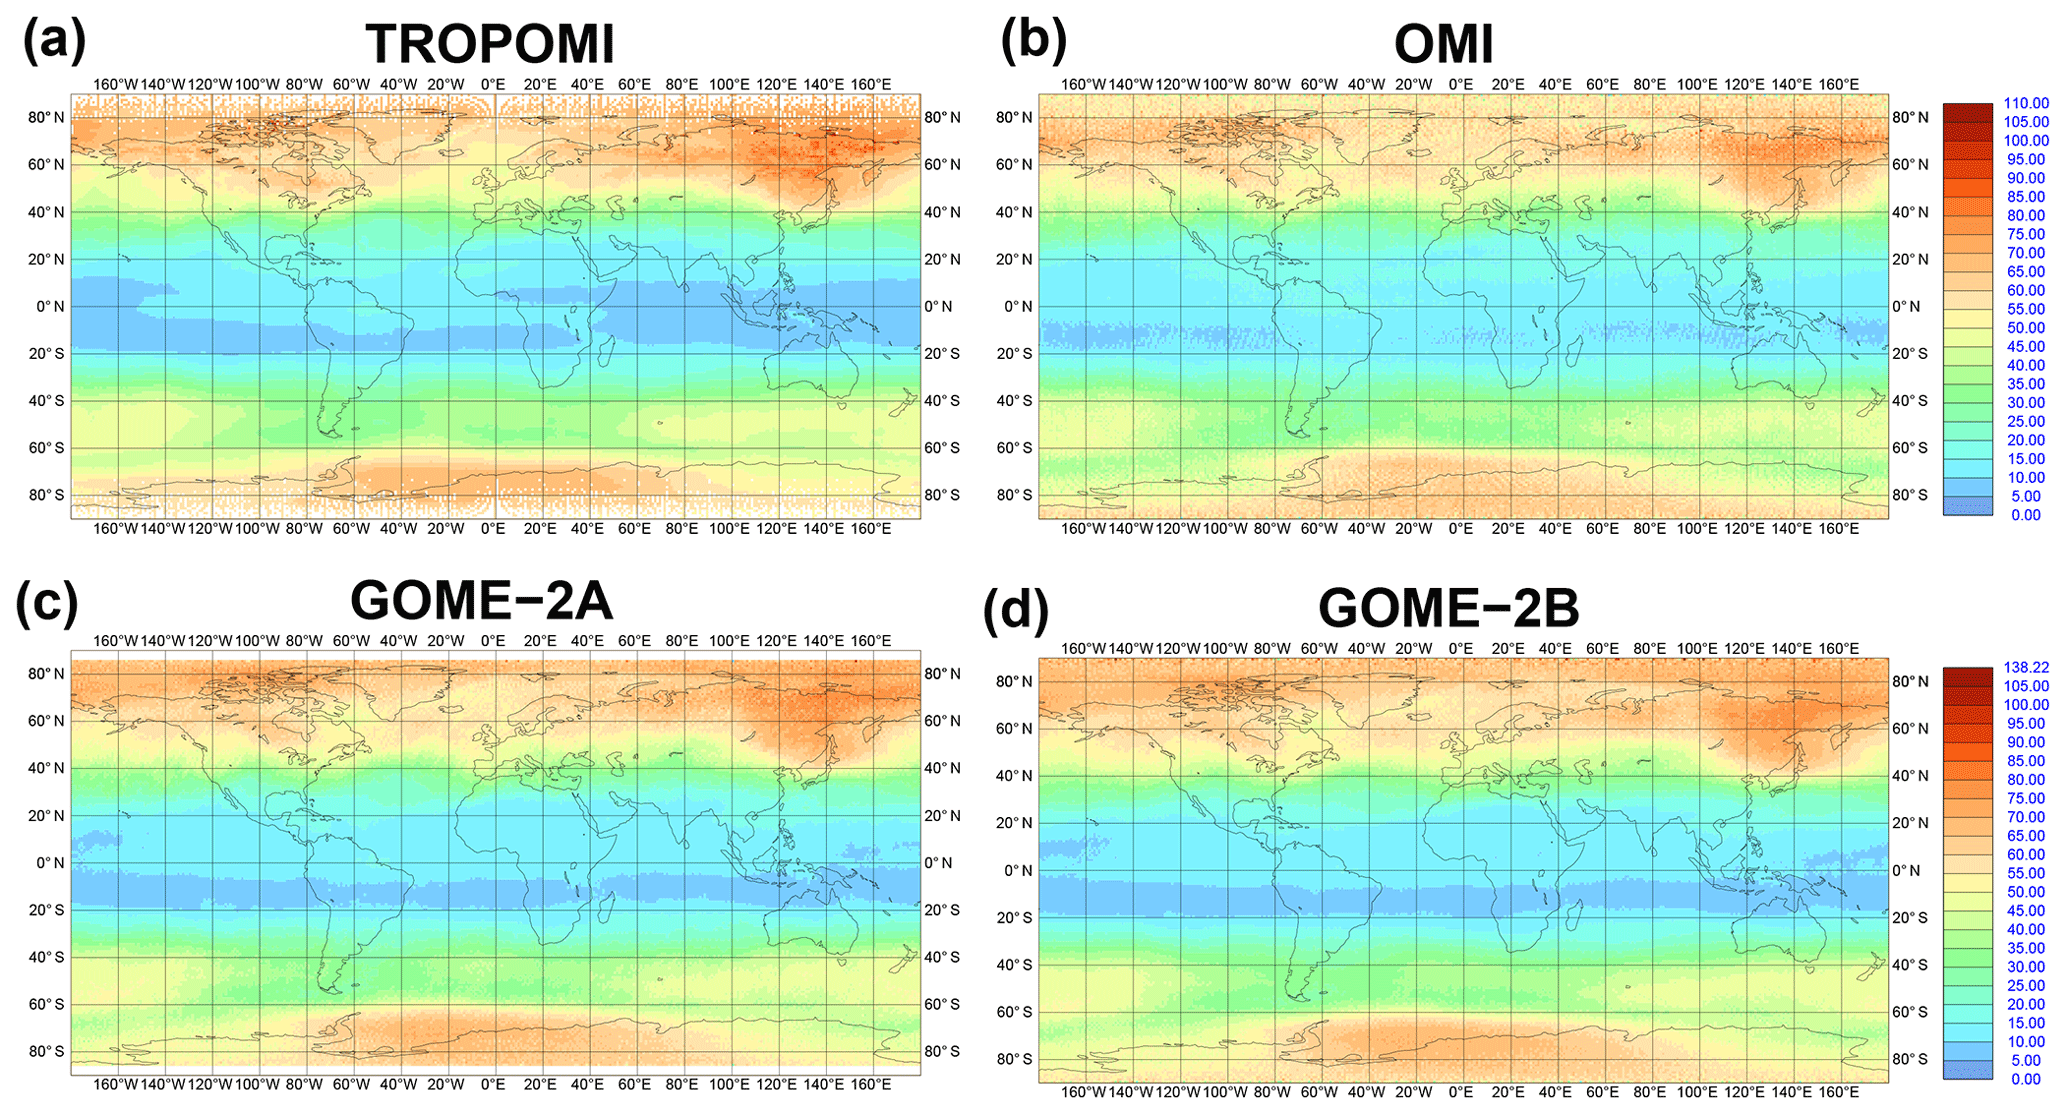
Figure 4TCO3 standard deviation of good data for the period 26 November 2017 to 30 November 2018 from (a) TROPOMI, (b) OMI, (c) GOME-2A and (d) GOME-2B in DU.
Figure 3 shows the mean TROPOMI TCO3 fields averaged for FMA and SON 2018 and the differences between TROPOMI, OMI and GOME-2AB. TROPOMI shows high TCO3 values in FMA during spring in the NH and low values over the Antarctic ozone hole during SON. The figure shows that there are large differences between TROPOMI and GOME-2AB polewards of about 60∘, which seem to be mainly negative over ice and sea and positive over land. During FMA there are also large differences in the NH north of about 40∘ N. However, these differences are still within about 20 DU (or less than 5 %) in most areas south of 60∘ N for GOME-2B and only slightly larger for GOME-2A. These differences come mainly from the surface albedo climatology that is used in the TROPOMI NRT retrieval algorithm of the v1.0.0–v1.1.2 data. The employed surface albedo climatology, based on OMI data (Kleipool et al., 2008), has a spatial resolution of 0.5∘ × 0.5∘ which seems coarser than the spatial resolution of the TROPOMI pixels. Consequently, surface albedo structures are found in the obtained TCO3 results, particularly over the polar regions, where the surface albedo climatology sometimes has very few grid cells marked as no snow or ice (reflectivity 0.05), whereas the reflectivity is close to 1 for the neighbouring ones with snow. In the future, it is planned to replace this coarse climatology with a new surface albedo retrieval using S5P data (Loyola et al., 2019a). For all three instruments, the differences in the NH are smaller in SON than FMA. During summer, when there is no snow cover, the resolution of the surface albedo is less of an issue and larger positive differences between TROPOMI and GOME-2AB are confined to Alaska and Kamchatka. We expect the largest problems to occur in spring and autumn, when the snow cover changes locally. Equatorward of those areas the differences between the instruments are smaller. Over oceans TROPOMI and GOME-2AB mainly agree to within ±4 DU, i.e. less than about 2 % of the tropical TCO3 values, with slightly larger differences over land (up to 10 DU, ∼5 %). During SON, negative differences of up to −6 DU are found over the maritime continent. This is probably caused by the update of the a priori in the TROPOMI algorithm v1.1.2, as the new one takes the tropospheric ozone wave one structure into account. The differences between TROPOMI and OMI are slightly larger than the differences between GOME-2AB and TROPOMI but still less than about 8 DU (or 4 %) over larger parts of the globe, with TROPOMI generally higher than OMI, except over the maritime continent. Over Antarctica and some areas north of 40∘ N positive and negative deviations are found. Because the differences over Antarctica show similar structures for OMI and GOME-2AB they are likely to point to problems with the TROPOMI retrievals using the OMI surface climatology rather than the other data sets.
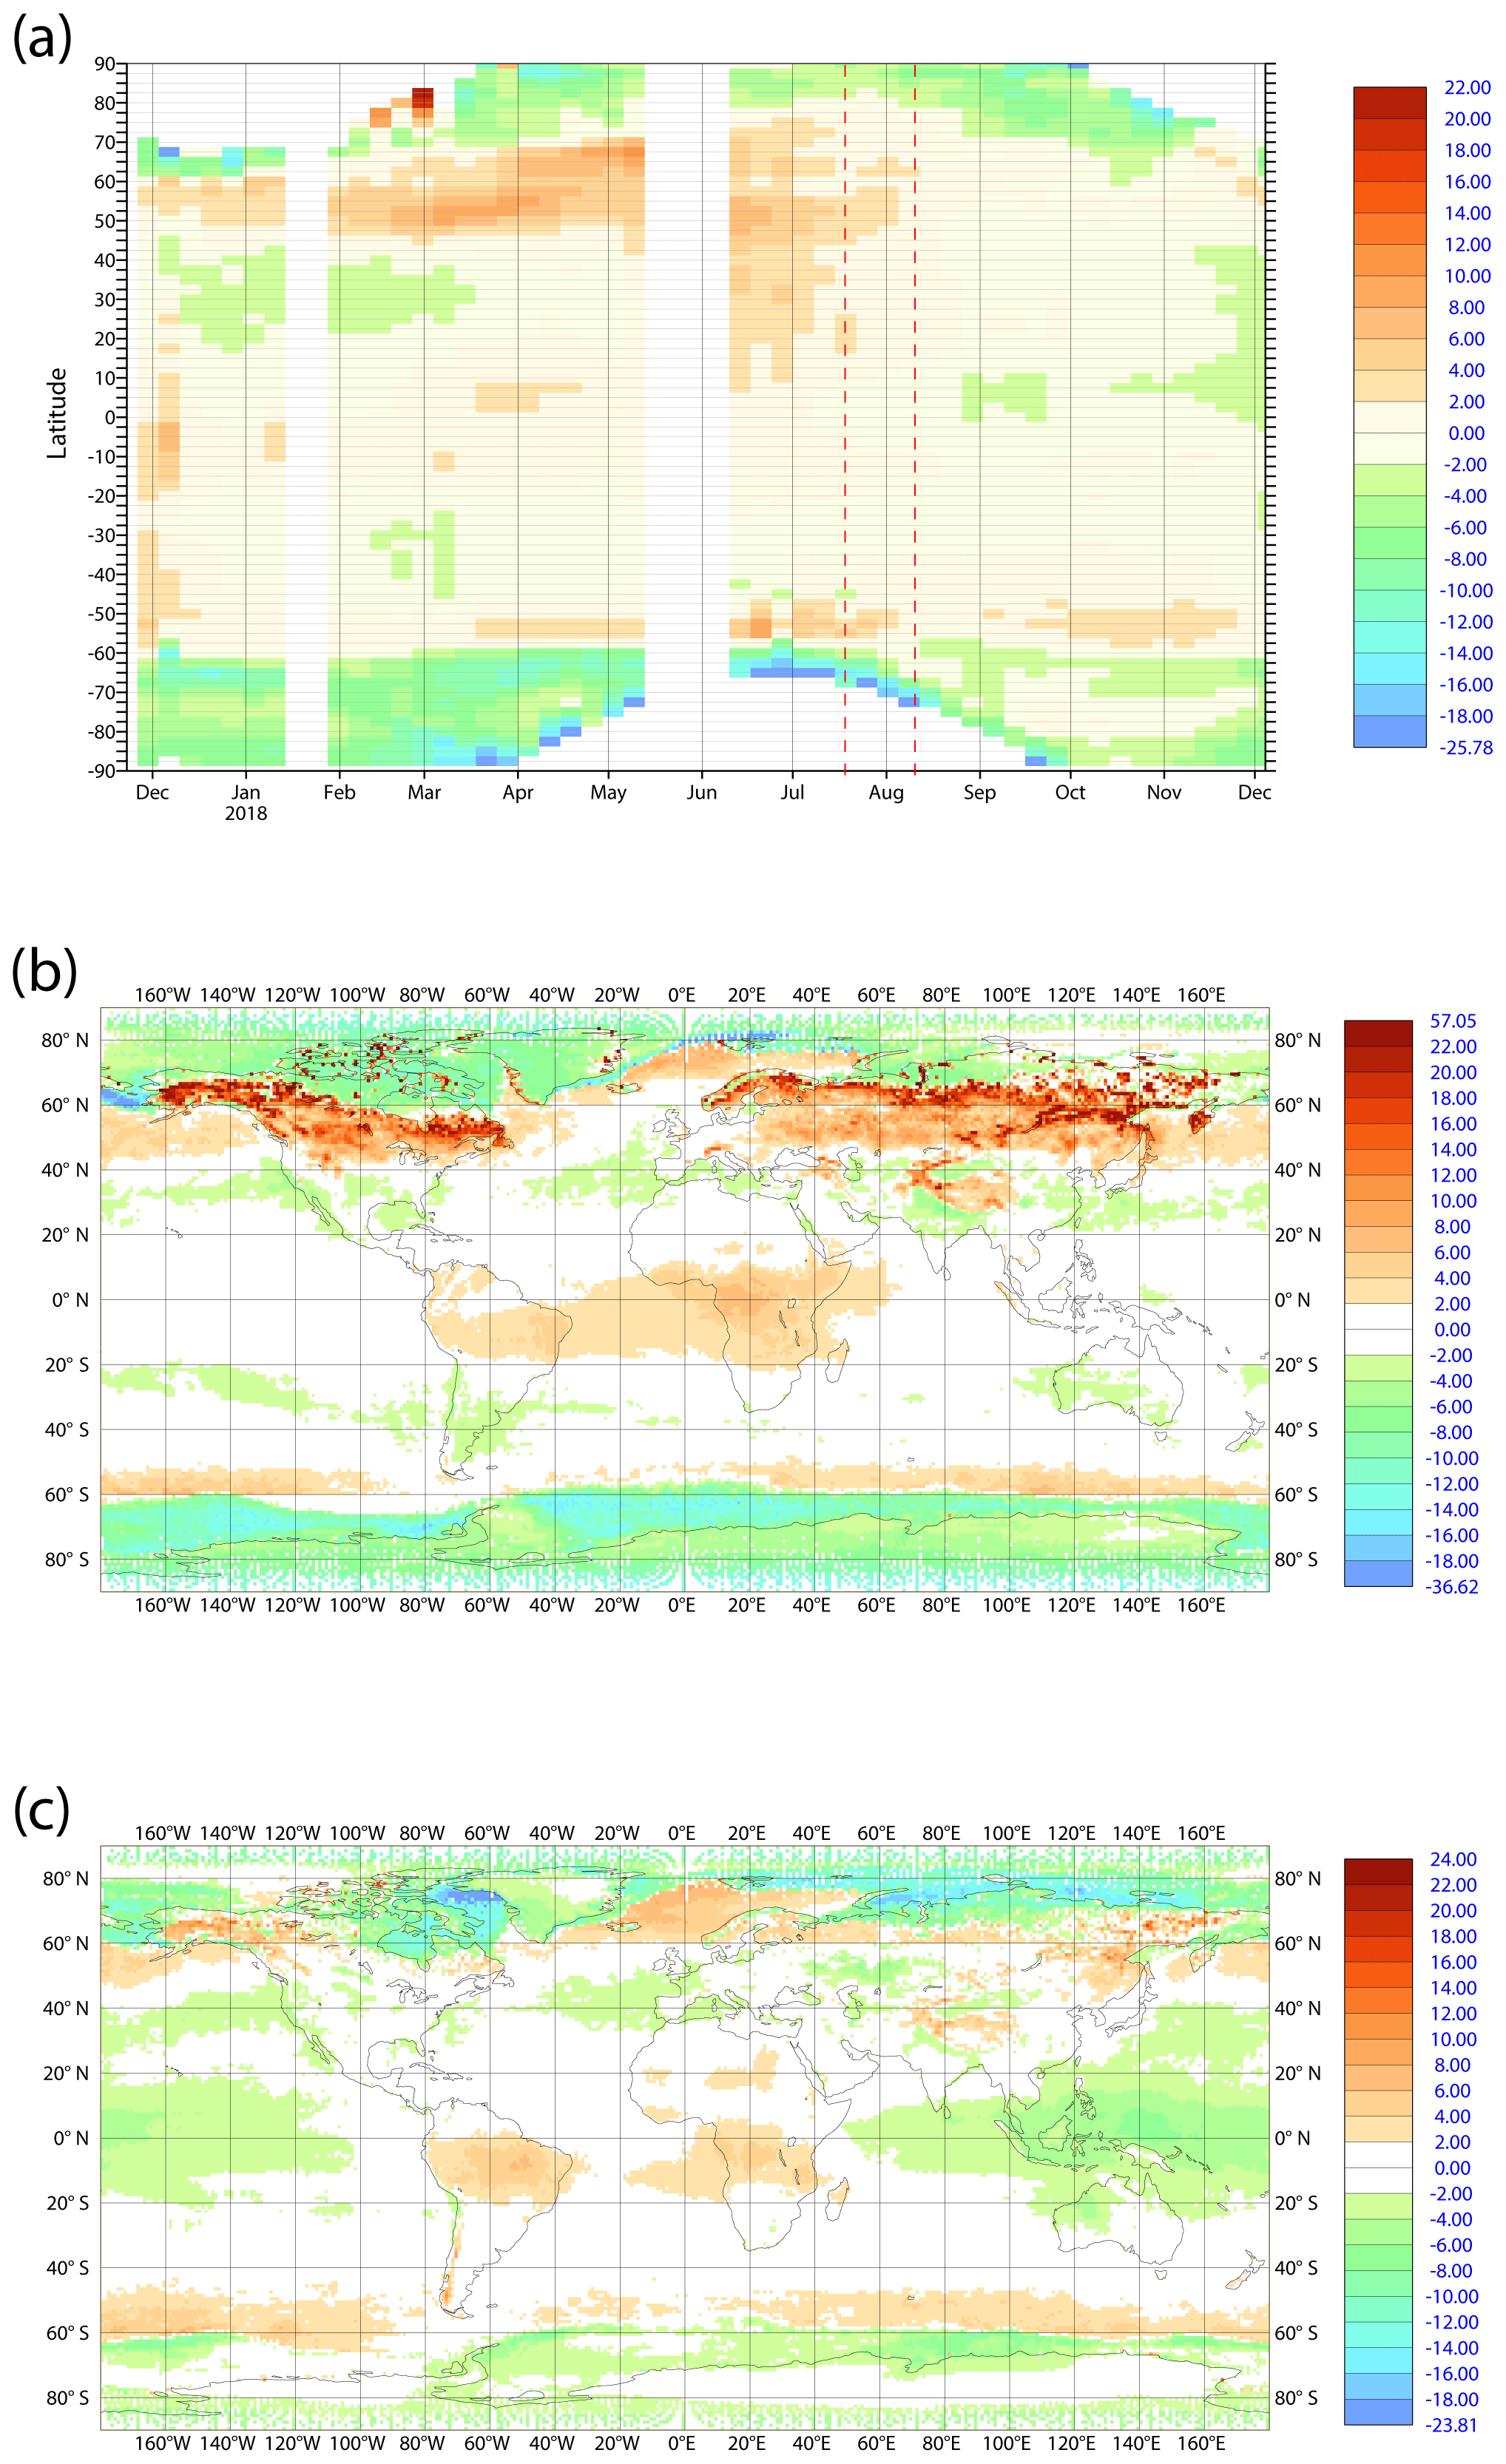
Figure 5(a) Time series of zonal mean weekly averaged TROPOMI TCO3 analysis departures (observations minus analysis) for the period 26 November 2017 to 30 November 2018. The red dashed lines mark changes in the retrieval versions (see Table 2). (b) Mean TROPOMI TCO3 analysis departures averaged over FMA 2018 and (c) mean analysis departures averaged over SON 2018. Only good data are shown. All values are in DU. Values smaller than 2 DU are white.
Figure 4 shows maps of the standard deviation of the four TCO3 retrievals over the whole period from 26 November 2017 to 3 November 2018. All retrievals show the same features with highest variability in the northern high latitudes and over Antarctica, where TCO3 values vary most during the course of a year, and the lowest variability in the tropics.
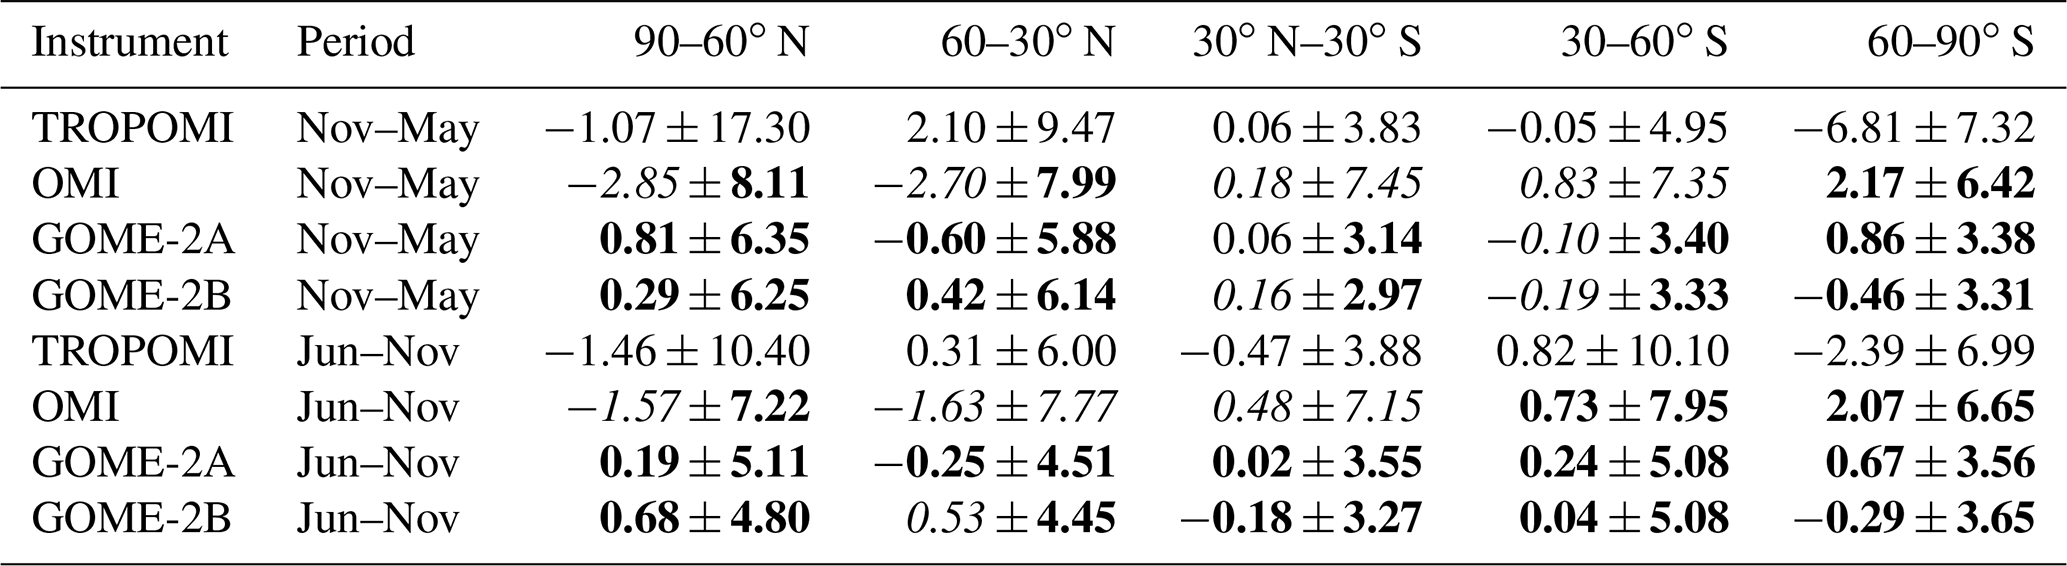
Table 3Mean bias and standard deviations of the TCO3 retrievals against the CAMS ozone analysis in DU from the control experiment (CTRL) for the periods 26 November 2017 to 3 May 2018 and 11 June to 30 November 2018. Numbers in bold mark where the biases and standard deviations of the other TCO3 data sets are smaller than in TROPOMI, italic marks where they are larger. Only good data are shown for TROPOMI and used data for the other instruments.
We now look at differences between TROPOMI and the CAMS ozone analysis, i.e. analysis departures. These departure plots show problems in the TROPOMI data more clearly than the comparison between instruments in Fig. 3, because they are not affected by issues from two different retrievals. Nevertheless, the main findings from Fig. 5 are similar to those from Fig. 3. Figure 5a shows a time series of zonal mean weekly averaged TROPOMI analysis departures for the period 26 November 2017 to 30 November 2018 and like Fig. 3 has the largest, mainly negative departures polewards of 60∘. Between 50∘ N and 60∘ S the zonal mean departures are within ±2–4 DU during most of the time series, i.e. less than 2 % of the zonal mean TCO3 (Fig. 2a). Larger positive departures are found between 50 and 60∘ N until August 2018 and between 50 and 60∘ S after the end of March. After the latest algorithm change to v1.1.2 in August, the zonal mean departures are less than ±2 DU between 60∘ N and 60∘ S most of the time and also smaller than −4 DU most of the time between 60 and 90∘ S. During FMA (Fig. 5b) TROPOMI is lower than the CAMS analysis south of 60∘ S and over land or snow/ice north of 60∘ N. TROPOMI is considerably higher than the CAMS analysis over land in the NH north of about 40∘ N with differences between 20 and 40 DU in places, a result of the issues with the surface albedo climatology discussed above. However, as TCO3 values are also large in these areas (see Fig. 3a1), this is still within about 10 % of the mean observation values. Large positive TROPOMI TCO3 departures are also seen over the Himalayas in FMA. In the other areas, TROPOMI agrees better with the model, with positive departures over the tropical Atlantic, Africa and South America (up to 8 DU, about 4 %) and small negative departures elsewhere. During SON (Fig. 5c) the departures are generally smaller than during FMA, especially over land in the NH. The largest negative departures are found over sea/ice north of 60∘ N (up to −20 DU). Over the maritime continent larger negative departures (up to −8 DU) are found during SON and FMA. As mentioned above this is probably caused by the update of the a priori in the TROPOMI retrievals that takes the tropospheric ozone wave one structure into account. We will show in Sect. 3.2.2 that the assimilation of TROPOMI improves the CAMS results compared to tropospheric ozone sondes and IAGOS measurements in the tropics, suggesting these differences point to a model bias rather than a problem with the data.
Table 3 lists mean biases and their standard deviations for the first half (November 2017–May 2018) and the second half (June–November 2018) of the time series. Averaged over November 2017–May 2018 TROPOMI shows a mean bias with respect to CAMS of DU between 90 and 60∘ N, 2.10±9.47 DU between 60 and 30∘ N, 0.06±3.83 DU between 30∘ N and 30∘ S, DU between 30 and 60∘ S and DU between 60 and 90∘ S. The mean bias between 90 and 60∘ N is relatively small because the positive biases over land and the negative ones over ice compensate (see Fig. 5a and b). This is also illustrated by the large standard deviation between 90 and 60∘ N. Table 3 also lists the values from the other three TCO3 retrievals and shows that the mean biases of TROPOMI are larger than those of GOME-2AB between 90 and 30∘ N and between 60 and 90∘ S but smaller between 30∘ N and 60∘ S. TROPOMI has smaller mean biases than OMI in all areas except 60–90∘ S. The standard deviations of the TROPOMI departures are larger than those of GOME-2AB in all areas and larger than those of OMI between 90 and 30∘ N and between 60 and 90∘ S but smaller than those of OMI between 30∘ N and 60∘ S. It should be born in mind, though, that used data are shown for GOME-2AB and OMI, and the CAMS analysis draws on the data, thus reducing the standard deviation of the departures, while good data are shown for TROPOMI and the TROPOMI data do not affect the CAMS analysis. For June to November 2018 TROPOMI has mean bias of DU between 90 and 60∘ N, 0.31±6.00 DU between 60 and 30∘ N, DU between 30∘ N and 30∘ S, 0.82±10.10 DU between 30 and 60∘ S and DU between 60 and 90∘ S. Again, the TROPOMI biases and standard deviations of the departures are larger than those of GOME-2AB in most areas, while the biases are smaller than those of OMI between 90∘ N and 30∘ S and larger between 30∘ and 90∘ S.

Figure 6Scatter plots of good TROPOMI NRT TCO3 analysis departures for (1) latitude, (2) solar elevation and (3) scan position for (a) FMA 2018 and (b) SON 2018. Values are in DU.
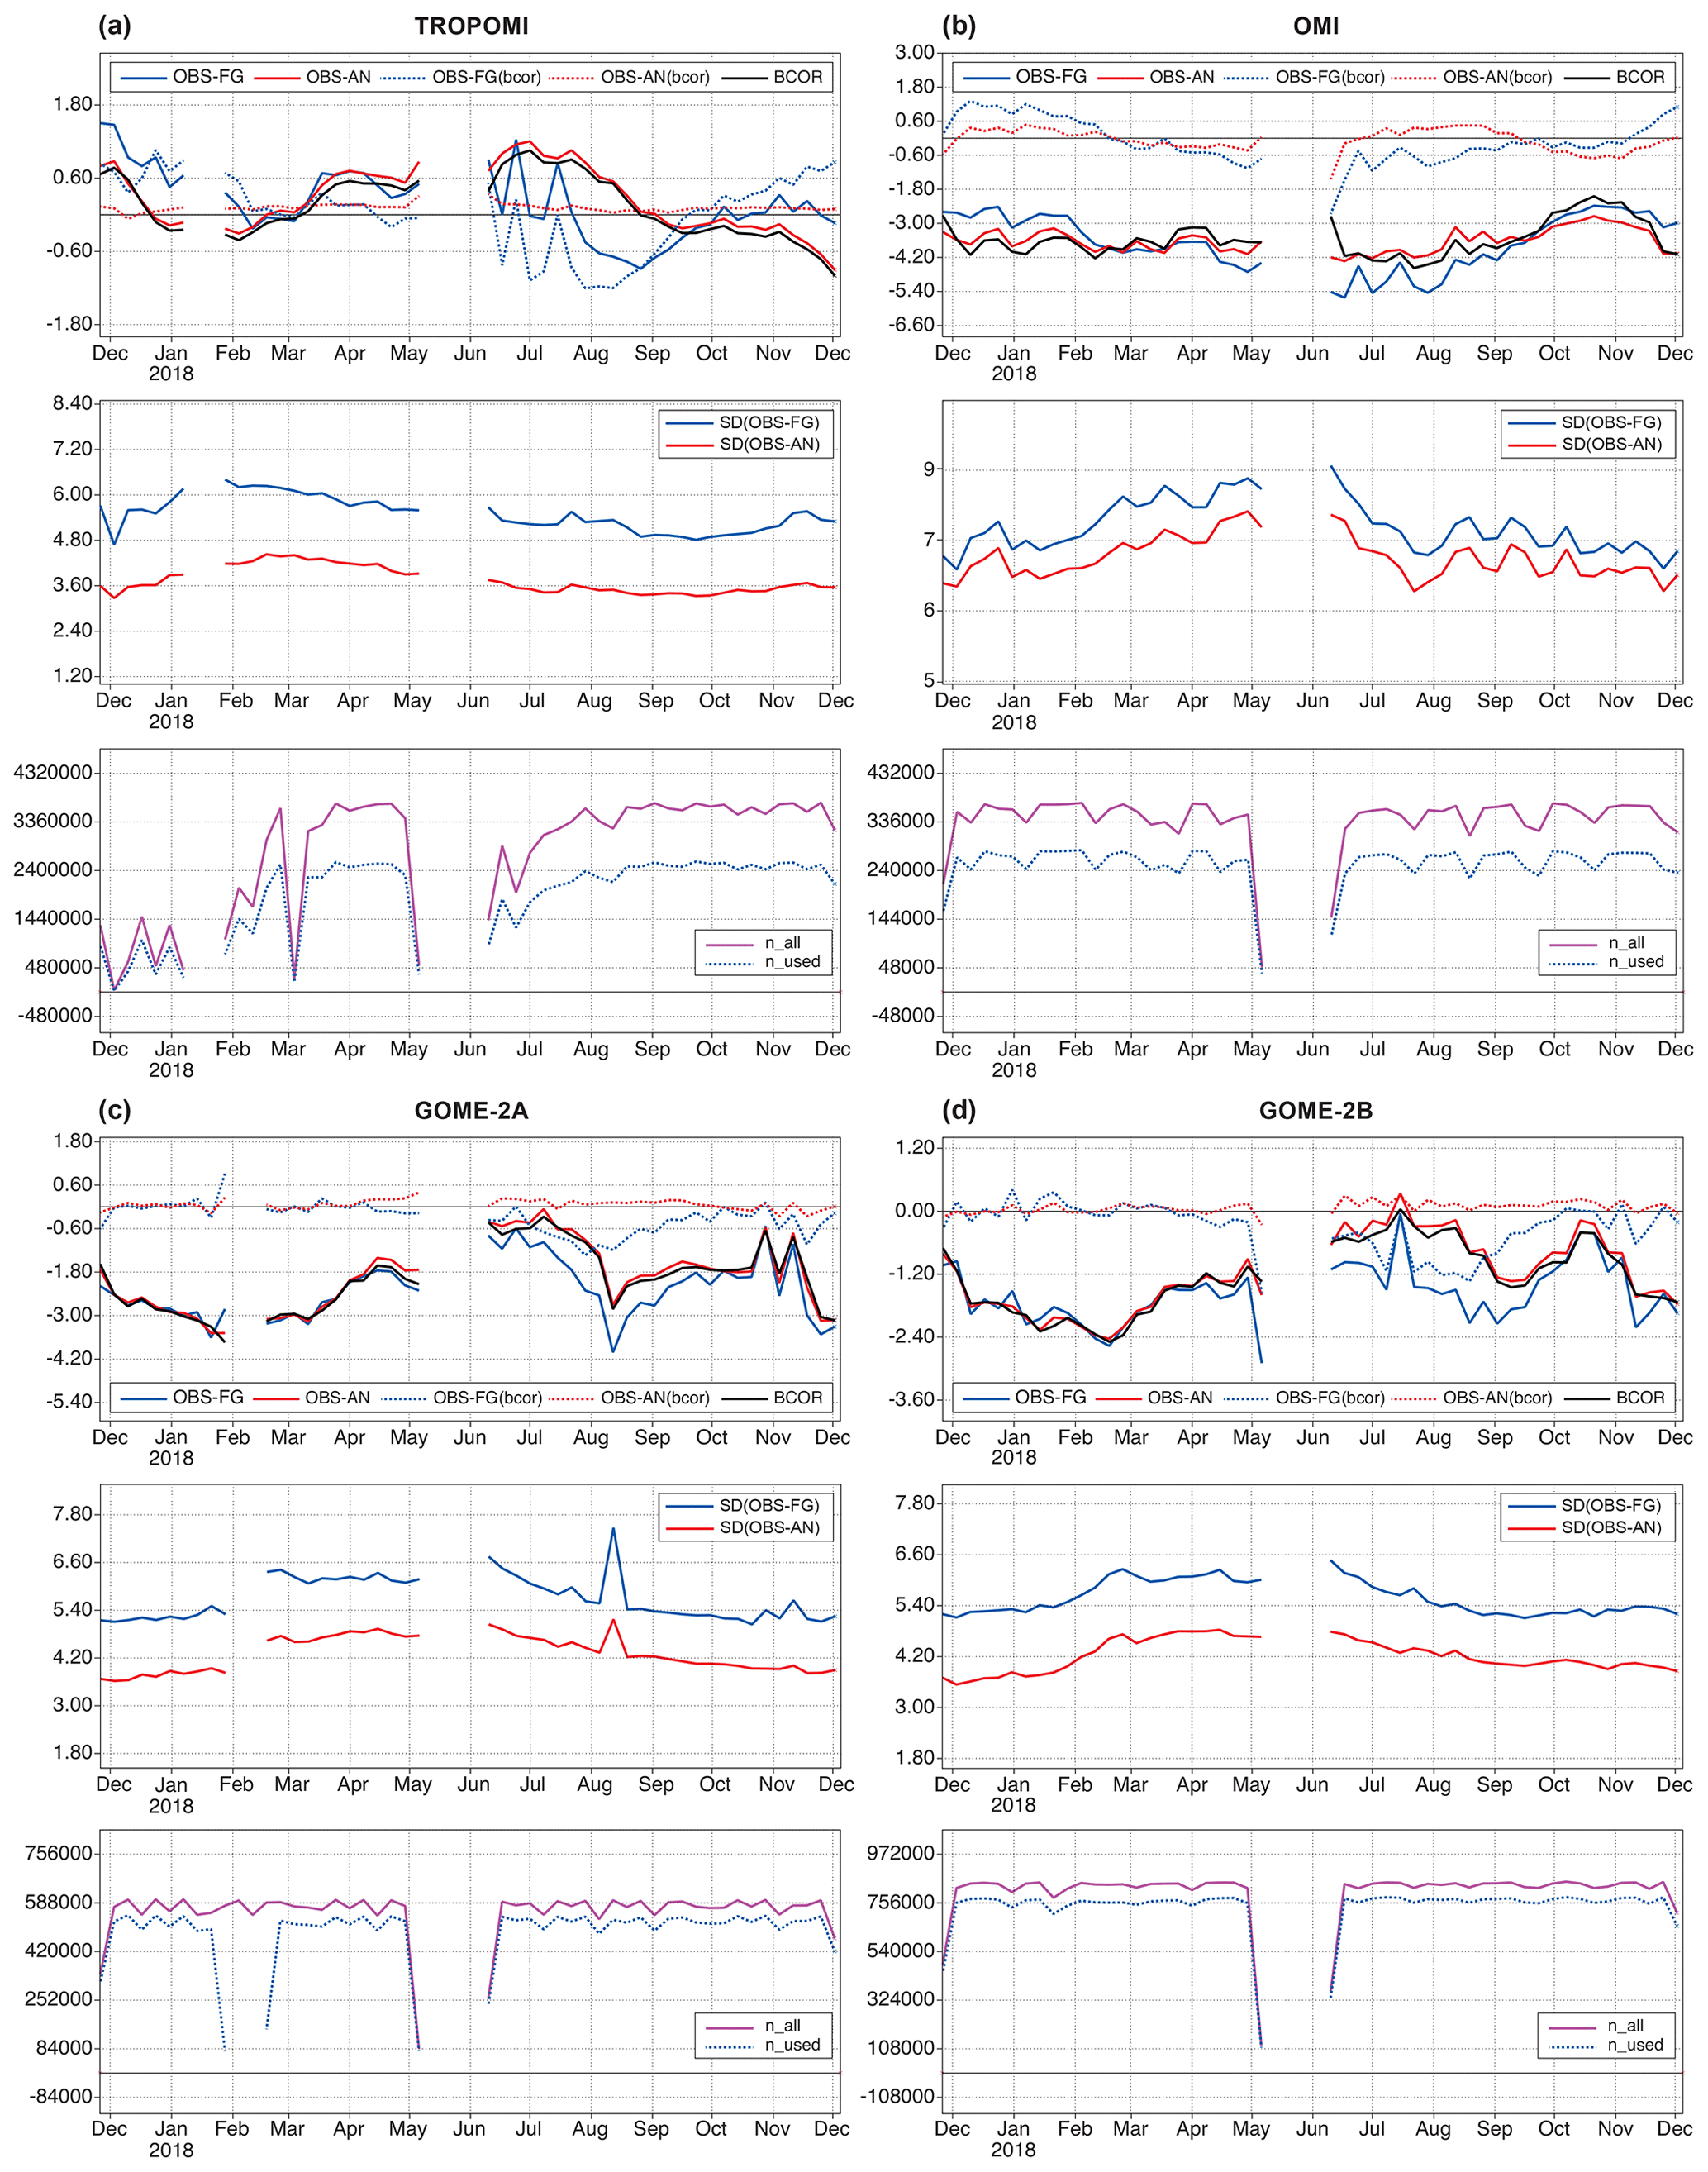
Figure 7Row 1: Time series for the period 26 November 2017 to 30 November 2018 of global mean weekly averaged TCO3 first-guess (solid blue) and analysis departures (solid red), bias-corrected first-guess (dotted blue) and analysis departures (dotted red) and bias correction (black) in DU. Row 2: standard deviation of first-guess (blue) and analysis departures (red) in DU. Row 3: number of data (used in blue, all in magenta) from (a) TROPOMI, (b) OMI, (c) GOME-2A and (d) GOME-2B. Used data are shown.
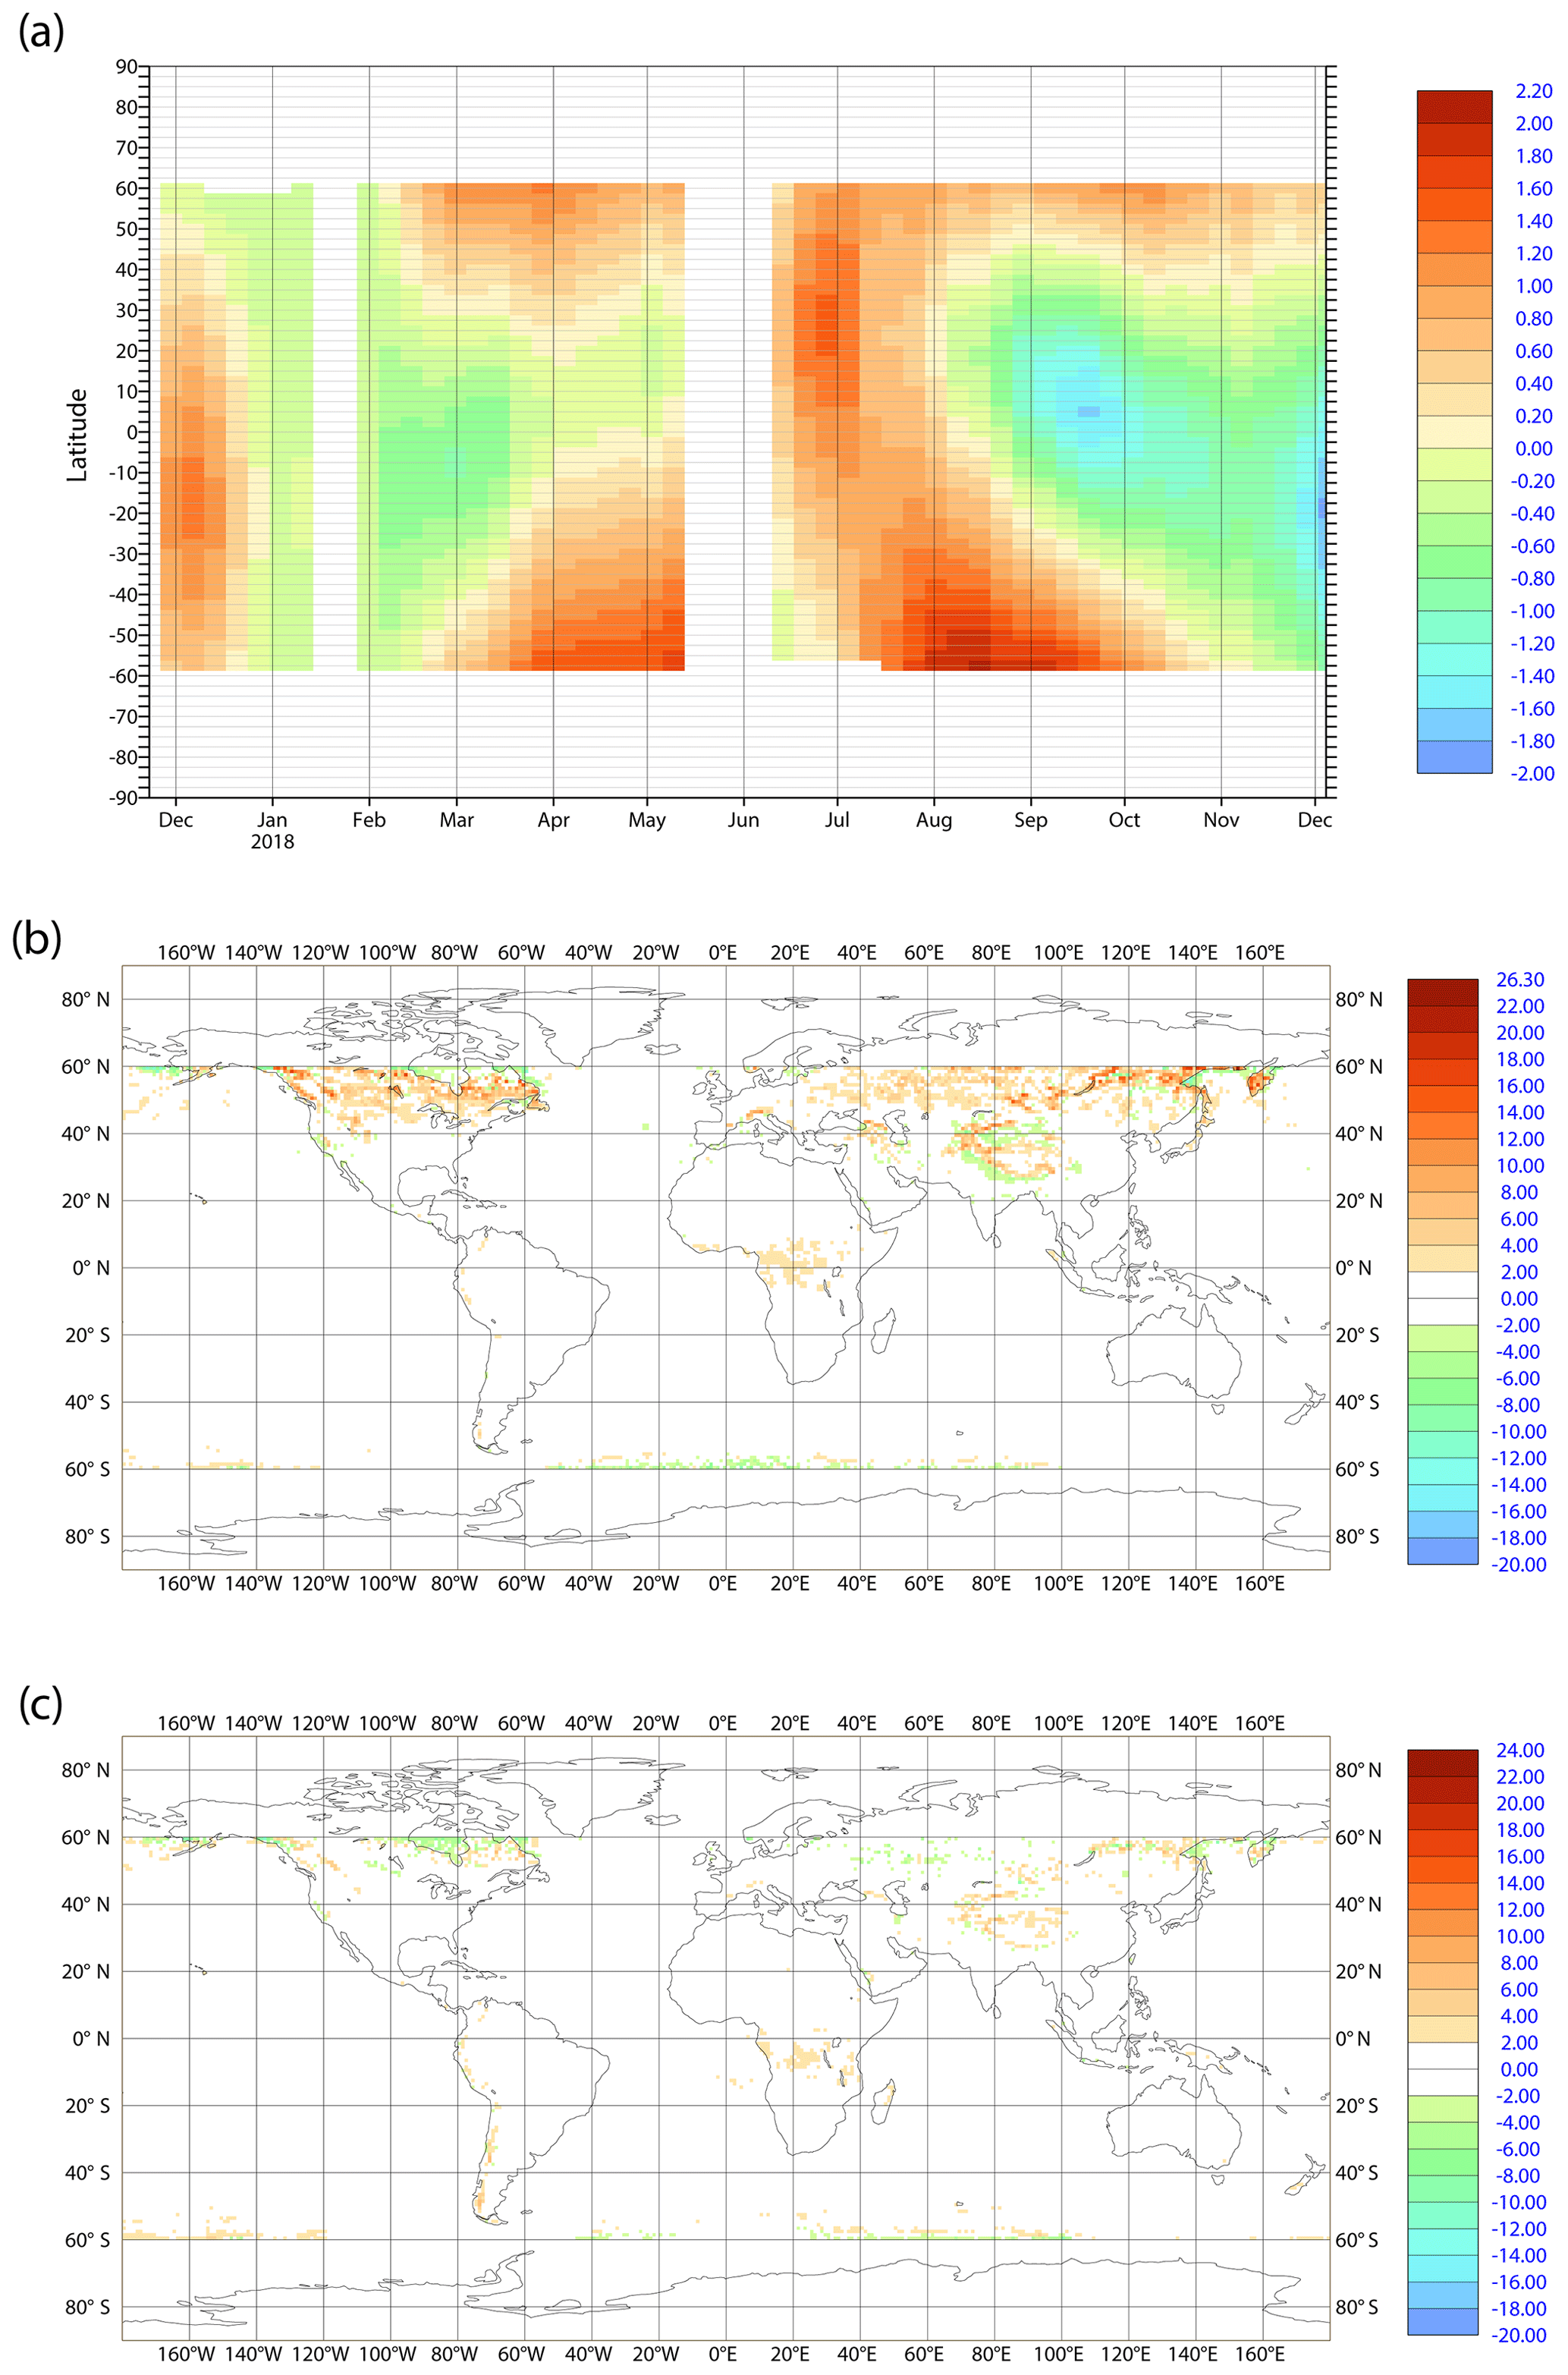
Figure 8(a) Time series of zonal mean weekly average bias correction applied to TROPOMI TCO3 for the period 26 November 2017 to 30 November 2018 and mean bias-corrected analysis departures for (b) FMA 2018 and (c) SON 2018 (compare with Fig. 5). All values are in DU.
Table 4Mean bias and standard deviations of the TCO3 retrievals against the CAMS ozone analysis in DU from the assimilation experiment (ASSIM) for the periods 26 November 2017 to 3 May 2018 and 11 June to 30 November 2018 for used data. Numbers in bold mark where the biases or standard deviations are smaller in ASSIM than in CTRL (Table 3), italic numbers mark where they are larger.
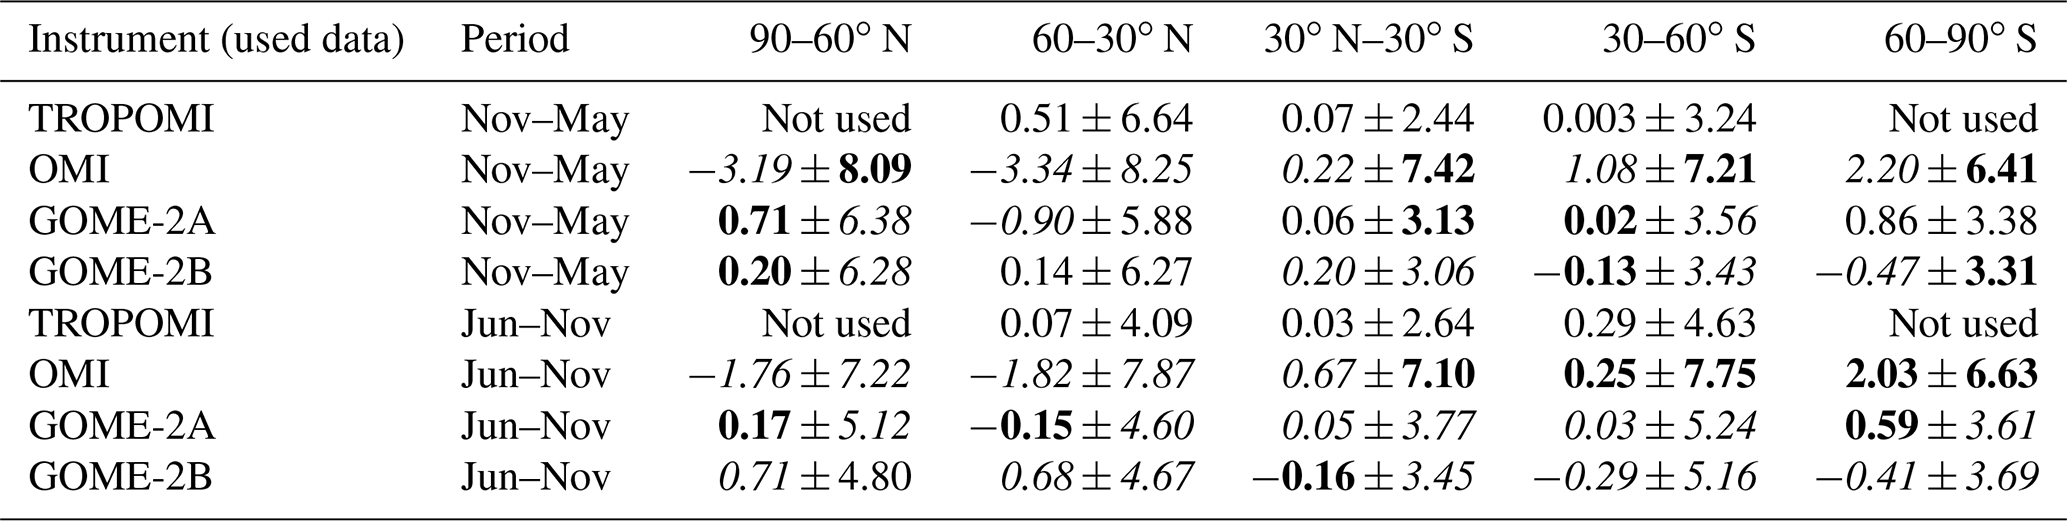
Figure 6 shows scatter plots of TROPOMI TCO3 analysis departures for the period 26 November 2017 to 30 November 2018 for latitude, solar elevation and scan position. Such plots can be very useful in identifying retrieval problems depending on the chosen parameters. In FMA, the scatter plot for latitude shows small mean departures between about 60∘ S and 45∘ N, positive departures between 45 and 70∘ N and negative departures polewards of 70∘ N and 60∘ S. This agrees with the averaged analysis departures shown in Fig. 5b and the Hovmöller plot in Fig. 5a and illustrates that there is a problem with the retrievals at high latitudes. The plot also shows that there is a large scatter polewards of 50∘ N and 60∘ S. Larger scatter at high latitudes is also seen for OMI and GOME-2AB if all good data are plotted (not shown). In SON, the mean departures plotted against latitude are generally small and do not show high values between 45 and 70∘ N any more. They are still negative polewards of 70∘ N and 60∘ S but smaller than in FMA. In FMA, the TROPOMI departures show a strong dependency on solar elevation with increasingly negative departures at solar elevations below 25∘. The SOE dependency is smaller in SON. For a sun-synchronous orbiting satellite, the SOE is mainly a function of the latitude; therefore this deviation might be caused by the latitudinal deviation discussed above. Departures in both seasons vary slightly depending on the scan position with increasingly negative departures towards the edges of the scan, especially on the western side of the scan. There is no dependency of the departures on cloud cover or cloud top pressure (not shown).
3.2 Assimilation tests with TROPOMI TCO3 NRT data
We showed in Sect. 3.1 that the TROPOMI TCO3 data are of good quality over large parts of the globe, but that there are some issues at high latitudes and low solar elevations, especially in FMA. The biases we observe outside those regions are of similar magnitude to the biases of the other total column data sets assimilated in CAMS (see Table 3), and we therefore do not expect any problems with the assimilation of TROPOMI NRT TCO3 if we bias correct the data and blacklist them appropriately. Hence, assimilation tests are carried out with the TROPOMI NRT TCO3 data for the period 26 November 2017 to 30 November 2018, blacklisting them for solar elevations less than 10∘ and poleward of 60∘. Restricting the assimilated data between 60∘ S and 60∘ N excludes the ozone hole observation in these tests. Variational bias correction is applied to the data in the same way as it is used for the other TCO3 data, i.e. with solar elevation and a global constant as predictors. The choice of these bias correction parameters can be altered in the future if needed.
3.2.1 Impact of the TROPOMI assimilation
Figure 7 shows time series of global mean weekly averaged TROPOMI, OMI and GOME-2AB TCO3 departures, bias correction, standard deviation of departures and number of observations between 26 November 2017 and 30 November 2018 for used data, i.e. the data that fulfil the blacklist criteria and quality checks listed in Table 1 and pass the variational quality control and first-guess checks applied by the IFS (see Sect. 2.1). The figure shows that the TROPOMI bias correction successfully removes the biases between the data and the model, so that the bias-corrected analysis departures are small. The bias correction calculates maximum values of about 1 DU in the global mean with the largest positive values between June and August and the largest negative values in November 2018. The magnitude of the global mean bias correction that is applied to TROPOMI is smaller than that of the other three TCO3 retrievals. Figure 7 shows that the analysis is drawing on the TROPOMI data (and the other three data sets), i.e. analysis departures are smaller than the first-guess departures and the standard deviation of the departures is reduced. About 2.4 million TROPOMI observations are used every week, which is 10 times as many observations as from OMI, 5 times as many as from GOME-2A and 3 times as many as from GOME-2B.
Table 4 lists mean biases and standard deviations from ASSIM for all four TCO3 retrievals for the period 26 November 2017 to 3 May 2018 and 11 June to 30 November 2018 for used data. It shows that TROPOMI TCO3 bias and standard deviation values are reduced in all three areas compared to the values in CTRL (see Table 3) as the analysis is drawing on the data. The fit to the other data sets is slightly degraded in some areas and improved in others when TROPOMI data are also assimilated (see Table 4), but overall the differences between the biases and the standard deviations of the departures of GOME-2AB and OMI from ASSIM and CTRL are small.
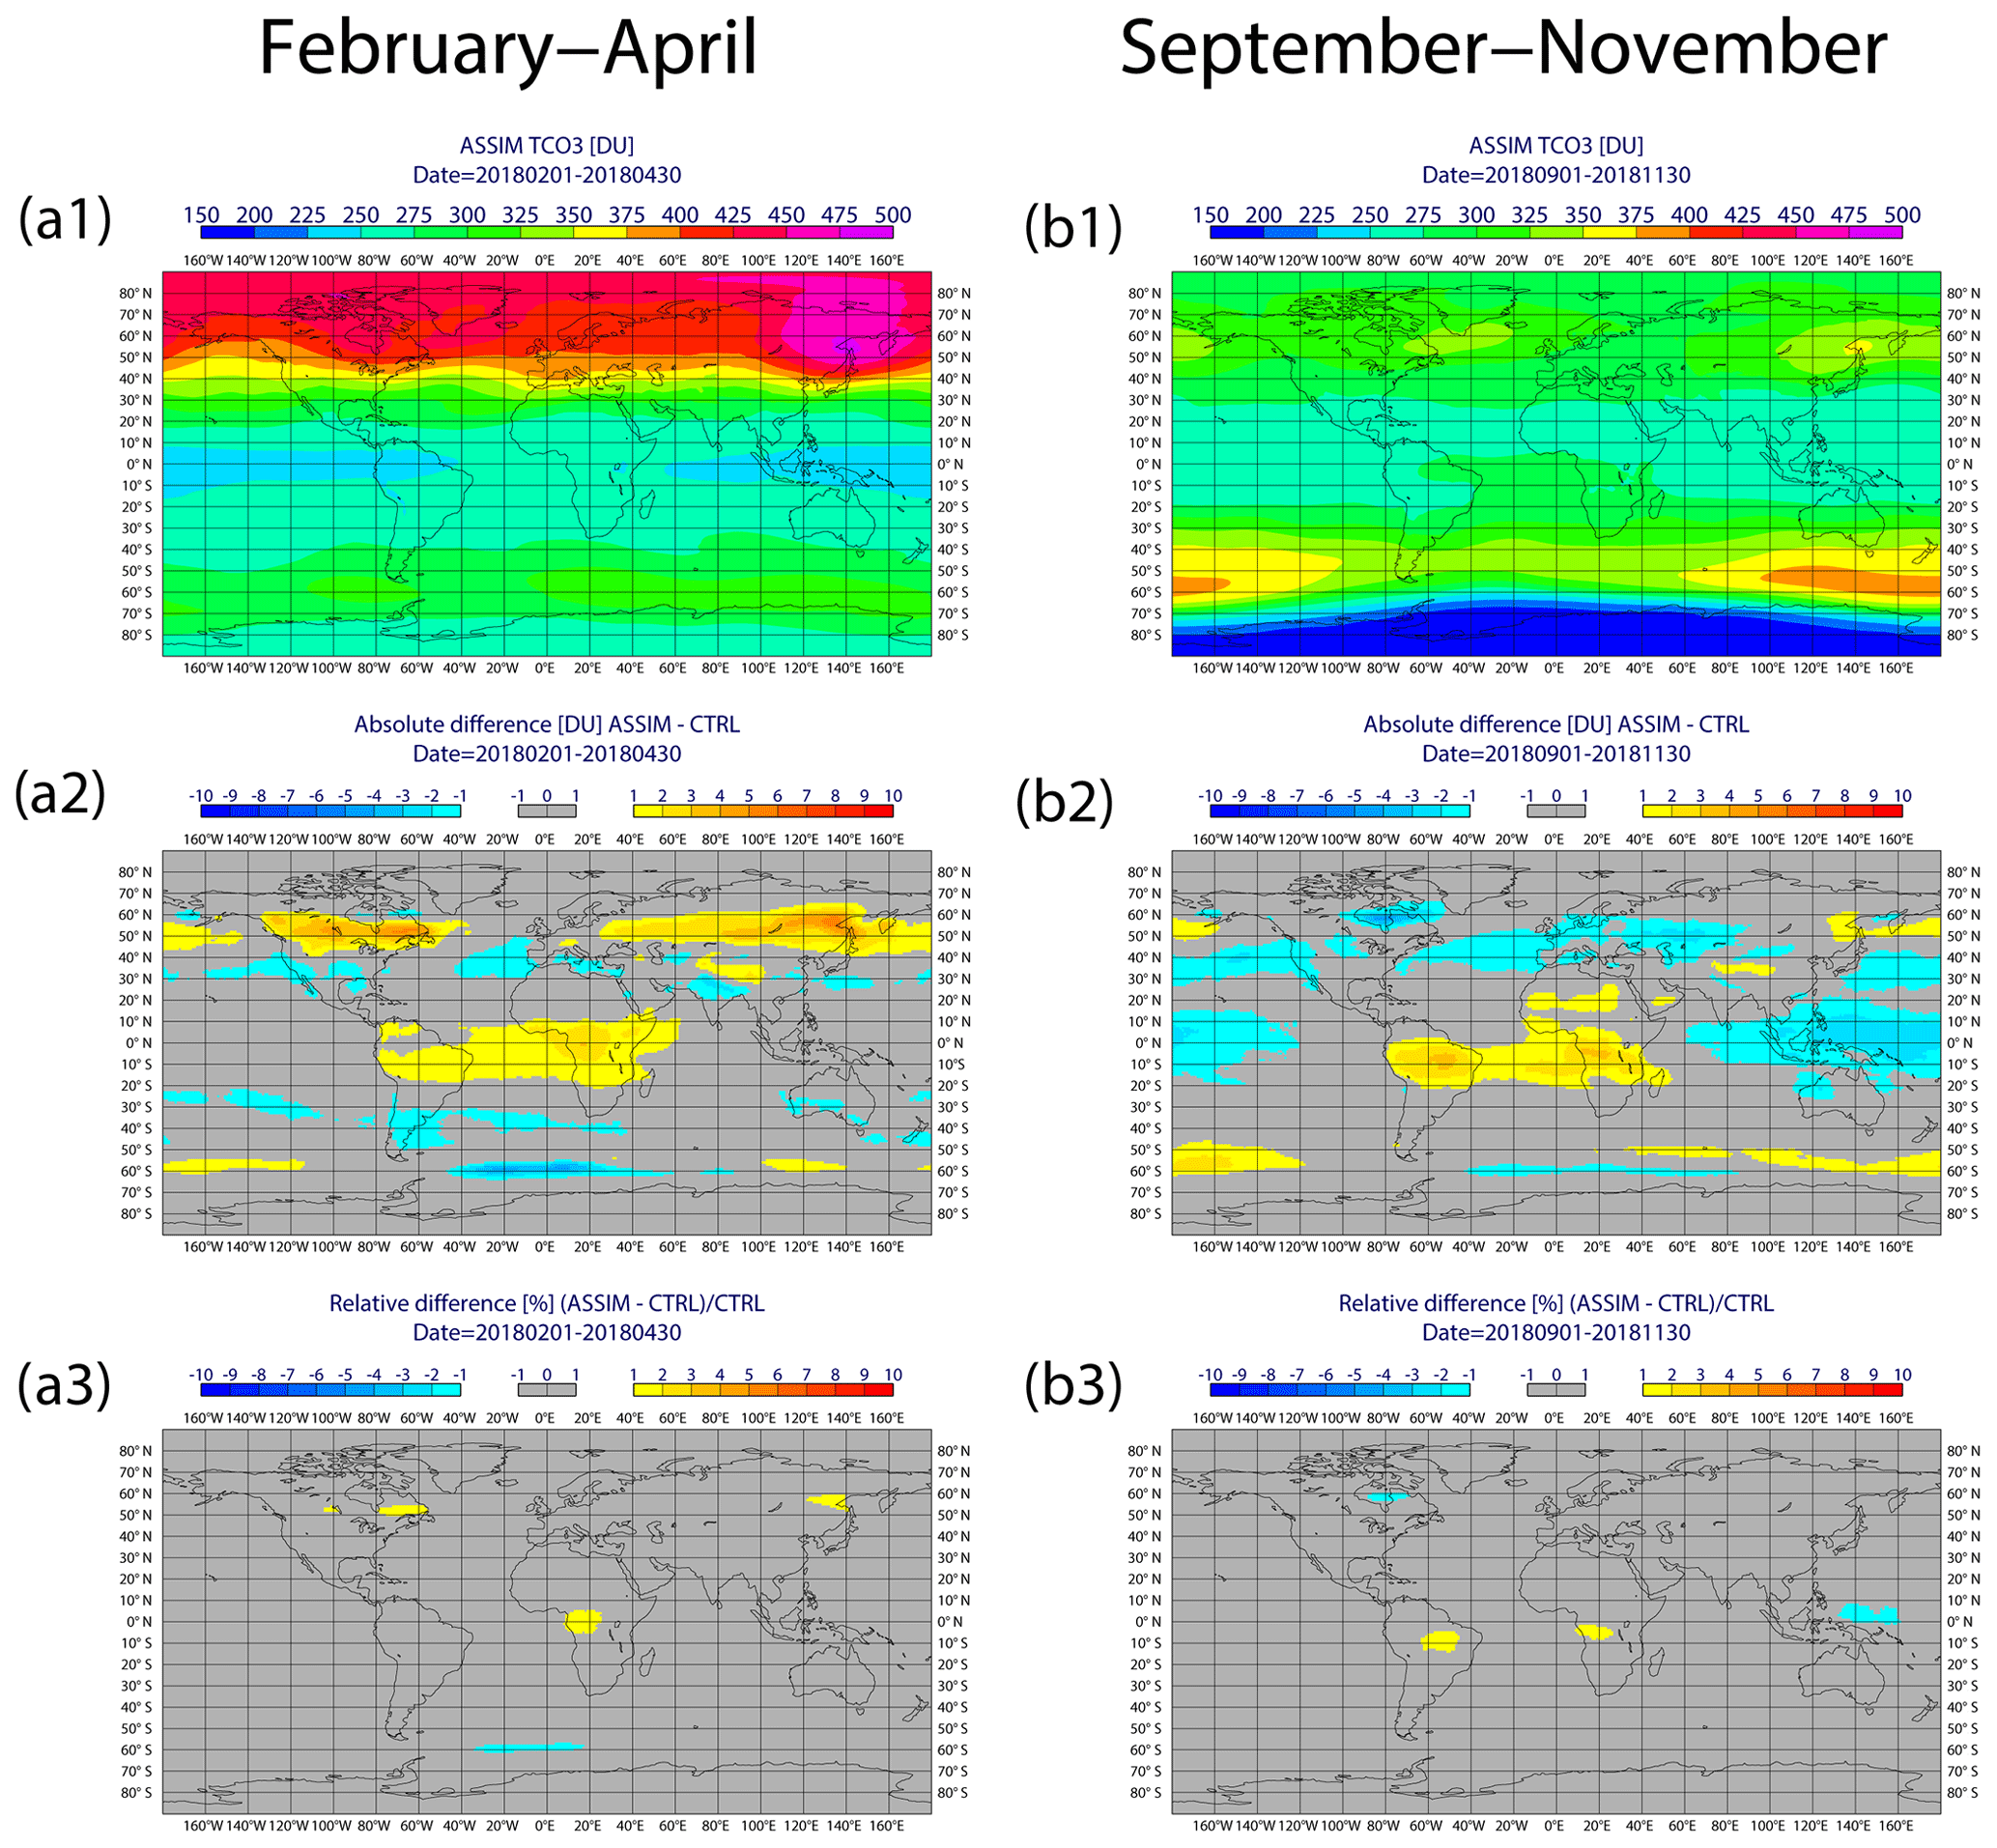
Figure 9Average fields for (a) FMA and (b) SON 2018. (1) Mean TCO3 analysis from ASSIM, (2) the absolute differences between ASSIM and CTRL in DU and (3) the relative differences between ASSIM and CTRL in percent.
Figure 8a shows a time series of the zonal mean weekly averaged bias correction that is applied to TROPOMI data for the period 26 November 2017 to 30 November 2018. The figure illustrates how the bias correction changes with time as it adapts to the data and that the mean bias-corrected TROPOMI analysis departures for FMA (Fig. 8b) and SON (Fig. 8c) are small compared to CTRL (Fig. 5b and c) as the analysis is drawing on the TROPOMI data. Some larger positive departures remain over land in the NH in FMA, where observation outliers are given less weight by the analysis.
Figure 9 shows the mean TCO3 fields from ASSIM for FMA and SON 2018 as well as the absolute and relative differences between ASSIM and CTRL. It illustrates that the impact of the TROPOMI assimilation in relative terms is small with relative differences of less than 2 % everywhere and less than 1 % in most areas. The absolute differences are largest over land in the NH in FMA, with ASSIM up to 10 DU higher than CTRL. However, the absolute TCO3 values are also largest then. Positive differences are also found in an area stretching from South America over the Atlantic to Africa in FMA and SON and in small bands around 60∘ S. In most other areas, the differences are below −2 DU and negative.
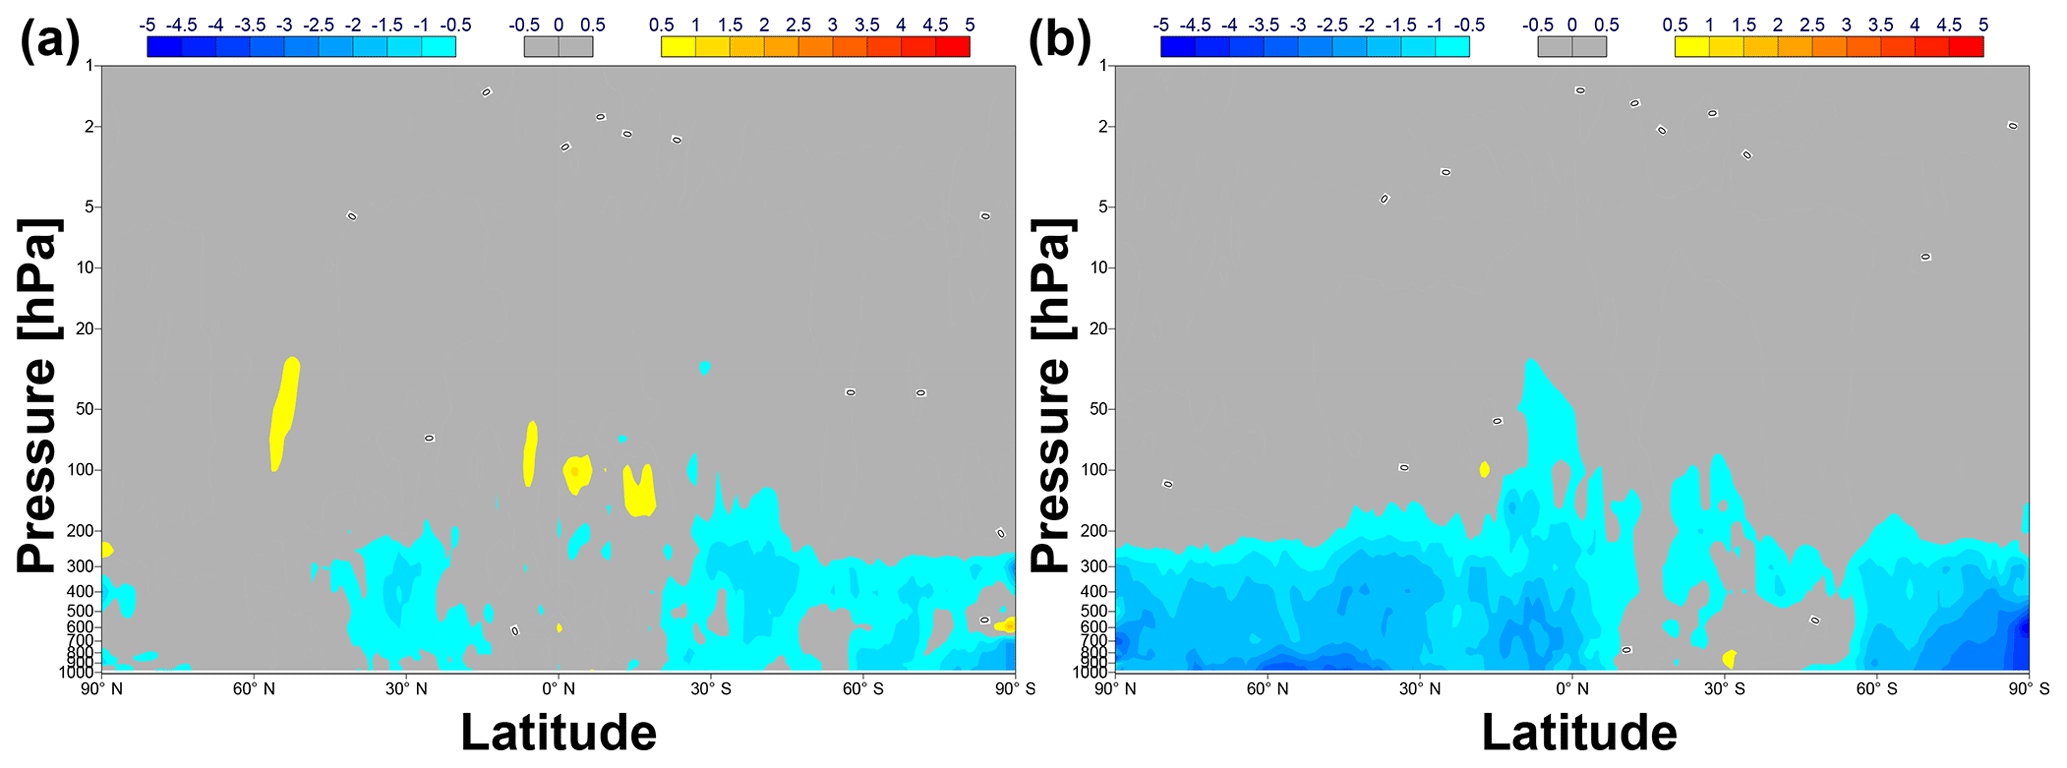
Figure 10Cross section of relative zonal mean O3 mixing ratio differences from ASSIM minus CTRL averaged over (a) FMA 2018 and (b) SON 2018 in percent.
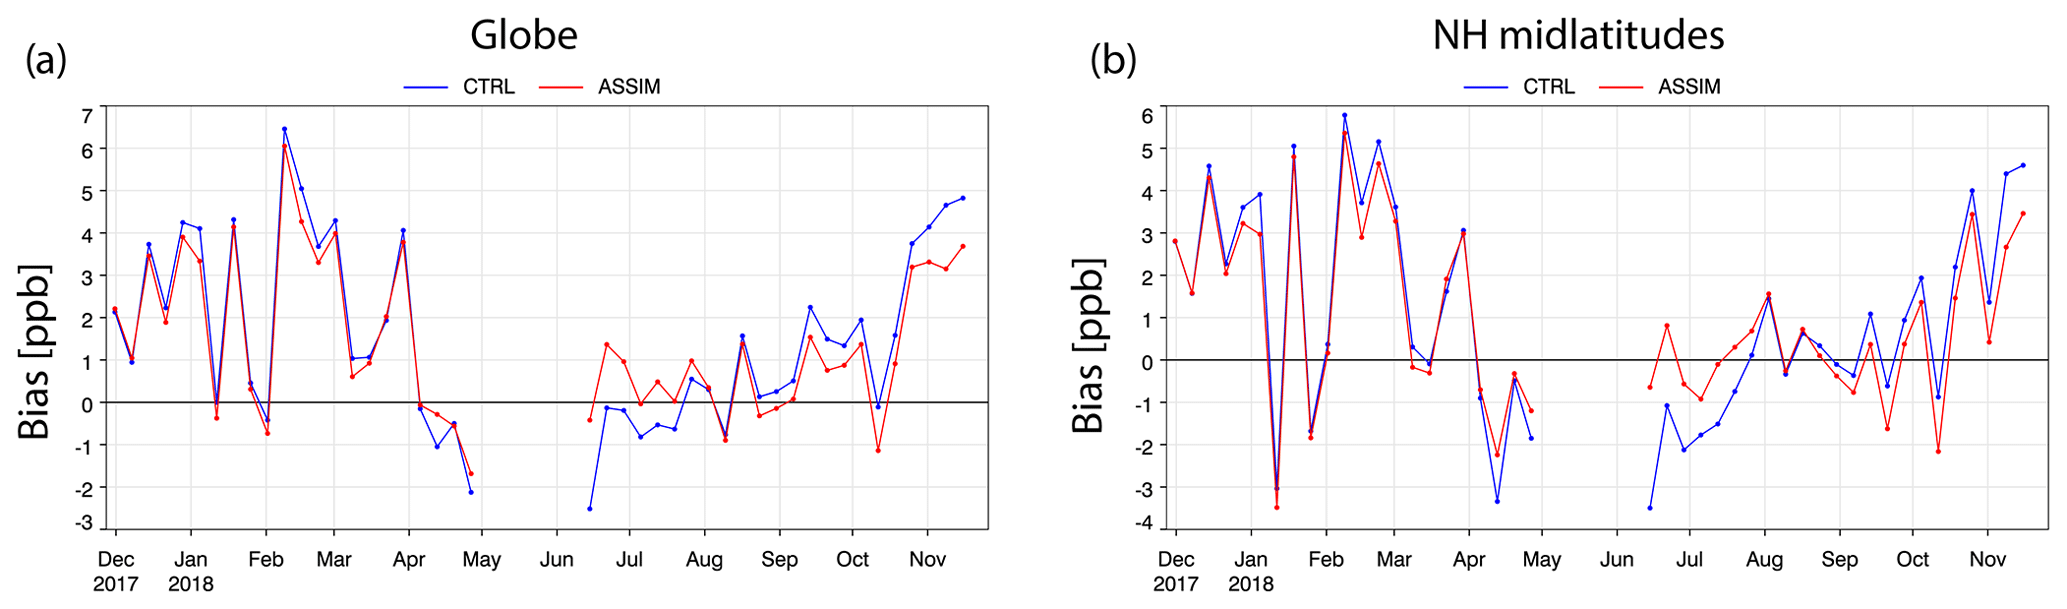
Figure 11Time series of weekly averaged TCO3 bias in DU from ASSIM (red) and CTRL (blue) compared to WOUDC Brewer data averaged over (a) the globe (between 15 and 33 sites) and (b) NH midlatitudes (between 12 and 19 sites).
Figure 10 shows cross sections of zonal mean relative O3 mixing ratio differences from ASSIM minus CTRL averaged over FMA and SON. Again, the impact of TROPOMI assimilation is small with the largest relative differences found in the troposphere. Here the TROPOMI data act to lower the ozone values in ASSIM in the zonal mean. In FMA the impact is less than 1 % everywhere. In SON, the differences in the troposphere are slightly larger and reach values of up to −3 % near the surface at NH midlatitudes and over the South Pole. Note that no TROPOMI data were assimilated south of 60∘ S so the changes seen here come from transport. Also, note that the absolute O3 values in the lower troposphere over the Antarctic are small.
3.2.2 Validation with independent observations
To assess if the assimilation of TROPOMI TCO3 retrievals improves or degrades the CAMS analysis, the O3 fields from ASSIM and CTRL are compared with independent observations. We use the following data sets for comparison. (1) Brewer spectrometer measurements were obtained from the World Ozone and Ultraviolet Radiation Data Centre (WOUDC). The Brewer data are calibrated with a precision of 1 % (Basher, 1982). (2) Ozone sonde data came from a variety of data centres: WOUDC, Southern Hemisphere ADditional OZonesondes (SHADOZ), Network for the Detection of Atmospheric Composition Change (NDACC), and campaigns for the Determination of Stratospheric Polar Ozone Losses (MATCH). The precision of electrochemical concentration cell (ECC) ozone sondes is of the order of ±5 % in the range between 200 and 10 hPa, between −14 % and +6 % above 10 hPa, and between −7 % and +17 % below 200 hPa (Komhyr et al., 1995). Larger errors are found in the presence of steep gradients and where the ozone amount is low. The same order of precision was found by Steinbrecht et al. (1998) for Brewer–Mast sondes. (3) Ozone profiles from instruments mounted on commercial aircraft from the In-service Aircraft for a Global Observing System (IAGOS). The IAGOS ozone data have a detection limit of 2 ppbv and a precision of ±(2 ppbv + 2 %) (Marenco et al., 1998). (4) Ground-based data from the World Meteorological Organisation's Global Atmosphere Watch (GAW) surface observation network (e.g. Oltmans and Levy, 1994; Novelli and Masarie, 2014). The GAW observations represent the global background away from the main polluted areas. GAW O3 data have a precision of ±1 ppbv (Novelli and Masarie, 2014).
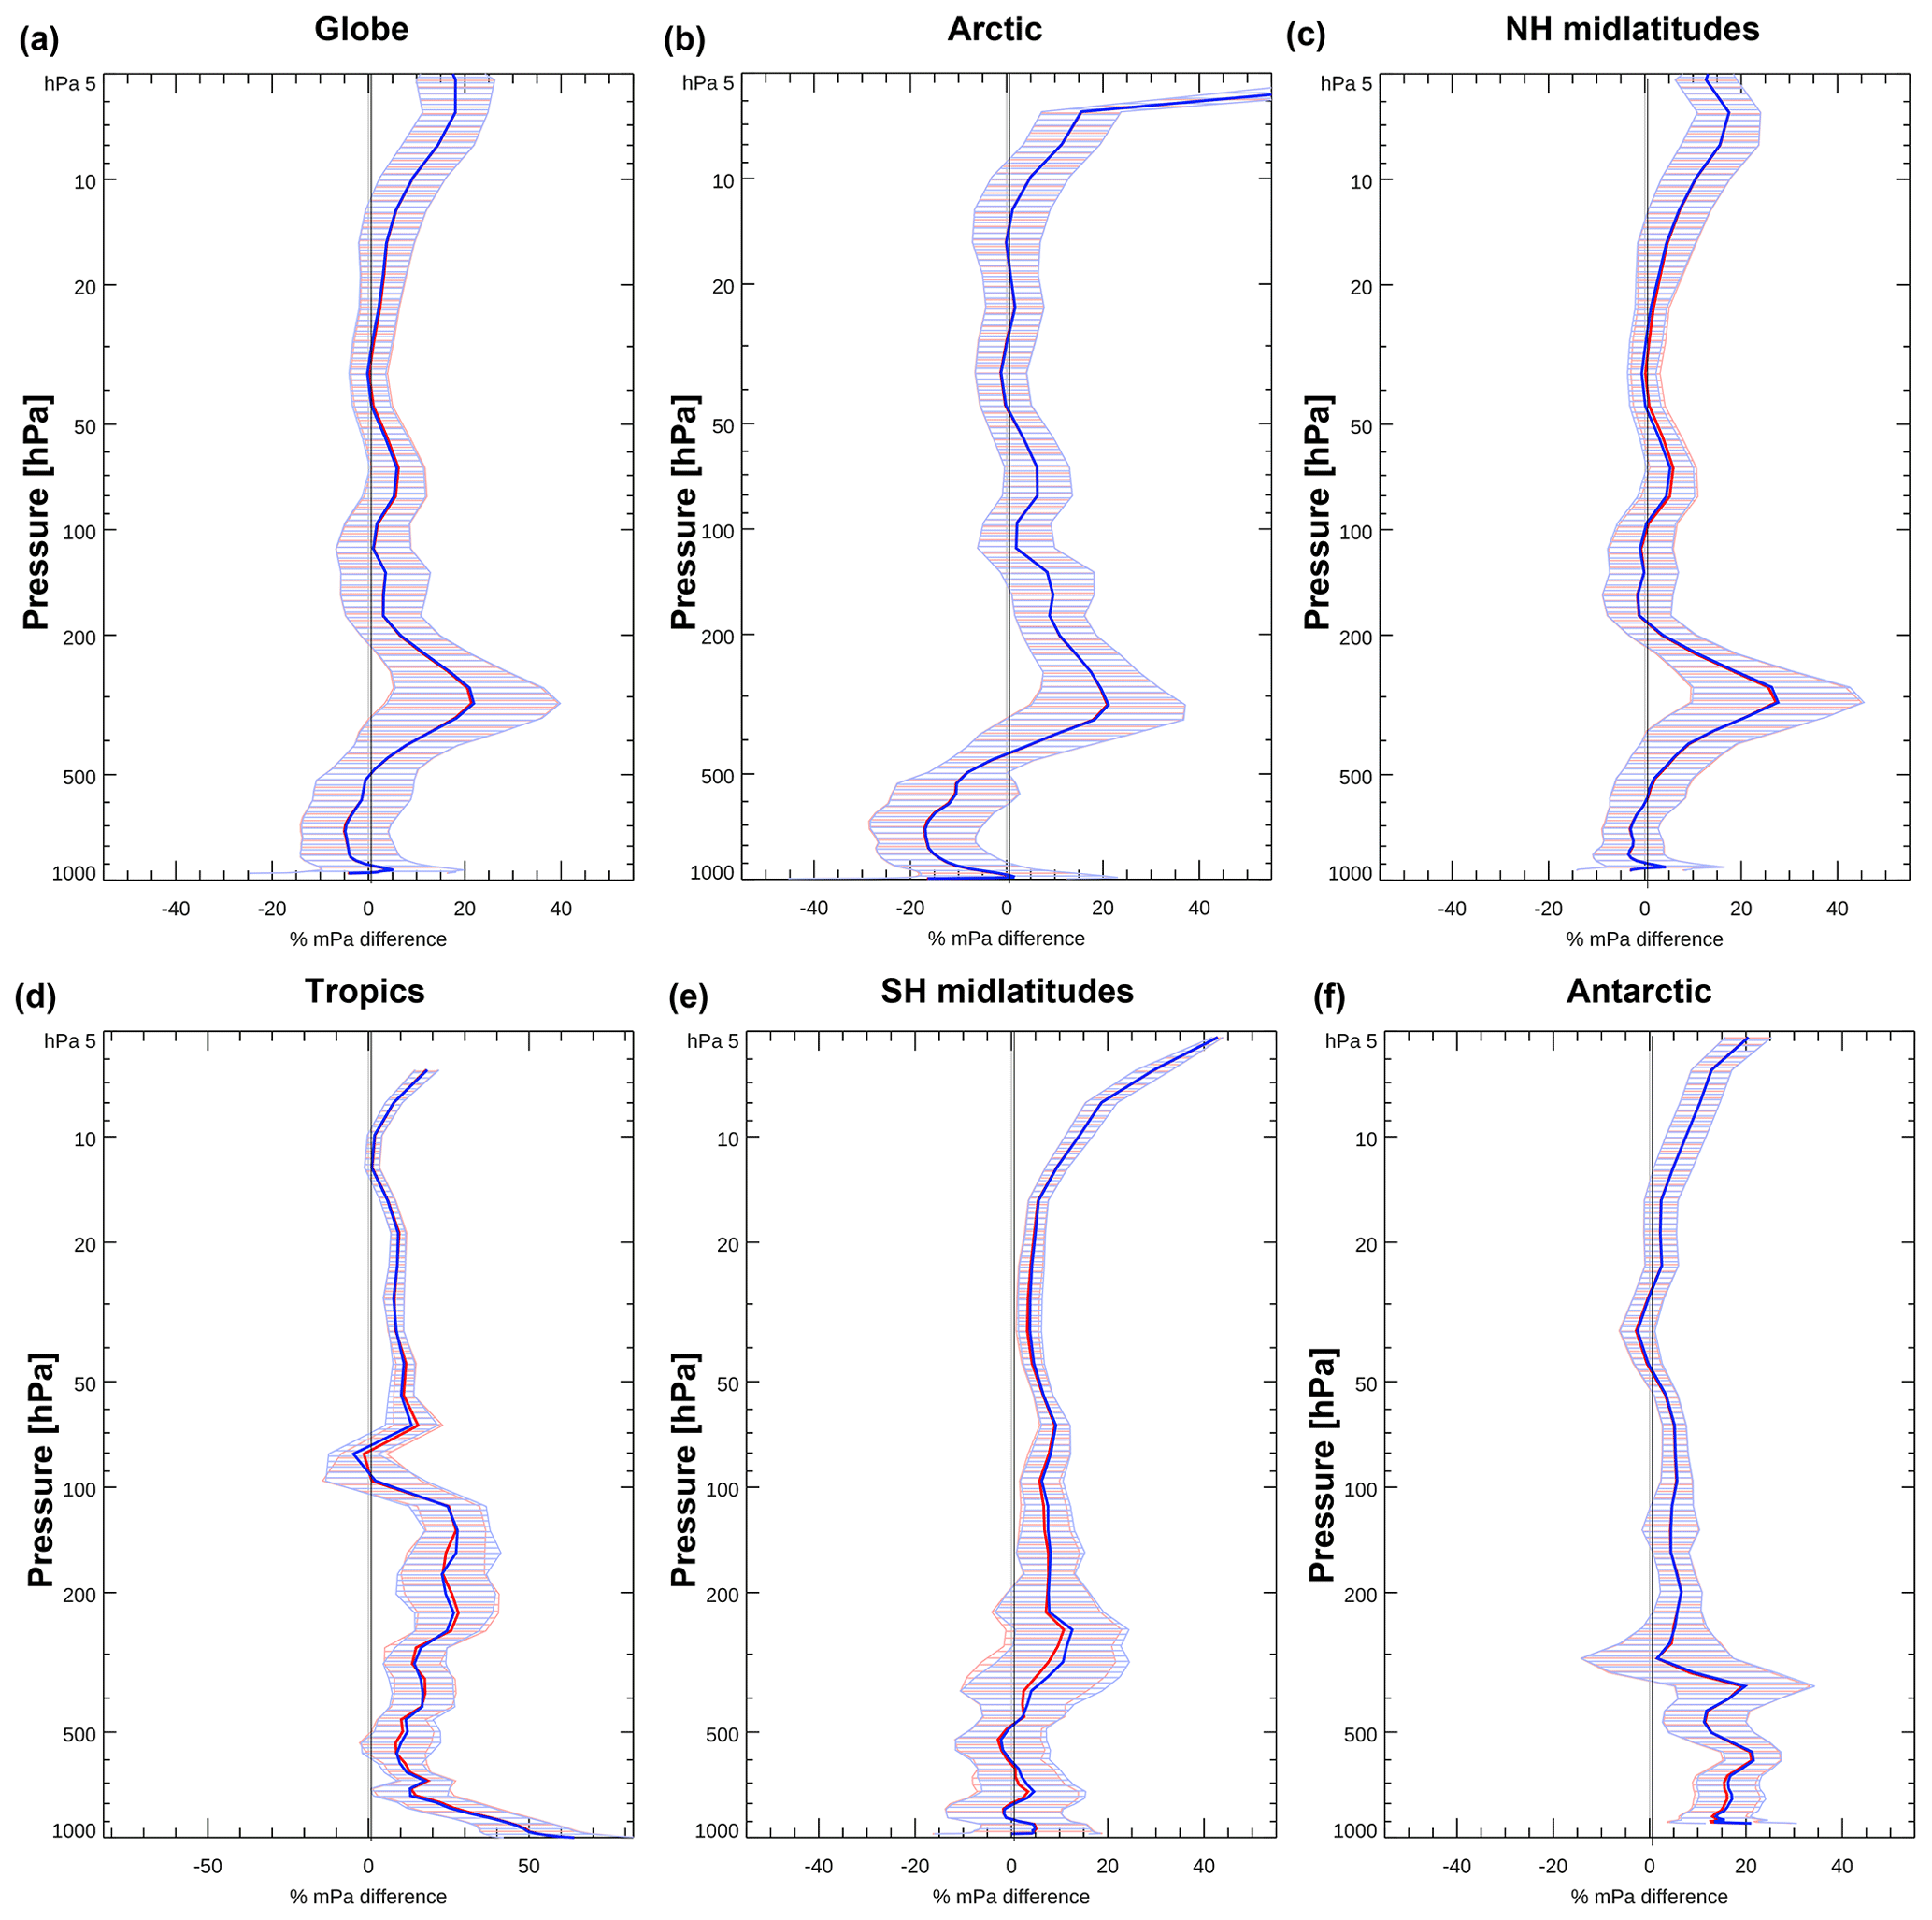
Figure 12Mean relative O3 bias for FMA 2018 in percent between ASSIM (red) and CTRL (blue) and ozone sondes averaged over the (a) globe, (b) Arctic, (c) NH midlatitudes, (d) tropics, (e) SH midlatitudes and (f) Antarctic.
Figure 11 shows time series of the weekly averaged TCO3 biases from ASSIM and CTRL against Brewer measurements averaged over the globe and NH midlatitudes for the period 26 November 2017 to 30 November 2018. The Figure shows a generally good agreement of both experiments with the Brewer data with maximum biases of less than 6 DU. It confirms that the impact of the TROPOMI assimilation in the CAMS system is small with differences between ASSIM and CTRL of less than 1 DU in the total column. Despite being small, the impact usually leads to an improved fit to the WOUDC data in ASSIM.
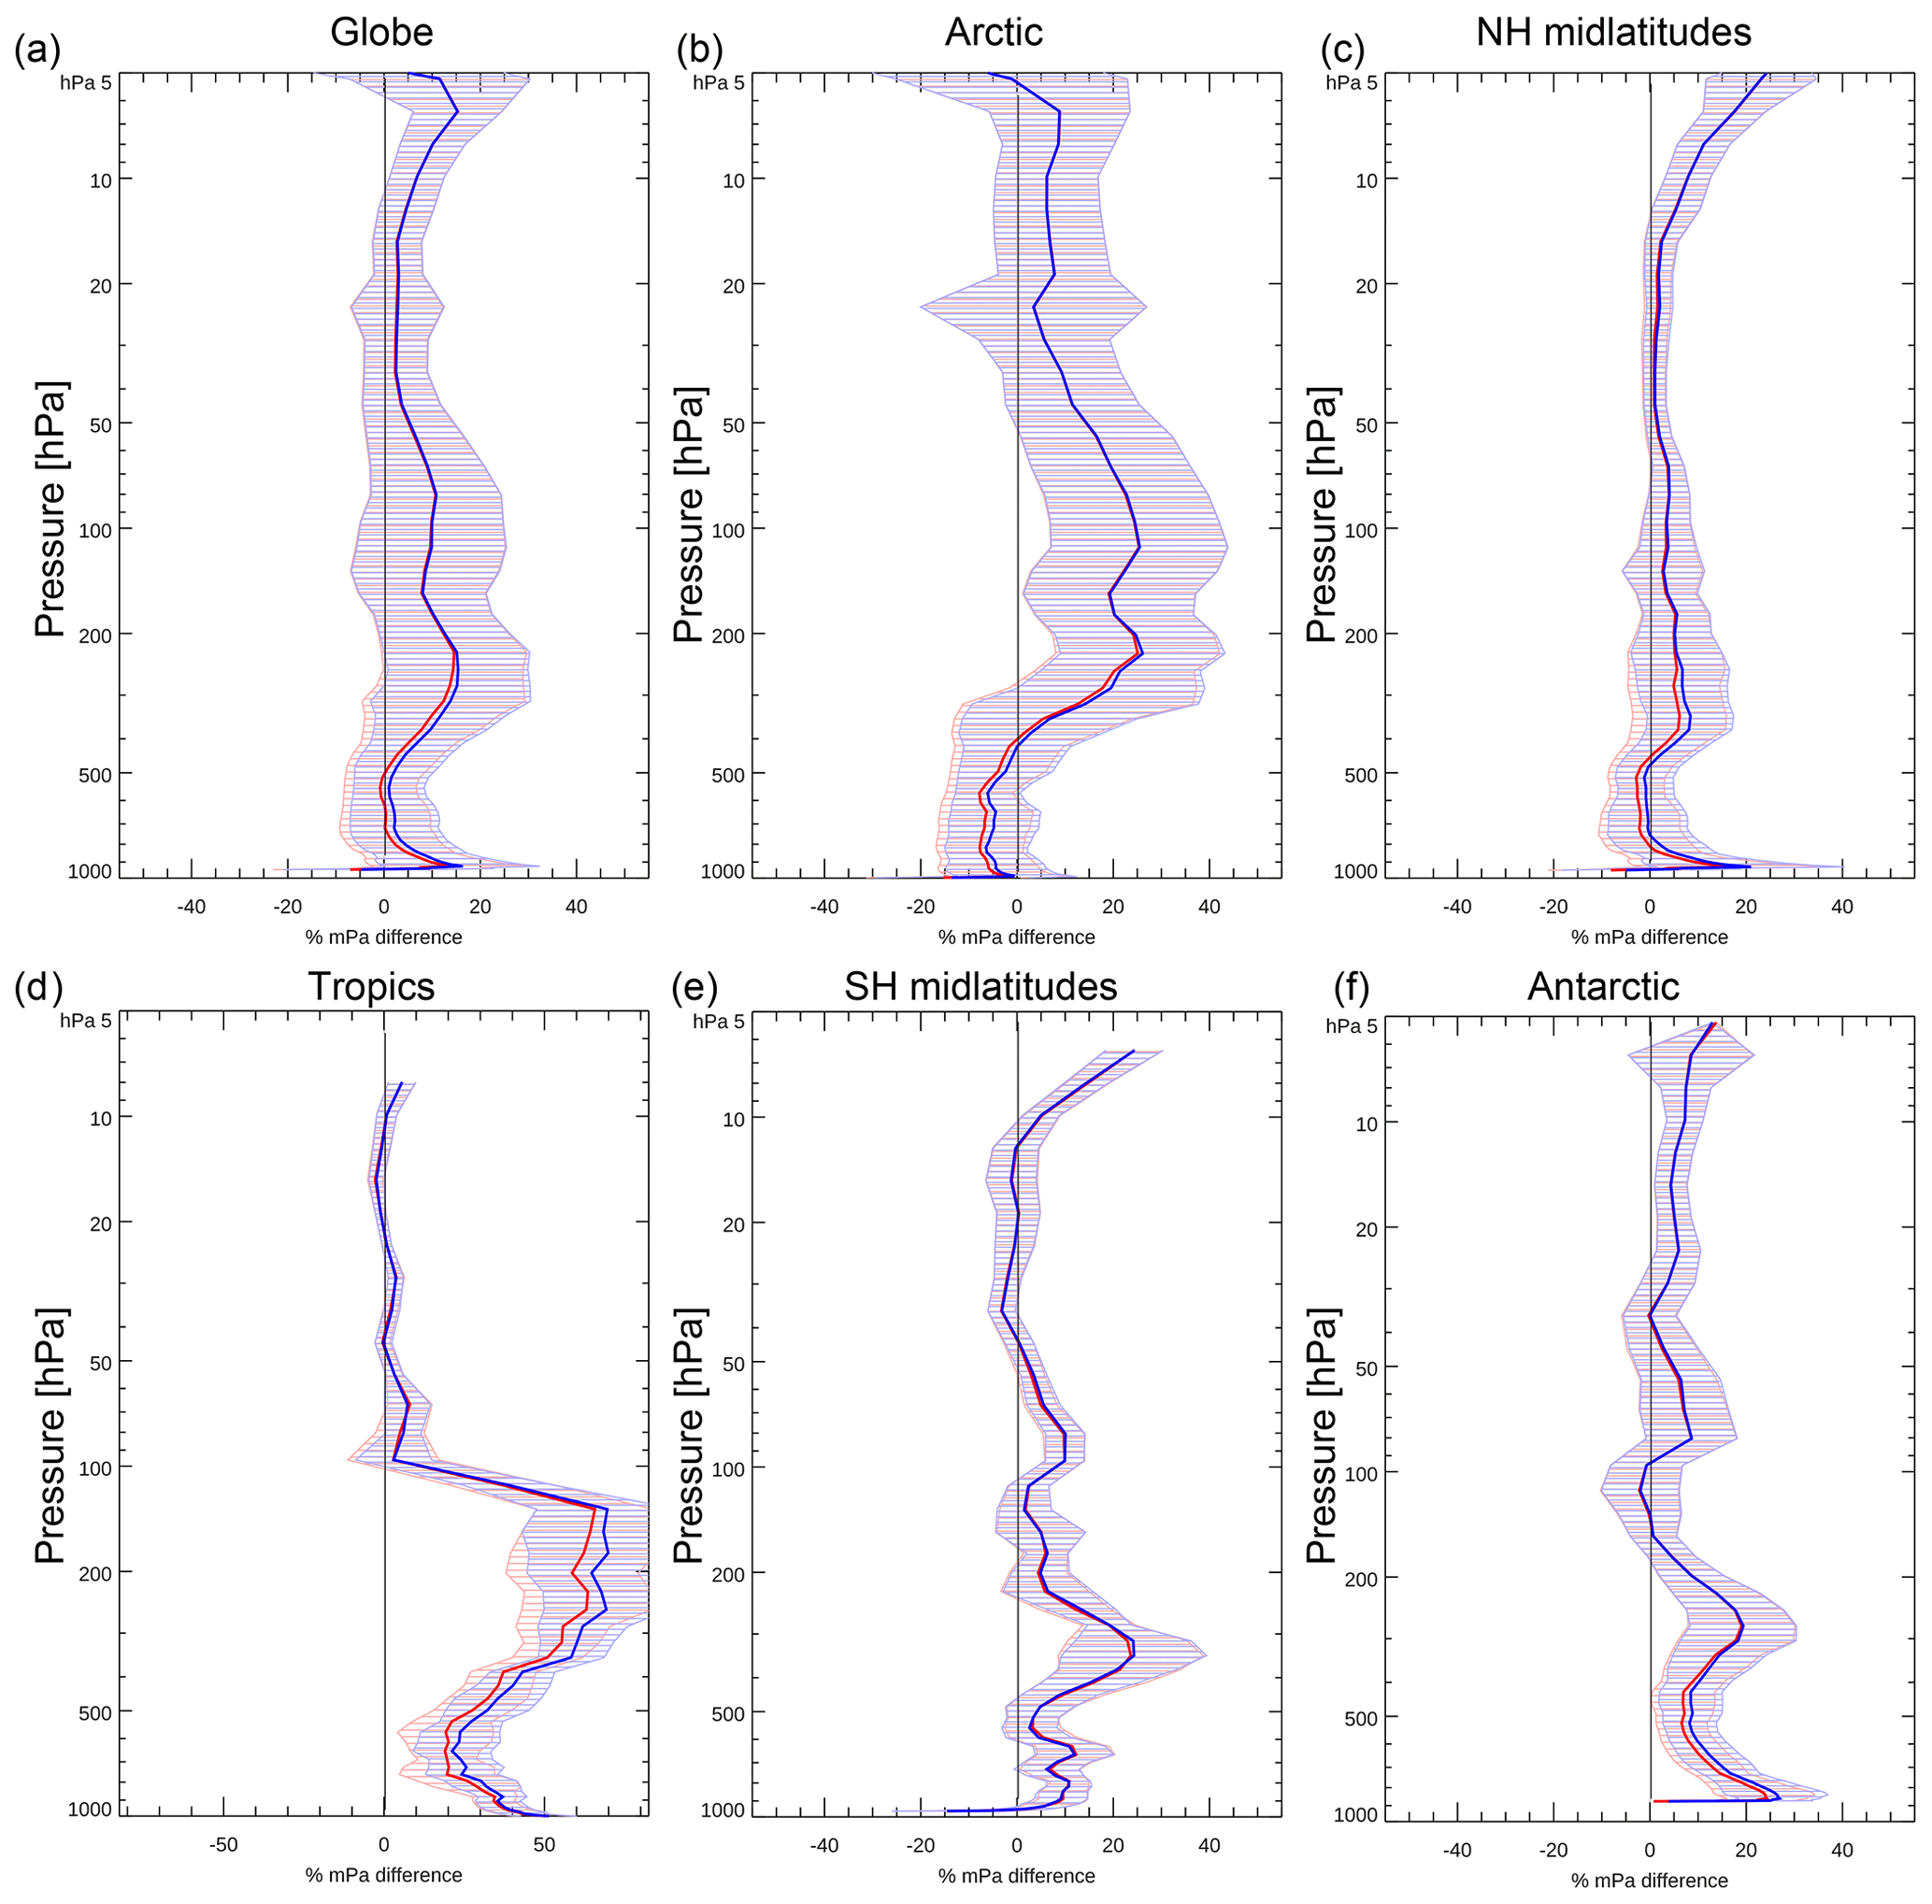
Figure 13Mean relative O3 bias for SON 2018 in percent between ASSIM (red) and CTRL (blue) and ozone sondes averaged over the (a) globe, (b) Arctic, (c) NH midlatitudes, (d) tropics, (e) SH midlatitudes and (f) Antarctic.
Compared with ozone sondes averaged over FMA (Fig. 12) and SON (Fig. 13) the impact in relative terms is also small. However, an improved fit to the data is seen in ASSIM in the tropics during SON, when the positive bias seen in CTRL is reduced. Ozone profiles from ASSIM and CTRL are also compared with IAGOS aircraft data (Fig. 14). Because not many IAGOS profiles were available during October and November 2018 we show FMA and July–September (JAS) 2018. In both seasons, we see a positive impact from the assimilation of TROPOMI TCO3 data over West African airports, where the negative bias seen in CTRL is reduced when assimilating TROPOMI TCO3 data. This increase in tropospheric O3 agrees with the increased TCO3 seen in ASSIM over Africa in FMA and SON (Fig. 9) but does not show up in the zonal mean cross sections (Fig. 10).
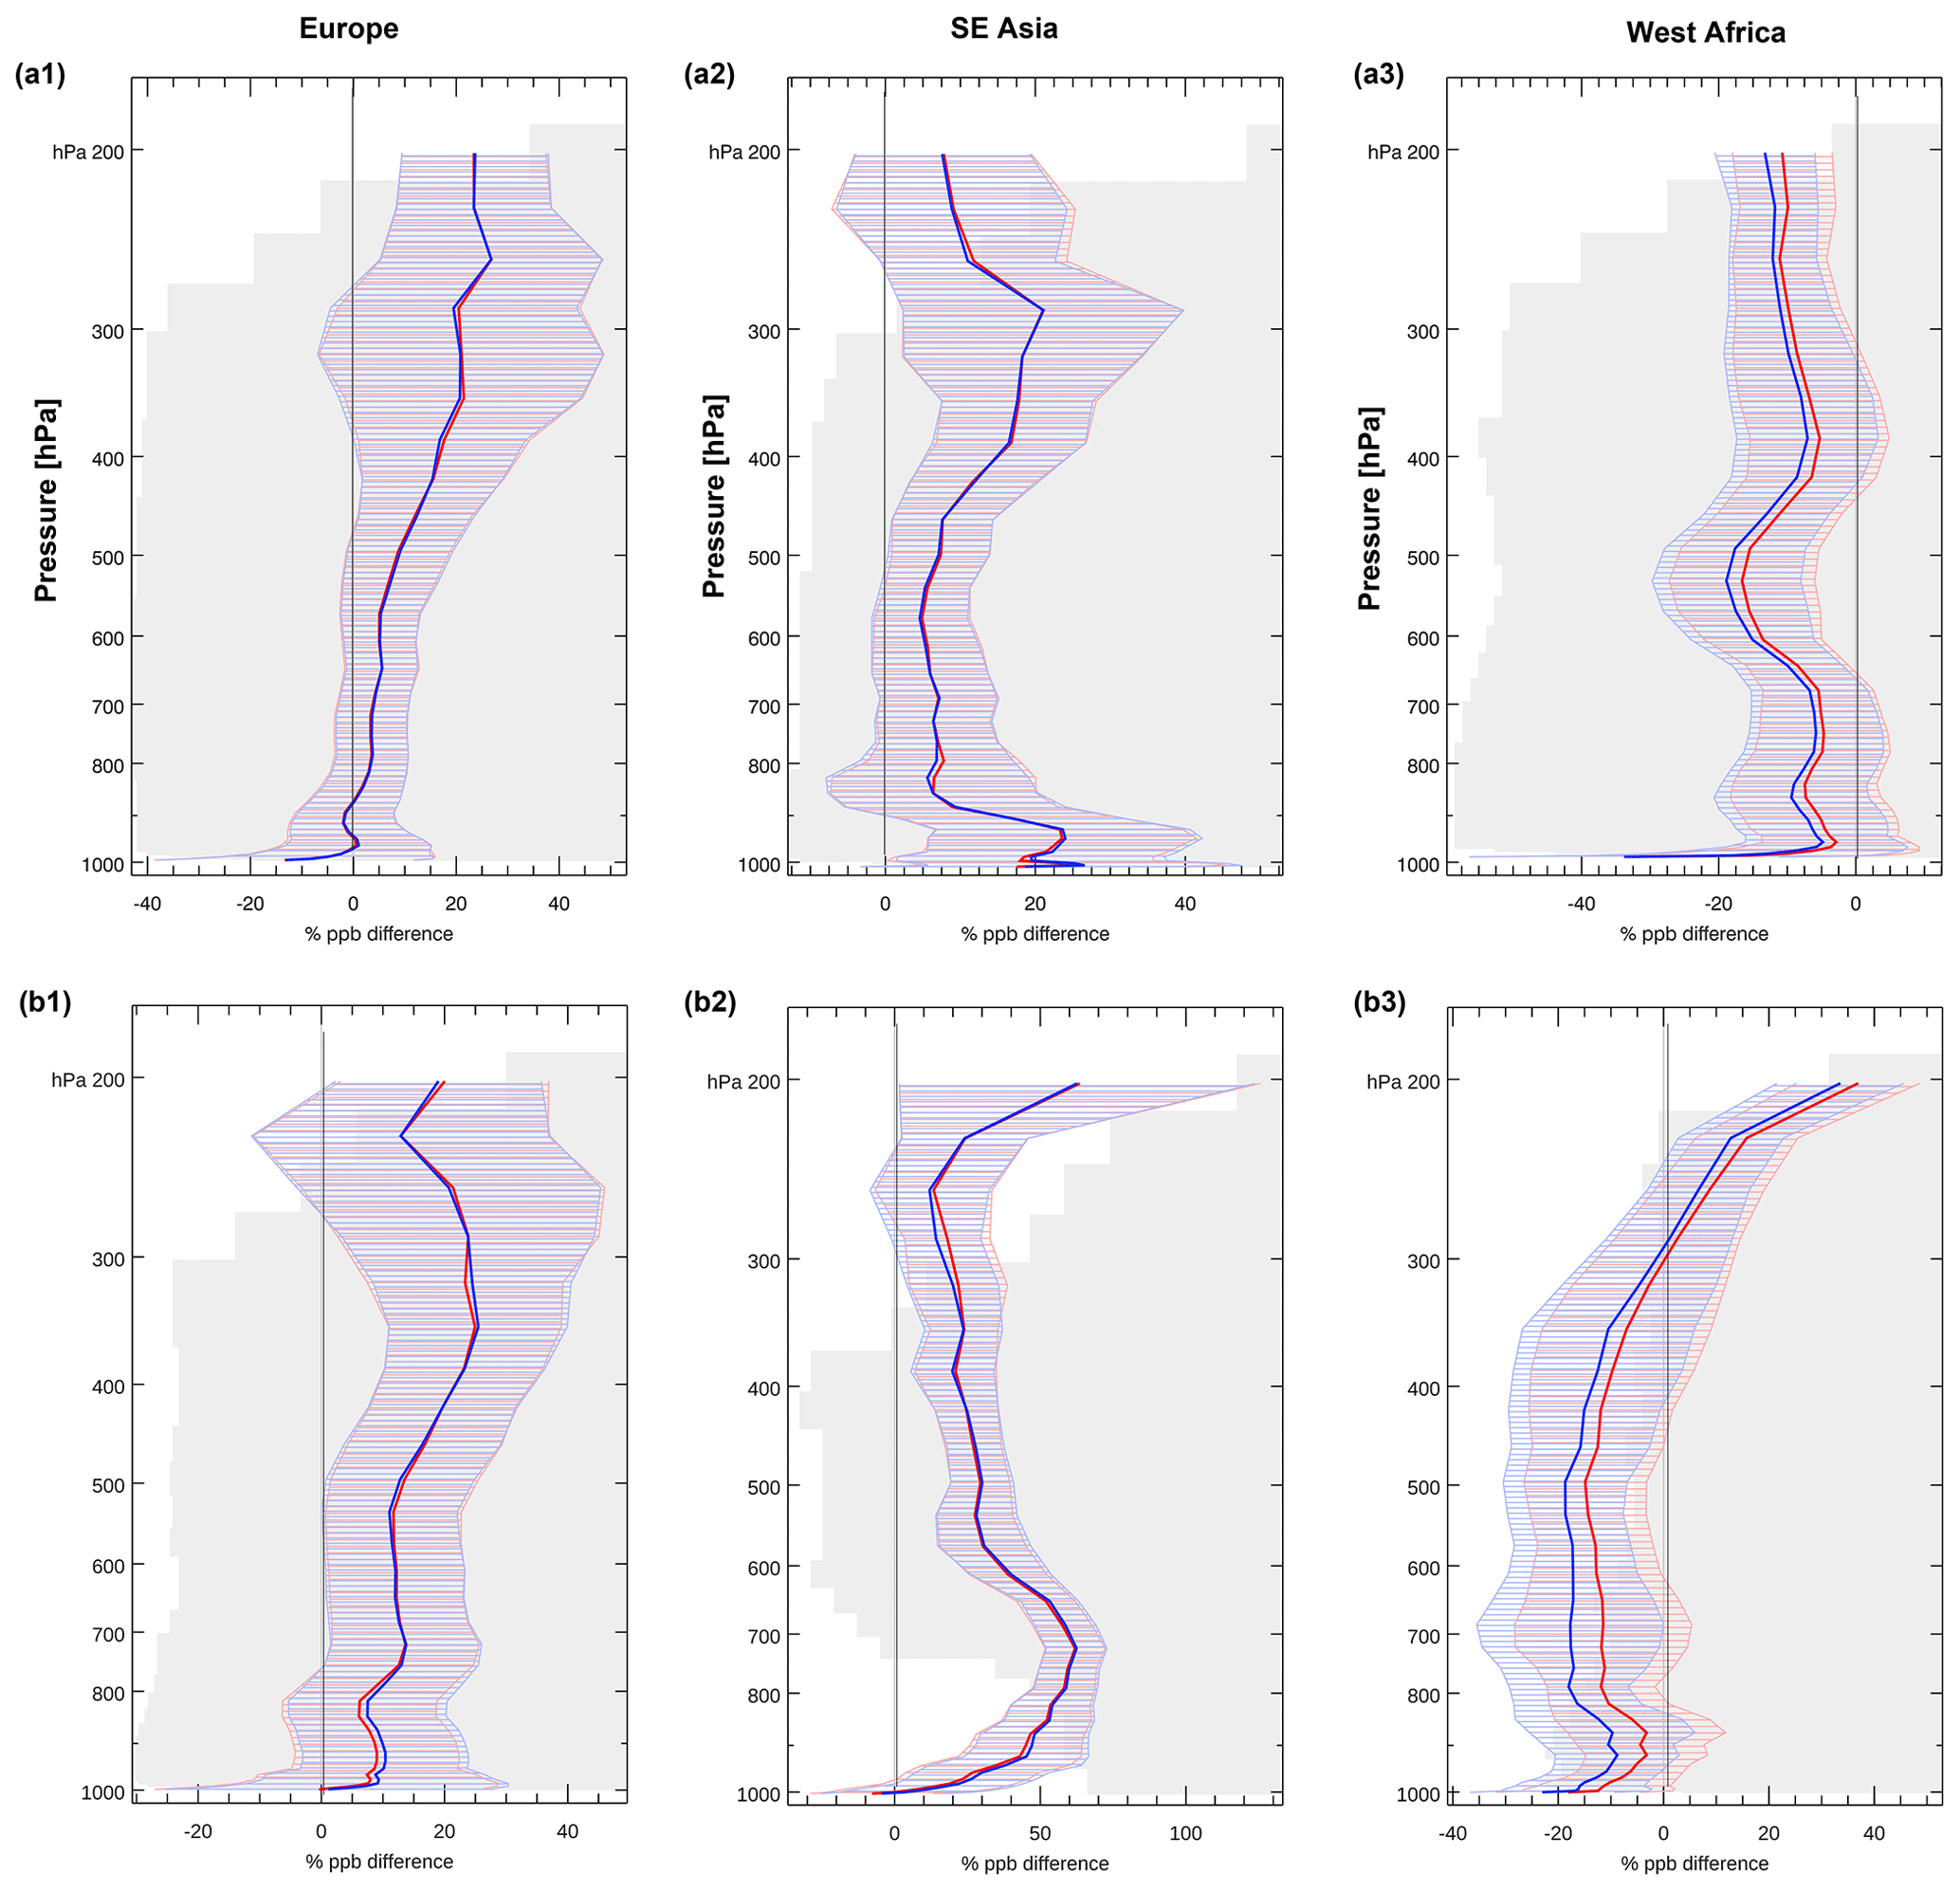
Figure 14Mean relative O3 difference in percent of ASSIM minus IAGOS aircraft data (red) and CTRL minus IAGOS (blue) for (a) FMA and (b) JAS 2018 averaged over (1) European airports, (2) SE Asian airports and (3) West African airports.
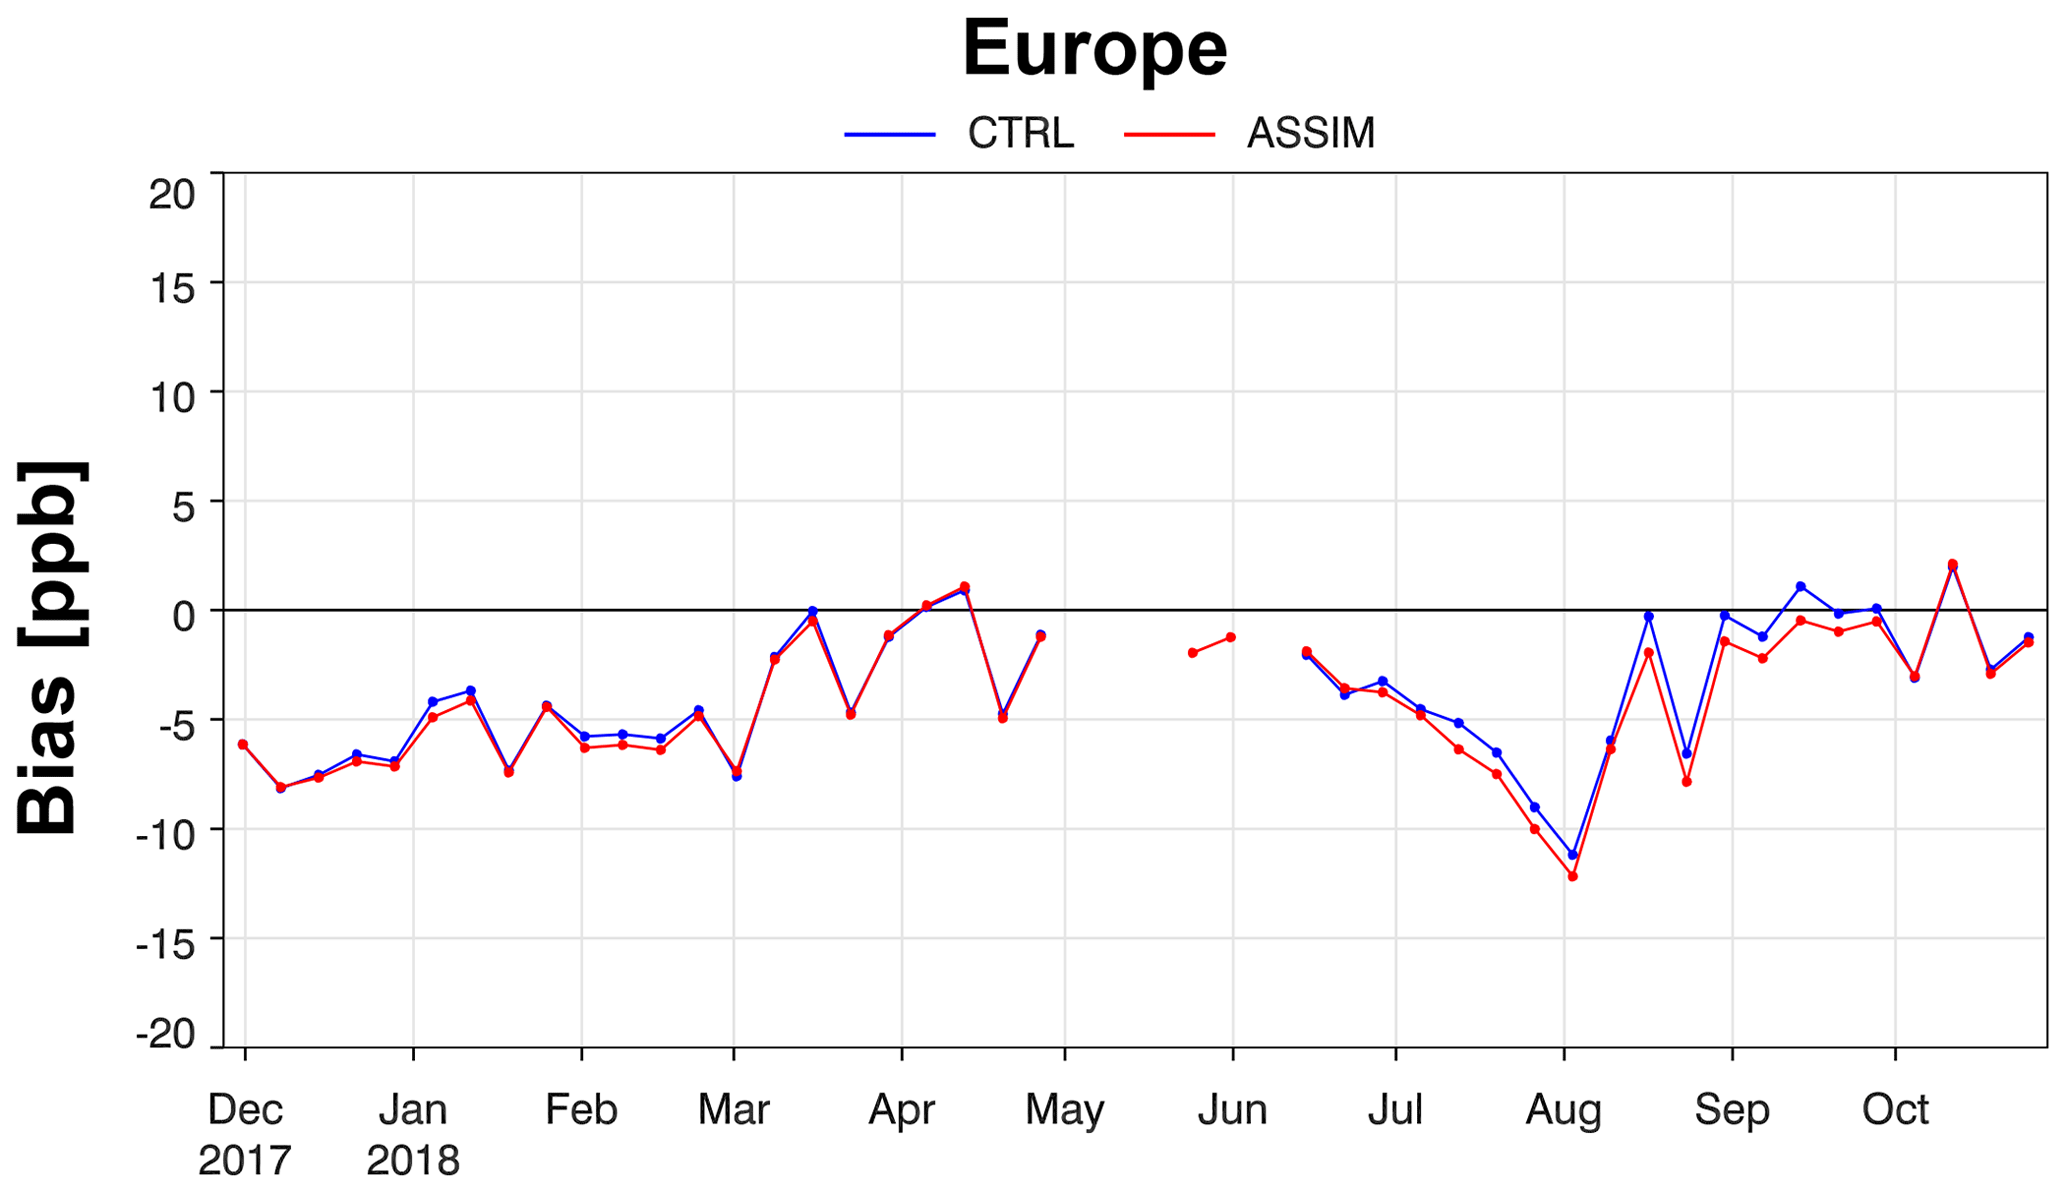
Figure 15Time series of weekly averaged O3 bias in ppb from ASSIM (red) and CTRL (blue) compared to GAW surface data averaged over Europe (between three and five sites).
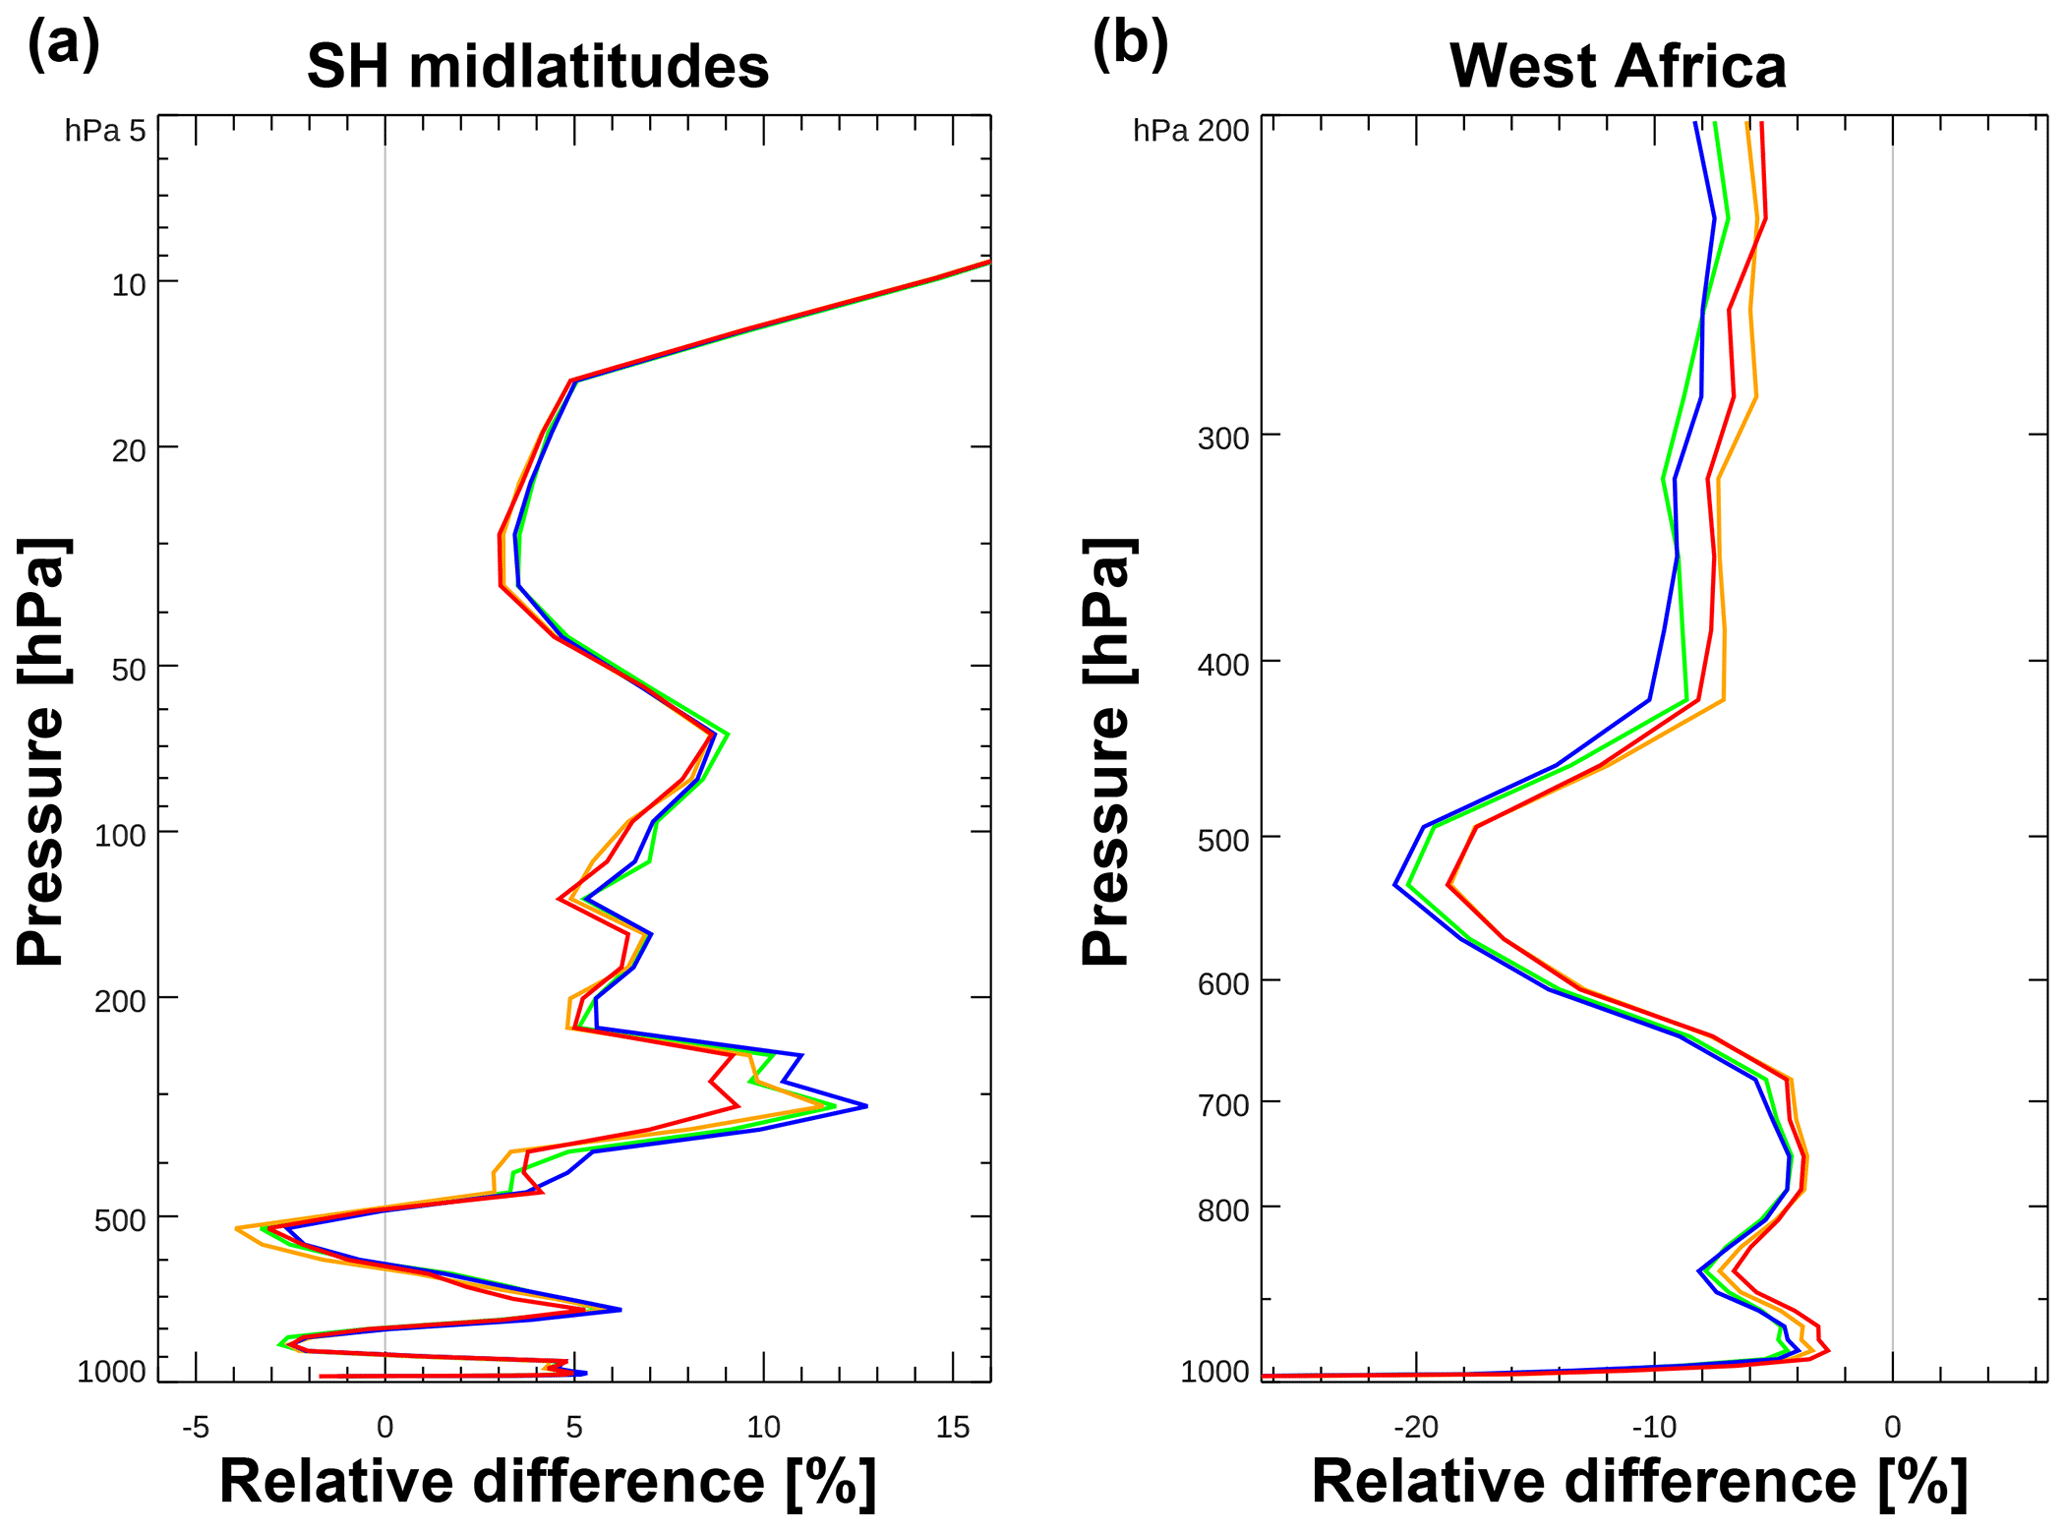
Figure 16Mean relative O3 difference in percent for FMA 2018 against (a) ozone sondes at SH midlatitudes and (b) IAGOS aircraft data at West African airports from ASSIM (red), ASSIM-OMI (orange), CTRL (blue) and CTRL-OMI (green).
Finally, we compare ASSIM and CTRL with GAW O3 surface observations over Europe in Fig. 15 and again see only a small, slightly negative impact. However, only very few GAW stations were available and the means are calculated from between three and five stations over Europe and more data would be needed for a meaningful validation of surface O3.
On the whole, the impact of the TROPOMI assimilation in the CAMS system is relatively small because the CAMS analysis is already well constrained by the other O3 data sets that are assimilated routinely, which are a combination of TCO3 data (OMI, GOME-2AB), O3 layers (SBUV/2, OMPS) and O3 profiles (MLS) (see Table 1). If no other O3 data were available and only TROPOMI TCO3 data were assimilated, the impact on the CAMS O3 analysis would be larger. To confirm that TROPOMI could serve as a good replacement if one of the older TCO3 instruments (OMI, GOME-2AB) failed, two further experiments were run for the period 26 November 2017 to 30 April 2018, one mimicking the configuration of CTRL but without OMI (CTRL-OMI) and the other mimicking the configuration of ASSIM without OMI (ASSIM-OMI). Compared to ozonesondes and IAGOS data the differences between these experiments and ASSIM and CTRL are very small indeed. The largest differences between the four experiments are found at the SH midlatitudes when compared with ozone sondes (Fig. 16a) and over West African airports compared with IAGOS (Fig. 16b). Even here, the differences between ASSIM and ASSIM-OMI are small and both fit the independent observations better than CTRL and CTRL-OMI. There is even a sign that removing OMI leads to a small improvement in the fit to IAGOS over West Africa. In all other areas the differences between the experiments with and without OMI were negligible when compared to sondes or IAGOS. These findings agree with results from longer observation system experiments that were carried out with the CAMS system for the years 2013 and 2014 in a different context (not shown), which showed only small changes to the CAMS O3 analysis if one of the TCO3 instruments was removed, confirming that the CAMS analysis is well constrained and that there is some redundancy in the system. We are therefore confident that TROPOMI will be able to counterbalance the loss of one of the older TCO3 instruments. Removing MLS O3 profiles has a much larger (negative) impact on the CAMS O3 analysis (e.g. Flemming et al., 2011) and TROPOMI would not be able to replace the MLS profiles as it does not provide data with a similar vertical resolution.
The main advantage of assimilating TROPOMI into the CAMS system seems to be the improvement in tropospheric ozone. This is because MLS defines the stratosphere, whereas OMI, GOME-2 and TROPOMI are also sensitive to the troposphere and add extra information here (see also Lefever et al., 2015). Adding TROPOMI to the CAMS system fits the CAMS analysis better to independent tropospheric data.
TROPOMI NRT TCO3 retrievals for the period 26 November 2017 to 30 November 2018 have been included in the CAMS data assimilation system to first monitor the data and to then carry out assimilation tests with them. The TROPOMI data used for the work presented in this paper were TROPOMI TCO3 data (v1.0.0), which had been reprocessed with the NRT algorithm until 3 May 2018 and NRT TROPOMI (v1.0.0 to v1.1.2) data for the period 11 June to 30 November 2018 (Loyola et al., 2019b). TROPOMI was still in its commissioning phase until 24 April 2018, but even the early TROPOMI TCO3 data generally agreed well with the CAMS analysis over large parts of the globe and were of good enough quality to test their use in the CAMS system.
Monitoring of TROPOMI TCO3 data in the CAMS system has shown that the data are of good quality over large parts of the globe. The TROPOMI TCO3 biases relative to the CAMS O3 analysis are of similar magnitude to biases of OMI and GOME-2AB TCO3 between 60∘ N and 60∘ S and TROPOMI agrees with the CAMS ozone analysis to within 2 % over large parts of the globe in weekly mean zonal mean time series and averaged over FMA and SON 2018. However, there are problems with the TROPOMI TCO3 NRT retrievals at high latitudes, at low solar elevations and over snow/ice (e.g. Antarctica or ice-covered areas in NH). These differences, which are most prominent over land in the NH north of 45∘ N before May 2018, come mainly from the surface albedo climatology that is used in the TROPOMI NRT retrieval algorithm and has a spatial resolution of 0.5∘ × 0.5∘, which is coarser than the spatial resolution of the TROPOMI pixels. It is planned to replace this climatology with a climatology based on TROPOMI data when data for a long enough period are available. The bias of TROPOMI TCO3 has a dependency on solar elevation, with increasingly negative biases at solar elevations less than 25∘, especially in FMA 2018. During SON 2018 the dependency on solar elevation is considerably smaller. The bias of TROPOMI TCO3 relative to CAMS also depends slightly on scan position, with an increasingly negative bias towards the western edge of the scan.
Relative to CAMS and averaged over the period 26 November 2017 to 3 May 2018, TROPOMI TCO3 NRT data show a mean bias with respect to CAMS of DU between 90 and 60∘ N, 2.10±9.47 DU between 60 and 30∘ N, 0.06±3.83 DU between 30∘ N and 30∘ S, DU between 30 and 60∘ S and DU between 60 and 90∘ S. For June to November 2018 TROPOMI has a mean bias of DU between 90 and 60∘ N, 0.31±6.00 DU between 60 and 30∘ N, DU between 30∘ N and 30∘ S, 0.82±10.10 DU between 30 and 60∘ S and DU between 60 and 90∘ S. This paper illustrates the power of using a global assimilation system to monitor new satellite products, as it provides continuous global coverage, allows us to build up global and regional statistics quickly and can help to identify problems with the retrievals (e.g. biases against solar elevation, latitude, scan position, surface albedo dependencies) that might be more difficult to discover when comparing TROPOMI retrievals against sparse in situ observations.
Assimilation tests were carried out with the TROPOMI TCO3 data, blacklisting them poleward of 60∘ and at solar elevations less than 10∘ and applying the ECMWF variational bias correction scheme to the data with solar elevation and a global constant as predictors. These assimilation tests showed that the bias correction successfully removed the biases between the model and the data. Overall, the impact of the TROPOMI data in the CAMS assimilation system was found to be relatively small, because the ozone analysis is already well constrained by several other ozone data sets that are assimilated routinely (OMI, GOME-2AB, MLS, SBUV/2, OMPS). Mean differences between a run with and without assimilation of TROPOMI TCO3 NRT data over the FMA and SON 2018 were less than 2 % for TCO3 everywhere and less than 1 % in most areas. For average zonal mean O3 mixing ratio profiles the differences between ASSIM and CTRL were less than 3 %, with the largest relative differences found in the troposphere, where the assimilation of TROPOMI TCO3 data led to decreased ozone values in the zonal mean. Zonal mean differences in the stratosphere were less than 1 %.
ASSIM and CTRL show only small differences when compared with independent ozone observations; however these differences are mainly positive. There is a slightly improved fit to WOUDC Brewer TCO3 data in ASSIM. The largest impact of the TROPOMI assimilation was found over West African airports, where the assimilation led to increased ozone values in the troposphere and a reduced negative bias against IAGOS aircraft profiles in FMA and JAS 2018. A positive impact in the tropical troposphere was also seen against ozone sondes in SON 2018, where the zonal mean positive bias was reduced. It seems the main advantage of assimilating TROPOMI into the CAMS system is the improvement in tropospheric ozone. This is because MLS defines the stratosphere, whereas OMI, GOME-2AB and TROPOMI are also sensitive to the troposphere and add extra information here (see also Lefever et al., 2015). Adding TROPOMI to the CAMS system improves the fit of the CAMS analysis to independent tropospheric data and makes the CAMS system more resilient against the loss of any of the older TCO3 instruments that are currently assimilated. Assimilation tests show that good results are achieved when replacing OMI with TROPOMI.
Due to the limitations of the current TROPOMI TCO3 NRT product, which uses a OMI climatology for the surface properties, ozone data had to be blacklisted at high latitudes in this study. Future algorithm updates dealing with a better treatment of the surface albedo (Loyola et al., 2019a) will improve the retrieval quality at high latitudes and should allow the data to be used up to the poles. The v1.1.2 data used after 8 August 2018 already show smaller departures south of 60∘ S. Note that the TROPOMI TCO3 offline algorithm does not have the limitation due to the surface albedo climatology seen in the NRT product because the surface albedo is fitted as part of the retrieval.
TROPOMI TCO3 NRT data were included passively in the operational CAMS system on 13 July 2018, the day the data were officially released by ESA, and have been monitored routinely by CAMS ever since (see https://atmosphere.copernicus.eu/charts/, last access: 22 March 2019). Because of the small but positive impact of the TROPOMI TCO3 assimilation on the CAMS ozone analysis shown in this paper it was decided to actively include the TROPOMI TCO3 NRT data in the operational NRT CAMS analysis, and the routine assimilation of the data in the operational CAMS analysis began on 4 December 2018.
CAMS data are freely available from https://atmosphere.copernicus.eu/ (last access 22 March 2019).
AI carried out the experiments described in the paper, the validation of the resulting analysis fields and wrote the manuscript, RR set up the S5P processing chain at ECMWF, which included coding and testing the BUFR converter needed to ingest the TROPOMI TCO3 data in the ECMWF data system, and JF helped with the development of the IFS chemistry module. DL, WZ, KPH, JX, PV, CL and MvR developed the TROPOMI TCO3 retrieval algorithm and the operational processing chain at DLR. All co-authors gave useful comments during the writing of the paper.
The authors declare that they have no conflict of interest.
This article is part of the special issue “TROPOMI on Sentinel-5 Precursor: first year in operation (AMT/ACPT inter-journal SI)”. It is not associated with a conference.
Thanks to the DLR colleagues Fabian Romahn and Mattia Pedergnana working on the operational UPAS system for generating TROPOMI TCO3 products and thanks to Maximilian Schwinger and the PDGS team at DLR responsible for the Sentinel-5 Precursor payload data ground segment. Thanks to Luke Jones for help with the plotting of ozone sondes, GAW and IAGOS data. Thanks to the data providers of the data assimilated in the CAMS reanalysis and the data used for the validation studies in this paper. The TROPOMI total ozone data are generated at DLR on behalf of EU/ESA. The GOME-2 total ozone data assimilated in CAMS are provided by DLR in the framework of the EUMETSAT AC-SAF project. The Copernicus Atmosphere Monitoring Service is operated by the European Centre for Medium-Range Weather Forecasts on behalf of the European Commission as part of the Copernicus programme (https://www.copernicus.eu/en, last access 22 March 2019).
This paper was edited by Ben Veihelmann and reviewed by two anonymous referees.
Andersson, E. and Järvinen, H.: Variational quality control, Q. J. Roy. Meteor. Soc., 125, 697–722, 1999.
Basher, R. E.: Review of the Dobson spectrophotometer and its accuracy, Global Ozone Res. Monit. Proj., Rep. 13, World Meteor. Organ., Geneva, Switzerland, December, available at: http://www.esrl.noaa.gov/gmd/ozwv/dobson/papers/report13/report13.html (last access: 3 February 2017), 1982.
Benedetti, A., Morcrette, J.-J., Boucher, O., Dethof, A., Engelen, R. J., Fisher, M., Flentje, H., Huneeus, N., Jones, L., Kaiser, J. W., Kinne, S., Mangold, A., Razinger, M., Simmons, A. J., Suttie, M., and the GEMS-AER team: Aerosol analysis and forecast in the European Centre for Medium-Range Weather Forecasts Integrated Forecast System: Data Assimilation, J. Geophys. Res., 114, D13205, https://doi.org/10.1020/2008JD011115, 2009.
Bhartia, P. K., McPeters, R. D., Mateer, C. L., Flynn, L. E., and Wellemeyer, C.: Algorithm for the estimation of vertical ozone profiles from the backscattered ultraviolet technique, J. Geophys. Res., 101, 18793–18806, 1996.
Cariolle, D. and Teyssèdre, H.: A revised linear ozone photochemistry parameterization for use in transport and general circulation models: multi-annual simulations, Atmos. Chem. Phys., 7, 2183–2196, https://doi.org/10.5194/acp-7-2183-2007, 2007.
Chapman, S.: On ozone and atomic oxygen in the upper atmosphere, The London, Edinburgh, and Dublin Philosophical Magazine and Journal of Science, 10, 369–383, https://doi.org/10.1080/14786443009461588, 1930.
Chipperfield, M. P., Dhomse, S., Hossaini, R., Feng, W., Santee, M. L., Weber, M., Burrows J. P., Wild J. D., Loyola, D., and Coldewey-Egbers, M.: On the cause of recent variations in lower stratospheric ozone, Geophys. Res. Lett., 45, 5718–5726, https://doi.org/10.1029/2018GL078071, 2018.
Courtier, P., Thépaut, J.-N., and Hollingsworth, A.: A strategy for operational implementation of 4D-Var, using an incremental approach, Q. J. Roy. Meteorol. Soc., 120, 1367–1388, 1994.
Dee, D. P. and Uppala, S.: Variational bias correction of satellite radiance data in the ERA-Interim reanalysis, Q. J. Roy. Meteor. Soc., 135, 1830–1841, 2009.
Dethof, A. and Hólm, E. V.: Ozone assimilation in the ERA-40 reanalysis project, Q. J. Roy. Meteor. Soc., 130, 2851–2872, 2004.
Dragani, R.: On the quality of the ERA-Interim ozone reanalyses: comparisons with satellite data, Q. J. Roy. Meteor. Soc., 137, 1312–1326, https://doi.org/10.1002/qj.821, 2011.
Dragani, R. and McNally, A. P.: Operational assimilation of ozone-sensitive infrared radiances at ECMWF, Q. J. Roy. Meteor. Soc., 139, 2068–2080, https://doi.org/10.1002/qj.2106, 2013.
Flemming, J., Inness, A., Jones, L., Eskes, H. J., Huijnen, V., Schultz, M. G., Stein, O., Cariolle, D., Kinnison, D., and Brasseur, G.: Forecasts and assimilation experiments of the Antarctic ozone hole 2008, Atmos. Chem. Phys., 11, 1961–1977, https://doi.org/10.5194/acp-11-1961-2011, 2011.
Flemming, J., Huijnen, V., Arteta, J., Bechtold, P., Beljaars, A., Blechschmidt, A.-M., Diamantakis, M., Engelen, R. J., Gaudel, A., Inness, A., Jones, L., Josse, B., Katragkou, E., Marecal, V., Peuch, V.-H., Richter, A., Schultz, M. G., Stein, O., and Tsikerdekis, A.: Tropospheric chemistry in the Integrated Forecasting System of ECMWF, Geosci. Model Dev., 8, 975–1003, https://doi.org/10.5194/gmd-8-975-2015, 2015.
Flemming, J., Benedetti, A., Inness, A., Engelen, R. J., Jones, L., Huijnen, V., Remy, S., Parrington, M., Suttie, M., Bozzo, A., Peuch, V.-H., Akritidis, D., and Katragkou, E.: The CAMS interim Reanalysis of Carbon Monoxide, Ozone and Aerosol for 2003–2015, Atmos. Chem. Phys., 17, 1945–1983, https://doi.org/10.5194/acp-17-1945-2017, 2017.
Flynn, L., Long, C., Wu, X., Evans, R., Beck, C. T., Petropavlovskikh, I., McConville, G., Yu, W., Zhang, Z., Niu, J., Beach, E., Hao, Y., Pan, C., Sen, B., Novicki, M., Zhou, S., and Seftor, C.: Performance of the Ozone Mapping and Profiler Suite (OMPS) products, J. Geophys. Res.-Atmos., 119, 6181–6195, https://doi.org/10.1002/2013JD020467, 2014.
Granier, C., Bessagnet, B., Bond, T., D'Angiola, A., Denier van der Gon, H., Frost, G. J., Heil, A., Kaiser, J. W., Kinne, S., Klimont, Z., Kloster, S., Lamarque, J.-F., Liousse, C., Masui, T., Meleux, F., Mieville, A., Ohara, R., Raut, J.-C., Riahi, K., Schultz, M. G., Smith, S. G., Thompson, A., van Aardenne, J., van der Werf, G. R., and van Vuuren, D. P.: Evolution of anthropogenic and biomass burning emissions of air pollutants at global and regional scales during the 1980–2010 period, Clim. Change, 109, 163–190, https://doi.org/10.1007/s10584-011-0154-1, 2011.
Guenther, A., Karl, T., Harley, P., Wiedinmyer, C., Palmer, P. I., and Geron, C.: Estimates of global terrestrial isoprene emissions using MEGAN (Model of Emissions of Gases and Aerosols from Nature), Atmos. Chem. Phys., 6, 3181–3210, https://doi.org/10.5194/acp-6-3181-2006, 2006.
Hansen, J., Sato, M., and Ruedy, R.: Radiative forcing and climate response, J. Geophys. Res., 102, 6831–6864, 1997.
Hao, N., Koukouli, M. E., Inness, A., Valks, P., Loyola, D. G., Zimmer, W., Balis, D. S., Zyrichidou, I., Van Roozendael, M., Lerot, C., and Spurr, R. J. D.: GOME-2 total ozone columns from MetOp-A/MetOp-B and assimilation in the MACC system, Atmos. Meas. Tech., 7, 2937–2951, https://doi.org/10.5194/amt-7-2937-2014, 2014.
Hogan, R., Ahlgrimm, M., Balsamo, G., Beljaars, A., Berrisford, P., Bozzo, A., Di Giuseppe, F., Forbes, R. M., Haiden, T., Lang, S., Mayer, M., Polichtchouk, I., Sandu, I., Vitart, F., and Wedi, N.: Radiation in numerical weather prediction, ECMWF Technical Memorandum 816, 2017.
Hólm, E. V., Untch, A., Simmons, A., Saunders, R., Bouttier, F., and Andersson, E.: Multivariate ozone assimilation in four-dimensional data assimilation, SODA workshop on Chemical Data Assimilation, Publication 188, KNMI, De Bilt, the Netherlands, 1999.
Huijnen, V., Williams, J., van Weele, M., van Noije, T., Krol, M., Dentener, F., Segers, A., Houweling, S., Peters, W., de Laat, J., Boersma, F., Bergamaschi, P., van Velthoven, P., Le Sager, P., Eskes, H., Alkemade, F., Scheele, R., Nédélec, P., and Pätz, H.-W.: The global chemistry transport model TM5: description and evaluation of the tropospheric chemistry version 3.0, Geosci. Model Dev., 3, 445–473, https://doi.org/10.5194/gmd-3-445-2010, 2010.
Inness, A., Baier, F., Benedetti, A., Bouarar, I., Chabrillat, S., Clark, H., Clerbaux, C., Coheur, P., Engelen, R. J., Errera, Q., Flemming, J., George, M., Granier, C., Hadji-Lazaro, J., Huijnen, V., Hurtmans, D., Jones, L., Kaiser, J. W., Kapsomenakis, J., Lefever, K., Leitão, J., Razinger, M., Richter, A., Schultz, M. G., Simmons, A. J., Suttie, M., Stein, O., Thépaut, J.-N., Thouret, V., Vrekoussis, M., Zerefos, C., and the MACC team: The MACC reanalysis: an 8 yr data set of atmospheric composition, Atmos. Chem. Phys., 13, 4073–4109, https://doi.org/10.5194/acp-13-4073-2013, 2013.
Inness, A., Blechschmidt, A.-M., Bouarar, I., Chabrillat, S., Crepulja, M., Engelen, R. J., Eskes, H., Flemming, J., Gaudel, A., Hendrick, F., Huijnen, V., Jones, L., Kapsomenakis, J., Katragkou, E., Keppens, A., Langerock, B., de Mazière, M., Melas, D., Parrington, M., Peuch, V. H., Razinger, M., Richter, A., Schultz, M. G., Suttie, M., Thouret, V., Vrekoussis, M., Wagner, A., and Zerefos, C.: Data assimilation of satellite-retrieved ozone, carbon monoxide and nitrogen dioxide with ECMWF's Composition-IFS, Atmos. Chem. Phys., 15, 5275–5303, https://doi.org/10.5194/acp-15-5275-2015, 2015.
Kaiser, J. W., Heil, A., Andreae, M. O., Benedetti, A., Chubarova, N., Jones, L., Morcrette, J.-J., Razinger, M., Schultz, M. G., Suttie, M., and van der Werf, G. R.: Biomass burning emissions estimated with a global fire assimilation system based on observed fire radiative power, Biogeosciences, 9, 527–554, https://doi.org/10.5194/bg-9-527-2012, 2012.
Kleipool, Q. L., Dobber, M. R., de Haan, J. F., and Levelt, P. F.: Earth surface reflectance climatology from 3 years of OMI data, J. Geophys. Res., 113, D18308, https://doi.org/10.1029/2008JD010290, 2008.
Komhyr, W. D., Barnes, R. A., Borthers, G. B., Lathrop, J. A., Kerr, J. B., and Opperman, D. P.: Electrochemical concentration cell ozonesonde performance evaluation during STOIC 1989, J. Geophys. Res., 100, 9231–9244, 1995.
Lefever, K., van der A, R., Baier, F., Christophe, Y., Errera, Q., Eskes, H., Flemming, J., Inness, A., Jones, L., Lambert, J.-C., Langerock, B., Schultz, M. G., Stein, O., Wagner, A., and Chabrillat, S.: Copernicus stratospheric ozone service, 2009–2012: validation, system intercomparison and roles of input data sets, Atmos. Chem. Phys., 15, 2269–2293, https://doi.org/10.5194/acp-15-2269-2015, 2015.
Lerot, C., Van Roozendael, M., van Geffen, J., van Gent, J., Fayt, C., Spurr, R., Lichtenberg, G., and von Bargen, A.: Six years of total ozone column measurements from SCIAMACHY nadir observations, Atmos. Meas. Tech., 2, 87–98, https://doi.org/10.5194/amt-2-87-2009, 2009.
Liu, X., Bhartia, P. K., Chance, K., Froidevaux, L., Spurr, R. J. D., and Kurosu, T. P.: Validation of Ozone Monitoring Instrument (OMI) ozone profiles and stratospheric ozone columns with Microwave Limb Sounder (MLS) measurements, Atmos. Chem. Phys., 10, 2539–2549, https://doi.org/10.5194/acp-10-2539-2010, 2010.
Loyola, D., Koukouli, M., Valks, P., Balis, D., Hao, N., Van Roozendael, M., Spurr, R., Zimmer, W., Kiemle, S., Lerot, C., and Lambert, J.-C.: The GOME-2 Total Column Ozone Product: Retrieval Algorithm and Ground-Based Validation, J. Geophys. Res., 116, D07302, https://doi.org/10.1029/2010JD014675, 2011.
Loyola, D. G., Gimeno García, S., Lutz, R., Argyrouli, A., Romahn, F., Spurr, R. J. D., Pedergnana, M., Doicu, A., Molina García, V., and Schüssler, O.: The operational cloud retrieval algorithms from TROPOMI on board Sentinel-5 Precursor, Atmos. Meas. Tech., 11, 409–427, https://doi.org/10.5194/amt-11-409-2018, 2018.
Loyola, D. G., Xu, J., Heue, K.-P., Zimmer, W.: Applying FP_ILM to the retrieval of geometry-dependent effective Lambertian equivalent reflectivity (GE_LER) to account for BRDF effects on UVN satellite measurements of trace gases, clouds and aerosols, Atmos. Meas. Tech. Discuss., submitted, 2019a.
Loyola, D., et al.: The near-real-time total ozone retrieval algorithm from TROPOMI onboard Sentinel-5 Precursor, Atmos. Meas. Tech. Discuss., in preparation, 2019b.
Manney, G. L.,Santee, M. L., Rex, M., Livesey, N. J., Pitts, M. C., Veefkind, P., Nash, E. R., Wohltmann, I., Lehmann, R., Froidevaux, L., Poole, L. R., Schoeberl, M. R., Haffner, D. P., Davies, J., Dorokhov, V., Gernandt, H., Johnson, B., Kivi, R., Kyrö, E., Larsen, N., Levelt, P. F.,Makshtas, A., McElroy, C. T., Nakajima, H., Parrondo, M. C., Tarasick, D. W., von der Gathen, P., Walker, K. A., and Zinoviev, N. S.: Unprecedented Arctic ozone loss in 2011, Nature, 478, 469–475, https://doi.org/10.1038/nature10556, 2011.
Marenco, A., Thouret, V., Nédélec, P., Smit, H. G., Helten, M., Kley, D., Karcher, F., Simon, P., Law, K., Pyle, J., Poschmann, G., Von Wrede, R., Hume, C., and Cook, T.: Measurement of ozone and water vapour by Airbus in-service aircraft: The MOZAIC airborne programme, an overview, J. Geophys. Res., 103, 25631–25642, 1998.
Massart, S., Agusti-Panareda, A., Aben, I., Butz, A., Chevallier, F., Crevoisier, C., Engelen, R., Frankenberg, C., and Hasekamp, O.: Assimilation of atmospheric methane products into the MACC-II system: from SCIAMACHY to TANSO and IASI, Atmos. Chem. Phys., 14, 6139–6158, https://doi.org/10.5194/acp-14-6139-2014, 2014.
McPeters, R. D., Bhartia, P. K., Haffner, D., Labow, G. J., and Flynn, L.: The version 8.6 SBUV ozone data record: An overview, J. Geophys. Res.-Atmos., 118, 8032–8039, https://doi.org/10.1002/jgrd.50597, 2013.
Newman, P. A., Nash, E. R., Kawa, S. R., Montzka, S. A., and Schauffler, S. M.: When will the Antarctic ozone hole recover?, Geophys. Res. Lett., 33, L12814, https://doi.org/10.1029/2005GL025232, 2006.
Newman, P. A., Oman, L. D., Douglass, A. R., Fleming, E. L., Frith, S. M., Hurwitz, M. M., Kawa, S. R., Jackman, C. H., Krotkov, N. A., Nash, E. R., Nielsen, J. E., Pawson, S., Stolarski, R. S., and Velders, G. J. M.: What would have happened to the ozone layer if chlorofluorocarbons (CFCs) had not been regulated?, Atmos. Chem. Phys., 9, 2113–2128, https://doi.org/10.5194/acp-9-2113-2009, 2009.
Novelli, P. C. and Masarie, K. A.: Atmospheric Carbon Monoxide Dry Air Mole Fractions from the NOAA ESRL Carbon Cycle Cooperative Global Air Sampling Network, 1988–2013, Version: 2014-07-02, available at: ftp://aftp.cmdl.noaa.gov/data/trace_gases/co/flask/surface/, last access: December 2014.
Oltmans, S. J. and Levy II, H: Surface ozone measurements from a global network, Atmos. Environ., 28, 9–24, 1994.
Pedergnana, M., Loyola, D., Apituley,A., Sneep, M., and Veefkind, J. P.: Sentinel-5 precursor/TROPOMI – Level 2 Product User Manual – O3 Total Column, S5P-L2-DLR-PUM-400A, available at: https://sentinels.copernicus.eu/documents/247904/2474726/Sentinel-5P-Level-2-Product-User-Manual-Ozone-Total-Column (last access: 22 March 2019), 2018.
Schwartz, M., Froidevaux, L., Livesey, N., and Read, W.: MLS/Aura Level 2 Ozone (O3) Mixing Ratio V004, Greenbelt, MD, USA, Goddard Earth Sciences Data and Information Services Center (GES DISC), https://doi.org/10.5067/Aura/MLS/DATA2017, 2015.
Spurr, R., Loyola, D., Van Roozendael, M., Lerot, C., Heue, K.-P., and Xu, J.: S5P/TROPOMI Total Ozone ATBD, S5P-L2-DLR-ATBD-400A, issue 1.6, available at: http://www.tropomi.eu/documents/atbd (last access: 31 January 2019), 2018.
Steinbrecht, W., Shwartz, R., and Claude, H.: New pump correction for the Brewer-Mast ozonesonde: Determination from experiment and instrument intercomparisons, J. Atmos. Ocean. Tech., 15, 144–156, 1998.
Strahan, S. E. and Douglass, A. R.: Decline in Antarctic ozone depletion and lower stratospheric chlorine deter- mined from Aura Microwave Limb Sounder observations, Geophys. Res. Lett., 45, 382–390, https://doi.org/10.1002/2017GL074830, 2018.
Valks, P., Loyola, D., Hao, N., Hedelt, P., Slijkhuis, S., Grossi, M., Gimeno Garcia, S., and Lutz, R.: Algorithm Theoretical Basis Document – GOME-2 Total Columns of Ozone, NO2, BrO, HCHO, SO2, H2O, OCLO and cloud Properties, GDP 4.8, SAF/AC/DLR/ATBD/01, Issue 3/A, available at: https://acsaf.org/docs/atbd/Algorithm_Theoretical_Basis_Document_NTO_OTO_DR_GDP48_Jun_2017.pdf (last access: 22 March 2019), 2017.
Van Roozendael, M., Loyola, D., Spurr, R., Balis, D., Lambert, J-C., Livschitz, Y., Valks, P., Ruppert, T., Kenter, P., Fayt, C., and Zehner C.: Ten years of GOME/ERS-2 total ozone data: the new GOME Data Processor (GDP) Version 4: I. Algorithm Description, J. Geophys Res., 111, D14311, https://doi.org/10.1029/2005JD006375, 2006.
Weber, M., Coldewey-Egbers, M., Fioletov, V. E., Frith, S. M., Wild, J. D., Burrows, J. P., Long, C. S., and Loyola, D.: Total ozone trends from 1979 to 2016 derived from five merged observational datasets – the emergence into ozone recovery, Atmos. Chem. Phys., 18, 2097–2117, https://doi.org/10.5194/acp-18-2097-2018, 2018.
Ziemke, J. R., Chandra, S., Labow, G. J., Bhartia, P. K., Froidevaux, L., and Witte, J. C.: A global climatology of tropospheric and stratospheric ozone derived from Aura OMI and MLS measurements, Atmos. Chem. Phys., 11, 9237–9251, https://doi.org/10.5194/acp-11-9237-2011, 2011.