the Creative Commons Attribution 4.0 License.
the Creative Commons Attribution 4.0 License.
 | 11 Jan 2019
Climatology of Asian dust activation and transport potential based on MISR satellite observations and trajectory analysis
Olga V. Kalashnikova
Michael J. Garay
Michael Notaro
Asian dust, primarily emitted from the Taklamakan and Gobi deserts, has been reported to reach remote destinations, such as North America. However, the relative contribution of the Taklamakan and Gobi deserts to dust loadings through long-range transport remains unaddressed in any observational study. Here, the climatology of Asian dust activation and potential for transport is investigated using stereo observations of dust sources from the Multi-angle Imaging SpectroRadiometer (MISR) instrument combined with observation-initiated trajectory modeling. MISR-derived dust plume top height and dust plume motion vectors confirm the peak of dust activation and transport potential in spring over the Gobi Desert and in both spring and summer over the Taklamakan Desert. The long-range trajectory patterns of Asian dust, including the influence on North America through trans-Pacific transport, are assessed using extensive forward trajectories initiated by MISR dust plume observations. The trajectory analysis reveals latitude-dependent spread of dust trajectories from the Taklamakan and Gobi deserts, with Taklamakan dust dominantly affecting to the south of 50∘ N and Gobi dust primarily affecting to the north of 50∘ N in North America. The Asian dust activation and transport potential exhibit substantial seasonal and interannual variability, motivating future studies on the potential drivers.
- Article
(8751 KB) -
Supplement
(590 KB) - BibTeX
- EndNote


Long-range transport of Asian dust has been documented in observational records and modeling results. It has been estimated that Asian dust sources account for 3 %–11 % of global dust emissions (Tanaka and Chiba, 2006). Originating primarily from the Taklamakan and Gobi deserts (Bory et al., 2003; Chen et al., 2017b; Prospero et al., 2002; Sun et al., 2001), elevated Asian dust is carried eastward by the prevailing midlatitude westerlies and crosses over China, South Korea, and Japan to the North Pacific (Duce et al., 1980; Huang et al., 2008; Shaw, 1980; Uno et al., 2011; Yumimoto et al., 2010). Asian dust occasionally reaches North America (Eguchi et al., 2009) and the Arctic (Huang et al., 2015) and can even be transported for more than one full track around the globe (Uno et al., 2009). Past observational studies have extensively examined individual cases of long-range, especially trans-Pacific, transport of Asian dust in terms of the transport pathways and vertical structure of aerosols (Arimoto et al., 2006; Eguchi et al., 2009; Liu et al., 2013; Uno et al., 2001, 2008, 2011; Yumimoto et al., 2009, 2010). Several field campaigns have been conducted to examine the composition, properties and radiative effects of Asian dust along its path of transport, such as the Asian Aerosol Characterization Experiment (ACE-Asia) (Huebert et al., 2003; Zhang et al., 2003), the Intercontinental Chemical Transport Experiment phase B (INTEX-B) (McKendry et al., 2008), Aeolian Dust Experiment on Climate Impact (ADEC) (Mikami et al., 2006), the National Aeronautics and Space Administration (NASA) Transport and Chemical Evolution over the Pacific (TRACE-P) (Jacob et al., 2003), and the Pacific Dust Experiment (Stith et al., 2009). However, due to the limited temporal coverage, these observational case studies or field campaigns did not address fundamental long-term statistics, such as the frequency of trans-Pacific transport of Asian dust.
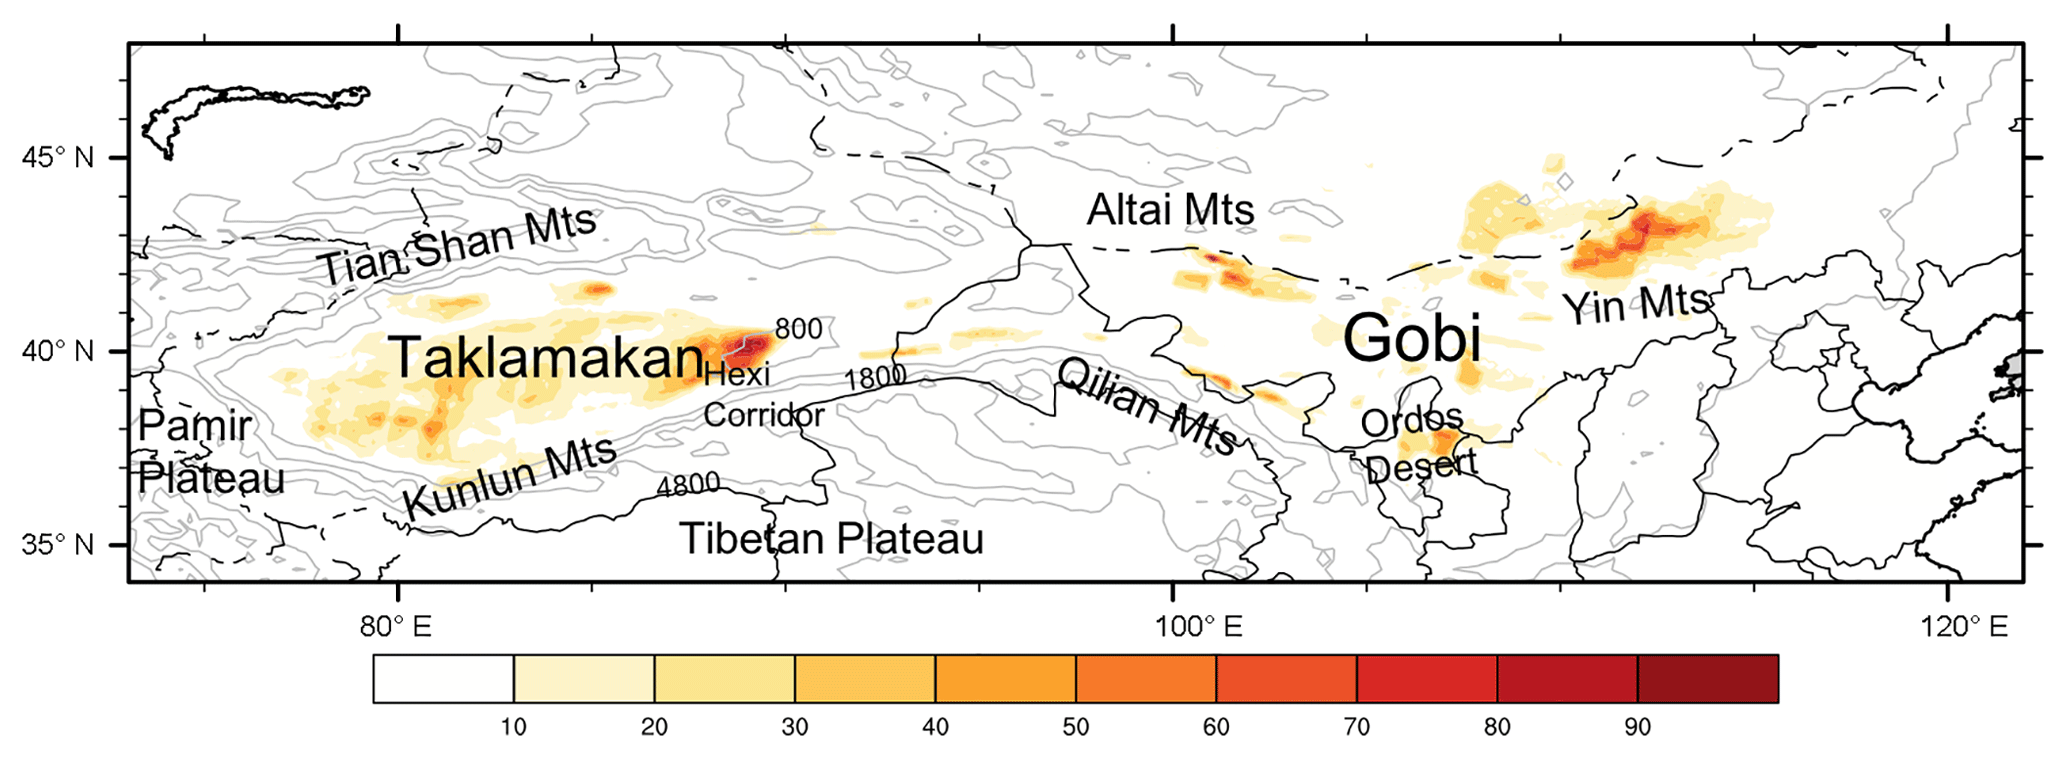
Figure 1Spatial distribution of dust plume detection frequency (% sample maximum) according to MINX. Grey contours indicate surface elevation (m) from the Multi-angle Imaging SpectroRadiometer (MISR) digital elevation model (DEM). Dust plume detection frequency in each pixel is calculated as the number of detected dust plume points per year.
The widely spread Asian dust exerts diverse influences on the regional and global environment. East Asian dust often mixes with pollutants, such as sulfate and nitrate, during the transport over the heavily polluted regions in China (K. Huang et al., 2010; Liu et al., 2014; Wang et al., 2016), leading to degraded air quality downwind in China (Yang et al., 2017), South Korea (Ha et al., 2017), Japan (Tobo et al., 2010), and the United States (Wu et al., 2015; Zhao et al., 2008). In particular, based on dust mass fluxes derived from satellite aerosol optical depth (AOD) observations and zonal wind assimilations, Yu et al. (2012) concluded that the trans-Pacific-transported Asian dust overwhelms the locally emitted dust in North America. Asian dust deposits into the marginal seas of China and North Pacific, carrying with it bioavailable iron that enhances phytoplankton growth (Tan et al., 2017; S.-H. Wang et al., 2012; Yuan and Zhang, 2006). Asian dust has been widely reported to influence regional and global climate directly by altering the radiative budget and indirectly by modifying cloud microphysics (Chen et al., 2017a; Ge et al., 2008; J. Huang et al., 2010, 2014, 2006a, b; Li et al., 2016; Wang et al., 2010). In particular, observational evidence indicates that Asian dust aerosols serve as ice nuclei and influence orographic precipitation processes over the western United States (Creamean et al., 2013).
Despite the important role of Asian dust in the global environment, the relative contribution of Asian dust sources, namely the Taklamakan and Gobi deserts (Fig. 1), to dust activity at remote destinations, such as North America, remains unaddressed by observational studies (Chen et al., 2017a). The Taklamakan Desert is located in the Tarim Basin of northwestern China and bounded by the Kunlun Mountains, the Pamir Plateau, and Tian Shan mountains to the south, west, and north, respectively. The Gobi Desert is located to the east of the Taklamakan Desert, covering portions of northern China and southern Mongolia. Based on a size-dependent soil dust emission and transport model, namely the Northern Aerosol Regional Climate Model (NARCM), Zhang et al. (2003) concluded that the Gobi Desert emitted about twice the amount of dust as the Taklamakan Desert during spring of 1960–2002. Based on the Weather Research and Forecasting model with chemistry (WRF-Chem) simulation of the massive East Asian dust storm in March 2010, Chen et al. (2017a) revealed comparable dust emission fluxes from the Gobi and Taklamakan deserts but suggested the higher potential for long-range dust transport from the Gobi Desert where the surface wind is dominantly eastward and the ground has higher altitude than the Taklamakan Desert. Given the substantial uncertainty in simulating dust emission and transport, due to difficulties in the parameterization of wind speed, soil water content, and vegetation cover (Uno et al., 2006), the modeling results regarding the relative contributions of the Taklamakan and Gobi deserts toward dust emission and transport need to be verified using observational data. Moreover, in light of the distinguished size distributions, chemical compositions, and optical properties of dust aerosols from the two deserts, knowledge about the dust activation and transport from the two deserts will facilitate better understanding of the remote environmental influence of Asian dust.
In the current study, dust source activities across the Taklamakan and Gobi deserts are examined using stereo retrievals of dust plumes observed by the Multi-angle Imaging SpectroRadiometer (MISR) (Diner et al., 1998) instrument on the NASA polar-orbiting Terra satellite. The plume heights and vector winds are retrieved by the MISR Interactive eXplorer (MINX) tool (Nelson et al., 2013) in case-by-case plume analysis. The multi-angle capability of MISR facilitates the stereoscopic retrieval of heights and motion vectors for clouds and aerosol plumes (Moroney et al., 2002). By incorporating additional information on the direction of apparent plume motion from a trained user, the MINX visualization and analysis software enables precise retrievals of aerosol plume heights and instantaneous winds at a horizontal resolution of 1.1 km. In prior studies, MINX plume height and motion retrievals provided unique and valuable information on aerosol injection heights from volcanic eruptions (Flower and Kahn, 2018), fires (Val Martin et al., 2010), and dust source activations (Kalashnikova et al., 2011). The dust plume measurements from MINX enable the current examination of the climatology in dust injection heights, which is a key parameter determining the potential for long-range transport yet has never been examined in observational data, across the Taklamakan and Gobi deserts. Furthermore, precise observations of dust injection heights allow more accurate trajectory modeling for the investigation of dust transport.
Through an analysis of plume height and motion observations from MISR and application of trajectory analysis, the present study investigates the climatology in dust source activity and dust transport potential from the Taklamakan and Gobi deserts. In particular, the following questions are addressed. Which dust source, between the Taklamakan and Gobi deserts, is a greater contributor towards the long-range transport of dust, such as the trans-Pacific transport to North America? How often do the trans-Pacific dust transport events occur? Is there any seasonality and/or interannual variability in the dust activation and transport potential?
2.1 MINX retrieval of dust plume height and motion
Dust plumes from the Taklamakan and Gobi deserts were processed with the MINX tool. Using multiple MISR imagery, the trained user of the MINX tool derives aerosol plume top height and wind at a spatial resolution of 1.1×1.1 km, with estimated uncertainties in height and wind speed of 200 m and 1–2 m s−1, respectively (Nelson et al., 2008). The MINX-based plume height and motion measurements are obtained geometrically, independent of background aerosols and thin cirrus, atmospheric thermal structure, cloud emissivity, or instrument radiometric calibration (Kalashnikova et al., 2011). The MISR instrument, with its 380 km swath, views the study region of East Asia every 6–7 days. Following Nelson et al. (2013), a “dust plume” is defined in this paper as a region of optically distinct dust that extends from an identified source to a downwind region, with a visible connection to the source, so that the direction of aerosol transport can be determined visually by the user. A “dust plume” typically contains hundreds to thousands of “dust plume data points”. Dust plumes are identified through MINX from MISR radiance imagery by a trained user, with the assistance from the Support Vector Machine (SVM) datasets in the MISR cloud classifiers product (Nelson et al., 2013). In the present study, the MINX dust plume data include 2251 dust plumes with 310 290 dust plume data points across the central Gobi Desert (36–45∘ N, 90–120∘ E) during 2001–2003, and 8945 plumes with 10 867 131 dust plume data points across the Taklamakan Desert (36–42∘ N, 77–91∘ E) during 2001–2011. Given the extensive labor work involved in the MINX retrieval, we currently only have 3 years of data over the Gobi Desert and 11 years of data over the Taklamakan Desert. However, the multi-year MINX dust plume data provide unique and sufficient information on the long-term statistics of dust plume characteristics. According to the spatial distribution of MINX dust plume samples (Fig. 1), substantial dust activation occurs across the entire Taklamakan Desert, with the highest frequency over the Hexi Corridor, where the surface wind is intensified due to the tunnel effect by surrounding mountains. In contrast, across the Gobi Desert, dust activation is limited to several hotspots, such as to the lee of the Yin, Qilian, and Altai mountains, and over the Ordos Desert.
2.2 HYSPLIT forward trajectory analysis
In order to identify the potential transport pathways of dust emitted from the Taklamakan and Gobi deserts, here we apply the Hybrid Single-Particle Lagrangian Integrated Trajectory (HYSPLIT) (Stein et al., 2015) model from the National Ocean and Atmosphere Administration (NOAA) Air Resource Laboratory. The HYSPLIT forward trajectory analysis has been widely used for tracing the downwind evolution of Saharan and Asian dust (Guo et al., 2017; Salvador et al., 2014; Su and Toon, 2011; Wang et al., 2016). Given the spatially widespread influence of Asian dust, long trajectories that last for weeks have been analyzed in previous studies (Guo et al., 2017; Huang et al., 2015; Uno et al., 2009; Wang et al., 2013). In the present study, 14-day forward trajectories from the Taklamakan Desert during 2001–2011 and from the Gobi Desert during 2001–2003 are computed based on 6-hourly, three-dimensional wind fields on a grid from the National Centers for Environmental Prediction (NCEP)/National Center for Atmospheric Research (NCAR) reanalysis. In recognition of the coarse spatial resolution of the NCEP/NCAR reanalysis, forward trajectories from the Taklamakan Desert are also computed based on wind fields from the NCEP Global Data Assimilation System on a grid (GDAS1) during 2006–2011 to confirm the conclusions from the trajectory analysis driven by the NCEP/NCAR reanalysis.
The initial date, time (around 05:00 UTC), latitude, longitude, and height of trajectory are obtained from MINX dust plume observations. Corresponding to the available MINX dust plume observations, a total of 310 290 forward trajectories are initiated from the 2251 dust plumes across the central Gobi Desert (36–45∘ N, 90–120∘ E) during 2001–2003, and 10 867 131 forward trajectories are initiated from the 8945 dust plumes across the Taklamakan Desert (36–42∘ N, 77–91∘ E) during 2001–2011. Given the spatial resolution of 1.1 km of the MINX dust plume data, the trajectories initiated from the nearby points in the same dust plume constitute a natural ensemble (Fig. S1 in the Supplement), thereby minimizing the trajectory calculation error. By initiating the trajectory model with the observed, precise dust plume height, the modeled transport pathways are improved. Given the capability of MISR at observing plume top features, we only analyze trajectories initiated at the observed dust plume top height in the current study.
In order to explore the sensitivity of atmospheric suspension time to initial injection height over the two deserts, experimental trajectories from the dust emission hotspots in the Taklamakan (40∘ N, 89∘ E; elevation of 805 m a.m.s.l.) and Gobi deserts (43.5∘ N, 130∘ E; elevation of 954 m a.m.s.l.) were initialized with injection height varying from 100 to 4000 m above ground in the previously reported dust active months of March–May during 2001–2003 (Fig. 2). According to this experiment, the atmospheric suspension time is sensitive to the initial injection height in the trajectory model for dust particles emitted from both the Taklamakan and Gobi deserts. Dust particles that are injected higher into the atmosphere generally have higher potential for longer atmospheric suspension time and thereby permit transport over a longer distance. In particular, particle suspension time is most sensitive to initial injection height when the injection height is below 2000 m above mean sea level (a.m.s.l.) over the Taklamakan Desert and 2500 m a.m.s.l. over the Gobi Desert, potentially attributed to the differentiated vertical profile of atmospheric stability over the two regions indicated by the climatology in vertical motion (Fig. S2). Incremental increases of 100 m in initial injection height over both deserts led to increases in the median atmospheric suspension time by more than 1 week at the most, suggesting the critical role of precise injection height in accurate modeling of dust transport and thereby determining the long-range transport. The sensitivity of atmospheric suspension time to injection height appears to be independent of the meteorological driver of the trajectories, since quantitatively similar sensitivity is evident in the analysis based on additional trajectories driven by GDAS1 and NCEP/NCAR during 2006–2008 (Fig. S3).
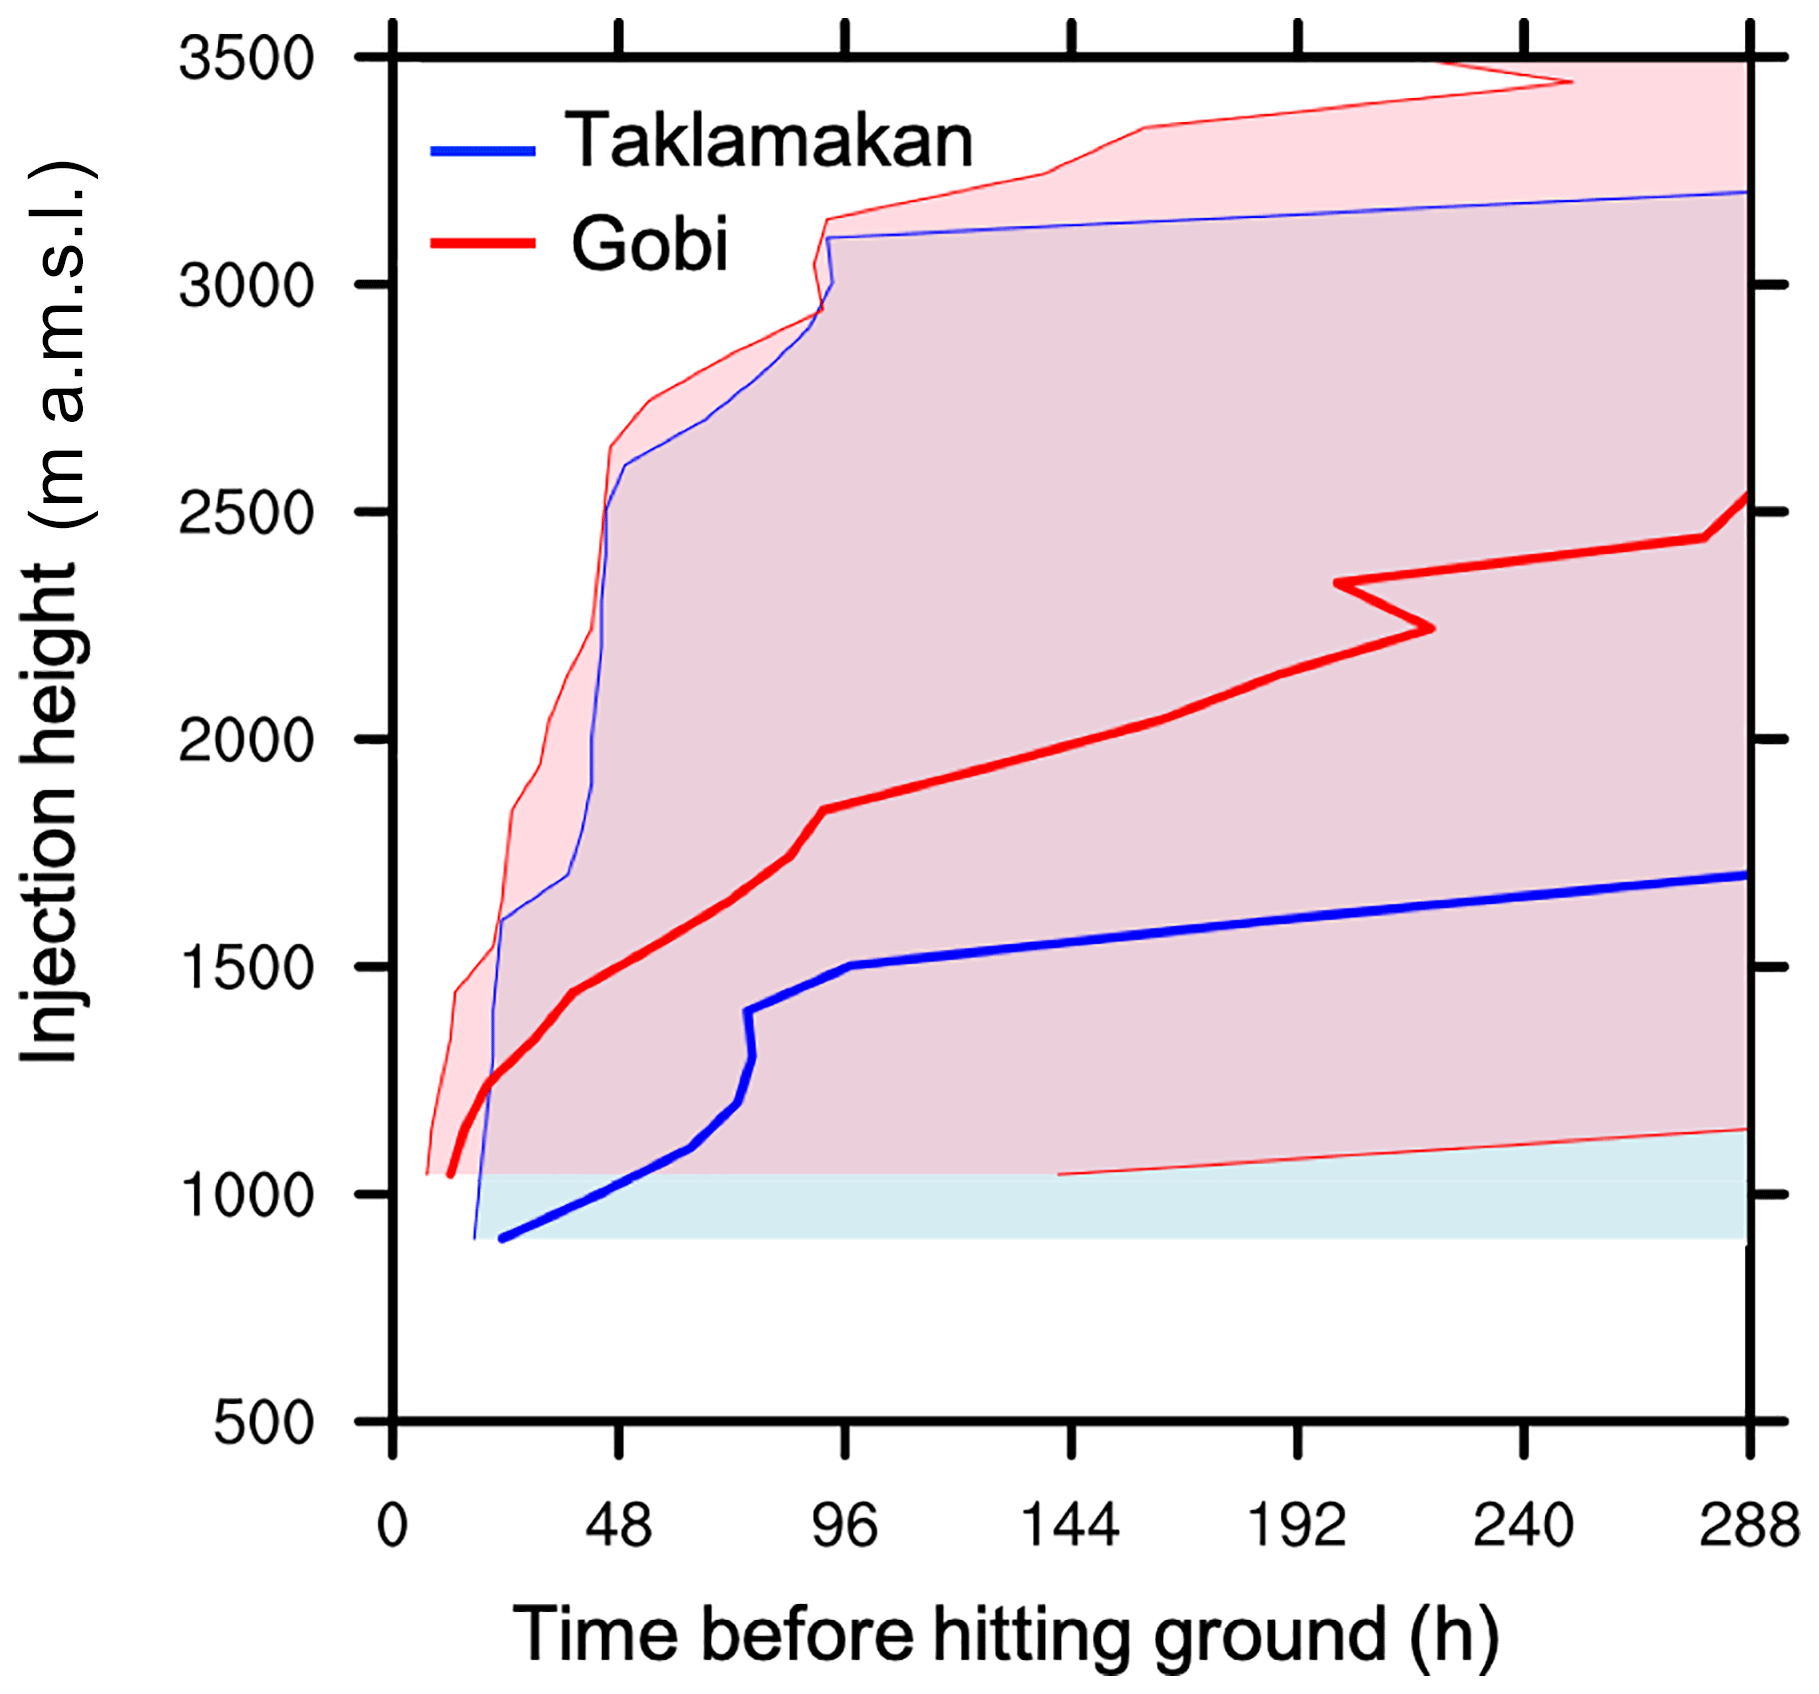
Figure 2Atmospheric suspension time (hours) of dust particles emitted from the Taklamakan (40∘ N, 89∘ E; elevation of 805 m a.m.s.l.) (blue) and Gobi deserts (43.5∘ N, 130∘ E; elevation of 954 m a.m.s.l.) (red) as a function of injection height (m a.m.s.l.), based on trajectories in March–May of 2001–2003. The thick lines (shading) represent the median (10th to 90th percentiles) of suspension time among 276 trajectories for each injection height.
2.3 MISR wind and MERRA2 reanalysis
In order to identify the dust transport directions over the Taklamakan and Gobi deserts, the wind climatology is examined at different vertical levels at a spatial resolution of 17.6 km from version F02_0002 of the MISR Level 3 cloud motion vector product (CMVP) for the time period of 2000–2017. In this product, imagery from multiple MISR cameras is used to simultaneously retrieve motion, namely wind speed and direction, and top height of automatically tracked features, such as optically thick aerosol plumes and clouds, thereby providing a proxy measure of wind (Mueller et al., 2012). In data-sparse regions like the Taklamakan and Gobi deserts, CMVP provides valuable information on the observed wind and complements any reanalysis or model simulation. Compared with other atmospheric motion vector (AMV) products based on radiometric heights, such as those retrieved by the Geostationary Operational Environmental Satellite (GOES) and Moderate Resolution Imaging Spectroradiometer (MODIS) AMV algorithms, the geometric heights assigned to MISR CMVs are not sensitive to radiometric calibrations, thereby facilitating higher accuracy (Mueller et al., 2017). MISR CMVP has been successfully applied to identify dust sources associated with the high frequency of rapidly propagating dust plumes near the surface across north Africa and the Middle East (Yu et al., 2018). In addition to MISR wind, vertical motion from the Modern-Era Retrospective analysis for Research and Applications version 2 (MERRA-2) (Gelaro et al., 2017) was also analyzed in an effort to explain the difference in the injection height and potential for long-range transport of dust from the Taklamakan and Gobi deserts, and confirm the findings from trajectories driven by NCEP/NCAR and GDAS1 reanalyses.
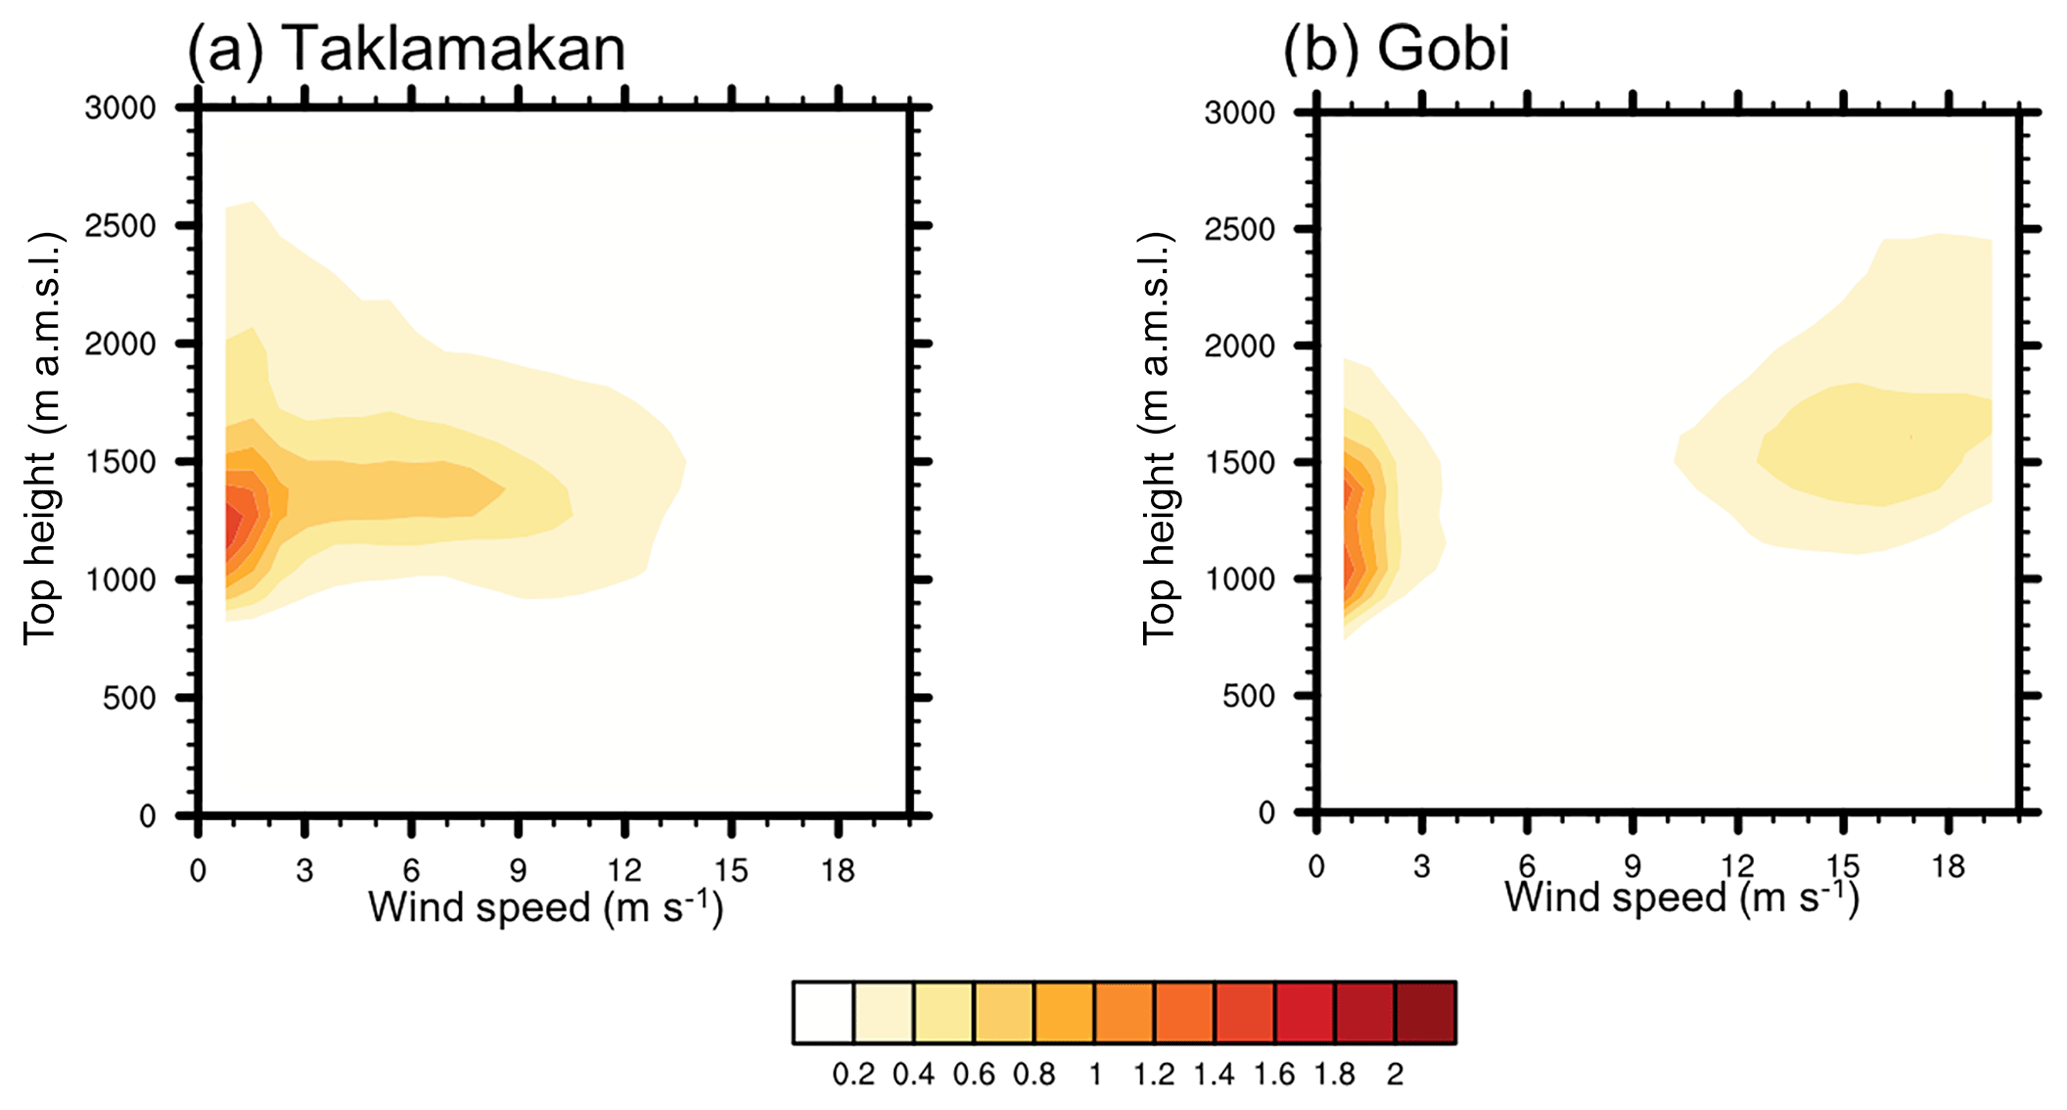
Figure 3Joint probability density function (%) of dust plume top height (m a.m.s.l.) and moving speed (m s−1) across the (a) Taklamakan Desert during 2001–2011 and (b) central Gobi Desert during 2001–2003 from MINX dust plume observation.
3.1 Asian dust plume characteristics
Based on the joint probability distribution of dust plume top height and motion speed (Fig. 3), dust particles from the Taklamakan and Gobi deserts are injected to similar heights above sea level, despite generally lower surface elevations across the Taklamakan Desert. Over both deserts, the dust plume top heights are most frequently observed between 1000 and 1500 m a.m.s.l., i.e., from the surface to about 500 m above the ground. About 5 % of dust plumes are injected to higher than 2 km a.m.s.l. over both deserts. The greatest dust plume top height in the MINX dataset is 3021 m a.m.s.l. over the Taklamakan Desert, and 2915 m a.m.s.l. over the Gobi Desert, apparently corresponding to local dust emissions, rather than from remote dust sources discussed in other studies (Hofer et al., 2017; Mikami et al., 2006; Tanaka et al., 2005). Taking into account the differential sensitivity of atmospheric suspension time to dust injection height over the two deserts (Fig. 2), dust emitted from the Taklamakan Desert appears to have higher potential for long-range transport than dust emitted from the Gobi Desert. According to the trajectory analysis, under dry conditions without wet deposition, dust particles injected to above 2 km a.m.s.l. over the Taklamakan Desert often stay in the atmosphere for longer than 12 days, which requires an injection height above 2.5 km a.m.s.l. from the Gobi Desert (Fig. 2). In addition, the dust plume top height over both deserts appears to be independent of wind speed, similar with the findings based on MISR observations and a 1-D plume rise model regarding smoke plumes associated with wildfires (Sofiev et al., 2012). The elevated dust plumes are mainly associated with weak winds below 5 m s−1 over the Taklamakan Desert, compared with strong winds exceeding 15 m s−1 over the Gobi Desert. Indeed, since the dust plume dataset contains points both over and downwind of the source, dust particles from the Gobi Desert are usually activated by strong surface winds exceeding 10 m s−1. The wind speed decreases quickly downwind of the actual source, causing the apparent discontinuity in the wind speed distribution over the Gobi Desert (Fig. 3b). The different wind regimes associated with dust injection height are primarily due to soil characteristics across the two deserts, namely primarily fine sands across the Taklamakan Desert versus coarse, rocky soils across the Gobi Desert (Sun et al., 2013).
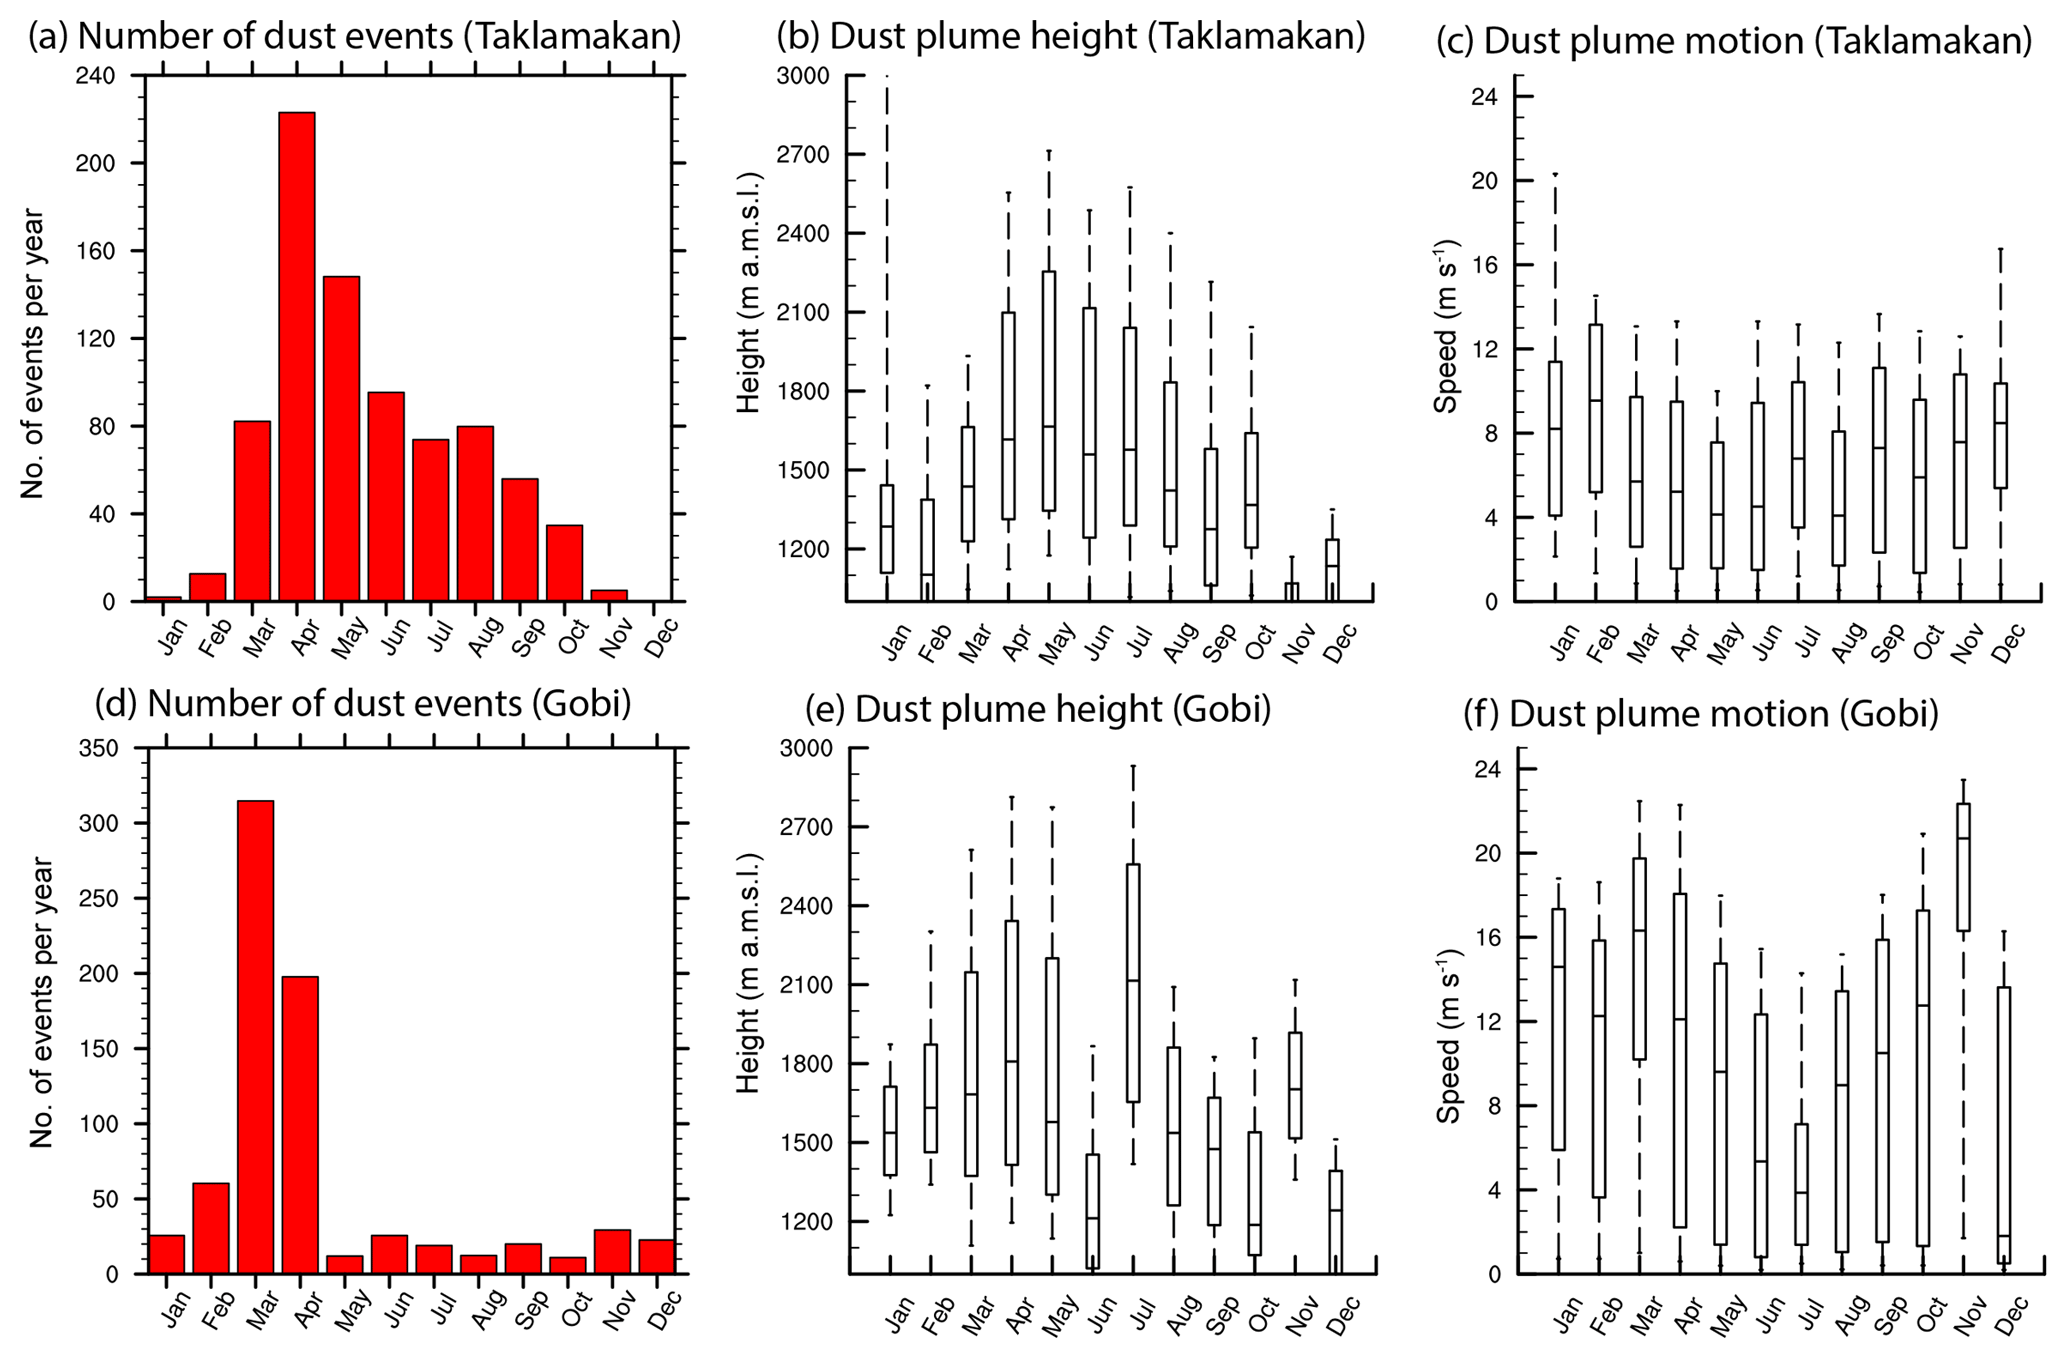
Figure 4Seasonality in dust plume characteristics from MINX dust plume data. (a, d) Dust plume occurrence per year bar chart, (b, e) injection height box plot (10th, 25th, 50th, 75th, and 90th percentiles), and (c, f) plume top moving speed box plot, across the (a–c) Taklamakan (2001–2011) and (d–f) Gobi (2001–2003) deserts, respectively, by month.
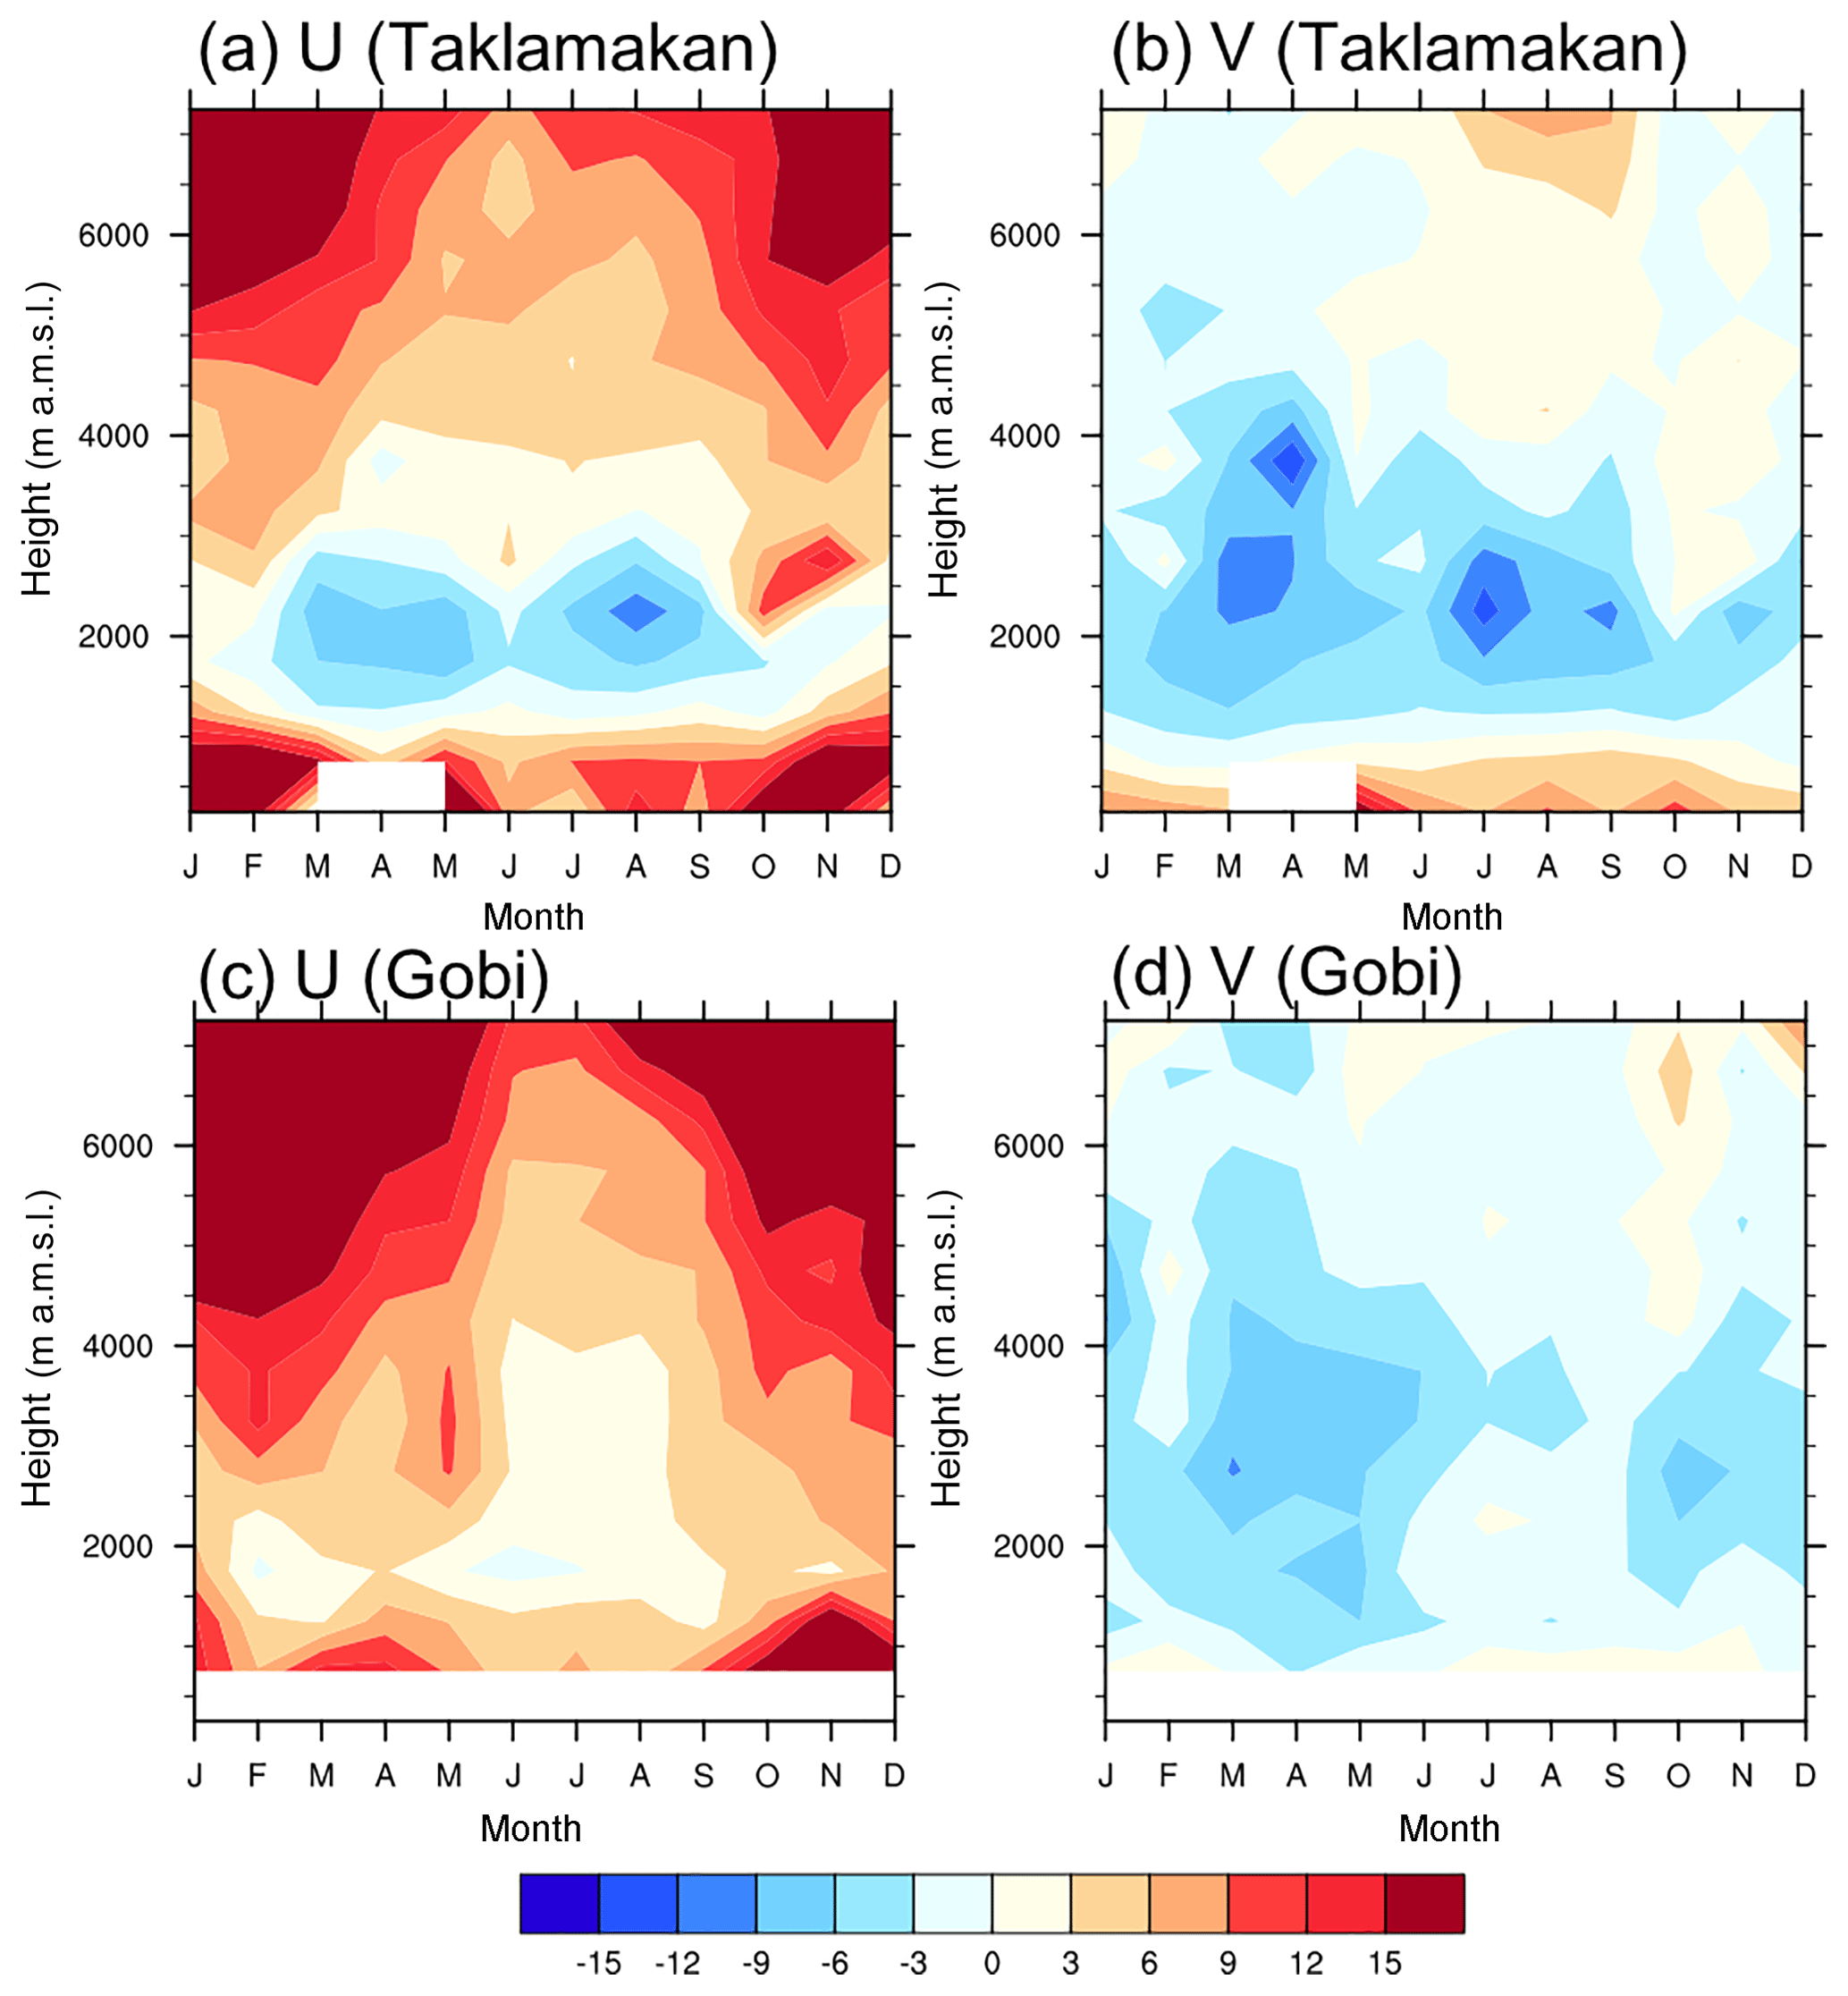
Figure 5Regional average (a, c) zonal (U) and (b, d) meridional (V) wind (m s−1) climatology across the (a–b) Taklamakan and (c–d) Gobi deserts, by month and height. The wind data are from MISR CMVP during 2001–2017, sampling the days with optically thick dust plumes or clouds. The missing cells represent levels below ground or sampled by CMVP for less than 10 times.
Dust activation events occur most frequently in spring over both the Taklamakan and Gobi deserts (Fig. 4), consistent with previous findings based on the climatology of AOD from MODIS (Yu et al., 2008) and the Along-Track Scanning Radiometer version 2 (ATSR-2) and Advanced Along-Track Scanning Radiometer (AATSR) (De Leeuw et al., 2018; Sogacheva et al., 2018), vertical distribution of dust aerosols observed by the Cloud-Aerosol Lidar with Orthogonal Polarization (CALIOP) lidar instrument (Liu et al., 2008; Proestakis et al., 2018; Xu et al., 2016), as well as dust observations at weather stations in China and Mongolia (Lim and Chun, 2006), among other observational evidence. Over the Taklamakan Desert, the occurrence of dust activation peaks in April and remains active except for the boreal winter months of November–February. An earlier study analyzing weather station, radiosonde, and reanalysis data suggests a key role of the nocturnal low-level jet on the dust activation over the Taklamakan Desert during spring and summer (Ge et al., 2016). Dust particles are injected to higher levels in boreal spring and summer, indicating seasonally enhanced potential for long-range transport of Taklamakan dust. Over the Gobi Desert, dust activation mostly occurs in March and April, driven by seasonally enhanced surface wind speeds associated with frequent cyclogenesis over northern China and Mongolia (Kurosaki and Mikami, 2004). Unlike the year-round dryness across the Taklamakan Desert, the Gobi Desert is affected by the East Asian summer monsoon, which inhibits summertime dust activation across the Gobi Desert (Arimoto et al., 2006). Dust plume top height also peaks in March and April over the Gobi Desert, suggesting the highest potential for long-range dust transport during these 2 months. The July peak of dust injection height over the Gobi Desert is likely due to enhanced ascent (Fig. S2) but needs further investigation, especially given the limited samples of dust plumes during July in the current study.
The climatology in horizontal wind, especially the zonal wind, is less favorable for eastward dust transport from the Taklamakan Desert than from the Gobi Desert (Fig. 5). Around 2 km a.m.s.l., the predominant wind direction is easterly in most months over the Taklamakan Desert, compared with dominant westerlies over the Gobi Desert at most vertical levels in most months. However, stronger ascending motion is noted at most vertical levels in most months over the Taklamakan Desert than over the Gobi Desert (Fig. S2), including especially the climatological ascent from the surface to about 3 km a.m.s.l. during April to October; this indicates a higher potential for dust over the Taklamakan Desert to become elevated to greater heights and enter the mean westerlies above 4 km a.m.s.l. Indeed, vertical motion exerts a strong influence on the travel distance of dust particles, as indicated by the correlation between dust particle atmospheric suspension time and first 3 h average vertical motion (−0.61 for Taklamakan and −0.58 from Gobi, both p values <0.01) according to 10 867 131 trajectories from the Taklamakan Desert and 310 290 trajectories from the Gobi Desert. In contrast, none of the correlations between atmospheric suspension time and horizontal winds (U, V, or wind speed) are significant for either desert. The identified key role of vertical motion in determining the dust particle atmospheric suspension time confirms previous findings based on dust events during the ACE-Asia field campaign (Tsai et al., 2008).
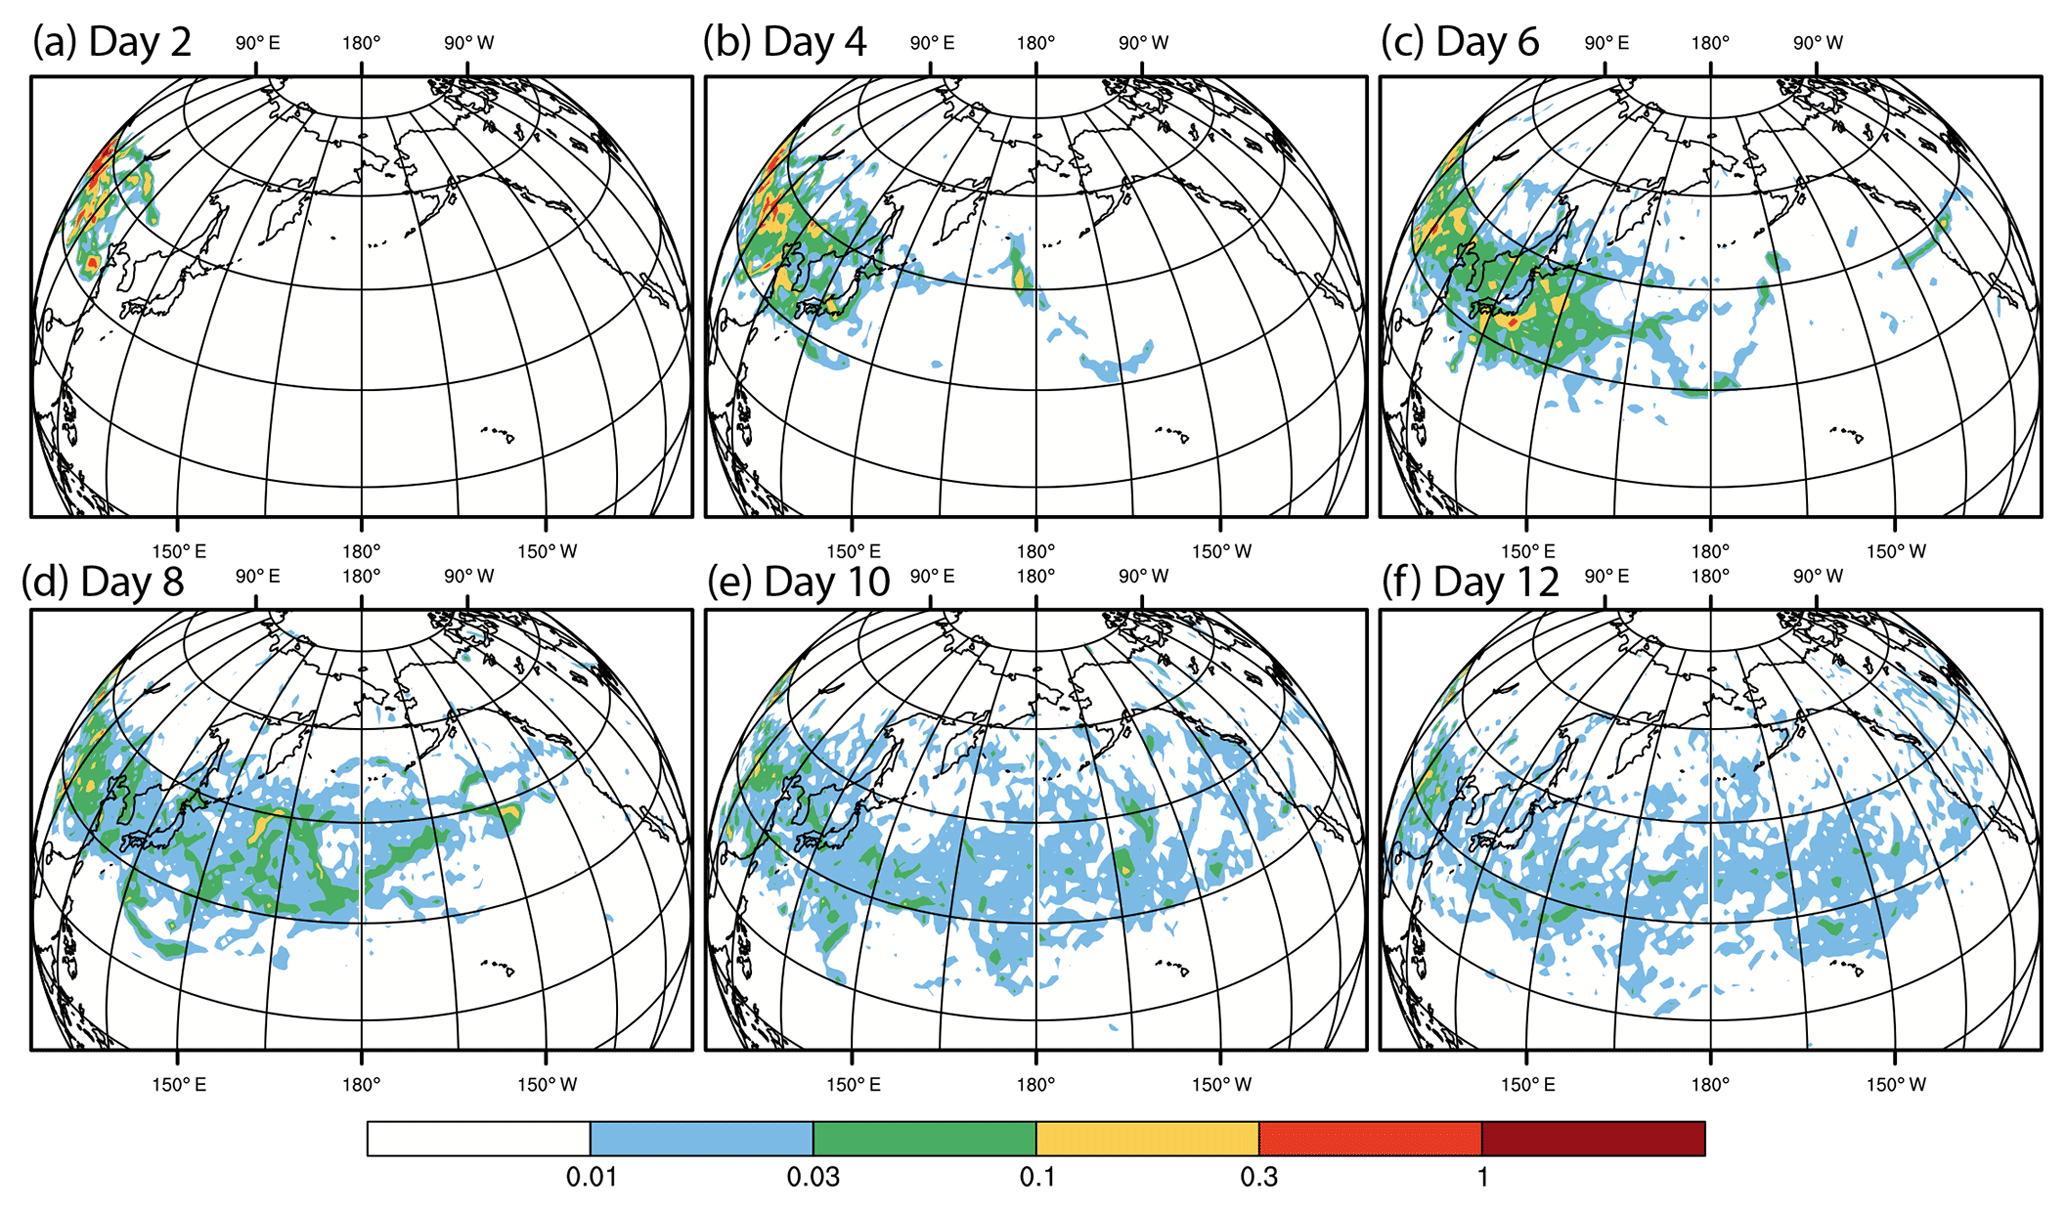
Figure 6Spatial distribution (%) of trajectory endpoints by the end of days (a) 2, (b) 4, (c) 6, (d) 8, (e) 10, and (f) 12 after emission from the Taklamakan Desert during 2001–2011. The spatial distribution values over all 1∘ latitude × 1∘ longitude grids in the Northern Hemisphere sum up to 100 %.
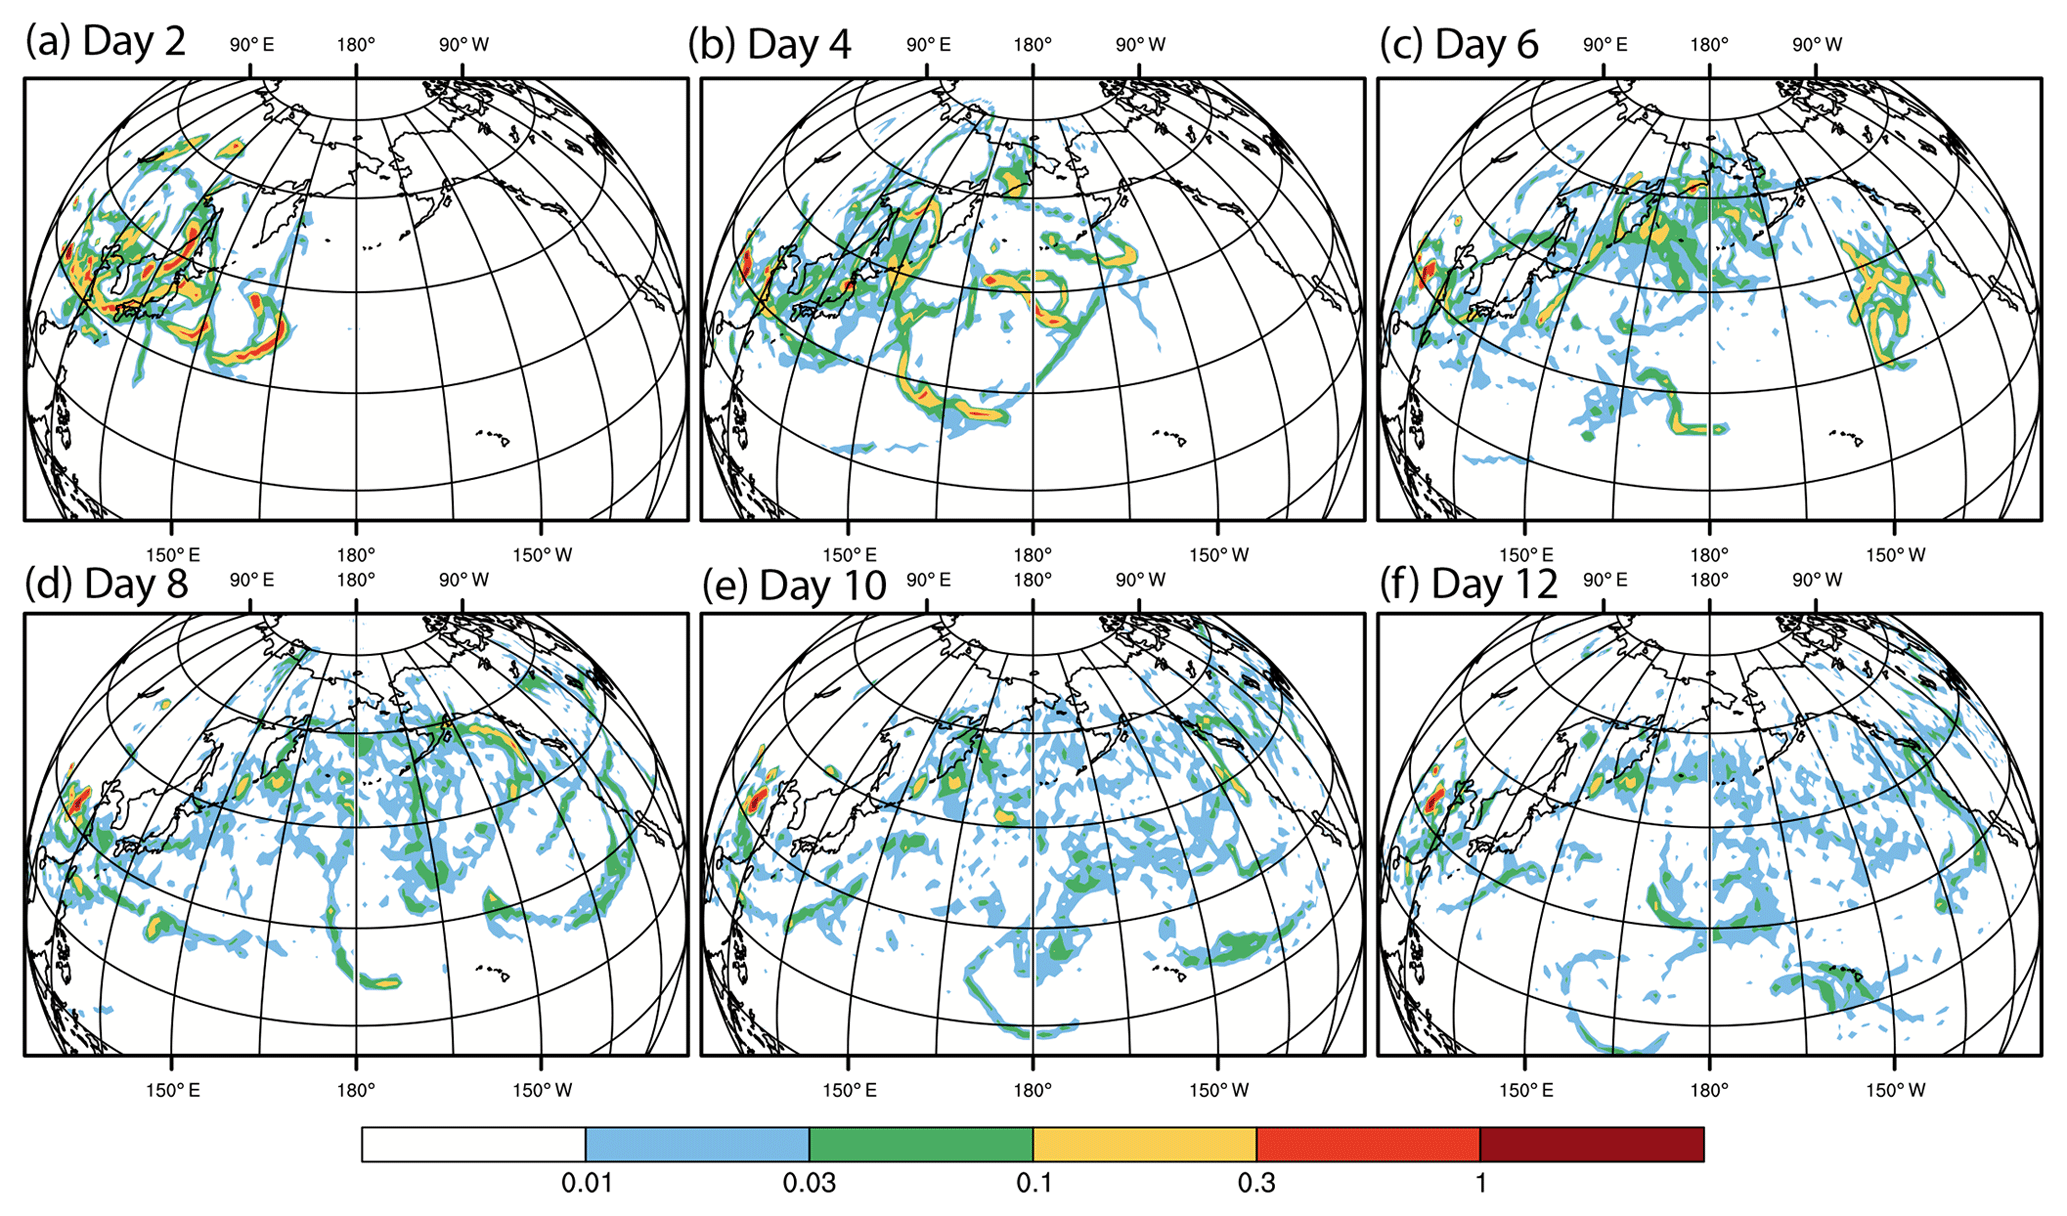
Figure 7Spatial distribution (%) of trajectory endpoints by the end of days (a) 2, (b) 4, (c) 6, (d) 8, (e) 10, and (f) 12 after emission from the central Gobi Desert during 2001–2003.
3.2 Potential transport pathways of Asian dust
The dust transport pathways are complicated after emission from the Taklamakan Desert (Fig. 6). During the first 2 days after emission, dust trajectories are mainly observed over limited areas in northern China and Mongolia near the source. Starting from the third day after emission, air parcels that contain dust particles from the Taklamakan Desert begin to affect the Korean Peninsula, Japan, and the northwestern Pacific Ocean and reach the west coast of North America as early as on the sixth day after emission. By day 12 after emission, Taklamakan dust trajectories reach scattered areas of North America but are more frequently present over other parts of the Northern Hemisphere. Given the widespread nature of dust after long-range transport, the absolute values in the spatial distribution of trajectory endpoint are less informative than the spatial distribution pattern itself, especially after several days after emission. In summary, the trajectory passage suggests that dust emitted from the Taklamakan Desert undergoes various complicated routes, with a small portion reaching North America as early as on the sixth day after emission.
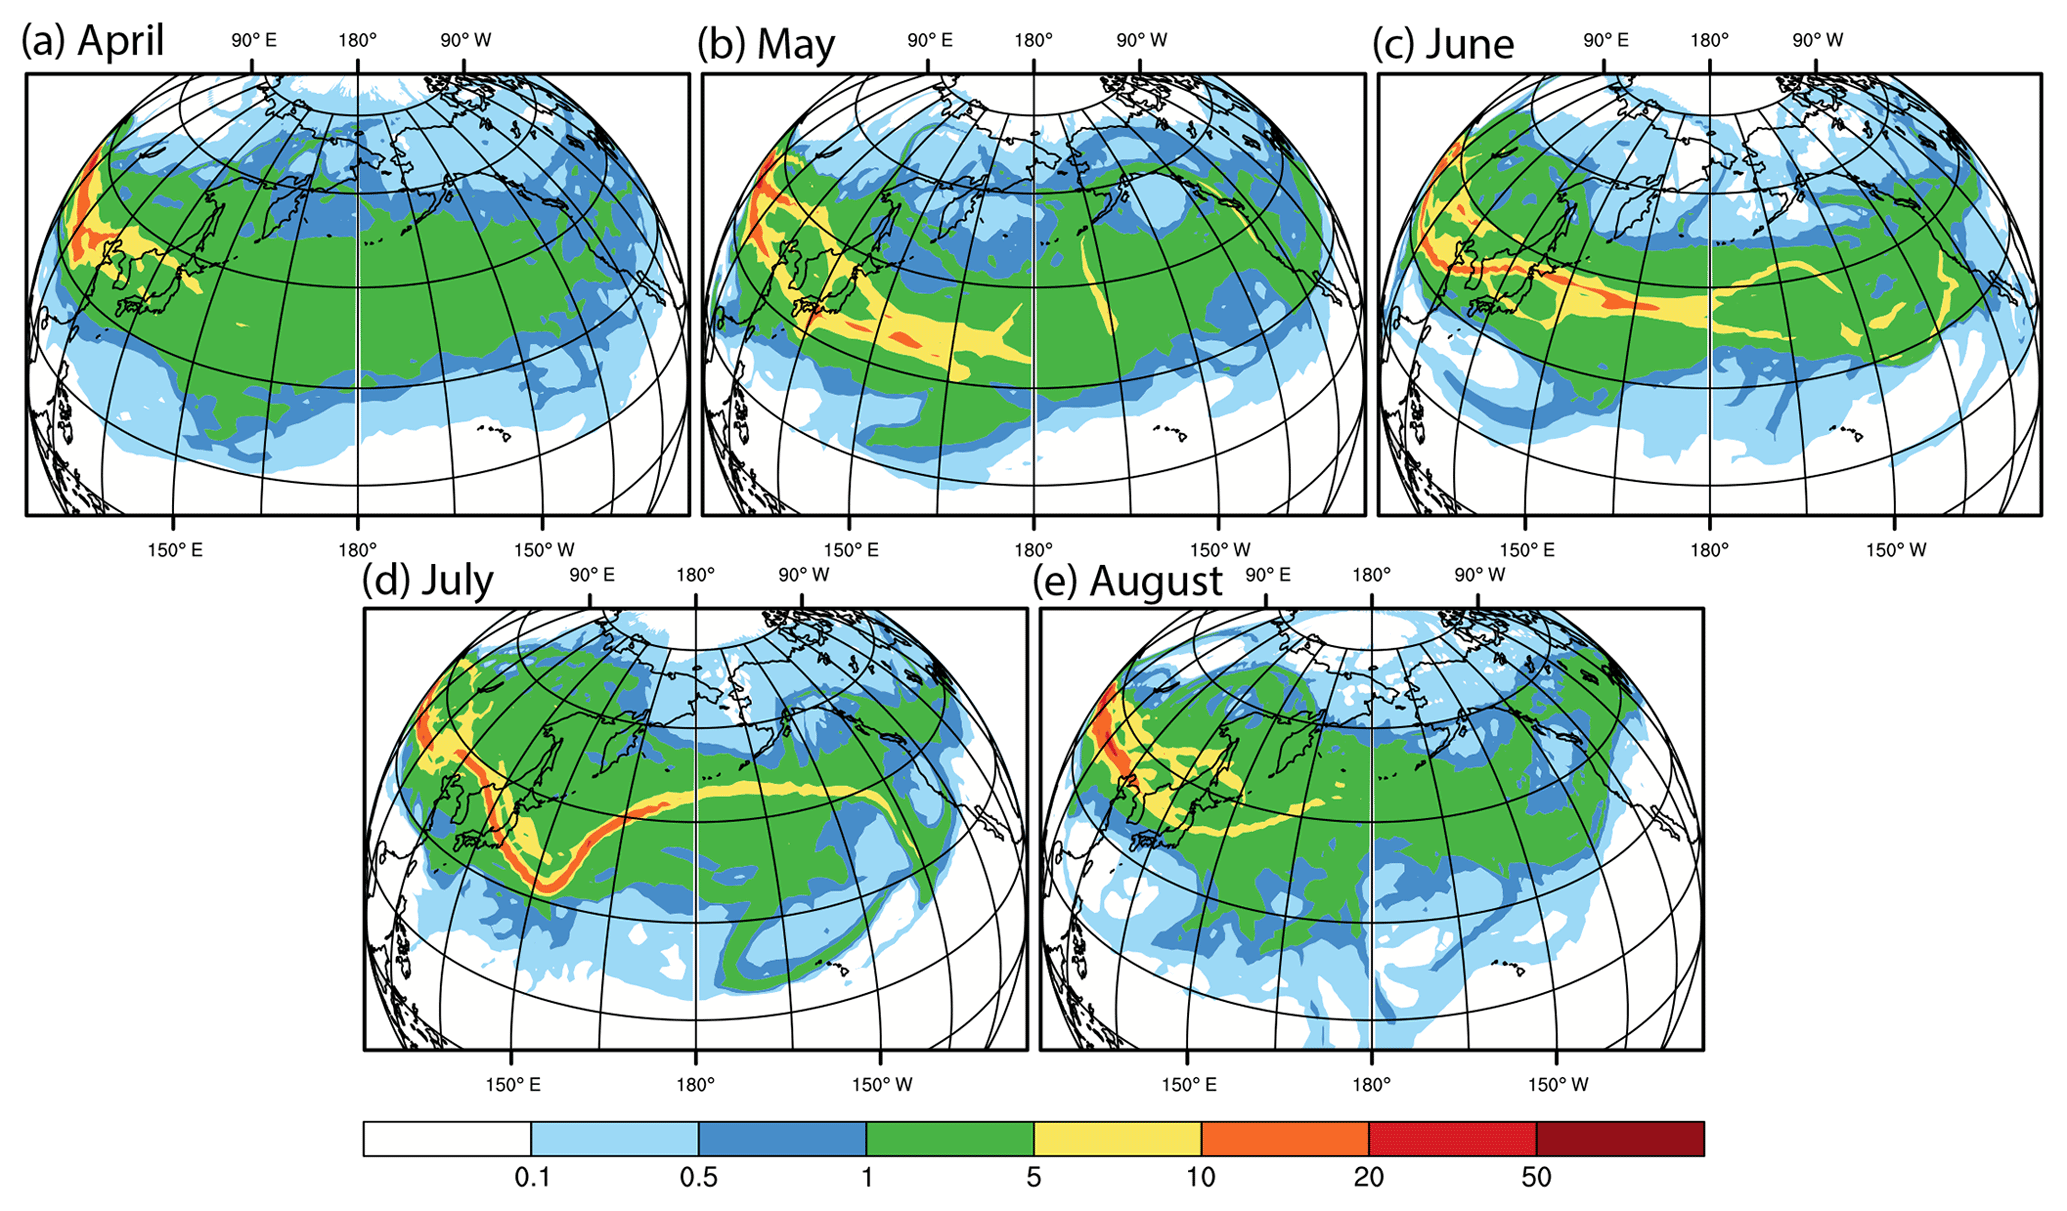
Figure 8Trajectory passage frequency (% of trajectories) from the Taklamakan Desert in (a) April, (b) May, (c) June, (d) July, and (e) August during 2001–2011. These months are analyzed because there are at least 10 000 data points with initial injection height exceeding 2 km a.m.s.l. in each of these months. The trajectory passage frequency is calculated as the number of trajectories crossing over each 1∘ latitude × 1∘ longitude grid in the Northern Hemisphere divided by the total number of trajectories from the Taklamakan Desert in each month.
Dust from the Gobi Desert undergoes even more complicated trajectory pathways that are closer to the Arctic compared with dust from the Taklamakan Desert (Fig. 7). Since the Gobi Desert is located to the east of the Taklamakan Desert, Gobi dust begins to influence the northwestern Pacific earlier than Taklamakan dust. However, due to complicated meteorological conditions, likely associated with polar fronts and jet streams, Gobi dust trajectories do not arrive to North America until day 8 after emission. Compared with the spatial distribution of Taklamakan dust influence, Gobi dust trajectories exert an influence over wider areas, ranging from as far south as 10∘ N over the Pacific Ocean to as far north as the Arctic.
3.3 Seasonality in transport potential of Asian dust
The transport potential of Taklamakan dust exhibits substantial seasonal variability (Fig. 8). The area affected by Taklamakan dust trajectories generally ranges from 30 to 60∘ N, with greater influence in East Asia near its source in all months. Consistent with implications from dust plume height (Fig. 4), Taklamakan dust is frequently transported over a long distance in both spring and summer, according to the trajectory analysis. Along with the seasonal placement of the predominant midlatitude westerlies, the spread of Taklamakan dust exhibits a northward shift from spring to summer, mainly affecting 30–45∘ N over North America in spring (April–May) and 45–60∘ N in summer (June–August). In May, both polar and subtropical jet streams contribute to the long-range transport of Taklamakan dust, as suggested by the apparent bifurcating transport paths (Fig. 8b). Moreover, in May, 1 %–5 % of trajectories from the Taklamakan Desert carry dust to south and southeast Asia, exerting potential influence on the onset of south Asian summer monsoon. The presence of Taklamakan dust over south and southeast Asia, according to observation-initiated trajectories, supports the findings regarding the influence of Asian dust on the south Asian summer monsoon by previous modeling study (Lau et al., 2006). In July, the troughing pattern of trajectories east of Japan is likely caused by the frequent occurrence of extratropical low pressure centers associated with the sea surface temperature gradient across the Kuroshio Current and its extension, along with the subtropical high pressure well developed in summer centered around 30∘ N, 170∘ E (Tanimoto et al., 2011).
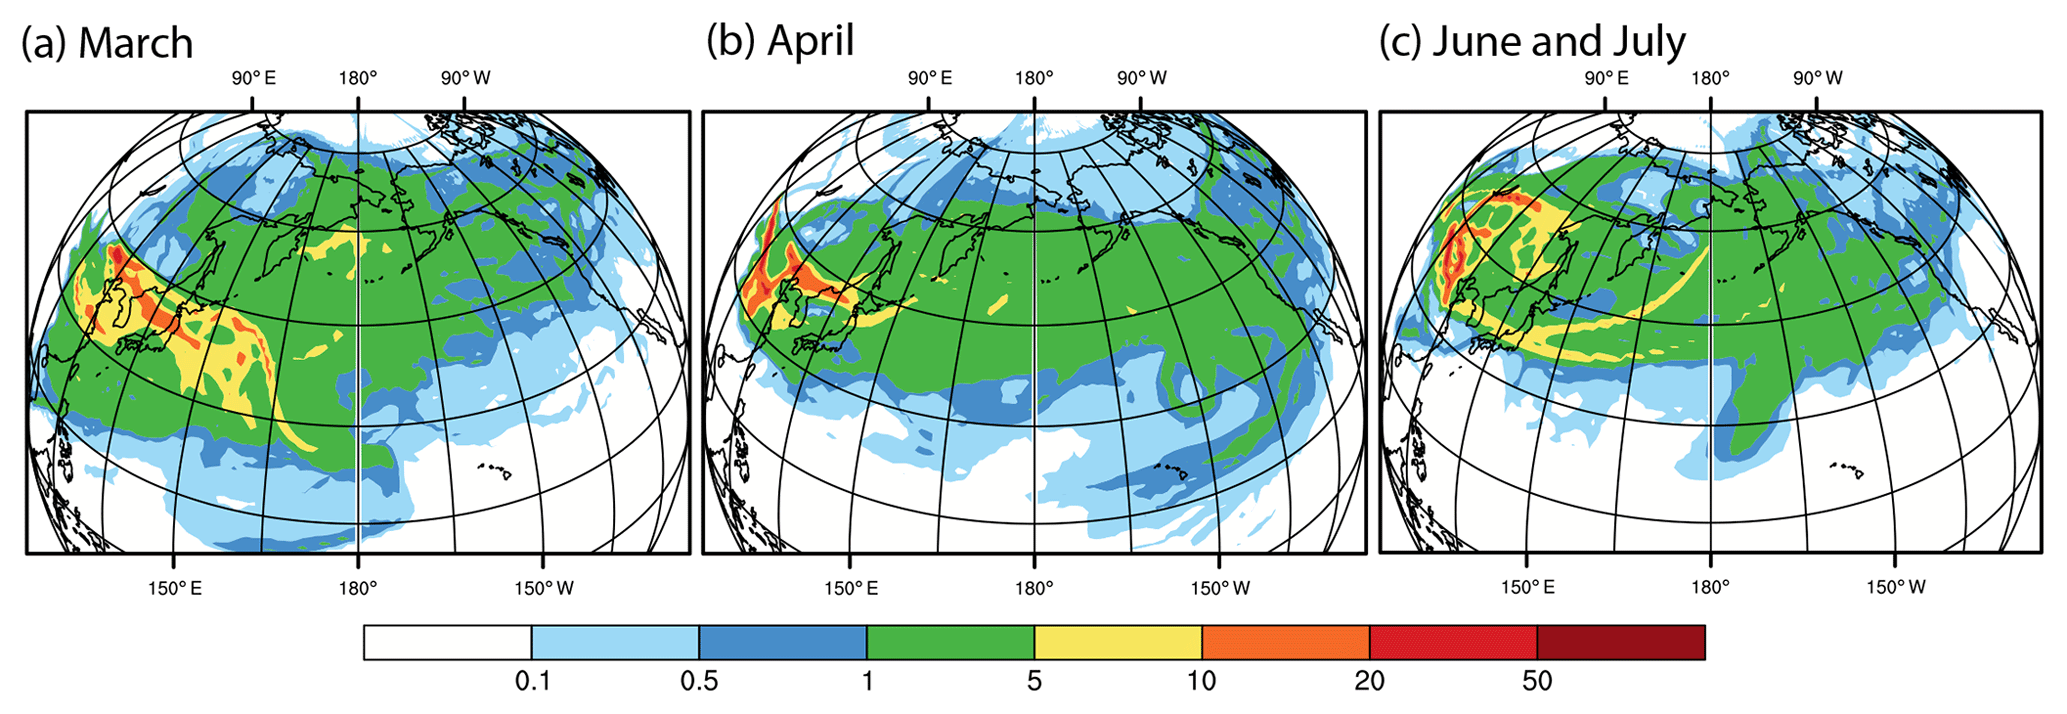
Figure 9Trajectory passage frequency (% of trajectories) from the central Gobi Desert in (a) March, (b) April, and (c) June and July during 2001–2003. There are at least 2500 data points with initial injection height exceeding 2 km a.m.s.l. in each of the analyzed periods. The trajectory passage frequency is calculated as the number of trajectories crossing over each 1∘ latitude × 1∘ longitude grid in the Northern Hemisphere divided by the total number of trajectories from the Gobi Desert in each month.
Substantial seasonality is also present in the trajectory passages of dust particles emitted from the Gobi Desert (Fig. 9). Similar to dust particles from the Taklamakan Desert, the springtime dust from the Gobi Desert generally spreads wider than summertime dust, consistent with the implication from the seasonal cycle of injection height (Fig. 4). The constrained and northward spread of Gobi dust in June is likely due to seasonally weakened and northward displacement of polar jet streams. In March, 1 %–5 % of dust trajectories from the Gobi Desert travel over the Bering Strait to the Arctic, likely causing phenomena like Arctic haze at several kilometers above the ground (Rahn et al., 1977).
3.4 Spread of Asian dust to North America
Taklamakan dust generally exerts a geographically wider spread over North America, especially over the southern part of the continent, than Gobi dust, according to trajectory analysis (Fig. 10). Overall, 5756 (3.9 %) dust trajectories from the Taklamakan Desert and 3804 (3.7 %) dust trajectories from the Gobi Desert travel over North America each year during 2001–2003, affecting 31 % and 23 % of the total area by more than 100 dust trajectories per year from the Taklamakan and Gobi deserts, respectively. Both the number of trajectories passing through and the area affected by a substantial number of trajectories from the Taklamakan Desert maximize around 40∘ N over North America. In contrast, both statistics maximize around 50–55∘ N over North America for Gobi dust trajectories. Around 40∘ N over North America, about 500 trajectories from the Taklamakan Desert and 150 trajectories from the Gobi Desert are observed each year during 2001–2003, with about 60 % and 20 % of the North American area affected by more than 100 trajectories per year from the Taklamakan and Gobi deserts, respectively. Around 55∘ N, these numbers are 300 and 400 trajectories per year from the Taklamakan and Gobi deserts, respectively, and 10 % and 20 % of the area affected by more than 100 trajectories per year from the Taklamakan and Gobi deserts, respectively. The latitudinal distribution of the influence from both deserts is likely due to the relatively strong northerly wind over the Taklamakan Desert compared to those over the Gobi Desert (Fig. 5). The relatively wider spread of Taklamakan dust trajectories, compared to Gobi dust trajectories, in North America is consistent with the implications from the dust plume top height (Fig. 3), atmospheric suspension time (Fig. 2), and local meteorological conditions (Figs. 5 and S2) regarding the higher potential of long-range transport from the Taklamakan Desert. The latitudinal distribution in the influence of Taklamakan dust on North America has been verified based on additional trajectories during 2006–2011 using both NCEP/NCAR and GDAS1 as the meteorological drivers, which also exhibits a peak between 40 and 45∘ N (Fig. S4).
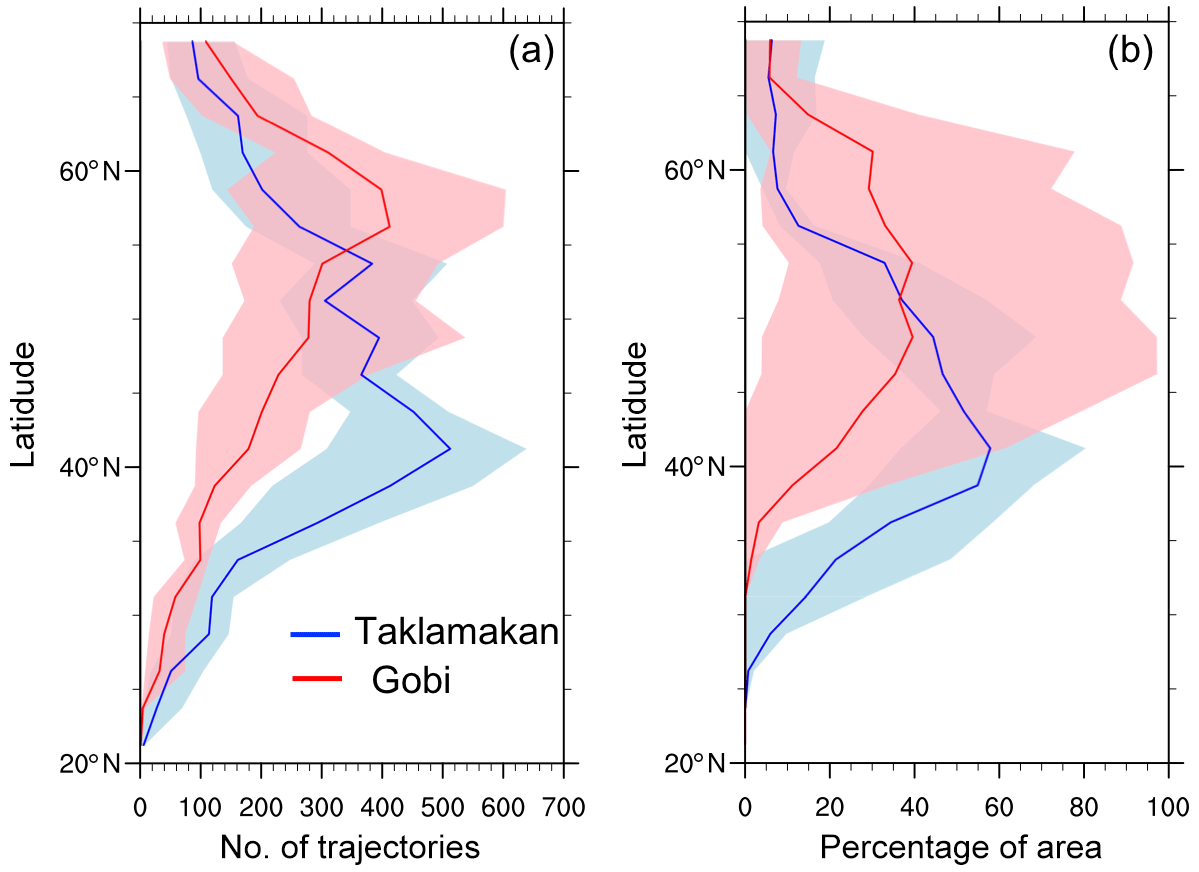
Figure 10Spread of Taklamakan and Gobi dust to North America by latitude, represented by trajectory passage during 2001–2003. (a) Number of trajectories per year from Taklamakan (blue) and Gobi (red) that pass over each 2.5∘ latitude band. (b) Percentage of area in each 2.5∘ latitude band influenced by more than 100 trajectories per year from Taklamakan (blue) and Gobi (red). The shadings represent maximum and minimum values among 2001, 2002, and 2003. These years are selected for the analysis because MISR dust plume data are available for both deserts during that period.
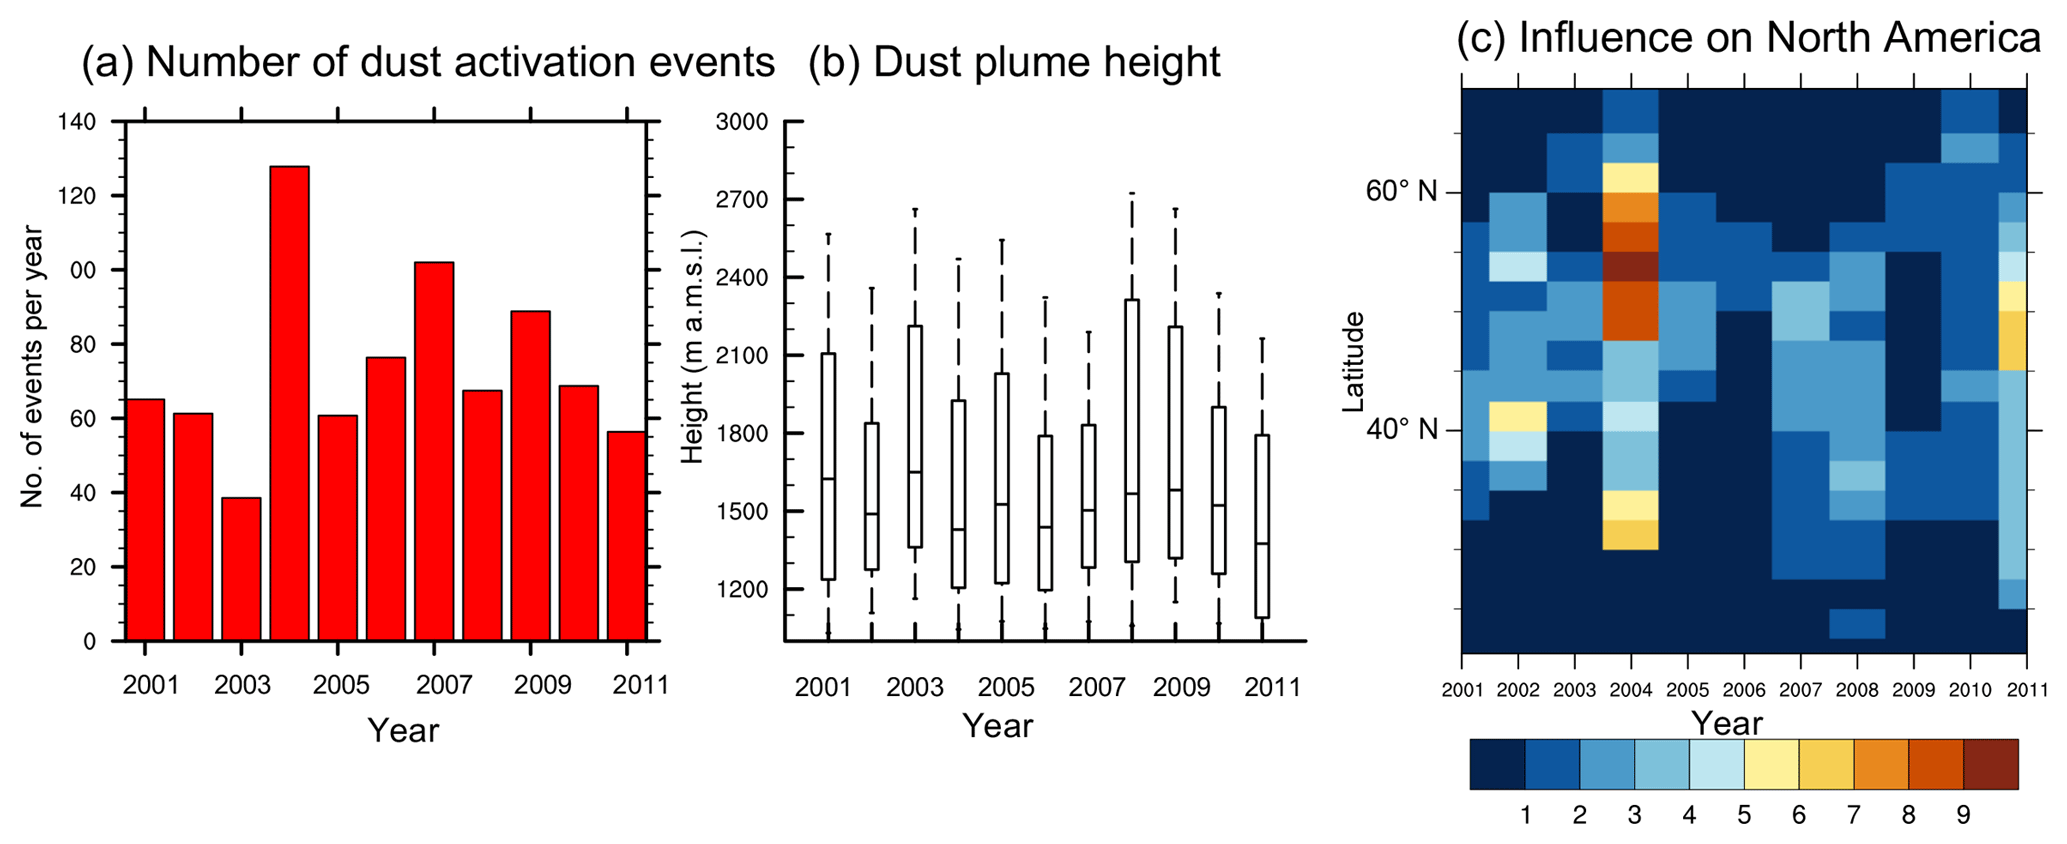
Figure 11Interannual variability in Taklamakan dust activation and transport during 2001–2011. (a) Dust activation occurrence, (b) dust plume height box plot (10th, 25th, 50th, 75th, and 90th percentiles), and (c) percentage of trajectories passing over North America by latitude.
3.5 Interannual variability in Asian dust activation and transport potential
The activation occurrence, injection height, and potential for long-range transport of dust emitted from the Taklamakan Desert exhibit substantial interannual variability during 2001–2011 (Fig. 11). The number of dust activation events captured by MISR and retrieved by MINX varies from 38 events in 2003 to 127 events to 2004. The inhibited dust activation in 2003 appears to be associated with anomalous wet soils, which represent the wettest year in a land surface model ensemble simulation of regional soil moisture in China during 1950–2006 (Wang et al., 2011). The median dust plume top height varies from 1334 to 1640 m a.m.s.l. in 2003, suggesting substantial variability in the potential for long-range transport. In addition, the trajectory patterns vary by year, as indicated by the influence on the remote regions such North America by latitude. The year 2004 appears to be the one with the most favorable meteorological conditions for trans-Pacific transport of Taklamakan dust, with the percentage of trajectories passing over North America maximizing at 10 % over around 53∘ N, likely attributed to two factors. One cause is the inhibited springtime dust activation (23 events in March–May) and enhanced summertime dust activation (89 events in June–August), with the latter favoring a northward shift of the dust spread (Fig. 8). Another factor is likely the large-scale circulation associated with the El Niño starting from June that favors a northward shift of the Asian dust spread (Gong et al., 2006). In 2002 and 2011, the influence of Taklamakan dust maximizes at a lower latitude of around 40 and 45∘ N, respectively. In contrast, during 2006 and 2009, the spread of Taklamakan dust trajectories over North America is trivial.
Indeed, such interannual variability is also present in the activation and transport of dust emitted from the Gobi Desert, as suggested by the 3 years of data (Fig. 10). Limited by the short record for dust plumes over the Gobi Desert, we did not make an effort to examine interannual variability in dust emission and transport from the Gobi Desert. However, comparing the interannual variability in the influence on North America by the dust trajectories from both deserts during 2001–2003, it appears that the interannual variability in dust emission and transport potential is greater for Gobi dust than for Taklamakan dust. The greater interannual variability in Gobi dust emission and transport is potentially caused by the complicated meteorological conditions, especially associated with the frontal activity (Tsai et al., 2008), over the Gobi Desert and along the Gobi dust transport pathways (Figs. 7 and 9).
In the current study, the climatology in dust plume characteristics and long-range trajectory of dust from the Taklamakan and Gobi deserts are examined using the climatology of dust plume top heights and winds near the source derived from MISR stereo observations of optically thick dust plume and trajectory analysis. Based on the unique MISR dust plume height and plume motion observations and confirmed with trajectory analysis, dust particles emitted from the Taklamakan Desert generally present higher potential for long-range transport and exert wider spread in their cone of influence across North America through trans-Pacific transport than dust from the Gobi Desert. The higher transport potential of Taklamakan dust is primarily attributed to greater injection heights from the ground, enabled by finer dust particles emitted from the Taklamakan Desert and climatological mid- to low-level ascending motion in spring and summer. Furthermore, the relative abundance of Taklamakan and Gobi dust trajectories over North America depends on latitude, with greater influence from Taklamakan dust trajectories to the south of 50∘ N and greater influence from Gobi dust trajectories to the north of 50∘ N across North America. Consistent with previous observational evidence, the MISR dust plume data and trajectory analysis indicate maximized dust activation occurrence and highest potential for long-range transport in spring from both deserts, with about 5 % of the trajectories passing over North America. Substantial summertime dust activation and long-range transport from the Taklamakan Desert occur as well.
Uncertainty in the current results mainly comes from the assumptions in trajectory modeling. By treating dust particles as tracers in the trajectory modeling, processes such as wet deposition and gravitational settling are ignored. Therefore, the current trajectory analysis provides an upper limit of the actual frequency of long-range dust transport, in particular the trans-Pacific dust transport from Asian sources to North America. Taking gravitational settling into account, the actual potential for long-range transport of dust from the Taklamakan Desert, compared to that of the Gobi Desert, is probability even higher than assessed in the current study, given the smaller particle size of Taklamakan dust. However, the stronger surface wind that activates dust mobilization in the Gobi Desert likely triggers stronger vertical mixing, as revealed by Gasteiger et al. (2017) regarding dust transport in the Saharan Air Layer, thus compensating the gravitational settling to a certain degree. These hypotheses can be tested by analyzing particle size distributions along trajectories from both deserts using ground and satellite observations, as well as performing advanced trajectory analysis that considers gravitational settling and wet deposition of dust particles.
In addition, the current study focuses on trajectories initiated at the top of observed dust plumes. Given the capability of MISR at observing plume top features, we cannot infer the vertical structure of dust plumes from MISR stereo observations. With observed dust plume vertical structure, future studies are encouraged to analyze trajectories initiated at all vertical levels with the presence of dust aerosols.
Furthermore, the accuracy of trajectory passages presented in this study is limited by the usage of the coarse-resolution NCEP/NCAR reanalysis as a meteorological driver. Although the conclusions regarding the sensitivity of atmospheric suspension time to dust injection height and influence of Asian dust on North America have been confirmed with trajectory analysis driven by a newer reanalysis with higher spatial resolution (Figs. S3 and S4), the trajectory-analysis-based findings regarding Asian dust transport potential and relative contribution of Taklamakan and Gobi dust on remote regions such as North America need to be confirmed by future observational and modeling efforts. As an extension of previous modeling studies (Chen et al., 2017a; Zhang et al., 2003), model simulations of the size-dependent dust emission from the Taklamakan and Gobi deserts are encouraged to incorporate observational constraints provided by MISR aerosol and particle shape measurements at different wavelengths as well as multi-spectral measurements from other satellite instruments (J. Wang et al., 2012; Xu et al., 2017). In order to verify the identified seasonality in dust trajectory patterns, we suggest future studies to take advantage of both geostationary and polar-orbiting satellite observations, as well as ground-based lidar observations. Such dust observations per trajectory will eventually connect the trajectory analysis with actual dust transport. In order to confirm our findings about the latitudinal distribution of the influence from Gobi and Taklamakan dust, we encourage future studies to examine isotopic abundance, mineralogical composition, and particle color information from samples collected at different locations across North America, given the elemental differences in dust minerals between the Taklamakan and Gobi deserts (Zhang et al., 1997).
The present results on the interannual variability in dust activation and transport motivates further observational investigations on the natural and anthropogenic drivers of such variability. The aforementioned satellite observations, especially the long-term stereo and optical measurements from MISR, will facilitate such observational investigation of the interannual variability in dust emission and transport from Asia, as demonstrated by previous examples focusing on north Africa and the Middle East (Notaro et al., 2015; Yu et al., 2018). Future observational studies on the environmental drivers of Asian dust emission and transport will also benefit from the development of advanced statistical methods, such as the Stepwise Generalized Equilibrium Feedback Assessment which has been successfully applied to examine the environmental drivers of north African dust and climate variability (Yu et al., 2017a, b).
MISR CMVP data were obtained from the NASA Langley Research Center Atmospheric Science Data Center. MERRA-2 meteorological reanalysis was obtained from Goddard Earth Sciences Data and Information Services Center (GES DISC). To request the MINX dust plume data and trajectory model outputs, please contact the corresponding author via email (yuyan06@gmail.com).
The supplement related to this article is available online at: https://doi.org/10.5194/acp-19-363-2019-supplement.
YY led the study with inputs from co-authors. OVK and MJG provided the MINX dust plume data and guidance on their usage. MN supported the trajectory analysis. YY prepared the manuscript and figures with comments from all co-authors.
The authors declare that they have no conflict of interest.
MISR CMVP data were obtained from the NASA Langley Research Center
Atmospheric Science Data Center. MERRA-2 meteorological reanalysis was
obtained from Goddard Earth Sciences Data and Information Services Center
(GES DISC). The MINX dust plume data were processed by Michael Goetz
during his 2012 summer internship at JPL and stored at the Jet Propulsion
Laboratory. Yan Yu was partially funded by NASA's Postdoc Program (NPP).
This work was performed at the Jet Propulsion Laboratory, California
Institute of Technology, under a contract with the National Aeronautics and
Space Administration. The authors thank the MISR team for providing
facilities and useful discussions.
Edited by: Jianzhong Ma
Reviewed by: two anonymous referees
Arimoto, R., Kim, Y. J., Kim, Y. P., Quinn, P. K., Bates, T. S., Anderson, T. L., Gong, S., Uno, I., Chin, M., Huebert, B. J., Clarke, A. D., Shinozuka, Y., Weber, R. J., Anderson, J. R., Guazzotti, S. A., Sullivan, R. C., Sodeman, D. A., Prather, K. A., and Sokolik, I. N.: Characterization of Asian Dust during ACE-Asia, Global Planet. Change, 52, 23–56, https://doi.org/10.1016/j.gloplacha.2006.02.013, 2006.
Bory, A. J. M., Biscaye, P. E., and Grousset, F. E.: Two distinct seasonal Asian source regions for mineral dust deposited in Greenland (NorthGRIP), Geophys. Res. Lett., 30, 1–4, https://doi.org/10.1029/2002GL016446, 2003.
Chen, S. Y., Huang, J., Kang, L., Wang, H., Ma, X., He, Y., Yuan, T., Yang, B., Huang, Z., and Zhang, G.: Emission, transport, and radiative effects of mineral dust from the Taklimakan and Gobi deserts: comparison of measurements and model results, Atmos. Chem. Phys., 17, 2401–2421, https://doi.org/10.5194/acp-17-2401-2017, 2017a.
Chen, S. Y., Huang, J. P., Li, J. X., Jia, R., Jiang, N. X., Kang, L. T., Ma, X. J., and Xie, T. T.: Comparison of dust emissions, transport, and deposition between the Taklimakan Desert and Gobi Desert from 2007 to 2011, Sci. China Earth Sci., 60, 1338–1355, https://doi.org/10.1007/s11430-016-9051-0, 2017b.
Creamean, J. M., Suski, K. J., Rosenfeld, D., Cazorla, A., Demott, P. J., Sullivan, R. C., White, A. B., Ralph, F., Minnis, P., Comstock, J. M., Tomlinson, J. M., and Prather, K. A.: Dust and Biological Aerosols, Science, 339, 1572–1578, https://doi.org/10.1126/science.1227279, 2013.
de Leeuw, G., Sogacheva, L., Rodriguez, E., Kourtidis, K., Georgoulias, A. K., Alexandri, G., Amiridis, V., Proestakis, E., Marinou, E., Xue, Y., and van der A, R.: Two decades of satellite observations of AOD over mainland China using ATSR-2, AATSR and MODIS/Terra: data set evaluation and large-scale patterns, Atmos. Chem. Phys., 18, 1573–1592, https://doi.org/10.5194/acp-18-1573-2018, 2018.
Diner, D. J., Beckert, J. C., Reilly, T. H., Bruegge, C. J., Conel, J. E., Kahn, R. A., Martonchik, J. V, Ackerman, T. P., Davies, R., Gerstl, S. A. W., Gordon, H. R., Muller, J. P., Myneni, R. B., Sellers, P. J., Pinty, B., and Verstraete, M. M.: Multi-angle Imaging SpectroRadiometer (MISR) instrument description and experiment overview, IEEE Trans. Geosci. Remote, 36, 1072–1087, https://doi.org/10.1109/36.700992, 1998.
Duce, R. A., Unni, C. K., Ray, B. J., Prospero, J. M., and Merrill, J. T.: Long-range atmospheric transport of soil dust from Asia to the tropical North Pacific: Temporal variability, Science, 209, 1522–1524, https://doi.org/10.1126/science.209.4464.1522, 1980.
Eguchi, K., Uno, I., Yumimoto, K., Takemura, T., Shimizu, A., Sugimoto, N., and Liu, Z.: Trans-pacific dust transport: integrated analysis of NASA/CALIPSO and a global aerosol transport model, Atmos. Chem. Phys., 9, 3137–3145, https://doi.org/10.5194/acp-9-3137-2009, 2009.
Flower, V. J. B. and Kahn, R. A.: Karymsky volcano eruptive plume properties based on MISR multi-angle imagery and the volcanological implications, Atmos. Chem. Phys., 18, 3903–3918, https://doi.org/10.5194/acp-18-3903-2018, 2018.
Gasteiger, J., Groß, S., Sauer, D., Haarig, M., Ansmann, A., and Weinzierl, B.: Particle settling and vertical mixing in the Saharan Air Layer as seen from an integrated model, lidar, and in situ perspective, Atmos. Chem. Phys., 17, 297–311, https://doi.org/10.5194/acp-17-297-2017, 2017.
Ge, J., Huang, J., Weng, F., and Sun, W.: Effects of dust storms on microwave radiation based on satellite observation and model simulation over the Taklamakan desert, Atmos. Chem. Phys., 8, 4903–4909, https://doi.org/10.5194/acp-8-4903-2008, 2008.
Ge, J. M., Liu, H., Huang, J., and Fu, Q.: Taklimakan Desert nocturnal low-level jet: climatology and dust activity, Atmos. Chem. Phys., 16, 7773–7783, https://doi.org/10.5194/acp-16-7773-2016, 2016.
Gelaro, R., McCarty, W., Suárez, M. J., Todling, R., Molod, A., Takacs, L., Randles, C. A., Darmenov, A., Bosilovich, M. G., Reichle, R., Wargan, K., Coy, L., Cullather, R., Draper, C., Akella, S., Buchard, V., Conaty, A., da Silva, A. M., Gu, W., Kim, G. K., Koster, R., Lucchesi, R., Merkova, D., Nielsen, J. E., Partyka, G., Pawson, S., Putman, W., Rienecker, M., Schubert, S. D., Sienkiewicz, M., and Zhao, B.: The modern-era retrospective analysis for research and applications, version 2 (MERRA-2), J. Climate, 30 5419–5454, https://doi.org/10.1175/JCLI-D-16-0758.1, 2017.
Gong, S. L., Zhang, X. Y., Zhao, T. L., Zhang, X. B., Barrie, L. A., Mckendry, I. G., and Zhao, C. S.: A simulated climatology of Asian dust aerosol and its trans-pacific transport. Part II: Interannual variability and climate connections, J. Climate, 19, 104–122, https://doi.org/10.1175/JCLI3606.1, 2006.
Guo, J., Lou, M., Miao, Y., Wang, Y., Zeng, Z., Liu, H., He, J., Xu, H., Wang, F., Min, M., and Zhai, P.: Trans-Pacific transport of dust aerosols from East Asia: Insights gained from multiple observations and modeling, Environ. Pollut., 230, 1030–1039, https://doi.org/10.1016/j.envpol.2017.07.062, 2017.
Ha, R., Baatar, A., and Yu, Y.: Identification of atmospheric transport and dispersion of Asian dust storms, Nat. Hazards Earth Syst. Sci., 17, 1425–1435, https://doi.org/10.5194/nhess-17-1425-2017, 2017.
Hofer, J., Althausen, D., Abdullaev, S. F., Makhmudov, A. N., Nazarov, B. I., Schettler, G., Engelmann, R., Baars, H., Fomba, K. W., Müller, K., Heinold, B., Kandler, K., and Ansmann, A.: Long-term profiling of mineral dust and pollution aerosol with multiwavelength polarization Raman lidar at the Central Asian site of Dushanbe, Tajikistan: case studies, Atmos. Chem. Phys., 17, 14559–14577, https://doi.org/10.5194/acp-17-14559-2017, 2017.
Huang, J., Minnis, P., Lin, B., Wang, T., Yi, Y., Hu, Y., Sun-Mack, S., and Ayers, K.: Possible influences of Asian dust aerosols on cloud properties and radiative forcing observed from MODIS and CERES, Geophys. Res. Lett., 33, L06824, https://doi.org/10.1029/2005GL024724, 2006a.
Huang, J., Lin, B., Minnis, P., Wang, T., Wang, X., Hu, Y., Yi, Y., and Ayers, J. K.: Satellite-based assessment of possible dust aerosols semi-direct effect on cloud water path over East Asia, Geophys. Res. Lett., 33, L19802, https://doi.org/10.1029/2006GL026561, 2006b.
Huang, J., Minnis, P., Chen, B., Huang, Z., Liu, Z., Zhao, Q., Yi, Y., and Ayers, J. K.: Long-range transport and vertical structure of Asian dust from CALIPSO and surface measurements during PACDEX, J. Geophys. Res., 113, D23212, https://doi.org/10.1029/2008JD010620, 2008.
Huang, J., Minnis, P., Yan, H., Yi, Y., Chen, B., Zhang, L., and Ayers, J. K.: Dust aerosol effect on semi-arid climate over Northwest China detected from A-Train satellite measurements, Atmos. Chem. Phys., 10, 6863–6872, https://doi.org/10.5194/acp-10-6863-2010, 2010.
Huang, J., Wang, T., Wang, W., Li, Z., and Yan, H.: Climate Effects of dust aerosols over East Asian and semiarid regions, J. Geophys. Res.-Atmos., 119, 11398–11416, https://doi.org/10.1002/2014JD021796, 2014.
Huang, K., Zhuang, G., Li, J., Wang, Q., Sun, Y., Lin, Y., and Fu, J. S.: Mixing of Asian dust with pollution aerosol and the transformation of aerosol components during the dust storm over China in spring 2007, J. Geophys. Res., 115, D00K13, https://doi.org/10.1029/2009JD013145, 2010.
Huang, Z., Huang, J., Hayasaka, T., Wang, S., Zhou, T., and Jin, H.: Short-cut transport path for Asian dust directly to the Arctic: A case study, Environ. Res. Lett., 10,114018, https://doi.org/10.1088/1748-9326/10/11/114018, 2015.
Huebert, B. J., Bates, T., Russell, P. B., Shi, B., Kim, Y. J., Kawamura, K., Carmichael, G., and Nakajima, T.: An overview of ACE-Asia: Strategies for quantifying the relationships between Asian aerosols and their climatic impacts, J. Geophys. Res., 108, 8633, https://doi.org/10.1029/2003JD003550, 2003.
Jacob, D. J., Crawford, J. H., Kleb, M. M., Connors, V. S., Bendura, R. J., Raper, J. L., Sachse, G. W., Gille, J. C., Emmons, L., and Heald, C. L.: Transport and Chemical Evolution over the Pacific (TRACE-P) aircraft mission: Design, execution, and first results, J. Geophys. Res.-Atmos., 108, 9000, https://doi.org/10.1029/2002JD003276, 2003.
Kalashnikova, O. V, Garay, M. J., Sokolik, I. N., Diner, D. J., Kahn, R. A, Martonchik, J. V, Lee, J. N., Torres, O., Yang, W., Marshak, A., Kassabian, S., and Chodas, M.: Capabilities and limitations of MISR aerosol products in dust-laden regions, Proc. SPIE 8177, Remote Sensing of Clouds and the Atmosphere XVI, 81770O, https://doi.org/10.1117/12.897773, 2011.
Kurosaki, Y. and Mikami, M.: Effect of snow cover on threshold wind velocity of dust outbreak, Geophys. Res. Lett., 31, L03106, https://doi.org/10.1029/2003GL018632, 2004.
Lau, K. M., Kim, M. K., and Kim, K. M.: Asian summer monsoon anomalies induced by aerosol direct forcing: The role of the Tibetan Plateau, Clim. Dynam., 26, 855–864, https://doi.org/10.1007/s00382-006-0114-z, 2006.
Li, B., Gasser, T., Ciais, P., Piao, S., Tao, S., Balkanski, Y., Hauglustaine, D., Boisier, J.-P., Chen, Z., Huang, M., Li, L. Z., Li, Y., Liu, H., Liu, J., Peng, S., Shen, Z., Sun, Z., Wang, R., Wang, T., Yin, G., Yin, Y., Zeng, H., Zeng, Z., and Zhou, F.: The contribution of China's emissions to global climate forcing, Nature, 531, 357–361, https://doi.org/10.1038/nature17165, 2016.
Lim, J. Y. and Chun, Y.: The characteristics of Asian dust events in Northeast Asia during the springtime from 1993 to 2004, Global Planet. Change, 52, 231–247, https://doi.org/10.1016/j.gloplacha.2006.02.010, 2006.
Liu, Q., Liu, Y., Yin, J., Zhang, M., and Zhang, T.: Chemical characteristics and source apportionment of PM10 during Asian dust storm and non-dust storm days in Beijing, Atmos. Environ., 91, 85–94, https://doi.org/10.1016/j.atmosenv.2014.03.057, 2014.
Liu, Z., Liu, D., Huang, J., Vaughan, M., Uno, I., Sugimoto, N., Kittaka, C., Trepte, C., Wang, Z., Hostetler, C., and Winker, D.: Airborne dust distributions over the Tibetan Plateau and surrounding areas derived from the first year of CALIPSO lidar observations, Atmos. Chem. Phys., 8, 5045–5060, https://doi.org/10.5194/acp-8-5045-2008, 2008.
Liu, Z., Fairlie, T. D., Uno, I., Huang, J., Wu, D., Omar, A., Kar, J., Vaughan, M., Rogers, R., Winker, D., Trepte, C., Hu, Y., Sun, W., Lin, B., and Cheng, A.: Transpacific transport and evolution of the optical properties of Asian dust, J. Quant. Spectrosc. Ra., 116, 24–33, https://doi.org/10.1016/j.jqsrt.2012.11.011, 2013.
McKendry, I. G., Macdonald, A. M., Leaitch, W. R., van Donkelaar, A., Zhang, Q., Duck, T., and Martin, R. V.: Trans-Pacific dust events observed at Whistler, British Columbia during INTEX-B, Atmos. Chem. Phys., 8, 6297–6307, https://doi.org/10.5194/acp-8-6297-2008, 2008.
Mikami, M., Shi, G. Y., Uno, I., Yabuki, S., Iwasaka, Y., Yasui, M., Aoki, T., Tanaka, T. Y., Kurosaki, Y., Masuda, K., Uchiyama, A., Matsuki, A., Sakai, T., Takemi, T., Nakawo, M., Seino, N., Ishizuka, M., Satake, S., Fujita, K., Hara, Y., Kai, K., Kanayama, S., Hayashi, M., Du, M., Kanai, Y., Yamada, Y., Zhang, X. Y., Shen, Z., Zhou, H., Abe, O., Nagai, T., Tsutsumi, Y., Chiba, M., and Suzuki, J.: Aeolian dust experiment on climate impact: An overview of Japan-China joint project ADEC, Global Planet. Change, 52, 142–172, https://doi.org/10.1016/j.gloplacha.2006.03.001, 2006.
Moroney, C., Davies, R., and Muller, J. P.: Operational retrieval of cloud-top heights using MISR data, IEEE Trans. Geosci. Remote, 40, 1532–1540, https://doi.org/10.1109/TGRS.2002.801150, 2002.
Mueller, K., Garay, M. J. Di, Girolamo, L., Jovanovic, V., and Moroney, C.: MISR Cloud Motion Vector Product Algorithm Theoretical Basis Cloud Motion Vector Product Algorithm Theoretical Basis, available at: https://eospso.gsfc.nasa.gov/sites/default/files/atbd/MISR_L3_CMV_ATBD.pdf (last access: 10 September 2018), 2012.
Mueller, K. J., Wu, D. L., Horváth, Á., Jovanovic, V. M., Muller, J. P., Girolamo, L. Di, Garay, M. J., Diner, D. J., Moroney, C. M., and Wanzong, S.: Assessment of MISR Cloud Motion Vectors (CMVs) relative to GOES and MODIS Atmospheric Motion Vectors (AMVs), J. Appl. Meteorol. Clim., 56, 555–572, https://doi.org/10.1175/JAMC-D-16-0112.1, 2017.
Nelson, D. L., Chen, Y., Kahn, R. A., Diner, D. J., and Mazzoni, D.: Example applications of the MISR INteractive eXplorer (MINX) software tool to wildfire smoke plume analyses, Remote Sensing of Fire: Science and Application, vol. 7089, International Society for Optics and Photonics, San Diego, California, USA, 2008.
Nelson, D. L., Garay, M. J., Kahn, R. A., and Dunst, B. A.: Stereoscopic height and wind retrievals for aerosol plumes with the MISR INteractive eXplorer (MINX), Remote Sens., 5, 4593–4628, https://doi.org/10.3390/rs5094593, 2013.
Notaro, M., Yu, Y., and Kalashnikova, O. V.: Regime shift in Arabian dust activity, triggered by persistent fertile crescent drought, J. Geophys. Res.-Atmos., 120, 10229–10249, https://doi.org/10.1002/2015JD023855, 2015.
Proestakis, E., Amiridis, V., Marinou, E., Georgoulias, A. K., Solomos, S., Kazadzis, S., Chimot, J., Che, H., Alexandri, G., Binietoglou, I., Daskalopoulou, V., Kourtidis, K. A., de Leeuw, G., and van der A, R. J.: Nine-year spatial and temporal evolution of desert dust aerosols over South and East Asia as revealed by CALIOP, Atmos. Chem. Phys., 18, 1337–1362, https://doi.org/10.5194/acp-18-1337-2018, 2018.
Prospero, J. M., Ginoux, P., Torres, O., Nicholson, S. E., and Gill, T. E.: Environmental Characterization Of Global Sources Of Atmospheric Soil Dust Identified With The Nimbus 7 Total Ozone Mapping Spectrometer (Toms) Absorbing Aerosol Product, Rev. Geophys., 40, 1002, https://doi.org/10.1029/2000rg000095, 2002.
Rahn, K. A., Borys, R. D., and Shaw, G. E.: The Asian source of Arctic haze bands, Nature, 268, 713–715, https://doi.org/10.1038/268713a0, 1977.
Salvador, P., Alonso-Pérez, S., Pey, J., Artíñano, B., de Bustos, J. J., Alastuey, A., and Querol, X.: African dust outbreaks over the western Mediterranean Basin: 11-year characterization of atmospheric circulation patterns and dust source areas, Atmos. Chem. Phys., 14, 6759–6775, https://doi.org/10.5194/acp-14-6759-2014, 2014.
Shaw, G. E.: Transport of Asian desert aerosol to the Hawaiian islands, J. Appl. Meteorol., 19, 1254–1259, https://doi.org/10.1175/1520-0450(1980)019<1254:TOADAT>2.0.CO;2, 1980.
Sofiev, M., Ermakova, T., and Vankevich, R.: Evaluation of the smoke-injection height from wild-land fires using remote-sensing data, Atmos. Chem. Phys., 12, 1995–2006, https://doi.org/10.5194/acp-12-1995-2012, 2012.
Sogacheva, L., Rodriguez, E., Kolmonen, P., Virtanen, T. H., Saponaro, G., de Leeuw, G., Georgoulias, A. K., Alexandri, G., Kourtidis, K., and van der A, R. J.: Spatial and seasonal variations of aerosols over China from two decades of multi-satellite observations – Part 2: AOD time series for 1995–2017 combined from ATSR ADV and MODIS C6.1 and AOD tendency estimations, Atmos. Chem. Phys., 18, 16631–16652, https://doi.org/10.5194/acp-18-16631-2018, 2018.
Stein, A. F., Draxler, R. R., Rolph, G. D., Stunder, B. J. B., Cohen, M. D., and Ngan, F.: NOAA's HYSPLIT atmospheric transport and dispersion modeling system, B. Am. Meteorol. Soc., 96, 2059–2077, https://doi.org/10.1175/BAMS-D-14-00110.1, 2015.
Stith, J. L., Ramanathan, V., Cooper, W. A., Roberts, G. C., DeMott, P. J., Carmichael, G., Hatch, C. D., Adhikary, B., Twohy, C. H., Rogers, D. C., Baumgardner, D., Prenni, A. J., Campos, T., Gao, R., Anderson, J., and Feng, Y.: An overview of aircraft observations from the Pacific Dust Experiment campaign, J. Geophys. Res., 114, D05207, https://doi.org/10.1029/2008JD010924, 2009.
Su, L. and Toon, O. B.: Saharan and Asian dust: similarities and differences determined by CALIPSO, AERONET, and a coupled climate-aerosol microphysical model, Atmos. Chem. Phys., 11, 3263–3280, https://doi.org/10.5194/acp-11-3263-2011, 2011.
Sun, J., Zhang, M., and Liu, T.: Spatial and temporal characteristics of dust storms in China and its surrounding regions, 1960–1999: Relations to source area and climate, J. Geophys. Res.-Atmos., 106, 10325–10333, https://doi.org/10.1029/2000JD900665, 2001.
Sun, Y., Chen, H., Tada, R., Weiss, D., Lin, M., Toyoda, S., Yan, Y., and Isozaki, Y.: ESR signal intensity and crystallinity of quartz from Gobi and sandy deserts in East Asia and implication for tracing Asian dust provenance, Geochem. Geophy. Geosy., 14, 2615–2627, https://doi.org/10.1002/ggge.20162, 2013.
Tan, S. C., Li, J., Che, H., Chen, B., and Wang, H.: Transport of East Asian dust storms to the marginal seas of China and the southern North Pacific in spring 2010, Atmos. Environ., 148, 316–328, https://doi.org/10.1016/j.atmosenv.2016.10.054, 2017.
Tanaka, T. Y. and Chiba, M.: A numerical study of the contributions of dust source regions to the global dust budget, Global Planet. Change, 52, 88–104, https://doi.org/10.1016/j.gloplacha.2006.02.002, 2006.
Tanaka, T. Y., Kurosaki, Y., Chiba, M., Matsumura, T., Nagai, T., Yamazaki, A., Uchiyama, A., Tsunematsu, N., and Kai, K.: Possible transcontinental dust transport from North Africa and the Middle East to East Asia, Atmos. Environ., 39, 3901–3909, https://doi.org/10.1016/j.atmosenv.2005.03.034, 2005.
Tanimoto, Y., Kanenari, T., Tokinaga, H., and Xie, S. P.: Sea level pressure minimum along the Kuroshio and its extension, J. Climate, 24, 4419–4434, https://doi.org/10.1175/2011JCLI4062.1, 2011.
Tobo, Y., Zhang, D., Matsuki, A., and Iwasaka, Y.: Asian dust particles converted into aqueous droplets under remote marine atmospheric conditions, P. Natl. Acad. Sci. USA, 107, 17905–17910, https://doi.org/10.1073/pnas.1008235107, 2010.
Tsai, F., Chen, G. T. J., Liu, T. H., Lin, W. D., and Tu, J. Y.: Characterizing the transport pathways of Asian dust, J. Geophys. Res., 113, D17311, https://doi.org/10.1029/2007JD009674, 2008.
Uno, I., Amano, H., Emori, S., Kinoshita, K., Matsui, I., and Sugimoto, N.: Trans-Pacific yellow sand transport observed in April 1998: A numerical simulation, J. Geophys. Res., 106, 18331–18344, https://doi.org/10.1029/2000JD900748, 2001.
Uno, I., Wang, Z., Chiba, M., Chun, Y. S., Gong, S. L., Hara, Y., Jung, E., Lee, S. S., Liu, M., Mikami, M., Music, S., Nickovic, S., Satake, S., Shao, Y., Song, Z., Sugimoto, N., Tanaka, T., and Westphal, D. L.: Dust model intercomparison (DMIP) study over Asia: Overview, J. Geophys. Res., 111, D12213, https://doi.org/10.1029/2005JD006575, 2006.
Uno, I., Yumimoto, K., Shimizu, A., Hara, Y., Sugimoto, N., Wang, Z., Liu, Z., and Winker, D. M.: 3D structure of Asian dust transport revealed by CALIPSO lidar and a 4DVAR dust model, Geophys. Res. Lett., 35, L06803, https://doi.org/10.1029/2007GL032329, 2008.
Uno, I., Eguchi, K., Yumimoto, K., Takemura, T., Shimizu, A., Uematsu, M., Liu, Z., Wang, Z., Hara, Y., and Sugimoto, N.: Asian dust transported one full circuit around the globe, Nat. Geosci., 2, 557–560, https://doi.org/10.1038/ngeo583, 2009.
Uno, I., Eguchi, K., Yumimoto, K., Liu, Z., Hara, Y., Sugimoto, N., Shimizu, A., and Takemura, T.: Large Asian dust layers continuously reached North America in April 2010, Atmos. Chem. Phys., 11, 7333–7341, https://doi.org/10.5194/acp-11-7333-2011, 2011.
Val Martin, M., Logan, J. A., Kahn, R. A., Leung, F.-Y., Nelson, D. L., and Diner, D. J.: Smoke injection heights from fires in North America: analysis of 5 years of satellite observations, Atmos. Chem. Phys., 10, 1491–1510, https://doi.org/10.5194/acp-10-1491-2010, 2010.
Wang, A., Lettenmaier, D. P., and Sheffield, J.: Soil moisture drought in China, 1950–2006, J. Climate, 24, 3257–3271, https://doi.org/10.1175/2011JCLI3733.1, 2011.
Wang, H., Zhang, L., Cao, X., Zhang, Z., and Liang, J.: A-Train satellite measurements of dust aerosol distributions over northern China, J. Quant. Spectrosc. Ra., 122, 170–179, https://doi.org/10.1016/j.jqsrt.2012.08.011, 2013.
Wang, J., Xu, X., Henze, D. K., Zeng, J., Ji, Q., Tsay, S.-C., and Huang, J.: Top-down estimate of dust emissions through integration of MODIS and MISR aerosol retrievals with the GEOS-Chem adjoint model, Geophys. Res. Lett., 39, L08802 https://doi.org/10.1029/2012GL051136, 2012.
Wang, Q., Zhuang, G., Huang, K., Liu, T., Lin, Y., Deng, C., Fu, Q., Fu, J. S., Chen, J., Zhang, W., and Yiming, M.: Evolution of particulate sulfate and nitrate along the Asian dust pathway: Secondary transformation and primary pollutants via long-range transport, Atmos. Res., 169, 86–95, https://doi.org/10.1016/j.atmosres.2015.09.013, 2016.
Wang, S.-H., Hsu, N. C., Tsay, S.-C., Lin, N.-H., Sayer, A. M., Huang, S.-J., and Lau, W. K. M.: Can Asian dust trigger phytoplankton blooms in the oligotrophic northern South China Sea?, Geophys. Res. Lett., 39, L05811, https://doi.org/10.1029/2011GL050415, 2012.
Wang, W., Huang, J., Minnis, P., Hu, Y., Li, J., Huang, Z., Ayers, J. K., and Wang, T.: Dusty cloud properties and radiative forcing over dust source and downwind regions derived from A-Train data during the Pacific Dust Experiment, J. Geophys. Res., 115, D00H35, https://doi.org/10.1029/2010JD014109, 2010.
Wu, Y., Han, Z., Nazmi, C., Gross, B., and Moshary, F.: A trans-Pacific Asian dust episode and its impacts to air quality in the east coast of U.S., Atmos. Environ., 106, 358–368, https://doi.org/10.1016/j.atmosenv.2015.02.013, 2015.
Xu, H., Zheng, F., and Zhang, W.: Variability in dust observed over China using a-train caliop instrument, Adv. Meteorol., 2016, 1246590, https://doi.org/10.1155/2016/1246590, 2016.
Xu, X., Wang, J., Wang, Y., Henze, D. K., Zhang, L., Grell, G. A., McKeen, S. A., and Wielicki, B. A.: Sense size-dependent dust loading and emission from space using reflected solar and infrared spectral measurements: An observation system simulation experiment, J. Geophys. Res.-Atmos., 122, 8233–8254, https://doi.org/10.1002/2017JD026677, 2017.
Yang, Y., Russell, L. M., Lou, S., Liao, H., Guo, J., Liu, Y., Singh, B., and Ghan, S. J.: Dust-wind interactions can intensify aerosol pollution over eastern China, Nat. Commun., 8, 15333, https://doi.org/10.1038/ncomms15333, 2017.
Yu, H., Remer, L. A., Chin, M., Bian, H., Kleidman, R. G., and Diehl, T.: A satellite-based assessment of transpacific transport of pollution aerosol, J. Geophys. Res., 113, D14S12, https://doi.org/10.1029/2007JD009349, 2008.
Yu, H., Remer, L. A., Chin, M., Bian, H., Tan, Q., Yuan, T., and Zhang, Y.: Aerosols from overseas rival domestic emissions over North America, Science, 337, 566–569, https://doi.org/10.1126/science.1217576, 2012.
Yu, Y., Notaro, M., Wang, F., Mao, J., Shi, X., and Wei, Y.: Observed positive vegetation-rainfall feedbacks in the Sahel dominated by a moisture recycling mechanism, Nat. Commun., 8, 1873, https://doi.org/10.1038/s41467-017-02021-1, 2017a.
Yu, Y., Notaro, M., Wang, F., Mao, J., Shi, X., and Wei, Y.: Validation of a statistical methodology for extracting vegetation feedbacks: focus on North African ecosystems in the Community Earth System Model, J. Climate, 31, 1565–1586, https://doi.org/10.1175/JCLI-D-17-0220.1, 2017b.
Yu, Y., Kalashnikova, O., Garay, M. J., and Lee, H.: Identification and characterization of dust source regions across North Africa and the Middle East using MISR satellite observations, Geophys. Res. Lett., 45, 6690–6701, https://doi.org/10.1029/2018GL078324, 2018.
Yuan, W. and Zhang, J.: High correlations between Asian dust events and biological productivity in the western North Pacific, Geophys. Res. Lett., 33, 8–11, https://doi.org/10.1029/2005GL025174, 2006.
Yumimoto, K., Eguchi, K., Uno, I., Takemura, T., Liu, Z., Shimizu, A., and Sugimoto, N.: An elevated large-scale dust veil from the Taklimakan Desert: Intercontinental transport and three-dimensional structure as captured by CALIPSO and regional and global models, Atmos. Chem. Phys., 9, 8545–8558, https://doi.org/10.5194/acp-9-8545-2009, 2009.
Yumimoto, K., Eguchi, K., Uno, I., Takemura, T., Liu, Z., Shimizu, A., Sugimoto, N., and Strawbridge, K.: Summertime trans-Pacific transport of Asian dust, Geophys. Res. Lett., 37, L18815, https://doi.org/10.1029/2010GL043995, 2010.
Zhang, X. Y., Arimoto, R., and An, Z. S.: Dust emission from Chinese desert sources linked to variations in atmospheric circulation, J. Geophys. Res.-Atmos., 102, 28041–28047, https://doi.org/10.1029/97JD02300, 1997.
Zhang, X. Y., Gong, S. L., Zhao, T. L., Arimoto, R., Wang, Y. Q., and Zhou, Z. J.: Sources of Asian dust and role of climate change versus desertification in Asian dust emission, Geophys. Res. Lett., 30, 2272, https://doi.org/10.1029/2003GL018206, 2003.
Zhao, T. L., Gong, S. L., Zhang, X. Y., and Jaffe, D. A.: Asian dust storm influence on North American ambient PM levels: observational evidence and controlling factors, Atmos. Chem. Phys., 8, 2717–2728, https://doi.org/10.5194/acp-8-2717-2008, 2008.