the Creative Commons Attribution 4.0 License.
the Creative Commons Attribution 4.0 License.
 | 10 Jan 2019
ROOOH: a missing piece of the puzzle for OH measurements in low-NO environments?
Christa Fittschen
Mohamad Al Ajami
Sebastien Batut
Valerio Ferracci
Scott Archer-Nicholls
Alexander T. Archibald
Coralie Schoemaecker
Field campaigns have been carried out with the FAGE (fluorescence assay by gas expansion) technique in remote biogenic environments in the last decade to quantify the in situ concentrations of OH, the main oxidant in the atmosphere. These data have revealed concentrations of OH radicals up to a factor of 10 higher than predicted by models, whereby the disagreement increases with decreasing NO concentration. This was interpreted as a major lack in our understanding of the chemistry of biogenic VOCs (volatile organic compounds), particularly isoprene, which are dominant in remote pristine conditions. But interferences in these measurements of unknown origin have also been discovered for some FAGE instruments: using a pre-injector, all ambient OH is removed by fast reaction before entering the FAGE cell, and any remaining OH signal can be attributed to an interference. This technique is now systematically used for FAGE measurements, allowing the reliable quantification of ambient OH concentrations along with the signal due to interference OH. However, the disagreement between modelled and measured high OH concentrations of earlier field campaigns as well as the origin of the now-quantifiable background OH is still not understood. We present in this paper the compelling idea that this interference, and thus the disagreement between model and measurement in earlier field campaigns, might be at least partially due to the unexpected decomposition of a new class of molecule, ROOOH, within the FAGE instruments. This idea is based on experiments, obtained with the FAGE set-up of the University of Lille, and supported by a modelling study. Even though the occurrence of this interference will be highly dependent on the design and measurement conditions of different FAGE instruments, including ROOOH in atmospheric chemistry models might reflect a missing piece of the puzzle in our understanding of OH in clean atmospheres.
- Article
(2731 KB) -
Supplement
(904 KB) - BibTeX
- EndNote


OH radicals are the most important oxidant in the atmosphere, and the detailed understanding of their formation and reactivity is key for the understanding of the overall chemistry. Upon reaction with volatile organic compounds (VOCs, such as methane and isoprene), OH oxidation leads to the production of organic peroxy radicals (RO2), which play a crucial role in the chemistry of tropospheric ozone and secondary organic aerosol (Monks et al., 2015). The concentration of OH radicals has been measured for several decades now (Holland et al., 2003; Creasey et al., 1997; Brune et al., 1995), and comparison of OH concentration profiles with model outputs is taken as a good indicator of the degree of our understanding of the chemistry. Good agreement is often obtained between measurements and models for polluted environments (where levels of nitrogen oxides () are in excess of 500 pmol mol−1, or ppt); however, remote and clean environments show much less good agreement (Stone et al., 2012). Several field campaigns in remote environments, dominated by natural biogenic emissions, have been carried out during the last decade (Whalley et al., 2011; Lelieveld et al., 2008; Hofzumahaus et al., 2009), and very poor agreement has been found, with measured OH concentrations exceeding model predictions by up to a factor of 10. These findings have been interpreted as reflecting a lack in our understanding of the oxidation mechanism of biogenic VOCs under low NOx conditions and have triggered a large number of studies aimed at improving the atmospheric oxidation mechanism of biogenic VOCs (Peeters et al., 2009; Crounse et al., 2011; Paulot et al., 2009; Archibald et al., 2010). Improvements have been made especially in the oxidation mechanism of isoprene (Wennberg et al., 2018), and new reaction pathways leading to OH recycling have been found. However, none of these new chemical pathways has led to a sufficiently significant increase in modelled OH concentration to bring models into reasonable agreement with measurements (Rohrer et al., 2014).
An alternative explanation for the unexpectedly high OH concentrations measured in biogenic, low-NO environments is that the measurements suffer from an unidentified interference. Indeed, all of these measurements have been carried out using a technique named FAGE (fluorescence assay by gas expansion). Briefly, ambient air is rapidly expanded into a low-pressure volume, where OH radicals are excited by 308 nm light and the resulting fluorescence is detected (Heard and Pilling, 2003). Calibration of the fluorescence signal allows the determination of absolute concentrations (Dusanter et al., 2008). Interferences can arise from different sources such as photolysis of suitable precursors by the fluorescence excitation laser (e.g. O3), the presence of fluorescing species other than OH or the decomposition of labile species during the gas expansion into the FAGE cell (Ren et al., 2004). The first source of interference can, in principle, be identified by varying the excitation laser energy: ambient OH radicals only need one photon to fluoresce, whilst other species need two (one for generating OH radicals by photolysis, another for their excitation). Therefore, the fluorescence intensity would not vary linearly with the excitation energy. Even though in practice this method is highly uncertain, given the generally low OH concentrations (and the resulting low S∕N ratio) and the high temporal variability of OH radical concentration, the high OH concentrations observed in the different field campaigns seem to arise from ambient OH and not from the photolysis of other species. This was also confirmed by Novelli et al. (2014a), who observed a strong background during HUMPPA2010 (Hyytiälä United Measurements of Photochemistry and Particles in Air) with a good S∕N ratio, allowing us to unequivocally exclude photolysis as the origin of the background signal. The second source of interference can be identified by regularly measuring the fluorescence signal with the excitation laser wavelengths slightly tuned off the OH line. This procedure is always adopted during measurements as it enables us to account for stray light reaching the detector from the excitation laser or from the sun.
The third source of interference, the generation of OH radicals during the expansion into the FAGE cell, is more difficult to identify because only one photon is needed and hence the interfering species would appear as ambient OH. Following the large disagreements between measurements and models, the group of W. Brune at Penn State University (State College) redesigned a concept to quantify such possible interferences (Mao et al., 2012), which had first been tested by Dubey et al. (1996): a pre-injector device is installed just above the inlet into the FAGE cell, which injects regularly into the airflow a high concentration of a species rapidly reacting with OH radicals. This way all ambient OH radicals are scavenged before entering the FAGE cell, and any remaining signal can be identified as interference. The difference between the signal with and without the scavenger allows the quantification of the real ambient OH. The use of this technique was reported for the first time in 2012, showing results for a field campaign in a forest in California (Mao et al., 2012). It led to the identification of a large fluorescence signal following scavenging of all ambient OH radicals, corresponding to up to 50 % of the total OH concentration. The OH concentrations obtained with the scavenger agreed well with models, while the OH concentrations obtained without the scavenger exceeded modelled concentrations by up to a factor of 3. Other groups also developed a pre-injector system in the following years (Griffith et al., 2016; Novelli et al., 2014a; Tan et al., 2017). Using this system, Novelli et al. (2014a) observed strong interferences in their FAGE system during three field campaigns in remote biogenic environments in Germany, Finland and Spain, while Griffith et al. (2016) were able to account for the observations through known interferences by O3 photolysis. Tan et al. (2017) have very recently observed a small unexplained OH concentration using a prototype pre-injector device during a field campaign in rural China. However, technical difficulties with the prototype made final conclusions about the origin of this unexplained OH signal uncertain.
Novelli et al. (2014a) proposed that ozonolysis of alkenes, leading to the formation of Criegee intermediates and the subsequent decomposition of these Criegee intermediates within the FAGE cell, was responsible for the interference (Novelli et al., 2017). However, using different FAGE systems, Rickly and Stevens (2018) and Fuchs et al. (2016) could not confirm this source: even though they detected internally formed OH when mixing high concentrations of O3 and alkenes in the laboratory, when they extrapolated their results to ambient conditions, they found that the possible interference generated this way would be well below the detection limit of their FAGE. Chamber studies were carried out at the SAPHIR chamber in Jülich (Fuchs et al., 2012), simulating remote forest conditions (i.e. high biogenic VOC and low-NO concentrations). OH concentrations were measured simultaneously by FAGE and by absolute DOAS (differential optical absorption spectroscopy) absorption. No sizeable interference was detected in these experiments, even though the same group had previously observed unexpectedly high OH concentrations in the Pearl River delta in China (Hofzumahaus et al., 2009; Rohrer et al., 2014), exceeding modelled concentrations by up to a factor of 8.
Following several years of interference studies in various environments, recent work from W. Brune's group (Feiner et al., 2016) concluded that the interference observed in their FAGE system
- a.
was due to a rather long-lived species because the interference persists into the evening;
- b.
had been observed in different environments dominated by MBO (2-methyl-3-buten-2-ol), terpenes or isoprene; hence, it must originate from a class of species rather than from only one species such as isoprene;
- c.
strongly increased with increasing O(1D); hence, it must somehow be linked to photochemistry and the species responsible for this interference was linked to a low NOx oxidation pathway because the extent of the interference steeply decreased with increasing NO concentration.
In this work we present experimental and modelling evidence that this sought-after species could be the product of the reaction between RO2 radicals and OH radicals. In recent works it has been shown that this reaction is fast (Assaf et al., 2016, 2017b; Yan et al., 2016) and could be competitive with other sinks for RO2 radicals (Fittschen et al., 2014; Archibald et al., 2009); i.e. it becomes increasingly important with decreasing NO concentration. Ab initio calculations (Müller et al., 2016; Liu et al., 2017; Assaf et al., 2018a) have shown that the initial reaction product is a trioxide, ROOOH, obtained from the recombination of RO2 and OH. The formation of this adduct is exothermic by around 120 kJ mol−1 compared to the initial reaction partners and by around 110 kJ mol−1 compared to the major decomposition products, RO + HO2, largely independent of the size of the alkyl moiety of the RO2. While for the smallest RO2 radical, CH3O2, stabilisation of CH3OOOH is not the major fate of the initial adduct (Assaf et al., 2017a; Müller et al., 2016; Caravan et al., 2018), and the major products are CH3O + HO2; the HO2 yield has been found to decrease with increasing size of the alkyl group, and it is expected that for C4 peroxy radicals the stabilisation of the initially formed ROOOH is the major product (Assaf et al., 2018b). For RO2 radicals obtained from an initial attack of OH radicals on biogenic VOCs, it can thus be expected that the major reaction products of the reaction between these RO2 radicals with OH radicals will also be the corresponding trioxides. Depending on the removal rate of ROOOH (which is not known to date), sizeable concentrations of this new class of species can possibly accumulate and thus be present in low-NO environments.
In the first part, the experimental evidence for the interference generated in the UL-FAGE (FAGE instrument of the University of Lille) by the presence of ROOOH molecules will be presented. It should be noted that the intensity of interferences or even the presence at all can depend on the design of the FAGE instrument (inlet design, pressure drop, residence time, etc.), and the results presented here are only valid for the FAGE instrument of the University of Lille. Other FAGE instruments need to be tested individually for the possible presence of an interference in OH measurement due to the presence of ROOOH. In the second part, model calculations are used in order to estimate the steady-state concentration of ROOOH molecules that can possibly build up in different environments.
2.1 Experiments
With the goal of forming sizeable amounts of trioxide (ROOOH), experiments have been carried out in a pump-probe UL-FAGE, described already in detail in earlier publications (Fuchs et al., 2017; Hansen et al., 2015; Parker et al., 2011). Briefly, a gas mixture containing the VOC (isoprene, C4H10 or CH4) and O3∕H2O is photolysed at 266 nm at a repetition rate of 2 Hz. The photolysed mixture is expanded into the FAGE cell, and the OH concentration is monitored by time-resolved laser-induced fluorescence (LIF). The excitation laser operates at 5 kHz; hence, the OH profiles are obtained with a time resolution of 200 µs. The residence time of the gas mixture in the photolysis cell is around 20 s; therefore, the mixture is photolysed around 40 times before it reaches the FAGE inlet. A schematic view of the experimental set-up is shown in Fig. 1; more details can be found in the Supplement.

Experiments start with a fresh mixture (i.e. with the photolysis laser manually covered), and 40 decays are then recorded every 0.5 s for 20 s. After 40 photolysis pulses the laser is covered again for 2 min to allow the mixture to completely refresh and, in order to improve the S∕N ratio, a new series of measurements is started. After 20 series, the signals are averaged so that one OH decay profile is obtained for each sequential photolysis pulse. An example is shown in Fig. 2 where, for clarity, only 1 in every 10 decay profiles is plotted. The open black symbols in Fig. 2 show the pre-photolysis signal, i.e. the signal registered just before uncovering the photolysis laser. This signal is not zero because some stray light from the excitation laser is always detected. Also, some ambient laboratory light can reach the detector through the photolysis window and the nozzle opening.
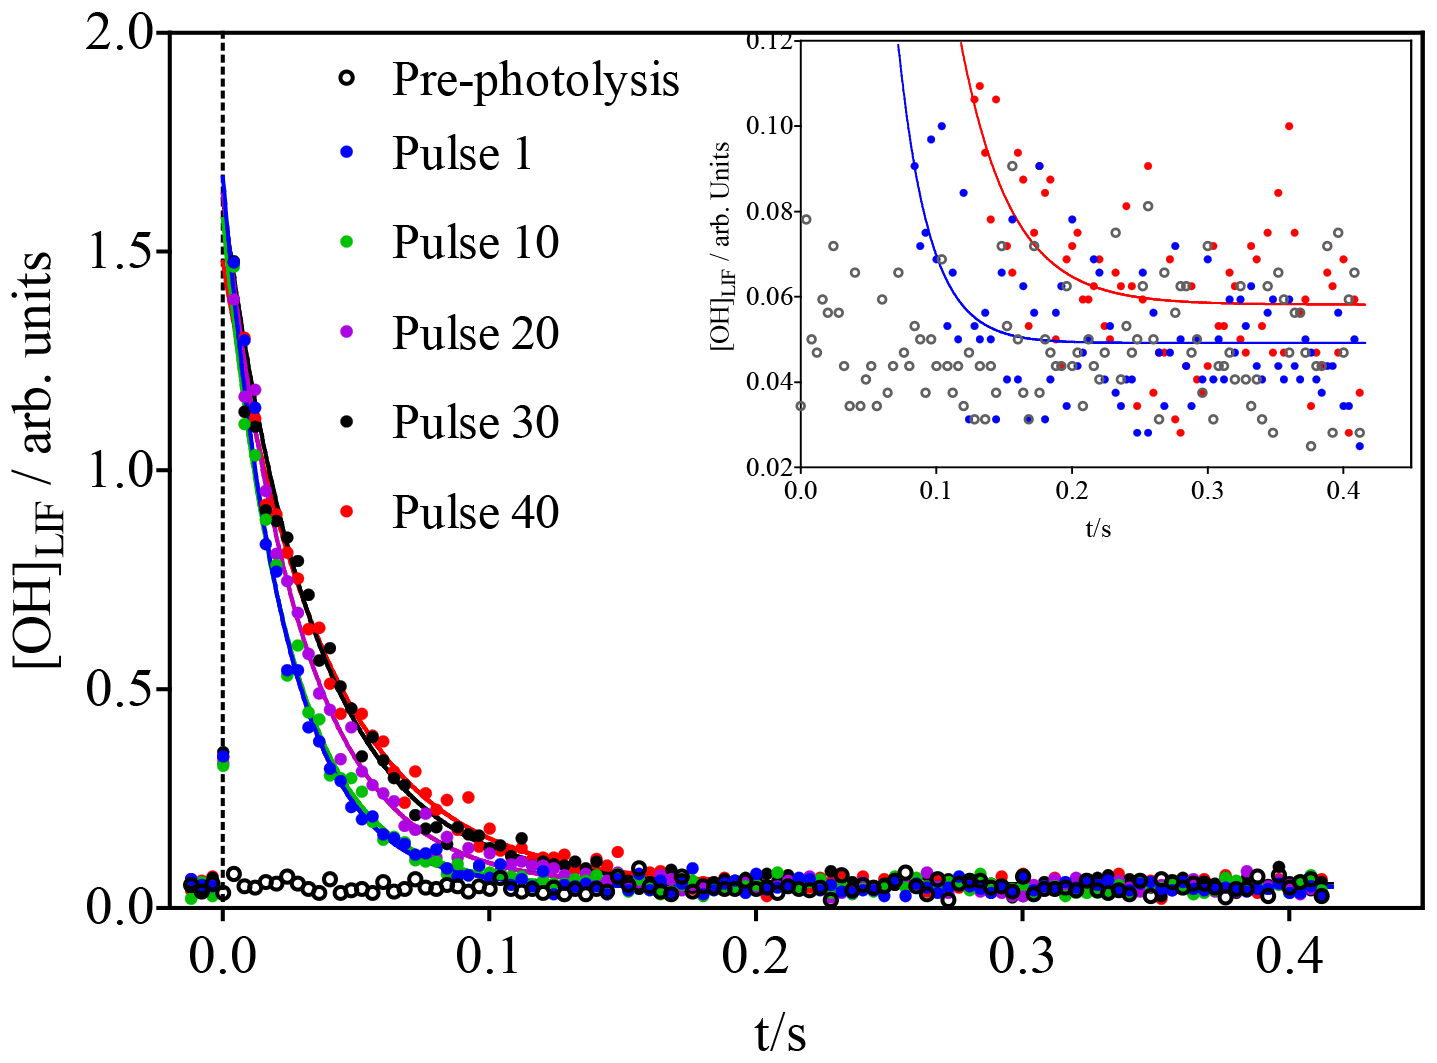
Figure 2OH concentration time profiles following the photolysis of 600 ppb O3 (leading to initial OH concentrations of around 1.4 × 1010 cm−3) in the presence of 3 × 1011 cm−3 isoprene. For clarity, only every 10th photolysis shot is shown. Open black symbols show the FAGE signal before the first photolysis shot. Time resolution was decreased from 200 µs to 4 ms by averaging 20 data points for clarity only: full lines show a fit to a single exponential decay, carried out using non-averaged data between 0.02 s and the end of the data set. The inset shows a vertical zoom; for clarity only the pre-photolysis signal as well as the signals for the first and last pulse with the corresponding fits are shown.
The initial isoprene concentration (3 × 1011 cm−3 in Fig. 2) was chosen to be low enough to make the reaction of RO2 with OH compete efficiently with that of isoprene with OH after several photolysis pulses: with initial OH concentrations of 1.4 × 1010 cm−3 (obtained from calibration in separate experiments; see Supplementary data), the isoprene concentration decreases with each photolysis shot, while the RO2 radical concentration increases. It can thus be expected that the concentration of ROOOH increases with every photolysis pulse. With the goal of getting a good idea of the ongoing chemistry in the photolysis cell and to get a rough estimate of the concentration of ROOOH being produced during this experiment, a very simple model was run using the conditions shown in Fig. 2.
Table 1Model used to estimate the accumulation of ROOOH in the photolysis cell before entering the FAGE cell; all rate constants have been taken from the most recent IUPAC evaluations (Atkinson et al., 2004, 2006).
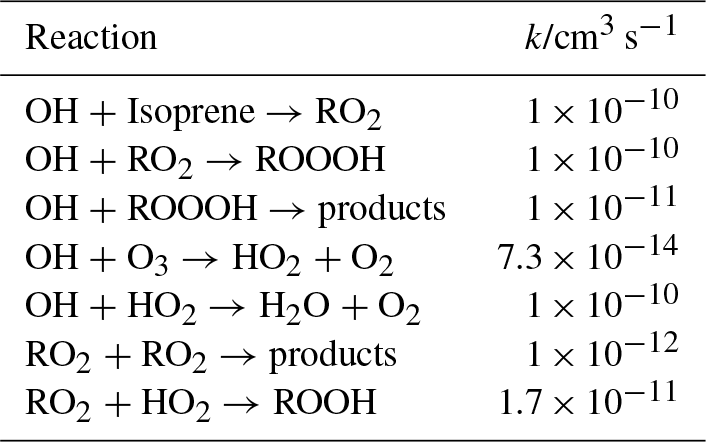
A yield of 1 is estimated for the formation of ROOOH in the reaction of RO2 with OH. The other major reaction path for the RO2 radicals under these conditions is the self reaction. The reaction of ROOOH with OH radicals has been estimated (in comparison with ROOH) to be 1 × 10⁻¹¹ cm3 s−1, but only a small fraction of ROOOH will have reacted with OH after 40 photolysis pulses.
This model was run 40 times for 0.5 s, with the final concentrations of the different species obtained at each run being used as initial concentrations in the following run, always adding 1.4 × 1010 cm−3 OH radicals to the mixture. The evolution of the different species with each photolysis shot is shown in Fig. 3.
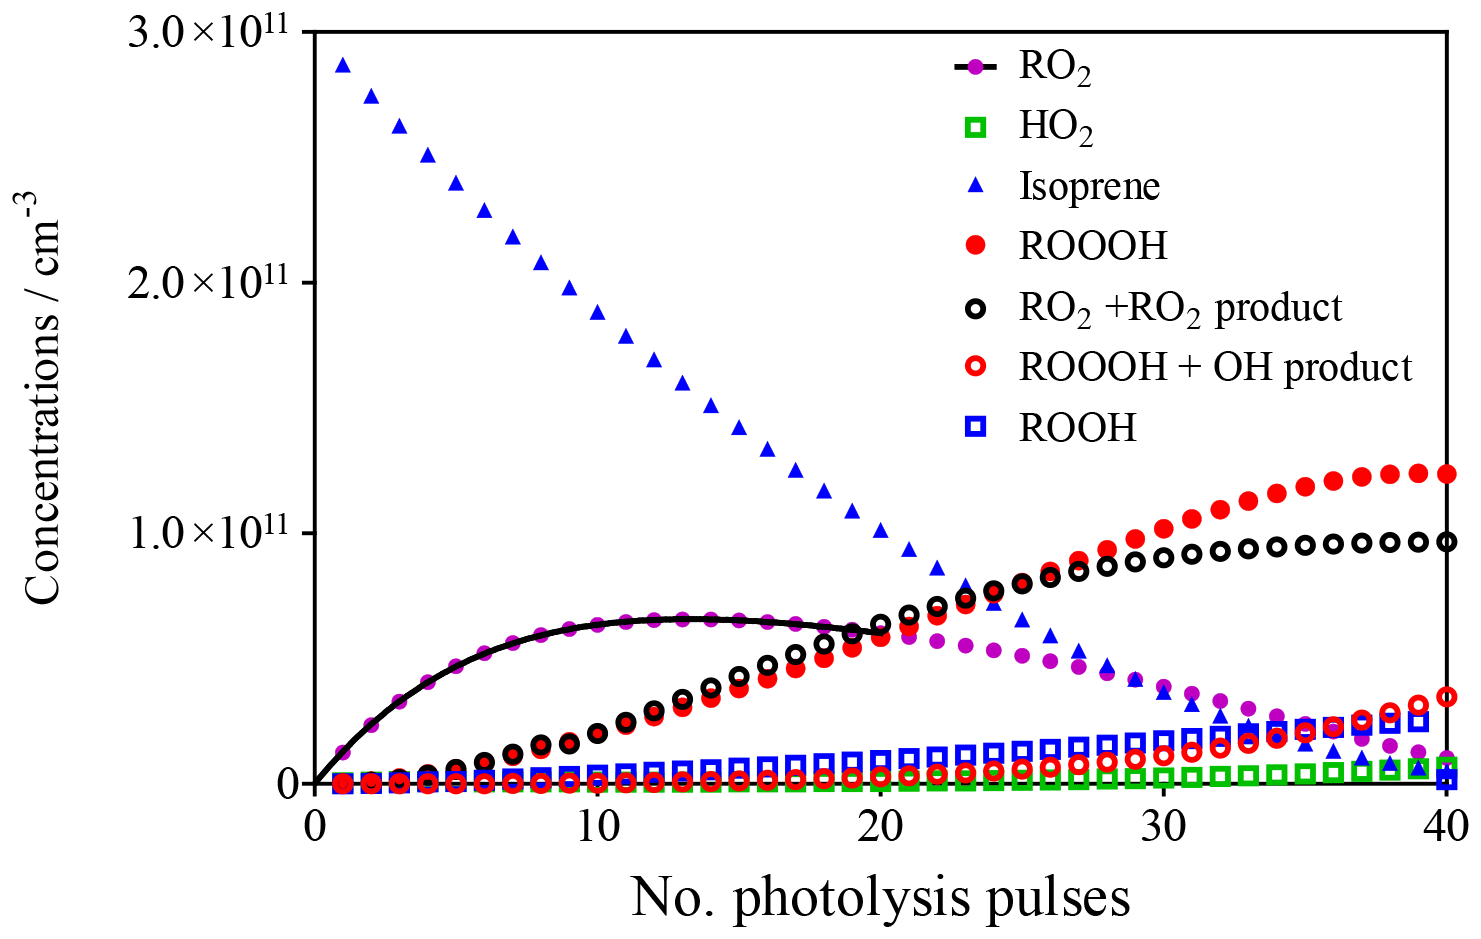
Figure 3Evolution of different species in the photolysis cell as a function of the number of photolysis pulses. Full black line describes evolution of RO2 by exponential rise (see section on CH4 experiments).
The goal of this model is not to precisely describe the ongoing chemistry but rather to get a good idea of how much ROOOH is possibly accumulated. The model uses different simplifications:
- i.
OH radicals only react with species present in the model, i.e. no wall loss or reaction with impurities is taken into account;
- ii.
the possible photolysis of ROOOH at 266 nm or a heterogeneous loss on the reactor walls is not taken into account;
- iii.
no reaction of OH with the products of RO2 self reaction are considered;
- iv.
the photolysis beam has been considered homogeneous; the inhomogeneity of the beam profile of our photolysis laser has not been considered;
- v.
the decrease in available RO2 concentration due to diffusion of the photolysed volume with fresh gas mixture from outside the photolysis beam is not considered.
All these simplifications lead to an uncertainty in the final ROOOH concentration, possibly of up to a factor of 10. Most of the simplifications will lead to an overestimation of the final ROOOH concentration (either ROOOH is consumed or less is formed), except for the inhomogeneous photolysis beam where the direction of uncertainty is not easy to determine (higher formation of ROOOH in the hotspots of the laser beam and lower formation in the rest of the volume). The model predicts the formation of around [ROOOH] ≈1 × 1011 cm−3.
The model predicts the consumption of most isoprene over the 40 photolysis pulses, which should lead to a decrease in the decay rate, given the much faster rate constant of OH with isoprene compared to the reaction products. A single-exponential decay was then fitted to the experimental OH profiles from Fig. 2, and the resulting pseudo-first order decay rates are shown as blue dots in Fig. 4. It can be seen that the decay rate decreases over the 40 shots by around 20 s−1, corresponding to a decrease in isoprene concentration of around 2 × 1011 cm−3, in good agreement with predictions of the kinetic model. The OH LIF signal at long reaction times, obtained as the plateau of the single-exponential fit (red dots in Fig. 4), increases with an increasing number of photolysis pulses (m = (1.2 ± 0.3) × 10−4 arb. units/photolysis pulse). This can be interpreted as interference due to decomposition of the increased concentration of ROOOH within the FAGE; however, more tests will be presented further down to strengthen this hypothesis.
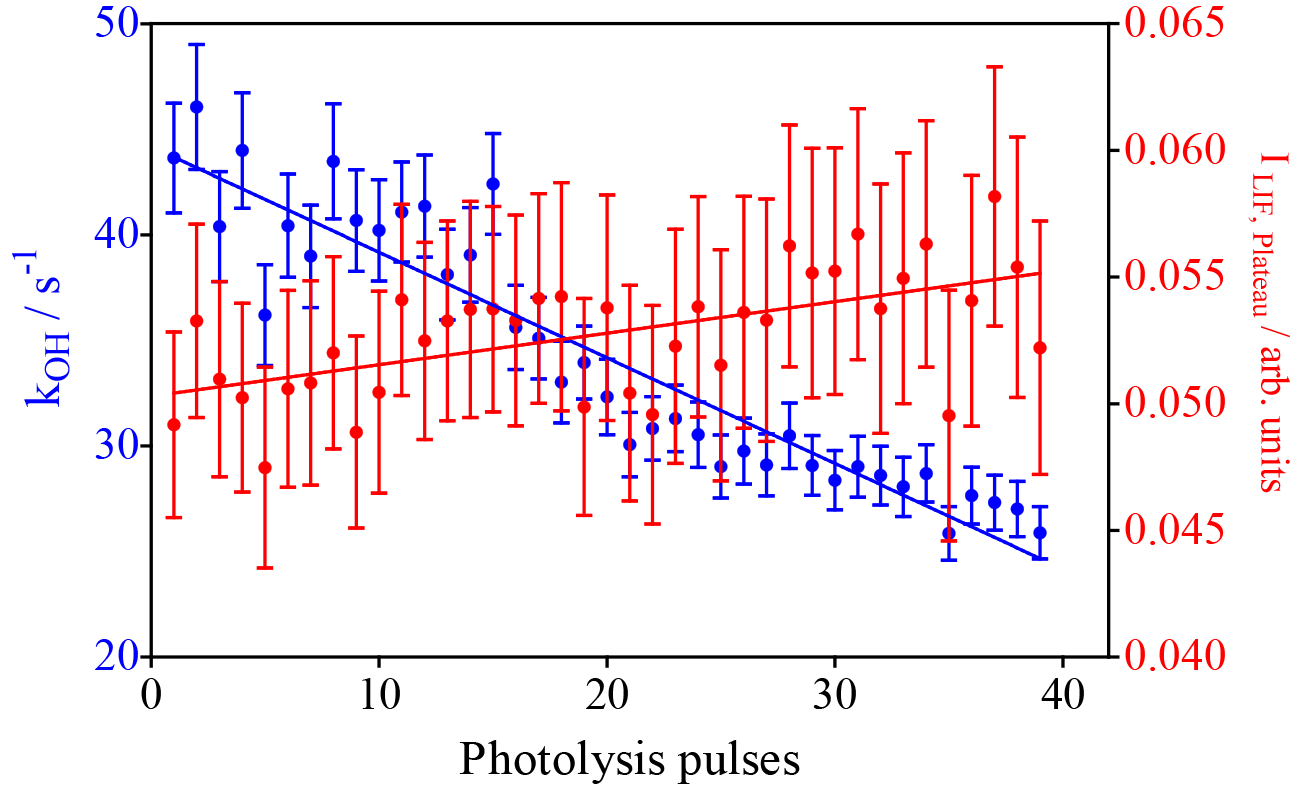
Figure 4Results of fitting a mono-exponential decay to the raw signal of the experiments shown in Fig. 1. Blue dots: OH decay rates from the mono-exponential fit between 0.02 s and the end of the data set (left y axis). Red dots: fluorescence signal after reaction of all OH radicals obtained as plateau of the single-exponential fit (right y axis). Error bars show 95 % confidence interval such as that obtained from the fit.
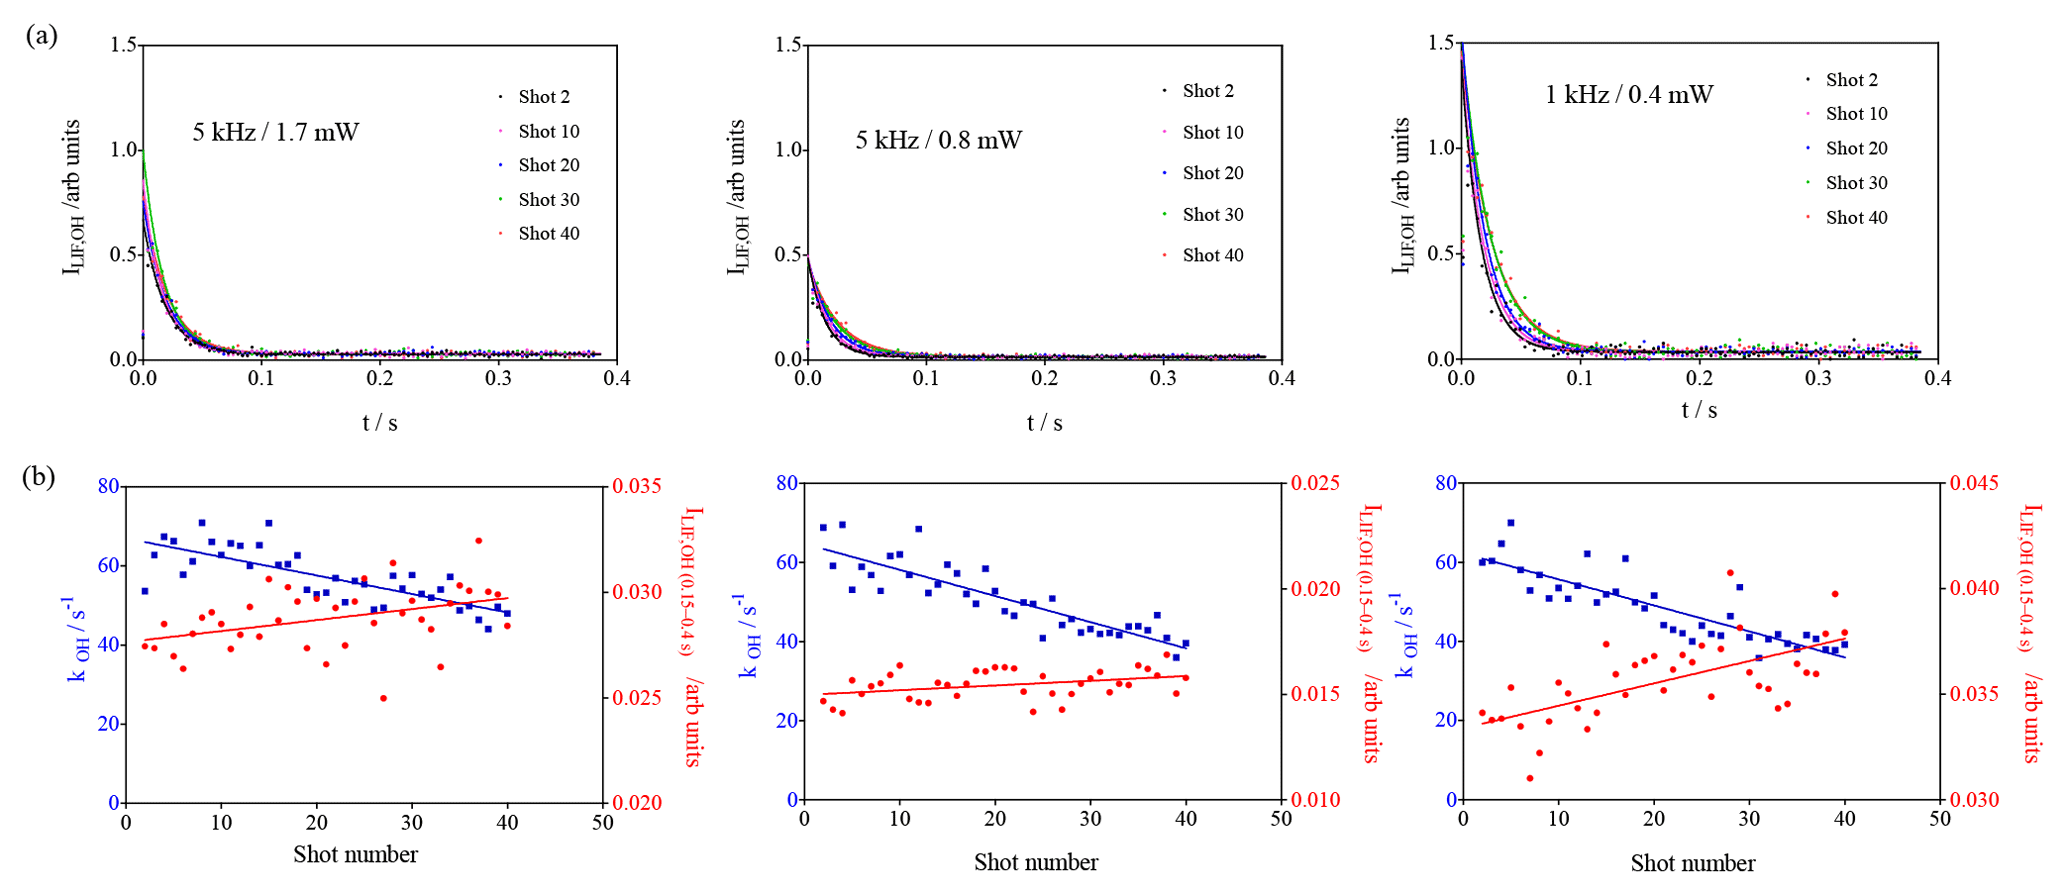
Figure 5Photolysis of O3 in the presence of isoprene using different excitation laser energies and repetition rates. (a) OH decays (for clarity, only every 10th decay is shown); (b) OH decay rate as a function of photolysis pulses (blue dots, left y axis) and fluorescence intensity averaged over 0.15 to 0.4 s (red dots, right y axis).
In order to better understand the origin of the increase in the LIF signal, additional experiments have been carried out.
2.1.1 Is the increase due to a one- or two-photon process?
Photolytically generated interferences need two photons for generating one fluorescence photon and can thus be identified by either varying the fluorescence excitation laser energy (the signal intensity would increase with the square of the excitation laser energy) or by changing the repetition rate of the excitation laser (photolytically generated interferences appear because the air mass within the excitation volume is not completely renewed between two excitation laser pulses (200 µs at 5 kHz), and thus OH radicals generated with one pulse can be excited with the following pulse; hence, such interference would be expected to decrease with decreasing repetition rate). Separate test experiments with CH3COCH3 as a known source of photolytically generated OH radicals are described in the Supplement. Three experiments with isoprene (3.2 × 1011 cm−3) have been carried out, keeping all other parameters constant (266 nm photolysis energy and repetition rate, O3 concentration): two experiments at 5 kHz with different excitation laser energies (1.7 and 0.8 mW) and one series with a lower excitation laser repetition rate (1 kHz, 0.4 mW). The results are shown in Fig. 5.
The blue dots on the lower graphs show the decrease in the decay rate with an increasing number of photolysis pulses, of the same order of magnitude for all three experiments, as expected (photolysis energies as well as isoprene and O3 concentration were identical for all three experiments). The absolute values for the background signals are different for the three experiments, they are highest for the highest pulse energy (0.4 mW at 1 kHz) and lowest at the lowest pulse energy (0.8 mW at 5 kHz), reflecting that the laser stray light is partially at the origin of the “background background”. The background increases with an increasing number of photolysis pulses for all three series, but the slope is different. However, the slope is directly proportional to the sensitivity of the LIF detection system, and for comparison needs to be normalised to the initial OH intensity. The results are summarised in Table 2.
Table 2Summary of results from Fig. 5.
a OH0 LIF intensity obtained as the average of the LIF intensity at t=0 for all 40 photolysis pulses, obtained by fitting to a single exponential decay between 0.015 and 0.4 s, in arbitrary units. b Slope obtained by linear regression of red dots in Fig. 5 in arbitrary units.
From the observation that the increase in residual LIF signal with an increasing number of photolysis pulses is independent of both (a) the fluorescence excitation laser energy and (b) the repetition rate of the excitation laser, we conclude that the observed interference in the UL-FAGE is not due to a photolytic process.
2.1.2 Is the interference really due to the product of RO2 + OH?
Additional experiments have been carried out using identical OH concentrations but much higher isoprene concentrations than in the above experiments. Under these conditions, there is still formation of high concentrations of RO2, but as the isoprene concentration stays high even after 40 photolysis pulses, the RO2 concentration never gets high enough to compete with the reaction of isoprene with OH. Therefore, one can expect comparable formation of all products from RO2 self or cross reaction or reaction with HO2 but only very little or no products from the reaction of RO2 with OH.
The results of these experiments are shown in Fig. 6. For the conditions in the left graphs , the OH decay rate decreases (() s−1 pulse s−1 after 40 pulses) in the same way as for the experiments above, and this is explained by the replacement of the reactive isoprene by less reactive products. For the conditions in the right graphs, the C5H8 concentration was so high () that it leads to decay rates that are not measurable anymore with our time resolution. For both conditions, however, the LIF intensity at long times does not increase within the experimental uncertainty with the number of laser pulses ( and for the left and right graphs, respectively).
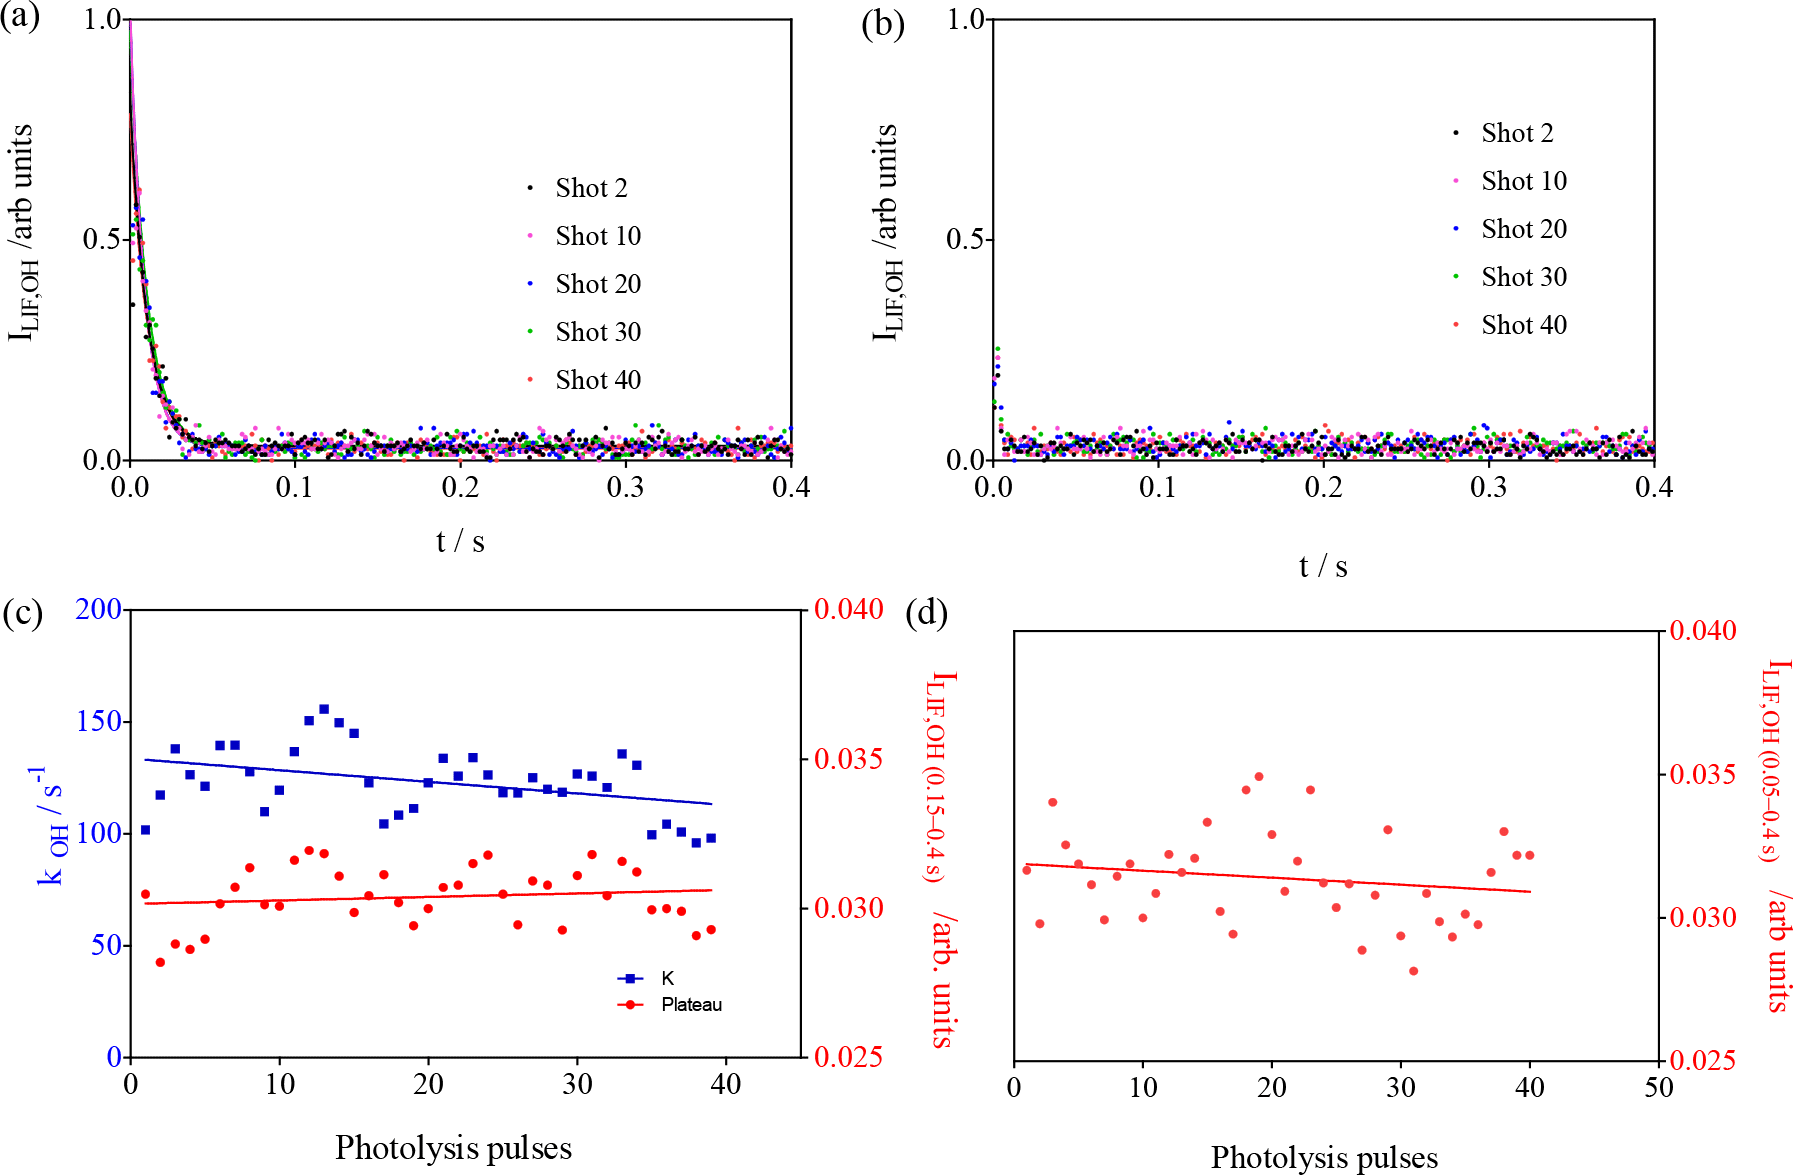
Figure 6Experiments with high isoprene concentrations: [C5H8] = 1.23 × 10¹² and 1.23 × 10¹³ molecule cm−3 for left and right graph, respectively. (a, b) LIF signals as a function of the number of photolysis pulses (for clarity, only every 10th pulse is shown); (c, d) show the rate constant in blue (decay was too fast to be measurable under the conditions of b) and the LIF intensity at long times in red (plateau from fitting for c; average of all data points between 0.01 and 0.4 s for d).
From these observations, it can be concluded that the increase in LIF intensity at long reaction times observed in the experiments presented in Fig. 4 is consistent with being generated by the product of the reaction between RO2 radicals and OH radicals.
2.1.3 Tests with n-C4H10
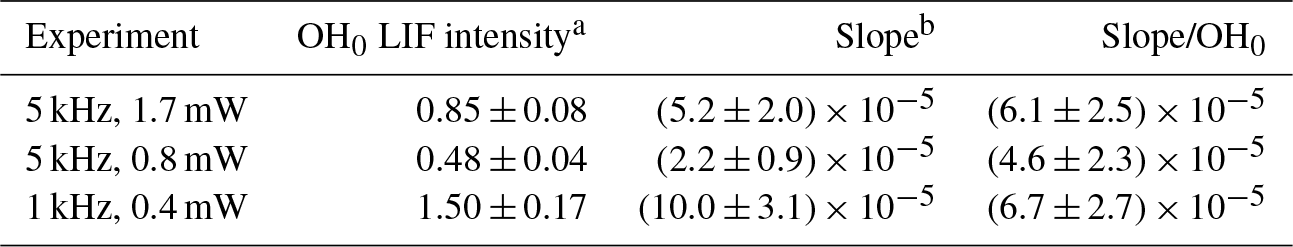
To further support the hypothesis that the observed increase in residual LIF signal is due to an interference generated by the product of the reaction of RO2 + OH, additional experiments have been carried out with C4H10 instead of isoprene. C4H10 has been chosen because Assaf et al. (2018b) have shown experimentally that the HO2 yield for the reaction of the corresponding RO2 radical with OH is very low, and both ab initio and RRKM (Rice–Ramsperger–Kassel–Marcus) calculations support the hypothesis that the major reaction product with increasing alkyl size of the RO2 radical becomes the corresponding trioxide. For the reaction of the corresponding isoprene peroxy radical with OH such direct evidence is currently not available, and it could be imagined that the OH radicals would rather add to the remaining double bond rather than to the peroxy site. Note, however, that the major conclusion from the above experiments (the product of the reaction between the isoprene-peroxy radical with OH generates an interference in the UL-FAGE) would still be the same. Three experiments with different butane concentrations have been carried out, and the results are shown in Fig. 7.
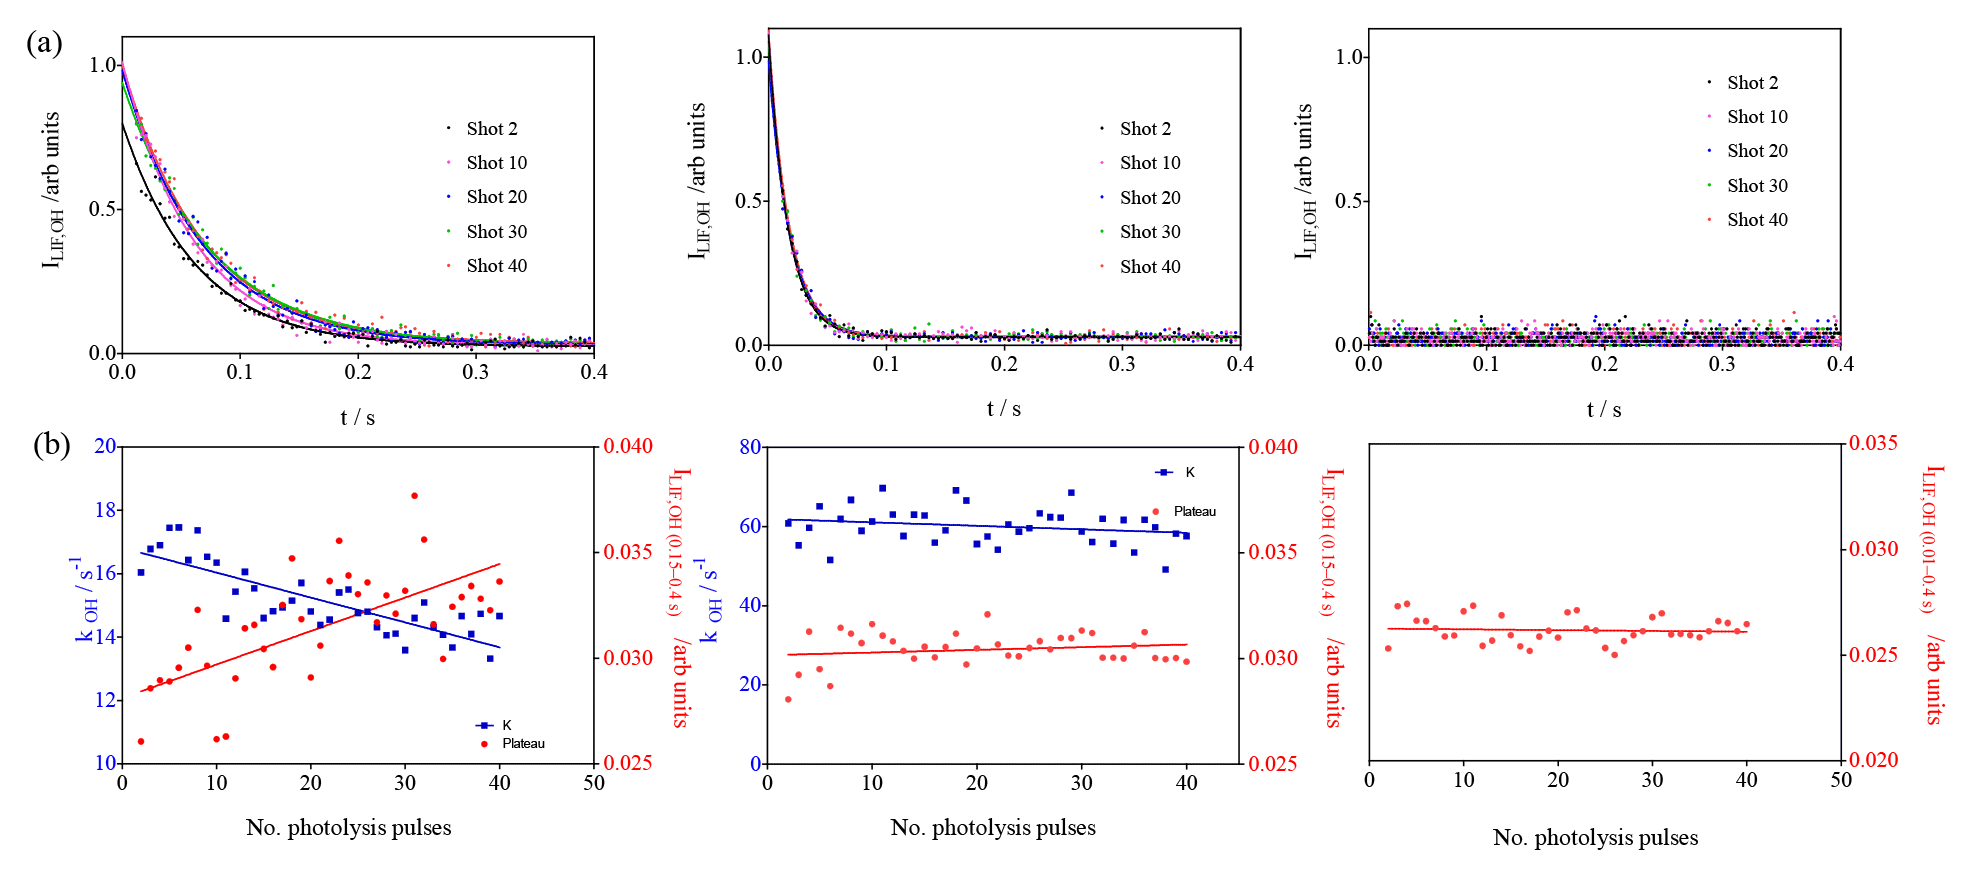
Figure 7Photolysis of O3 in the presence of different concentrations of n-butane (7 × 10¹², 2 × 10¹³ and 7.5 × 1015 cm−3 from left to right). (a) OH decays (for clarity only every 10th decay is shown); (b) decay rates of OH radicals as a function of photolysis pulses (blue dots, left y axis), residual LIF intensity taken from mono-exponential fit for left graphs and as the average LIF intensity between 0.15 and 0.4 s and 0.01 and 0.4 s for the centre and right graphs, respectively.
For the lowest concentration (left graphs in Fig. 7), a high formation of ROOOH can be expected: under these conditions OH radicals react slowly with butane, and the reaction with the nascent RO2 radicals becomes rapidly competitive. The concentration has been increased in the middle graphs of Fig. 7 such that only a very low concentration of ROOOH is expected. In the right graphs, finally, a very high concentration of butane has been used, too high to detect the decay of OH radicals with our time resolution. Under these conditions, it is expected that OH radicals react nearly exclusively with butane and no ROOOH is formed. Note that the initial OH radical concentration is the same in all three experiments. The interference is clearly visible in the left graphs (slope m = (15.8±4) × 10−5 arb. units), barely in the centre graphs (m = (1.2±1.7) × 10−5 arb. units) and not present anymore in the right graphs (m = −(0.4±1.3) × 10−5 arb. units). Note that in the experiment of the right graphs, the concentrations of all other species are similar to the concentrations in the left graphs, i.e. the RO2 and HO2 concentrations are similar and with this all products obtained from self and cross reactions. This is another strong indicator that the observed increase in residual LIF intensity is indeed due to the product of the reaction of RO2 with OH.
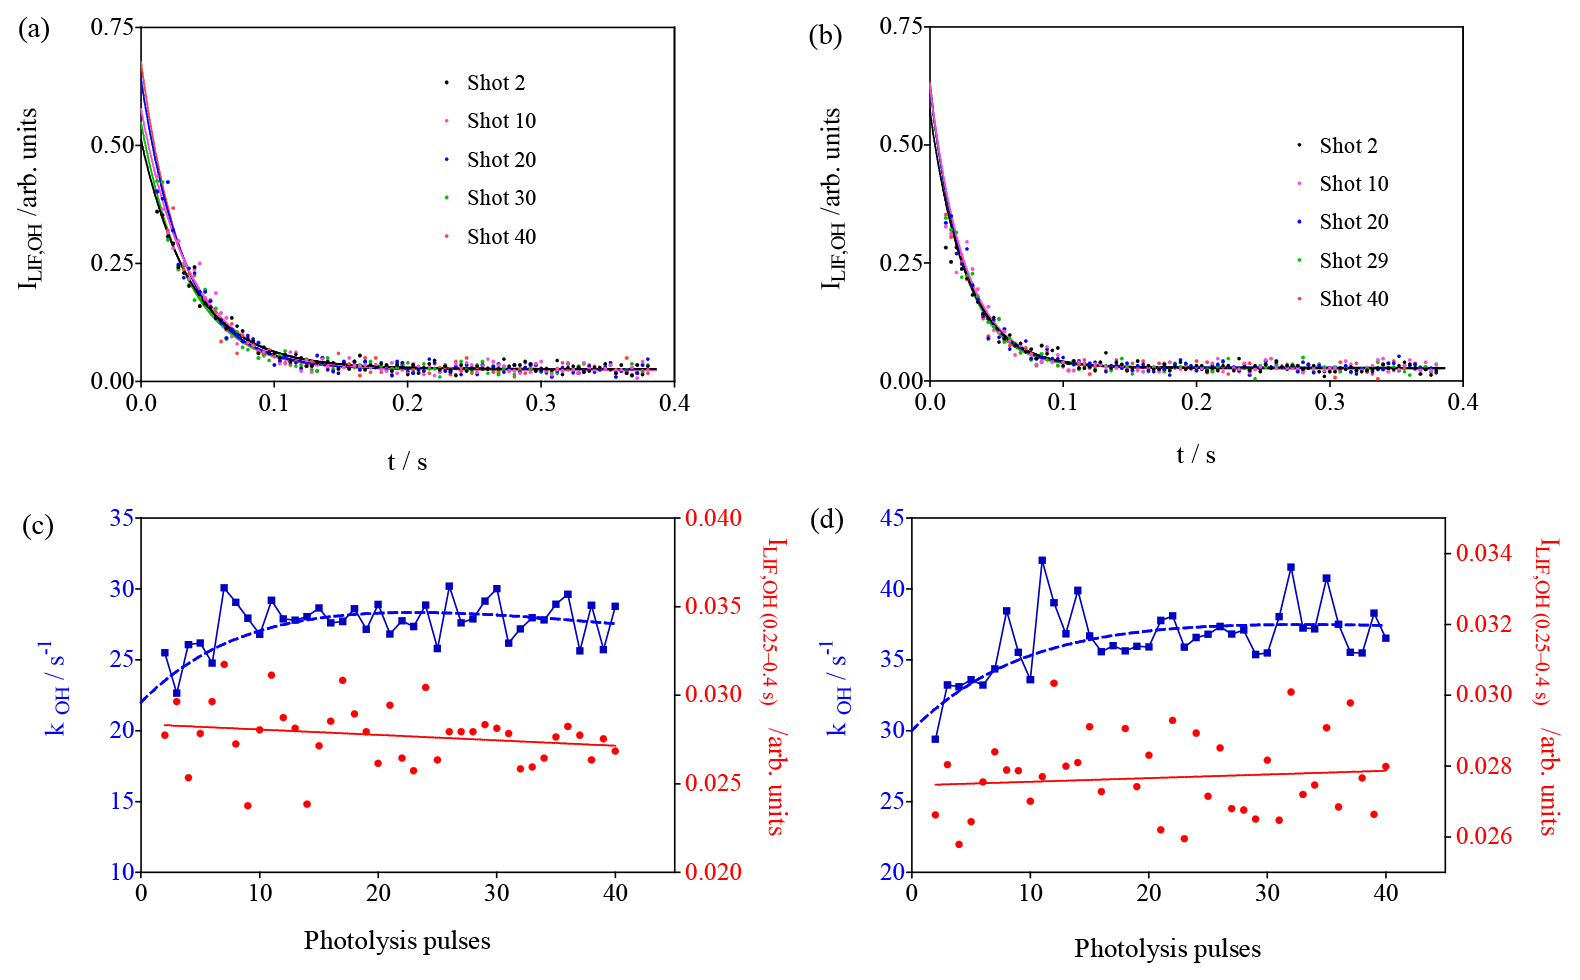
Figure 8Photolysis of O3 in the presence of different concentrations of CH4 (3.3×1015 cm−3 and 4.9 × 1015 cm−3 for (a–d), respectively). (a, b) OH decays (for clarity only every 10th decay is shown); (c, d) decay rates of OH radicals as a function of photolysis pulses (blue dots, left y axis), residual LIF intensity taken as the average LIF intensity between 0.25 and 0.4 s s (red dots, right y axis).
2.1.4 Tests with CH4
Experiments with CH4 have been carried out because it is known that the HO2 yield in the reaction of CH3O2 with OH is very high, and that the yield of stabilised CH3OOOH is expected to be very low (Assaf et al., 2017a, 2018b). Therefore, it would not be expected to observe an interference in the FAGE system. Two experiments with different CH4 concentrations have been performed; the results are shown in Fig. 8. In both series, one observes, for the OH decay rate, an increase over the first few photolysis shots. This is expected due to the formation of CH3O2 radicals that are more reactive to OH radicals than CH4. In Fig. 3 it can be seen that the model predicts (for an overall reactivity of 30 s−1) an increase in RO2 radicals over the first 10 pulses, followed by a steady-state period and a slow decay. The decay rates are plotted as a function of the photolysis pulses in Fig. 8c, d and have been fitted by forcing to the same rise time as the one obtained from the mono-exponential fit of the RO2 profile in Fig. 3. A rough estimation of the increase in the decay rate of 8 s−1 is obtained, corresponding to a CH3O2 concentration (using k() = 1.5 × 10⁻¹⁰ cm3 s−1) (Assaf et al., 2016) of 5 × 1010 cm−3, in excellent agreement with the predictions of the model (Fig. 3). This good agreement gives more confidence in the principal idea of the experiments and the conditions chosen to enhance the formation of ROOOH.
In both experiments the LIF intensity at long times does not change ( and for left and right graphs of Fig. 8, respectively). This is expected due to the small yield of CH3OOOH and further supports the hypothesis that ROOOH, the product of the reaction between RO2 and OH, leads to an interference in UL-FAGE.
2.1.5 Intensity of interference in UL-FAGE
The increase in residual LIF signal in Fig. 4 over the 40 photolysis pulses is around 0.005 arb. units. This can be compared with the raw OH decays shown in Fig. 2: the initial LIF signal of ≈1.7 arb. units corresponds to an OH concentration of 1.4 × 1010 cm−3. Therefore, the increase in the residual signal corresponds to an equivalent OH concentration of ≈4 × 107 cm−3. The concentration of ROOOH accumulated after 40 photolysis pulses was estimated to be [ROOOH] ≈1 × 1011 cm−3 using a simple model, i.e. a fraction of ≈4 × 10⁻⁴ of ROOOH decomposed to OH radicals during the expansion within the UL-FAGE. No clear explanation can be given on the mechanism of this OH formation: a homogeneous decomposition within the shock wave of the expansion is unlikely because the pathway leading to CH3O and HO2 is thermodynamically more favoured (Assaf et al., 2018a) and thus no OH would be expected. Therefore, a heterogeneous decomposition on the walls of the FAGE cell or the entrance nozzle are more likely. The residence time of the gas mixture between entrance nozzle and detection beam can be calculated from the volume of the cell (0.25 L) and the gas flow (3 L min−1 STP, standard temperature and pressure) to around 1 s, leaving ample time for collisions with the reactor walls.
It can hence be concluded that in the UL-FAGE, an interference signal corresponding to [OH] = 1 × 106 cm−3 (order of magnitude of the disagreement between model and measurements) could be generated by less than 100 ppt of ROOOH. It needs to be emphasised that this result is only valid for the UL-FAGE, and the magnitude or even presence of this interference might be very different for other FAGE instruments and needs to be tested. Also, it is not very likely that this species can explain the observed increase in the interference at night, as observed by Novelli et al. (2014a).
In order to estimate if ROOOH concentrations in this range can possibly be accumulated in remote biogenic environments, calculations using global and box models have been performed.
2.2 Modelling results
The global distribution of ROOOH species produced by the RO2 + OH reaction was investigated using the Met Office's Unified Model with the United Kingdom Chemistry and Aerosols scheme (UM-UKCA), version 8.4 (Abraham et al., 2012). UM-UKCA is a global chemistry–climate model with a horizontal resolution of 1.875∘ in longitude and 1.25∘ in latitude on 85 vertical levels from the surface up to a height of 85 km (in its N96-L85 configuration). The chemistry scheme and emissions used in the present study were described in detail in a recent work (Ferracci et al., 2018) and included isoprene oxidation (Archibald et al., 2010) and isoprene emissions.
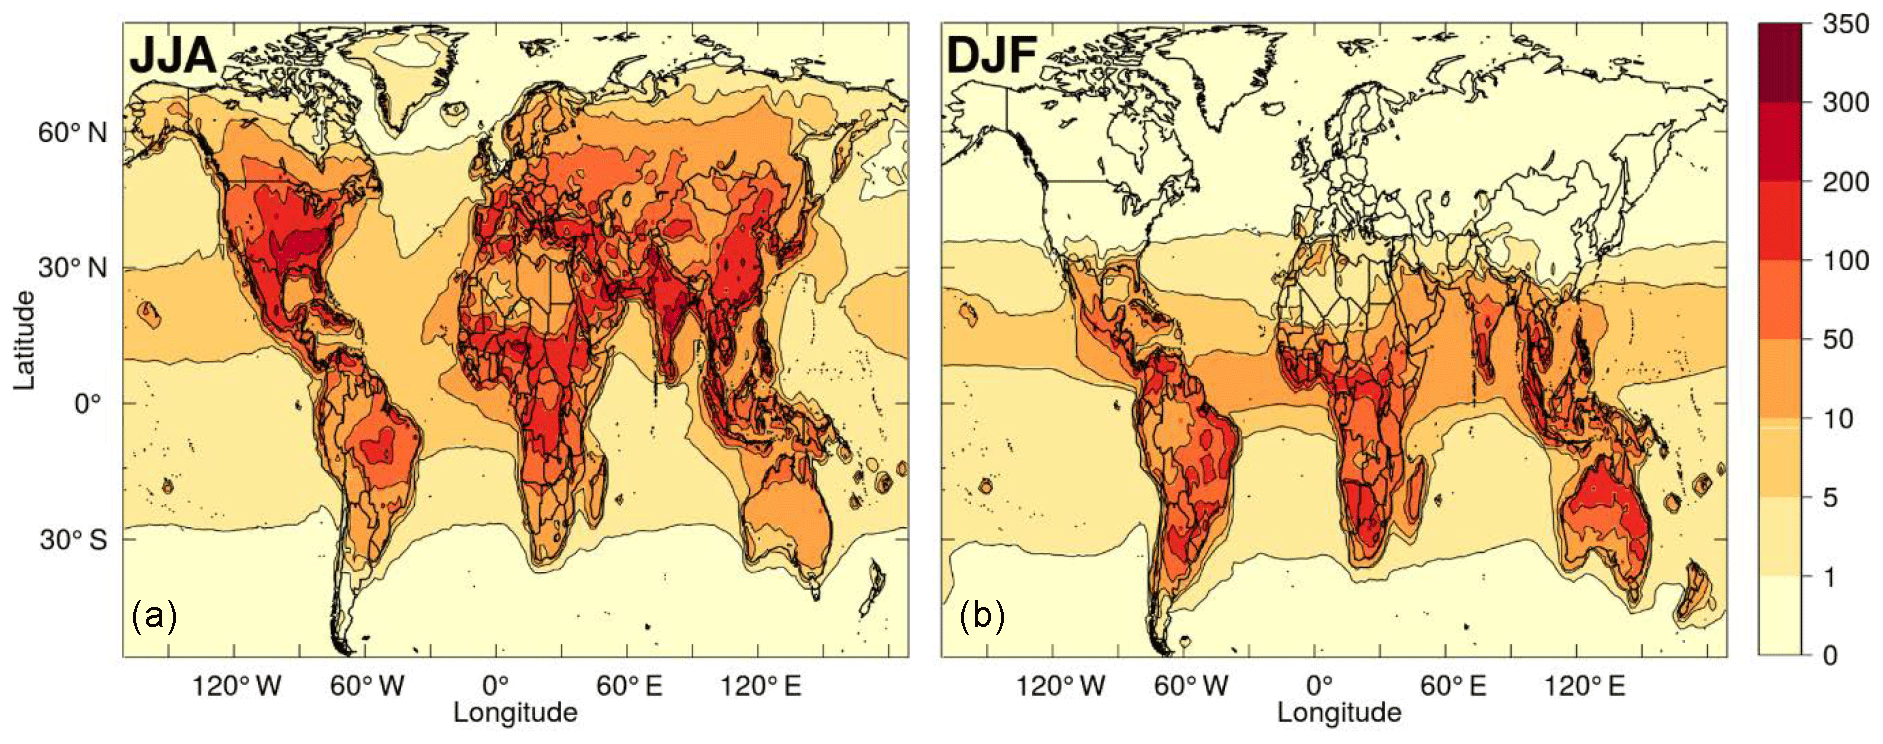
Figure 9Modelled mean diurnal peak ROOOH volume mixing ratio (in ppt) during northern (a) and southern (b) summer months, using a combined removal rate for all ROOOH of 10−4 s−1.
Crucially, the model simulated the abundances of a number of peroxy radicals resulting from the oxidation of emitted VOCs: CH3O2 (methyl peroxy), CH3CH2O2 (ethyl peroxy), CH3CH2CH2O2 (n-propyl peroxy), (CH3)2CHO2 (i-propyl peroxy), CH3C(O)O2 (acetyl peroxy), CH3CH2C(O)O2 (propionyl peroxy) and CH3C(O)CH2O2 (propyldioxy peroxy). Peroxy radicals from the first oxidation of isoprene were lumped into one species as those from the oxidation of isoprene oxidation products (methacrolein and methyl vinyl ketone). These were used, along with the modelled number densities of OH and a rate constant k1 of 1.5 × 10⁻¹⁰ cm3 s−1, for all RO2 + OH reactions (consistent with laboratory studies; Faragó et al., 2015; Assaf et al., 2016, 2017b) to calculate the total rate of production of ROOOH species. The total atmospheric abundance of trioxide species, [ROOOH]ss, was then calculated offline assuming steady state between the production and loss (L) processes of ROOOH, according to the following equation:
where the sum is across all RO2 radicals in the model excluding methyl peroxy radicals, for which it has been shown that the production of a trioxide species is only a minor product channel (Assaf et al., 2017a) while the trioxide yield is expected to be close to 1 for larger peroxy radicals (Assaf et al., 2018b).
Steady-state ROOOH abundances were calculated “offline” using the modelled abundances of hourly [OH] and [RO2] along with a rate constant (Assaf et al., 2016, 2017b) for ROOOH formation of 1.5 × 10⁻¹⁰ cm3 s−1. As neither the removal rate nor the dominant loss process of these ROOOH species are currently known, different removal rates were tested, ranging from 10−5 to 10−2 s−1. In any case, the modelled [ROOOH] followed a diurnal and seasonal cycle similar to that of its precursors (OH and RO2). Therefore, the highest [ROOOH] values were found around midday–14:00 local time in the summer months (JJA in the Northern Hemisphere; DJF in the Southern Hemisphere). The peak [ROOOH] values shown in Fig. 9 and in Fig. S4 in the Supplement were determined by producing an average seasonal diurnal cycle for each model grid cell and then plotting only its peak [ROOOH] value. Figure 9 shows the average diurnal peak concentration of ROOOH in the boreal (Fig. 9a) and austral (Fig. 9b) summer obtained using a removal rate of 10−4 s−1, leading to ROOOH lifetimes of around 3 h, of the same order as the lifetime of ROOH species. Peak concentrations of several 100 ppt are reached in this scenario, especially at tropical latitudes, which would lead to an interference in the UL-FAGE system of the order of 1 × 106 cm−3. However, we would like to emphasise that both the modelled concentration of ROOOH in the atmosphere as well as the sensitivity of the UL-FAGE to ROOOH species currently bear an uncertainty of at least a factor of 10.
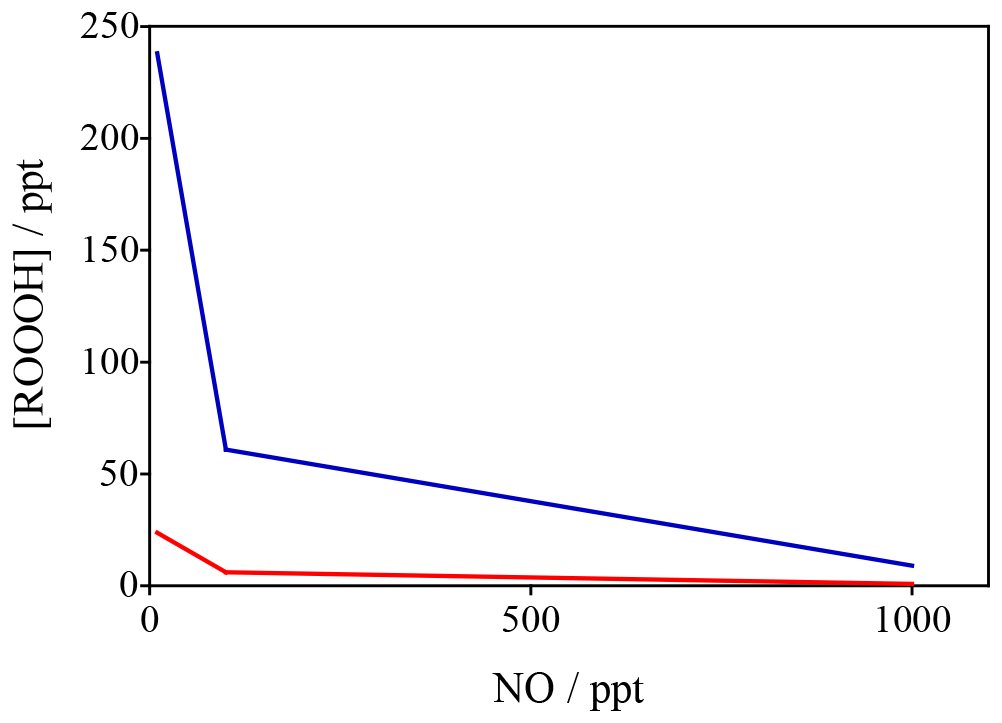
Figure 10Variation in ROOOH as a function of NO (x axis) and VOC reactivity (different colours) constrained by data from Feiner et al. (2016). These data in red reflect a situation of VOC reactivity of 5 s−1 whilst the blue data reflect a VOC reactivity of 24 s−1 (similar to that seen in regions like the Amazon).
To confirm these global model results, a steady-state box model, constrained to observations (including OH, NO, isoprene and HO2) made in the south-east USA (Feiner et al., 2016) was developed. The results of the calculations with the steady-state model are shown in Fig. 10, which highlights that at low levels of [NO] (< 200 ppt), typical in remote BVOC (biogenic VOC)-rich environments, levels of [ROOOH] are predicted to be of the order of 50–200 ppt, with a steep increase at [NO] < 100 ppt. The two data sets plotted in Fig. 10 span a range of different NMVOCs (non-methane volatile organic compounds) (isoprene) mixing ratios and highlight that ROOOH levels increase with increasing [VOC] and decreasing [NO], in agreement with the global 3-D modelling results shown in Fig. 9.
In this work we have shown that the product of the reaction of RO2 radicals with OH radicals leads to an OH interference signal in the UL-FAGE instrument. The intensity of such interference or even its very occurrence can depend on the design and working conditions of the FAGE set-up, which is different for different groups. However, if occurring also with a comparable intensity in other FAGE instruments, this interference might be high enough to explain numerous observations obtained with FAGE instruments from other research groups including the following.
-
Underestimation by models of OH concentrations measured in remote, biogenic environments: the global model predicts ROOOH peak concentrations in remote environments that are possibly high enough to explain, at least partially, the observed disagreement between model and measurements (Whalley et al., 2011; Lelieveld et al., 2008; Hofzumahaus et al., 2009; Tan et al., 2017).
-
Variability of interferences observed in field campaigns: the box model calculations have shown that the concentration of ROOOH species varies with NO, VOC concentration and J(O1D) in the same way as the amplitude of the interference such as observed by the group of W. Brune (Feiner et al., 2016).
-
Interference observed from O3 + alkenes: the tentative explanation of alkene ozonolysis being the source of internally formed OH radicals through decomposition of the stabilised Criegee intermediate (Novelli et al., 2017) is possibly also, at least partially, due to ROOOH formed in a secondary reaction from RO2 and OH, both generated during the ozonolysis (Johnson and Marston, 2008) of the very high VOC and O3 concentrations in laboratory experiments (Novelli et al., 2014b; Rickly and Stevens, 2018; Fuchs et al., 2016). Indeed, it is observed in these experiments that the interference scales with the O3 + alkene turnover rate, i.e. the time that ROOOH can accumulate.
-
Interferences observed in the SAPHIR chamber: Fuchs et al. (2012) have carried out experiments under low-NO conditions by comparing OH concentrations measured by FAGE and DOAS (Fuchs et al., 2012). Most of the time the agreement between both techniques was excellent, but on a few days towards the end of the campaign higher OH concentrations were measured by FAGE compared to DOAS. The NO concentrations on these days were lower, making the formation of ROOOH more likely than on days with excellent agreement between FAGE and DOAS (Table 2 in Fuchs et al., 2012).
The results presented in this work thus propose a plausible solution to answer many open questions; it is, however, not very likely that they can explain an increase in the interference at night, such as observed by Novelli et al. (2014a). Of course, the uncertainties are currently high on both the observed FAGE interference per ROOOH molecule as well as the maximum ROOOH concentration that can accumulate in real environments. The first point could be improved through well-designed chamber studies under very low-NO concentrations: such experiments have already been carried out (Nguyen et al., 2014), and a detailed analysis of the data might support the conclusions from this work. The second point is more difficult to ameliorate because the steady-state ROOOH concentration directly scales with its removal rate, and currently nothing is known about the fate of ROOOH. Perhaps the table can be turned by using the evolution of the observed interferences to learn about the fate of ROOOH?
Nonetheless, even with current uncertainties the implications of our understanding of daylight atmospheric oxidation chemistry are significant. We provide a plausible mechanism for how and why high OH levels in some environments are bolstered by a false signal, in a sense validating our current generation of models and reducing the need for speculative chemistry to explain the difference in simulated and observed OH of earlier field campaigns in pristine environments. With further observations and model development, the outcome will be to improve our ability to predict the OH budget in pristine environments and the impacts of changes on the global chemistry–climate system.
Data are available upon request.
The supplement related to this article is available online at: https://doi.org/10.5194/acp-19-349-2019-supplement.
SB and CS developed the FAGE instrument; CF and CS designed the experiments and MA carried them out; VF, SAN and ATA developed the model and performed the simulations. CF prepared the paper with contributions from all co-authors.
The authors declare that they have no conflict of interest.
This project was supported by the French ANR agency under contract no.
ANR-11-LabX-0005-01 CaPPA (Chemical and Physical Properties of the
Atmosphere), the Région Hauts-de-France, the Ministère de
l'Enseignement Supérieur et de la Recherche (CPER Climibio) and the
European Fund for Regional Economic Development. Alexander T. Archibald and
Scott Archer-Nicholls thank NERC-NCAS and the Walters Kundert Trust under
whose auspices this work was enabled. Valerio Ferracci thanks the European
Research Council for funding through the Atmospheric Chemistry-Climate
Interactions (ACCI) project, project number 267760. UM-UKCA runs in this work
used the ARCHER UK National Supercomputing Service. The authors thank
Paul Wennberg for very helpful discussions.
Edited by: Frank Keutsch
Reviewed by: two anonymous referees
Abraham, N. L., Archibald, A. T., Bellouin, N., Boucher, O., Braesicke, P., Bushell, A., Carslaw, K., Collins, B., Dalvi, M., Emmerson, K., Folberth, G., Haywood, J., Johnson, C., Kipling, Z., Macintyre, H., Mann, G., Telford, P., Merikanto, J., Morgenstern, O., Connor, F. O., Ord, C., Osprey, S., Pringle, K., Pyle, J., Rae, J., Reddington, C., Savage, N., Spracklen, D., Stier, P., and West, R.: Unified Model Documentation Paper No. 84: United Kingdom Chemistry and Aerosol (UKCA) Technical Description MetUM Version 8.4, 84, 1–74, 2012.
Archibald, A. T., Petit, A. S., Percival, C. J., Harvey, J. N., and Shallcross, D. E.: On the Importance of the Reaction between OH and RO2 Radicals, Atmos. Sci. Lett., 10, 102–108, 2009.
Archibald, A. T., Cooke, M. C., Utembe, S. R., Shallcross, D. E., Derwent, R. G., and Jenkin, M. E.: Impacts of mechanistic changes on HOx formation and recycling in the oxidation of isoprene, Atmos. Chem. Phys., 10, 8097–8118, https://doi.org/10.5194/acp-10-8097-2010, 2010.
Assaf, E., Song, B., Tomas, A., Schoemaecker, C., and Fittschen, C.: Rate Constant of the Reaction between CH3O2 Radicals and OH Radicals revisited, J. Phys. Chem. A, 120, 8923–8932, https://doi.org/10.1021/acs.jpca.6b07704, 2016.
Assaf, E., Sheps, L., Whalley, L., Heard, D., Tomas, A., Schoemaecker, C., and Fittschen, C.: The Reaction between CH3O2 and OH Radicals: Product Yields and Atmospheric Implications, Environ. Sci. Technol., 51, 2170–2177, https://doi.org/10.1021/acs.est.6b06265, 2017a.
Assaf, E., Tanaka, S., Kajii, Y., Schoemaecker, C., and Fittschen, C.: Rate constants of the reaction of C2–C4 peroxy radicals with OH radicals, Chem. Phys. Lett., 684, 245–249, https://doi.org/10.1016/j.cplett.2017.06.062, 2017b.
Assaf, E., Schoemaecker, C., Vereecken, L., and Fittschen, C.: The reaction of fluorine atoms with methanol: yield of CH3∕CH2OH and rate constant of the reactions CH3 + CH3 and CH3 + HO2, PCCP, 20, 8707, https://doi.org/10.1039/C7CP05770A, 2018a.
Assaf, E., Schoemaecker, C., Vereecken, L., and Fittschen, C.: Experimental and Theoretical Investigation of the Reaction of RO2 Radicals with OH Radicals: Dependence of the HO2 Yield on the Size of the Alkyl Group, Int. J. Chem. Kinet., 50, 670–680, https://doi.org/10.1002/kin.21191, 2018b.
Brune, W. H., Stevens, P. S., and Mather, J. H.: Measuring OH and HO2 in the Troposphere by Laser-Induced Fluorescence at Low Pressure, J. Atmos. Sci., 52, 3328–3336, 1995.
Caravan, R. L., Khan, M. A. H., Zádor, J., Sheps, L., Antonov, I. O., Rotavera, B., Ramasesha, K., Au, K., Chen, M.-W., Rösch, D., Osborn, D. L., Fittschen, C., Schoemaecker, C., Duncianu, M., Grira, A., Dusanter, S., Tomas, A., Percival, C. J., Shallcross, D. E., and Taatjes, C. A.: The reaction of OH with CH3OO is not a major source of atmospheric methanol, Nat. Commun., 9, 4343, https://doi.org/10.1038/s41467-018-06716-x, 2018.
Creasey, D. J., Halford-Maw, P. A., Heard, D. E., Pilling, M. J., and Whitaker, B. J.: Implementation and initial deployment of a field instrument for measurement of OH and HO2 in the troposphere by laser-induced fluorescence, J. Chem. Soc., Faraday Trans., 93, 2907–2913, 1997.
Crounse, J. D., Paulot, F., Kjaergaard, H. G., and Wennberg, P. O.: Peroxy radical isomerization in the oxidation of isoprene, Phys. Chem. Chem. Phys., 13, 13607–13613, https://doi.org/10.1039/c1cp21330j, 2011.
Dubey, M. K., Hanisco, T. F., Wennberg, P. O., and Anderson, J. G.: Monitoring potential photochemical interference in laser-induced fluorescence measurements of atmospheric OH, Geophys. Res. Lett., 23, 3215–3218, 1996.
Dusanter, S., Vimal, D., and Stevens, P. S.: Technical note: Measuring tropospheric OH and HO2 by laser-induced fluorescence at low pressure. A comparison of calibration techniques, Atmos. Chem. Phys., 8, 321–340, https://doi.org/10.5194/acp-8-321-2008, 2008.
Faragó, E. P., Schoemaecker, C., Viskolcz, B., and Fittschen, C.: Experimental Determination of the Rate Constant of the Reaction between C2H5O2 and OH Radicals, Chem. Phys. Lett., 619, 196–200, https://doi.org/10.1016/j.cplett.2014.11.069, 2015.
Feiner, P. A., Brune, W. H., Miller, D. O., Zhang, L., Cohen, R. C., Romer, P. S., Goldstein, A. H., Keutsch, F. N., Skog, K. M., Wennberg, P. O., Nguyen, T. B., Teng, A. P., DeGouw, J., Koss, A., Wild, R. J., Brown, S. S., Guenther, A., Edgerton, E., Baumann, K., and Fry, J. L.: Testing Atmospheric Oxidation in an Alabama Forest, J. Atmos. Sci., 73, 4699–4710, https://doi.org/10.1175/jas-d-16-0044.1, 2016.
Ferracci, V., Heimann, I., Abraham, N. L., Pyle, J. A., and Archibald, A. T.: Global modelling of the total OH reactivity: investigations on the “missing” OH sink and its atmospheric implications, Atmos. Chem. Phys., 18, 7109–7129, https://doi.org/10.5194/acp-18-7109-2018, 2018.
Fittschen, C., Whalley, L. K., and Heard, D. E.: The Reaction of CH3O2 Radicals with OH Radicals: A Neglected Sink for CH3O2 in the Remote Atmosphere, Environ. Sci. Technol., 118, 7700–7701, https://doi.org/10.1021/es502481q, 2014.
Fuchs, H., Dorn, H.-P., Bachner, M., Bohn, B., Brauers, T., Gomm, S., Hofzumahaus, A., Holland, F., Nehr, S., Rohrer, F., Tillmann, R., and Wahner, A.: Comparison of OH concentration measurements by DOAS and LIF during SAPHIR chamber experiments at high OH reactivity and low NO concentration, Atmos. Meas. Tech., 5, 1611–1626, https://doi.org/10.5194/amt-5-1611-2012, 2012.
Fuchs, H., Tan, Z., Hofzumahaus, A., Broch, S., Dorn, H.-P., Holland, F., Künstler, C., Gomm, S., Rohrer, F., Schrade, S., Tillmann, R., and Wahner, A.: Investigation of potential interferences in the detection of atmospheric ROx radicals by laser-induced fluorescence under dark conditions, Atmos. Meas. Tech., 9, 1431–1447, https://doi.org/10.5194/amt-9-1431-2016, 2016.
Fuchs, H., Novelli, A., Rolletter, M., Hofzumahaus, A., Pfannerstill, E. Y., Kessel, S., Edtbauer, A., Williams, J., Michoud, V., Dusanter, S., Locoge, N., Zannoni, N., Gros, V., Truong, F., Sarda-Esteve, R., Cryer, D. R., Brumby, C. A., Whalley, L. K., Stone, D., Seakins, P. W., Heard, D. E., Schoemaecker, C., Blocquet, M., Coudert, S., Batut, S., Fittschen, C., Thames, A. B., Brune, W. H., Ernest, C., Harder, H., Muller, J. B. A., Elste, T., Kubistin, D., Andres, S., Bohn, B., Hohaus, T., Holland, F., Li, X., Rohrer, F., Kiendler-Scharr, A., Tillmann, R., Wegener, R., Yu, Z., Zou, Q., and Wahner, A.: Comparison of OH reactivity measurements in the atmospheric simulation chamber SAPHIR, Atmos. Meas. Tech., 10, 4023–4053, https://doi.org/10.5194/amt-10-4023-2017, 2017.
Griffith, S. M., Hansen, R. F., Dusanter, S., Michoud, V., Gilman, J. B., Kuster, W. C., Veres, P. R., Graus, M., de Gouw, J. A., Roberts, J., Young, C., Washenfelder, R., Brown, S. S., Thalman, R., Waxman, E., Volkamer, R., Tsai, C., Stutz, J., Flynn, J. H., Grossberg, N., Lefer, B., Alvarez, S. L., Rappenglueck, B., Mielke, L. H., Osthoff, H. D., and Stevens, P. S.: Measurements of hydroxyl and hydroperoxy radicals during CalNex-LA: Model comparisons and radical budgets, J. Geophys. Res.-Atmos., 121, 4211–4232, https://doi.org/10.1002/2015jd024358, 2016.
Hansen, R. F., Blocquet, M., Schoemaecker, C., Léonardis, T., Locoge, N., Fittschen, C., Hanoune, B., Stevens, P. S., Sinha, V., and Dusanter, S.: Intercomparison of the comparative reactivity method (CRM) and pump–probe technique for measuring total OH reactivity in an urban environment, Atmos. Meas. Tech., 8, 4243–4264, https://doi.org/10.5194/amt-8-4243-2015, 2015.
Heard, D. E. and Pilling, M. J.: Measurement of OH and HO2 in the Troposphere, Chem. Rev., 103, 5163–5198, 2003.
Hofzumahaus, A., Rohrer, F., Lu, K., Bohn, B., Brauers, T., Chang, C. C., Fuchs, H., Holland, F., Kita, K., Kondo, Y., Li, X., Lou, S., Shao, M., Zeng, L., Wahner, A., and Zhang, Y.: Amplified trace gas removal in the troposphere, Science, 324, 1702–1704, https://doi.org/10.1126/science.1164566, 2009.
Holland, F., Hofzumahaus, A., Schafer, R., Kraus, A., and Patz, H. W.: Measurements of OH and HO2 radical concentrations and photolysis frequencies during BERLIOZ, J. Geophys. Res.-Atmos., 108, 8246, https://doi.org/10.1029/2001jd001393, 2003.
Johnson, D., and Marston, G.: The gas-phase ozonolysis of unsaturated volatile organic compounds in the troposphere, Chem. Soc. Rev., 37, 699–716, https://doi.org/10.1039/B704260B, 2008.
Lelieveld, J., Butler, T. M., Crowley, J. N., Dillon, T. J., Fischer, H., Ganzeveld, L., Harder, H., Lawrence, M. G., Martinez, M., Taraborrelli, D., and Williams, J.: Atmospheric oxidation capacity sustained by a tropical forest, Nature, 452, 737–740, 2008.
Liu, Y., Chen, L., Chen, D., Wang, W., Liu, F., and Wang, W.: Computational study on mechanisms of C2H5O2 + OH reaction and properties of C2H5O3H complex, Chem. Res. Chinese U., 33, 623–630, https://doi.org/10.1007/s40242-017-7055-4, 2017.
Mao, J., Ren, X., Zhang, L., Van Duin, D. M., Cohen, R. C., Park, J.-H., Goldstein, A. H., Paulot, F., Beaver, M. R., Crounse, J. D., Wennberg, P. O., DiGangi, J. P., Henry, S. B., Keutsch, F. N., Park, C., Schade, G. W., Wolfe, G. M., Thornton, J. A., and Brune, W. H.: Insights into hydroxyl measurements and atmospheric oxidation in a California forest, Atmos. Chem. Phys., 12, 8009–8020, https://doi.org/10.5194/acp-12-8009-2012, 2012.
Monks, P. S., Archibald, A. T., Colette, A., Cooper, O., Coyle, M., Derwent, R., Fowler, D., Granier, C., Law, K. S., Mills, G. E., Stevenson, D. S., Tarasova, O., Thouret, V., von Schneidemesser, E., Sommariva, R., Wild, O., and Williams, M. L.: Tropospheric ozone and its precursors from the urban to the global scale from air quality to short-lived climate forcer, Atmos. Chem. Phys., 15, 8889–8973, https://doi.org/10.5194/acp-15-8889-2015, 2015.
Müller, J.-F., Liu, Z., Nguyen, V. S., Stavrakou, T., Harvey, J. N., and Peeters, J.: The Reaction of Methyl Peroxy and Hydroxyl Radicals as a Major Source of Atmospheric Methanol, Nat. Commun., 7, 13213, https://doi.org/10.1038/ncomms13213, 2016.
Nguyen, T. B., Crounse, J. D., Schwantes, R. H., Teng, A. P., Bates, K. H., Zhang, X., St. Clair, J. M., Brune, W. H., Tyndall, G. S., Keutsch, F. N., Seinfeld, J. H., and Wennberg, P. O.: Overview of the Focused Isoprene eXperiment at the California Institute of Technology (FIXCIT): mechanistic chamber studies on the oxidation of biogenic compounds, Atmos. Chem. Phys., 14, 13531–13549, https://doi.org/10.5194/acp-14-13531-2014, 2014.
Novelli, A., Hens, K., Tatum Ernest, C., Kubistin, D., Regelin, E., Elste, T., Plass-Dülmer, C., Martinez, M., Lelieveld, J., and Harder, H.: Characterisation of an inlet pre-injector laser-induced fluorescence instrument for the measurement of atmospheric hydroxyl radicals, Atmos. Meas. Tech., 7, 3413–3430, https://doi.org/10.5194/amt-7-3413-2014, 2014a.
Novelli, A., Vereecken, L., Lelieveld, J., and Harder, H.: Direct observation of OH formation from stabilised Criegee intermediates, Phys. Chem. Chem. Phys., 16, 19941–19951, https://doi.org/10.1039/C4CP02719A, 2014b.
Novelli, A., Hens, K., Tatum Ernest, C., Martinez, M., Nölscher, A. C., Sinha, V., Paasonen, P., Petäjä, T., Sipilä, M., Elste, T., Plass-Dülmer, C., Phillips, G. J., Kubistin, D., Williams, J., Vereecken, L., Lelieveld, J., and Harder, H.: Estimating the atmospheric concentration of Criegee intermediates and their possible interference in a FAGE-LIF instrument, Atmos. Chem. Phys., 17, 7807–7826, https://doi.org/10.5194/acp-17-7807-2017, 2017.
Parker, A., Amedro, D., Schoemaecker, C., and Fittschen, C.: OH Reactivity Measurments by FAGE, Environ. Eng. Manage. J., 10, 107–114, 2011.
Paulot, F., Crounse, J. D., Kjaergaard, H. G., Kurten, A., St. Clair, J. M., Seinfeld, J. H., and Wennberg, P. O.: Unexpected epoxide formation in the gas-phase photooxidation of isoprene, Science, 325, 730–733, https://doi.org/10.1126/science.1172910, 2009.
Peeters, J., Nguyen, T. L., and Vereecken, L.: HOx radical regeneration in the oxidation of isoprene, Phys. Chem. Chem. Phys., 11, 5935–5939, https://doi.org/10.1039/b908511d, 2009.
Ren, X., Harder, H., Martinez, M., Faloona, I. C., Tan, D., Lesher, R. L., Carlo, P. D., Simpas, J. B., and Brune, W. H.: Interference Testing for Atmospheric HOx Measurements by Laser-induced Fluorescence, J. Atmos. Chem., 47, 169–190, 2004.
Rickly, P. and Stevens, P. S.: Measurements of a potential interference with laser-induced fluorescence measurements of ambient OH from the ozonolysis of biogenic alkenes, Atmos. Meas. Tech., 11, 1–16, https://doi.org/10.5194/amt-11-1-2018, 2018.
Rohrer, F., Lu, K., Hofzumahaus, A., Bohn, B., Brauers, T., Chang, C.-C., Fuchs, H., Haseler, R., Holland, F., Hu, M., Kita, K., Kondo, Y., Li, X., Lou, S., Oebel, A., Shao, M., Zeng, L., Zhu, T., Zhang, Y., and Wahner, A.: Maximum efficiency in the hydroxyl-radical-based self-cleansing of the troposphere, Nat. Geosci., 7, 559–563, https://doi.org/10.1038/ngeo2199, 2014.
Stone, D., Whalley, L. K., and Heard, D. E.: Tropospheric OH and HO2 radicals: field measurements and model comparisons, Chem. Soc. Rev., 41, 6348–6404, https://doi.org/10.1039/c2cs35140d, 2012.
Tan, Z., Fuchs, H., Lu, K., Hofzumahaus, A., Bohn, B., Broch, S., Dong, H., Gomm, S., Häseler, R., He, L., Holland, F., Li, X., Liu, Y., Lu, S., Rohrer, F., Shao, M., Wang, B., Wang, M., Wu, Y., Zeng, L., Zhang, Y., Wahner, A., and Zhang, Y.: Radical chemistry at a rural site (Wangdu) in the North China Plain: observation and model calculations of OH, HO2 and RO2 radicals, Atmos. Chem. Phys., 17, 663–690, https://doi.org/10.5194/acp-17-663-2017, 2017.
Wennberg, P. O., Bates, K. H., Crounse, J. D., Dodson, L. G., McVay, R. C., Mertens, L. A., Nguyen, T. B., Praske, E., Schwantes, R. H., Smarte, M. D., Clair, J. M. S., Teng, A. P., Zhang, X., and Seinfeld, J. H.: Gas-Phase Reactions of Isoprene and Its Major Oxidation Products, Chem. Rev., 118, 3337–3390, https://doi.org/10.1021/acs.chemrev.7b00439, 2018.
Whalley, L. K., Edwards, P. M., Furneaux, K. L., Goddard, A., Ingham, T., Evans, M. J., Stone, D., Hopkins, J. R., Jones, C. E., Karunaharan, A., Lee, J. D., Lewis, A. C., Monks, P. S., Moller, S. J., and Heard, D. E.: Quantifying the magnitude of a missing hydroxyl radical source in a tropical rainforest, Atmos. Chem. Phys., 11, 7223–7233, https://doi.org/10.5194/acp-11-7223-2011, 2011.
Yan, C., Kocevska, S., and Krasnoperov, L. N.: Kinetics of the Reaction of CH3O2 Radicals With OH Studied Over the 292–526 K Temperature Range, J. Phys. Chem. A, 120, 6111–6121, https://doi.org/10.1021/acs.jpca.6b04213, 2016.