the Creative Commons Attribution 4.0 License.
the Creative Commons Attribution 4.0 License.
 | 14 Mar 2019
Lidar observations of pyrocumulonimbus smoke plumes in the UTLS over Tomsk (Western Siberia, Russia) from 2000 to 2017
Vladimir V. Zuev
Vladislav V. Gerasimov
Aleksei V. Nevzorov
Ekaterina S. Savelieva
Large volcanic eruptions with the volcanic explosivity index (VEI) ≥ 3 are widely known to be the strongest source of long-lived aerosol in the upper troposphere and lower stratosphere (UTLS). However, the latest studies have revealed that massive forest (bush) fires represent another strong source of short-term (but intense) aerosol perturbations in the UTLS if combustion products from the fires reach these altitudes via convective ascent within pyrocumulonimbus clouds (pyroCbs). PyroCbs, generated by boreal wildfires in North America and northeastern Asia and injecting smoke plumes into the UTLS, have been intensively studied using both ground- and space-based instruments since the beginning of the 21st century. In this paper, we focus on aerosol layers observed in the UTLS over Tomsk (56.48∘ N, 85.05∘ E, Western Siberia, Russia) that could be smoke plumes from such pyroCb events occurring in the 2000–2017 period. Using the HYSPLIT trajectory analysis, we have reliably assigned nine aerosol layers to 8 out of more than 100 documented pyroCb events, the aftereffects of which could potentially be detected in the UTLS over Tomsk. All the eight pyroCb events occurred in the USA and Canada: one event per year occurred in 2000, 2002, 2003, 2013, 2015, and 2016, whereas two events occurred in 2017. No plumes from pyroCbs originating in the boreal zone of Siberia and the Far East (to the east of Tomsk) were observed in the UTLS over Tomsk between 2000 and 2017. We conclude that the time durations for pyroCb plumes to be detected in the UTLS using ground-based lidars are less than about a month, i.e., plumes from pyroCbs generated by wildfires to the east of Tomsk can significantly diffuse before reaching the Tomsk lidar station by the westerly zonal transport of air masses. A comparative analysis of the contributions from pyroCb events and volcanic eruptions with VEI ≥ 3 to aerosol loading of the UTLS over Tomsk showed the following. Plumes from two or more pyroCbs that have occurred in North America in a single year are able to markedly increase the aerosol loading compared to the previous year. The annual average value of the integrated aerosol backscatter coefficient increased by 14.8 % in 2017 compared to that in 2016 due to multiple pyroCbs occurring in British Columbia (Canada) in August 2017. The aftereffects of pyroCb events are comparable to those of volcanic eruptions with VEI ≤ 3, but even multiple pyroCbs can hardly compete with volcanic eruptions with VEI = 4.
- Article
(5802 KB) -
Supplement
(9344 KB) - BibTeX
- EndNote


There are many sources of aerosol in the troposphere: bio- and fossil-fuel burning, forest and bush fires, power generation and industrial processes, engines, volcanic eruptions, etc., and conversely, only a few such sources exist in the stratosphere. Aircraft emissions (combustion products of carbon-containing fuels) (Blake and Kato, 1995; Hendricks et al., 2004; Koehler et al., 2009; Wilkerson et al., 2010; Balkanski et al., 2010) and troposphere-to-stratosphere transport of air (Kremser et al., 2016) are responsible for background aerosol loading in the lower stratosphere (LS). Large volcanic eruptions with the volcanic explosivity index (VEI) ≥ 3 represent the principal source of strong and long-term stratospheric aerosol perturbations (Robock, 2000; Robock and Oppenheimer, 2003; Kremser et al., 2016), which is confirmed by both space-borne and ground-based long-term lidar measurements (Vernier et al., 2011; Trickl et al., 2013; Mills et al., 2016; Sakai et al., 2016; Khaykin et al., 2017; Zuev at al., 2017; Friberg et al., 2018). Volcanic plumes persist in the stratosphere for several months to several years, depending on the eruption latitude, VEI, and maximum plume altitude (MPA) after the eruptions (Hofmann et al., 2009). However, studies over the last two decades have revealed that, in addition to volcanic eruptions, there exists another source able to cause short-term, but locally intense, aerosol perturbations in the LS. This source is massive forest (or bush) fires if combustion products from the fires reach stratospheric altitudes.
Massive forest fires (wildfires), the plumes of which can ascend to the LS, and their aftereffects have been intensively studied since the beginning of the 21st century (Fromm et al., 2000, 2005, 2006, 2008a, b, 2010; Fromm and Servranckx, 2003; Jost et al., 2004; Livesey et al., 2004; Damoah et al., 2006; Cammas et al., 2009; Gonzi and Palmer, 2010; Guan et al., 2010; Siddaway and Petelina, 2011; Dahlkötter et al., 2014; Paugam et al., 2016). Smoke plumes of the overwhelming majority of forest fires are located within the planetary boundary layer (Val Martin et al., 2010; Nikonovas et al., 2017; Rémy et al., 2017), and a small number of them (<5 %–10 %) can enter the free troposphere (Sofiev et al., 2013; Peterson et al., 2014). Only in exceptional cases are aerosol plumes from the fires able to reach stratospheric altitudes via convective ascent within pyrocumulonimbus clouds (pyroCb; http://glossary.ametsoc.org/wiki/Pyrocumulonimbus, last access: 13 March 2019). PyroCbs, injecting aerosol directly into the LS, originate mainly from boreal wildfires in North America (particularly in the Canadian boreal zone) and northeastern Asia (Siberia and the Far East) (Fromm et al., 2010; Guan et al., 2010), and bush fires in Australia (Fromm et al., 2006; Siddaway and Petelina, 2011). In particular years, pyroCb events can occur too frequently to be considered as an occasional source of aerosol in the LS. For example, Fromm et al. (2010) identified 17 such pyroCbs in the US and Canada during the summer of 2002, a part of which reached the LS.
PyroCb stratospheric plumes can spread throughout the hemisphere and are detected by both ground- and space-based lidars for 2 to 4 months after their occurrence (Fromm et al., 2000, 2008b, 2010). Owing to their potential impact on the climate, a lot of attention is currently paid to monitoring pyroCbs via, for example, the Geostationary Operational Environmental Satellite (GOES) system (https://www.nasa.gov/content/goes, last access: 13 March 2019). The data on pyroCb events occurring throughout the world are accumulated on the web page of the Cooperative Institute for Meteorological Satellite Studies (CIMSS): http://pyrocb.ssec.wisc.edu/ (last access: 13 March 2019) and their archives have been available since May 2013.
Ground-based lidar observations of stratospheric aerosol perturbations have been almost continuously performed in Tomsk (56.48∘ N, 85.05∘ E, Western Siberia, Russia) for more than 30 years (Zuev et al., 1998, 2001, 2017). In the papers, we mainly discussed and focused on aerosol perturbations in the stratosphere over Tomsk after major volcanic eruptions (with VEI ≥ 3), the plumes of which were able to directly enter the stratosphere. To consider the effect of only volcanic eruptions on stratospheric aerosol loading and definitely exclude from consideration any aerosol perturbations in the upper troposphere (UT) (such as cirrus clouds) and tropopause region (TR), we analyzed the results of lidar measurements at altitudes higher than 13–15 km. It is clear that this altitude limitation could lead to the loss of information on aerosol events like pyroCb plumes in the upper troposphere and lower stratosphere (UTLS) over Tomsk. The possibility to observe stratospheric smoke plumes in Tomsk from massive forest fires occurring in North America was noted in Zuev et al. (2017). In this paper, we analyze aerosol perturbations in the 11–30 km altitude region over Tomsk that could be caused by massive wildfires in North America and northeastern Asia from 2000 to 2017.
The lidar measurements we consider were made using the aerosol channel of the Siberian Lidar Station (SLS) located in Tomsk. The transmitter of the channel represents a Nd:YAG laser (LS-2132T-LBO model, LOTIS TII Co., the Republic of Belarus) that operates at a wavelength of 532 nm with 100 mJ pulse energy and at a pulse repetition rate of 20 Hz. The channel receiver is a Newtonian telescope with a mirror diameter of 0.3 m and a focal length of 1 m. The backscattered signals are registered by a photomultiplier tube R7206-01 (Hamamatsu Photonics, Japan) operating in the photon counting mode with a vertical resolution of 100 m. Owing to the rearrangement and improvement of the SLS, there were two shutdown periods of the aerosol channel from July 1997 to May 1999 and from February to September 2014. A detailed description of the SLS aerosol channel technical parameters is given in Zuev (2000) and Burlakov et al. (2010).
The scattering ratio R532(H) is used to describe the aerosol vertical distribution in the UTLS:
Here and are the altitude-dependent molecular (Rayleigh) and aerosol (Mie) backscatter coefficients, respectively; π denotes the angle of the backscatter lidar signal propagation (i.e., π radian). Stratospheric altitudes of ∼30–35 km over Tomsk are mostly aerosol-free and, therefore, we use an altitude H0=30 km for calibrating the detected lidar signals by normalizing them to the molecular backscatter signal from H0 (Zuev et al., 2017).
The integrated aerosol backscatter coefficient is used to discover the temporal dynamics of aerosol loading in the UTLS over Tomsk in the 2001–2017 period:
where the lower limit H1=11 km can fall within the UT, TR, or LS due to the variability of the local tropopause altitude, and the upper limit is the calibration altitude km. The use of the fixed 11 km altitude is a compulsory measure because there is a problem in determining the tropopause altitude over the lidar site due to the absence of a meteorological station launching radiosondes in Tomsk. Nevertheless, the 11 km lower limit does not allow missing pyroCb plumes from North America and excludes the tropospheric aerosol sources with the exception of cirrus clouds. Moreover, the fixed 11–30 km altitude region allows us (regardless of the real tropopause altitude) to make a comparative analysis of aerosol loading over Tomsk due to both volcanic eruptions and pyroCb events from 2000 to 2017.
To estimate the tropopause altitude over the lidar site, we use vertical temperature profiles from three neighboring meteorological stations launching radiosondes twice a day (at 00:00 and 12:00 UTC). These stations are located in Kolpashevo (58.31∘ N, 82.95∘ E), Emeljanovo (56.18∘ N, 92.61∘ E), and Novosibirsk (54.96∘ N, 82.95∘ E) (Fig. 1), the radiosonde data of which can be found on the web page http://weather.uwyo.edu/upperair/sounding.html?region=np (last access: 13 March 2019) of the University of Wyoming (Kolpashevo, Emeljanovo, and Novosibirsk station numbers are 29231, 29572, and 29634, respectively). The lower boundary of the tropopause is determined by the temperature lapse rate of 2 K km−1 according to the criterion provided by the World Meteorological Organization (WMO, 1957). All temperature profiles and estimated tropopause altitudes that we used in our study are also given in the Supplement. When analyzing perturbed scattering ratio R532(H) profiles, cirrus clouds are excluded from consideration based on the criteria presented in Appendix A.
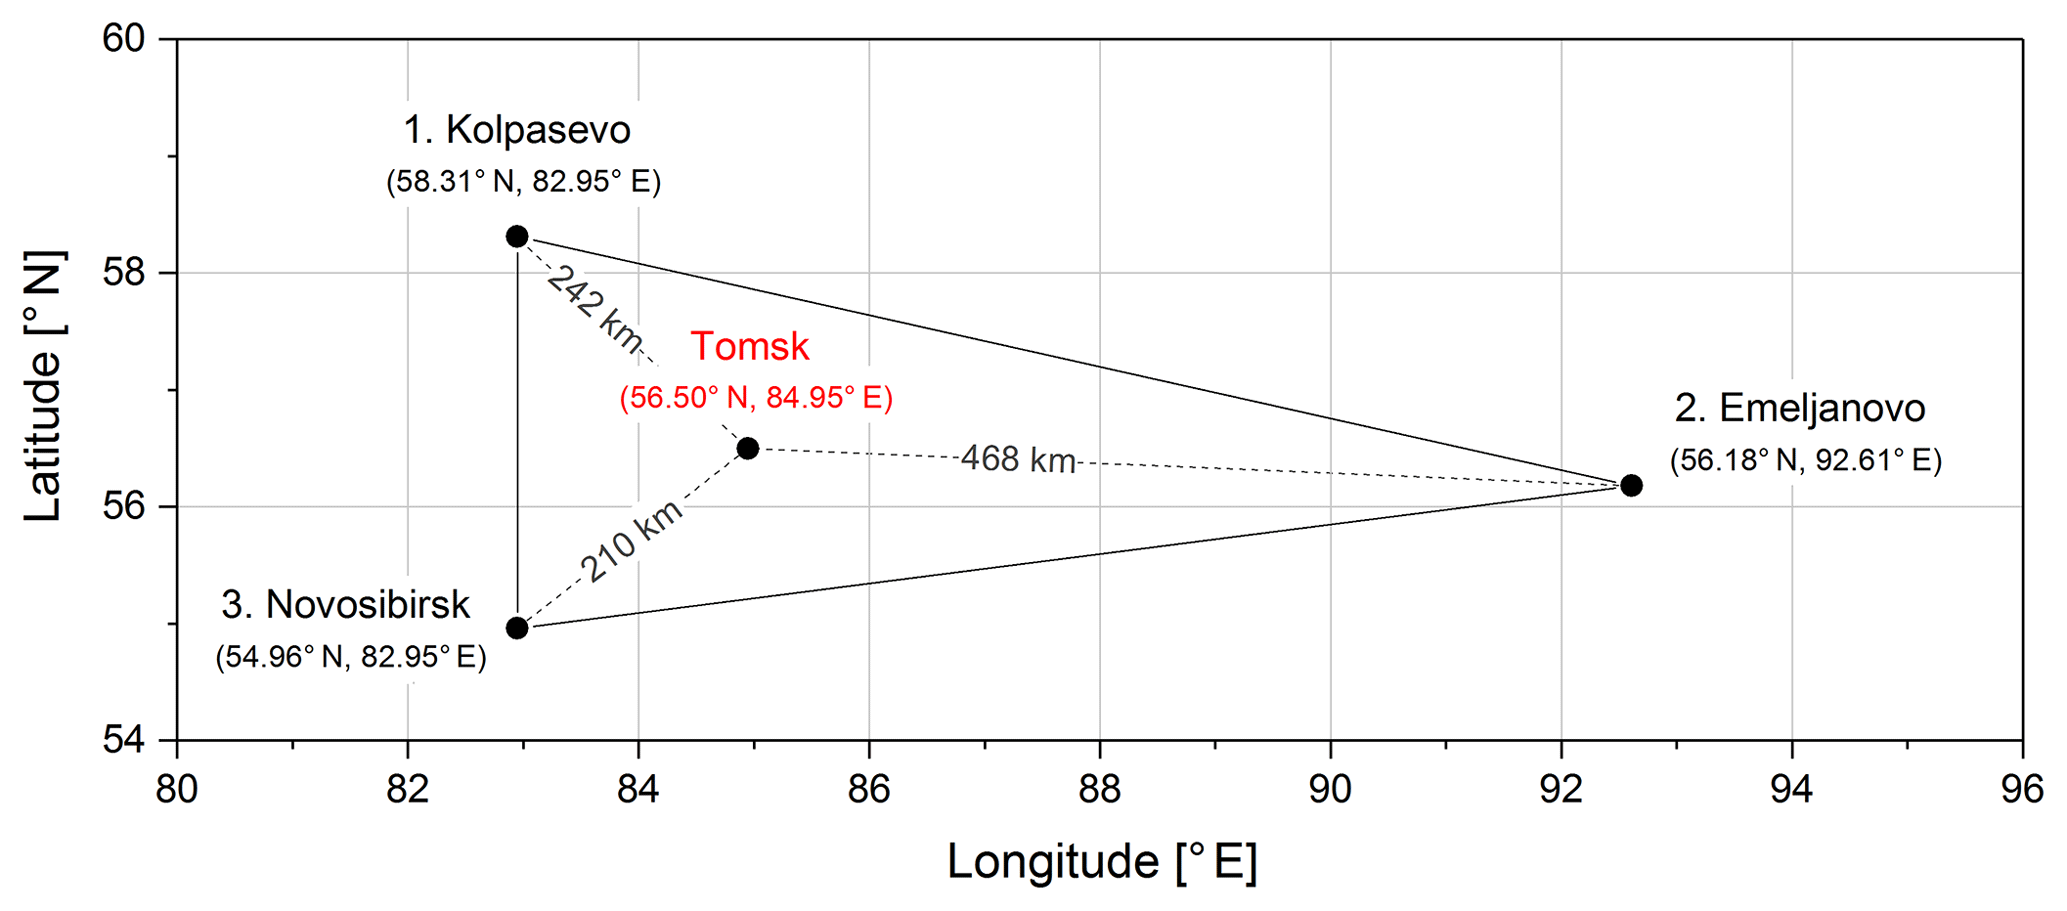
Figure 1Three neighboring meteorological stations (with the distances between them and Tomsk) launching radiosondes twice a day. The stations are numbered for convenience.
We took data on pyroCb events from scientific papers if the events were documented from 2000 to 2012, and at http://pyrocb.ssec.wisc.edu/ (last access: 13 March 2019) for pyroCbs that occurred after May 2013. The required data on volcanic eruptions for the 2004–2017 period were taken from the Smithsonian Institution Global Volcanism Program (GVP; http://volcano.si.edu/, last access: 13 March 2019; Section: Reports; Subsections: Smithsonian/USGS Weekly Volcanic Activity Report and Bulletin of the Global Volcanism Network). To assign aerosol layers detected in the UTLS over Tomsk to their sources (pyroCbs or volcanic eruptions), we analyze air mass backward trajectories calculated with the NOAA's PC Windows-based HYSPLIT trajectory model (February 2018 Release; Stein et al., 2015; http://ready.arl.noaa.gov/HYSPLIT.php, last access: 13 March 2019), the HYSPLIT-compatible NOAA meteorological data from the NCEP/NCAR Reanalysis (2000 to 2003), and the Global Data Assimilation System (GDAS) one-degree (July 2013 and May to August 2017) and half-degree (September 2013 to May 2016) archives.
All altitudes in this study are given above mean sea level (m.s.l.), whereas all dates and times are given in UTC.

Figure 2(a) Detection of the Jasper Fire pyroCb plume in the UTLS over Tomsk. The numbers 2 and 3 indicate the tropopause altitudes estimated in Emeljanovo and Novosibirsk, respectively, at 19:30 UTC on 4 September 2000. (b) Air mass backward ensemble trajectories started from altitudes of 12.0–12.15 km over Tomsk at the same time.
There were no eruptions of either tropical or northern volcanoes to be recorded at the SLS in Tomsk from the middle of 2000 to the end of 2004 and in the 2012–2016 period (Zuev et al., 2017), with the exception of the 13 February 2014 Kelut eruption, the plume of which, however, could not be detected at the SLS due to the 2014 shutdown period (see Sect. 2). When analyzing aerosol layers observed over Tomsk and pyroCb events documented in the Northern Hemisphere over the period 2000–2017, we have discovered more than 100 pyroCbs (with known and unknown MPAs), the plumes of which could potentially be detected in the UTLS over Tomsk. However, only a few of the detected layers have been reliably attributed to the selected pyroCb events using the HYSPLIT trajectory analysis. To illustrate the correlation between the pyroCbs and corresponding layers over Tomsk, we present only the most successful examples of the HYSPLIT trajectories that passed over or close to the places of origin of the pyroCbs (or near the known pyroCb plume locations when the exact coordinates and time of the pyroCb events are unknown). We have also analyzed available CALIPSO data to corroborate the Tomsk observations for the 2013–2017 period. The CALIPSO data are given in the Supplement.
3.1 Detection of pyroCb smoke plumes in the UTLS
The first aerosol layer we consider was observed in the TR over Tomsk at altitudes between 11.4 and 12.5 km with the maximum R(H)=2.42 at H=12.1 km on 4 September 2000 (Fig. 2a). The HYSPLIT trajectory analysis showed that this layer was highly likely to be a smoke plume initially detected in the UTLS over Iowa (∼42∘ N, ∼92∘ W; USA) by the Total Ozone Monitoring Spectrometer (TOMS) on 27 August (Fromm et al., 2010). The plume originated from a pyroCb that occurred due to the massive “Jasper Fire” in the Black Hills National Forest (South Dakota, USA). Figure 2b shows, as an example, three air mass backward trajectories started from altitudes of 12.0–12.15 km over Tomsk at 19:30 on 4 September and passed close to the Jasper Fire pyroCb plume location at altitudes of 9.3–10.2 km on 27 August. According to radiosonde data from two close stations located in Green Bay (44.48∘ N, 88.13∘ W; USA) and Davenport (41.61∘ N, 90.58∘ W; USA), the tropopause was at 15.0–15.9 km on that day. Based upon the end points of the trajectories (with km) and tropopause altitude, the Jasper Fire smoke came to the Tomsk TR from the UT over the place of the pyroCb plume observation in Iowa.
According to Fromm et al. (2010), a pyroCb generated by the “Mustang Fire” was registered with HMPA=13 km on the border of Utah and Wyoming (41.0∘ N, 109.3∘ W; USA) on 1 July 2002. On 15 July, 2 weeks after the event, an aerosol layer was observed in the LS over Tomsk at altitudes of ∼11.7–13.5 km with the maximum R(H)=1.41 at H=12.4 km (Fig. 3a). Figure 3b presents the HYSPLIT air mass backward ensemble trajectories started from altitudes of ∼12.1 km over Tomsk at 17:00 on 15 July and passed near the place of origin of the Mustang Fire pyroCb at altitudes –12.4 km on 1 July. The analysis of radiosonde data from the meteorological station located in Riverton (43.06∘ N, 108.48∘ W; USA) revealed that the tropopause altitude was around 13.0 km on that day and, therefore, we can assume that the pyroCb MPA did not exceed the local tropopause. Air masses containing the Mustang Fire pyroCb plume came to the Tomsk LS from the UT over a place close to the pyroCb origin.
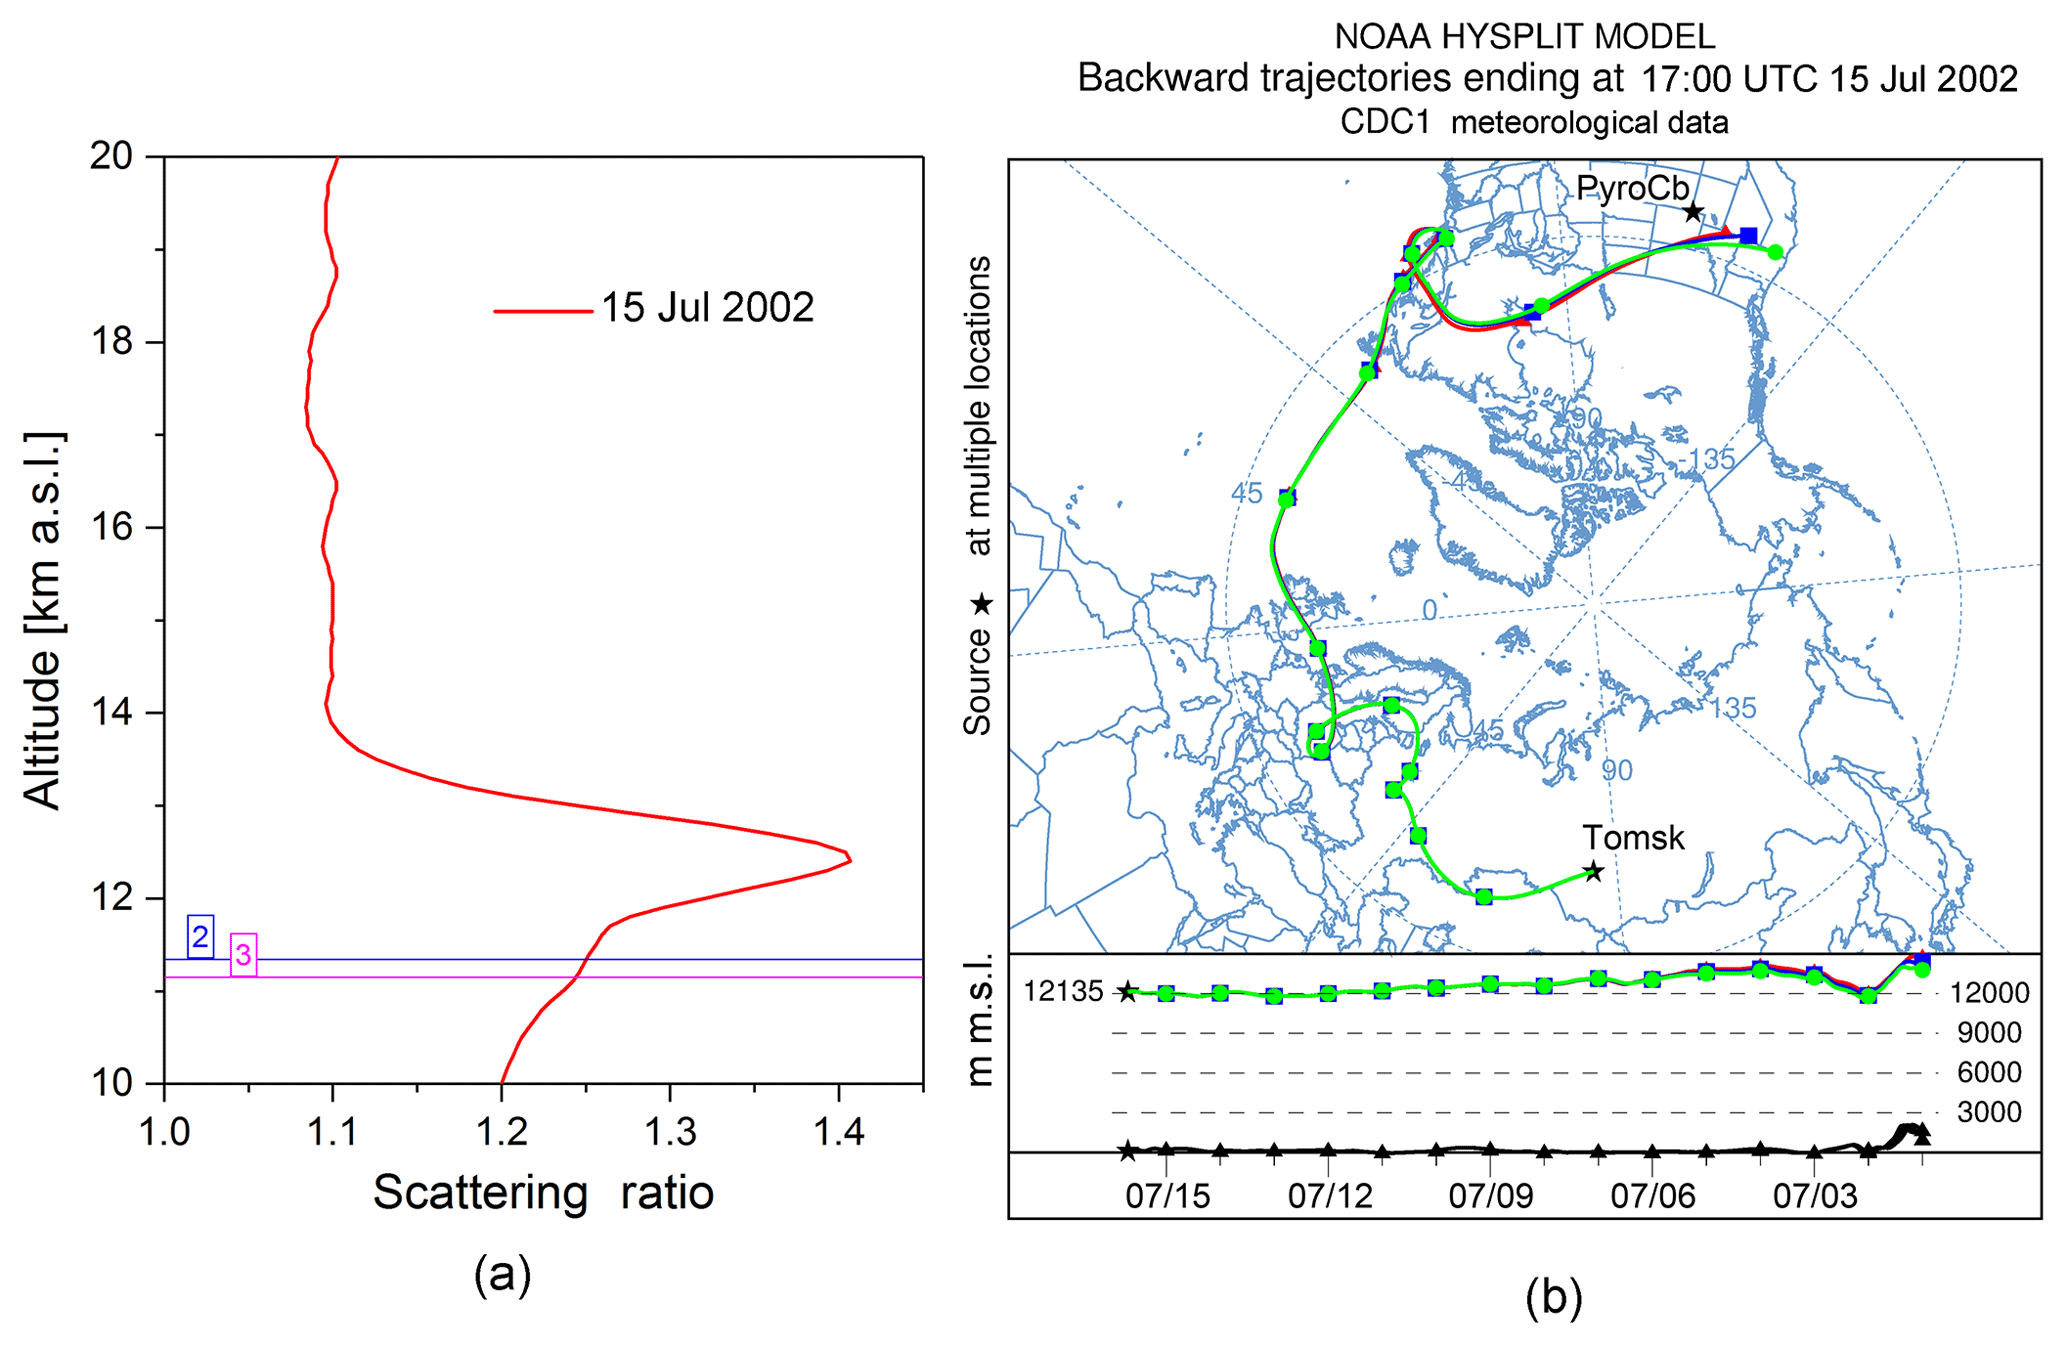
Figure 3(a) Detection of the Mustang Fire pyroCb plume in the LS over Tomsk. The numbers 2 and 3 indicate the tropopause altitudes estimated in Emeljanovo and Novosibirsk, respectively, at 17:00 UTC on 15 July 2002. (b) Air mass backward ensemble trajectories started from altitudes of ∼12.1 km over Tomsk at the same time.

Figure 4(a) Detection of the Conibear Lake Fire pyroCb plume in the UT–TR over Tomsk. The numbers 1–3 indicate the tropopause altitudes estimated in Kolpashevo, Emeljanovo, and Novosibirsk, respectively, at 17:00 UTC on 29 August 2003. (b) Air mass backward ensemble trajectories started from altitude of ∼11.7 km over Tomsk at the same time.
Another aerosol layer potentially associated with a pyroCb event was observed in the UT–TR over Tomsk between 10 and 12 km with the maximum R(H)=1.87 at H=11.1 km on 29 August 2003 (Fig. 4a). On 18 August, 11 days earlier, a pyroCb plume was registered over Hudson Bay (61∘ N, 89∘ W; Canada) by the TOMS. The pyroCb was previously generated by the “Conibear Lake Fire” in the Wood Buffalo National Park (Alberta–Northwest Territories, Canada) (Fromm et al., 2010). As seen in Fig. 4b, the HYSPLIT air mass backward trajectories, started from altitudes of ∼11.7 km over Tomsk at 17:00 on 29 August, passed over the pyroCb plume location at altitudes –11.9 km on 18 August. Radiosonde data from the Churchill station (58.73∘ N, 94.08∘ W; Canada) to the west of the plume registration showed the tropopause altitude of ∼11.4 km. According to the Inukjuak station (58.45∘ N, 78.11∘ W; Canada) to the east of the plume registration, the tropopause was at ∼11.9 km on that day. Thus, we can conclude that the Conibear Lake Fire smoke came to the Tomsk UT–TR from the UT–TR over Hudson Bay.
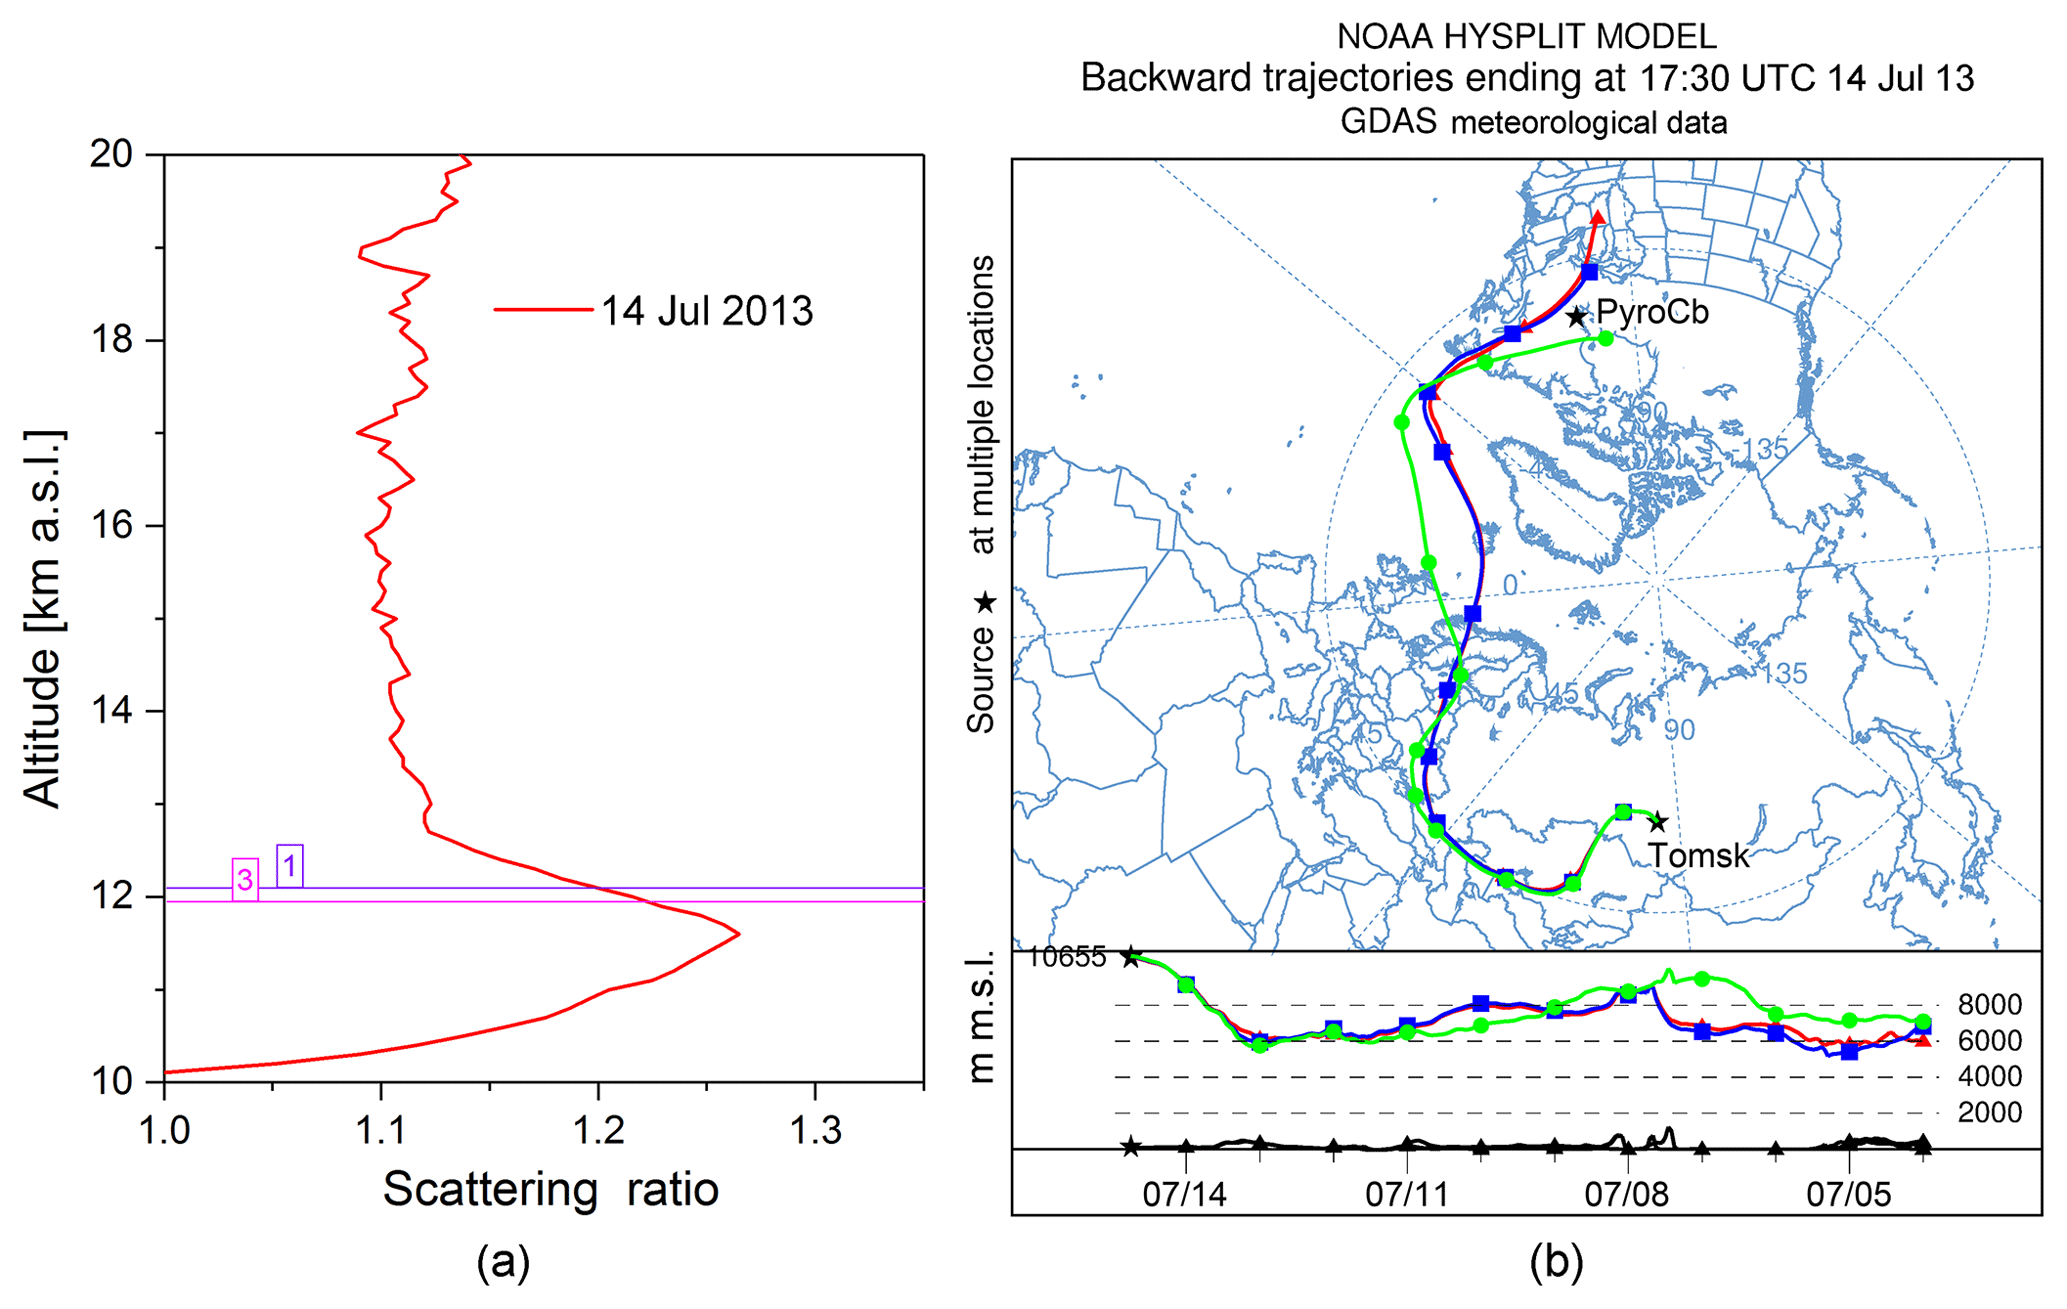
Figure 5(a) Detection of the Eastmain pyroCb plume in the UT–TR over Tomsk. The numbers 1–3 indicate the tropopause altitudes estimated in Kolpashevo, Emeljanovo, and Novosibirsk, respectively, at 17:30 UTC on 14 July 2013. (b) Air mass backward ensemble trajectories started from altitude of 10.6–10.7 km over Tomsk at the same time.
The next aerosol layer reliably attributed to a pyroCb event was registered at the SLS in Tomsk 10 years later, in July 2013. Namely, the layer with the maximum R(H)=1.27 at H=11.7 km was observed in the UT–TR over Tomsk on 14 July 2013 (Fig. 5a). The HYSPLIT trajectory analysis showed that the layer could represent a smoke plume from a pyroCb generated by large fires that were burning in the Eastmain region of Quebec (∼52∘ N, ∼78∘ W; Canada) in June–July 2013. The Eastmain pyroCb was discovered using the 1 km resolution GOES-13 0.63 µm visible channel after 21:55 on 4 July (http://pyrocb.ssec.wisc.edu/archives/136, last access: 13 March 2019). Figure 5b shows three example HYSPLIT air mass backward trajectories started from altitudes of 10.6–10.7 km over Tomsk at 17:30 on 14 July and passed near the place of origin of the Eastmain pyroCb at altitudes of 5.5–7.2 km on 4 July. The analysis of radiosonde data from the station located in Moosonee (51.26∘ N, 80.65∘ W; Canada) revealed that the tropopause altitude was varying from 10.9 to 11.8 km during the afternoon of 4 July, whereas the data from the La Grande Iv station (53.75∘ N, 73.66∘ W; Canada) showed that the local tropopause was around 11.0 km at 00:00 on 5 July. Based upon the behavior of the HYSPLIT trajectories (Fig. 5b), the pyroCb plume was spreading in the middle and upper troposphere before reaching the UT–TR over Tomsk on 14 July. Note that the aftereffects of the summer 2013 fire season in North America were also widely observed in the troposphere over central Europe (Trickl et al., 2015; Markowicz et al., 2016).
Only one aerosol layer associated with pyroCb events was detected in the TR–LS over Tomsk in 2015. More precisely, the layer was observed between 10.1 and 12.0 km, with the maximum R(H)=1.62 at H=11.0 km on 16 July (Fig. 6a). On 11 July, 5 days before, two pyroCbs were registered in British Columbia using the GOES-15 0.63 µm visible, 3.9 µm IR, and 10.7 µm IR channels (http://pyrocb.ssec.wisc.edu/archives/985, last access: 13 March 2019). The former pyroCb was observed at 56.4∘ N, 123.9∘ W with HMPA=10.5 km around 00:30, whereas the latter one was detected at 52.2∘ N, 124∘ W with HMPA=10 km 4.5 h later, at ∼05:00. As seen in Fig. 6b, three HYSPLIT backward trajectories that started from altitudes of 10.3–10.5 km over Tomsk at 18:00 on 16 July passed near and over the place of the former pyroCb origin at altitudes –11.5 km on 11 July. According to the station located in Prince George (53.90∘ N, 122.80∘ W; Canada), the lower boundary of the tropopause was at ∼12.2 km at 00:00 on that day. Therefore, the pyroCb plume with HMPA=10.5 km did not exceed the local tropopause and came to the TR–LS over Tomsk from the UT over the place of the pyroCb origin in British Columbia. We could not connect the aerosol layer under consideration with the latter pyroCb event.
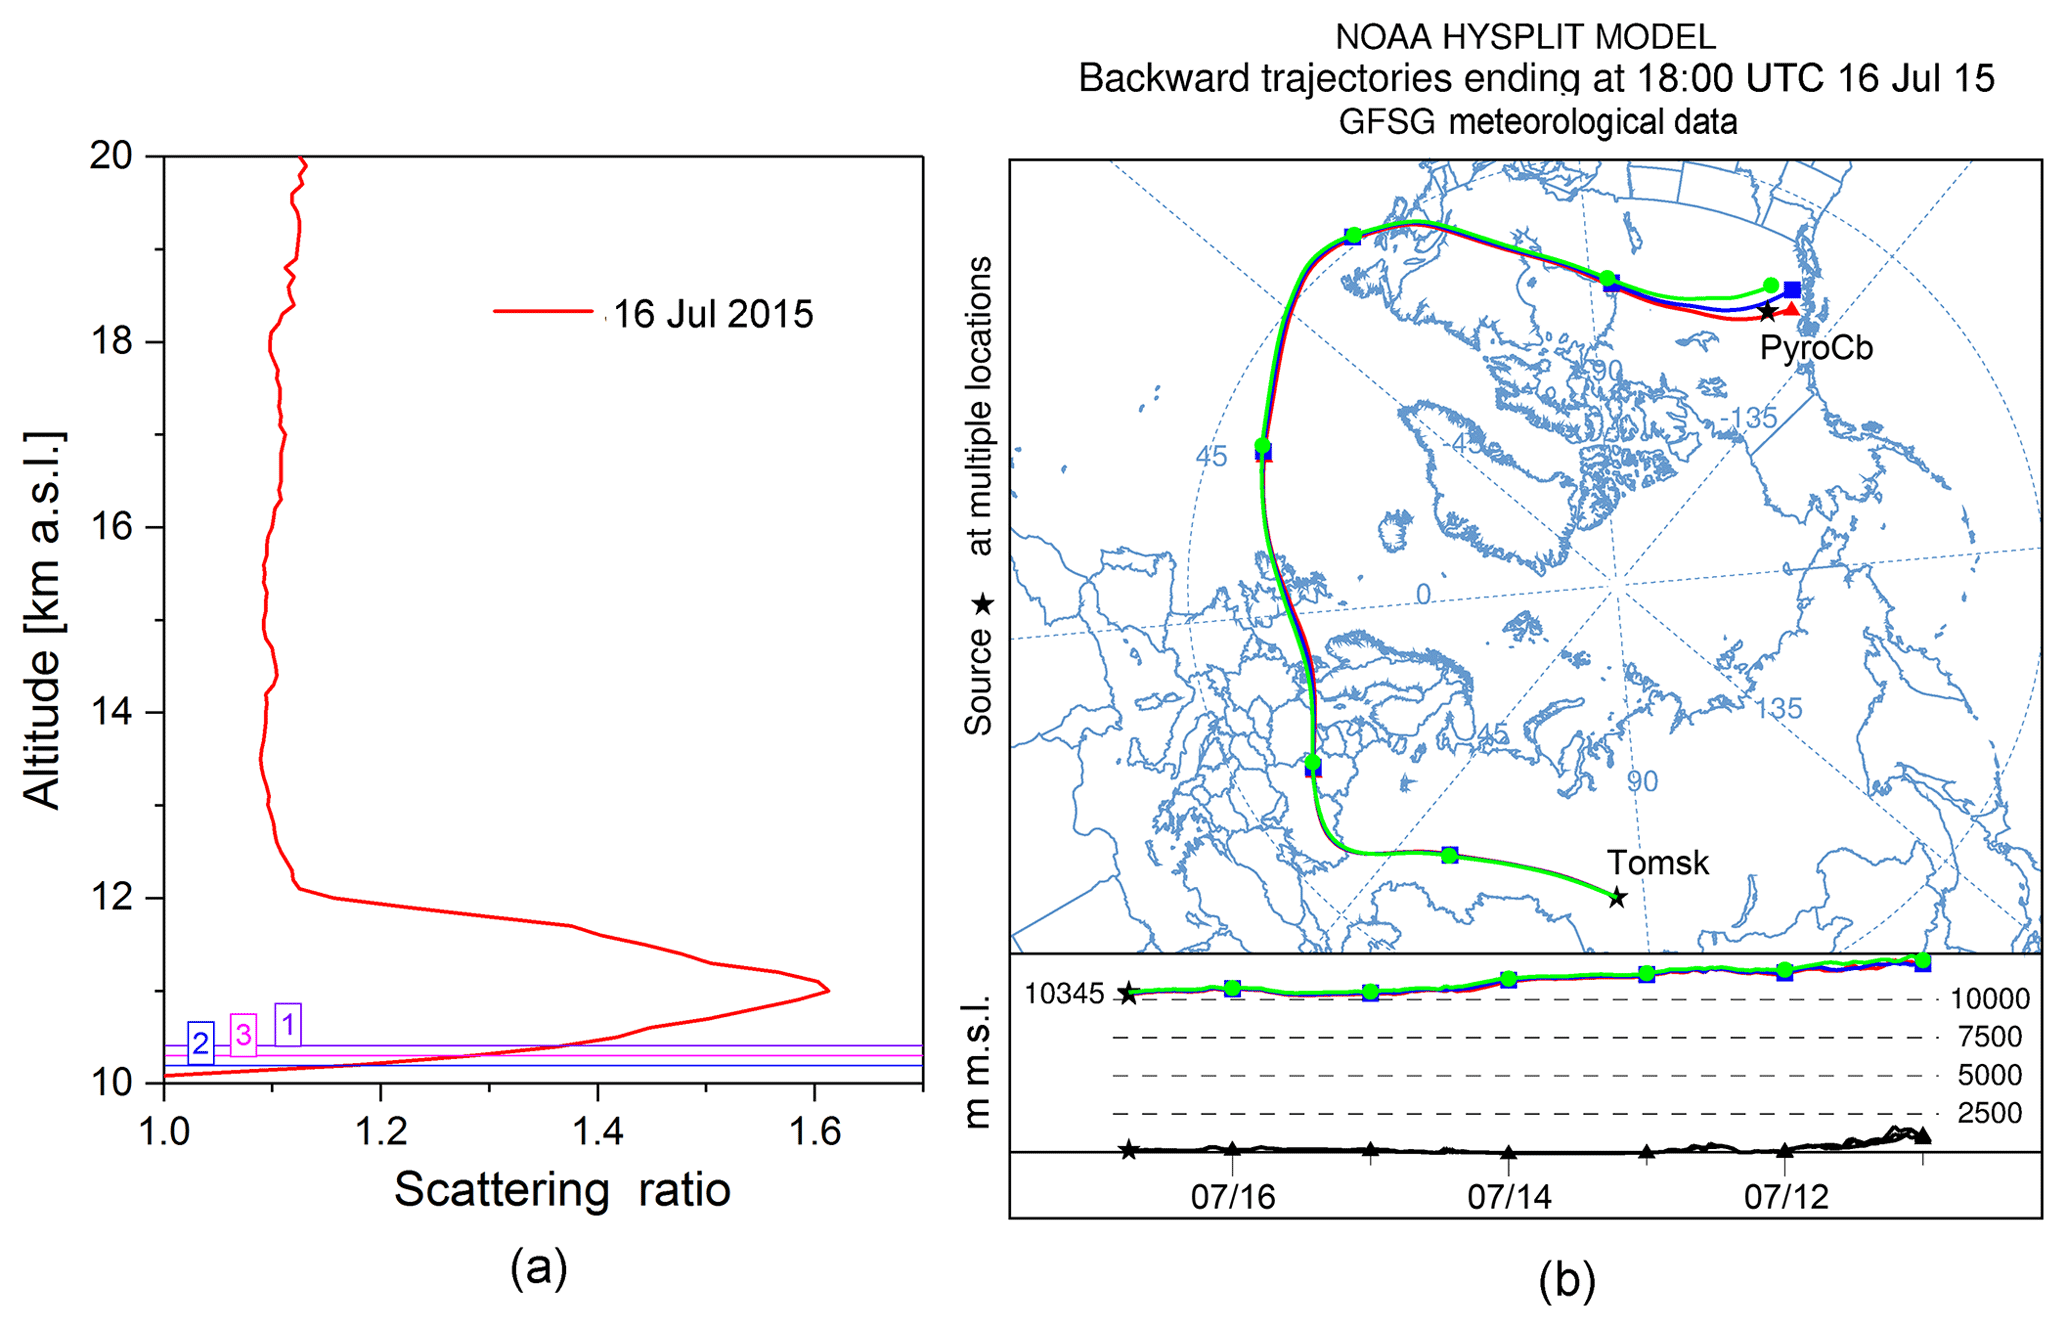
Figure 6(a) Detection of a pyroCb plume from British Columbia in the TR–LS over Tomsk. The numbers 1–3 indicate the tropopause altitudes estimated in Kolpashevo, Emeljanovo, and Novosibirsk, respectively, at 18:00 UTC on 16 July 2015. (b) Air mass backward ensemble trajectories started from altitude of 10.3–10.5 km over Tomsk at the same time.
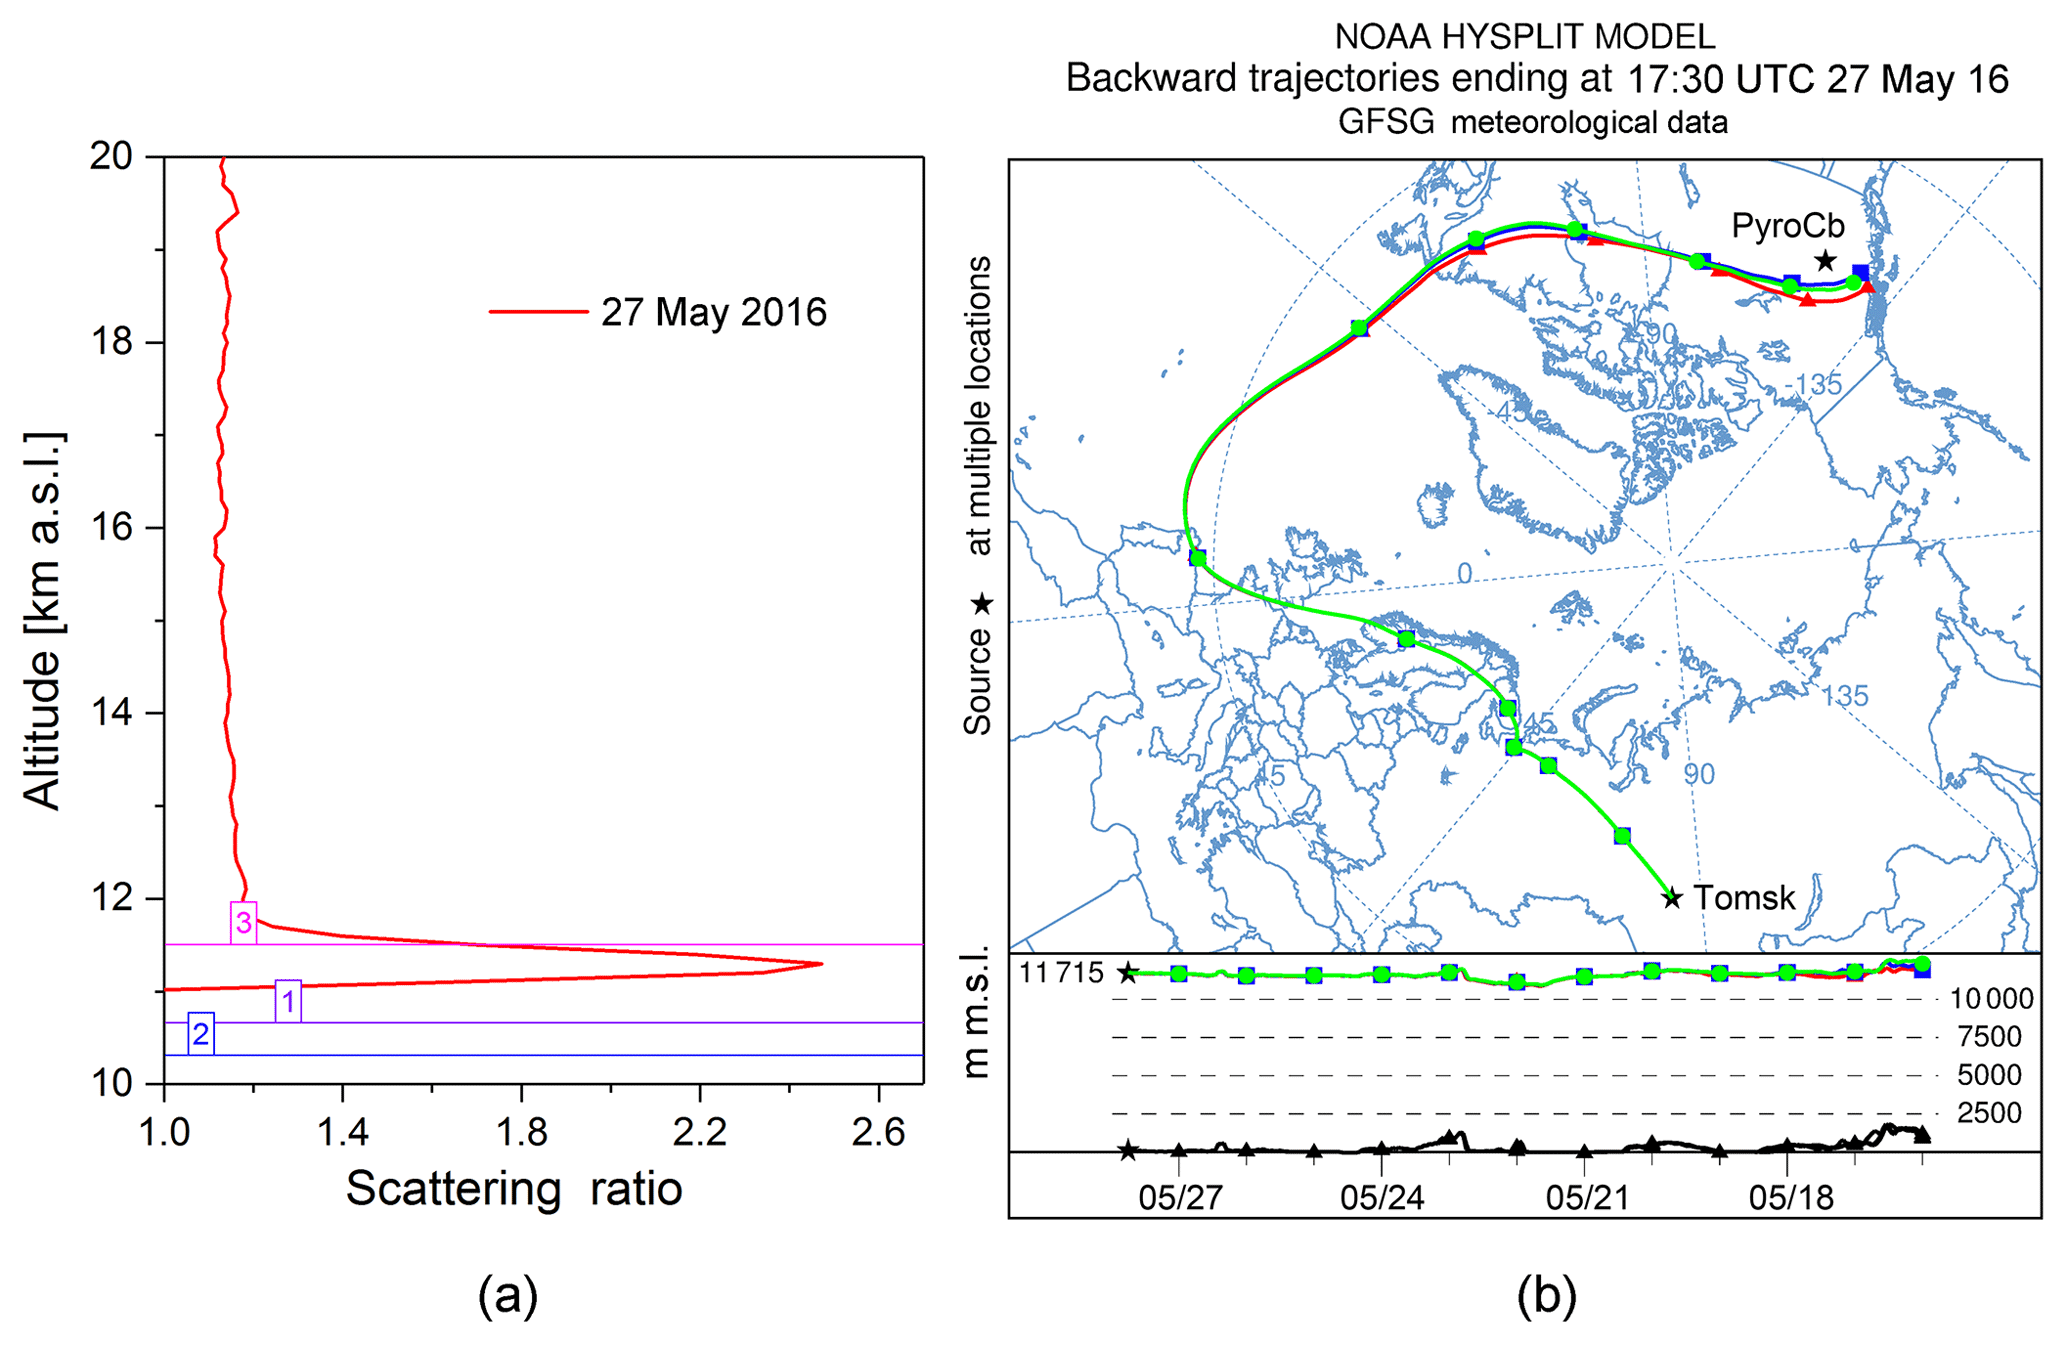
Figure 7(a) Detection of a pyroCb plume from British Columbia in the TR–LS over Tomsk. The numbers 1–3 indicate the tropopause altitudes estimated in Kolpashevo, Emeljanovo, and Novosibirsk, respectively, at 17:30 UTC on 27 May 2016. (b) Air mass backward ensemble trajectories started from altitude of ∼11.7 km over Tomsk at the same time.
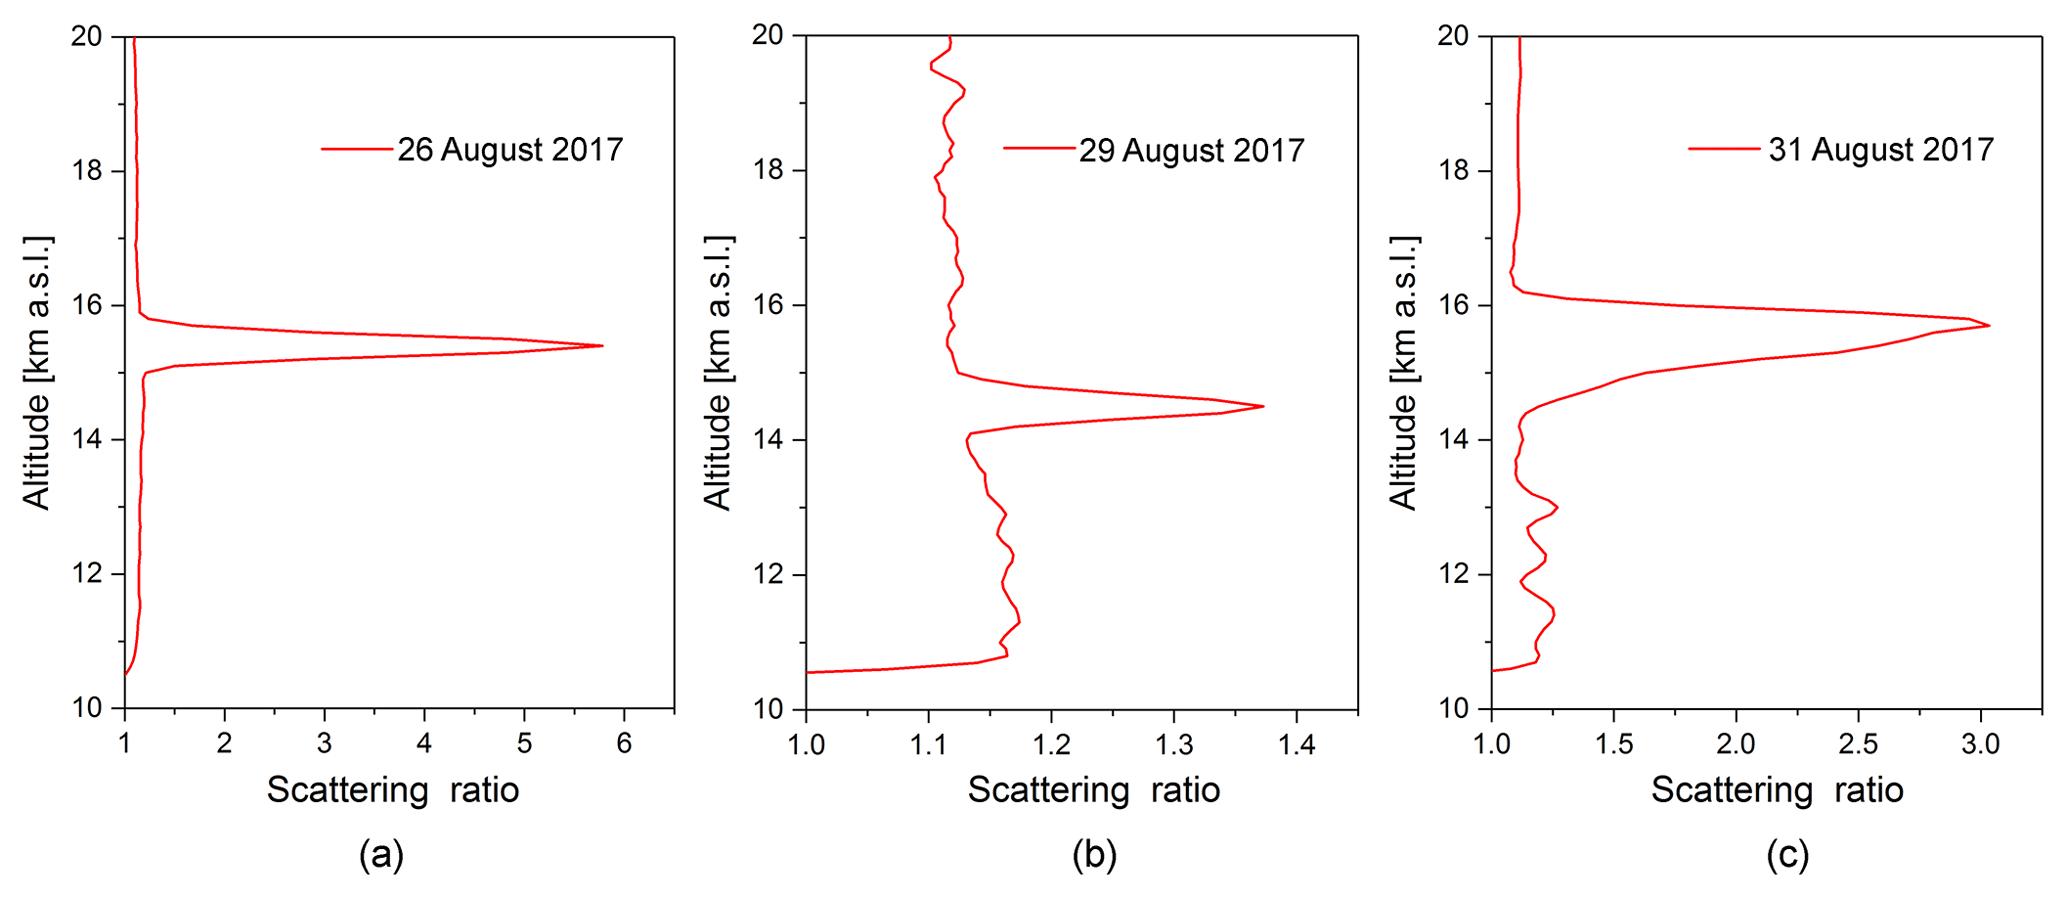
Figure 8(a–c) Detection of pyroCb plumes from British Columbia in the LS over Tomsk on 26, 29, and 31 August 2017, respectively.
Another marked pyroCb formed in British Columbia was observed at ∼56∘ N, ∼122∘ W by the GOES-15 visible and IR channels at 22:00 on 16 May 2016 (http://pyrocb.ssec.wisc.edu/archives/1622, last access: 13 March 2019). On 27 May, 11 days after the event, a thin aerosol layer with a thickness of ∼0.8 km and the maximum R(H)=2.48 at H=11.3 km was detected in the TR–LS over Tomsk (Fig. 7a). Figure 7b presents the HYSPLIT backward ensemble trajectories started from altitudes of ∼11.7 km over Tomsk at 17:30 on 27 May and then passed close to the place of the pyroCb origin at altitudes –10.8 km on 16 May. Radiosonde data from the Fort Nelson station (58.83∘ N, 122.60∘ W; Canada) showed the tropopause altitude of around 11.1 km on that day. Hence, air masses containing the pyroCb plume came to the Tomsk TR–LS from the UT over a place close to the pyroCb origin. The smoke from the pyroCb was also observed in the UTLS over the UK with Raman lidars between 23 and 31 May 2016 (Vaughan et al., 2018).
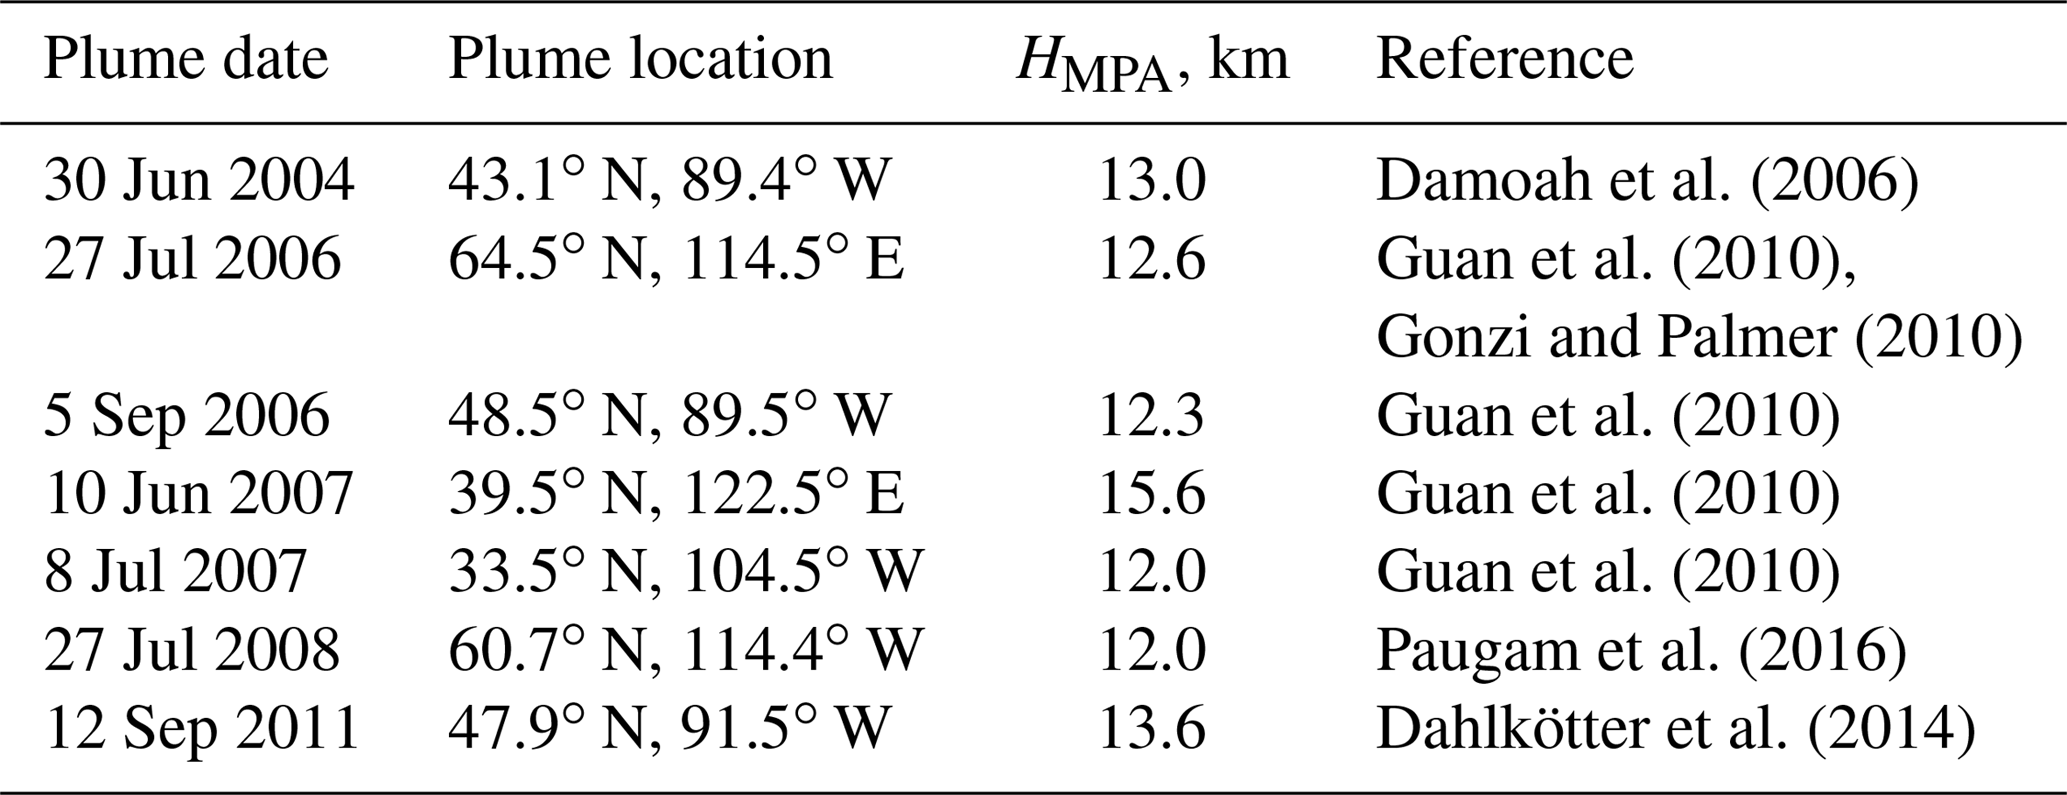
Table 1List of biomass burning plumes with HMPA≥12 km that were documented in the Northern Hemisphere and could potentially be detected in the UTLS over Tomsk in the 2004–2011 period. MPA: maximum plume altitude.
In August 2017, massive forest fires in British Columbia generated several strong pyroCbs, the plumes of which reached stratospheric altitudes. The aftereffects of these Canadian wildfires and pyroCb events were widely observed in the UTLS over Europe in August and September 2017 and have already been intensively studied by different research groups (Ansmann et al., 2018; Haarig et al., 2018; Khaykin et al., 2018; Hu et al., 2019; Peterson et al., 2018). We could attribute three aerosol layers observed in the LS over Tomsk at the end of August to two out of five pyroCbs detected by the GOES-15 instruments at 51.8∘ N, 123.2∘ W and 53.1∘ N, 121.0∘ W at around 03:30 and 05:30 on 12 August, respectively (http://pyrocb.ssec.wisc.edu/archives/2135, last access: 13 March 2019). The first aerosol layer was observed between 15.0 and 15.8 km with the maximum R(H)=5.8 at H=15.4 km 2 weeks after the event, on 26 August (Fig. 8a). On 29 August, 3 days later, the second layer was detected with the maximum R(H)=1.37 at H=14.5 km (Fig. 8b). Finally, the third layer was observed between 14.3 and 16.2 km with the maximum R(H)=3.1 at H=15.7 km on 31 August (Fig. 8c). The initial conditions (times and altitudes over Tomsk) for each HYSPLIT trajectory can be found in Fig. 9. All the HYSPLIT backward trajectories that started over Tomsk on 26, 29, and 31 August passed close to the places of origin of both pyroCbs at altitudes of 13.7–13.9, 13.5–13.7, and 14.4–15.1 km, respectively, on 12 August. According to the stations located in Prince George (53.90∘ N, 122.80∘ W; Canada) and Port Hardy (50.68∘ N, 127.36∘ W; Canada), the tropopause altitude was not higher than 12.3 km on that day. Therefore, based upon the behavior of the HYSPLIT trajectories (Fig. 9), smoke plumes from both pyroCbs were spreading in the LS before reaching Tomsk at the end of August. This conclusion is also confirmed by the CALIPSO data (see the Supplement). We cannot exclude that the layers observed over Tomsk on 26, 29, and 31 August could contain aerosol from the other three pyroCbs detected by the NOAA-18 instruments on the evening of 12 August.
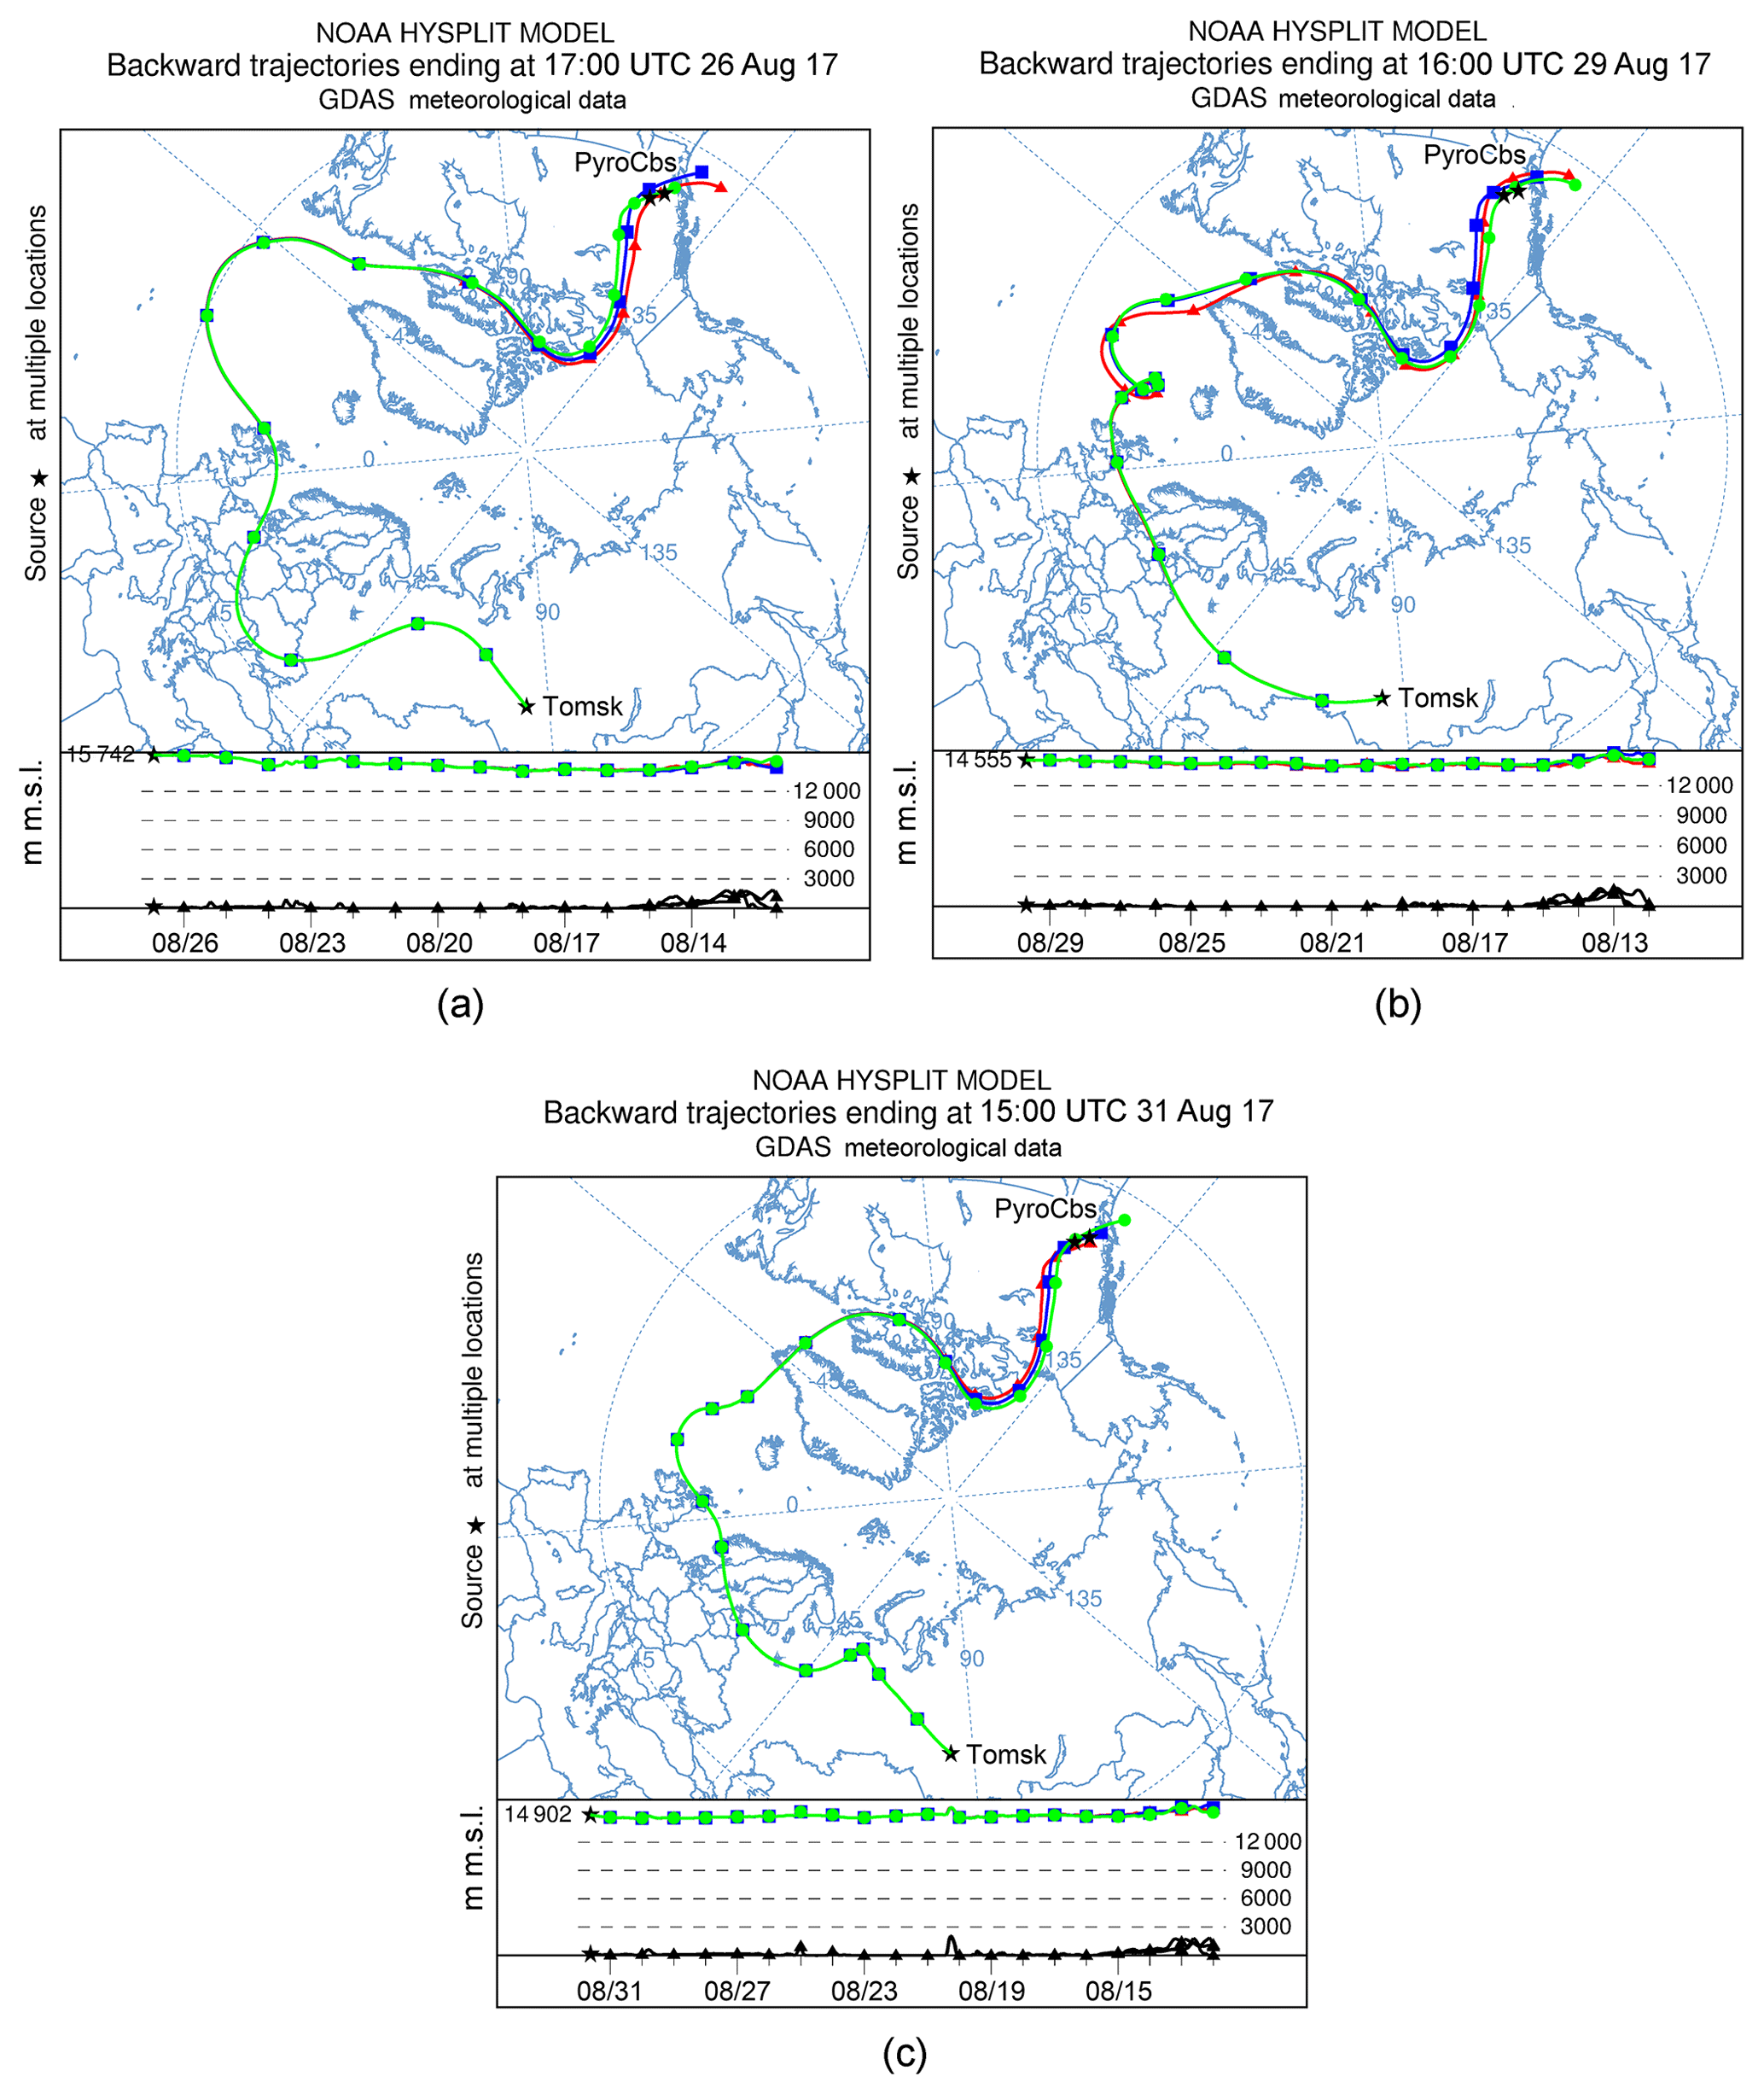
Figure 9Air mass backward ensemble trajectories started from altitude of (a) ∼15.75 km over Tomsk at 17:00 UTC on 26 August 2017, (b) ∼14.55 km at 16:00 UTC on 29 August 2017, and (c) ∼14.9 km at 15:00 UTC on 31 August 2017.
3.2 PyroCb events in 2004–2012
Several biomass burning plumes with HMPA≥12 km, which resulted from pyroCbs and could potentially be detected over Tomsk, were documented in the UTLS of the Northern Hemisphere between 2004 and 2011 (Table 1). However, no aerosol layers associated with these plumes were observed at the SLS during the period. This was due to unfavorable weather conditions (rain, snow, fog, clouds) in Tomsk, or pyroCb plumes could have diffused or passed by the SLS and, therefore, might not be detected. Note also that 12 explosive eruptions with VEI = 3–4 of both tropical and northern extratropical volcanoes, the aftereffects of which were reliably registered in the stratosphere over Tomsk, occurred in the 2004–2011 period (Zuev at al., 2017). We do not exclude that pyroCb plumes could hardly be discerned against the background of the volcanic plumes in the UTLS over Tomsk in this period. There were no significant events (volcanic eruptions and pyroCbs) to be recorded at the SLS in 2012.
To estimate the contribution of the pyroCb events discussed above to aerosol loading of the UTLS over Tomsk, we have analyzed the 2001–2017 time series of the annual average values (see Sect. 2). The upper part of Fig. 10 presents both the 10-day and annual average values obtained from the SLS observations. Due to weather conditions in Tomsk, the observations are often irregular in time and periods without lidar measurements can last up to several months. To obtain a homogeneous time series of values for the time intervals when measurement data are available, all the data for every 10-day period are averaged. The average values for the periods from days 1 to 10, 11 to 20, and 21 to 30 (31) of a month are assigned to the 5th, 15th, and 25th days of the month, respectively. The same data processing method was used in Zuev et al. (1998, 2017). The annual average values are assigned to 1 July of the corresponding year. PyroCb events and volcanic eruptions (Tables 2 and 3), the plumes of which were observed in the UTLS over Tomsk between 2000 and 2017, are indicated by red and black vertical bars, respectively, in the lower part of Fig. 10.

Figure 10The 2001–2017 time series of the integrated aerosol backscatter coefficient obtained from lidar observations at λ=532 nm in the 11–30 km altitude range. Open dark-green circles denote the 10-day average values; solid red circles show the annual average values assigned to 1 July of each year. Red and black vertical bars in the lower part of the figure indicate, respectively, pyroCbs and volcanic eruptions (see also Tables 2 and 3), the plumes of which were observed in the UTLS over Tomsk between 2000 and 2017. The black sloping lines show the trends in the annual average values for the 2001–2004, 2004–2011, and 2011–2017 periods.
Table 2List of documented pyroCbs, the plumes of which perturbed the UTLS over Tomsk during the 2000–2017 period.
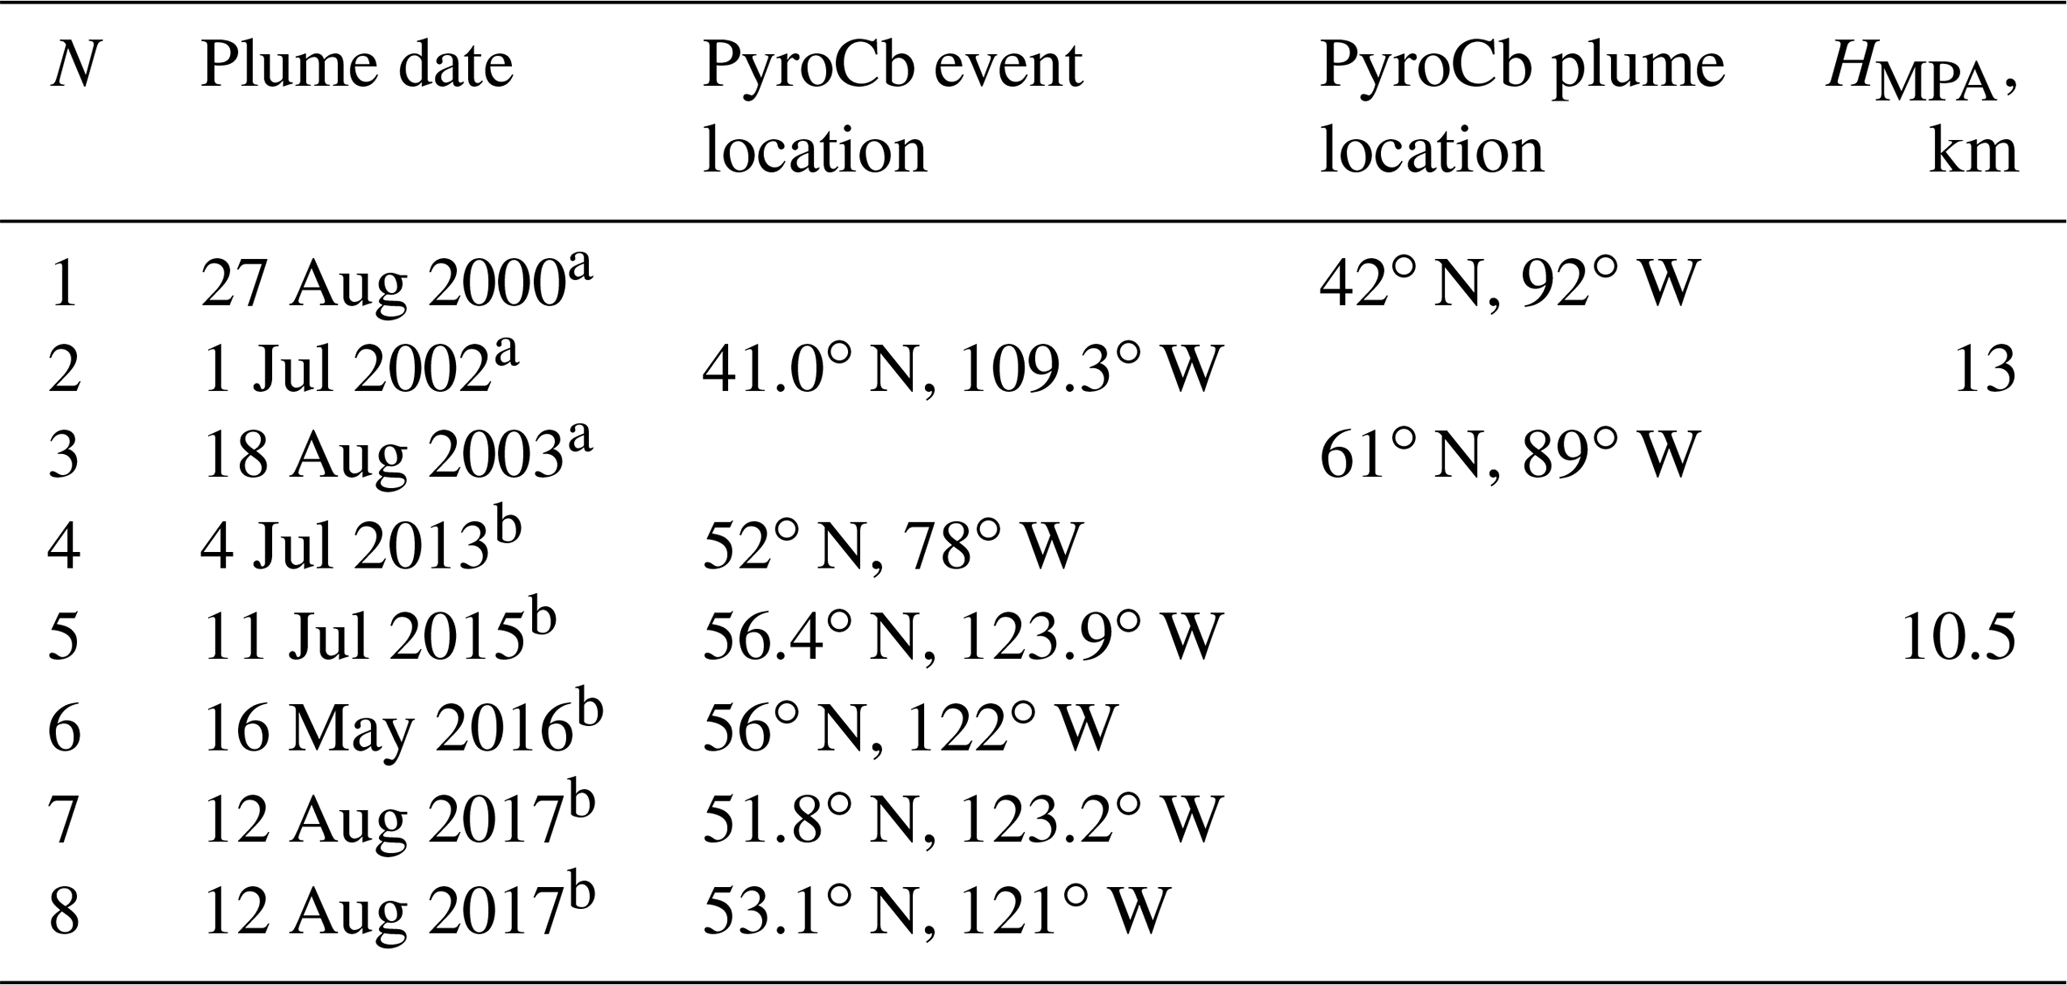
a Fromm et al. (2010); b http://pyrocb.ssec.wisc.edu/ (last access: 13 March 2019).
Table 3List of volcanic eruptions that have perturbed the UTLS over Tomsk from 2004 to the present day. The list was retrieved from the GVP data.
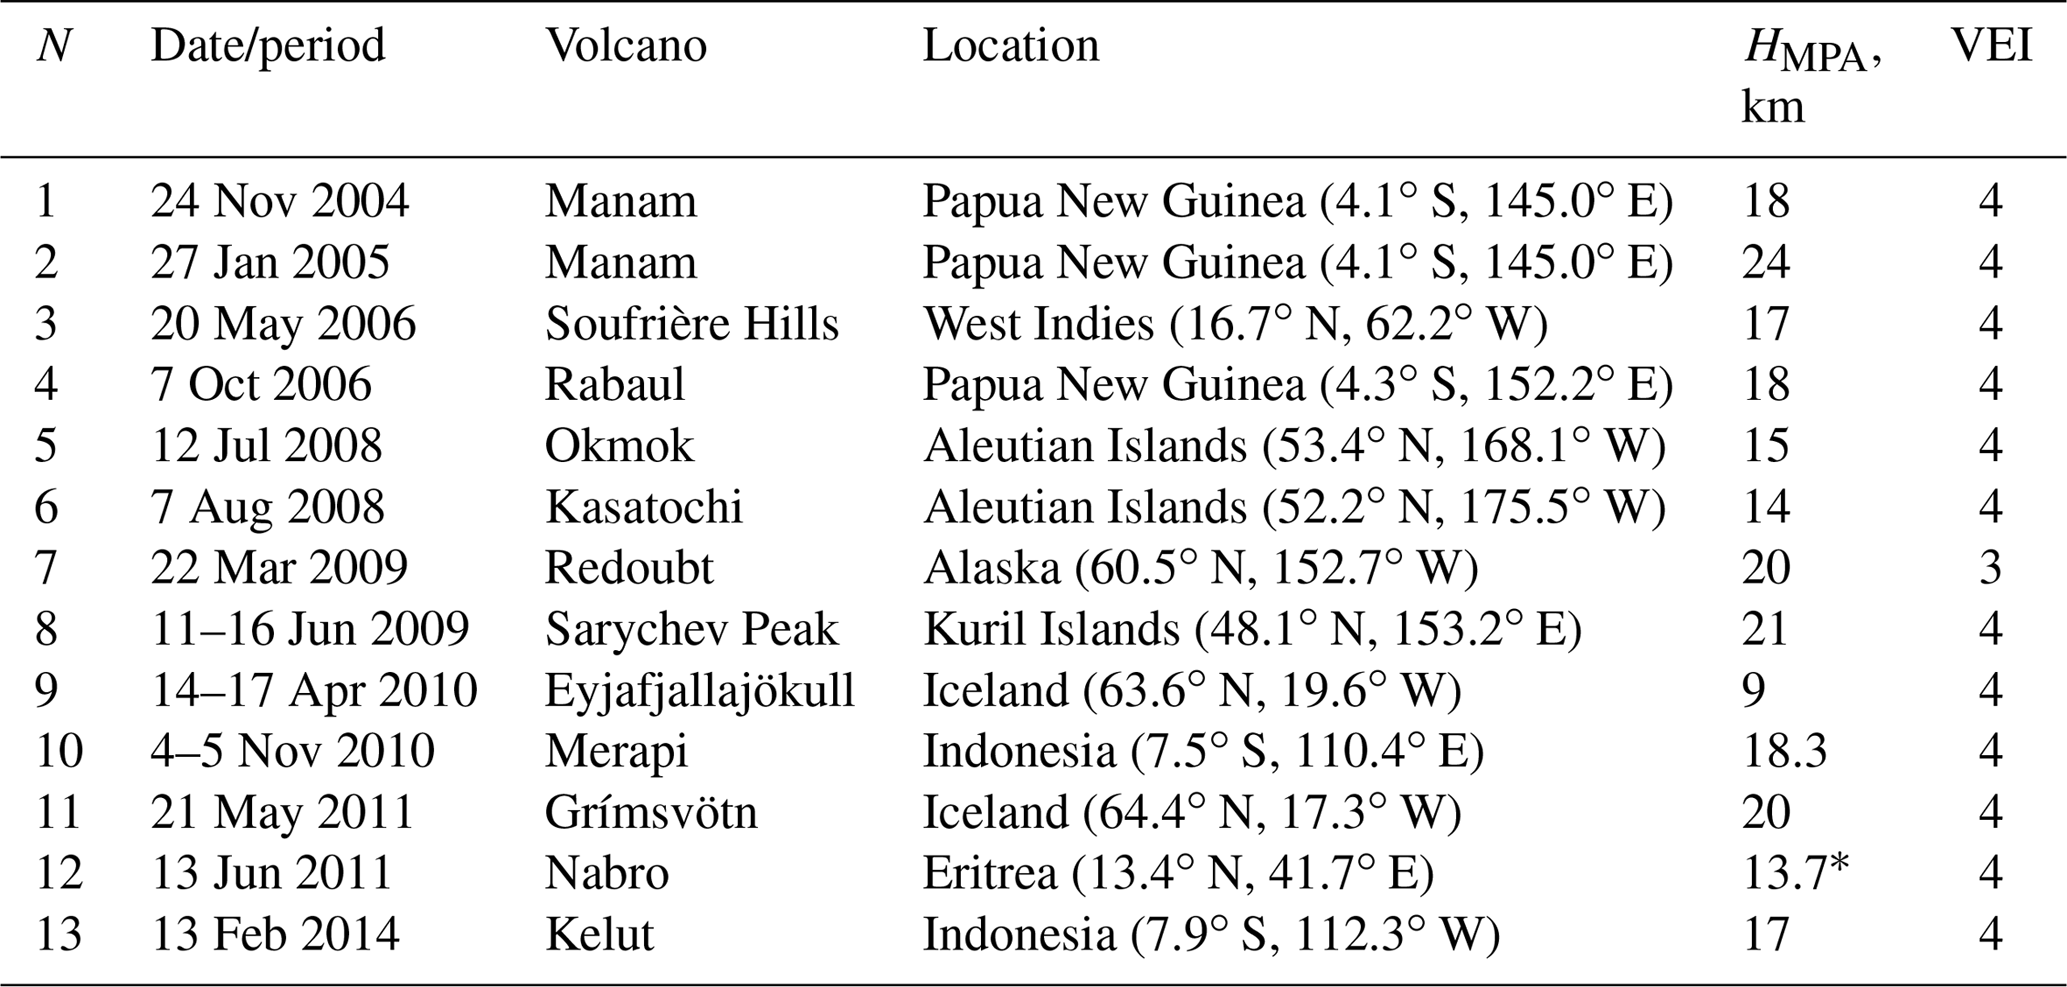
* ∼18 km (Fromm et al., 2014).
The time series can be divided into three periods with different trends in the annual average values: 2001–2004, 2004–2011, and 2011–2017 (Fig. 10). The first 2001–2004 period (a) is marked by a negative trend in the values caused by the absence of volcanic eruptions with VEI ≥ 3 in the Northern Hemisphere. Despite the fact that three pyroCb plumes were detected from 2000 to 2003, the minimum (background) annual average sr−1 was reached in 2004. Note that when integrating the aerosol backscatter coefficient over the 15–30 km altitude range, the minimum annual average sr−1 is also reached in 2004 (Zuev et al., 2017). During the second 2004–2011 period (b), the aftereffects of 12 volcanic eruptions (Table 3) measurably perturbed the UTLS over Tomsk and, therefore, were registered at the SLS. This volcanic activity led to a positive trend in the annual average values. The last 2011–2017 period (c) is characterized by comparatively low activity of both tropical and northern volcanoes. Only the 2014 Mt. Kelut volcanic eruption could slightly perturb the UTLS over Tomsk in a given period of time (Table 3). Thus, a negative trend in the annual average values was observed in spite of five pyroCbs that injected smoke into the UTLS in 2013 and 2015–2017 (Table 2).
The trends in Fig. 10 show that for the Tomsk region the aftereffects of tropical and northern volcanic eruptions with VEI ≥ 3 are stronger and longer-lasting than those of pyroCb events that occurred mainly due to wildfires in North America. Indeed, volumes and lifetimes of primary (volcanic ejecta) and secondary (sulfuric acid) aerosols in the UTLS from explosive volcanic eruptions are known to be higher (Hofmann et al., 2009) compared to those of aerosols from pyroCb plumes (Fromm et al., 2010). Hence, volcanic eruptions for period (b) naturally led to an increase in aerosol loading of the UTLS over Tomsk and, therefore, to a positive trend in the annual average values. PyroCbs generated by wildfires from 2004 to 2011 (including documented ones listed in Table 1) also had to perturb the UTLS over Tomsk. But the use of our single-wavelength lidar with no depolarization information makes it impossible to unambiguously discern the pyroCb plumes against the background of more powerful volcanic plumes for the same period. Nevertheless, a comparison of the annual average values in periods (a) and (c) of volcanic quiescence with those in period (b) of volcanic activity shows that the positive trend in the period 2004–2011 should have been mostly caused by volcanic eruptions. The same conclusion was reached by Zuev et al. (2017) when integrating over the 15–30 km altitude range.
The presence of pyroCb plumes in the UTLS over Tomsk in periods (a) and (c) did not allow the annual average values to decrease to the background level (as it was in 2004 in the absence of both volcanic and pyroCb plumes). On the other hand, plumes from two or more pyroCbs that have occurred in North America in a single year are able to markedly increase aerosol loading of the UTLS over Tomsk compared to the previous year (Fig. 10). For example, the annual average reached a value of sr−1 due to pyroCbs 7 and 8 (Table 2) occurred in 2017 (by comparison, sr−1 in 2016). This substantiates the assumption that the effect of pyroCbs on aerosol loading of the UTLS sometimes can be comparable to that of volcanic eruptions (Fromm et al., 2010).
The increasing number and intensity of boreal forest fires in North America and northeastern Asia due to climate warming over the last decades (Wotton et al., 2010, 2017; Sofiev et al., 2013; Rémy et al., 2017) lead to an increasing number of pyroCbs, the plumes of which are able to reach the UTLS (Fromm et al., 2010; Guan et al., 2010). Boreal wildfires are usually active during the warm half-year (April to September) and spread in the UTLS for long distances mainly due to the westerly zonal transport of air masses in the Northern Hemisphere. Therefore, the plumes of pyroCbs occurring in North America are frequently detected in the UTLS over Europe, and more rarely over Siberia, and the Far East by both ground- and space-based lidars.
In this study, we have considered and analyzed aerosol layers in the UTLS (11–30 km) over Tomsk that could represent smoke plumes from pyroCbs generated by massive wildfires in North America and northeastern Asia between 2000 and 2017. Using the HYSPLIT trajectory analysis, we have reliably assigned 9 such layers to 8 out of more than 100 documented pyroCb events, the aftereffects of which could potentially be detected at the SLS. All the eight pyroCb events occurred in North America: one event per year occurred in 2000, 2002, 2003, 2013, 2015, and 2016, whereas two events occurred in 2017. Such a small number of observed pyroCbs could be due to unfavorable weather conditions in Tomsk, or pyroCb plumes could have passed by the SLS. Unfortunately, we could not unambiguously discern plumes from pyroCbs occurring in the 2004–2011 period (Table 1) against the background of more powerful plumes from 12 volcanic eruptions observed during this period (Table 3).
Massive forest fires generating pyroCbs are also known to occur in northeastern Asia (http://pyrocb.ssec.wisc.edu/, last access: 13 March 2019). However, no plumes in the UTLS over Tomsk from pyroCbs that occurred in the boreal zone of Siberia and the Far East (to the east of Tomsk) were detected at the SLS between 2000 and 2017. We can assume that the time durations for pyroCb plumes to be detected in the UTLS using ground-based lidars are less than about a month. In other words, plumes from pyroCbs generated by wildfires to the east of Tomsk can significantly diffuse before reaching the SLS due to the westerly zonal transport. This probably explains a comparatively “low” contribution from pyroCbs to aerosol loading of the UTLS over Tomsk and, therefore, the negative trends in the annual average values in the absence of, and during low, volcanic activity in time periods (a) and (c), respectively (Fig. 10).
Based on the results of lidar observations at the SLS between 2000 and 2017, we can conclude the following. During a short-term period (up to 3 weeks) after pyroCb events have occurred in North America, their aftereffects in the UTLS over Tomsk are comparable to those of volcanic eruptions with VEI ∼ 3. During periods of volcanic quiescence, smoke plumes that reached the UTLS over Tomsk from two or more pyroCbs in a single year can lead to a marked increase in aerosol loading compared to that in the previous year. For example, the annual average value increased by 14.8 % in 2017 compared to that in 2016 due to multiple pyroCbs that occurred in British Columbia (Canada) in August 2017. The contribution from a single pyroCb or multiple ones (originating in North America and injecting smoke into the UTLS) to the annual average value for the Tomsk region is comparable to the contribution from both tropical and northern volcanic eruptions with VEI ≤ 3, but can hardly compete with that from volcanic eruptions with VEI = 4. The last conclusion is in agreement with the findings reported by Peterson et al. (2018).
The NOAA's HYSPLIT model used to calculate all air mass backward trajectories is available at http://ready.arl.noaa.gov/HYSPLIT.php/ (last access: 13 March 2019). The volcanic eruption data can be found at http://volcano.si.edu/ and the data on pyroCb events that occurred after May 2013 are located at http://pyrocb.ssec.wisc.edu/ (last access: 13 March 2019). The integrated aerosol backscatter coefficient and scattering ratio data retrieved from the SLS observations are presented in the Supplement. To open .opj files, the scientific graphing and data analysis software “Origin” is required (https://www.originlab.com/, last access: 13 March 2019), the trial version of which can be downloaded at https://www.originlab.com/demodownload.aspx/ (last access: 13 March 2019). The CALIPSO data used to corroborate the Tomsk observations in the 2013–2017 period and radiosonde data from meteorological stations located in Kolpashevo, Emeljanovo, Novosibirsk, and North America are also given in the Supplement.
Aerosol layers detected in the UT–TR with ground-based lidars are identified as cirrus clouds if the scattering ratio R(H)>10 for a laser wavelength λ1=532 nm (Tao et al., 2008; Samokhvalov et al., 2013). However, according to Sassen et al. (1989), the minimum value of R(H) can be 5.2 in the case of so-called “subvisual” cirrus clouds, invisible to the naked eye (for a laser wavelength λ2=694.3 nm), with a thickness of <1 km. Note, however, that the thickness of other cirrus cloud types can often be more than 1 km (Goldfarb et al., 2001). To calculate the minimum R(H) value for λ1=532 nm, one can use the fact that the aerosol backscatter coefficient , λ) is considered to be independent of the scattered light wavelength if aerosol particles are much greater than the wavelength (Measures, 1984). Since cirrus cloud particles (∼25 µm, Sassen et al., 1989) are greater than both considered wavelengths λ1 and λ2, we can assume for each altitude H. Therefore, using Eq. (1), we can write the following equality:
Taking into account the dependence , for the scattering ratio we have
Substituting λ1=532 nm, λ2=694.3 nm, and R(λ2)=5.2 into Eq. (A2), we finally obtain R(λ1)=2.45.
The supplement related to this article is available online at: https://doi.org/10.5194/acp-19-3341-2019-supplement.
VVZ and VVG performed the main analysis of all data and wrote the paper. AVN made measurements at the SLS and processed lidar data. ESS performed the HYSPLIT trajectory analysis. VVG and ESS retrieved data on pyroCbs, the plumes of which could potentially be detected in the UTLS over Tomsk.
The authors declare that they have no conflict of interest.
We thank Michael Fromm (the US Naval Research Laboratory) for the information on the aerosol cloud coming to Tomsk from several strong pyroCbs generated by wildfires in British Columbia (Canada) in August 2017.
This paper was edited by Matthias Tesche and reviewed by Michael Fromm and one anonymous referee.
Ansmann, A., Baars, H., Chudnovsky, A., Mattis, I., Veselovskii, I., Haarig, M., Seifert, P., Engelmann, R., and Wandinger, U.: Extreme levels of Canadian wildfire smoke in the stratosphere over central Europe on 21–22 August 2017, Atmos. Chem. Phys., 18, 11831–11845, https://doi.org/10.5194/acp-18-11831-2018, 2018.
Balkanski, Y., Myhre, G., Gauss, M., Rädel, G., Highwood, E. J., and Shine, K. P.: Direct radiative effect of aerosols emitted by transport: from road, shipping and aviation, Atmos. Chem. Phys., 10, 4477–4489, https://doi.org/10.5194/acp-10-4477-2010, 2010.
Blake, D. F. and Kato, K.: Latitudinal distribution of black carbon soot in the upper troposphere and lower stratosphere, J. Geophys. Res., 100, 7195–7202, https://doi.org/10.1029/94JD03118, 1995.
Burlakov, V. D., Dolgii, S. I., and Nevzorov, A. V.: A three-frequency Lidar for sensing microstructure characteristics of stratospheric aerosols, Instrum. Exp. Tech., 53, 890–894, https://doi.org/10.1134/S0020441210060230, 2010.
Cammas, J.-P., Brioude, J., Chaboureau, J.-P., Duron, J., Mari, C., Mascart, P., Nédélec, P., Smit, H., Pätz, H.-W., Volz-Thomas, A., Stohl, A., and Fromm, M.: Injection in the lower stratosphere of biomass fire emissions followed by long-range transport: a MOZAIC case study, Atmos. Chem. Phys., 9, 5829–5846, https://doi.org/10.5194/acp-9-5829-2009, 2009.
Dahlkötter, F., Gysel, M., Sauer, D., Minikin, A., Baumann, R., Seifert, P., Ansmann, A., Fromm, M., Voigt, C., and Weinzierl, B.: The Pagami Creek smoke plume after long-range transport to the upper troposphere over Europe – aerosol properties and black carbon mixing state, Atmos. Chem. Phys., 14, 6111–6137, https://doi.org/10.5194/acp-14-6111-2014, 2014.
Damoah, R., Spichtinger, N., Servranckx, R., Fromm, M., Eloranta, E. W., Razenkov, I. A., James, P., Shulski, M., Forster, C., and Stohl, A.: A case study of pyro-convection using transport model and remote sensing data, Atmos. Chem. Phys., 6, 173–185, https://doi.org/10.5194/acp-6-173-2006, 2006.
Friberg, J., Martinsson, B. G., Andersson, S. M., and Sandvik, O. S.: Volcanic impact on the climate – the stratospheric aerosol load in the period 2006–2015, Atmos. Chem. Phys., 18, 11149–11169, https://doi.org/10.5194/acp-18-11149-2018, 2018.
Fromm, M. and Servranckx, R.: Transport of forest fire smoke above the tropopause by supercell convection, Geophys. Res. Lett., 30, 1542, https://doi.org/10.1029/2002GL016820, 2003.
Fromm, M., Alfred, J., Hoppel, K., Hornstein, J., Bevilacqua, R., Shettle, E., Servranckx, R., Li, Z., and Stocks, B.: Observations of boreal forest fire smoke in the stratosphere by POAM III, SAGE II, and lidar in 1998, Geophys. Res. Lett., 27, 1407–1410, https://doi.org/10.1029/1999GL011200, 2000.
Fromm, M., Bevilacqua, R., Servranckx, R., Rosen, J., Thayer, J. P., Herman, J., and Larko, D.: Pyro-cumulonimbus injection of smoke to the stratosphere: Observations and impact of a super blowup in northwestern Canada on 3–4 August 1998, J. Geophys. Res., 110, D08205, https://doi.org/10.1029/2004JD005350, 2005.
Fromm, M., Tupper, A., Rosenfeld, D., Servranckx, R., and McRae, R.: Violent pyro-convective storm devastates Australia's capital and pollutes the stratosphere, Geophys. Res. Lett., 33, L05815, https://doi.org/10.1029/2005GL025161, 2006.
Fromm, M., Torres, O., Diner, D., Lindsey, D., Vant Hull, B., Servranckx, R., Shettle, E. P., and Li, Z.: Stratospheric impact of the Chisholm pyrocumulonimbus eruption: 1. Earth-viewing satellite perspective, J. Geophys. Res., 113, D08202, https://doi.org/10.1029/2007JD009153, 2008a.
Fromm, M., Shettle, E. P., Fricke, K. H., Ritter, C., Trickl, T., Giehl, H., Gerding, M., Barnes, J. E., O'Neill, M., Massie, S. T., Blum, U., McDermid, I. S., Leblanc, T., and Deshler, T.: Stratospheric impact of the Chisholm pyrocumulonimbus eruption: 2. Vertical profile perspective, J. Geophys. Res., 113, D08203, https://doi.org/10.1029/2007JD009147, 2008b.
Fromm, M., Lindsey, D.T., Servranckx, R., Yue, G., Trickl, T., Sica, R., Doucet, P., and Godin-Beekmann, S.: The Untold Story of Pyrocumulonimbus, B. Am. Meteorol. Soc., 91, 1193–1209, https://doi.org/10.1175/2010BAMS3004.1, 2010.
Fromm, M., Kablick III, G., Nedoluha, G., Carboni, E., Grainger, R., Campbell, J., and Lewis, J.: Correcting the record of volcanic stratospheric aerosol impact: Nabro and Sarychev Peak, J. Geophys. Res., 119, 10343–10364, https://doi.org/10.1002/2014JD021507, 2014.
Goldfarb, L., Keckhut, P., Chanin, M.-L., and Hauchecorne, A.: Cirrus climatological results from lidar measurements at OHP (44∘ N, 6∘ E), Geophys. Res. Lett., 28, 1687–1690, https://doi.org/10.1029/2000GL012701, 2001.
Gonzi, S. and Palmer, P. I.: Vertical transport of surface fire emissions observed from space, J. Geophys. Res., 115, D02306, https://doi.org/10.1029/2009JD012053, 2010.
Guan, H., Esswein, R., Lopez, J., Bergstrom, R., Warnock, A., Follette-Cook, M., Fromm, M., and Iraci, L. T.: A multi-decadal history of biomass burning plume heights identified using aerosol index measurements, Atmos. Chem. Phys., 10, 6461–6469, https://doi.org/10.5194/acp-10-6461-2010, 2010.
Haarig, M., Ansmann, A., Baars, H., Jimenez, C., Veselovskii, I., Engelmann, R., and Althausen, D.: Depolarization and lidar ratios at 355, 532, and 1064 nm and microphysical properties of aged tropospheric and stratospheric Canadian wildfire smoke, Atmos. Chem. Phys., 18, 11847–11861, https://doi.org/10.5194/acp-18-11847-2018, 2018.
Hendricks, J., Kärcher, B., Döpelheuer, A., Feichter, J., Lohmann, U., and Baumgardner, D.: Simulating the global atmospheric black carbon cycle: a revisit to the contribution of aircraft emissions. Atmos. Chem. Phys., 4, 2521–2541, https://doi.org/10.5194/acp-4-2521-2004, 2004.
Hofmann, D., Barnes, J., O'Neill, M., Trudeau, M., and Neely, R.: Increase in background stratospheric aerosol observed with lidar at Mauna Loa Observatory and Boulder, Colorado, Geophys. Res. Lett., 36, L15808, https://doi.org/10.1029/2009GL039008, 2009.
Hu, Q., Goloub, P., Veselovskii, I., Bravo-Aranda, J.-A., Popovici, I. E., Podvin, T., Haeffelin, M., Lopatin, A., Dubovik, O., Pietras, C., Huang, X., Torres, B., and Chen, C.: Long-range-transported Canadian smoke plumes in the lower stratosphere over northern France, Atmos. Chem. Phys., 19, 1173–1193, https://doi.org/10.5194/acp-19-1173-2019, 2019.
Jost, H. J., Drdla, K., Stohl, A., Pfister, L., Loewenstein, M., Lopez, J. P., Hudson, P. K., Murphy, D. M., Cziczo, D. J., Fromm, M., Bui, T. P., Dean-Day, J., Gerbig, C., Mahoney, M. J., Richard, E. C., Spichtinger, N., Pittman, J. V., Weinstock, E. M., Wilson, J. C., and Xueref, I.: In-situ observations of mid-latitude forest fire plumes deep in the stratosphere, Geophys. Res. Lett., 31, L11101, https://doi.org/10.1029/2003GL019253, 2004.
Khaykin, S. M., Godin-Beekmann, S., Keckhut, P., Hauchecorne, A., Jumelet, J., Vernier, J. P., Bourassa, A., Degenstein, D. A., Rieger, L. A., Bingen, C., Vanhellemont, F., Robert, C., DeLand, M., and Bhartia, P. K.: Variability and evolution of the midlatitude stratospheric aerosol budget from 22 years of ground-based lidar and satellite observations, Atmos. Chem. Phys., 17, 1829–1845, https://doi.org/10.5194/acp-17-1829-2017, 2017.
Khaykin, S. M., Godin-Beekmann, S., Hauchecorne, A., Pelon, J., Ravetta, F., and Keckut, P.: Stratospheric smoke with unprecedentedly high backscatter observed by lidars above southern France, Geophys. Res. Lett., 45, 1639–1646, https://doi.org/10.1002/2017GL076763, 2018.
Koehler, K. A., DeMott, P. J., Kreidenweis, S. M., Popovicheva, O. B., Petters, M. D., Carrico, C. M., Kireeva, E. D., Khokhlova, T. D., and Shonija, N. K.: Cloud condensation nuclei and ice nucleation activity of hydrophobic and hydrophilic soot particles, Phys. Chem. Chem. Phys., 11, 7906–7920, https://doi.org/10.1039/B905334B, 2009.
Kremser, S., Thomason, L. W., von Hobe, M., Hermann, M., Deshler, T., Timmreck, C., Toohey, M., Stenke, A., Schwarz, J. P., Weigel, R., Fueglistaler, S., Prata, F. J., Vernier, J.-P., Schlager, H., Barnes, J. E., Antuña-Marrero, J.-C., Fairlie, D., Palm, M., Mahieu, E., Notholt, J., Rex, M., Bingen, C., Vanhellemont, F., Bourassa, A., Plane, J. M. C., Klocke, D., Carn, S. A., Clarisse, L., Trickl, T., Neely, R., James, A. D., Rieger, L., Wilson, J. C., and Meland, B.: Stratospheric aerosol – Observations, processes, and impact on climate, Rev. Geophys., 54, 278–335, https://doi.org/10.1002/2015RG000511, 2016.
Livesey, N. J., Fromm, M. D., Waters, J. W., Manney, G. L., Santee, M. L., and Read, W. G.: Enhancements in lower stratospheric CH3CN observed by the Upper Atmosphere Research Satellite Microwave Limb Sounder following boreal forest fires, J. Geophys. Res., 109, D06308, https://doi.org/10.1029/2003JD004055, 2004.
Markowicz, K. M., Chilinski, M. T., Lisok, J., Zawadzka, O., Stachlewska, I. S., Janicka, L., Rozwadowska, A., Makuch, P., Pakszys, P., Zielinski, T., Petelski, T., Posyniak, M., Pietruczuk, A., Szkop, A., and Westphal, D. L.: Study of aerosol optical properties during long-range transport of biomass burning from Canada to Central Europe in July 2013, J. Aerosol Sci., 101, 156–173, https://doi.org/10.1016/j.jaerosci.2016.08.006, 2016.
Measures, R. M.: Laser Remote Sensing: Fundamentals and Applications, Wiley, New York, 510 pp., 1984.
Mills, M. J., Schmidt, A., Easter, R., Solomon, S., Kinnison, D. E., Ghan, S. J., Neely III, R. R., Marsh, D. R., Conley, A., Bardeen, C. G., and Gettelman, A.: Global volcanic aerosol properties derived from emissions, 1990–2014, using CESM1(WACCM), J. Geophys. Res.-Atmos., 121, 2332–2348, https://doi.org/10.1002/2015JD024290, 2016.
Nikonovas, T., North, P. R. J., and Doerr, S. H.: Particulate emissions from large North American wildfires estimated using a new top-down method, Atmos. Chem. Phys., 17, 6423–6438, https://doi.org/10.5194/acp-17-6423-2017, 2017.
Paugam, R., Wooster, M., Freitas, S., and Val Martin, M.: A review of approaches to estimate wildfire plume injection height within large-scale atmospheric chemical transport models, Atmos. Chem. Phys., 16, 907–925, https://doi.org/10.5194/acp-16-907-2016, 2016.
Peterson, D., Hyer, E., and Wang, J.: Quantifying the potential for high-altitude smoke injection in the North American boreal forest using the standard MODIS fire products and subpixel-based methods, J. Geophys. Res.-Atmos., 119, 3401–3419, https://doi.org/10.1002/2013JD021067, 2014.
Peterson, D., Campbell, J., Hyer, E., Fromm, M., Kablick, G., Cossuth, J., and DeLand, M.: Wildfire-driven thunderstorms cause a volcano-like stratospheric injection of smoke, NPJ Clim. Atmos. Sci., 1, 30, https://doi.org/10.1038/s41612-018-0039-3, 2018.
Rémy, S., Veira, A., Paugam, R., Sofiev, M., Kaiser, J. W., Marenco, F., Burton, S. P., Benedetti, A., Engelen, R. J., Ferrare, R., and Hair, J. W.: Two global data sets of daily fire emission injection heights since 2003, Atmos. Chem. Phys., 17, 2921–2942, https://doi.org/10.5194/acp-17-2921-2017, 2017.
Robock, A.: Volcanic eruptions and climate, Rev. Geophys., 38, 191–219, https://doi.org/10.1029/1998RG000054, 2000.
Robock, A. and Oppenheimer, C. (Eds.): Volcanism and the Earth's Atmosphere, Geophysical Monograph Series, 139, AGU, Washington, D.C., 360 pp., 2003.
Sakai, T., Uchino, O., Nagai, T., Liley, B., Morino, I., and Fujimoto, T.: Long-term variation of stratospheric aerosols observed with lidars over Tsukuba, Japan, from 1982 and Lauder, New Zealand, from 1992 to 2015, J. Geophys. Res., 121, 10283–10293, https://doi.org/10.1002/2016JD025132, 2016.
Samokhvalov, I. V., Bryukhanov, I. D., Nasonov, S. V., Zhivotenyuk, I. V., and Stykon, A. P.: Investigation of the optical characteristics of cirrus clouds with anomalous backscattering, Russ. Phys. J., 55, 925–929, https://doi.org/10.1007/s11182-013-9902-1, 2013.
Sassen, K., Griffin, M. K., and Dodd, G. C.: Optical scattering and microphysical properties of subvisual cirrus clouds, and climatic implications, J. Appl. Meteorol., 28, 91–98, https://doi.org/10.1175/1520-0450(1989)028<0091:OSAMPO>2.0.CO;2, 1989.
Siddaway, J. M. and Petelina, S. V.: Transport and evolution of the 2009 Australian Black Saturday bushfire smoke in the lower stratosphere observed by OSIRIS on Odin, J. Geophys. Res., 116, D06203, https://doi.org/10.1029/2010JD015162, 2011.
Sofiev, M., Vankevich, R., Ermakova, T., and Hakkarainen, J.: Global mapping of maximum emission heights and resulting vertical profiles of wildfire emissions, Atmos. Chem. Phys., 13, 7039–7052, https://doi.org/10.5194/acp-13-7039-2013, 2013.
Stein, A. F., Draxler, R. R, Rolph, G. D., Stunder, B. J. B., Cohen, M. D., and Ngan, F.: NOAA's HYSPLIT atmospheric transport and dispersion modeling system, B. Am. Meteorol. Soc., 96, 2059–2077, https://doi.org/10.1175/BAMS-D-14-00110.1, 2015.
Tao, Z., McCormick, M. P., Wu, D., Liu, Z., and Vaughan, M. A.: Measurements of cirrus cloud backscatter color ratio with a two-wavelength lidar, Appl. Optics, 47, 1478–1485, https://doi.org/10.1364/AO.47.001478, 2008.
Trickl, T., Giehl, H., Jäger, H., and Vogelmann, H.: 35 yr of stratospheric aerosol measurements at Garmisch-Partenkirchen: from Fuego to Eyjafjallajökull, and beyond, Atmos. Chem. Phys., 13, 5205–5225, https://doi.org/10.5194/acp-13-5205-2013, 2013.
Trickl, T., Vogelmann, H., Flentje, H., and Ries, L.: Stratospheric ozone in boreal fire plumes – the 2013 smoke season over central Europe, Atmos. Chem. Phys., 15, 9631–9649, https://doi.org/10.5194/acp-15-9631-2015, 2015.
Val Martin, M., Logan, J.A., Kahn, R.A., Leung, F.-Y., Nelson, D.L., and Diner, D. J.: Smoke injection heights from fires in North America: analysis of 5 years of satellite observations, Atmos. Chem. Phys., 10, 1491–1510, https://doi.org/10.5194/acp-10-1491-2010, 2010.
Vaughan, G., Draude, A. P., Ricketts, H. M. A., Schultz, D. M., Adam, M., Sugier, J., and Wareing, D. P.: Transport of Canadian forest fire smoke over the UK as observed by lidar, Atmos. Chem. Phys., 18, 11375–11388, https://doi.org/10.5194/acp-18-11375-2018, 2018.
Vernier, J.-P., Thomason, L. W., Pommereau, J. P., Bourassa, A., Pelon, J., Garnier, A., Hauchecorne, A., Blanot, L., Trepte, C., Degenstein, D., and Vargas, F.: Major influence of tropical volcanic eruptions on the stratospheric aerosol layer during the last decade, Geophys. Res. Lett., 38, 1–8, https://doi.org/10.1029/2011GL047563, 2011.
Wilkerson, J. T., Jacobson, M. Z., Malwitz, A., Balasubramanian, S., Wayson, R., Fleming, G., Naiman, A. D., and Lele, S. K.: Analysis of emission data from global commercial aviation: 2004 and 2006, Atmos. Chem. Phys., 10, 6391–6408, https://doi.org/10.5194/acp-10-6391-2010, 2010.
WMO: World Meteorological Organization: Definition of the tropopause, Bull. World Meteorol. Org., 6, 136–137, 1957.
Wotton, B. M., Flannigan, M. D., and Marshall, G. A.: Potential climate change impacts on fire intensity and key wildfire suppression thresholds in Canada, Environ. Res. Lett., 12, 095003, https://doi.org/10.1088/1748-9326/aa7e6e, 2017.
Wotton, B. M., Nock, C. A., and Flannigan, M. D.: Forest fire occurrence and climate change in Canada, Int. J. Wildland Fire, 19, 253–271, https://doi.org/10.1071/WF09002, 2010.
Zuev, V. V.: Siberian Lidar Station – the unique experimental complex for remote investigations of the ozonosphere, Atmos. Ocean. Opt., 13, 84–88, 2000.
Zuev, V. V., Burlakov, V. D., and El'nikov, A. V.: Ten years (1986–1995) of lidar observations of temporal and vertical structure of stratospheric aerosols over Siberia, J. Aerosol Sci., 29, 1179–1187, https://doi.org/10.1016/S0021-8502(98)00025-1, 1998.
Zuev, V. V., Burlakov, V. D., El'nikov, A. V., Ivanov, A. P., Chaikovskii, A. P., and Shcherbakov, V. N.: Processes of long-term relaxation of stratospheric aerosol layer in Northern Hemisphere midlatitudes after a powerful volcanic eruption, Atmos. Environ., 35, 5059–5066, https://doi.org/10.1016/S1352-2310(01)00327-2, 2001.
Zuev, V. V., Burlakov, V. D., Nevzorov, A. V., Pravdin, V. L., Savelieva, E. S., and Gerasimov, V. V.: 30-year lidar observations of the stratospheric aerosol layer state over Tomsk (Western Siberia, Russia), Atmos. Chem. Phys. 17, 3067–3081, https://doi.org/10.5194/acp-17-3067-2017, 2017.
- Abstract
- Introduction
- Lidar instruments and methods
- Results of lidar observations in Tomsk for the 2000–2017 period
- Time series of the integrated aerosol backscatter coefficient (2001–2017)
- Concluding remarks
- Data availability
- Scattering ratio R(H, λ) values for cirrus clouds
- Author contributions
- Competing interests
- Acknowledgements
- Review statement
- References
- Supplement