the Creative Commons Attribution 4.0 License.
the Creative Commons Attribution 4.0 License.
 | 08 Mar 2019
Causes of a continuous summertime O3 pollution event in Jinan, a central city in the North China Plain
Xiaopu Lyu
Nan Wang
Likun Xue
Fei Jiang
Yangzong Zeren
Hairong Cheng
Zhe Cai
Lihui Han
Ying Zhou
In the summer of 2017, measurements of ozone (O3) and its precursors were carried out at an urban site in Jinan, a central city in the North China Plain (NCP). A continuous O3 pollution event was captured during 4–11 August, with the maximum hourly O3 mixing ratio reaching 154.1 ppbv. Model simulation indicated that local photochemical formation and regional transport contributed 14.0±2.3 and 18.7±4.0 ppbv h−1, respectively, to the increase in O3 during 09:00–15:00 LT (local time) in this event. For local O3 formation, the calculated OH reactivities of volatile organic compounds (VOCs) and carbon monoxide (CO) were comparable between O3 episodes and non-episodes (p>0.05), so was the OH reactivity of nitrogen oxides (NOx). However, the ratio of OH reactivity of VOCs and CO to that of NOx increased from 2.0±0.4 s−1 s1 during non-episodes to 3.7±0.7 s−1 s1 during O3 episodes, which resulted in the change in the O3 formation mechanism from the VOC-limited regime before the O3 pollution event to the transitional regime during the event. Correspondingly, the simulated local O3 production rate during the event (maximum: 21.3 ppbv h−1) was markedly higher than that before the event (p<0.05) (maximum: 16.9 ppbv h−1). Given that gasoline and diesel exhaust made large contributions to the abundance of O3 precursors and the O3 production rate, constraint on vehicular emissions is the most effective strategy to control O3 pollution in Jinan. The NCP has been confirmed as a source region of tropospheric O3, where the shift in regimes controlling O3 formation like the case presented in this study can be expected across the entire region, due to the substantial reductions of NOx emissions in recent years.
- Article
(8922 KB) -
Supplement
(6383 KB) - BibTeX
- EndNote


Air pollution in the North China Plain (NCP), the largest alluvial plain of China consisting of Beijing, Tianjin and many cities in Hebei, Shandong and Henan provinces, has attracted much attention in recent years. While the annual average concentration of PM2.5 (particulate matter with aerodynamic diameter less than or equal to 2.5 µm) has been reduced under concerted efforts on emission restrictions (Zhang et al., 2015; Lang et al., 2017), the tropospheric ozone (O3) pollution, which is less visible than haze but may be equally harmful to human health, is still severe. At a regional receptor site of the NCP in a mountainous area to the north of Beijing, Wang et al. (2006) reported the maximum hourly O3 mixing ratio of 286 ppbv. A year-round observation of O3 at 10 urban sites in Beijing indicated frequent O3 non-attainments (hourly O3 > 100 ppbv) through May to August 2013 (Z. Wang et al., 2015). An hourly O3 mixing ratio of up to 120 ppbv was reported on Mt. Tai, the highest mountain in the NCP (1534 m a.s.l.) (Gao et al., 2005). All these studies revealed the significant photochemical O3 pollution over the entire NCP. Moreover, O3 has been increasing in the NCP during the last decades (Zhang et al., 2014, 2015). The increase rate of O3 at an urban site in Beijing from 2005 to 2011 was quantified as 2.6 ppbv yr−1 (Zhang et al., 2014), comparable to that (1.7–2.1 ppbv yr−1) at Mt. Tai in the summer between 2003 and 2015 (Sun et al., 2016). Overall, the NCP suffers from severe O3 pollution, which is aggravating.
Apart from the intrusion of stratospheric O3 in some places with high elevations (Cooper et al., 2005; Lin et al., 2015), photochemical formation is the main source of the ground-level O3. Volatile organic compounds (VOCs), carbon monoxide (CO) and nitrogen oxides (NOx) are key precursors of tropospheric O3 (Crutzen, 1973; Chameides and Walker, 1973; Carter, 1994; Carter et al., 1995). The general chemical Reactions R1–R5 show the production of O3 from the OH-initiated oxidation of hydrocarbons (RH) (Jenkin et al., 1997; Atkinson, 2000; Jenkin and Clemitshaw, 2000).
The production of O3 is generally limited by VOCs or NOx or co-limited by both VOCs and NOx, depending upon the chemical compositions of the air, particularly the ratio between OH reactivity of VOCs and NOx (OH reactivity is the sum of the products of O3 precursor concentrations and the reaction rate constants between O3 precursors and OH). Xue et al. (2014) indicated that the formation of O3 was limited by NOx in Lanzhou in summer, consistent with the findings of Liu et al. (2010), who proved that the NOx-limited regime dominated O3 formation in most areas of northwestern China. In southwestern China, O3 formation was diagnosed as VOC-limited in Chengdu but NOx-limited in Pengzhou due to the large amount of emissions from petrochemical industry (Tan et al., 2018a). Lyu et al. (2016) reported the VOC-limited regime in Wuhan, a city in central China. The VOC-limited regime has also been repeatedly confirmed for O3 formation in Shanghai (Xue et al., 2014; Xing et al., 2017) and Nanjing (Ding et al., 2013), eastern China. In the Pearl River Delta of southern China, it was found that O3 formation was generally limited by VOCs in the southwest, while it was limited by NOx in the northeast (Ye et al., 2016). In the NCP, both Han et al. (2018) and Xing et al. (2018) summarized that VOCs limited the production of O3 in most urban areas. However, in the suburban and rural areas, O3 formation was generally in the transitional regime, e.g., Yucheng (Zong et al., 2018), or limited by NOx, e.g., Wangdu (Tan et al., 2018b). From a historical perspective, Jin et al. (2017) pointed out that the sensitivity of O3 formation to VOCs increased in most Chinese cities but decreased in some megacities (such as Beijing and Shanghai) due to the stringent control of NOx emissions in recent years. Different VOCs play non-equivalent roles in O3 formation. Alkenes, aromatics and carbonyls can be readily oxidized by oxidative radicals (e.g., OH) or photolyzed (applicable for carbonyls), leading to O3 formation (Cheng et al., 2010; Guo et al., 2013). Therefore, the sources with large quantities of emissions of these VOCs generally make considerable contributions to the photochemical production of ground-level O3. For example, Cheng et al. (2010) pointed out that carbonyls increased the peak O3 production rates at a rural site and at a suburban site in southern China by 64 % and 47 %, respectively. Solvent-based industry and paint solvent usage with intensive emissions of aromatics were responsible for more than half of the O3 formation potential in Shanghai (Cai et al., 2010). Carbonyls and alkenes accounted for 71 %–85 % of the total OH reactivity of VOCs in Beijing (Shao et al., 2009).
In addition to the chemical processes, meteorological conditions also play significant roles in the formation, transport and accumulation of O3. Studies (Chan and Chan, 2000; Huang et al., 2005) indicated that tropical cyclone (typhoon as the mature form) and continental anticyclone are the most common synoptic systems conducive to O3 pollution in coastal cities of southern China. Many O3 episodes in eastern China occurred under the control of the Western Pacific Subtropical High (WPSH) (He et al., 2012; Shu et al., 2016). In the NCP (northern China), the summertime O3 pollution is generally accompanied by weak high-pressure systems (Wang et al., 2010). Furthermore, O3 pollution is also related to the topography. For example, the mountains to the north and west of Beijing lead to upslope winds (valley breeze) in daytime, which transport the polluted air masses laden with O3 and/or O3 precursors from the NCP to Beijing (Lin et al., 2008). Overall, the causes of O3 pollution are complicated and need to be analyzed case by case.
The NCP is the region with the largest emissions of many air pollutants, such as VOCs and NOx, in China (Gu et al., 2014; Li et al., 2017), partially accounting for the severe O3 pollution there. In addition, O3 pollution in the NCP is closely related to the synoptic systems and topographic features (Chen et al., 2009; Zhang et al., 2016). For example, the strong photochemical production of O3 in urban plumes of Beijing was found by Wang et al. (2006), while the contribution of regional transport was revealed by the enhanced O3 production at a rural site in the NCP under southerly winds (Lin et al., 2008). Through the review of synoptic systems in the NCP from 1980 to 2013, Zhang et al. (2016) concluded that the air quality was generally unhealthy under weak East Asian monsoons. Moreover, a decadal statistical analysis indicated that meteorological factors explained ∼50 % of the O3 variations in Beijing (Zhang et al., 2015). Despite many previous studies, the evolutions of the synoptic and photochemical processes in O3 pollution events and their contributions to the non-attainment of O3 have been seldom looked into in the NCP. Besides, the local and regional contributions to the elevated O3 in the NCP are not unambiguously quantified and are limited by the deficiencies in the model representation of either physical or local chemical processes. The situation was even much worse for Jinan, the capital of Shandong province. As early as the 2000s, studies (Shan et al., 2008; Yin et al., 2009) reported the maximum hourly O3 mixing ratios of 143.8 and 147.8 ppbv in June 2004 and 2005, respectively. Even higher O3 (198 ppbv) was observed at a rural site downwind of Jinan in June 2013 (Zong et al., 2018). However, almost no study was carried out to explore the mechanisms responsible for high O3 there, though it has been confirmed that air pollution in the cities like Jinan in the NCP influenced air quality in Beijing (Lin et al., 2008; Wang et al., 2010). To better understand O3 pollution in the NCP, this study investigated the causes of an O3 episode event lasting for 8 days in Jinan in summer 2017. The analyses presented here focused on the synoptic systems dominating the Shandong Peninsula during this event, the chemical profiles of O3 and O3 precursors, and the simulation of factors contributing to O3 in Jinan with the aid of a chemical transport model and a photochemical box model. In addition, we proposed feasible O3 control measures based on the source-resolved OH reactivity of VOCs and NOx.
2.1 Site description
The air quality monitoring and sample collection were carried out on the rooftop of a seven-story building on the campus of Shandong University from 15 July to 14 August 2017. The campus is located in the urban area of Jinan, and the site is about 50 m from a main road (Shanda South Road) outside the campus. Figure 1 shows the locations of the sampling site (36.68∘ N, 117.07∘ E; 22 m a.g.l.) and the surrounding air quality monitoring stations (AQMSs) set up by the China National Environmental Monitoring Center (CNEMC). Also shown are the observed O3 and rainfall averaged over 4–11 August 2017 when the O3 episode event occurred in Jinan. It is noteworthy that the days with maximum hourly O3 mixing ratios exceeding 100 ppbv (Grade II of National Ambient Air Quality Standard) were defined as O3 episode days. The hourly O3 values at the AQMSs were obtained from the website of CNEMC (http://www.cnemc.cn/, last access: 12 September 2018). The high O3 levels at almost all the AQMSs in the NCP (Fig. 1a) indicated a regional O3 pollution event in this period. In view of the comparable O3 mixing ratios observed at our sampling site to those at the surrounding AQMSs, we believe that the observations at our sampling site to some extent represented the characteristics of this regional pollution event. This was confirmed by the strong influences of regional transport on O3 variations at the site, as discussed in Sect. 3.3.
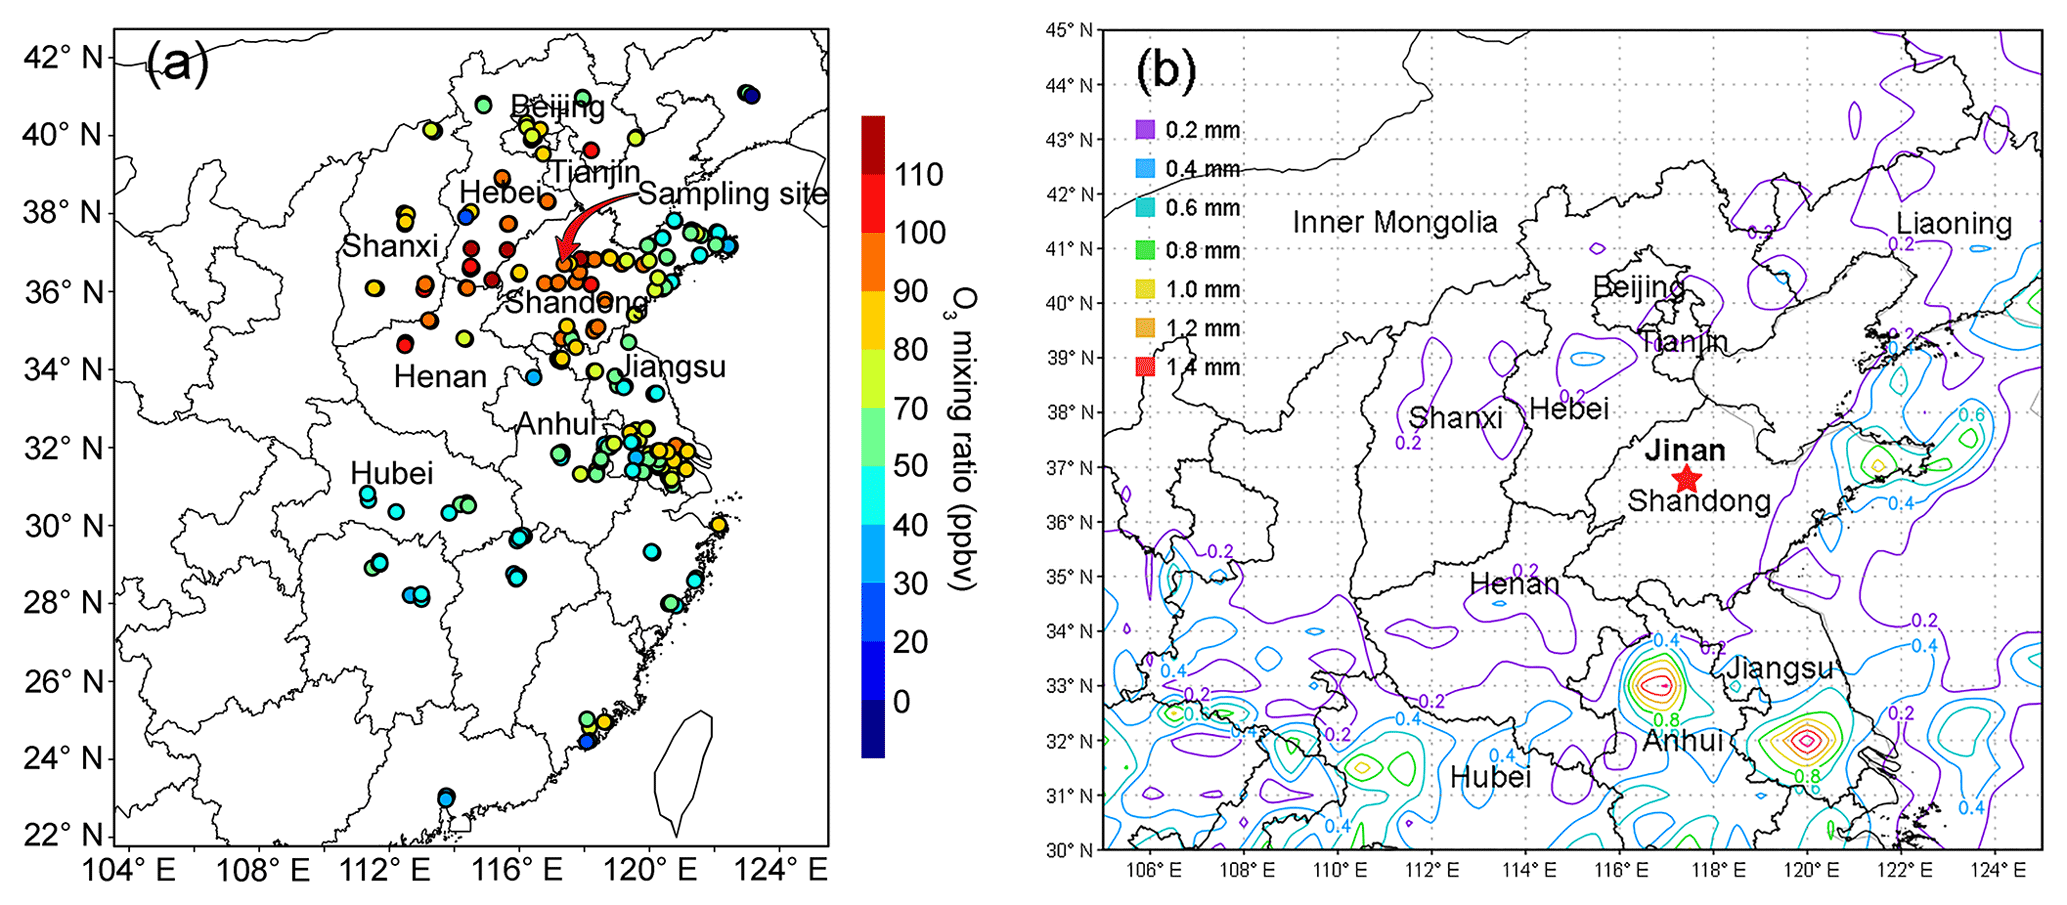
Figure 1(a) Locations of the sampling site and the CNEMC AQMSs, and the average observed O3 at 14:00 LT on 4–11 August 2017 (colored circles). The sampling site is overlapped with the nearest AQMS in Jinan. (b) Rainfall distribution, in millimeters (mm), averaged over 4–11 August 2017.
2.2 Air quality monitoring and sample collection
2.2.1 Continuous monitoring of air pollutants and meteorological parameters
O3, NO and NO2 were continuously monitored at the sampling site between 15 July and 14 August 2017. The air was drawn through a 4 m Teflon tube by the built-in pumps of the trace gas analyzers at the total flow rate of 2 L min−1 (1.4 L min−1 for O3 analyzer and 0.6 L min−1 for NOx analyzer). The inlet was located ∼1 m above the rooftop of the building. O3 and NO∕NOx were detected with a UV-based photometric analyzer and a chemiluminescence NO–NO2–NOx analyzer, respectively (see Table S1 in the Supplement for the specifications). The lowest NO observed during the sampling period was 2.4 ppbv, which is 6 times the detection limit (DL) of the NOx analyzer (0.4 ppbv). Since the measurement accuracy of the analyzer was <15 %, the DL was low enough to not influence the accurate measurements of NO in this study. NO2 was calculated from the difference between NO and NOx. Studies indicated that NO2 monitored with chemiluminescence was generally overestimated due to the conversion of the total odd nitrogen (NOy) to NO by molybdenum oxide catalysts (McClenny et al., 2002; Dunlea et al., 2007; Xu et al., 2013). The positive bias was more significant in more aged air masses, resulting from higher levels of NOz (NOz =NOy − NOx) (Dunlea et al., 2007). The average overestimation of NO2 was 22 % in Mexico City, which even increased to 50 % in the afternoon (Dunlea et al., 2007). Xu et al. (2013) suggested that the chemiluminescence monitors overestimated NO2 by less than 10 % in urban areas with fresh emission of NOx, but the positive bias went up to 30 %–50 % at the suburban sites. As described in Sect. 2.1, our sampling site was located in the urban area of Jinan and was only ∼50 m from a main road. Therefore, we infer that NO2 might not be significantly overestimated in this study. However, larger overestimation could be expected during O3 episodes, when the stronger photochemical reactions caused higher production of NOz. According to Xu et al. (2013), we adopted 30 % (minimum bias in suburban area) and 10 % (maximum bias in urban area) as the maximum fraction of NO2 overestimation during episodes and non-episodes at this urban site, respectively. The influences of the NO2 measurement interferences on the results are discussed where necessary.
The hourly concentrations of sulfur dioxide (SO2) and CO were acquired from a nearest AQMS, which is ∼1 km from our sampling site. Year-round monitoring of inorganic trace gases was conducted at this AQMS. The air was drawn into the analyzers at a flow of 3 L min−1 through an inlet, ∼1 m above the rooftop of a five-story building (∼16 m a.g.l.). The specifications of the analyzers deployed at the AQMS are also provided in Table S1. The hourly concentrations of O3 and NO2 measured at the AQMS (NO data were not available at the CNEMC website) agreed well with those observed at our sampling site, with the slope of 1.04 (R2=0.82) and 1.13 (R2=0.71) for O3 and NO2 in the linear least squares regressions, respectively (Fig. S1 in the Supplement). Due to the differences in analyzers and/or in sources and sinks of air pollutants between the two sites, the agreements were worse at low mixing ratios for both O3 and NO2. Therefore, we only used SO2 and CO monitored at the AQMS in this study, which had lower photochemical reactivity than O3 and NO2 and were more homogeneous at a larger scale.
In addition, the meteorological parameters, including wind speed, wind direction, pressure, temperature and relative humidity, were monitored at the sampling site by a widely used weather station (China Huayun Group, model CAWS600-B). The daily total solar radiation was obtained from the observations at a meteorological station in Jinan (36.6∘ N, 117.05∘ E; 170.3 m a.s.l.), 9 km from our sampling site.
2.2.2 Sample collection and chemical analysis
The VOC and oxygenated VOC (OVOC) samples were collected on 9 selective days (i.e., 20 and 30 July and 1, 4–7 and 10–11 August), referred to as VOC sampling days hereafter. The days were selected to cover the periods with relatively high and normal levels of O3. The high-O3 days were forecasted prior to sampling based on the numerical simulations of meteorological conditions and air quality. In total, 6 out of 9 VOC sampling days were O3 episode days with the maximum hourly O3 mixing ratio values ranging from 100.4 to 154.1 ppbv. On each day (regardless of episode or non-episode), six VOC and OVOC samples were collected between 08:00 and 18:00 LT every 2 h with the duration of 1 h for VOC and 2 h for OVOC samples. VOC samples were collected with 2 L stainless steel canisters which were cleaned and evacuated before sampling. A flow restrictor was connected to the inlet of the canister to guarantee 1 h sampling. OVOCs were sampled with the 2,4-dinitrophenylhydrazine (DNPH) cartridge, in front of which an O3 scrubber was interfaced to remove O3 in the air. A pump was used to draw the air through the DNPH cartridge at a flow of 500 mL min−1. After sampling, all the DNPH cartridges were stored in a refrigerator at 4 ∘C until chemical analysis.
VOC samples were analyzed using a gas chromatograph with mass selective detector, flame ion detector and electron capture detector system (Colman et al., 2001). In total, 85 VOCs, including 59 hydrocarbons, 19 halocarbons and 7 alkyl nitrates, were quantified. The overall ranges of the DL, accuracy and precision for VOC analysis were 1–154 pptv, 1.2 %–19.8 % and 0.1 %–17.9 %, respectively. The analysis results given by this system have been compared with those analyzed by the University of California, Irvine, and good agreements were achieved (Fig. S2). OVOC samples were eluted with 5 mL acetonitrile, followed by analysis with high-performance liquid chromatography. The DL, accuracy and precision for the detected OVOC species were within the range of 3–11 pptv, 0.32 %–0.98 % and 0.01 %–1.03 %, respectively.
2.3 Model configuration
2.3.1 Chemical transport model
To analyze the processes contributing to high O3 in Jinan, a chemical transport model, i.e., the Weather Research and Forecasting–Community Multiscale Air Quality (WRF-CMAQ) model, was utilized to simulate O3 in this study. WRF v3.6.1 was run to provide the offline meteorological field for CMAQ v5.0.2. A two-nested domain was adopted with the resolution of 36 km (outer domain) and 12 km (inner domain). As shown in Fig. S3, the outer domain covered the entire continental area of China, aiming to provide sufficient boundary conditions for the inner domain, which specifically focused on eastern China.
We used the 2012-based Multi-resolution Emission Inventory for China (MEIC) to provide anthropogenic emissions of air pollutants, which was developed by Tsinghua University specifically for China, with the grid resolution of 0.25∘ × 0.25∘ (Zhang et al., 2007; He, 2012). Five emission sectors, namely transportation, agriculture, power plant, industry and residence, were included in MEIC. The emission inventory was linearly interpolated to the domains with consideration of the earth curvature effect. For grids outside China, the air pollutant emissions were derived from the INTEX-B (Intercontinental Chemical Transport Experiment Phase B) Asian emission inventory (Zhang et al., 2009). Consistent with many previous studies (Jiang et al., 2010; N. Wang et al., 2015), the Model of Emissions of Gases and Aerosols from Nature (MEGAN) was used to calculate the biogenic emissions. The physical and chemical parameterizations for WRF-CMAQ were generally identical to those described in N. Wang et al. (2015), with the following improvements. Firstly, the carbon bond v5 with updated toluene chemistry (CB05-TU) was chosen as the gas-phase chemical mechanism (Whitten et al., 2010). Secondly, a single-layer urban canopy model (Kusaka and Kimura, 2004) was used to model the urban surface–atmosphere interactions. Thirdly, the default 1990s US Geological Survey data in WRF were replaced by adopting the 2012-based Moderate Resolution Imaging Spectroradiometer (MODIS) land cover data for eastern China. The substitution was performed to update the simulation of boundary meteorological conditions (Wang et al., 2007).
An integrated process rate (IPR) module incorporated in CMAQ was used to analyze the processes influencing the variations of O3. Through solving the mass continuity equation established between the overall change in O3 concentration across time and the change in O3 concentration caused by individual processes, including horizontal diffusion (HDIF), horizontal advection (HADV), vertical diffusion (VDIF), vertical advection (VADV), dry deposition, net effect of chemistry (CHEM) and cloud processes, the O3 variation rates induced by individual processes were determined. Note that since the estimate of CHEM is influenced by the estimate of O3 precursor emissions, the simulation of meteorological conditions and the chemical mechanism, all three aspects should be taken into account wherever CHEM is discussed. The IPR analysis has been widely applied in the diagnosis of processes influencing O3 pollution (Huang et al., 2005; N. Wang et al., 2015). Since the field observations were conducted near the surface (∼22 m a.g.l.), and the box model (Sect. 2.3.2) was constrained by the observations, the modeling results on the ground-level layer were extracted from WRF-CMAQ for analyses in this study.
2.3.2 Photochemical box model
We also utilized a photochemical box model incorporating the Master Chemical Mechanism (PBM-MCM) to study the in situ O3 chemistry, thanks to the detailed (species-based) descriptions of VOC degradations in the MCM (Saunders et al., 2003; Lam et al., 2013). The PBM model was localized to be applicable in Jinan, with the settings of geographic coordinates, sunlight duration and photolysis rates. The photolysis rates were calculated by the TUV (Tropospheric Ultraviolet and Visible) model (Madronich and Flocke, 1997). Specifically, the geographical coordinates, date and time were input into the TUV model to initialize the calculation of solar radiation with the default aerosol optical depth (AOD), cloud optical depth (COD), surface albedo and other parameters. Then, COD was adjusted to make the calculated daily total solar radiation progressively approach the observed value. When the difference between the calculated and observed solar radiation was less than 1 %, the input parameters with the adjusted COD were accepted. Based on the settings, the hourly solar radiations and the photolysis rates of O3 (J(O1D)) and NO2 (JNO2) were calculated by the TUV model and applied to the PBM-MCM for O3 chemistry modeling. Table S2 shows the daily maximum J(O1D) and JNO2 on the VOC sampling days. The MCM v3.2 (http://mcm.leeds.ac.uk/MCM/, last access: 12 September 2018) consists of 17 242 reactions among 5836 species. The mixing ratios of O3 and its precursors at 00:00 LT on each day were used as the initial conditions for each day's modeling. The initial O3 therefore represented O3 left over from the days before the modeling day and partially accounted for the primary OH production. Hourly concentrations of 46 VOCs, 4 OVOCs and 4 trace gases (SO2, CO, NO and NO2), as well as hourly meteorological parameters (temperature and relative humidity), were taken as inputs to constrain the model. O3, as the species to be modeled, was not input except for the setting of initial conditions. The Freon, cycloalkanes and methyl cycloalkanes with low O3 formation potentials were not included in model inputs either. Also excluded were the species whose concentrations were lower than the DLs in more than 20 % of samples, such as the methyl hexane and methyl heptane isomers. For the hours when measurement data were not available, the concentrations were obtained with linear interpolation. Some secondary species, such as formaldehyde (HCHO), acetaldehyde and acetone, were input into the model to constrain the simulation. Since other secondary species, e.g., PAN and HNO3, were not observed in this study, their concentrations were calculated by the model. The model simulated dry depositions of all the chemicals, and the deposition velocities were set identical to those in Lam et al. (2013). Since NO and NO2 were separately measured, they were not treated as a whole (i.e., NOx) in the model. Instead, both NO and NO2 data were input into the model so that the partitioning between them was constrained to observations.
The simulations were separately performed on all the VOC sampling days. For the spin-up, the model was run 72 h prior to the simulation on the day of interest, with the same inputs. The model treated the air pollutants to be well-mixed within the boundary layer, while dilution and transport were not considered. O3 in the free troposphere was not considered either, due to the lack of O3 observations above the boundary layer over Jinan. This might hinder the accurate reproduction of the observed O3, particularly on the days when advection and diffusion were strong. Since the model mainly described the in situ photochemistry, it was validated through comparison with the CHEM process simulated by WRF-CMAQ. The simulated O3 production rates were output every hour, which were integrated values over every 3600 s in 1 h (model resolution: 1 s). More details about the model configuration can be found in Lam et al. (2013) and Lyu et al. (2017).
3.1 Overall characteristics of O3 pollution in Jinan
Figure 2 shows the time series of trace gases; OH reactivity of VOCs, CO and NOx; and meteorological conditions on the VOC sampling days in Jinan (trace gases in the whole sampling period are shown in Fig. S4). All the OH reactivity values discussed in this study were calculated rather than observed ones. The OH reactivity of VOCs was categorized into carbonyls, biogenic VOCs (BVOCs), aromatics, alkenes and alkanes (Table S3 lists the VOCs included in each group). The reaction rate constants between O3 precursors and OH in the calculation of OH reactivity were adopted from the MCM v3.2. The average total OH reactivity on all the VOC sampling days (19.4±2.1 s−1) was comparable to that reported in New York (19±3 s−1, Ren et al., 2003), Houston (9–22 s−1, Mao et al., 2010) and Beijing (15–27 s−1, Williams et al., 2016). Consistent with previous studies in urban areas (Ren et al., 2003; Yang et al., 2016 and references therein), NOx was the largest contributor (28.9±1.9 %) to the total OH reactivity. Noticeably, 20.5±4.1 % of the total OH reactivity was attributable to BVOCs, which were much higher than the contributions in urban areas (<10 %) reviewed by Yang et al. (2016). The elevated isoprene levels (2.2±0.6 ppbv during episodes and 0.9±0.3 ppbv during non-episodes) under high temperature (mean: 31 ∘C) explained the considerable contribution of BVOCs to the total OH reactivity in this study.
The total OH reactivity of VOCs and CO (OH reactivityVOCs+CO) was comparable between O3 episodes (14.8±2.0 s−1) and non-episodes (12.2±3.0 s−1), so was the OH reactivity of NOx (4.7±0.8 and 6.9±1.9 s−1 during episodes and non-episodes, respectively). Taking the positive biases of NO2 measurements into account (Sect. 2.2.1), we found that the OH reactivity of NOx was overestimated by up to 17.5±1.1 % and 5.4±0.7 % during O3 episodes and non-episodes, respectively. In the case of maximum overestimation, the actual OH reactivity of NOx during episodes (4.0±0.7 s−1) might be lower (p<0.05) than that during non-episodes (6.6±1.9 s−1). The high OH reactivity during non-episodes mainly occurred on 30 July and 1 August, due to the unfavorable meteorological conditions, which are discussed later. Despite the comparable OH reactivity, we found that the ratio of during O3 episodes (3.7±0.7 s−1 s1) was higher than during non-episodes (2.0±0.4 s−1 s1) (p<0.05). The difference was likely even larger, due to the more significant overestimation of NO2 during episodes. This indicated that O3 formation was more limited by VOCs during non-episodes than during episodes. Indeed, O3 formation in Jinan switched from the VOC-limited regime during non-episodes to the transitional regime during episodes (see Sect. 3.4.2). This partially explained the build-up of O3 on episode days, because the transitional regime features the highest O3 production rates.
From the aspect of meteorological conditions, O3 episodes had relatively stronger solar radiation, higher temperature, lower relative humidity and weaker winds (p<0.05). This is reasonable as O3 formation and accumulation are generally enhanced under these weather conditions. In particular, the solar radiation on 30 July was much weaker than that during O3 episodes, primarily accounting for the low O3 on this day. Figure S5 shows the COD retrieved from the Terra MODIS (https://ladsweb.modaps.eosdis.nasa.gov/search/imageViewer/1/MOD06_L2–61/2017-08-06/DB/Site:142/2873994172–3, last access: 12 September 2018) at 10:00–12:00 LT on all the VOC sampling days. The Terra MODIS image revealed thick cloud cover with high COD over Jinan on 30 July, which caused the weak solar radiation. The influences of cloud cover/COD and solar radiation on O3 pollution are further discussed in Sect. 3.2. Unlike our previous understanding that O3 pollution is aggravated under high pressure (Chan and Chan, 2000; Zhao et al., 2009), the sea-level pressure during O3 episodes (993.4±0.2 hPa) was significantly lower than during non-episodes (996.1±0.4 hPa) in this study (p<0.05). When O3 reached its hourly maximum on 10 August (154.1 ppbv), the pressure was at its lowest value (990.2 hPa). This discrepancy inspired us to look into the synoptic and chemical processes in this continuous O3 pollution event.
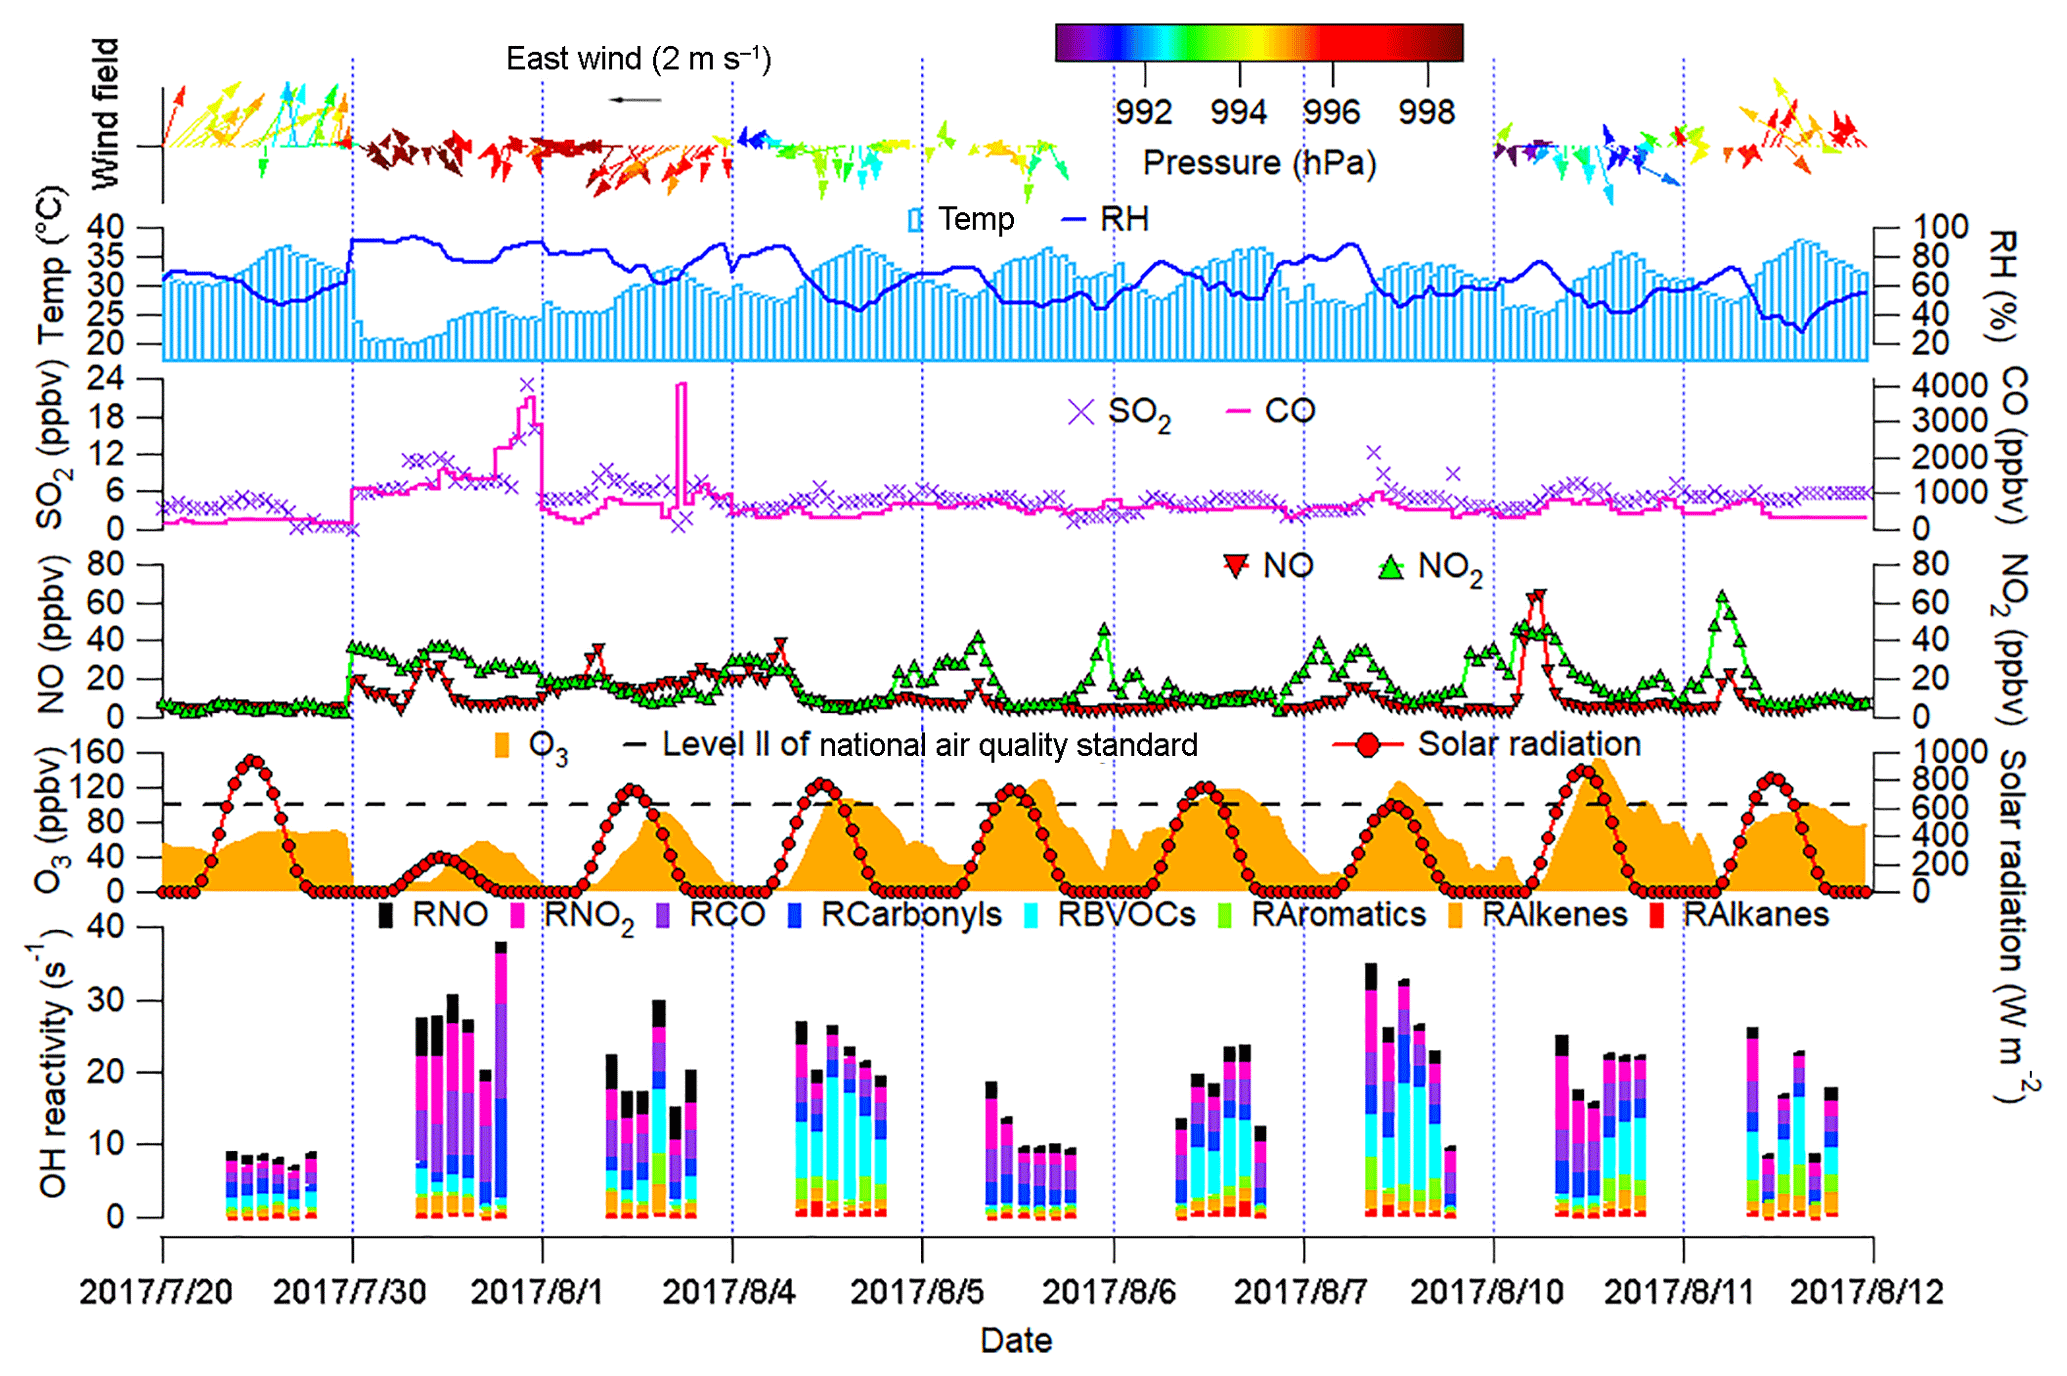
Figure 2Time series of trace gases, OH reactivity of O3 precursors and meteorological parameters. Wind speed and wind direction were not monitored from 17:00 LT on 5 August to 23:00 LT on 7 August due to malfunction of the weather station. RH in the top panel denotes the relative humidity. RX in the bottom panel is the OH reactivity of species/group X.
3.2 Synoptic processes and relationship with O3 pollution
Figure 3 displays the average weather charts at 14:00 LT during O3 episodes and non-episodes (weather charts on individual VOC sampling days are shown in Fig. S6). Clearly, the temperature in Shandong province was much higher during O3 episodes than non-episodes, which favored O3 formation on episode days. Additionally, southerly and southwesterly winds originating from the inland areas (Hubei, Henan and Anhui provinces) prevailed in central and western Shandong during O3 episodes. In contrast, the winds were generally from the sea or coastal regions in Jiangsu province during non-episodes. It is more likely that O3 and O3 precursors were transported to Jinan during episodes. The high concentrations of O3 precursors on 30 July and 1 August (non-episode days) were mainly caused by the weather conditions (high pressure, low temperature and low solar radiation), as discussed in Sect. 3.1. Further, we also noticed that the winds changed direction from the southwest to the northwest around Jinan during O3 episodes. This meant that there might be a local circulation, hampering the dispersion of air pollutants during episodes. It seemed that the change in wind direction was caused by the convergence of continental air and sea breeze from Bohai Bay, similar to the convergence zone formed over the Pearl River estuary in southern China (Fung et al., 2005; Lo et al., 2006). Overall, the surface winds were more favorable for regional transport and accumulation of air pollutants during O3 episodes. In addition, Shandong province was under the control of a uniform pressure system with the sea-level pressure of 1000–1001 hPa during O3 episodes, implying the relatively stagnant weather.
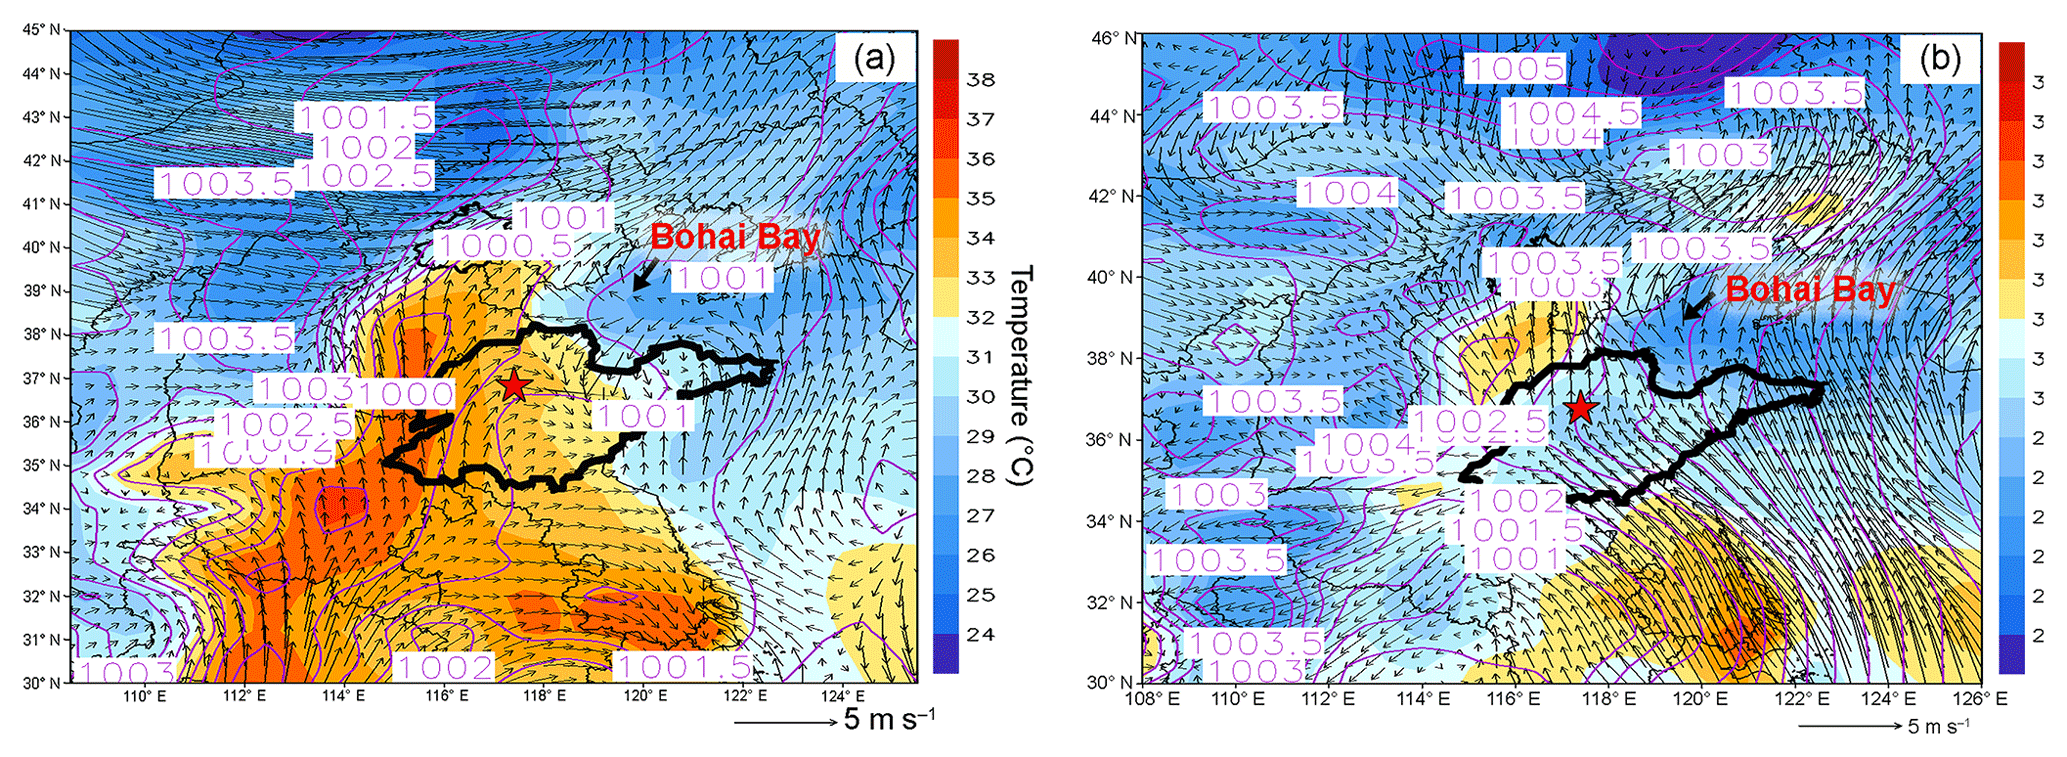
Figure 3Weather chart at 14:00 LT averaged over (a) O3 episodes and (b) non-episodes. The red star represents Jinan. The dark black line is the boundary of Shandong province. Bohai Bay is located to the northeast of Shandong province. Numbers in the figure are sea-level pressures in units of hectopascal (hPa).
To better understand the relationship between O3 pollution and the synoptic systems, Table 1 summarizes the synoptic systems, weather conditions and air mass origins on all the VOC sampling days. The weather charts at surface level and 500 hPa on 1, 4, 7, 10 and 13 August are presented in Figs. S7 and S8, showing the evolution of the synoptic systems. To identify the origins of air masses, the backward trajectories of air masses are shown in Fig. 4. The trajectories were computed using the Hybrid Single-Particle Lagrangian Integrated Trajectory (HYSPLIT) model v4.9. Each trajectory was calculated for 48 h and the calculation was done every 6 h (four trajectories each day). Our sampling site (36.68∘ N, 117.07∘ E) was set as the end point of the trajectories with the height of 500 m a.s.l. The discrepancy between the wind direction and origin of air masses, e.g., on 1 and 11 August, was likely due to the air recirculation at the ground level.
It was found that Jinan was under the control of the WPSH on 20 July (weather chart on 500 hPa is not shown here), and the air masses arriving in Jinan originated from southern China (Fig. 4). As anticipated, the WPSH caused high temperatures and the intensive solar radiation (Fig. 2), which was conducive to O3 formation. However, the winds on 20 July were the strongest in the entire VOC sampling period, with the highest hourly wind speed of 3.9 m s−1. The strong winds facilitated the dispersion of O3 and its precursors, leading to low O3 levels on this day. The WPSH moved southward on the following days and Jinan was controlled by a uniform pressure system, which was formed in the peripheries of two low-pressure systems (two rain belts as shown in Fig. 1), i.e., one over central China and another over northern China (Fig. S7). Thus, the pressure in Jinan was relatively high (997.1±0.3 hPa), compared to the south and north regions. This synoptic system lasted for several days until 7 August, covering 2 non-episode days and 4 O3 episode days. The low O3 on 2 non-episode days (30 July and 1 August) was mainly attributable to the weak solar radiation and low temperature as discussed above.
In contrast, continuously strong solar radiations with low COD (Figs. 2 and S5), high temperature and continental air masses (Fig. 4) were observed on 4–7 August. This, in addition to the shift in the O3 formation mechanism (see Sects. 3.1 and 3.4.2), explained the prolonged O3 pollution event. On 10 August, the rain belt over northern China moved southward, forming a deep low-pressure trough over the NCP, and Jinan was behind the trough (Fig. S8d). The low-pressure trough is a typical synoptic system conducive to O3 pollution, resulting from the intrusion of O3 in the stratosphere and/or the upper troposphere (Chan and Chan, 2000). Moreover, there was nearly no cloud cover over the entire NCP on 10 August (Fig. S5). Consequently, the highest O3 (154.1 ppbv) in this sampling campaign was observed. On 11 August, the low-pressure system continued to extend to the Yellow Sea. O3 decreased substantially on this day with the disappearance of the low-pressure trough and the weakening of solar radiation, though the hourly maximum O3 mixing ratio still reached 100.4 ppbv. On the following days, the precipitations relieved the O3 pollution in Jinan.
Table 1Summary of the synoptic systems, weather conditions and air mass origins on VOC sampling days.
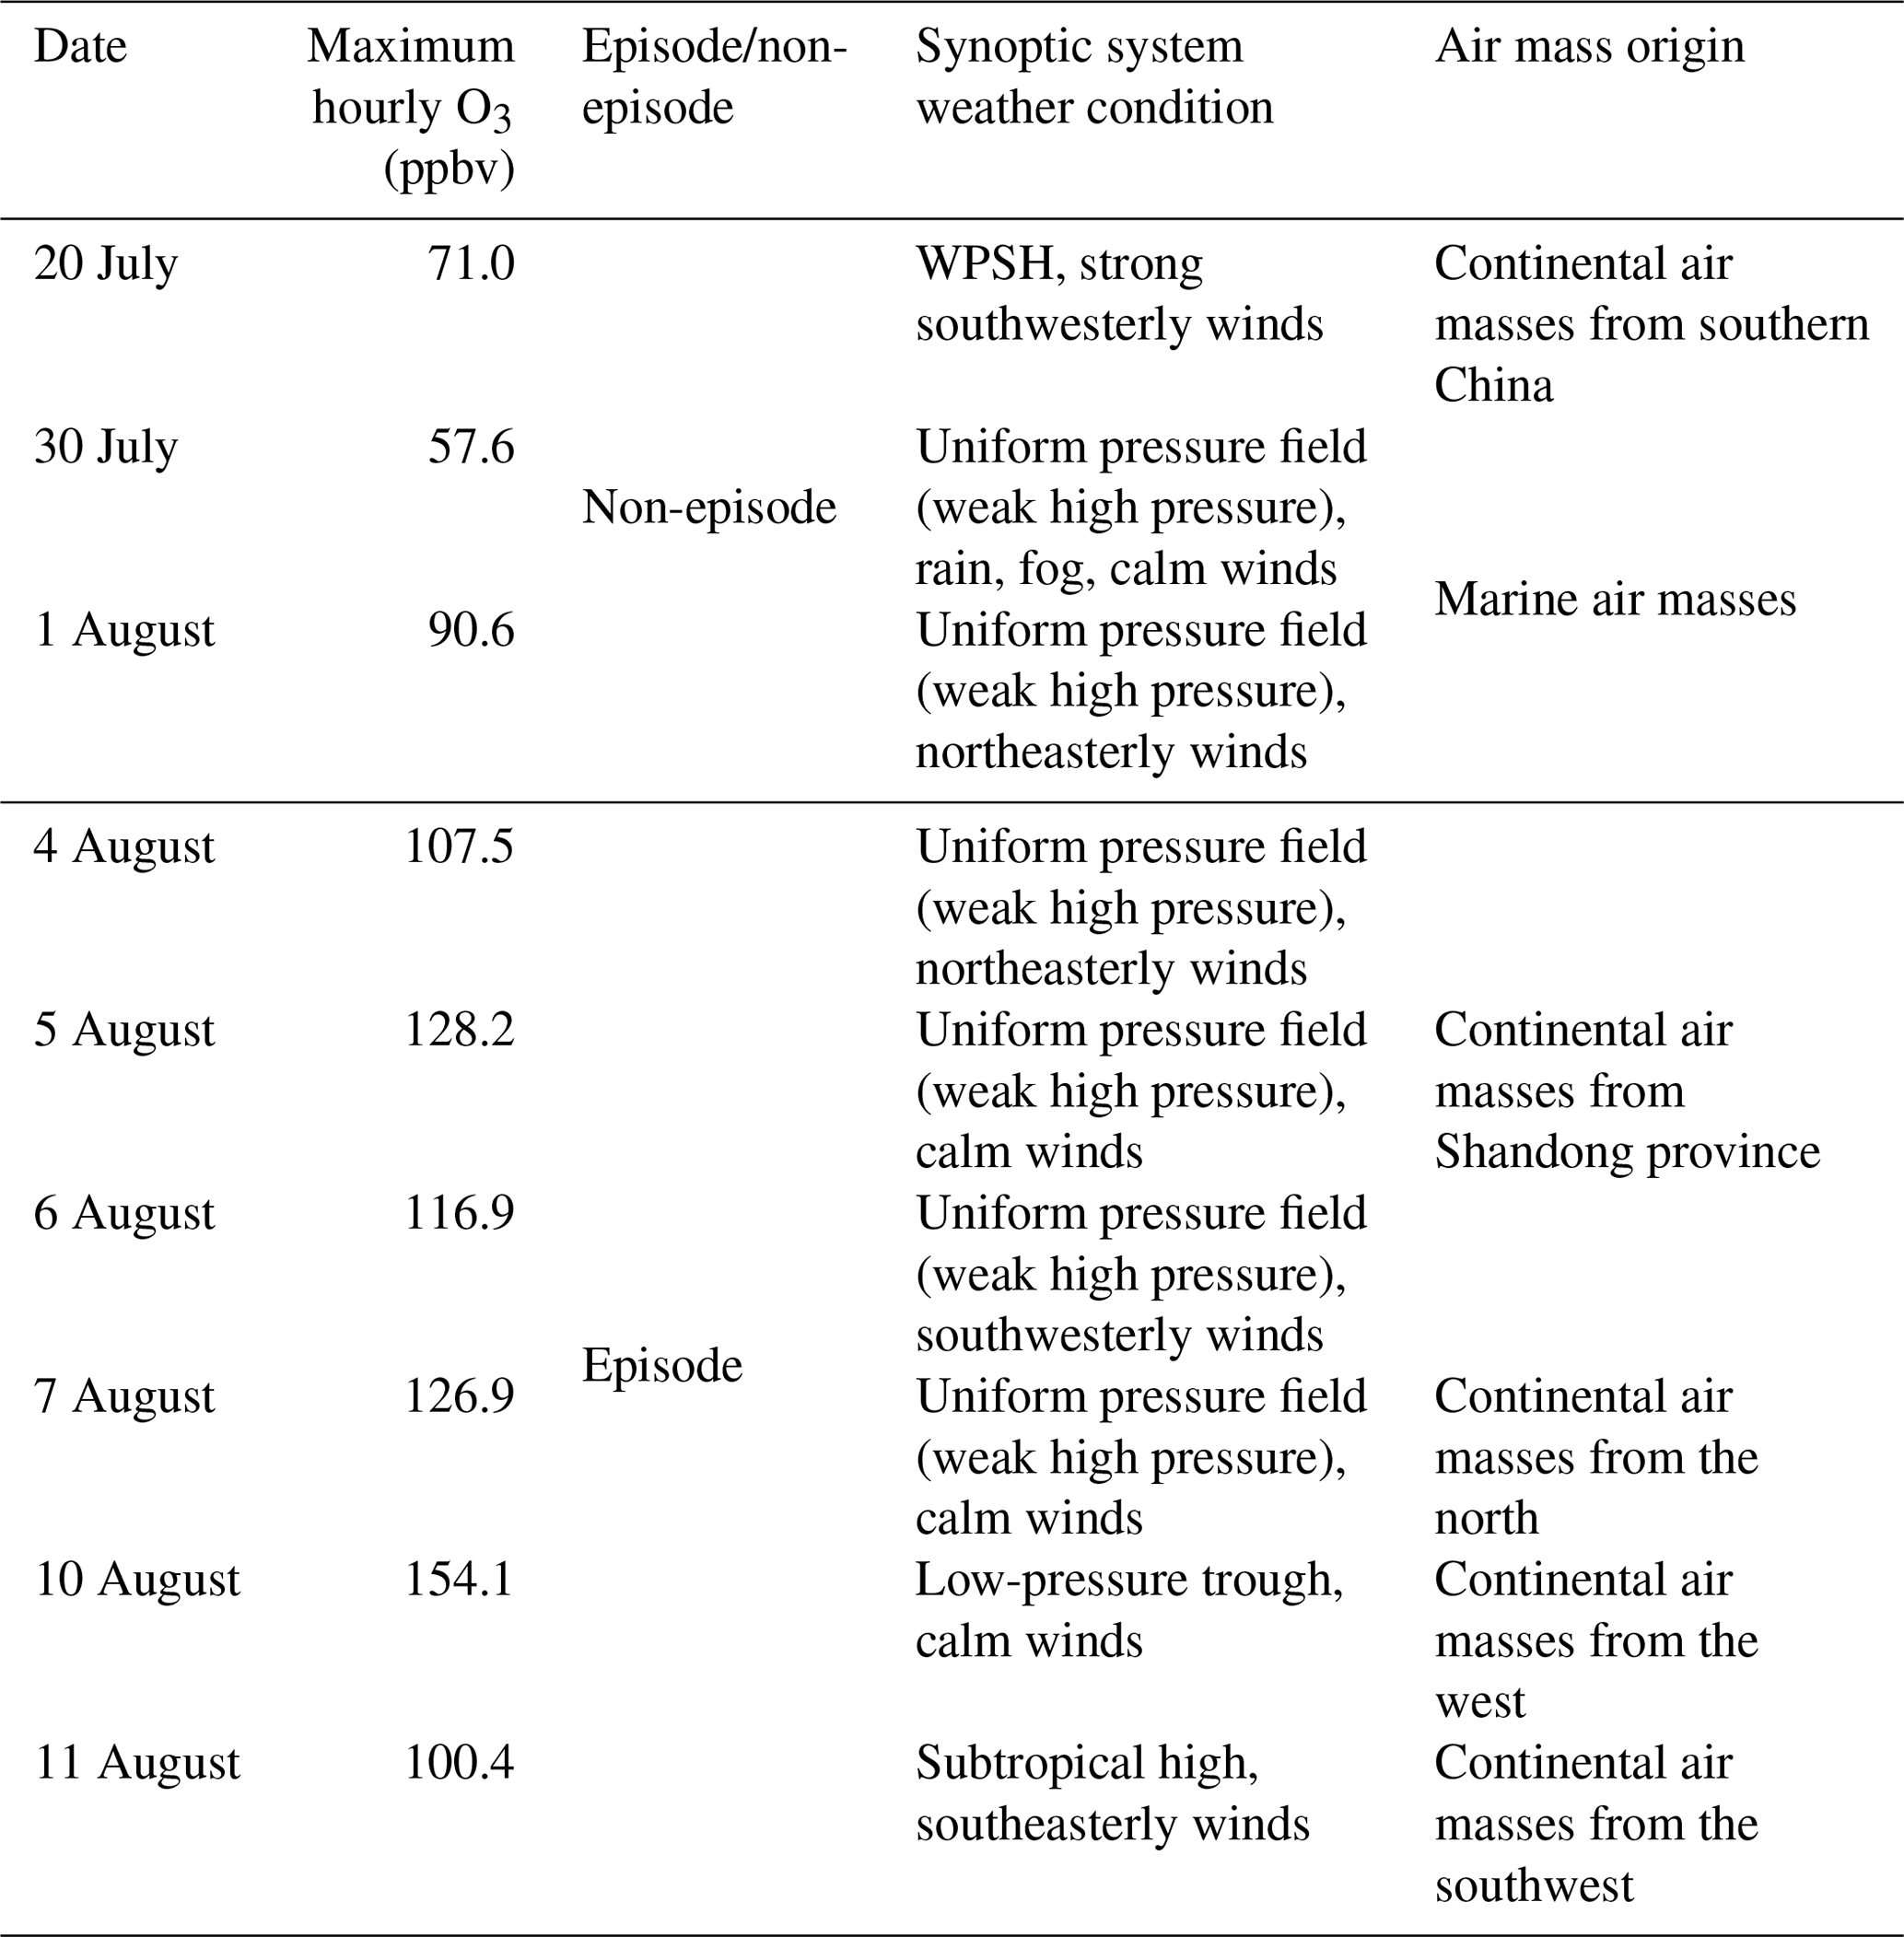
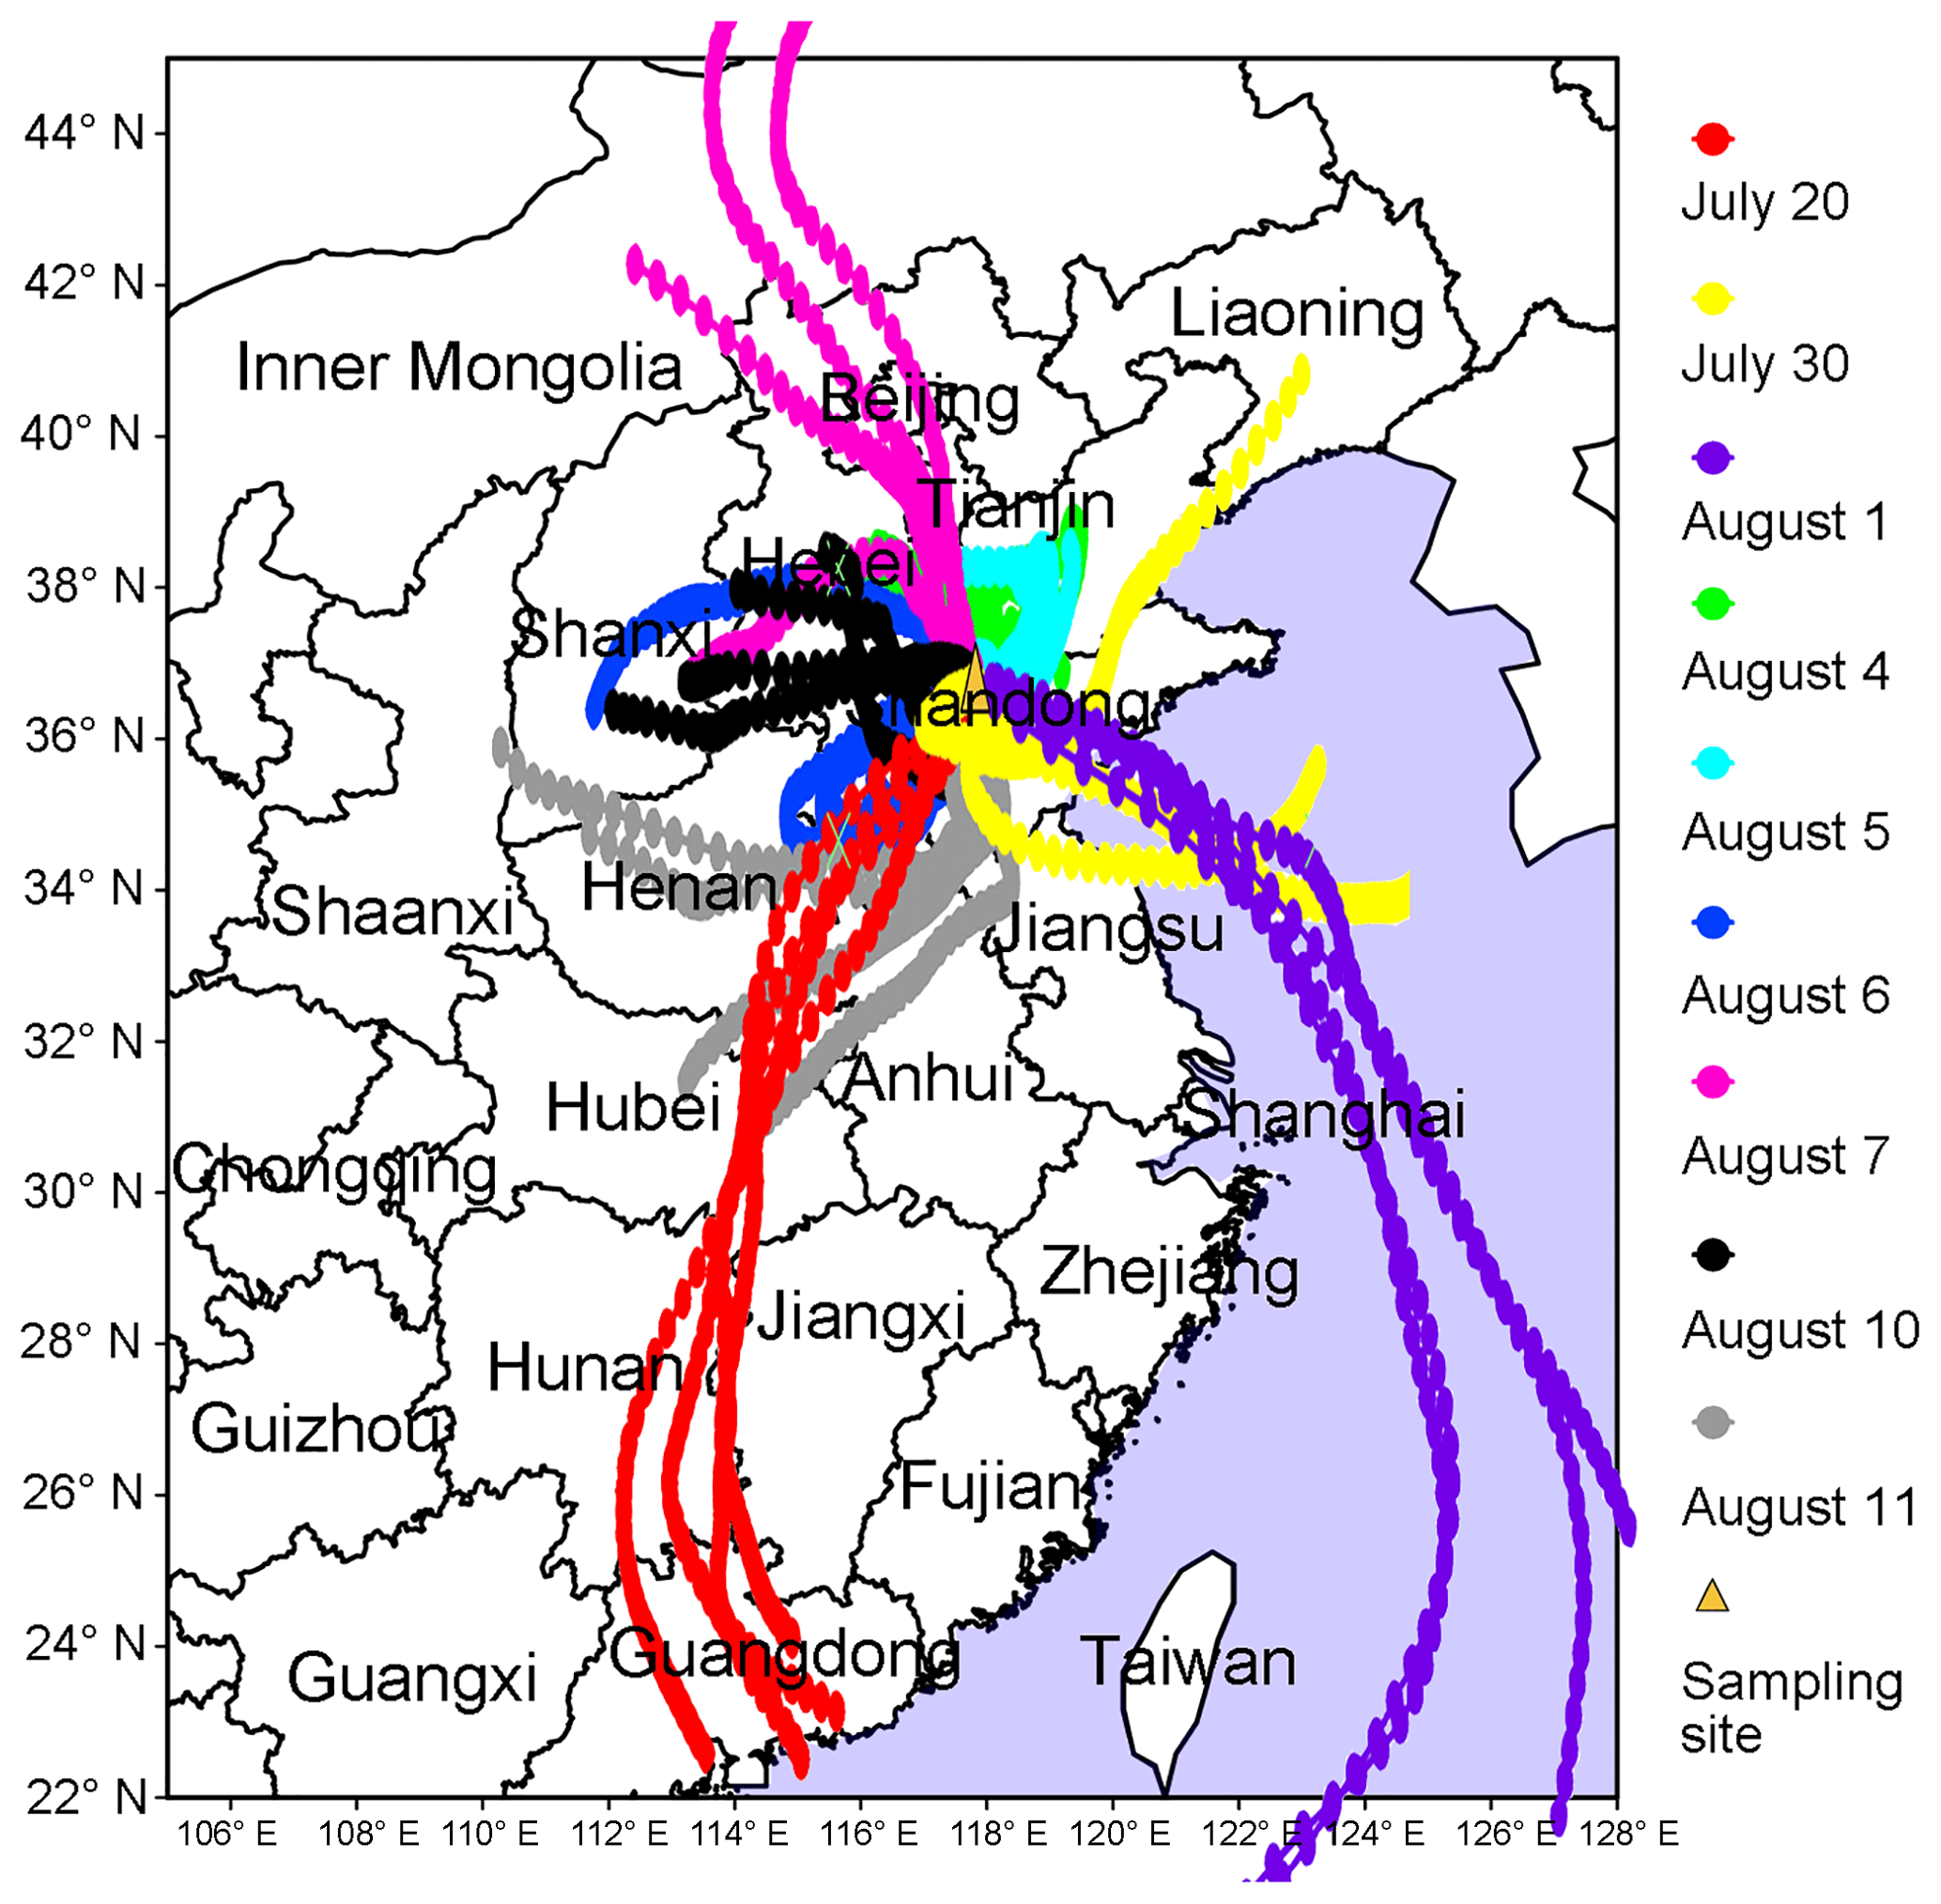
Figure 4The 48 h backward trajectories calculated every 6 h, with Jinan (36.68∘ N, 117.07∘ E; 500 m a.g.l.) as the ending point. The trajectories are simulated by HYSPLIT v4.9. The water areas are highlighted in blue.
3.3 O3 simulation and process analysis
The observations indicated the likely different regimes controlling local O3 formation and the potential impacts of regional transport. To understand the atmospheric chemistry and dynamics, as well as their roles in this O3 pollution event, the WRF-CMAQ was applied. Figure 5 shows the hourly average simulated and observed O3 on the VOC sampling days in Jinan. Overall, the model reproduced the magnitudes and diurnal patterns of the observed O3 well, except for the higher simulated O3 on 20 July and the under-prediction of O3 on 1, 7 and 10 August. Discussions on the discrepancies and the model validation were provided in Text S1, Figs. S9–S11 and Table S4.

Figure 5Hourly average mixing ratios of the WRF-CMAQ simulated and observed O3 in Jinan. The grey area shows the minimum and maximum simulated O3 at the sampling site and eight adjoining grids (12 km×12 km for each grid).
The IPR analysis quantified the O3 variation rates induced by different processes, as shown in Fig. 6. HDIF and HADV were summed as horizontal transport (HTRA), and the vertical transport (VTRA) was a total representative of VDIF and VADV. It was found that chemical reactions generally led to the decrease in the O3 mixing ratio during non-episodes. The negative contributions of chemical reactions on 20 July coincided with the very low concentrations of O3 precursors and the flat diurnal cycle of O3 (Fig. 2). The chemical destruction to O3 on 30 July and 1 August was most likely related to the weak solar radiation and low temperature, which inhibited the photochemical reactions. In fact, the negative chemical effect should be considered as the titration of NO to the regionally transported and/or background O3 and the depletion of O3 by the freshly emitted NO near the sources (Beck and Grennfelt, 1994; Sillman, 1999). Conversely, the combined effect of horizontal and vertical transport was to increase O3 levels during non-episodes.
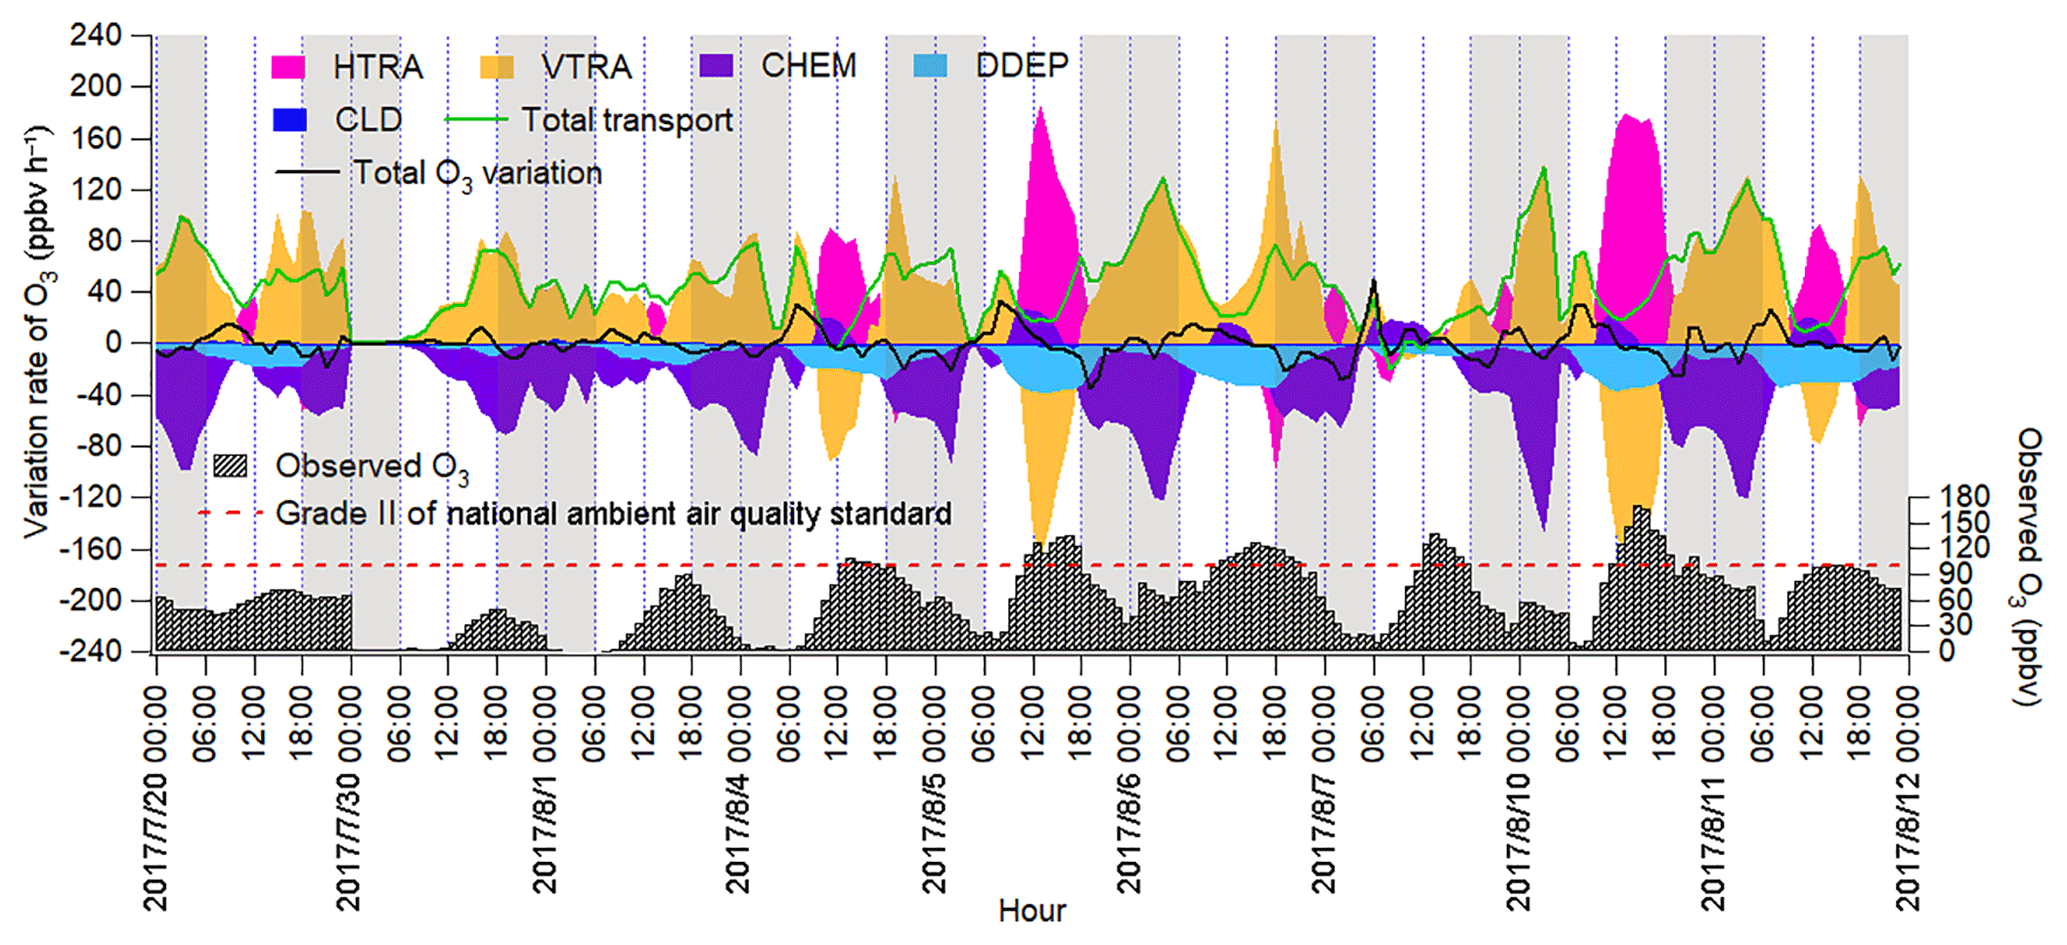
Figure 6Time series of O3 variation rate in Jinan induced by individual processes calculated based on the change in O3 per hour. Total transport is the sum of HTRA and VTRA, and the sum of O3 variation rates attributable to all the processes is represented by the total O3 variation rate. The nighttime (18:00–06:00 LT) has been highlighted in grey.
During O3 episodes, chemical reactions made positive contributions to O3 production rates between 09:00 and 15:00 LT, with the average hourly O3 production rate of 14.0±2.3 ppbv h−1. At the same time, O3 was also elevated by transport at an average rate of 18.7±4.0 ppbv h−1, as a combined effect of vertical transport ( ppbv h−1) and horizontal transport (59.5±19.8 ppbv h−1). The negative contribution of vertical transport to O3 in these hours might be caused by the updraft with the increase in temperature in the city. The positive contributions of horizontal transport could be explained by the air masses laden with O3 originating from the west and the north (Figs. 4 and S10). The much-higher O3 over the NCP than in the surrounding regions indicated that the NCP was an O3 source in this case. In fact, the transport of O3 from the lower troposphere over the NCP to the free troposphere and further to northeast China was also presented by Ding et al. (2009).
During 16:00–08:00 LT on O3 episode days, O3 was titrated and chemically consumed at the rate of 49.4±6.3 ppbv h−1. This was reasonable, because the fresh vehicular emissions in the morning and evening rush hours consumed O3, particularly the irreversible titration of NO to O3 in the absence of sunlight. The NO2 produced from the titration reaction was carried over to the other places by air circulation and/or oxidized to NO3 and N2O5, which could further react with aerosol to form HNO3 and ClNO2 in the evening. Horizontal and vertical transport dominated O3 sources, with the average positive contribution of 5.7±7.0 and 54.5±9.6 ppbv h−1 during 16:00–08:00 LT on 4–11 August, respectively. The strong vertical transport coincided with the downward winds in the evening, which brought the high-altitude O3 to the ground, as indicated in Fig. S9. However, the sources of O3 in the upper atmosphere were beyond the scope of this study.
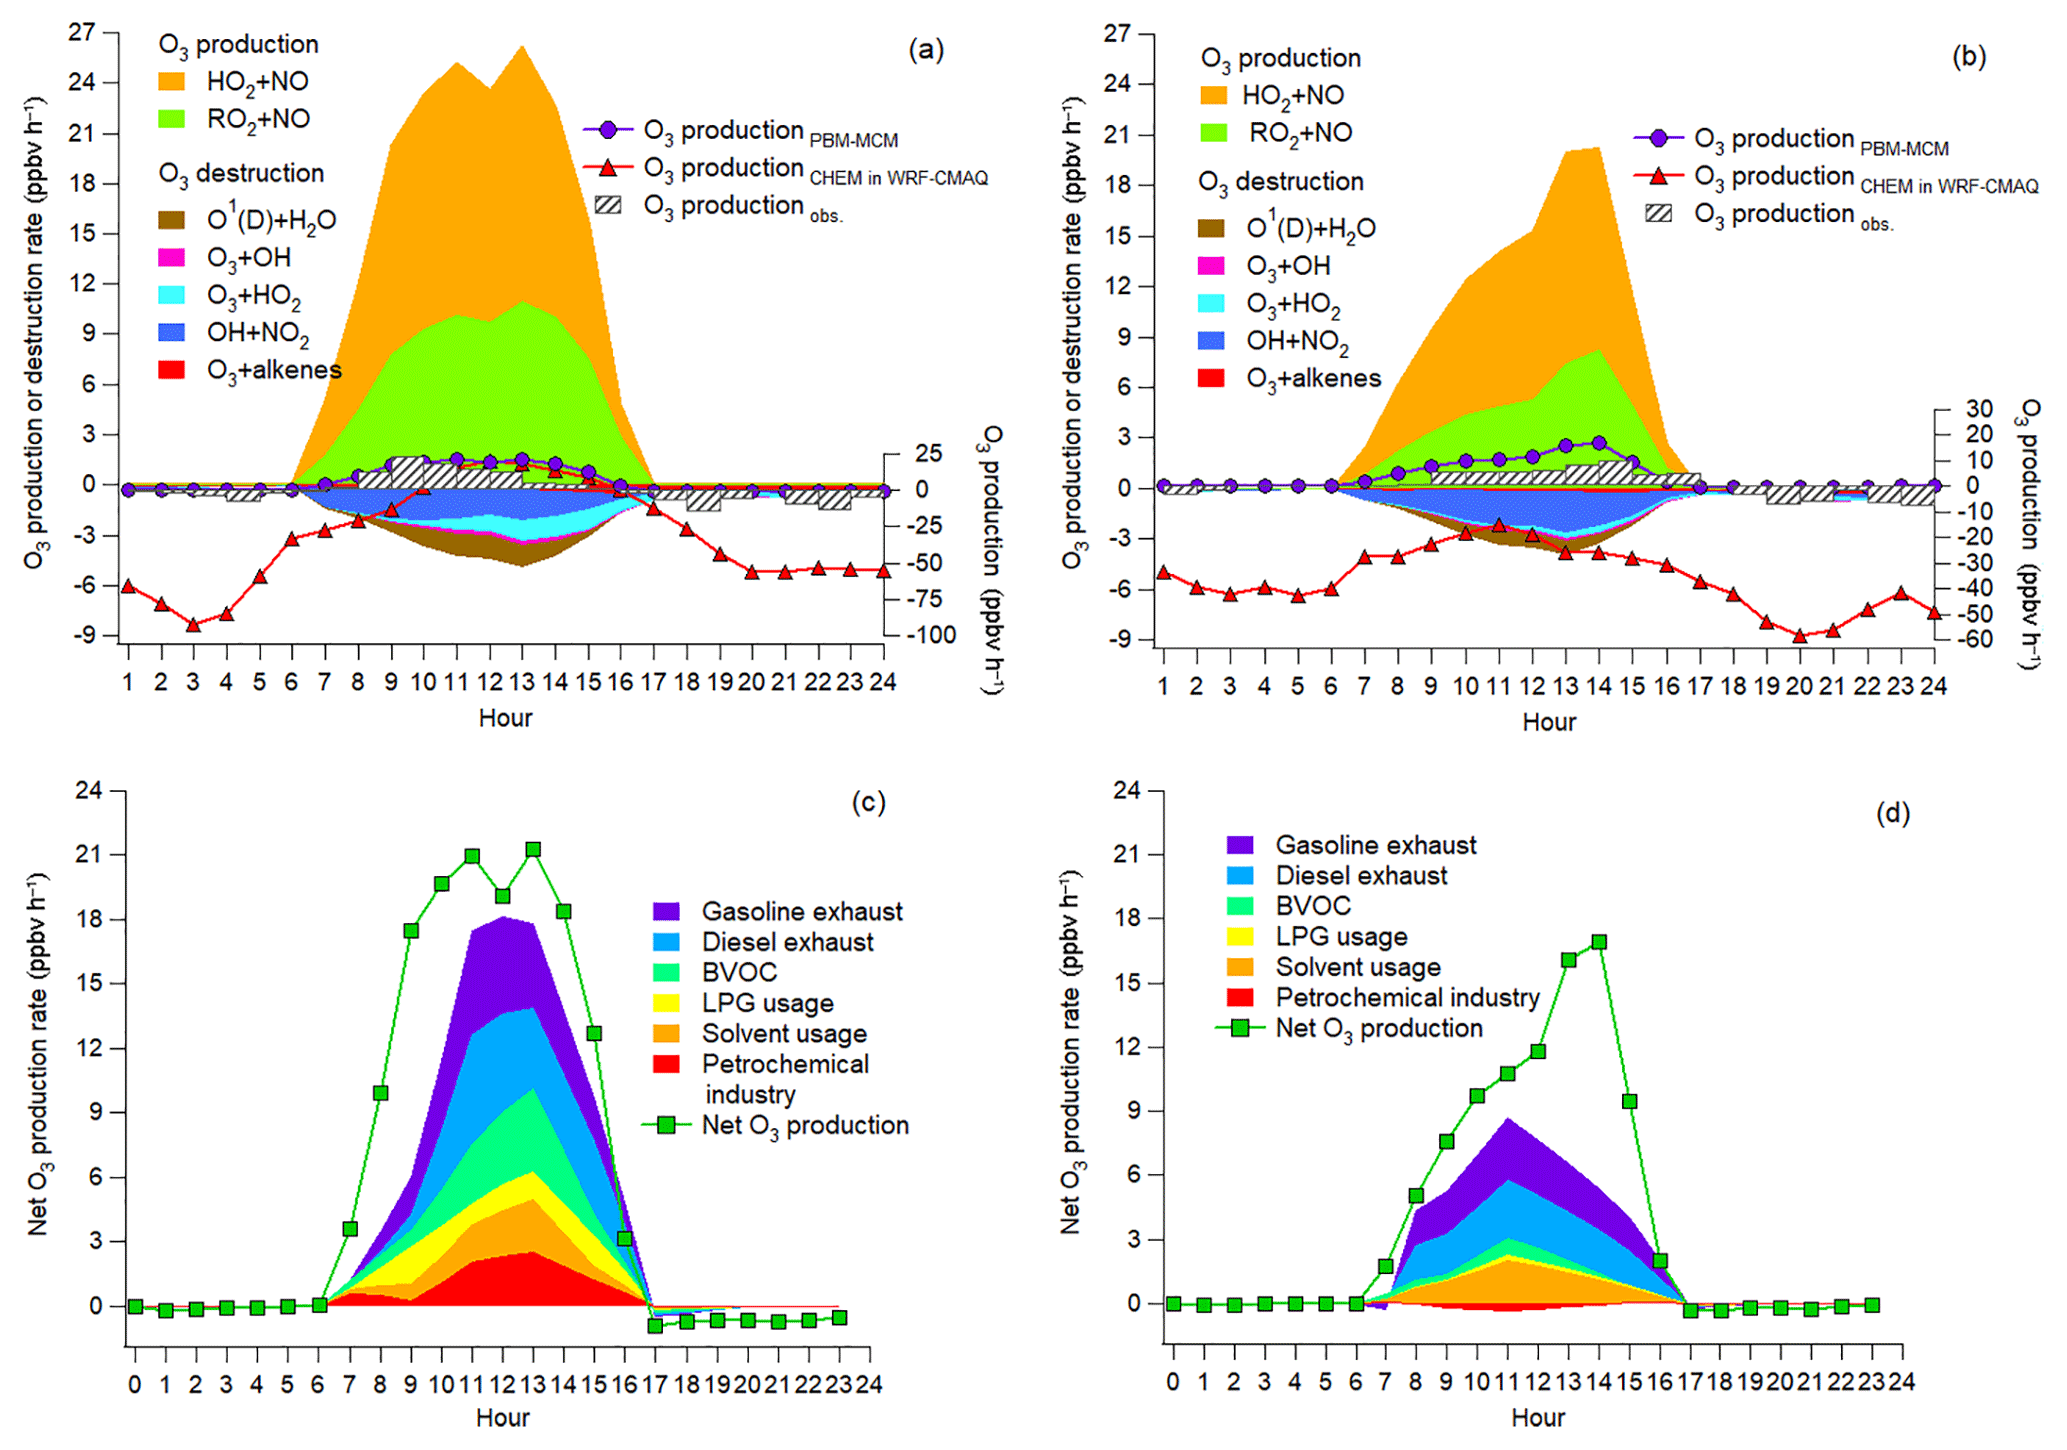
Figure 7Pathway contributions to O3 production and destruction rate during episodes (a) and non-episodes (b). Contributions of O3 precursor sources to the net O3 production rate during episodes (c) and non-episodes (d).
3.4 Local O3 formation and control
3.4.1 Pathway and source contributions to O3 production
The IPR analyses showed that chemical reactions served as an important source of O3 on episode days in Jinan, particularly during 09:00–15:00 LT when O3 was at high levels. This process was further studied through the simulation of the in situ photochemistry by PBM-MCM. It should be noted that the simulations were based on the observed concentrations of O3 precursors, which could be influenced by both local and regional air. Caution was required to extend the results to all the situations in Jinan, because the regional effect was not always consistent. Table S5 lists the production and destruction pathways of O3 (Thornton et al., 2002; Monks, 2005; Kanaya et al., 2009). Briefly, the oxidation of NO by HO2 and RO2 produced NO2, which led to O3 formation following NO2 photolysis (Reactions R2 and R4–R5 in Sect. 1). Therefore, the reactions between NO and HO2∕RO2 were considered as the production pathways of O3. To account for O3 destruction, the reaction between O1(D) and H2O denoted the photolysis of O3, and reactions of O3 with OH, HO2 and alkenes were also included. Furthermore, since HNO3 was an important sink of NO2, the reaction between OH and NO2 was treated to be destructive to O3. The titration of O3 by NO was not included in O3 destruction, because NO2 produced in this reaction was not considered as a source of O3.
Table 2Contributions to VOCs, CO, NO, NO2 and the O3 production rate by the sources of O3 precursors averaged on the VOC sampling days in Jinan (Unit: % unless otherwise specified).
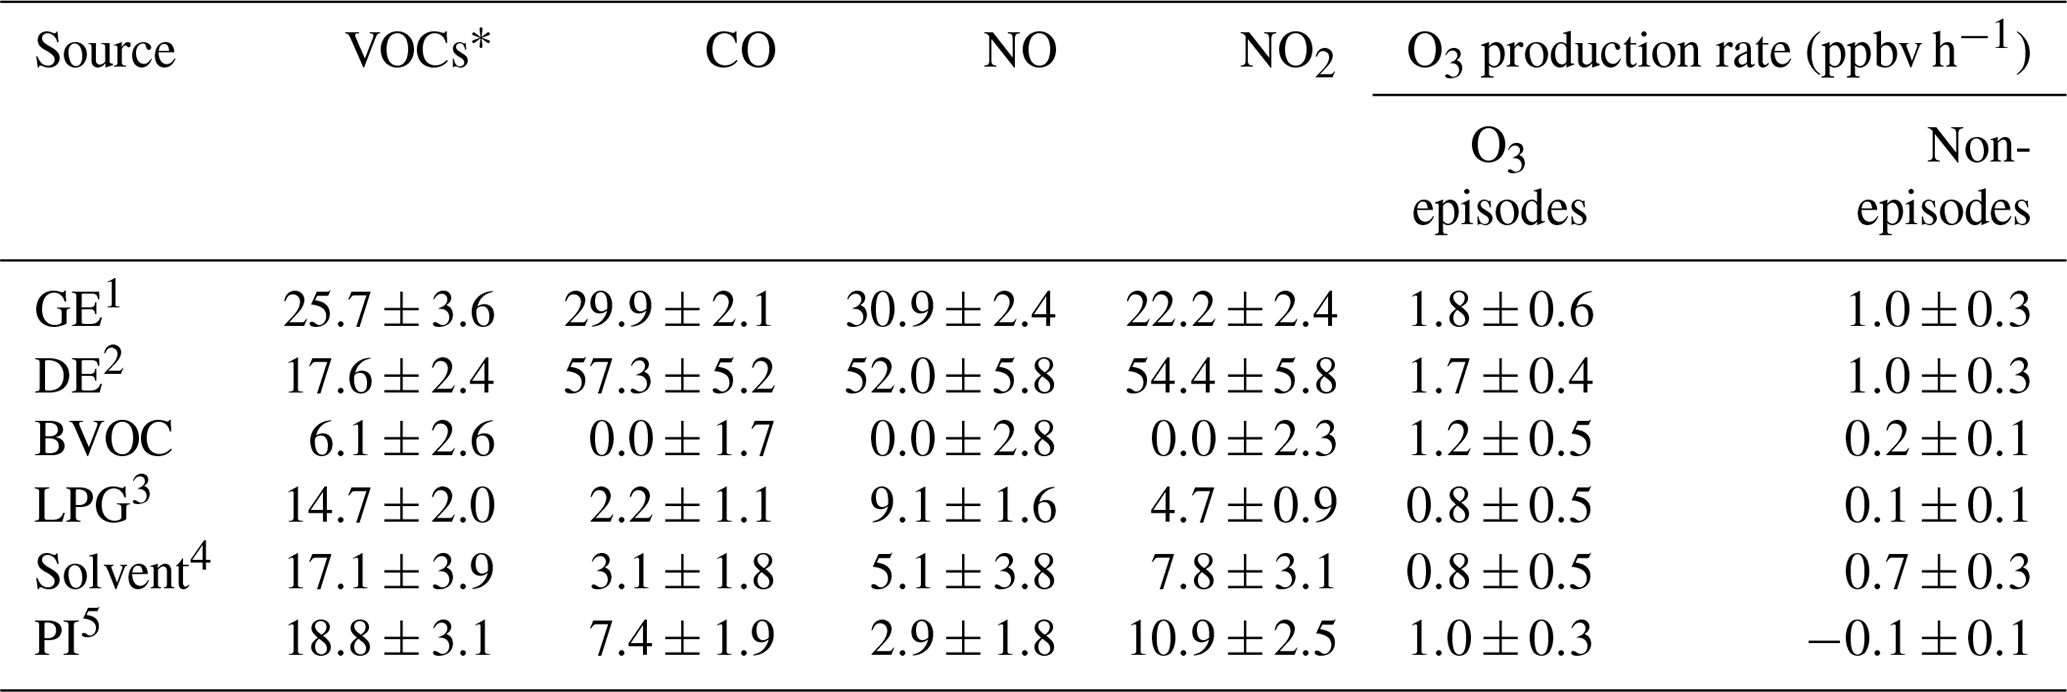
VOCs*: VOCs applied in source apportionment (see Text S2). 1 Gasoline exhaust. 2 Diesel exhaust. 3 Liquefied petroleum gas (LPG) usage. 4 Solvent usage. 5 Petrochemical industry.
Figure 7a and b show the average diurnal cycles of the simulated contributions to O3 production rates of different pathways. Also shown are the net O3 production rates simulated by PBM-MCM (O3 productionPBM-MCM), those simulated by WRF-CMAQ (O3 productionCHEM) and those calculated from the observed hourly O3 (O3 productionobs.). Overall, O3 productionPBM-MCM and O3 productionobs. were on the same magnitudes, especially during O3 episodes with more stagnant weather conditions. This indicated that the PBM-MCM model reasonably reproduced the in situ O3 photochemistry. Though obvious discrepancies existed between O3 productionCHEM and O3 productionPBM-MCM, they agreed well with each other during 10:00–15:00 LT on episode days, consistent with the finding that chemical reactions made great contributions to O3 in these hours (Fig. 6). The lower or even negative O3 productionCHEM resulted from the titration of the regionally transported and/or local background O3 by NO and the following depletion of NO2 through reaction with OH and/or dispersion. Differently, PBM-MCM did not consider the transport of O3, though the transport effect was partially represented by constraining the model to the observed concentrations of O3 precursors. In addition, the PBM-MCM was constructed by the observed air pollutants, which were already subject to chemical reactions before being detected by the analytical instruments. This meant that the reaction between NO and O3 from the emission to the detection of NOx was not considered in PBM-MCM. However, as an emission-based model, WRF-CMAQ performed better in describing the reactions immediately after the emissions of air pollutants. Therefore, the chemical destruction of O3 in the vicinity of NOx sources also accounted for the aforementioned discrepancy. The obviously higher reaction rates between NO and O3 simulated by WRF-CMAQ (Fig. S12) confirmed our inferences.
During both O3 episodes and non-episodes, the reaction between HO2 and NO dominated over RO2 + NO in O3 production, while the O3 destruction was mainly attributable to the formation of HNO3, the reaction between O3 and HO2, and photolysis of O3. The net O3 production rate during O3 episodes (maximum: 21.3 ppbv h−1) was much (p<0.05) higher than during non-episodes (maximum: 16.9 ppbv h−1), which partially explained the higher O3 on episode days. In general, OH + NO2 serves as the chain-terminating reaction in the VOC-limited regime of O3 formation, while the radical–radical reactions take over the role in the NOx-limited regime (Finlayson-Pitts and Pitts Jr., 1993; Kleinman, 2005). Here, we found that the ratio of total reaction rates between HO2 + RO2 and OH + NO2 substantially increased from 0.2±0.1 during non-episodes to 1.0±0.3 during O3 episodes (p<0.05). This suggested that O3 formation during non-episodes was limited by VOCs, while it switched to being co-limited by VOCs and NOx during O3 episodes in view of the equivalent role of HO2 + RO2 and OH + NO2 in terminating the chain reactions.
Further, the contributions to the net O3 production rates of different sources of O3 precursors were identified, as presented in Fig. 7c and d. Text S2 and Fig. S13 illustrate the source apportionment of O3 precursors and the simulations of the source-specific contributions to O3 production rates. The results are presented in Table 2. Since the source apportionment was performed for the ambient O3 precursors which were already subject to atmospheric processes, such as dispersion, deposition and chemical reactions, the results represented the source contributions to the steady-state concentrations of O3 precursors and the corresponding O3 production rates. It was found that gasoline exhaust and diesel exhaust were the largest contributors to O3 production rates regardless of O3 episodes or non-episodes. Further, the net O3 production rates attributable to gasoline exhaust (diesel exhaust) increased from 1.0±0.3 ppbv h−1 (1.0±0.3 ppbv h−1) during non-episodes to 1.8±0.6 ppbv h−1 (1.7±0.4 ppbv h−1) during O3 episodes. This suggested that vehicular emissions played critical roles in building up ground-level O3 in the O3 pollution event. If carbonyls were taken into account, the contributions of vehicular emissions to O3 production rates were even higher than the currently simulated values, due to the abundances of carbonyls in vehicle exhausts (Grosjean et al., 1990; Granby et al., 1997). In addition, the contributions of the other sources to O3 production rates all increased during O3 episodes except for solvent usage (p>0.05), as listed in Table 2. It is not surprising to see the synchronous increases, because of the stronger solar radiation and higher temperature during episodes.
Further insight into the percentage contributions (not shown here) found that the contributions of BVOC, liquefied petroleum gas (LPG) usage and petrochemical industry to O3 production rates increased substantially from 9.9±4.2 %, 4.3±1.4 % and % during non-episodes to 19.2±4.3 %, 9.1±3.4 % and 12.1±3.1 % during O3 episodes, respectively. The increased O3 production rates by BVOCs could be explained by the increase in isoprene (episodes: 2.2±0.6 ppbv; non-episodes: 0.9±0.3 ppbv) under higher temperature and stronger solar radiation during O3 episodes. The enhancement of O3 production rates driven by petrochemical industry on episode days was likely associated with the dominance of continental air (Fig. 4) and the extensive petrochemical industries in the NCP. For example, the mixing ratio of styrene increased from 54.7±22.0 pptv during non-episodes to 162.3±44.7 pptv during O3 episodes. The reason for elevated O3 production rates resulting from LPG usage during episodes was unknown. It is worth noting that the source contributions to O3 production rates might have some uncertainties due to the limited number of samples (54 samples) and O3 precursors (31 VOCs, CO, NO and NO2) applied for source apportionment.
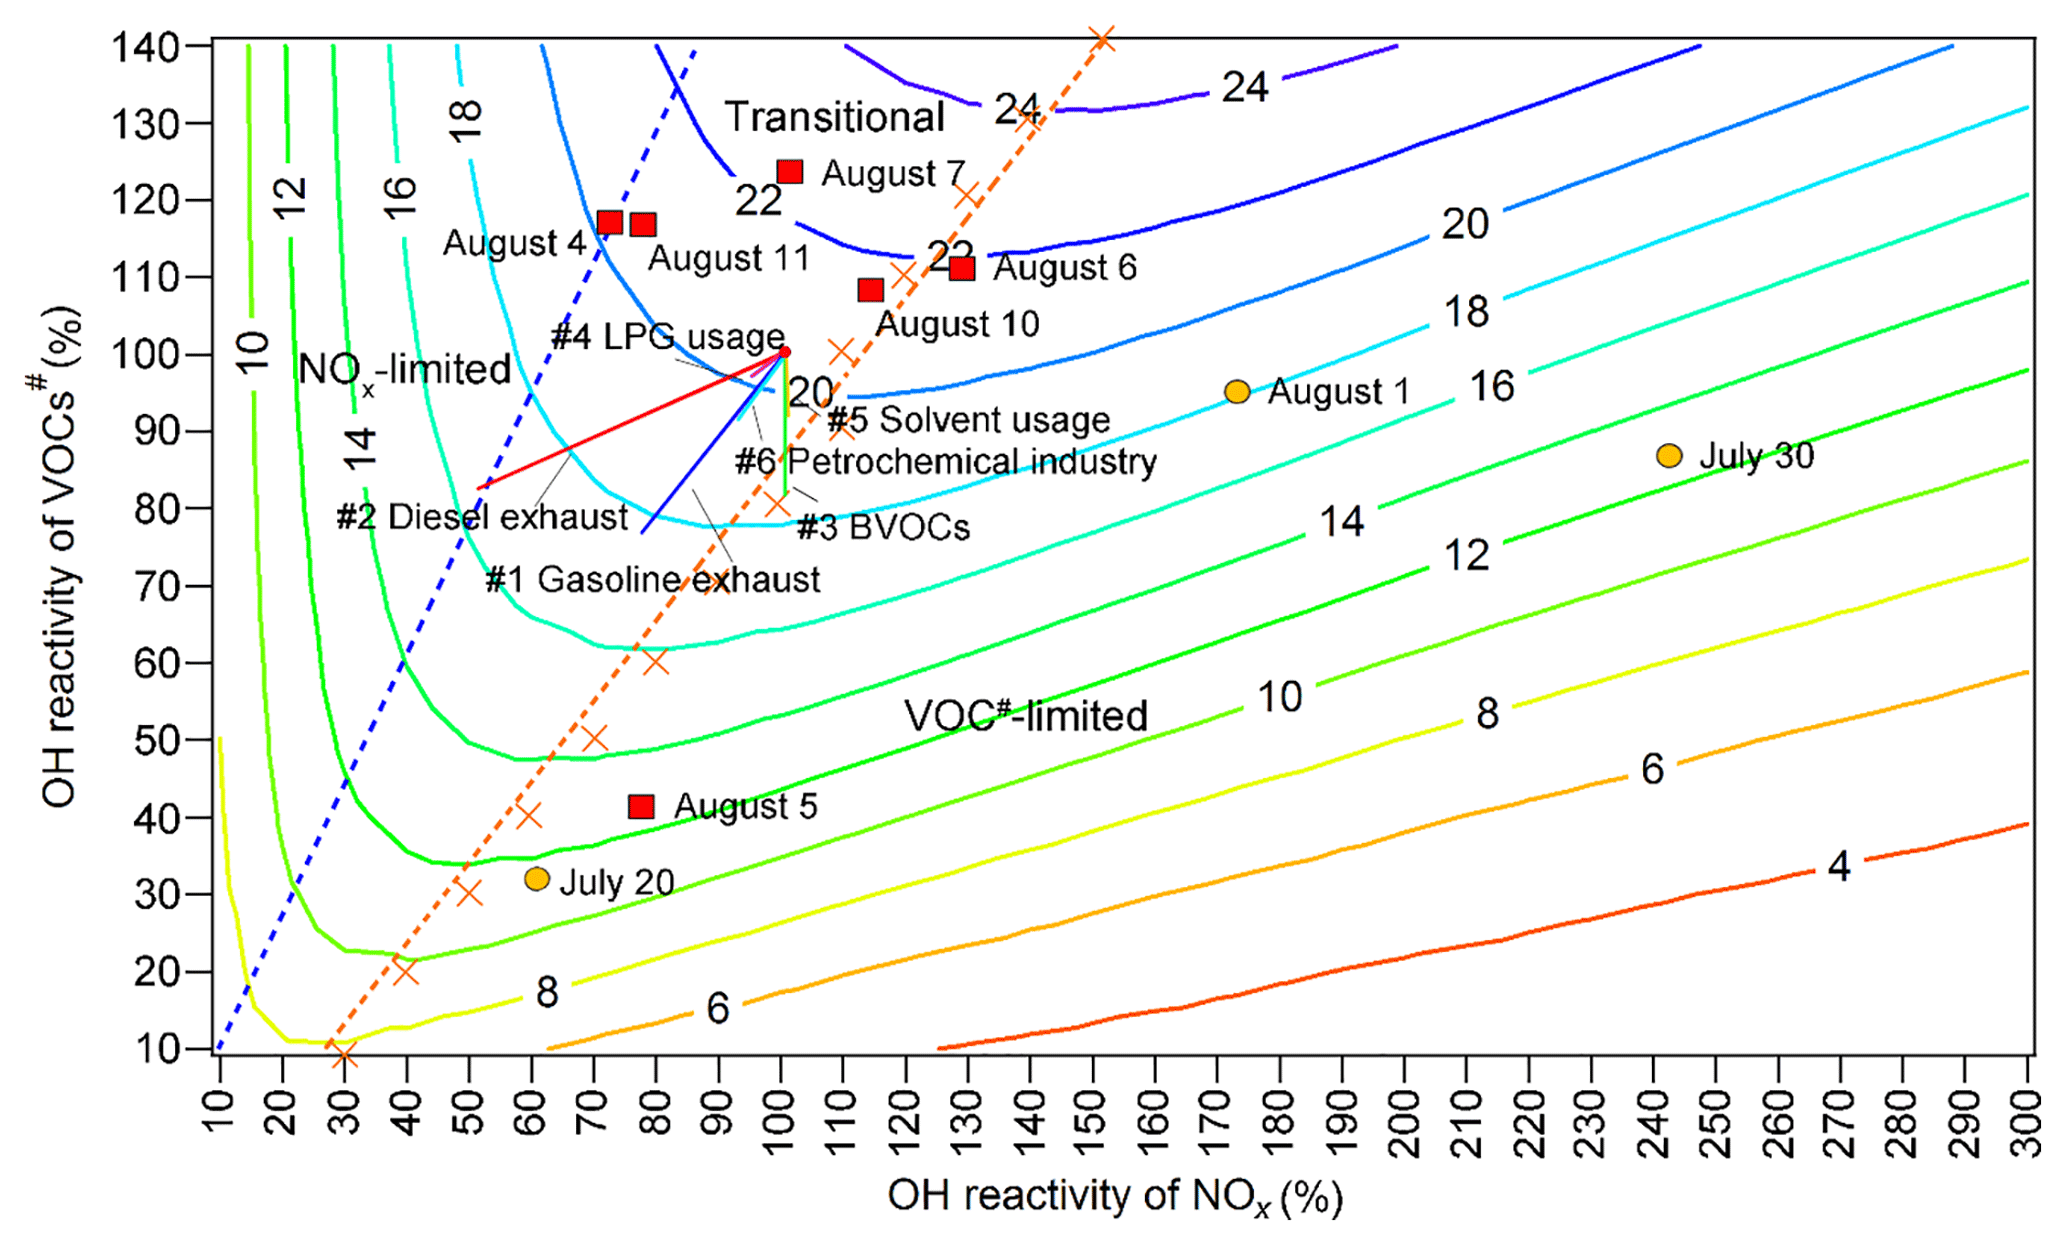
Figure 8Isopleths of the net O3 production rate (ppbv h−1) at 12:00 LT as a function of OH reactivity and OH reactivity. The red blocks and orange circles denote the calculated OH reactivity and OH reactivity values at 12:00 LT on O3 episode and non-episode days, respectively. Each orange cross represents the OH reactivity and OH reactivity at 12:00 LT in the scenario with the highest O3 production rate at a given OH reactivity. The dashed orange line and dashed blue line divide O3 formation into the VOC-limited regime, transitional regime and NOx-limited regime. Line 1 (solid straight blue line): gasoline exhaust; line 2 (straight red line): diesel exhaust; line 3 (straight green line): BVOCs; line 4 (straight pink line): LPG usage; line 5 (solid straight orange line): solvent usage; line 6 (straight light-blue line): petrochemical industry.
3.4.2 O3 control measures
Both WRF-CMAQ and PBM-MCM revealed the significant local O3 formation in the O3 pollution event. The relationships between O3 and its precursors needed to be clarified so that the science-based control measures could be taken. Throughout the VOC sampling period, the OH reactivity values of VOCs (OH reactivityVOCs) were within the range of 33 %–123 % of the average OH reactivityVOCs during O3 episodes. For OH reactivity of NOx (OH reactivity), the range was 61 %–242 %. The O3 production rates were simulated in a set of assumed scenarios with different OH reactivityVOCs and OH reactivity values. To include the OH reactivity of VOCs and NOx on all the VOC sampling days, factors from 10 % to 140 % with the step of 10 % were applied to the average diurnal profiles of VOCs and CO during O3 episodes, while the factors ranged from 10 % to 300 % with the step of 10 % for NOx. The initial concentrations of all the air pollutants were also scaled by the factors, and the model was constrained to these scaled concentrations every hour, except for O3. It should be noted that the factors applied to CO were exactly the same as those applied to VOCs; therefore we use VOCs# to represent the sum of VOCs and CO hereafter. The 14 gradients of OH reactivity values and 30 gradients of OH reactivity values made up 420 scenarios. Meteorological conditions were exactly the same for all the scenarios and the clear sky was hypothesized. According to the simulations, the maximum O3 production rates occurred at 12:00 LT. Thus, the simulated O3 production rates at 12:00 LT, as a function of percentages of OH reactivityVOCs and OH reactivity, are plotted in Fig. 8.
Text S3 describes the methods to define the regimes of O3 formation. Overall, O3 formation was mainly limited by VOCs# during non-episodes. However, it switched to being co-limited by VOCs# and NOx (transitional regime) on episode days with the net O3 production rates being among the highest, except for 5 August when the strong sea breeze diluted air pollutants in Jinan and/or intercepted the transport of air pollutants from central China to Jinan (Fig. S6). In fact, the sensitivity of O3 formation to NOx might be underemphasized due to the positive biases of NO2 measurements (Lu et al., 2010). This effect was expected to be more significant during episodes when the overestimation of NO2 was more obvious. However, O3 formation was not likely only limited by NOx even during O3 episodes because NO2 could not be overestimated by more than 30 % according to our inferences (see Sect. 2.2.1). Therefore, O3 formation was treated to be in the transitional regime during episodes. This partially explained the increased O3 during episodes in Jinan, given the higher O3 production rates in the transitional regime (Fig. 8). Noticeably, the change in regimes controlling O3 formation is consistent with that predicted by the ratio and the ratio of the reaction rates between HO2 + RO2 and OH + NO2.
The source apportionment of O3 precursors enabled us to calculate the source-specific OH reactivity and OH reactivity values. Accordingly, the variations in O3 production rates induced by the reductions in source emissions are presented in Fig. 8 (straight solid lines 1–6). The start point of the straight lines corresponded to 100% of the total average OH reactivity and OH reactivity during O3 episodes. The end points, however, represented the OH reactivity and OH reactivity with the complete removal of emissions from the individual sources. Therefore, the differences of the O3 production rates between the start point and end points were the source contributions to the O3 production rates, while the lengths of the lines reflected the contributions to the OH reactivity of the sources. Further, the simulated O3 production rates on the lines 1–6, as a response of reductions in source emissions, are extracted and plotted in Fig. S14. Obviously, the highest efficiencies of O3 reduction could be achieved by cutting diesel exhaust (0.58 ppbv h10 % emission reduction) and gasoline exhaust (0.47 ppbv h10 % emission reduction). In fact, the sensitivities of O3 production rates to the vehicle exhausts might be somewhat underestimated, due to the exclusion of carbonyls in the source apportionment. However, the reductions of O3 production rates by cutting 10 % of vehicle exhausts were still insignificant, compared to the overall maximum O3 production rate of 21.3 ppbv h−1 during O3 episodes. This indicated that, by only restraining emissions from one to two sources, high percentages of emission reductions were required to sufficiently reduce the overall O3 production rate. Otherwise, a combined effort should be made to control the emissions of O3 precursors from the diverse sources. In particular, it is essential to get rid of the transitional regime featuring high O3 production rates.
This study investigates the causes of a severe O3 pollution event lasting for 8 consecutive days in the NCP, one of the most densely populated regions in the world. Photochemical formation in the lower troposphere of the NCP is demonstrated as the main source of O3, under the control of weak high-pressure or low-pressure trough. Though the emissions of NOx, an important precursor of O3, have been significantly reduced in China since 2013 (Duncan et al., 2016; Liu et al., 2017), O3 pollution is still severe or even worsening in the NCP, as revealed in the present and also previous studies (Zhang et al., 2014; Sun et al., 2016). The finding that O3 formation shifted from the VOC-limited regime on relatively low O3 days to the transitional regime on O3 non-attainment days may elucidate the increase in O3, because O3 production rates in the transitional regime are the highest. It is unrealistic to expect the continuously linear reduction in NOx emissions in the NCP after the substantial decreases in emissions from power plants and industries in recent years. In other words, restraining VOC emissions is urgent for O3 abatement in the NCP. Another important finding in this study is that the NCP served as an O3 source. This was proposed by Ding et al. (2009), based on the aircraft measurement and simulation of atmospheric dynamics. We confirm it through the ground-level observation and the simulation of in situ photochemistry. It can be expected that organic nitrates are also intensively formed in the NCP as byproducts of O3 formation. In view of the fact that the NCP is located within the midlatitude band of Northern Hemisphere under the dominance of westerlies, we believe that O3 and organic nitrates formed in this region may be transported over a long distance following the uplifting of air masses, which has been confirmed to partially account for the enhancement of background O3 in North America and even Europe (Derwent et al., 2015; Lin et al., 2017). Therefore, the recent air pollution control measures taken in China (including China's Clean Air Action Plan in force in 2013) (Zheng et al., 2018) are still inadequate to ease the burden of global tropospheric O3 in a short period. More effective action plans should be implemented for O3 abatement, with comprehensive thinking of atmospheric dynamics and chemistry.
The data are accessible at https://drive.google.com/open?id=1_KeOxOuVsLY83xL74RtcRORsiiyIR 8FZ (Lyu, 2018).
The supplement related to this article is available online at: https://doi.org/10.5194/acp-19-3025-2019-supplement.
The study was designed by the corresponding author, HG, with the help of LH and YZ. FJ and HC provided valuable input on the characteristics of meteorological conditions and emissions of air pollutants in the NCP. XL collected the samples and managed the logistics in the field campaign, and LX provided sufficient assistance in field sampling campaign. The solar radiation data in Jinan were obtained from ZC. XL performed data analyses and wrote the paper, while the chemical transport modeling was done by NW and YZ. HG revised and finalized the paper for submission.
This study was supported by the National Key R & D Program of
China (2017YFC0212001); the Research Grants Council of the Hong Kong Special Administrative Region via
grants PolyU5154/13E, PolyU152052/14E, PolyU152052/16E, CRF/C5004-15E
and CRF/C5022-14G; the Collaborative Research program between the Beijing
University of Technology and the Hong Kong Polytechnic
University (PolyU) (4-ZZFW); the Hong Kong Polytechnic University PhD scholarships (project RTUP); and the
National Natural Science Foundation of China (no. 41675118). This study was
partly supported by the Hong Kong PolyU internal grant (G-YBUQ, 1-ZVJT and
1-BBW4). The valuable comments of the anonymous reviewers were highly appreciated.
Edited by: Steven Brown
Reviewed by: two anonymous referees
Atkinson, R.: Atmospheric chemistry of VOCs and NOx, Atmos. Environ., 34, 2063–2101, 2000.
Beck, J. P. and Grennfelt, P.: Estimate of ozone production and destruction over northwestern Europe, Atmos. Environ., 28, 129–140, 1994.
Cai, C., Geng, F., Tie, X., Yu, Q., and An, J.: Characteristics and source apportionment of VOCs measured in Shanghai, China, Atmos. Environ., 44, 5005–5014, 2010.
Carter, W. P.: Development of ozone reactivity scales for volatile organic compounds, Air Waste Manage. Assoc., 44, 881–899, 1994.
Carter, W. P., Pierce, J. A., Luo, D., and Malkina, I. L.: Environmental chamber study of maximum incremental reactivities of volatile organic compounds, Atmos. Environ., 29, 2499–2511, 1995.
Chameides, W. and Walker, J. C.: A photochemical theory of tropospheric ozone, J. Geophys. Res., 78, 8751–8760, 1973.
Chan, C. Y. and Chan, L. Y.: Effect of meteorology and air pollutant transport on ozone episodes at a subtropical coastal Asian city, Hong Kong, J. Geophys. Res.-Atmos., 105, 20707–20724, 2000.
Chen, Y., Zhao, C., Zhang, Q., Deng, Z., Huang, M., and Ma, X.: Aircraft study of mountain chimney effect of Beijing, China, J. Geophys. Res.-Atmos., 114, D08306, https://doi.org/10.1029/2008JD010610, 2009.
Cheng, H., Guo, H., Wang, X., Saunders, S. M., Lam, S. H. M., Jiang, F., Wang, T., Ding, A., Lee, S., and Ho, K. F.: On the relationship between ozone and its precursors in the Pearl River Delta: application of an observation-based model (OBM), Environ. Sci. Pollut. Res., 17, 547–560, 2010.
Colman, J. J., Swanson, A. L., Meinardi, S., Sive, B. C., Blake, D. R., and Rowland, F. S.: Description of the analysis of a wide range of volatile organic compounds in whole air samples collected during PEM-Tropics A and B, Anal. Chem., 73, 3723–3731, 2001.
Cooper, O. R., Stohl, A., Hübler, G., Hsie, E. Y., Parrish, D. D., Tuck, A. F., Kiladis, G. N., Oltmans, S. J., Johnson, B. J., Shapiro, M., and Moody, J. L.: Direct transport of midlatitude stratospheric ozone into the lower troposphere and marine boundary layer of the tropical Pacific Ocean, J. Geophys. Res.-Atmos., 110, D23310, https://doi.org/10.1029/2005JD005783, 2005.
Crutzen, P.: A discussion of the chemistry of some minor constituents in the stratosphere and troposphere, Pure Appl. Geophys., 106, 1385–1399, 1973.
Derwent, R. G., Utembe, S. R., Jenkin, M. E., and Shallcross, D. E.: Tropospheric ozone production regions and the intercontinental origins of surface ozone over Europe, Atmos. Environ., 112, 216–224, 2015.
Ding, A., Wang, T., Xue, L., Gao, J., Stohl, A., Lei, H., Jin, D., Ren, Y., Wang, X., Wei, X., and Qi, Y.: Transport of north China air pollution by midlatitude cyclones: Case study of aircraft measurements in summer 2007, J. Geophys. Res.-Atmos., 114, D08304, https://doi.org/10.1029/2008JD011023, 2009.
Ding, A. J., Fu, C. B., Yang, X. Q., Sun, J. N., Zheng, L. F., Xie, Y. N., Herrmann, E., Nie, W., Petäjä, T., Kerminen, V.-M., and Kulmala, M.: Ozone and fine particle in the western Yangtze River Delta: an overview of 1 yr data at the SORPES station, Atmos. Chem. Phys., 13, 5813–5830, https://doi.org/10.5194/acp-13-5813-2013, 2013.
Duncan, B. N., Lamsal, L. N., Thompson, A. M., Yoshida, Y., Lu, Z., Streets, D. G., Hurwitz, M. M., and Pickering, K.E.: A space-based, high-resolution view of notable changes in urban NOx pollution around the world (2005–2014), J. Geophys. Res.-Atmos., 121, 976–996, 2016.
Dunlea, E. J., Herndon, S. C., Nelson, D. D., Volkamer, R. M., San Martini, F., Sheehy, P. M., Zahniser, M. S., Shorter, J. H., Wormhoudt, J. C., Lamb, B. K., Allwine, E. J., Gaffney, J. S., Marley, N. A., Grutter, M., Marquez, C., Blanco, S., Cardenas, B., Retama, A., Ramos Villegas, C. R., Kolb, C. E., Molina, L. T., and Molina, M. J.: Evaluation of nitrogen dioxide chemiluminescence monitors in a polluted urban environment, Atmos. Chem. Phys., 7, 2691–2704, https://doi.org/10.5194/acp-7-2691-2007, 2007.
Finlayson-Pitts, B. J. and Pitts Jr., J. N.: Atmospheric chemistry of tropospheric ozone formation: scientific and regulatory implications, Air Waste Manage. Assoc., 43, 1091–1100, 1993.
Fung, J. C. H., Lau, A. K. H., Lam, J. S. L., and Yuan, Z.: Observational and modeling analysis of a severe air pollution episode in western Hong Kong, J. Geophys. Res.-Atmos., 110, D09105, https://doi.org/10.1029/2004JD005105, 2005.
Gao, J., Wang, T., Ding, A., and Liu, C.: Observational study of ozone and carbon monoxide at the summit of mount Tai (1534 m asl) in central-eastern China, Atmos. Environ., 39, 4779–4791, 2005.
Granby, K., Christensen, C. S., and Lohse, C.: Urban and semi-rural observations of carboxylic acids and carbonyls, Atmos. Environ., 31, 1403–1415, 1997.
Grosjean, D., Miguel, A. H., and Tavares, T. M.: Urban air pollution in Brazil: Acetaldehyde and other carbonyls, Atmos. Environ., 24, 101–106, 1990.
Gu, D., Wang, Y., Smeltzer, C., and Boersma, K. F.: Anthropogenic emissions of NOx over China: Reconciling the difference of inverse modeling results using GOME-2 and OMI measurements, J. Geophys. Res.-Atmos., 119, 7732–7740, 2014.
Guo, H., Ling, Z. H., Cheung, K., Jiang, F., Wang, D. W., Simpson, I. J., Barletta, B., Meinardi, S., Wang, T. J., Wang, X. M., Saunders, S. M., and Blake, D. R.: Characterization of photochemical pollution at different elevations in mountainous areas in Hong Kong, Atmos. Chem. Phys., 13, 3881–3898, https://doi.org/10.5194/acp-13-3881-2013, 2013.
Han, X., Zhu, L., Wang, S., Meng, X., Zhang, M., and Hu, J.: Modeling study of impacts on surface ozone of regional transport and emissions reductions over North China Plain in summer 2015, Atmos. Chem. Phys., 18, 12207–12221, https://doi.org/10.5194/acp-18-12207-2018, 2018.
He, J., Wang, Y., Hao, J., Shen, L., and Wang, L.: Variations of surface O3 in August at a rural site near Shanghai: influences from the West Pacific subtropical high and anthropogenic emissions, Environ. Sci. Pollut. Res., 19, 4016–4029, 2012.
He, K.: Multi-resolution Emission Inventory for China (MEIC): model framework and 1990–2010 anthropogenic emissions, in: AGU Fall Meeting Abstracts, 3–7 December 2012, San Francisco, 2012.
Huang, J. P., Fung, J. C., Lau, A. K., and Qin, Y.: Numerical simulation and process analysis of typhoon-related ozone episodes in Hong Kong, J. Geophys. Res.-Atmos., 110, D05301, https://doi.org/10.1029/2004JD004914, 2005.
Jenkin, M. E. and Clemitshaw, K. C.: Ozone and other secondary photochemical pollutants: chemical processes governing their formation in the planetary boundary layer, Atmos. Environ., 34, 2499–2527, 2000.
Jenkin, M. E., Saunders, S. M., and Pilling, M. J.: The tropospheric degradation of volatile organic compounds: a protocol for mechanism development, Atmos. Environ., 31, 81–104, 1997.
Jiang, F., Guo, H., Wang, T. J., Cheng, H. R., Wang, X. M., Simpson, I. J., Ding, A. J., Saunders, S. M., Lam, S. H. M., and Blake, D. R.: An ozone episode in the Pearl River Delta: Field observation and model simulation, J. Geophys. Res.-Atmos., 115, D22305, https://doi.org/10.1029/2009JD013583, 2010.
Jin, X., Fiore, A. M., Murray, L. T., Valin, L. C., Lamsal, L. N., Duncan, B., Folkert Boersma, K., De Smedt, I., Abad, G. G., Chance, K., and Tonnesen, G. S.: Evaluating a Space-Based Indicator of Surface Ozone-NOx-VOC Sensitivity Over Midlatitude Source Regions and Application to Decadal Trends, J. Geophys. Res.-Atmos., 122, 10439–10461, 2017.
Kanaya, Y., Pochanart, P., Liu, Y., Li, J., Tanimoto, H., Kato, S., Suthawaree, J., Inomata, S., Taketani, F., Okuzawa, K., Kawamura, K., Akimoto, H., and Wang, Z. F.: Rates and regimes of photochemical ozone production over Central East China in June 2006: a box model analysis using comprehensive measurements of ozone precursors, Atmos. Chem. Phys., 9, 7711–7723, https://doi.org/10.5194/acp-9-7711-2009, 2009.
Kleinman, L. I.: The dependence of tropospheric ozone production rate on ozone precursors, Atmos. Environ., 3, 575–586, 2005.
Kusaka, H. and Kimura, F.: Coupling a single-layer urban canopy model with a simple atmospheric model: Impact on urban heat island simulation for an idealized case, J. Meteorol. Soc. Jpn. Ser. II, 82, 67–80, 2004.
Lam, S. H. M., Saunders, S. M., Guo, H., Ling, Z. H., Jiang, F., Wang, X. M., and Wang, T. J.: Modelling VOC source impacts on high ozone episode days observed at a mountain summit in Hong Kong under the influence of mountain-valley breezes, Atmos. Environ., 81, 166–176, 2013.
Lang, J., Zhang, Y., Zhou, Y., Cheng, S., Chen, D., Guo, X., Chen, S., Li, X., Xing, X., and Wang, H.: Trends of PM2.5 and chemical composition in Beijing, 2000–2015, Aerosol Air Qual. Res., 17, 412–425, 2017.
Li, M., Zhang, Q., Kurokawa, J.-I., Woo, J.-H., He, K., Lu, Z., Ohara, T., Song, Y., Streets, D. G., Carmichael, G. R., Cheng, Y., Hong, C., Huo, H., Jiang, X., Kang, S., Liu, F., Su, H., and Zheng, B.: MIX: a mosaic Asian anthropogenic emission inventory under the international collaboration framework of the MICS-Asia and HTAP, Atmos. Chem. Phys., 17, 935–963, https://doi.org/10.5194/acp-17-935-2017, 2017.
Lin, M., Fiore, A. M., Horowitz, L. W., Langford, A. O., Oltmans, S. J., Tarasick, D., and Rieder, H. E.: Climate variability modulates western US ozone air quality in spring via deep stratospheric intrusions, Nat. Commun., 6, 7105, https://doi.org/10.1038/ncomms8105, 2015.
Lin, M., Horowitz, L. W., Payton, R., Fiore, A. M., and Tonnesen, G.: US surface ozone trends and extremes from 1980 to 2014: quantifying the roles of rising Asian emissions, domestic controls, wildfires, and climate, Atmos. Chem. Phys., 17, 2943–2970, https://doi.org/10.5194/acp-17-2943-2017, 2017.
Lin, W., Xu, X., Zhang, X., and Tang, J.: Contributions of pollutants from North China Plain to surface ozone at the Shangdianzi GAW Station, Atmos. Chem. Phys., 8, 5889–5898, https://doi.org/10.5194/acp-8-5889-2008, 2008.
Liu, F., Beirle, S., Zhang, Q., van der A, R. J., Zheng, B., Tong, D., and He, K.: NOx emission trends over Chinese cities estimated from OMI observations during 2005 to 2015, Atmos. Chem. Phys., 17, 9261–9275, https://doi.org/10.5194/acp-17-9261-2017, 2017.
Liu, X. H., Zhang, Y., Xing, J., Zhang, Q., Wang, K., Streets, D. G., Jang, C., Wang, W. X., and Hao, J. M.: Understanding of regional air pollution over China using CMAQ, part II. Process analysis and sensitivity of ozone and particulate matter to precursor emissions, Atmos. Environ., 44, 3719–3727, 2010.
Lo, J. C., Lau, A. K., Fung, J. C., and Chen, F.: Investigation of enhanced cross-city transport and trapping of air pollutants by coastal and urban land-sea breeze circulations, J. Geophys. Res.-Atmos., 111, D14104, https://doi.org/10.1029/2005JD006837, 2006.
Lu, K., Zhang, Y., Su, H., Brauers, T., Chou, C. C., Hofzumahaus, A., Liu, S. C., Kita, K., Kondo, Y., Shao, M., and Wahner, A.: Oxidant (O3 + NO2) production processes and formation regimes in Beijing, J. Geophys. Res.-Atmos., 115, D07303, https://doi.org/10.1029/2009JD012714, 2010.
Lyu, X.: Data for the paper “Causes of a continuous summertime O3 pollution event in Jinan, a central city in the North China Plain”, Google Drive, available at: https://drive.google.com/open?id=1_KeOxOuVsLY83xL74RtcRORsiiyIR8FZ, 2018.
Lyu, X. P., Chen, N., Guo, H., Zhang, W. H., Wang, N., Wang, Y., and Liu, M.: Ambient volatile organic compounds and their effect on ozone production in Wuhan, central China, Sci. Total Environ., 541, 200–209, 2016.
Lyu, X. P., Guo, H., Wang, N., Simpson, I. J., Cheng, H. R., Zeng, L. W., Saunders, S. M., Lam, S. H. M., Meinardi, S., and Blake, D. R.: Modeling C1–C4 alkyl nitrate photochemistry and their impacts on O3 production in urban and suburban environments of Hong Kong, J. Geophys. Res.-Atmos., 122, 10539–10556, 2017.
Madronich, S. and Flocke, S.: Theoretical estimation of biologically effective UV radiation at the Earth's surface, in: Solar Ultraviolet Radiation, Springer, Berlin, Heidelberg, 23–48, 1997.
Mao, J., Ren, X., Chen, S., Brune, W. H., Chen, Z., Martinez, M., Harder, H., Lefer, B., Rappenglueck, B., Flynn, J., and Leuchner, M.: Atmospheric oxidation capacity in the summer of Houston 2006: Comparison with summer measurements in other metropolitan studies, Atmos. Environ., 44, 4107–4115, 2010.
McClenny, W. A., Williams, E. J., Cohen, R. C., and Stutz, J.: Preparing to measure the effects of the NOx SIP Call – methods for ambient air monitoring of NO, NO2, NOy, and individual NOz species, Air Waste Manage. Assoc., 52, 542–562, 2002.
Monks, P. S.: Gas-phase radical chemistry in the troposphere, Chem. Soc. Rev., 34, 376–395, 2005.
Ren, X., Harder, H., Martinez, M., Lesher, R. L., Oliger, A., Simpas, J. B., Brune, W. H., Schwab, J. J., Demerjian, K. L., He, Y., and Zhou, X.: OH and HO2 chemistry in the urban atmosphere of New York City, Atmos. Environ., 37, 3639–3651, 2003.
Saunders, S. M., Jenkin, M. E., Derwent, R. G., and Pilling, M. J.: Protocol for the development of the Master Chemical Mechanism, MCM v3 (Part A): tropospheric degradation of non-aromatic volatile organic compounds, Atmos. Chem. Phys., 3, 161–180, https://doi.org/10.5194/acp-3-161-2003, 2003.
Shan, W., Yin, Y., Zhang, J., and Ding, Y.: Observational study of surface ozone at an urban site in East China, Atmos. Res., 89, 252–261, 2008.
Shao, M., Lu, S., Liu, Y., Xie, X., Chang, C., Huang, S., and Chen, Z.: Volatile organic compounds measured in summer in Beijing and their role in ground-level ozone formation, J. Geophys. Res.-Atmos., 114, D00G06, https://doi.org/10.1029/2008JD010863, 2009.
Shu, L., Xie, M., Wang, T., Gao, D., Chen, P., Han, Y., Li, S., Zhuang, B., and Li, M.: Integrated studies of a regional ozone pollution synthetically affected by subtropical high and typhoon system in the Yangtze River Delta region, China, Atmos. Chem. Phys., 16, 15801–15819, https://doi.org/10.5194/acp-16-15801-2016, 2016.
Sillman, S.: The relation between ozone, NOx and hydrocarbons in urban and polluted rural environments, Atmos. Environ., 33, 1821–1845, 1999.
Sun, L., Xue, L., Wang, T., Gao, J., Ding, A., Cooper, O. R., Lin, M., Xu, P., Wang, Z., Wang, X., Wen, L., Zhu, Y., Chen, T., Yang, L., Wang, Y., Chen, J., and Wang, W.: Significant increase of summertime ozone at Mount Tai in Central Eastern China, Atmos. Chem. Phys., 16, 10637–10650, https://doi.org/10.5194/acp-16-10637-2016, 2016.
Tan, Z., Lu, K., Dong, H., Hu, M., Li, X., Liu, Y., Lu, S., Shao, M., Su, R., Wang, H., and Wu, Y.: Explicit diagnosis of the local ozone production rate and the ozone-NOx-VOC sensitivities, Sci. Bull., 63, 1067–1076, 2018a.
Tan, Z., Lu, K., Jiang, M., Su, R., Dong, H., Zeng, L., Xie, S., Tan, Q., and Zhang, Y.: Exploring ozone pollution in Chengdu, southwestern China: A case study from radical chemistry to O3-VOC-NOx sensitivity, Sci. Total Environ., 636, 775–786, 2018b.
Thornton, J. A., Wooldridge, P. J., Cohen, R. C., Martinez, M., Harder, H., Brune, W. H., Williams, E. J., Roberts, J. M., Fehsenfeld, F. C., Hall, S. R., and Shetter, R. E.: Ozone production rates as a function of NOx abundances and HOx production rates in the Nashville urban plume, J. Geophys. Res.-Atmos., 107, 4146, https://doi.org/10.1029/2001JD000932, 2002.
Wang, N., Guo, H., Jiang, F., Ling, Z. H., and Wang, T.: Simulation of ozone formation at different elevations in mountainous area of Hong Kong using WRF-CMAQ model, Sci. Total Environ., 505, 939–951, 2015.
Wang, T., Ding, A., Gao, J., and Wu, W. S.: Strong ozone production in urban plumes from Beijing, China, Geophys. Res. Lett., 33, L21806, https://doi.org/10.1029/2006GL027689, 2006.
Wang, T., Nie, W., Gao, J., Xue, L. K., Gao, X. M., Wang, X. F., Qiu, J., Poon, C. N., Meinardi, S., Blake, D., Wang, S. L., Ding, A. J., Chai, F. H., Zhang, Q. Z., and Wang, W. X.: Air quality during the 2008 Beijing Olympics: secondary pollutants and regional impact, Atmos. Chem. Phys., 10, 7603–7615, https://doi.org/10.5194/acp-10-7603-2010, 2010.
Wang, X. M., Lin, W. S., Yang, L. M., Deng, R. R., and Lin, H.: A numerical study of influences of urban land-use change on ozone distribution over the Pearl River Delta region, China, Tellus B, 59, 633–641, 2007.
Wang, Z., Li, Y., Chen, T., Zhang, D., Sun, F., Wei, Q., Dong, X., Sun, R., Huan, N., and Pan, L.: Ground-level ozone in urban Beijing over a 1-year period: Temporal variations and relationship to atmospheric oxidation, Atmos. Res., 164, 110–117, 2015.
Whitten, G. Z., Heo, G., Kimura, Y., McDonald-Buller, E., Allen, D. T., Carter, W. P., and Yarwood, G.: A new condensed toluene mechanism for Carbon Bond: CB05-TU, Atmos. Environ., 44, 5346–5355, 2010.
Williams, J., Keßel, S. U., Nölscher, A. C., Yang, Y., Lee, Y., Yáñez-Serrano, A. M., Wolff, S., Kesselmeier, J., Klüpfel, T., Lelieveld, J., and Shao, M.: Opposite OH reactivity and ozone cycles in the Amazon rainforest and megacity Beijing: Subversion of biospheric oxidant control by anthropogenic emissions, Atmos. Environ., 125, 112–118, 2016.
Xing, C., Liu, C., Wang, S., Chan, K. L., Gao, Y., Huang, X., Su, W., Zhang, C., Dong, Y., Fan, G., Zhang, T., Chen, Z., Hu, Q., Su, H., Xie, Z., and Liu, J.: Observations of the vertical distributions of summertime atmospheric pollutants and the corresponding ozone production in Shanghai, China, Atmos. Chem. Phys., 17, 14275–14289, https://doi.org/10.5194/acp-17-14275-2017, 2017.
Xing, J., Ding, D., Wang, S., Zhao, B., Jang, C., Wu, W., Zhang, F., Zhu, Y., and Hao, J.: Quantification of the enhanced effectiveness of NOx control from simultaneous reductions of VOC and NH3 for reducing air pollution in the Beijing–Tianjin–Hebei region, China, Atmos. Chem. Phys., 18, 7799–7814, https://doi.org/10.5194/acp-18-7799-2018, 2018.
Xu, Z., Wang, T., Xue, L. K., Louie, P. K., Luk, C. W., Gao, J., Wang, S. L., Chai, F. H., and Wang, W. X.: Evaluating the uncertainties of thermal catalytic conversion in measuring atmospheric nitrogen dioxide at four differently polluted sites in China, Atmos. Environ., 76, 221–226, 2013.
Xue, L. K., Wang, T., Gao, J., Ding, A. J., Zhou, X. H., Blake, D. R., Wang, X. F., Saunders, S. M., Fan, S. J., Zuo, H. C., Zhang, Q. Z., and Wang, W. X.: Ground-level ozone in four Chinese cities: precursors, regional transport and heterogeneous processes, Atmos. Chem. Phys., 14, 13175–13188, https://doi.org/10.5194/acp-14-13175-2014, 2014.
Yang, Y., Shao, M., Wang, X., Nolscher, A. C., Kessel, S., Guenther, A., and Williams, J.: Towards a quantitative understanding of total OH reactivity: A review, Atmos. Environ., 134, 147–161, 2016.
Ye, L., Wang, X., Fan, S., Chen, W., Chang, M., Zhou, S., Wu, Z., and Fan, Q.: Photochemical indicators of ozone sensitivity: application in the Pearl River Delta, China, Front. Environ. Sci. Eng., 10, 15, https://doi.org/10.1007/s11783-016-0887-1, 2016.
Yin, Y., Lu, H., Shan, W., and Zheng, Y.: Analysis of observed ozone episode in urban Jinan, China, Bulletin Environ, Contam. Toxicol., 83, 159–163, 2009.
Zhang, Q., Streets, D. G., He, K., Wang, Y., Richter, A., Burrows, J. P., Uno, I., Jang, C. J., Chen, D., Yao, Z., and Lei, Y.: NOx emission trends for China, 1995–2004: The view from the ground and the view from space, J. Geophys. Res.-Atmos., 112, D22306, https://doi.org/10.1029/2007JD008684, 2007.
Zhang, Q., Streets, D. G., Carmichael, G. R., He, K. B., Huo, H., Kannari, A., limont, Z., Park, I. S., Reddy, S., Fu, J. S., Chen, D., Duan, L., Lei, Y., Wang, L. T., and Yao, Z. L.: Asian emissions in 2006 for the NASA INTEX-B mission, Atmos. Chem. Phys., 9, 5131–5153, https://doi.org/10.5194/acp-9-5131-2009, 2009.
Zhang, Q., Yuan, B., Shao, M., Wang, X., Lu, S., Lu, K., Wang, M., Chen, L., Chang, C.-C., and Liu, S. C.: Variations of ground-level O3 and its precursors in Beijing in summertime between 2005 and 2011, Atmos. Chem. Phys., 14, 6089–6101, https://doi.org/10.5194/acp-14-6089-2014, 2014.
Zhang, Y., Ding, A., Mao, H., Nie, W., Zhou, D., Liu, L., Huang, X., and Fu, C.: Impact of synoptic weather patterns and inter-decadal climate variability on air quality in the North China Plain during 1980–2013, Atmos. Environ., 124, 119–128, 2016.
Zhang, Z., Zhang, X., Gong, D., Quan, W., Zhao, X., Ma, Z., and Kim, S. J.: Evolution of surface O3 and PM2.5 concentrations and their relationships with meteorological conditions over the last decade in Beijing, Atmos. Environ., 108, 67–75, 2015.
Zhao, C., Wang, Y., and Zeng, T.: East China plains: A “basin” of ozone pollution, Environ. Sci. Technol., 43, 1911–1915, 2009.
Zheng, B., Tong, D., Li, M., Liu, F., Hong, C., Geng, G., Li, H., Li, X., Peng, L., Qi, J., Yan, L., Zhang, Y., Zhao, H., Zheng, Y., He, K., and Zhang, Q.: Trends in China's anthropogenic emissions since 2010 as the consequence of clean air actions, Atmos. Chem. Phys., 18, 14095–14111, https://doi.org/10.5194/acp-18-14095-2018, 2018.
Zong, R., Yang, X., Wen, L., Xu, C., Zhu, Y., Chen, T., Yao, L., Wang, L., Zhang, J., Yang, L., Wang, X., Shao, M., Zhu, T., Xue, L., and Wang, W.: Strong ozone production at a rural site in the North China Plain: Mixed effects of urban plumes and biogenic emissions, J. Environ. Sci., 71, 261–270, https://doi.org/10.1016/j.jes.2018.05.003, 2018.