the Creative Commons Attribution 4.0 License.
the Creative Commons Attribution 4.0 License.
 | 04 Mar 2019
Molecular characterization of organic aerosols in the Kathmandu Valley, Nepal: insights into primary and secondary sources
Shichang Kang
Maheswar Rupakheti
Qianggong Zhang
Lekhendra Tripathee
Junming Guo
Pengfei Chen
Dipesh Rupakheti
Arnico K. Panday
Mark G. Lawrence
Kimitaka Kawamura
Organic atmospheric aerosols in the Hindu Kush–Himalayas–Tibetan Plateau region are still poorly characterized. To better understand the chemical characteristics and sources of organic aerosols in the foothill region of the central Himalaya, the atmospheric aerosol samples were collected in Bode, a suburban site of the Kathmandu Valley (KV) over a 1-year period from April 2013 to April 2014. Various molecular tracers from specific sources of primary organic aerosols (POAs) and secondary organic aerosols (SOAs) were determined. Tracer-based estimation methods were employed to apportion contributions from each source. The concentrations of organic carbon (OC) and elemental carbon (EC) increased during winter with a maximum monthly average in January. Levoglucosan (a molecular tracer for biomass burning, BB) was observed as the dominant species among all the analyzed organic tracers and its annual average concentration was 788±685 ng m−3 (ranging from 58.8 to 3079 ng m−3). Isoprene-SOA (I-SOA) represented a high concentration among biogenic-SOA tracers. For the seasonality, anhydrosugars, phenolic compounds, resin acid, and aromatic SOA tracer showed similar seasonal variations with OC and EC while monosaccharides, sugar alcohols, and I-SOA tracers showed lower levels during winter. BB contributed a significant fraction to OC, averaging 24.9 %±10.4 % during the whole year, and up to 36.3 %±10.4 % in the post-monsoon season. On an annual average basis, anthropogenic toluene-derived secondary OC accounted for 8.8 % and biogenic secondary OC contributed 6.2 % to total OC. The annual contribution of fungal spores to OC was 3.2 % with a maximum during the monsoon season (5.9 %). For plant debris, it accounted for 1.4 % of OC during the monsoon. Therefore, OC is mainly associated with BB and other anthropogenic activity in the KV. Our findings are conducive to designing effective measures to mitigate the heavy air pollution and its impacts in the KV and surrounding area.
- Article
(3569 KB) - Full-text XML
-
Supplement
(1111 KB) - BibTeX
- EndNote


South Asia, especially the Indo-Gangetic Plain (IGP) region, is a global air pollution hotspot. Atmospheric pollutants (e.g., organic carbon, OC; black carbon, BC; gaseous pollutants, etc.) from South Asia have been increasing during recent decades (Ramanathan et al., 2005; Muzzini and Aparicio, 2013; Lawrence and Lelieveld, 2010). While these pollutants are of concern locally near the emission sources, they can also, in a short span of time, be transported to rural and remote regions over a long distance. This results in an annually recurring regional-scale haze, referred to as atmospheric brown clouds (ABCs), and covers a large area from the Himalayan range to the Indian Ocean (Ramanathan et al., 2007). Until recently the emissions, types, levels, atmospheric transport and transformation, impacts, and mitigation of various atmospheric pollutants were not well characterized in the vast mountain areas and the foothill region in South Asia. In this context, the international project of “A Sustainable Atmosphere for the Kathmandu Valley (SusKat)” was launched, aiming to comprehensively understand the causes of the severe air pollution in the region, and identifying appropriate solutions to reduce its impacts (Rupakheti et al., 2019). This paper presents analyses of samples collected as part of the SusKat field campaign.
The Kathmandu Valley (KV), the capital region of Nepal, is considered one of the most polluted regions over South Asia and the largest metropolitan region in the foothills of the Hindu Kush–Himalayas–Tibetan Plateau (HKHTP) region, facing rapid but unplanned urbanization, with a current population of approximately 4 million (Muzzini and Aparicio, 2013). Additionally, the bowl-shaped topography restricts the free flow of air, resulting in poor air quality (Pudasainee et al., 2006; Panday and Prinn, 2009). Giri et al. (2007) showed PM10 concentrations in Kathmandu were about 2–4 times higher than the guidelines prescribed by the World Health Organization (WHO; PM10 24 h mean: 50 µg m−3; WHO, 2006). More recently, Shakya et al. (2017) reported that daily mean PM2.5 concentrations at seven locations in the KV during 2014 were about 5 times higher than the WHO guidelines (PM2.5 24 h mean: 25 µg m−3; WHO, 2006). Besides particulate matter, recent studies have pointed out that ground-level ozone (O3) is also of concern (Mahata et al., 2018; Bhardwaj et al., 2018). Ozone levels at Pakanajol in the city center exceeded the WHO's 8 h maximum O3 guidelines of 100 µg m−3 on 125 days in a year (Putero et al., 2015), while Mahata et al. (2018) reported such exceedance was for nearly 3 months at Bode (where sampling for this study was conducted) and 6 months at Nagarkot, a hilltop site downwind of the KV. The concentrations of acetonitrile and isoprene (precursor for both O3 and secondary organic aerosol, SOA) investigated by Sarkar et al. (2016) in the KV were comparable with the highest reported elsewhere in the world. Air pollution is a clear threat to human health (leading to respiratory disease, cardiovascular disease, cancer, etc.), agricultural productivity, and revenues from tourism in the KV and surrounding regions (Putero et al., 2015; Shakya et al., 2016).
Carbonaceous aerosols (OC, and BC and EC, elemental carbon) are often a principal component of atmospheric aerosols and the ABCs over South Asia (Wester et al., 2019). Sources and chemical transformations of OC are complicated, including primary emission sources (e.g., biomass/biofuel burning and fossil fuel combustion, plant debris, soil dust, etc.) and secondary formation of the oxidative products from precursor gases produced from both biogenic and anthropogenic compounds (Simoneit, 2002; Claeys et al., 2004; Fu et al., 2010). Although previous studies on organic aerosol characteristics in the KV and surrounding regions are limited, they demonstrated that OC was the main component of aerosols (Shakya et al., 2017; Kim et al., 2015). However, they have focused on a few aerosol species or a handful of organic compound classes (Chen et al., 2015; Sarkar et al., 2016). Only at a rural site, Godavari, on the southern edge of the KV, analysis of organic aerosols at the molecular level has been reported (Stone et al., 2010, 2012). Overall, the composition and sources of OC are still poorly characterized.
Therefore, to overcome such research gaps, our study comprehensively investigates the organic molecular compositions of aerosols from the KV, including anhydrosugars, monosaccharides, sugar alcohols, phenolic compounds, resin acid, phthalic acid esters, and SOAs produced from primary emission sources and secondary formation. We also studied the seasonal variation and molecular distribution to decipher their abundances, understand their predominant sources (primary vs. secondary), and to evaluate contributions of different sources to the carbonaceous aerosols in the suburban environment in the Himalayan foothills. Our current work enriches the database of the chemical characteristics of organic aerosols in South Asia, particularly in the HKHTP region.
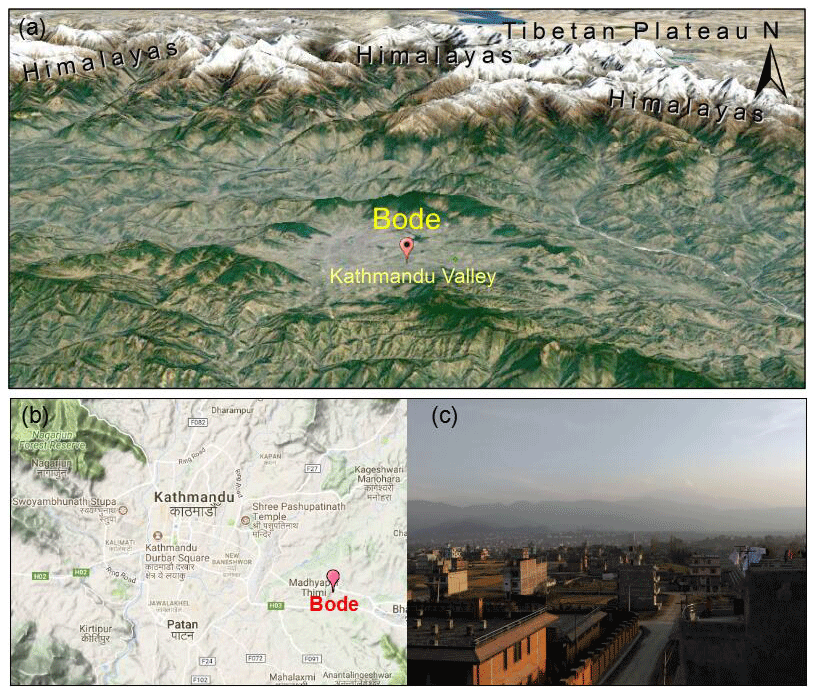
Figure 1Location of measurement site: (a) Kathmandu Valley, (b) urban measurement site at Bode in the Kathmandu Valley, (c) air pollution observed from the Bode site in the afternoon.
2.1 Sampling site
The KV is a round, flat basin with the bottom at an elevation of approximately 1300 m above sea level (a.s.l.) in the southern foothills of the Himalayas. It is encircled by green mountains (elevation: 1500 to 2800 m a.s.l.; Panday and Prinn, 2009). Our sampling was performed during April 2013 to April 2014 in Bode (27.67∘ N, 85.38∘ E; 1320 m a.s.l.), a suburban site to the east of Kathmandu city in the valley (Fig. 1). There are two major wind flows in the KV: (a) west to east, from Nagdhunga–Bhimdhunga mountain pass in the west to Nagarkot–Sanga mountain pass in the east, (b) south to north, from Bagmati River corridor to the northeast direction through the central-eastern part of the valley. These two airflows meet around the central-eastern part of the valley and move eastward towards the Nagarkot–Sanga passes (Panday and Prinn, 2009). The Bode area receives these two air flows, and hence it is downwind of Kathmandu city and Lalitpur or Patan city located in the southwest, west, and northwest directions during the daytime, and Bhaktapur city located in the east and southeast during nighttime (Bhardwaj et al., 2018; Mahata et al., 2017; Rupakheti et al., 2019). In addition, it is situated in a residential area with urban buildings and houses scattered across agricultural fields with paddy, wheat, corn, and vegetable farms. Some small industries (plastics, electronics, wood, fabrics, etc.) and Bhaktapur Industrial Estate are located in the southeastern direction from Bode, as well as several brick kilns that use low-quality coal during January to April (Sarkar et al., 2016). The Tribhuvan International Airport to the west of Bode (∼4 km) may have potential impacts when there is a westerly wind. Approximately 1.5 and 7 km to the north there are two reserve forests, consisting of a mix of mainly broad-leaved deciduous trees and evergreen conifer trees (Department of Plant Resources, 2015). BC and O3 measurements in the two major SusKat-ABC sites (Paknajol and Bode) in the valley show similar levels (Putero et al., 2015; Mahata et al., 2018). Therefore, the Bode site can be taken as a representative site for the KV (Rupakheti et al., 2019).
2.2 Sample collection
The total suspended particulate (TSP) samples were continuously collected for 23 h (day and nighttime) every 5 days by a medium-volume sampler (model: KC-120H, Laoshan Co., China), which was installed on the rooftop of a building, approximately 20 m above ground. The flow rate was 100 L min−1. Overall, 82 aerosol samples were successfully obtained using 90 mm diameter quartz filters (Whatman PLC, UK). The filters were pre-baked (550 ∘C, 6 h) to remove all organic material and weighed by a microbalance (sensitivity: ±0.01 mg) before and after sampling. Before each weighing, they were equilibrated at constant temperature (25±3 ∘C) and humidity (30±5 %) conditions for 24 h. Finally, the filters were preserved at −20 ∘C until laboratory analysis. Field blanks (one blank filter each month) were also collected, briefly putting a filter onto the instrument without drawing air to assess potential contamination. There may be positive and negative artifacts during the sample handling/conditioning due to the adsorption/evaporation processes of organic aerosols (Li et al., 2018; Boreddy et al., 2017; Oanh et al., 2016). In a comparable study, Ding et al. (2013) reported the positive artifacts for OC and organic tracers were 10 %–20 % and up to 16 %, respectively.
2.3 Chemical analysis
The aerosol samples were analyzed for major ions, OC, EC, and organic molecular tracers in the laboratory. Major ions (Ca2+, Na+, K+, Mg2+, , Cl−, and ) were measured using an ion chromatograph (Dionex, USA) with ICS-320 and ICS-1500 (Tripathee et al., 2017). The limit of detection (LOD) of all the major ions was 0.01 µg m−3. They denoted less than 5 % of the real sample concentrations in the field blank filters (Tripathee et al., 2017). Non-sea-salt Ca2+ (nss-Ca2+) and K+ (nss-K+) were estimated according to the method from George et al. (2008). OC and EC were determined by a thermal/optical reflectance analyzer (Model 2001A, USA; Wan et al., 2015). The OC from field blank samples (0.59±0.13 µg m−3) were subtracted from the filter samples. EC in the field blank sample was 0.00 µg m−3.
A detailed analytical method of organic molecular tracers was described previously by Wan et al. (2017). A trace gas chromatograph coupled to a PolarisQ mass spectrometer detector (GC–MS, Thermo Scientific) was used for analysis. Briefly, small filter portions (1.13–3.39 cm2) were cut, spiked with appropriate amounts of methyl-β-D-xylanopyranoside (MXP, 99 %, Sigma) and D3-malic acid (DMA, C/D/N Isotopes Inc., 99 %) as internal recovery standards. Each filter portion was then extracted three times with a mixture of 20 mL dichloromethane ∕ methanol (2 : 1, v∕v) at room temperature for 30 min. The solvent extracts in total of 60 mL were combined and successively filtered through quartz wool, concentrated, dried over ultrapure nitrogen gas, and then reacted with 50 µL of 99 % N,O-bis-(trimethylsilyl)trifluoroacetamide (BSTFA, with 1 % trimethylsilyl chloride) and pyridine () at 70 ∘C for 3 h. n-Hexane of 150 µL was added after derivatization. A TG-5MS column (30 m × 0.25 mm × 0.25 µm) was used for separation according to the GC temperature program. The oven temperature was initially held at 50 ∘C for 2 min, increased to 120 ∘C at 30 ∘C min−1, then to 300 ∘C at 6 ∘C min−1, and finally held for 16 min. The MS was operated in electron ionization (EI) mode at 70 eV with a scan range of 50–650 Da.
For quantitative analysis, authentic standards processed as the samples above were used to establish the calibration curves. To quantitate the target compounds when their were no available standards, surrogate compounds were used as the following: erythritol for 2-methylglyceric acid (2-MGA), 2-methyltetrols (2-MTLs), and C5-alkene triols; cis-pinonic acid (PNA) for 3-hydroxyglutaric acid (3-HGA) and 3-methyl-1,2,3-butanetricarboxylic acid (MBTCA); pinic acid (PA) for β-caryophyllinic acid (β-CA); and azelaic acid for 2,3-dihydroxy-4-oxopentanoic acid (DHOPA). Recoveries for target tracers and MXP (Table S1) were more than 75 %. The exception was for malic acid (50.3 %–90.5 %) and cis-pinonic acid (60.2 %–81.8 %). The relative differences based on duplicate analysis were less than 15 %. The method detection limits (MDLs) were 0.04–0.13 ng m−3 (Table S1). Our results were not corrected for the recoveries. No target compounds were detected in the field blank filters using the same procedure with the samples.
Table 1 lists chemical species (OC, EC, and major ions) and molecular markers (from the sources of biomass burning, BB; fungal spores; plant debris; plastic emissions; and biogenic and anthropogenic secondary formation) analyzed in this study. They include anhydrosugars (levoglucosan, mannosan, and galactosan), primary saccharides (sucrose, trehalose, glucose, and xylose) and sugar alcohols (mannitol, arabitol, sorbitol, and erythritol), lignin and resin pyrolysis products (vanillic, syringic, p-hydroxybenzoic and dehydroabietic acids), phthalic acid esters, isoprene tracers (2-MGA, 2-MTLs of methylthreitol and 2-methylerythritol, C5-alkene triols of cis-2-methyl-1,3,4-trihydroxy-1-butene, 3-methy-2,3,4-trihydroxy-1-butene, and trans-2-methyl-1,3,4-trihydroxy-1-butene), monoterpene tracers (PNA, PA, 3-HGA and MBTCA), β-CA, and DHOPA.
Table 1Concentrations of TSP, major ions, OC, EC (µg m−3), and molecular tracers in the aerosols from Bode, Kathmandu Valley (ng m−3).
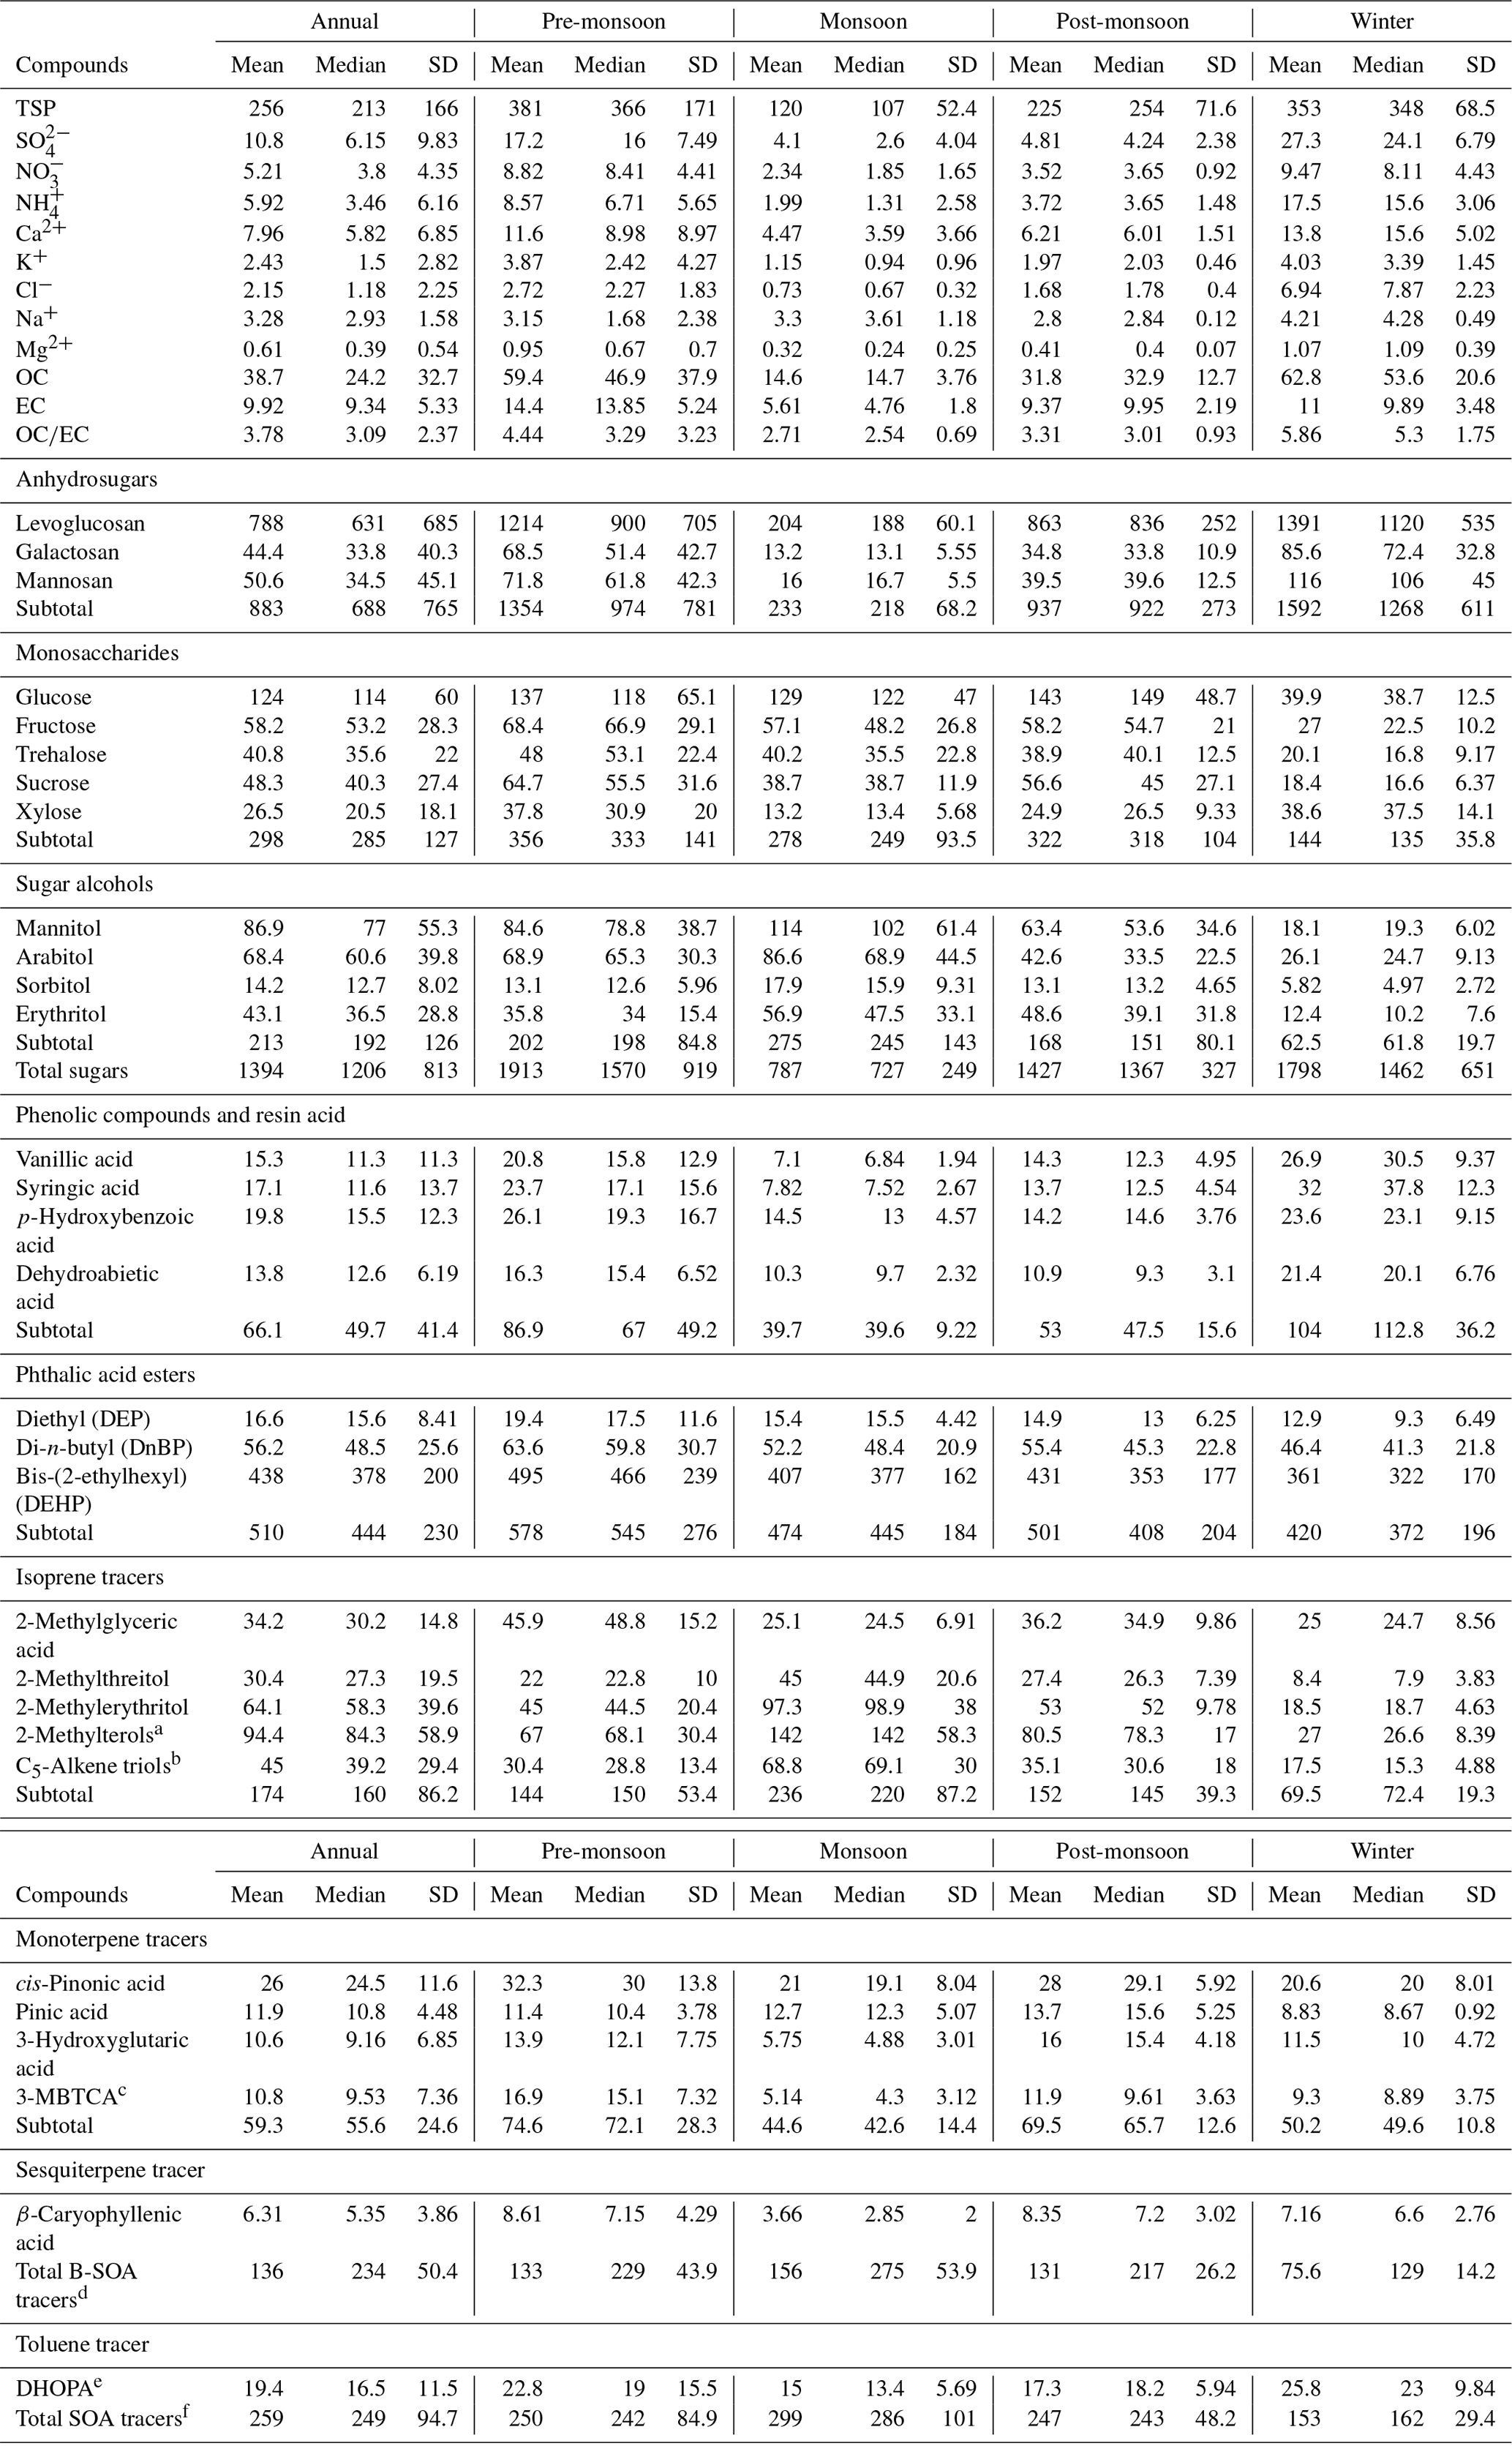
a Sum of 2-methylthreitol and
2-methylerythritol. b C5-Alkene triols:
3-Methy-2,3,4-trihydroxy-1-butene,
cis-2-methyl-1,3,4-trihydroxy-1-butene, and
trans-2-methyl-1,3,4-trihydroxy-1-butene.
c 3-MBTCA:
3-methyl-1,2,3-butanetricarboxylic acid. d Sum of 2-methylglyceric
acid, 2-methylterols, C5-alkene triols, cis-pinonic acid, pinic
acid, 3-hydroxyglutaric acid and 3-MBTCA. e DHOPA:
2,3-dihydroxy-4-oxopentanoic acid. f Sum of 2-methylglyceric acid,
2-methylterols, C5-alkene triols, cis-pinonic acid, pinic acid,
3-hydroxyglutaric acid and 3-MBTCA, and 2,3-dihydroxy-4-oxopentanoic acid.
2.4 Estimation of measurement uncertainty
The application of surrogate standards for the quantification of most SOA tracers (excluding PNA and PA) could cause additional errors to the measurements. Error in analyte measurement (EA) is propagated from the standard deviation of the field blank (EFB), error in spike recovery (ER), and error from surrogate quantification (EQ):
EFB was 0 in this study due to the undetectable SOA tracers in the field blanks. To estimate the ER of tracers, the spike recoveries of surrogate standards within the range of 9.2 % (erythritol) to 26.1 % (PNA) were used. EQ was estimated by an empirical approach according to Stone et al. (2012). The relative error introduced by each carbon atom (En), oxygenated functional group (Ef), and alkenes (Ed) was estimated to be 15 %, 10 %, and 60 %, respectively. Therefore, EQ is calculated as
where Δn, Δf, and Δd are the difference between a surrogate and an analyte of carbon atom number, oxygen-containing functional group, and alkene functionality, respectively.
EQ was calculated in the range of 15 % (2-MTLs) to 120 % (β-CA) and the estimation of EA ranged from 17.6 % to 122.4 %. The estimated uncertainties for the measurement of the SOA tracers are presented in Table S2.
2.5 Meteorological parameters
The meteorological parameters (e.g., temperature, T; relative humidity, RH; etc.) used in this study were derived from Tribhuvan International Airport (https://www.wunderground.com/, last access: 24 February 2019), which is located west of Bode (approximately 4 km). Mixing layer height (MLH) data were measured with a Vaisala ceilometer at the Bode site (Mues et al., 2017). The meteorology of KV and its surrounding regions is controlled by the South Asian monsoon circulations in the wet season (monsoon, June–September). Westerlies dominate the atmospheric circulation patterns during the dry seasons including pre-monsoon (March–May), post-monsoon (October–November), and winter (December–February) with limited precipitation (Pudasainee et al., 2006; Mues et al., 2017). Additionally, it is also influenced by local mountain valley circulation (Mues et al., 2018).
A statistical concentration summary of major ions, OC, EC, and organic tracers identified in TSP samples collected at the Bode site is presented in Table 1. Tracers for six classes of organic compounds were detected: anhydrosugars, monosaccharides, sugar alcohols, phenolic compounds and resin acid, phthalic acid esters, and SOA tracers.
3.1 Aerosol loadings
The TSP samples at the Bode site exhibited daily mass concentrations from 32.0 to 723 µg m−3 (256±166 µg m−3) during April 2013 to April 2014 (Table 1). Putero et al. (2015) reported 195±83 µg m−3 of online PM2.5 concentration at the Pakajol site (also one of SusKat-ABC sites), accounting for roughly 80 % of TSP in our study. The TSP concentrations were comparable to those reported over other heavily polluted regions in South Asia, including Islamabad in Pakistan (Shah and Shaheen, 2008) and Kolkata (Gupta et al., 2007) and Agra (Rajput and Lakhani, 2010) in India. Compared to the remote sites such as Lulang in the Tibetan Plateau (Wang et al., 2015) and Manora Peak in the central Himalaya (Ram et al., 2010), the TSP at Bode shows significantly higher mass concentrations. We found a clear seasonal variation in TSP mass concentrations (Fig. 2a), higher in pre-monsoon season (381±366 µg m−3) and winter (353±348 µg m−3), and lower in the monsoon period (120±107 µg m−3), which was nearly half of the post-monsoon season (225±71.6 µg m−3). It generally corresponded to the buildup of the ABCs, which engulfed most of South Asia and the northern Indian Ocean extending from November to May (Ramanathan et al., 2005).
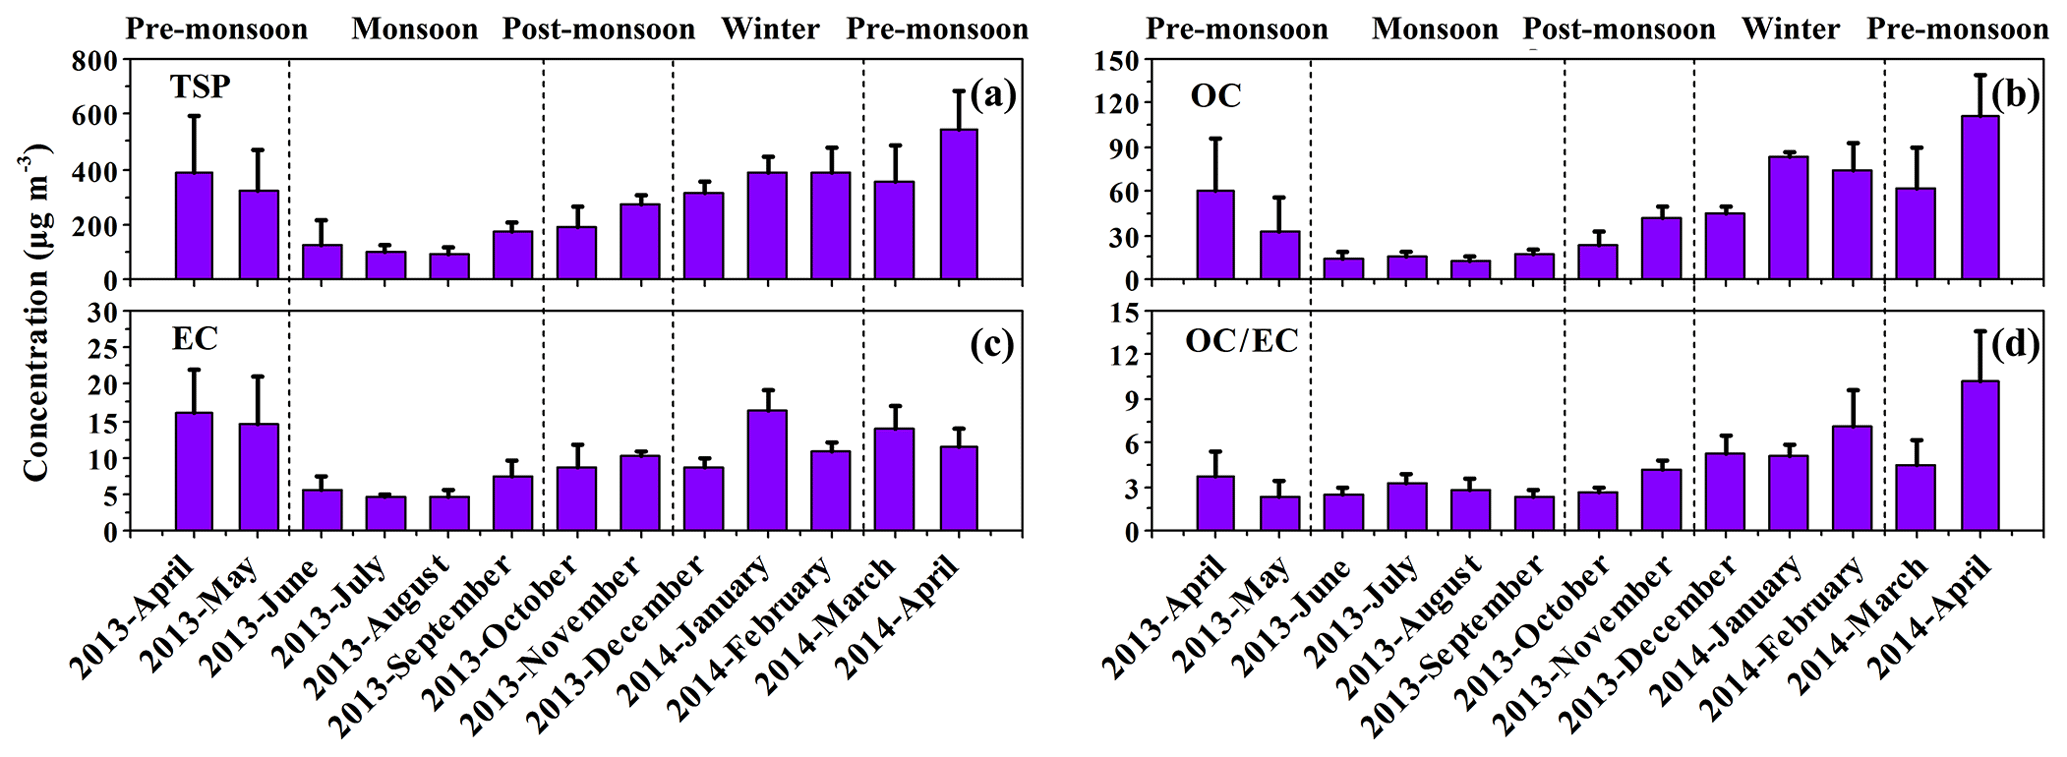
Figure 2Monthly variations in TSP, OC, EC, and OC∕EC ratios at the Bode site, Kathmandu Valley, during April 2013–April 2014.
Meteorological parameters may also affect the TSP concentrations. The highest TSP concentration observed during the pre-monsoon period can be caused by the fugitive dust that has been blown up by strong wind and the absence of wet precipitation (Fig. S1a and c). The lower TSP concentration in the monsoon was likely related to increased precipitation (Fig. S1c) after the onset of the South Asian monsoon. During this season, nearly 80 % of the annual precipitation falls in the KV, which flushes out pollutants from the atmosphere (Tripathee et al., 2017; Wester et al., 2019). During winter, an inversion layer often occurs in the KV owing to its bowl-shaped topography (Pudasainee et al., 2006). The existence of an inversion layer with the lower temperature (12.0±2.41 ∘C), wind speed (2.86±1.34 km h−1), and MLH (0.34±0.08 km) (Mues et al., 2017; Fig. S1a, c and d) altogether reduced the pollution dispersion mechanism resulting in increased levels of pollutants close to the ground surface.
3.2 Major ions, OC and EC
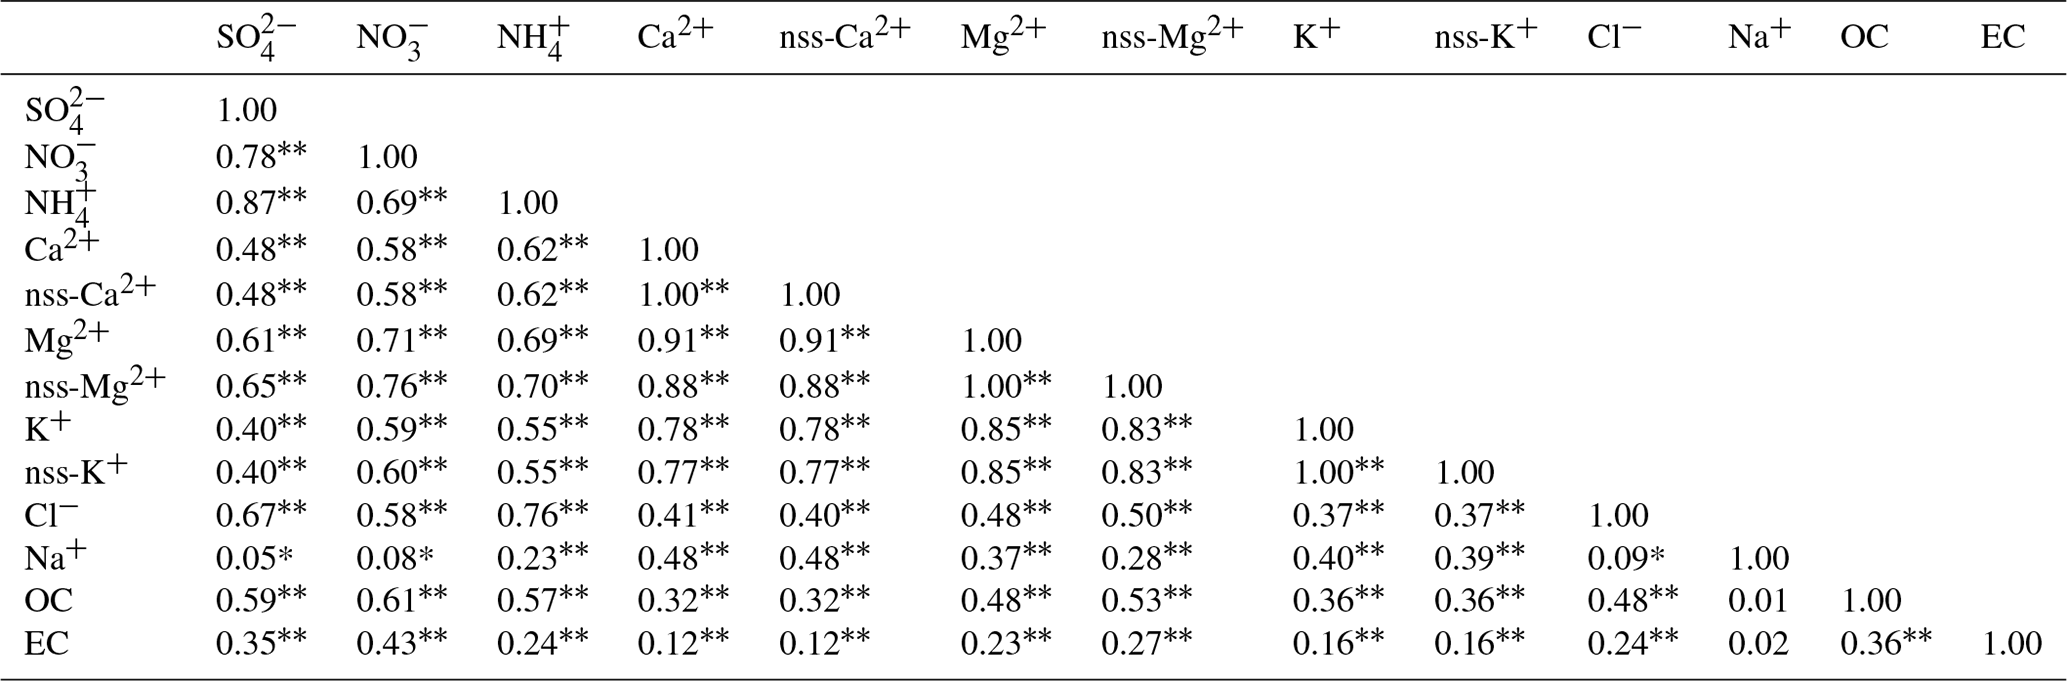
Concentrations of eight major ions were measured in the aerosol samples from the Bode site. The total sum accounted for 17.1 %±8.5 % of annual average TSP mass. Sulfate ranked the highest among them (annual mean: 10.8±9.83 µg m−3), followed by Ca2+ (7.96±6.85 µg m−3), (5.92±6.16 µg m−3), (5.21±4.35 µg m−3), Na+ (3.28±1.58 µg m−3), K+ (2.43±2.82 µg m−3), Cl− (2.15±2.25 µg m−3), and Mg2+ (0.61±0.54 µg m−3). On average, the combination of , , and , i.e., the secondary inorganic aerosols, constituted more than half (51.3 %) of the total ionic concentrations. The Ca2+ alone accounted for 22.1 % of total ions.
Sulfate, ammonium, and nitrate revealed a typical seasonality with the seasonally averaged concentrations ranked in the descending order of winter > pre-monsoon > post-monsoon > monsoon. This is consistent with the seasonal variation in the precursors NOx, NO2, and SO2, which are mainly caused by automobile exhaust, household cooking, and emissions from brick kilns co-fired with biomass in the KV (Kiros et al., 2016; Wester et al., 2019). Currently, nearly 50 % of the total motor vehicles in Nepal (approximately 2.33 million) run on the KV roads (DoTM, 2015; Mahata et al., 2018). Diesel- or gasoline-powered generators (producing higher NOx emissions) and garbage burning are other major pollution sources in Nepal during the sampling period, which can also emit many aerosol precursors (Stockwell et al., 2016).
Ions derived from crustal sources, such as Ca2+ and Mg2+, are related to the local fugitive dust sources such as unpaved roads and construction activities (Ram et al., 2010). Interestingly, good correlations were found for Ca2+ and (R2=0.48, P<0.001), (R2=0.58, P<0.001), and (R2=0.62, P<0.001), and for Mg2+ and (R2=0.61, P<0.001), (R2=0.71, P<0.001), and (R2=0.69, P<0.001), respectively (Table 2), which hinted that dust may co-exist with , , and in the KV (Tripathee et al., 2017).
Table 2Linear correlation coefficients (R2) among major ions and OC and EC in aerosols in Bode, Kathmandu Valley.
* P<0.1; : P<0.001.
Carbonaceous aerosols (OC: 38.7±32.7 µg m−3 and EC: 9.92±5.33 µg m−3) accounted for 19.2 %±5.48 % of TSP mass through the sampling period at the Bode site, which was higher than that of the major ions. OC alone accounted for 14.6 %±4.81 % of the TSP mass. During winter and pre-monsoon seasons, OC and EC showed much higher concentrations than those during the wet season (Fig. 2b and c). In this study, we found that the daily OC to EC mass ratios (OC∕EC) varied from 0.77 to 15.8 (annual mean: 3.78±2.37) and seasonal mean ratios of 4.44, 2.71, 3.31, and 5.86 during pre-monsoon, monsoon, post-monsoon, and winter seasons, respectively (Table 1 and Fig. 2d). The OC∕EC ratios of more than 2.0 indicate the BB aerosols or the formation of secondary organic matter (Cao et al., 2007). Their influence and contribution will be discussed in the following sections. The OC∕EC ratios found in this study for the KV were similar to other sites in South Asia, like Lumbini (5.16±2.09, 2.41–10.03; Wan et al., 2017), Delhi (5.86±0.99, 2.9–9.2; Bisht et al., 2015), and Lahore (3.9±1.6, 1.5–7.2; Alam et al., 2014).
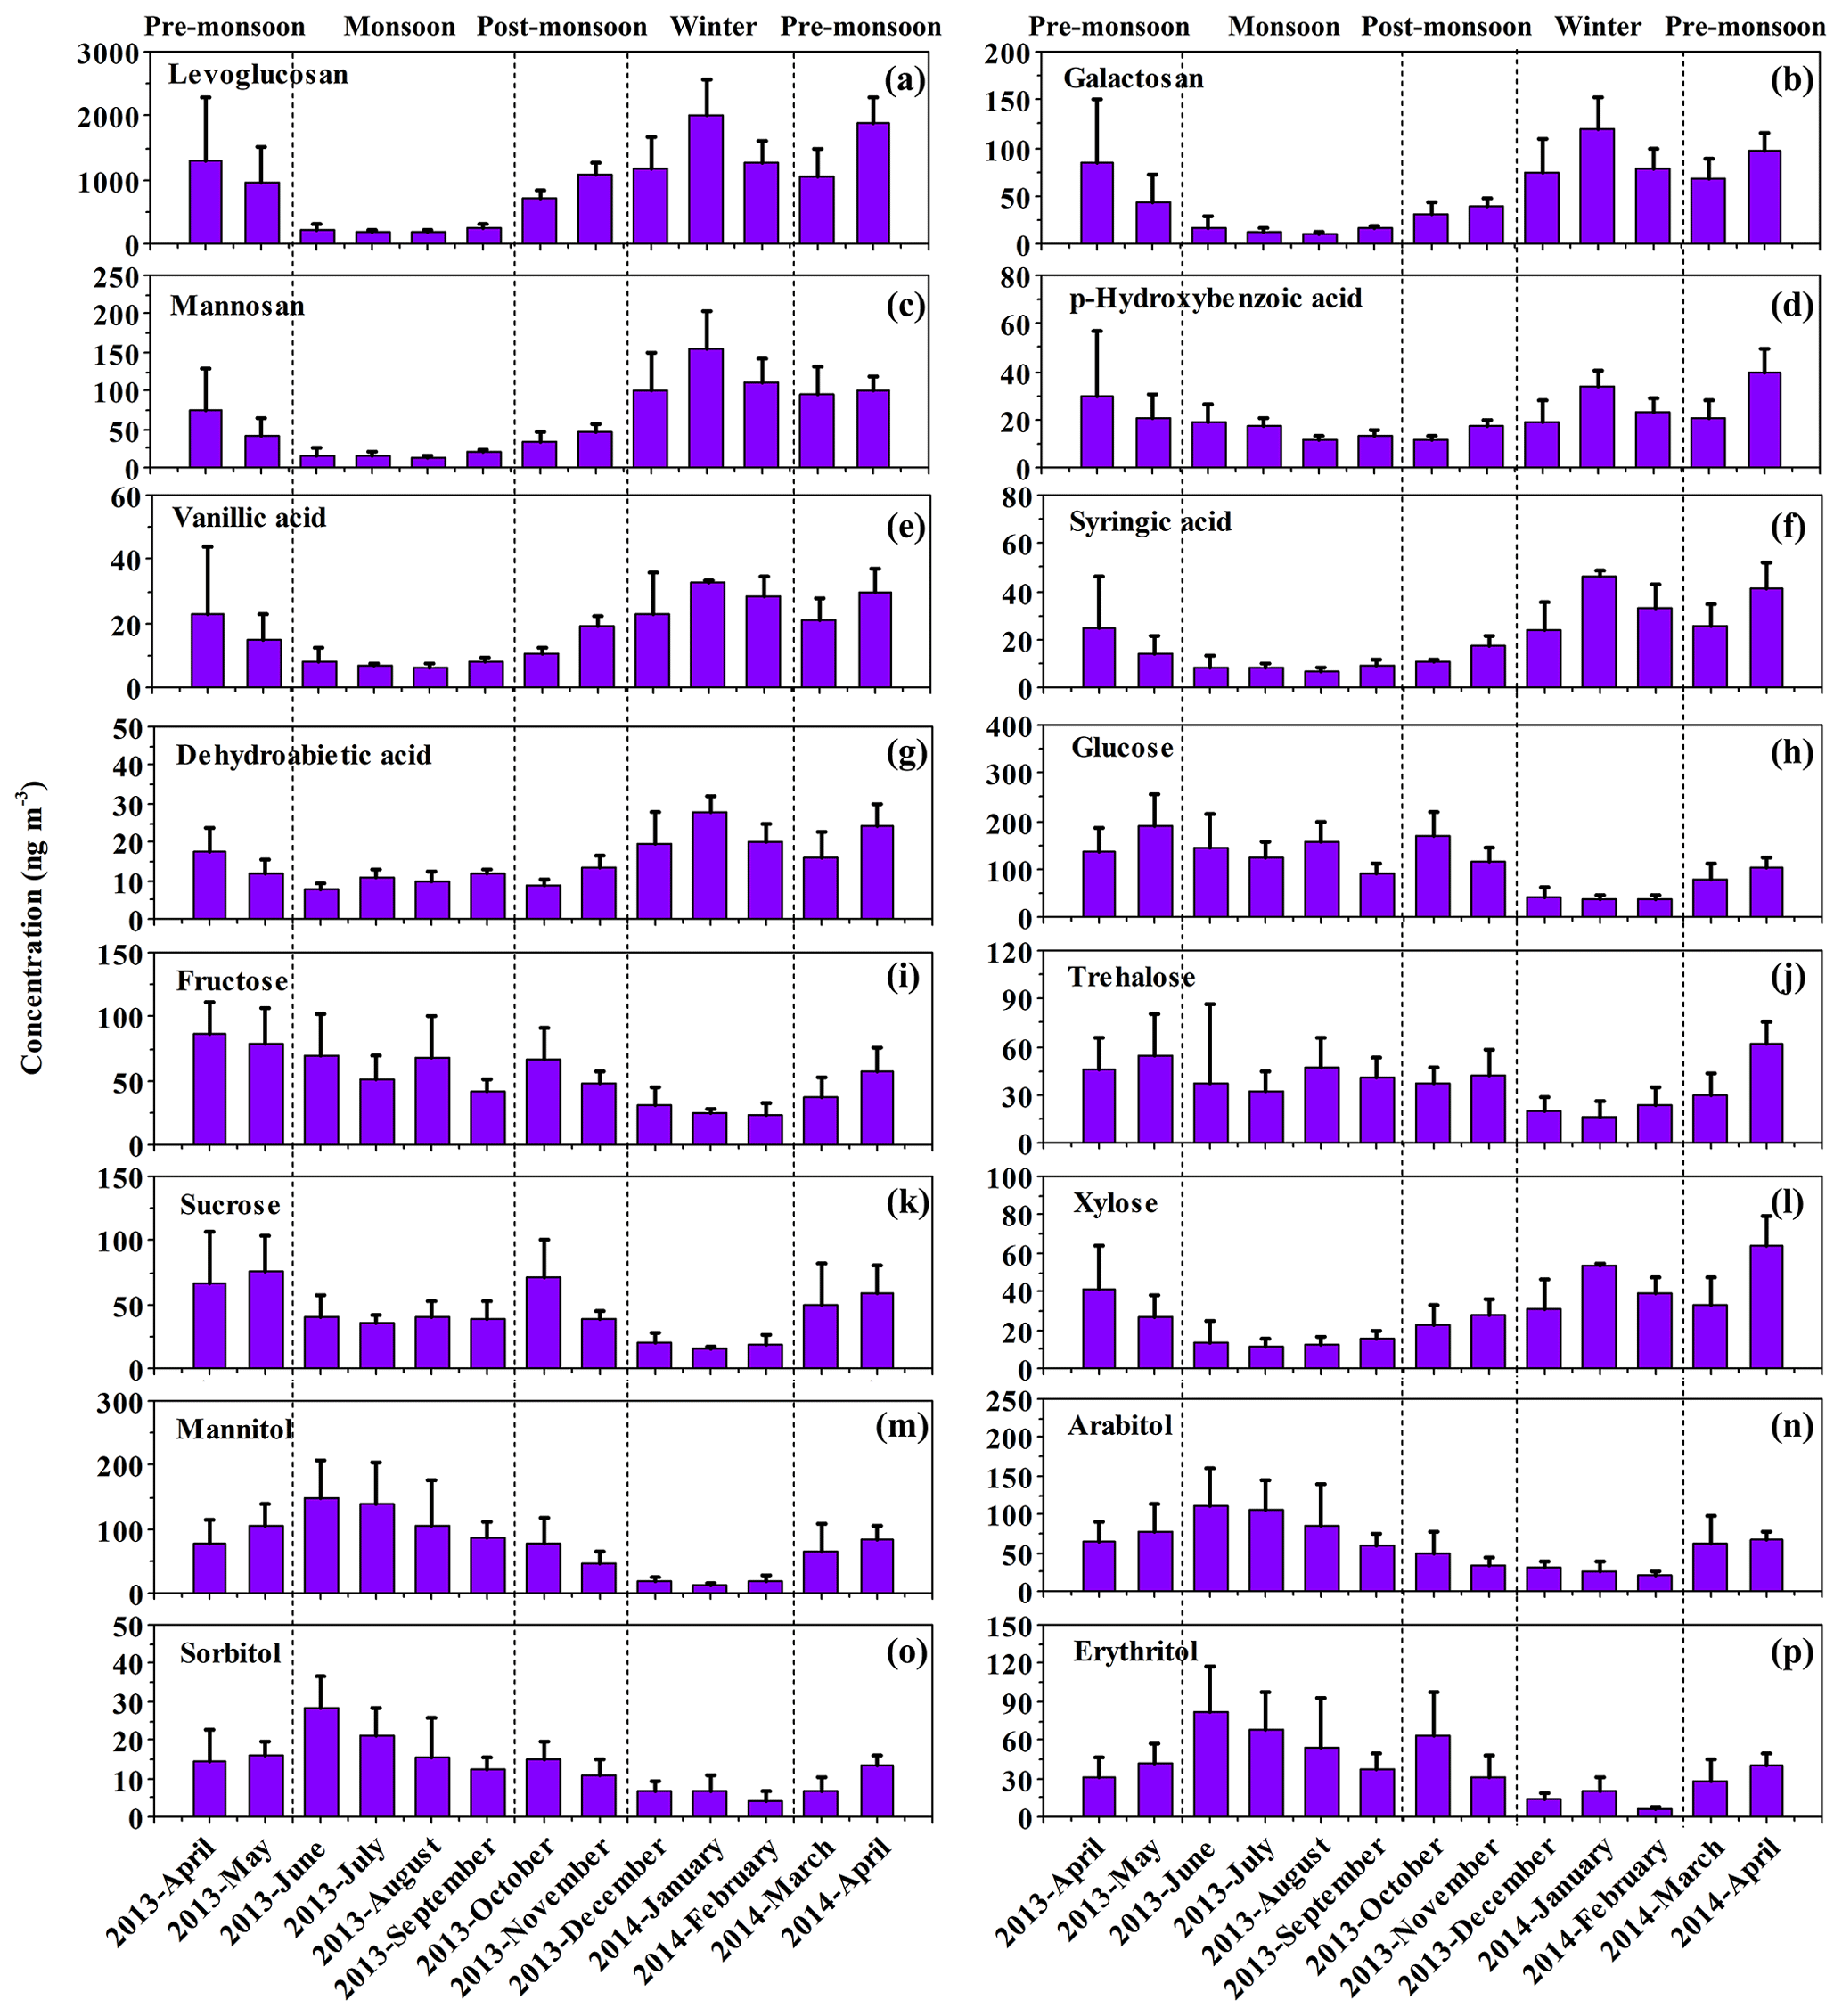
Figure 3Monthly variations in biomass burning tracers, monosaccharides, and sugar alcohols at the Bode site, Kathmandu Valley, during April 2013–April 2014.
3.3 Sugar compounds
3.3.1 Anhydrosugars
Anhydrosugars of levoglucosan (1,6-anhydro-β-D-glucopyranose) and its two isomers (mannosan and galactosan) have been used as ideal molecular tracers for BB emissions (Simoneit, 2002; Bhattarai et al., 2019). They are exclusively emitted from the combustion and pyrolysis of cellulose and hemicelluloses. In the current study, the annual average concentration of levoglucosan was 788±685 ng m−3, ranging from 58.8 to 3079 ng m−3, which was the dominant species of the total identified tracer compounds (Table 1).
For the seasonality, levoglucosan showed significantly higher levels during winter, pre-monsoon, and post-monsoon seasons (Fig. 3a). Especially higher concentrations were recorded in winter varying from 830 to 2395 ng m−3 (annual mean: 1391±535 ng m−3). It showed comparable levels with other sites in the world, which were badly affected by the BB emissions, e.g., New Delhi (1977 ng m−3; Li et al., 2014) and Raipur (2180 ng m−3) in India (Deshmukh et al., 2016), Tasmania (4540±2480 ng m−3) in Australia (Reisen et al., 2013), and Lumbini (1161±1347) in Nepal (Wan et al., 2017). Our results were much higher than the aerosols (20–372 ng m−3) collected at the rural Godavari site (Stone et al., 2010), located on the southern edge of the KV during 2006. Good correlations were exhibited between levoglucosan and OC (R2=0.79, P<0.001), EC (R2=0.42, P<0.001), and nss-K+ (R2=0.35, P<0.01) during the sampling campaign (Fig. 4). This indicates that OC and EC in KV's aerosols are strongly related to a BB source (Kim et al., 2015).
The ratio of levoglucosan to mannosan (Lev∕Man) has been applied to distinguish the possible categories of biomass burnt. Previously, higher Lev∕Man ratios were reported for emissions from combustion of hardwood (ranging from 12.9 to 35.4 with an average of 21.5±8.3) and agricultural residues (range from 12.7 to 55.7 with an average of 32.6±19.1; Sang et al., 2013; Bhattarai et al., 2019). For the softwood burning, the average ratio was 4.0±1.0 (ranging from 2.5 to 5.8). In the current study, the annual mean ratio of Lev∕Man was 16.3±5.96 ranging from 9.13 to 33.1 with only nine samples less than 10. It can be inferred that the combustion of crop residues and hardwood is likely to be one of the major sources of atmospheric pollution in this region. A previous study also reported that the combustion of wood fuel for cooking and heating is common during wintertime in Nepal, and there is much more crop residue combustion during both pre- and post-monsoon seasons (Stockwell et al., 2016). This is not only a local but also a regional phenomenon; for example, Bhardwaj et al. (2018) and Wan et al. (2017) pointed out emissions from crop residue burning during the pre- and post-monsoon periods from western India and eastern Pakistan impact the air quality in Nepal. Similarly, Rupakheti et al. (2017) also showed that the combustion of agricultural residues and forest fires over the northwestern IGP region are causes of the air pollution episodes over the foothills of the central Himalayas. In addition, brick kilns mainly operated during January–April burned substantial quantities of low-grade coal, mixed crop wastes, and firewood (Kim et al., 2015; Wester et al., 2019). Such emissions may also lead to the high levels of levoglucosan observed at Bode. We must point out that incense burning in KV may also influence the levoglucosan concentration.
3.3.2 Monosaccharides
Primary biological aerosol particle (PBAP) tracers, commonly known also as bioaerosols, were analyzed in the Bode aerosol samples, including five monosaccharides of glucose, fructose, trehalose, sucrose, and xylose. PBAPs are derived from fungal spores, vegetative debris, pollen, bacteria, and viruses. Most of them can cause adverse effects (e.g., allergenic reaction) to human health (Bauer et al., 2008; Myriokefalitakis et al., 2017).
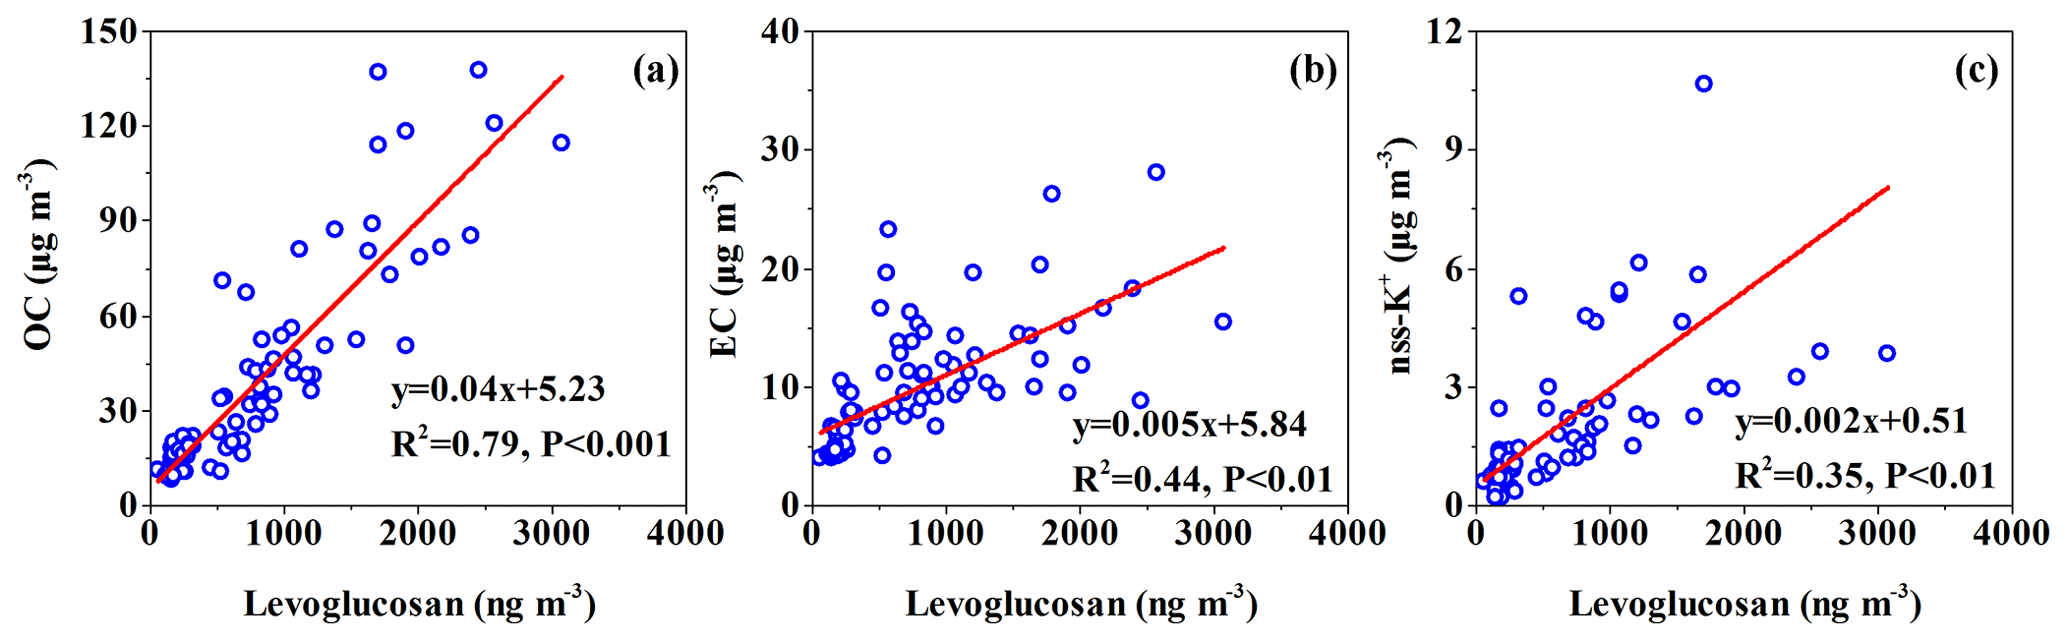
Figure 4Correlations between (a) levoglucosan and OC, (b) levoglucosan and EC, (c) levoglucosan and nss-K+ in Bode aerosols during the sampling period (April 2013–April 2014).
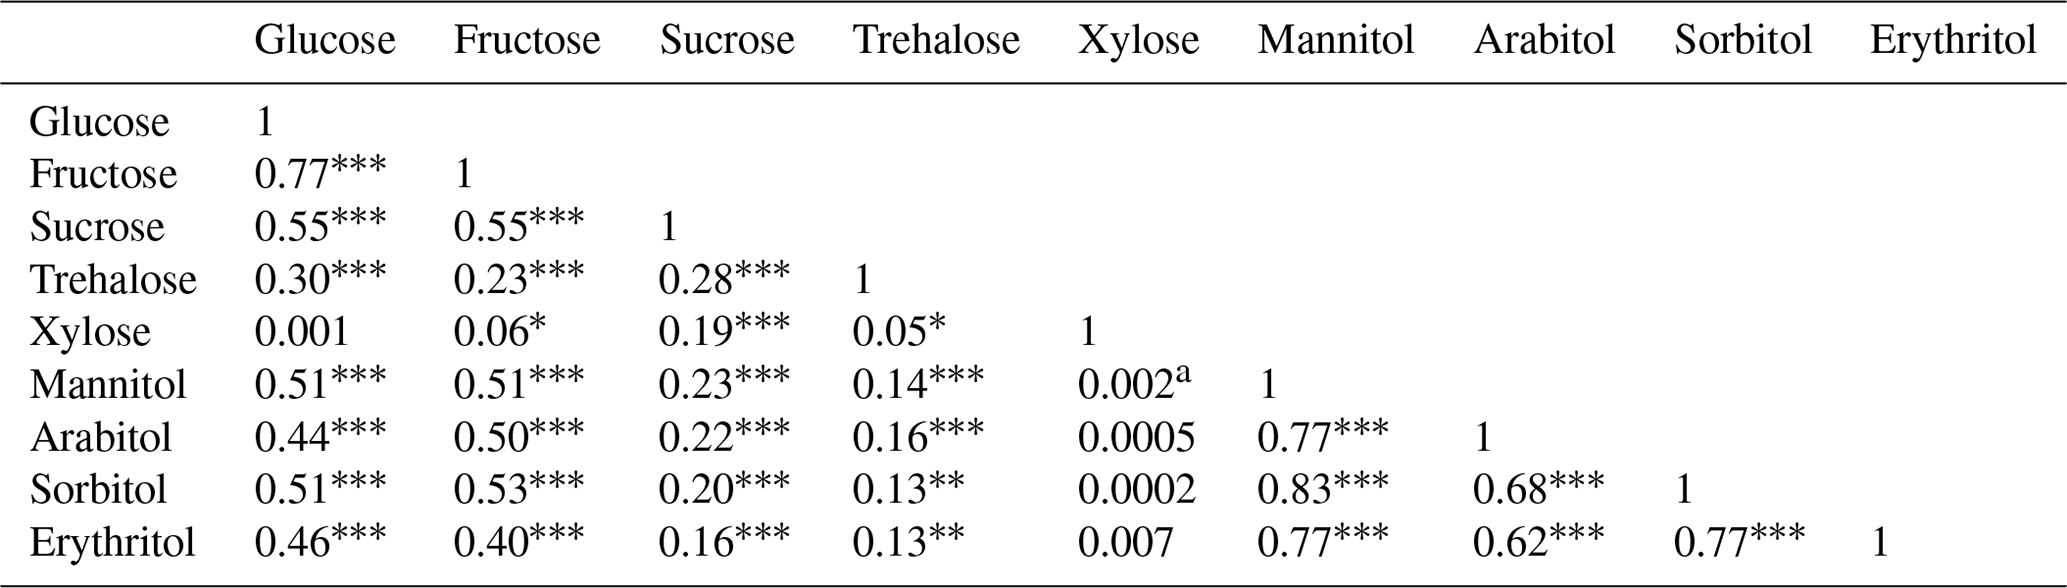
Table 3Linear correlation coefficients (R2) among monosaccharides and sugar alcohols in aerosols from Bode, Kathmandu Valley.
a Negative value indicate negative correlation. * p<0.1; p<0.01; p<0.001.
In the current work, total monosaccharides had an annual mean concentration of 298±127 ng m−3. Glucose was the predominant species among monosaccharides (124±60.0 ng m−3), followed by fructose (58.2±28.3 ng m−3), sucrose (48.3±27.4 ng m−3), trehalose (40.8±22.0 ng m−3), and xylose (26.5±18.1 ng m−3) (Table 1). Except xylose, they all presented higher concentrations in the pre-monsoon period while being lower in winter (Fig. 3h–k). There were significant linear correlations between glucose and fructose (R2=0.77, p<0.001), trehalose and glucose (R2=0.30, p<0.001), trehalose and fructose (R2=0.23, p<0.001), sucrose and glucose (R2=0.55, p<0.001), sucrose and fructose (R2=0.55, p<0.001), and sucrose and trehalose (R2=0.28, p<0.001) (Table 3). Therefore, the strong correlations indicated that they were derived from common sources, e.g. from local forests in the KV during the period of high productivity of plants. In addition, the pollen produced from the flowering of local vegetation also largely contribute to glucose, fructose, trehalose, and sucrose. The flowering of trees and crops peaks during the pre-monsoon season. A similar phenomenon was also reported in deciduous forests in northern Japan (Miyazaki et al., 2012).
Xylose has complex sources, including soils (Simoneit et al., 2004), microbiota (Wan and Yu, 2007), vegetation, bacteria (Cowie and Hedges, 1984), and biomass combustion (Zhu et al., 2015). It presents as less abundant and only accounts for 6.90 %±8.32 % of the total PBAP tracers identified in the Bode aerosols. For the seasonal pattern, it is characterized by waxing in winter (38.6±14.1 ng m−3) and waning in the monsoon season (13.2±5.68 ng m−3), which was different from the other primary monosaccharides (Table 1 and Fig. 3l). Close correlation between xylose and levoglucosan (the BB tracer) was observed in our study (Fig. S2, R2=0.72, p<0.001), indicating that the emissions from the burning of biomass may largely contribute to xylose in Bode aerosols. A similar finding for the xylose source (i.e., BB) was also proposed by Zhu et al. (2015).
3.3.3 Sugar alcohols
Total concentration of sugar alcohols (arabitol, sorbitol, erythritol, and mannitol) was 213±126 ng m−3, and thus lower than that of total monosaccharides (Table 1). Mannitol (86.9±55.3 ng m−3) and arabitol (68.4±39.8 ng m−3) showed higher concentrations, followed by erythritol (43.1±28.8 ng m−3) and sorbitol (14.2±8.02 ng m−3). All of them exhibited monsoon maxima (114±61.4, 86.6±44.5, 56.9±33.1, and 17.9±9.31 ng m−3, respectively) and winter minima (18.1±6.02, 26.1±9.13, 5.82±2.72, and 12.4±7.60 ng m−3, respectively) (Table 1 and Fig. 3m–p). They also showed significant correlations with each other, implying their common sources (Zhu et al., 2015). Mannitol and arabitol have been mostly associated with fungal spores, along with vegetation and mature leaves and algae (Yttri et al., 2007; Myriokefalitakis et al., 2017). Recent studies proposed that elevated concentrations of mannitol and arabitol were usually observed to augment after rain events and also highly correlated with relative humidity (Yue et al., 2016; Zhu et al., 2016). Therefore, at Bode, sugar alcohols were likely emitted by plants in nearby forest and agriculture fields, especially during the monsoon with the higher relative humidity (Fig. S1b). In addition, the higher temperatures (Fig. S1a) were conducive for more active microbial activities. Notably, the levels of PBAPs discussed above were much higher than other sites in the world (Zhu et al., 2015; Liang et al., 2016; Yttri et al., 2007), indicating the strong fungal spore production in the KV during the wet season.
3.4 Phenolic compounds and resin acid
Phenolic compounds (e.g., vanillic, syringic, and p-hydroxybenzoic acids) derived from lignin pyrolysis and resin acid (e.g., dehydroabietic acid) from burning of conifer plants can also be used as biomarkers for BB. Syringic acid is prevalent in hardwood smoke, while vanillic acid is dominant both in softwood and hardwood smoke (Myers-Pigg et al., 2016; Wan et al., 2019). Herbaceous plant smoke primarily contains p-anisic acid and p-anisaldehyde (e.g., p-hydroxybenzoic acid and p-hydroxybenzaldehyde). Dehydroabietic acid is a dominant compound in the total lipid material from pinewood smoke. Therefore, three pyrolysis products of lignin (vanillic, syringic, and p-hydroxybenzoic acids) and one pyrolysis product of resin acid (dehydroabietic acid) were chosen as organic markers in this study.
p-Hydroxybenzoic acid (19.8±12.3 ng m−3) was the predominant species, the second was dehydroabietic acid (13.8±6.19 ng m−3), and then vanillic (15.3±11.3 ng m−3) and syringic acids (17.1±13.7 ng m−3) (Table 1). They exhibited maximum concentrations during winter and pre-monsoon periods, and decreased during the wet season and then increased from the post-monsoon period, which was consistent with the seasonal variation of levoglucosan (Fig. 3d–g). There were also significant correlations of lignin and resin pyrolysis products with levoglucosan (cellulose pyrolysis products) (Fig. S3a; p-hydroxybenzoic acid and levoglucosan, R2=0.72, P<0.001; Fig. S3b; vanillic acid and levoglucosan, R2=0.86, P<0.001; Fig. S3c; syringic acid and levoglucosan, R2=0.83, P<0.001; Fig. S3d; and levoglucosan and dehydroabietic acid, R2=0.63, P<0.001). Such a result also shows that there are various biomass combustion sources in the valley.
The concentration ratio of syringic to vanillic acids (Syr∕Van) has recently been used to further discriminate the vegetation types burned (Fujii et al., 2015; Myers-Pigg et al., 2016; Wan et al., 2019). A previous study documented that the Syr∕Van ratios ranged from 0.1 to 2.44 for combustion of hardwood and herbaceous angiosperm, while it varied from 0.01 to 0.24 for burning softwood (Myers-Pigg et al., 2016). Regarding the aerosol samples from KV, the Syr∕Van ratio was 0.94±0.18 of an annual average ranging from 0.65 to 1.31, indicating that combustion of hardwood and herbaceous plant (including crop residues) is the most likely source of BB in the valley. This finding agrees with the results obtained from the Lev∕Man ratios discussed in Sect. 3.3.1.
Besides the information revealed by anhydrosugars discussed in Sect. 3.3.1, lignin and resin biomarkers further confirmed that BB emissions play a significant role in contributing to organic aerosols in the KV, particularly during winter and pre-monsoon periods.
3.5 Phthalic acid esters
Phthalates or phthalic acid esters are extensively utilized as key additives in the manufacturing and processing of plastic products. As they are physically rather than chemically bonded to the polymer, they can be easily released into the environment. There are potential adverse effects on the ecological system and human health due to their toxicity, e.g., carcinogenicity and endocrine disruption (Fu et al., 2010; Li et al., 2016). Diethyl (DEP), di-n-butyl (DnBP), and bis-(2-ethylhexyl) (DEHP) phthalates were analyzed in the current study. The annual average concentration of phthalates was 510±230 ng m−3 (165–1520 ng m−3; Table 1). They showed a higher concentration during the pre-monsoon season (Fig. S4). Similar concentrations of phthalates (the total of DEP, DnBP, dimethyl, diisobutyl, and di-(2-ethylhexyl) phthalates) was also investigated in an Indian urban site, with 553 ng m−3 (295–857 ng m−3) in May and 303 ng m−3 (175–598 ng m−3) during winter (Fu et al., 2010). In South Asia, large quantities of municipal solid wastes containing plastic products are generally disposed of in open landfills. The open burning of plastics along with other municipal solid waste is common in Nepal, and thus can also release numerous phthalate compounds into the atmosphere.
3.6 SOA tracers
Emissions of volatile organic compounds (VOCs) from vegetation into the atmosphere, especially isoprene, monoterpenes, and sesquiterpenes, occur in large amounts. These biogenic VOCs (B-VOCs) are crucial precursors of biogenic SOA (B-SOA). Globally, the emissions of B-VOCs (1150 Tg C yr−1), consisting of 44 % isoprene and 11 % monoterpenes are much higher than emissions of anthropogenic VOCs (only 110 Tg C yr−1; Guenther et al., 1995). It should be noted, besides biogenic emissions, combustion of biomass and fossil fuels also contributes to the isoprene, monoterpenes, and sesquiterpenes (Jathar et al., 2014; Sarkar et al., 2016, 2017). The investigation of gaseous VOCs during winter (December 2012 to February 2013) air in the KV during the SusKat-ABC campaign also showed high levels of isoprene and it was attributed (at least during high isoprene periods) mostly to biogenic emissions (Sarkar et al., 2016, 2017). It is difficult to appropriately quantify the fractions of biogenic and anthropogenic emissions of these compounds, based on ambient measurement of these species alone, without measurement of BB tracers such as acetonitrile and furan. The budget of isoprene emissions (500 Tg yr−1) on a global scale is dominated by vegetation (Guenther et al., 2006). Therefore, in our study, we considered the oxidation products of isoprene, monoterpenes, and sesquiterpenes as the tracers of biogenic emissions and attribute their main source as biogenic emissions. This may lead to some overestimation of their contributions to SOA formation.
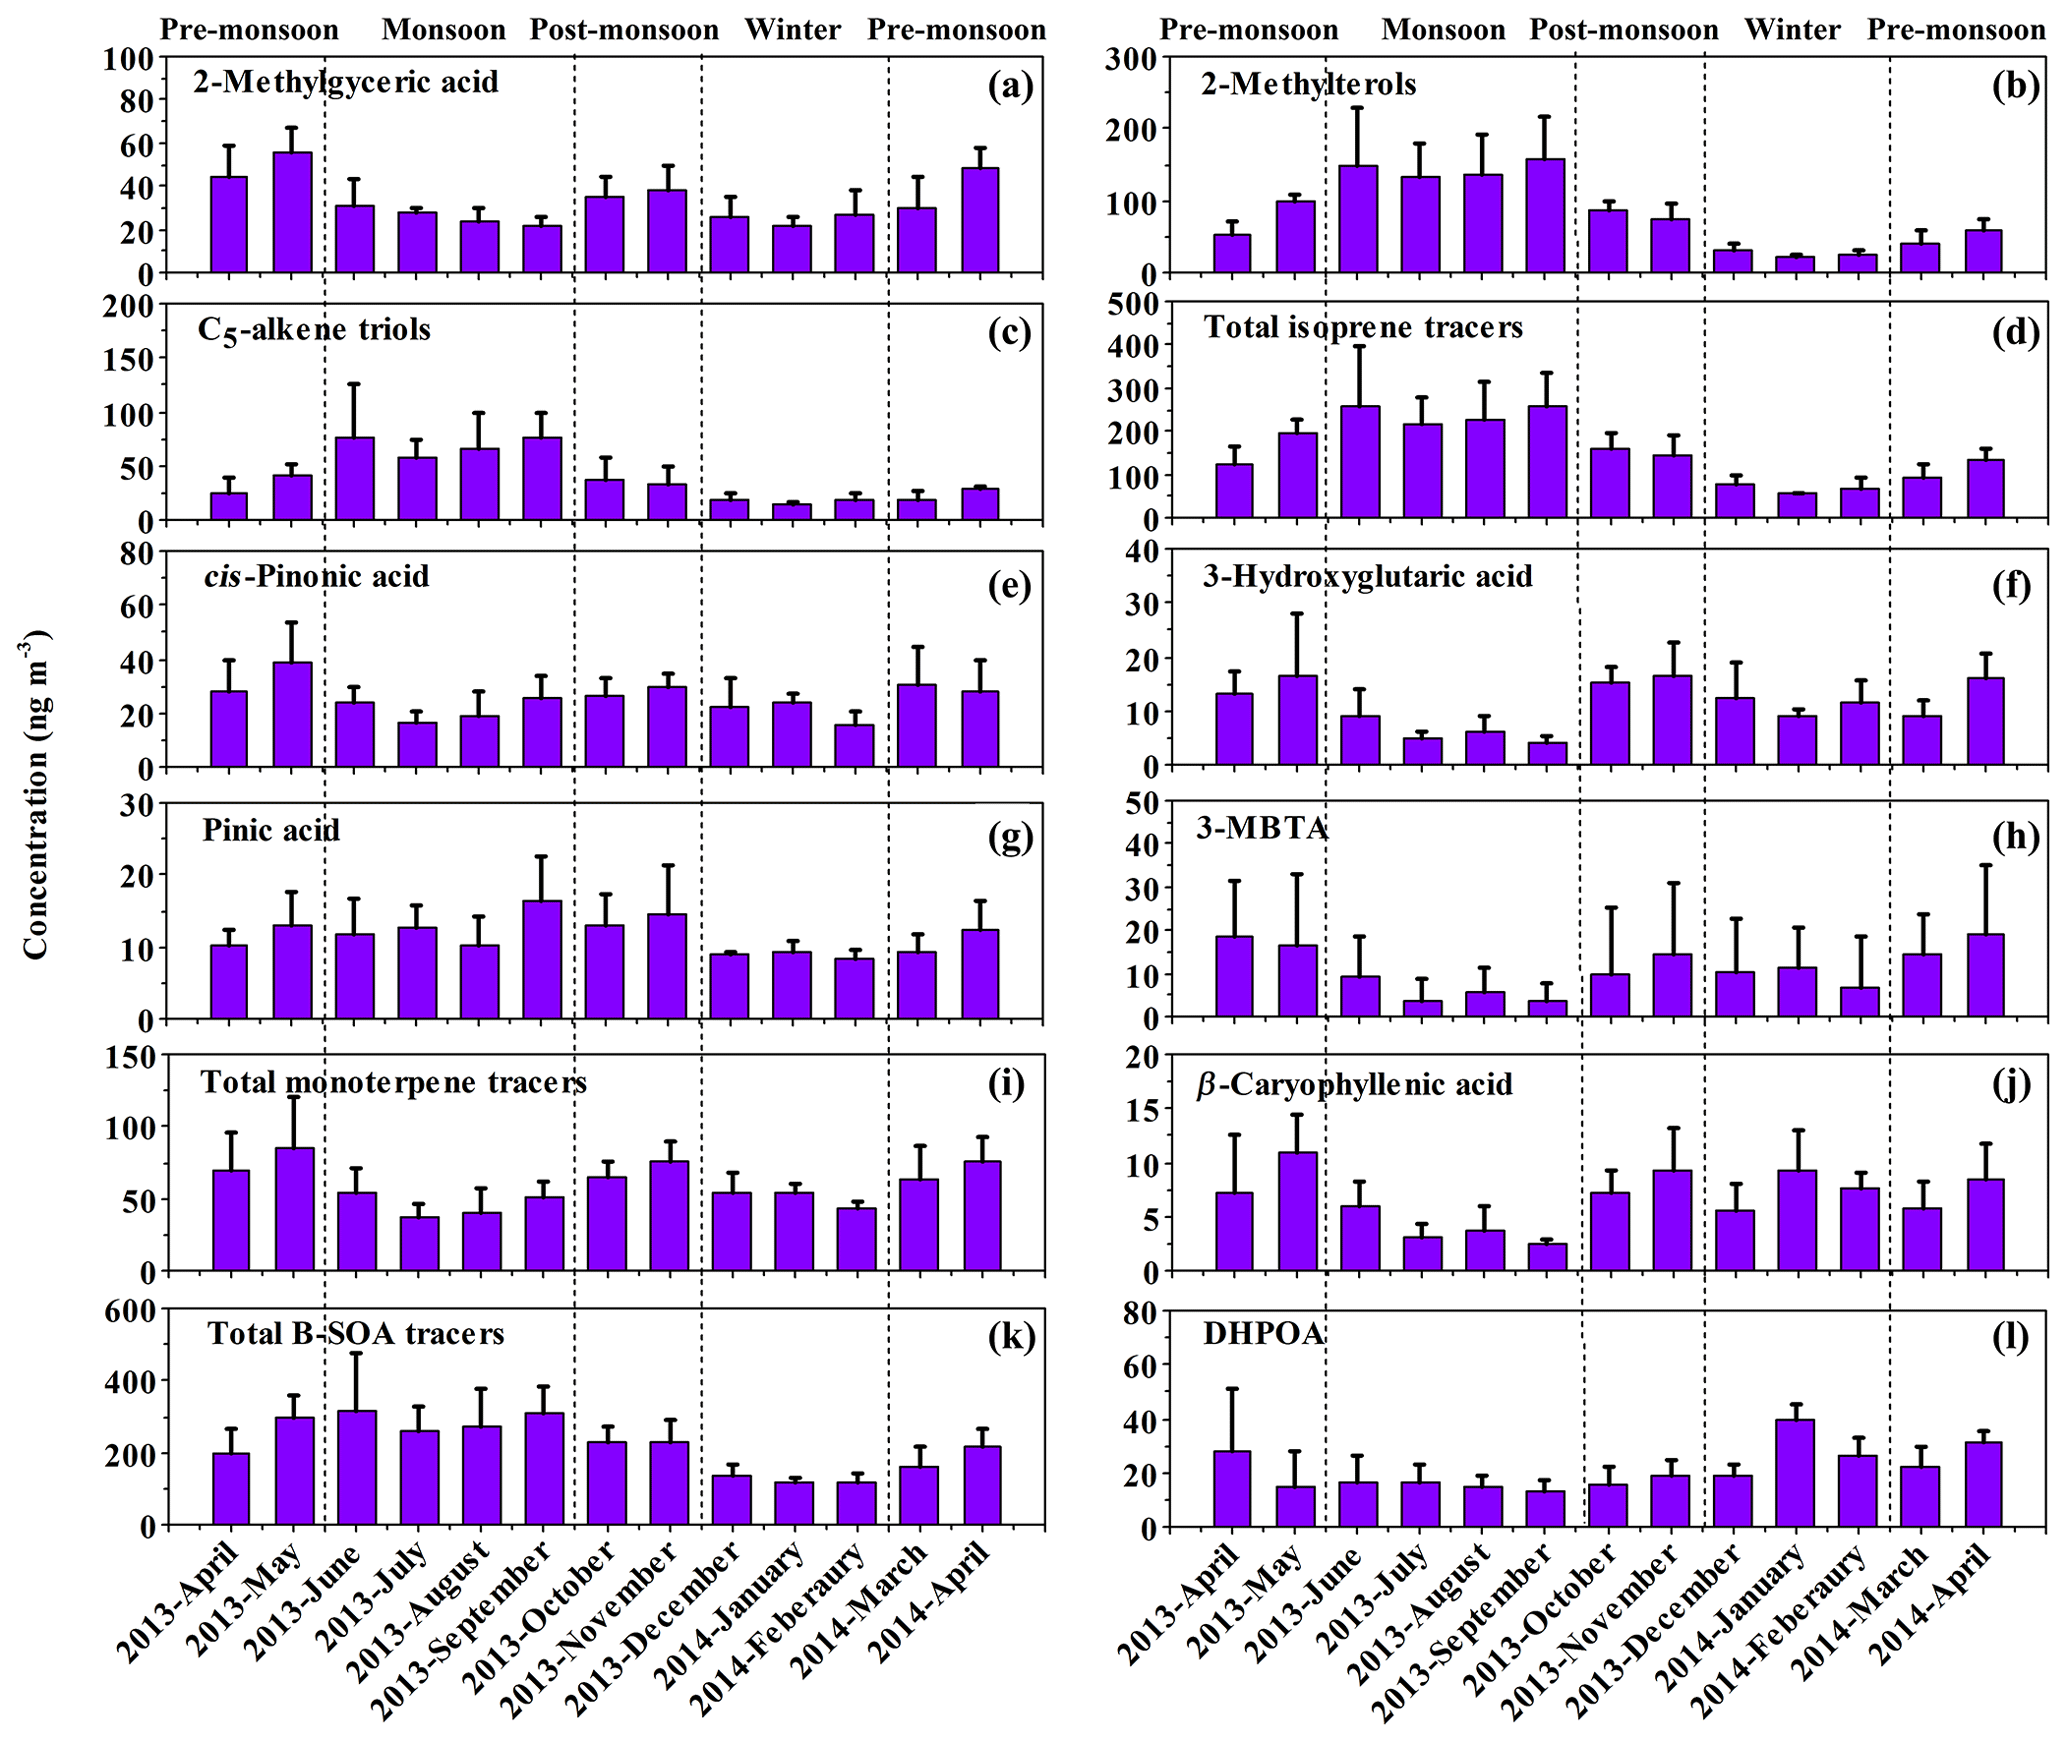
Figure 5Monthly variations in B-SOA tracers, total isoprene tracers, total monoterpene tracers, β-caryophyllenic acid, total B-SOA tracers, and DHOPA at the Bode site, Kathmandu Valley, during April 2013–April 2014.
3.6.1 Isoprene SOA tracers
Six isoprene-SOA (I-SOA) tracers were identified in the Bode aerosols: 2-MGA, two diastereoisomeric 2-methyltetrols (2-MTLs) and three C5-alkene triols. Their total concentrations ranged from 38.8 to 444 ng m−3 (174±86.2 ng m−3) with the maximum (236±87.2 ng m−3) in the monsoon season (Table 1). During the post-monsoon and pre-monsoon periods, their concentrations were similar, and a little lower than those during the monsoon (Fig. 5d) and being the lowest during winter. Their seasonal variation was in agreement with the ambient temperature (Fig. S1a), which can influence the isoprene emissions and the photochemical processes (Shen et al., 2015; Wang et al., 2008). The annual average concentration was higher than the urban sites reported from Beijing (44.3 ng m−3) and Kunming (108 ng m−3) (Ding et al., 2016a), even 1 to 2 orders of magnitude higher than that from global oceans and the Arctic (Hu et al., 2013). Among I-SOA tracers, 2-MTLs were the major components (51.0 %±10.5 %; Fig. 6), with an annual average of 94.4±58.9 ng m−3 (ranging from 10.9 to 270 ng m−3). Strong correlations were exhibited between the two isomers during all seasons (Fig. S5a), implying that they formed through a similar pathway (Shen et al., 2015; Fu et al., 2010). The daily concentration of 2-MGA ranged from 7.10 to 79.0 ng m−3 with an annual average of 34.2±14.8 ng m−3. For C5-alkene triols, the average concentration was 45.0±29.4 ng m−3. They positively correlated with 2-MTLs (Fig. S5b), indicating they were also the oxidation products of isoprene under low-NOx conditions.
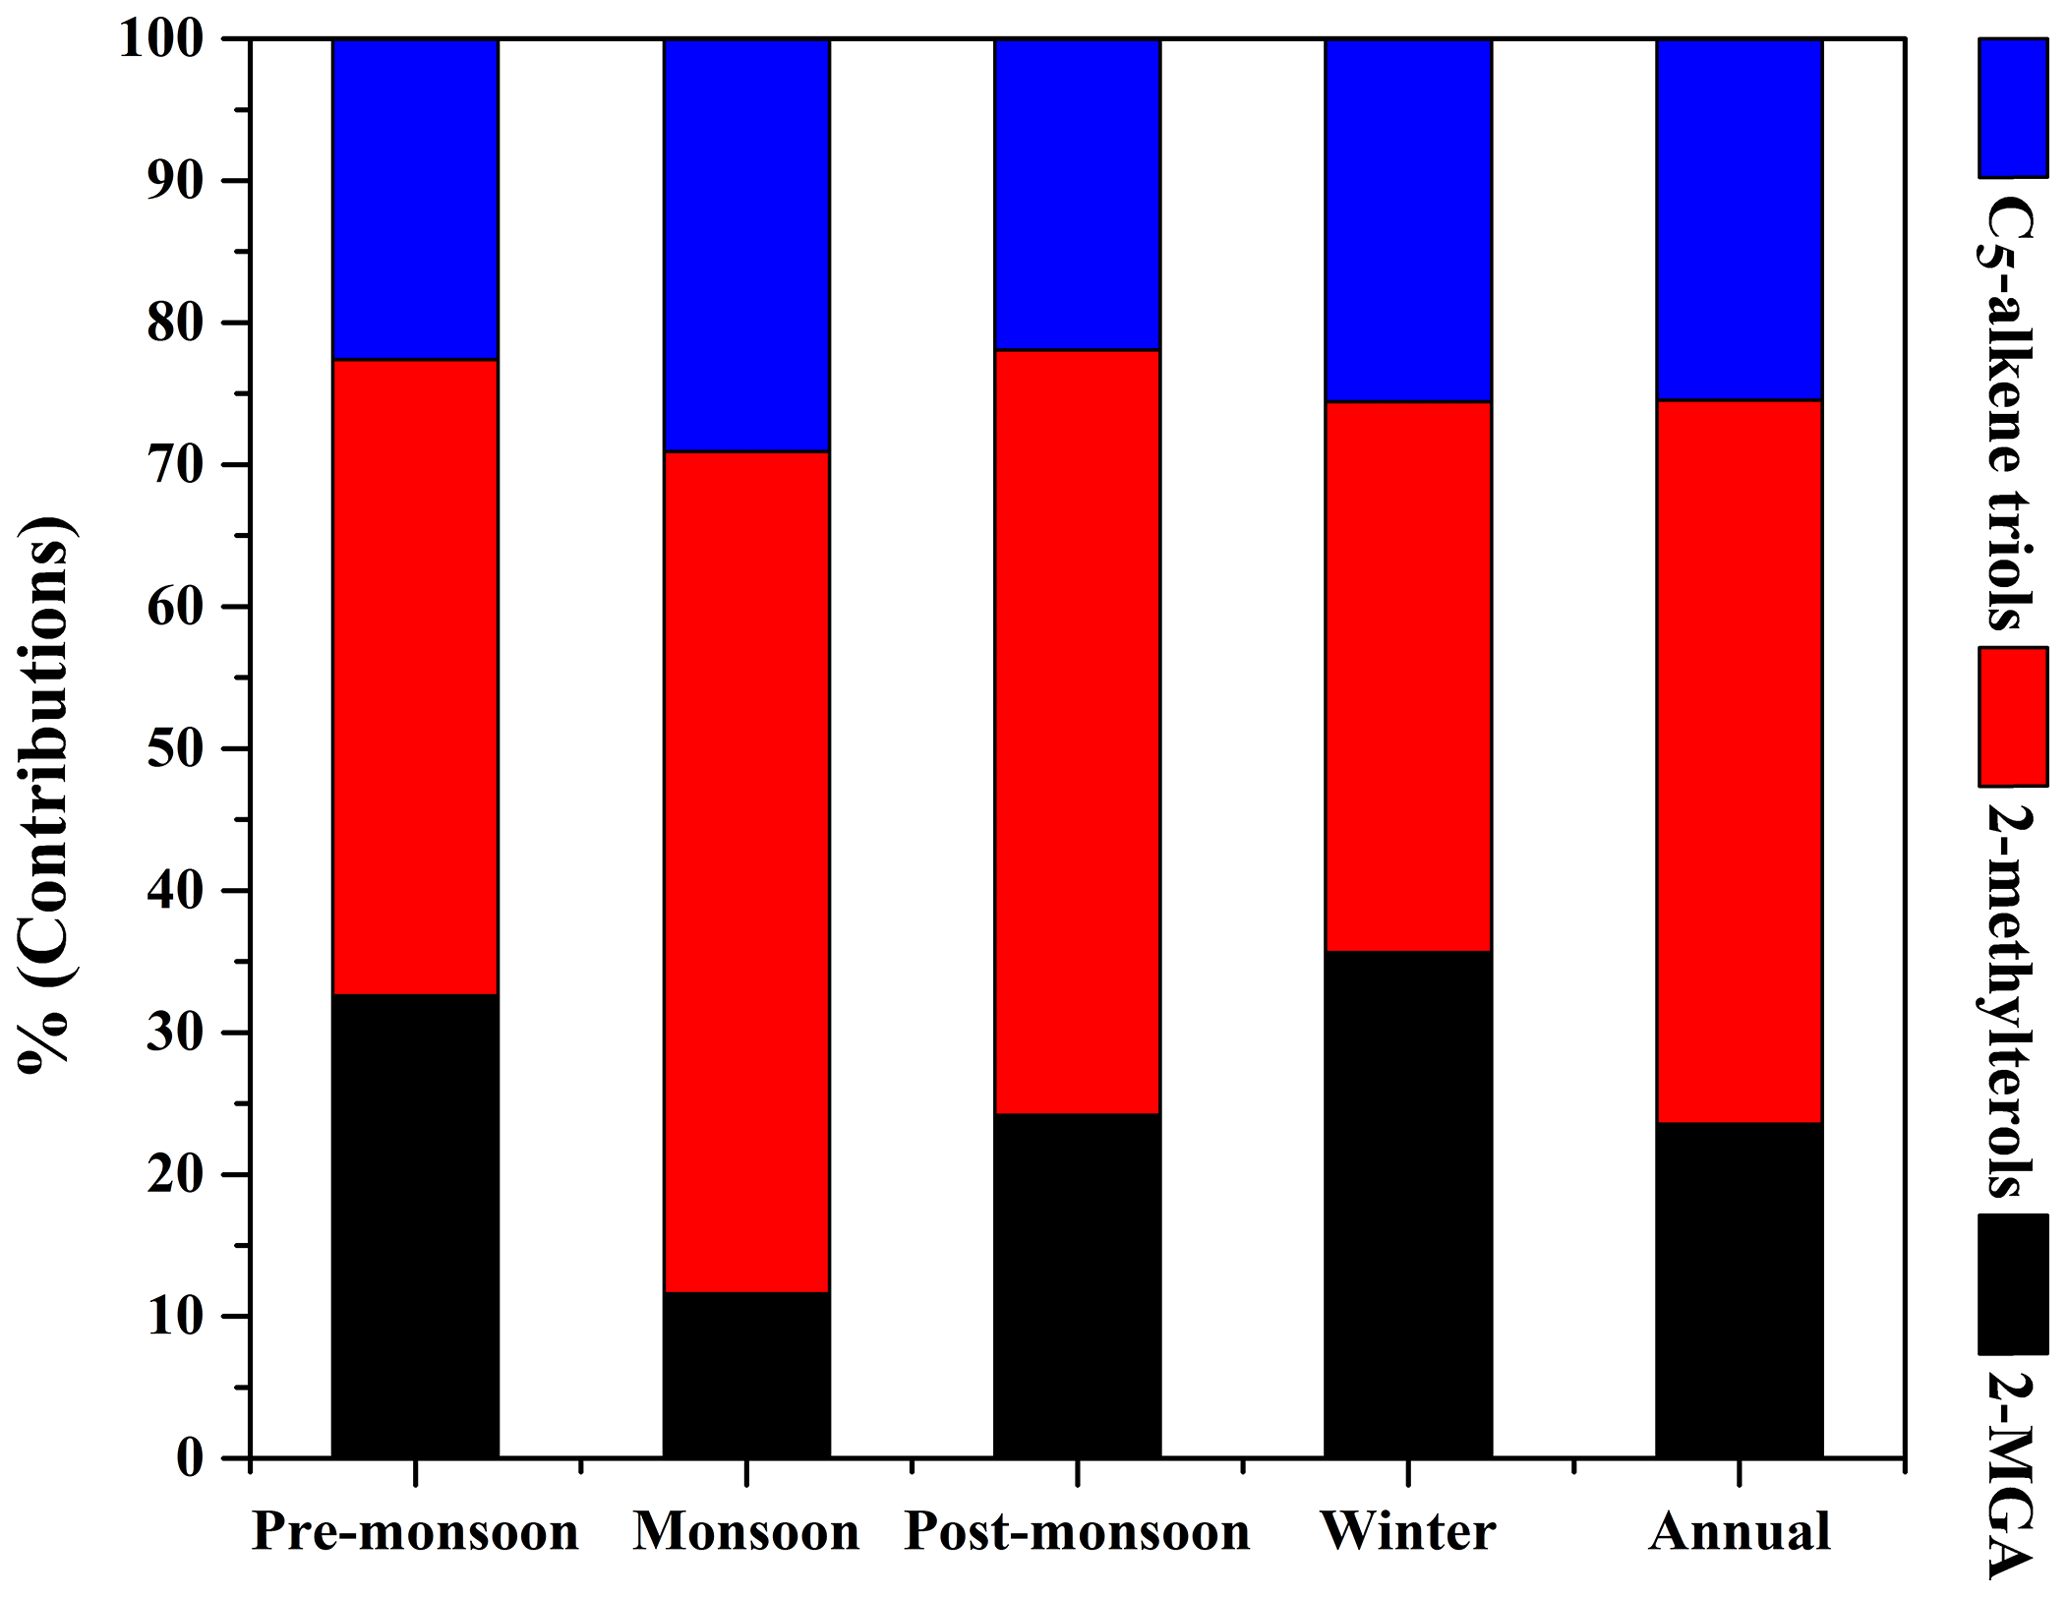
Figure 6The percentage contributions of the isoprene SOA tracers to the total during different seasons in the atmospheric aerosols from Kathmandu.
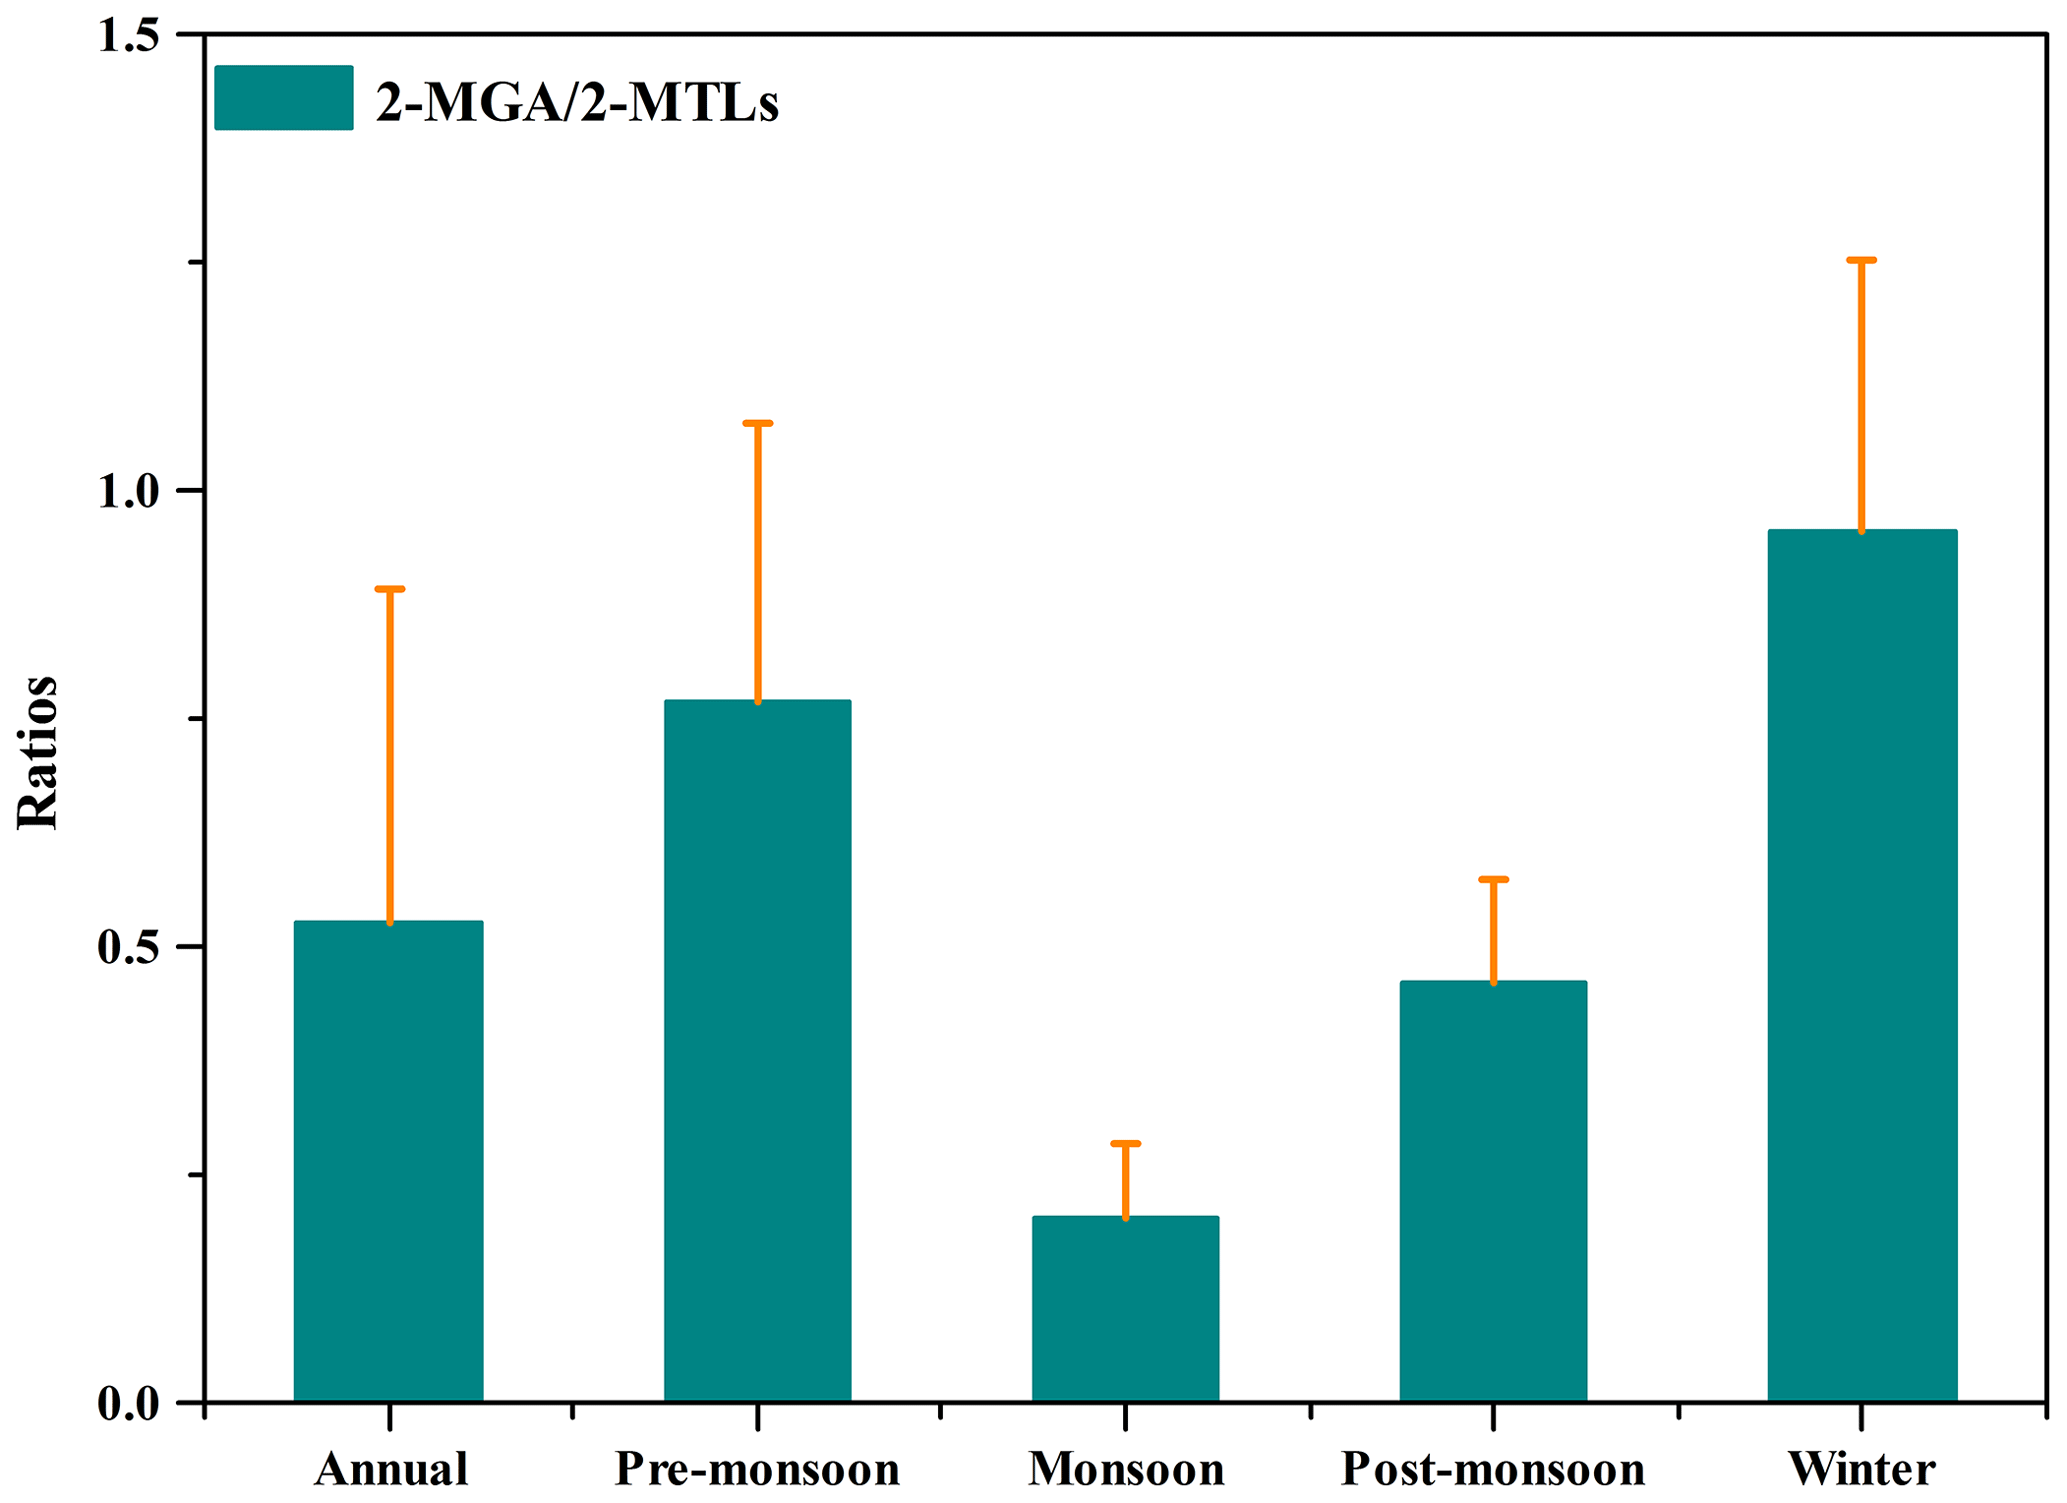
According to the reaction chamber results from Surratt et al. (2010), the formation mechanism of 2-MGA remarkably differs from 2-MTLs. 2-MGA is formed under high-NOx conditions, while 2-MTLs are mainly produced under low-NOx or NOx-free conditions. The formation of 2-MGA can be enhanced under lower RH conditions, while it is the opposite for 2-MTLs (Zhang et al., 2011). During the monsoon season, due to the conducive conditions of high temperature, high RH (>70 %; Fig. S1b), high solar radiation, and fully grown plants, the isoprene emissions were large. In addition, NOx during this season was much lower than other seasons. Therefore, 2-MGA ∕ 2-MTLs ratios exhibited the lowest values (0.20±0.08) in the aerosol samples during this wet season (Fig. 7). In contrast, 2-MGA ∕ 2-MTLs ratios increased up to 0.95 in winter, owing to the lowest temperature and RH of the whole year (Fig. 7) and the higher NOx concentration in the KV (Kondo et al., 2005; Kiros et al., 2016). NOx from anthropogenic sources (industry, transportation, BB in the houses as well as in the field) and meteorological conditions with reduced mixing layer heights in winter would also favor the formation of 2-MGA and subsequently increase the 2-MGA ∕ 2-MTLs ratio.
Positive correlations were observed between 2-MGA, , and (Fig. 8). Budisulistiorini et al. (2017) investigated that the concentrations of B-SOA could significantly increase as the aerosol acidity enhances based on the laboratory simulations and field observations. The significant influence of I-SOA by might be explained by the concerted nucleophilic addition to the key intermediates in the gas phase (e.g., isoprene epoxydiols), which is the rate-determining step in SOA formation (Xu et al., 2015; Li et al., 2018). Li et al. (2018) reported that plays an important part in promoting aqueous-phase oxidation of I-SOA tracers. There may be a similar effect of on the SOA formation that needs further research. Therefore, the increase in and could effectively facilitate the ring-opening reaction of isoprene epoxydiols and the SOA formation. Thus, the higher 2-MGA in the KV may be due to the abundant and during the pre-monsoon season when most of the brick kilns (more than 100) are operational. Our finding demonstrated that the anthropogenic pollutants (e.g., SO2, NOx, etc.) can be conducive to accelerating the oxidation of B-VOCs and enhancing the ambient concentrations of B-SOA.
3.6.2 Terpene SOA tracers
Besides isoprene tracers, we also measured four monoterpene oxidation products (M-SOA tracers), including PNA, PA, 3-HGA, and MBTCA (Claeys et al., 2007). They are produced through the photooxidation of monoterpenes with ozone and the hydroxyl radical (Iinuma et al., 2004). The annual average concentration of the total M-SOA tracers was 59.3±24.6 ng m−3 (Table 1). The concentration of M-SOA tracers was higher than those investigated in previous studies from an urban site in Kunming (annual average: 44.1±38.8 ng m−3; Ding et al., 2016b), three states (Ohio, Michigan, and California) in North America (summer: 30.4–60.6 ng m−3; Stone et al., 2009), and a forest site in Hyytiälä, Europe (summer: 15.1–33.3 ng m−3; Kourtchev et al., 2005).
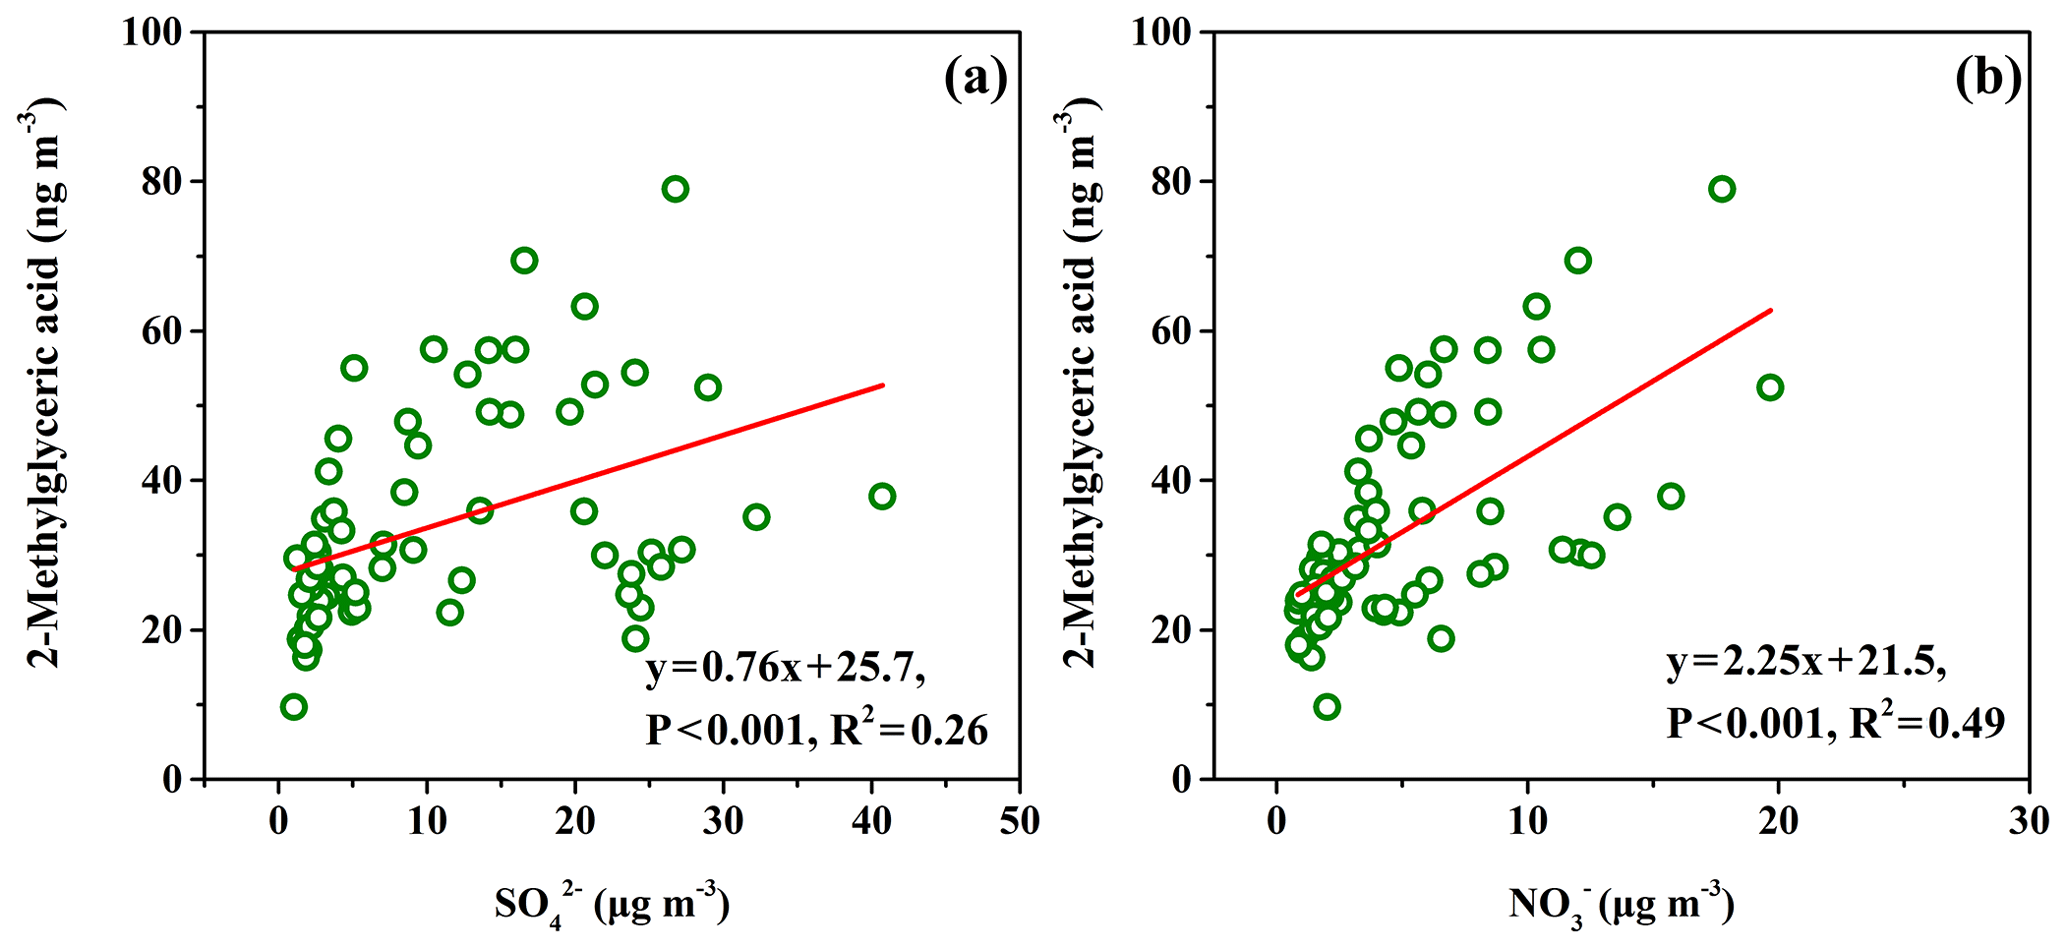
Figure 8Concentration correlation between (a) 2-methylglyceric acid (2-MGA) and and (b) 2-methylglyceric acid and in the aerosols from Bode, Kathmandu.
For the seasonal variation, relatively high concentrations of M-SOA tracers occurred during pre-monsoon and post-monsoon seasons (Fig. 5e–i). Interestingly, there is intensive BB in KV twice a year (forest fires and crop-residue fires during April to May, and crop-residue fires during October to November) discussed in Sect. 3.3.1 and 3.4, which may have been associated with high concentrations of M-SOA tracers. During the fires, substantial amounts of aerosols and VOCs including isoprene and monoterpenes would generate, which can enhance the levels of B-SOA tracers (Jathar et al., 2014; Ding et al., 2013). Good correlations were obtained between the BB tracer, i.e. levoglucosan and the higher generation oxidation products (e.g., 3-HGA and MBTCA, R2=0.32 and R2=0.53, respectively) in the Bode aerosols (Fig. S6). The forests in the KV mainly consist of broad-leaved evergreen mixed forest, oak-laurel forest, and oak forest as well as the conifer tree species (Department of Plant Resources, 2015; Sarkar et al., 2016). Monoterpenes were mainly released from coniferous trees (Kang et al., 2018). Therefore, it is suggested that the atmospheric aerosol compositions especially of SOA tracers over the KV maybe significantly affected by BB activities.
Sesquiterpenes (e.g., β-caryophyllene) are also among the B-SOA precursors emitted from trees, which have been observed in the troposphere in a lot of studies. β-CA is the tracer of β-caryophyllene SOA and its concentration in the Bode aerosols was 6.31±3.86 ng m−3 with a range of 1.53 to 18.5 ng m−3. It shared a similar seasonal variation with M-SOA tracers and positively correlated with them, indicating the possible common emission pattern.
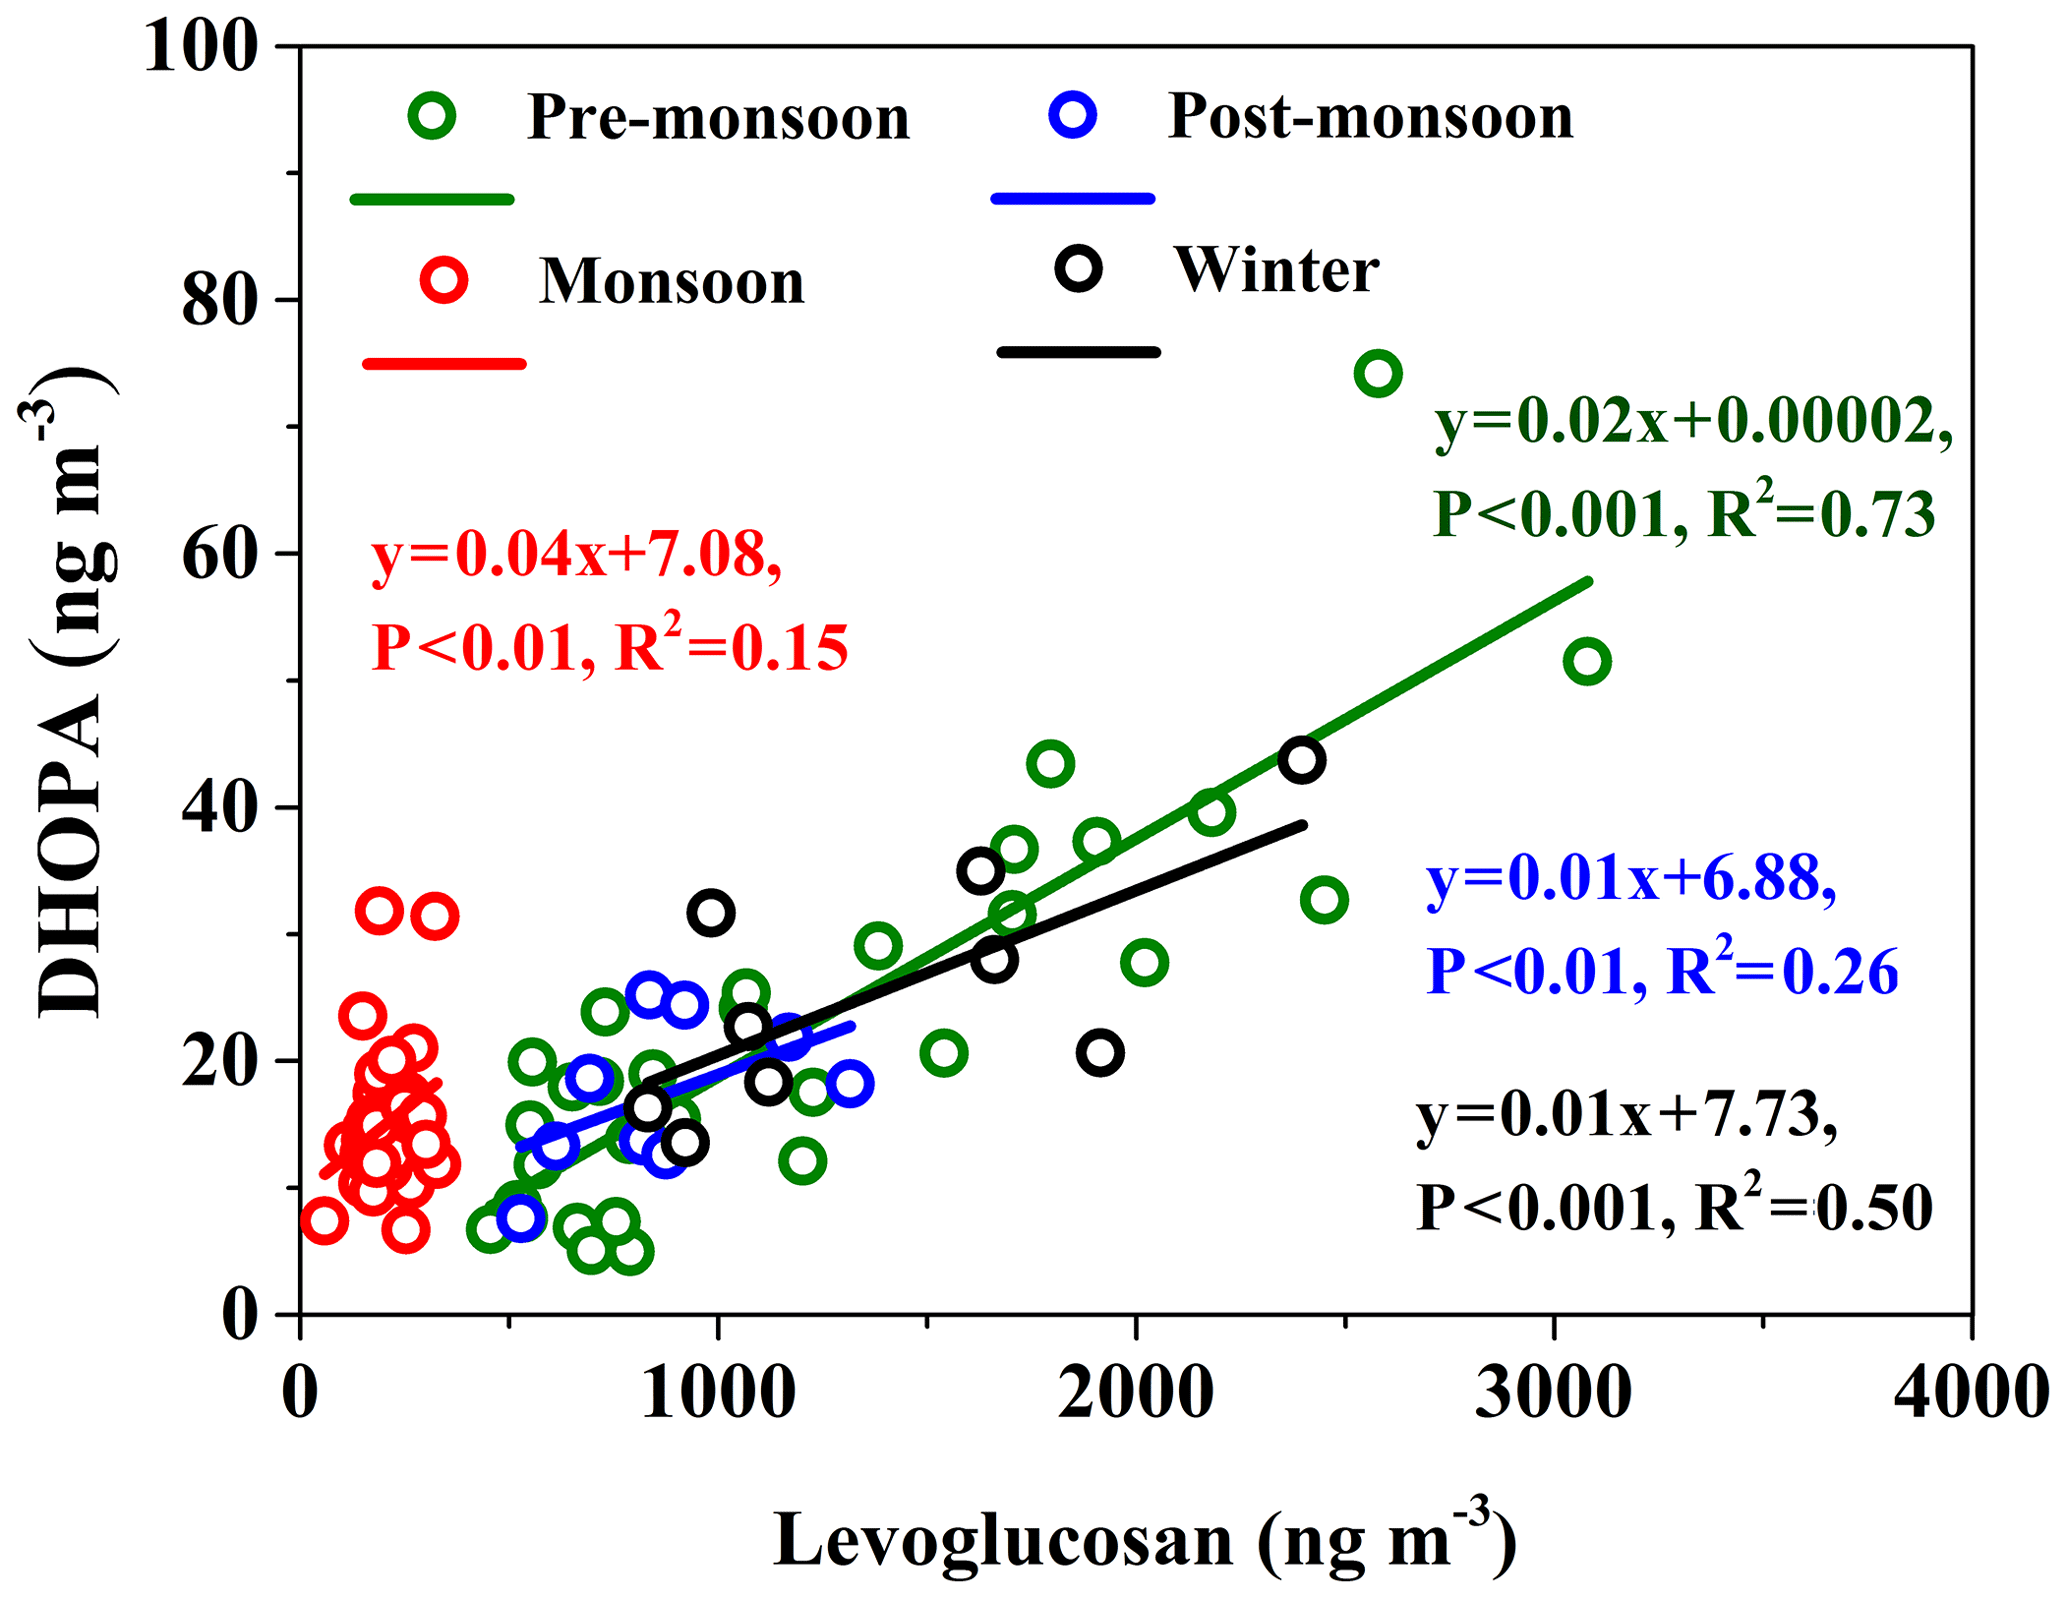
Figure 9Correlation between 2,3-dihydroxy-4-oxopentanoic acid (DHOPA) and levoglucosan in Bode aerosols during the sampling period (April 2013–April 2014).
3.6.3 Aromatic SOA tracer
Anthropogenic SOA is also an important OC source. DHOPA is a tracer of anthropogenic SOA from aromatics. In this study, DHOPA showed higher levels in winter and pre-monsoon periods and lower in the monsoon season (Fig. 5l). Though the major emissions of aromatics come from fossil sources, BB is also considered to be a possible source in some sites of the world (Shen et al., 2015). There was a good correlation between DHOPA and levoglucosan (Fig. 9), especially during the pre-monsoon period with an R2 value of 0.73. This indicated BB emissions are also a significant source of DHOPA in Bode.
3.7 Estimation of the contributions of different sources to OC
As discussed above, both the primary and secondary sources have an influence on OC in the atmospheric aerosols of the KV. In this section, we will apply the tracer-based methods to evaluate the different sources' contributions to OC. It should be noted here that tracer methods can provide a reasonable estimation, but uncertainties are introduced considering the site differences and the lack of representative source profiles for the given study location. The contribution evaluated from each source to OC in the current study is still inferable.
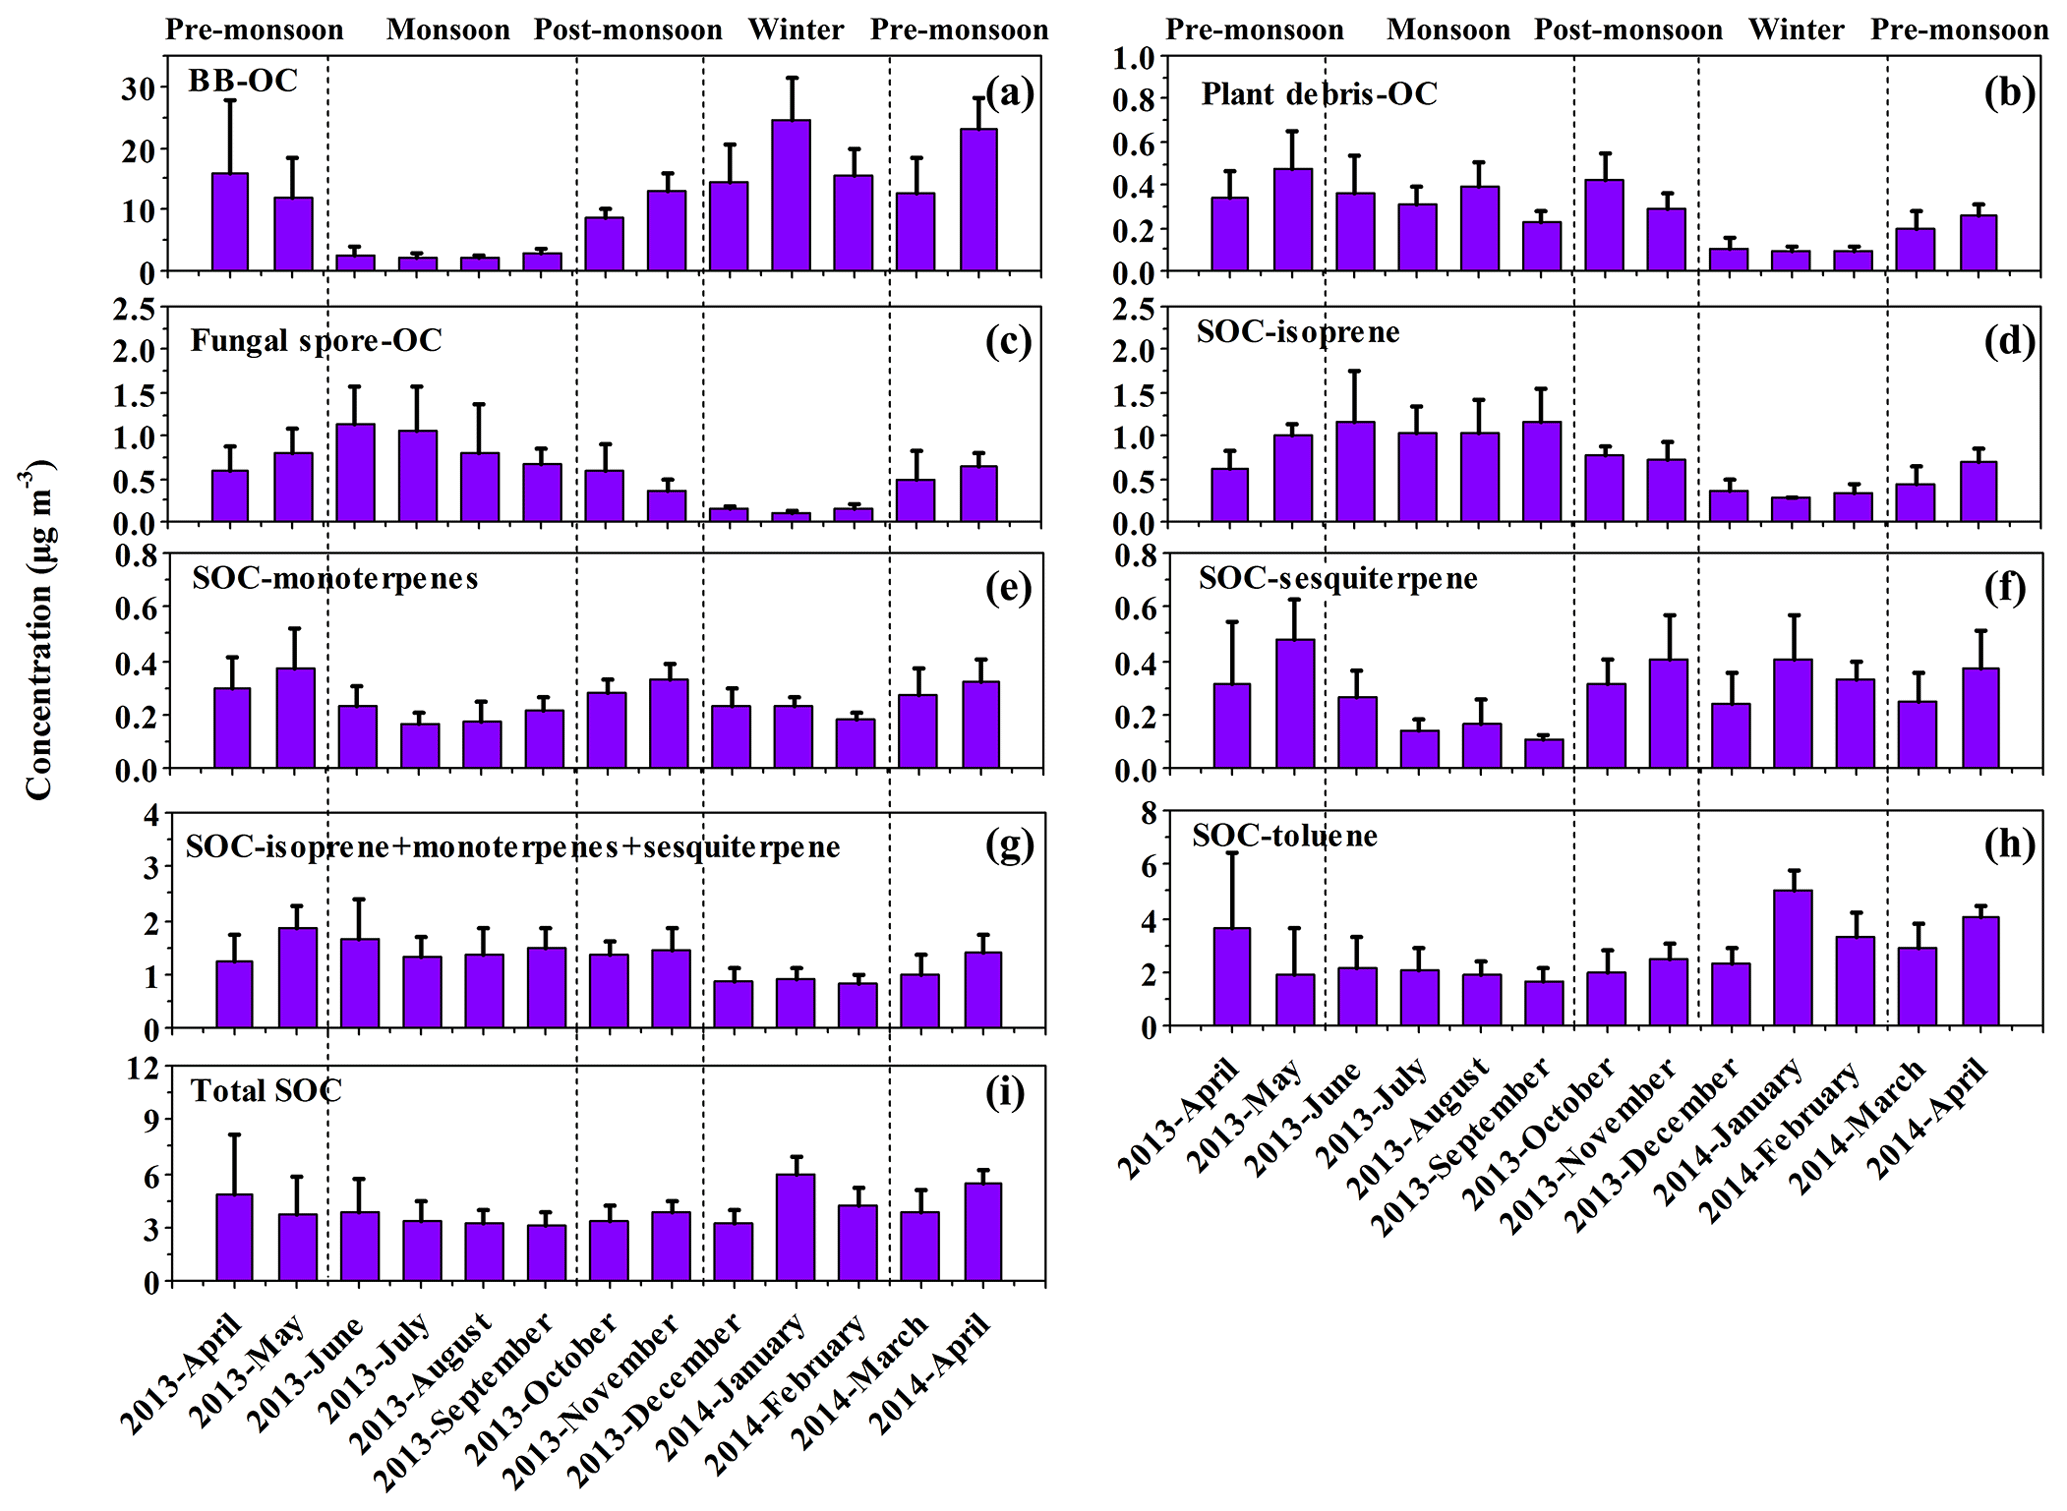
Figure 10Monthly concentration variations in (a) BB-OC, (b) plant-debris-OC, (c) fungal-spore-OC, (d) SOC-isoprene (I-SOC), (e) SOC-monoterpenes (M-SOC), (f) SOC-sesquiterpene (SOC-C), (g) SOC-isoprene + monoterpenes + sesquiterpene (B-SOC), (h) SOC-toluene (A-SOC), and (i) total SOC that were estimated using a tracer-based method at the Bode site, Kathmandu Valley, during April 2013–April 2014.
3.7.1 BB-derived OC
Levoglucosan to OC ratios (Lev∕OC) detected in source samples have been used in a wide range for quantitative estimations of the BB contribution to OC (Stone et al., 2012; Zhang et al., 2015; Wan et al., 2017), although the ratios vary among different types of biomass burnt and combustion conditions (Bhattarai et al., 2019). An average of 8.14 % (8.0 %–8.2 %) for Lev∕OC from the burning sites of biofuel, savanna, crop residues, tropical forests, and so on was documented in Andreae and Merlet (2001). Zhang et al. (2007) obtained Lev∕OC ratios ranging from 5.4 % to 11.8 % (an average of 8.27 %) from the aerosols of cereal straw (wheat, corn, and rice) combustion. Sheesley et al. (2003) reported an average of 7.94 % of levoglucosan from the combustion of biomass (including rice straw, biomass briquettes, dried cow-dung patties, etc.) indigenous to South Asia. However, the ratio acquired from the hardwood burning in fireplaces and stoves in the US was 14 %, which was applied at the background sites in Europe (Fine et al., 2004). Stone et al. (2012) used Lev∕OC ratio of 12 %±0.2 % during the burning of acacia wood at Godavari in the KV for the CMB (chemical mass balance) profile source apportionment. The mean value of Lev∕OC for BB from the main biomass types was 10.1 %. In this study, we choose the mostly used values of 8.14 % for BB estimation (Graham et al., 2002; Fu et al., 2014; Ho et al., 2014; Sang et al., 2011; Zhu et al., 2016; Mkoma et al., 2013). In addition, the uncertainties of using different ratios were also calculated (see Table S3). The diagnostic ratios among molecular tracers and OC (e.g., Lev∕OC) from direct emissions are critical for more precise results. It is meaningful to understand the emission characteristics for individual OC emission categories, as well as in different locations, especially in South Asia.
Figures 10 and 11 present the monthly concentration variations in BB-OC and contribution of BB-OC to OC, respectively. Current estimations show that BB-OC contributed 24.9 %±10.4 % (varying from 6.32 % to 61.5 %) to OC throughout the year in Bode aerosols (Fig. 11a). This was higher than the study in Lumbini in Nepal (19.8 %±19.4 %; Wan et al., 2017), and nearly twice that of the BB-OC contribution to OC reported in Hong Kong (6.5 %–11 %; Sang et al., 2011) and the Pearl River Delta in China (13.1 %; Ho et al., 2014). Moreover, the contribution of BB-OC to OC in the current study was maximized in the post-monsoon season (36.3 %±10.4 %), higher than that in the pre-monsoon (28.5 %±10.3 %) and winter (27.9 %±8.63 %) periods. These results indicate that BB severely affect the air quality in the KV, especially during the post-monsoon period. Similarly, Stone et al. (2010) reported 21 %±2 % of OC in PM2.5 from the Godavari rural site in the outskirts of the KV during 2006, and this was also attributed to the primary BB sources.
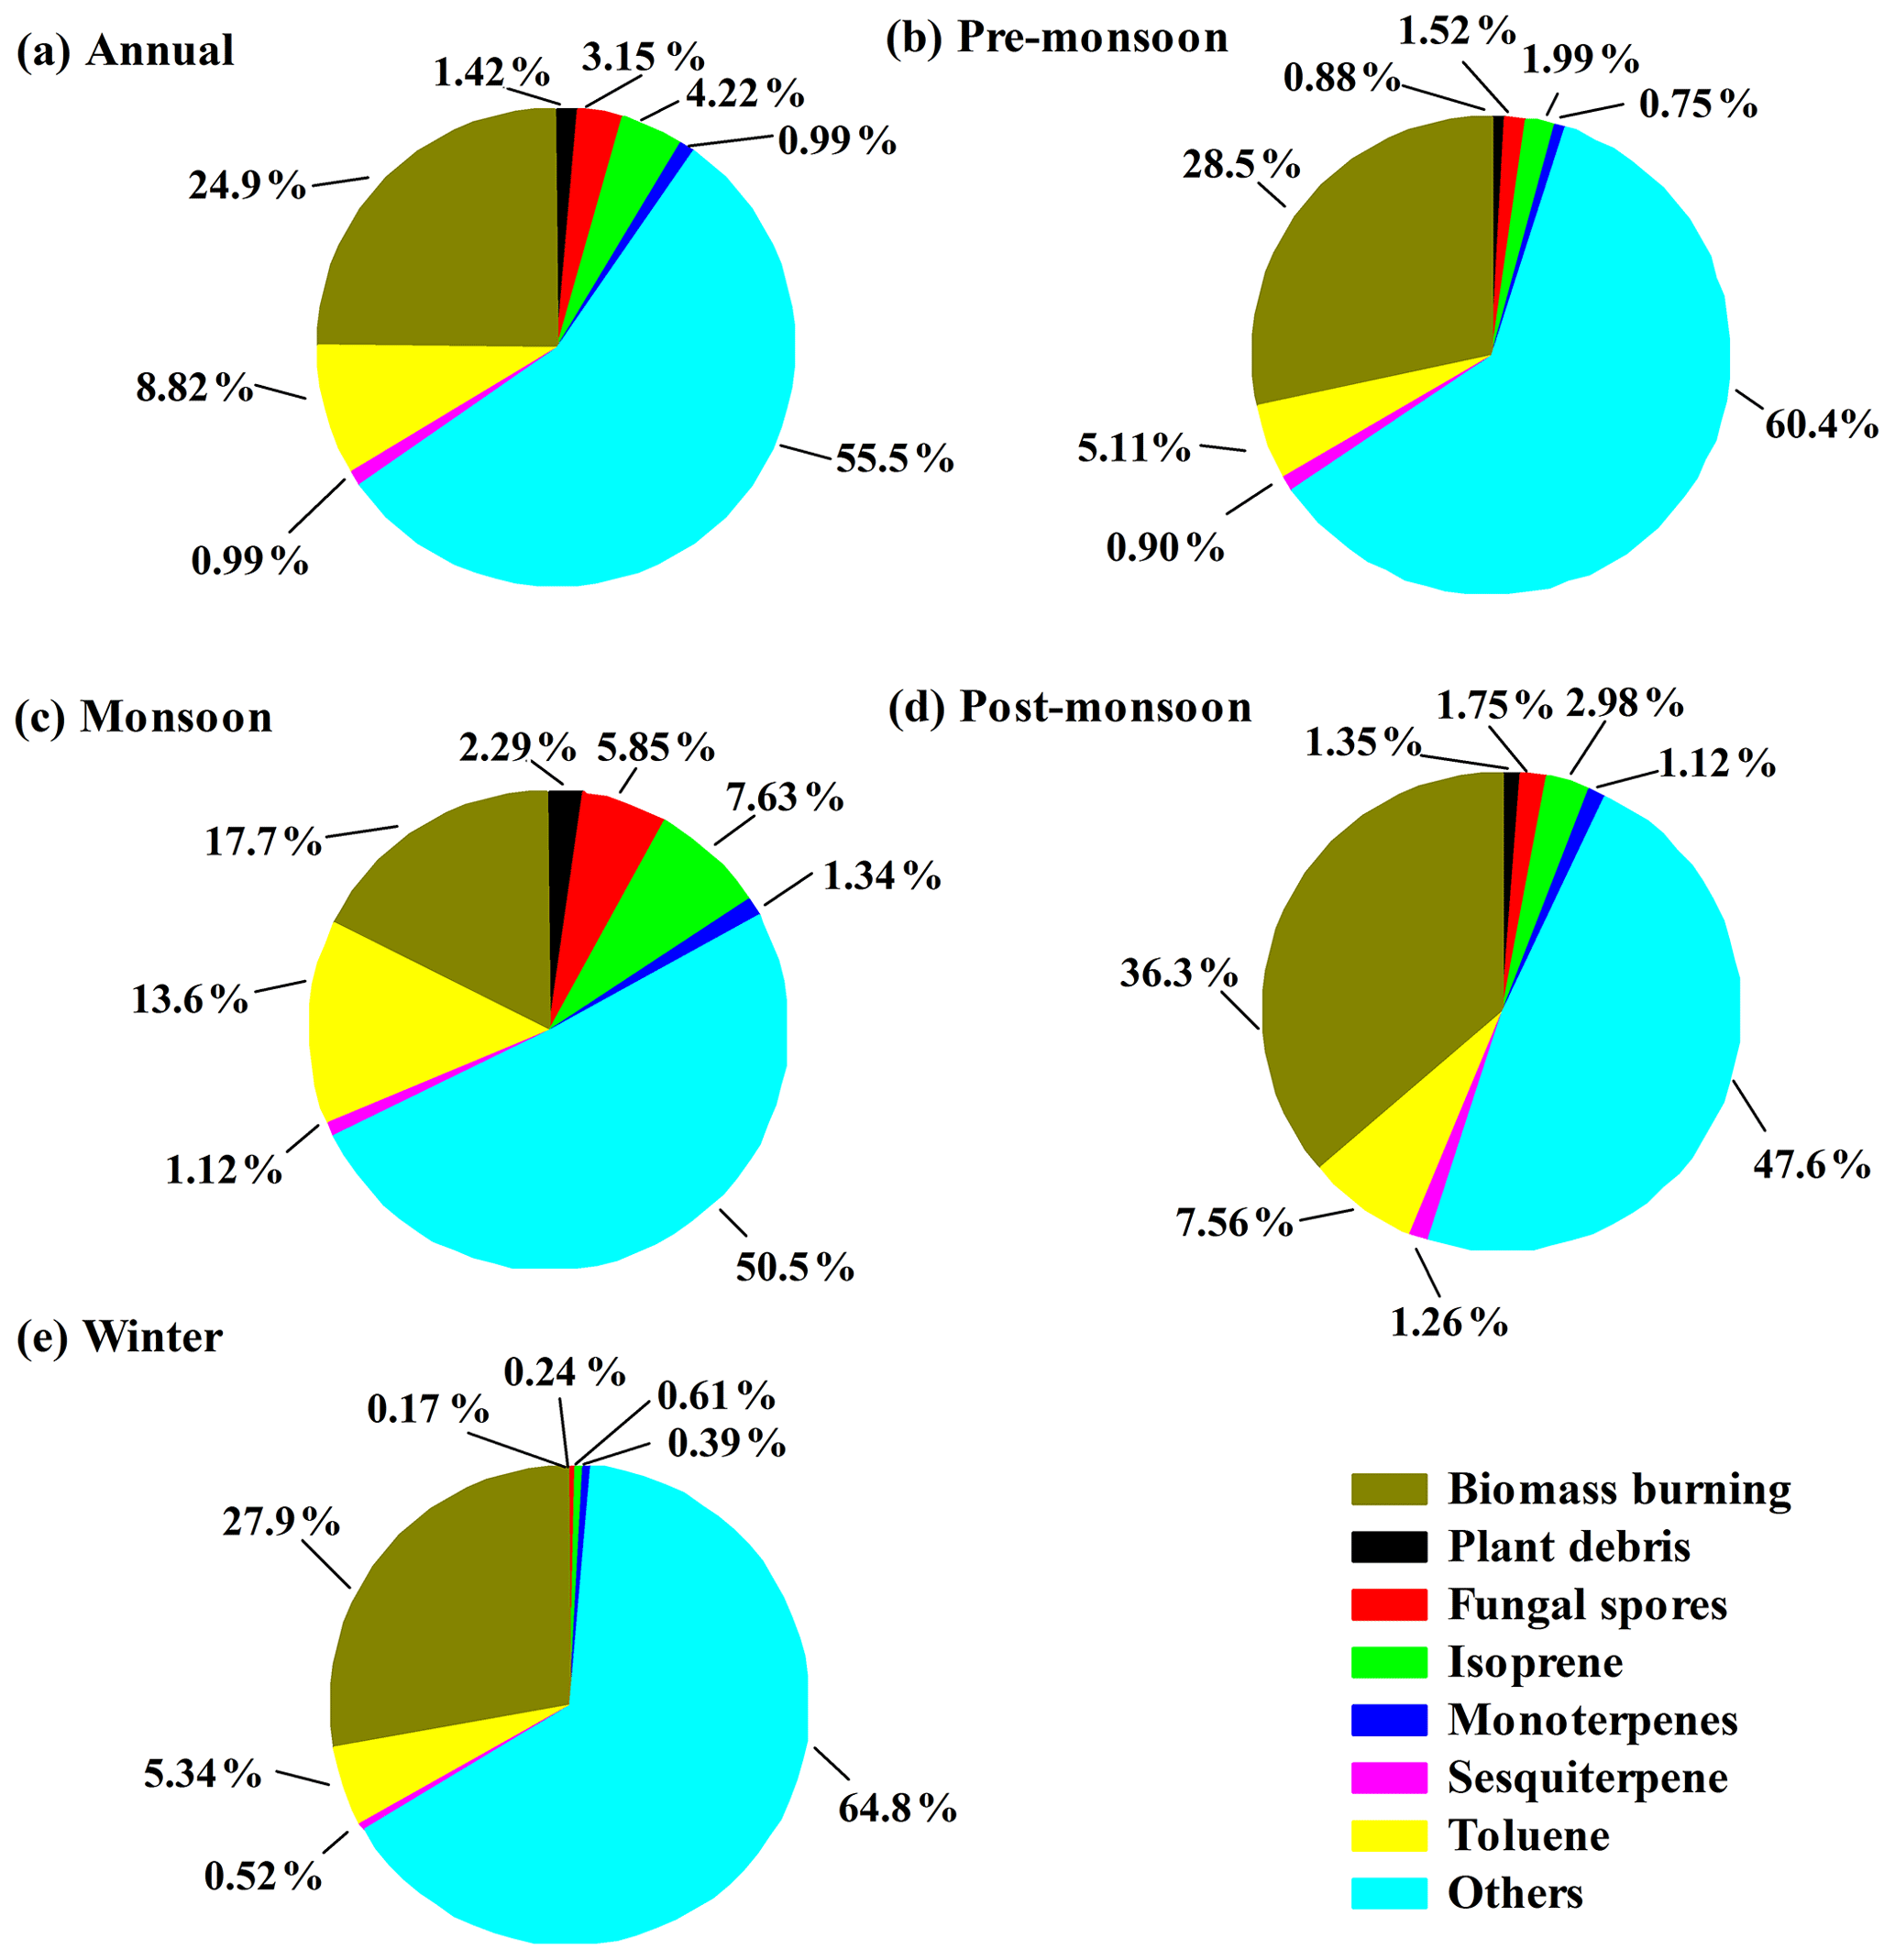
Figure 11Pie-charts showing contributions from different sources to OC based on the estimation of tracer-method in Bode, Kathmandu Valley: (a) annual, (b) pre-monsoon, (c) monsoon, (d) post-monsoon, and (e) winter.
3.7.2 Plant-debris OC and fungal-spore-derived OC
PBAPs have been identified as an important source using tracers (Sect. 3.3.2). They are likely to have a big contribution to the aerosols in Bode. In order to reveal how much they are contributing to organic aerosols, “total” plant debris was calculated based on glucose following the equations below (Zhu et al., 2016; Puxbaum and Tenze-Kunit, 2003):
where GF (0.90) is the glucose ∕ cellulose weight conversion factor and SY (0.717) is the saccharification yield.
The OC fraction derived from fungal spores was estimated using mannitol levels according to the studies by Bauer et al. (2008) and Holden et al. (2011), i.e., there was 1.7 pg mannitol and 13 pg OC per spore.
As shown in Fig. 11a, fungal-spore-derived OC and plant-debris OC annually contribute to 3.15 %±2.86 % and 1.42 %±1.03 % of OC, respectively. The contributions were both higher in the monsoon season, with 5.85 %±2.50 % for fungal-spore-derived OC and 2.29 %±0.79 % for plant-debris-OC to OC, respectively (Fig. 11c). During winter, the contributions were lowest due to the inactive vegetation. There are also some similar results from the literature. For example, Zhu et al. (2016) reported the plant debris contribution to OC was 5.6 % and 4.6 % during nighttime and daytime, respectively, from aerosols in a mid-latitudinal forest. Szidat et al. (2006) reported the plant debris contributed to 3.2 % of OC during summer in urban aerosols collected in Zurich, Switzerland. The contributions of fungal aerosol to OC was 8 % in the aerosols from a Brazilian urban site (Emygdio et al., 2018). Liang et al. (2017) reported fungal aerosol contributions of 3.5 %±3.7 % in aerosols from a rural site in Beijing, China. In marine aerosols, the fungal spores were documented to be the major contributor to total OC with 3.1 % (0.03 %–19.8 %) over the East China Sea (Kang et al., 2018). All of the above strengthened the importance of plant debris and fungal spores to the aerosol burden in the atmosphere.
3.7.3 Biogenic SOC and anthropogenic toluene SOC
Biogenic secondary organic carbon (B-SOC) and anthropogenic aromatic SOC (A-SOC) from the oxidation of isoprene, monoterpenes, sesquiterpene, and toluene were assessed using the tracer-based method proposed by Kleindienst et al. (2007). This method has been applied successfully in numerous aerosol studies (Shen et al., 2015; Ding et al., 2016a; Kang et al., 2018). The mass fraction of tracer compounds in SOCs (FSOC) for an individual precursor was calculated based on smog chamber simulations. The calculation formula was the following:
where [tri] is the concentration of tracer i and [SOC] is the concentration of SOC. The conversion factors of FSOC were 0.155±0.039, .231±0.111, 0.0230±0.0046, and 0.0079±0.0026 µg µg C−1 for isoprene, monoterpenes, sesquiterpene, and toluene, respectively (Kleindienst et al., 2007).
The total calculated concentrations of B-SOC varied from 0.41 to 2.77 µg m−3 with an annual mean concentration of 1.36±0.49 µg m−3, a higher concentration of 1.43±0.48 µg m−3 in monsoon and lower concentration of 0.86±0.20 µg m−3 in winter (Fig. 10g). The B-SOC ∕ OC ratio showed a higher average percentage of 10.1 %±3.34 % in the monsoon season (Fig. 11c), indicating B-SOC was an important OC source in Bode during this period. During post-monsoon, the B-SOC ∕ OC ratio declined to 5.36 % (Fig. 11d). The B-SOC ∕ OC ratio showed the lowest value of 1.52 %±0.70 % in winter (Fig. 11e), indicating that B-SOC had minor contributions to elevated OC in winter. The annual average concentration of A-SOC was 2.45±1.45 µg m−3, which is higher than the B-SOC. The highest A-SOC concentration was obtained in winter (3.27±1.25 µg m−3; Fig. 10h). A-SOC was the second most important contributor to OC after BB-OC. It is not only derived from increased fossil fuel combustion and the subsequent oxidation, but also from BB emissions.
In total, SOC (including B-SOC and A-SOC) reconstructed using the formula above in this section was 3.81±1.63 µg m−3, accounting for 15.0 %±8.99 % of OC.
3.7.4 Possible sources of the unidentified OC
On the whole, BB contributed one-fourth (24.9 %±10.4 %) of the OC in Bode, followed by A-SOC (8.82 %±5.55 %), B-SOC (6.19 %±4.49 %), fungal spores (3.15 %±2.86 %), and plant debris (1.42 %±1.03 %) (Fig. 11a). Nevertheless, there is still a part of OC (55.5 %) that we were not able to be attributed to any specific source based on the tracers analyzed in the current study. There are some uncertainties caused by the organic tracer analyses (estimation of measurement uncertainty was shown in Table S2). Furthermore, fossil fuel combustion and soil dust could also be notable fractions of OC in Bode aerosols. Additionally, low-molecular-weight (LMW) dicarboxylic acids from both primary and secondary sources are also a remarkable contributor to atmospheric organic aerosols (Kawamura and Bikkina, 2016). Humic-like substances and amines can constitute another fraction of OC, but are not well studied (Wu et al., 2018; Laskin et al., 2015). Therefore, the possible contributions of the unidentified OC (55.5 %) from various sectors need further investigation, which is better to comprehensively understand the sources of South Asian aerosols and will be very useful for the targeted pollution control measures in this region.
Field measurements of atmospheric aerosols were conducted in a semi-urban site (Bode) of the KV, Nepal, from April 2013 to April 2014. The organic tracers from primary and secondary organic aerosols (POA and SOA) were determined. A distinctive seasonality was observed for various aerosol species. Higher concentrations of OC, EC, anhydrosugars, phenolic compounds, and resin acid were observed in winter and pre-monsoon seasons, and their concentrations were lower during the wet (monsoon) period. Levoglucosan was the dominant species of the total identified tracers with an average concentration of 788 ng m−3. We observed high abundances of monosaccharides in the pre-monsoon season and of sugar alcohols in the wet period, and lower levels in winter because of the reduced plant activities. I-SOA tracers represented a majority among B-SOA tracers with a maximum in the monsoon season. The seasonal variation in M-SOA tracers was controlled by monoterpene emission and BB. DHOPA exhibited higher concentrations during the winter and pre-monsoon seasons.
The likely OC sources were further evaluated for their contributions to observed total OC using tracer-based methods. BB-OC contributed a major fraction (24.9 %) to OC in Bode, followed by A-SOC (8.8 %), B-SOC (6.2 %), fungal spores (3.2 %) and plant debris (1.4 %). The highest contribution of BB-OC, 36.3 %, occurred during the post-monsoon season. A-SOC, B-SOC, fungal spores, and plant debris all made larger contributions during the monsoon. The higher BB-OC and the A-SOC contributions imply that some BB and anthropogenic components are widespread in the KV and thus represent the main contributors affecting the regional air quality in the KV region.
The present study clearly shows that the chemical constituents and sources of OC strongly vary with seasons, as a result of diverse air pollution sources in the valley across four seasons. The heavy BB and the subsequent oxidant emissions are anticipated to cause larger contributions of B-SOC to OC. Understanding OC's climate impacts is a frontier area of research, because a large uncertainty still exists in the estimation of OC radiative forcing. Our study implies that since BB is a major source of ambient OC, the fraction of OC that absorbs light (referred to as brown carbon) and also acts as cloud condensation nuclei, needs to be further studied in order to better understand radiative effects of OC on regional climate change. The current source contribution estimates from the tracer-based methods do not accurately evaluate the large temporal variations from all kinds of sources. Contributions from other sectors (ca. 55.5 %), including LMW dicarboxylic acids (Kawamura and Sakaguchi, 1999; Kawamura and Bikkina, 2016), need further investigation to better understand the atmospheric aerosols from both urban and rural sources such as the KV and other sites in the Himalayan foothills and the Indo-Gangetic Plain regions. These observations of severe air pollution, particularly the particulate matter pollution, provide valuable support for air pollution control measures, especially in determining which sources and sectors to first focus on in the KV and the surrounding region in order to reduce the air pollution from being severe to become much cleaner in the near future. In addition, the current study based on the molecular level-source apportionment of OC in a heavily polluted region of South Asia provides a much more specific quantification of source estimation for OC, which is different from previous studies based on the bulk carbonaceous aerosol using radiocarbon (14C) measurements, PMF and CMB.
In the Supplement, there are additional improvements for future studies to address. The key recommendations are as follows: (i) many more tracers need to be identified to explain the other sources of organic aerosols in the KV; (ii) the conversion factors of tracers to OC from local emissions are critical for more precise source apportionments and therefore future studies on the emission characteristics will be valuable; (iii) comprehensive methods (e.g., carbon isotope and modeling) need to be integrated for the source apportionment of organic aerosols in the KV; (iv) the influences of BB on the formation of SOAs could be further studied, especially during the heavily polluted dry season, with additional simultaneous measurements of precursors (e.g., NOx and O3), PM2.5, and so on at the same time; (v) to better understand the atmospheric processes of various chemical species, investigations of size-segregated aerosols are especially needed in the heavy polluted KV.
Raw data are archived at the Institute of Tibetan Plateau Research, Chinese Academy of Sciences, and are available on request by contacting the corresponding author.
The supplement related to this article is available online at: https://doi.org/10.5194/acp-19-2725-2019-supplement.
All authors contributed to the final version of this article. XW analyzed the organic molecular tracers and wrote the paper under the supervision of ZC. SK, QZ, and ML organized the campaign. JG, PC, and DR worked with the instruments and collected the aerosol samples. PC and LT analyzed the OC, EC, and major ions data. MR, KK, ML, AP, and DR provided advice and feedback throughout the drafting and submission process.
The authors declare that they have no conflict of interest.
This article is part of the special issue “Atmospheric pollution in the Himalayan foothills: The SusKat-ABC international air pollution measurement campaign”. It is not associated with a conference.
The authors gratefully appreciate Shyam Kumar Newar and Bhogendra Kathayat
for their assistance with the sample collection, the staff at the Bode site
in the Kathmandu Valley, and all individuals and groups who participated in
the SusKat-ABC field campaigns, and the support from Kathmandu Center for
Research and Education, Chinese Academy of Sciences – Tribhuvan University.
We would like to thank senior scientist Karl Epson Yttri from the Norwegian
Institute for Air Research for the helpful suggestions as to how to reply the
comments from the referees. This study was supported by the Strategic
Priority Research Program of the Chinese Academy of Sciences, Pan-Third Pole
Environment Study for a Green Silk Road (Pan-TPE, XDA20040501), the National
Natural Science Foundation of China (41522103, 41807389, 41630754, and 41721091) and China Postdoctoral
Science Foundation (2018M630210). The co-authors from the
Institute for Advanced Sustainability Studies (IASS) gratefully acknowledge funding
from the federal ministry of education and research (BMBF) and the
Brandenburg state ministry of science, research and culture
(MWFK).
Edited by: Kim Oanh Nguyen
Thi
Reviewed by: two anonymous referees
Alam, K., Mukhtar, A., Shahid, I., Blaschke, T., Majid, H., Rahman, S., Khan, R., and Rahman, N.: Source apportionment and characterization of particulate matter (PM10) in urban environment of Lahore, Aerosol Air Qual. Res., 14, 1851–1861, 2014.
Andreae, M. O. and Merlet, P.: Emission of trace gases and aerosols from biomass burning, Global Biogeochem. Cy., 15, 955–966, https://doi.org/10.1029/2000gb001382, 2001.
Bauer, H., Claeys, M., Vermeylen, R., Schueller, E., Weinke, G., Berger, A., and Puxbaum, H.: Arabitol and mannitol as tracers for the quantification of airborne fungal spores, Atmos. Environ., 42, 588–593, https://doi.org/10.1016/j.atmosenv.2007.10.013, 2008.
Bhardwaj, P., Naja, M., Rupakheti, M., Lupascu, A., Mues, A., Panday, A. K., Kumar, R., Mahata, K. S., Lal, S., Chandola, H. C., and Lawrence, M. G.: Variations in surface ozone and carbon monoxide in the Kathmandu Valley and surrounding broader regions during SusKat-ABC field campaign: role of local and regional sources, Atmos. Chem. Phys., 18, 11949–11971, https://doi.org/10.5194/acp-18-11949-2018, 2018.
Bhattarai, H., Saikawa, E., Wan, X., Zhu, H., Ram, K., Gao, S., Kang, S., Zhang, Q., Zhang, Y., Wu, G., Wang, X., Kawamura, K., Fu, P., and Cong, Z.: Levoglucosan as a tracer of biomass burning: Recent progress and perspectives, Atmos. Res., 220, 20–33, 2019.
Bisht, D., Dumka, U., Kaskaoutis, D., Pipal, A., Srivastava, A., Soni, V., Attri, S., Sateesh, M., and Tiwari, S.: Carbonaceous aerosols and pollutants over Delhi urban environment: temporal evolution, source apportionment and radiative forcing, Sci. Total Environ., 521, 431–445, 2015.
Boreddy, S. K. R., Kawamura, K., and Tachibana, E.: Long-term (2001–2013) observations of water-soluble dicarboxylic acids and related compounds over the western North Pacific: trends, seasonality and source apportionment, Sci. Rep., 7, 8518, https://doi.org/10.1038/s41598-017-08745-w, 2017.
Budisulistiorini, S. H., Nenes, A., Carlton, A. G., Surratt, J. D., McNeill, V. F., and Pye, H. O. T.: Simulating Aqueous-Phase Isoprene-Epoxydiol (IEPOX) Secondary Organic Aerosol Production During the 2013 Southern Oxidant and Aerosol Study (SOAS), Environ. Sci. Technol., 51, 5026–5034, https://doi.org/10.1021/acs.est.6b05750, 2017.
Cao, J. J., Lee, S. C., Chow, J. C., Watson, J. G., Ho, K. F., Zhang, R. J., Jin, Z. D., Shen, Z. X., Chen, G. C., Kang, Y. M., Zou, S. C., Zhang, L. Z., Qi, S. H., Dai, M. H., Cheng, Y., and Hu, K.: Spatial and seasonal distributions of carbonaceous aerosols over China, J. Geophys. Res.-Atmos., 112, D22S11, https://doi.org/10.1029/2006jd008205, 2007.
Chen, P., Kang, S., Li, C., Rupakheti, M., Yan, F., Li, Q., Ji, Z., Zhang, Q., Luo, W., and Sillanpaa, M.: Characteristics and sources of polycyclic aromatic hydrocarbons in atmospheric aerosols in the Kathmandu Valley, Nepal, Sci. Total Environ., 538, 86–92, https://doi.org/10.1016/j.scitotenv.2015.08.006, 2015.
Claeys, M., Graham, B., Vas, G., Wang, W., Vermeylen, R., Pashynska, V., Cafmeyer, J., Guyon, P., Andreae, M. O., Artaxo, P., and Maenhaut, W.: Formation of secondary organic aerosols through photooxidation of isoprene, Science, 303, 1173–1176, https://doi.org/10.1126/science.1092805, 2004.
Claeys, M., Szmigielski, R., Kourtchev, I., Van der Veken, P., Vermeylen, R., Maenhaut, W., Jaoui, M., Kleindienst, T. E., Lewandowski, M., Offenberg, J. H., and Edney, E. O.: Hydroxydicarboxylic Acids:? Markers for Secondary Organic Aerosol from the Photooxidation of α-Pinene, Environ. Sci. Technol., 41, 1628–1634, https://doi.org/10.1021/es0620181, 2007.
Cowie, G. L. and Hedges, J. I.: Carbohydrate sources in a coastal marine environment, Geochim. Cosmochim. Ac., 48, 2075–2087, https://doi.org/10.1016/0016-7037(84)90388-0, 1984.
Department of Plant Resources: Plant Resources, Bulletin of Department of Plant Resources, Nepal 37, Ministry of Forests and Soil Conservation, Kathmandu, 1–122, 2015.
Department of Transport Management (DoTM): Annual report of Ministry of Labor and Transport Management, Government of Nepal, 2015.
Deshmukh, D. K., Kawamura, K., and Deb, M. K.: Dicarboxylic acids, ω-oxocarboxylic acids, α-dicarbonyls, WSOC, OC, EC, and inorganic ions in wintertime size-segregated aerosols from central India: Sources and formation processes, Chemosphere, 161, 27–42, 2016.
Ding, X., Wang, X., Xie, Z., Zhang, Z., and Sun, L.: Impacts of Siberian Biomass Burning on Organic Aerosols over the North Pacific Ocean and the Arctic: Primary and Secondary Organic Tracers, Environ. Sci. Technol., 47, 3149–3157, https://doi.org/10.1021/es3037093, 2013.
Ding, X., He, Q.-F., Shen, R.-Q., Yu, Q.-Q., Zhang, Y.-Q., Xin, J.-Y., Wen, T.-X., and Wang, X.-M.: Spatial and seasonal variations of isoprene secondary organic aerosol in China: Significant impact of biomass burning during winter, Sci. Rep., 6, 20411, https://doi.org/10.1038/srep20411, 2016a.
Ding, X., Zhang, Y.-Q., He, Q.-F., Yu, Q.-Q., Shen, R.-Q., Zhang, Y., Zhang, Z., Lyu, S.-J., Hu, Q.-H., Wang, Y.-S., Li, L.-F., Song, W., and Wang, X.-M.: Spatial and seasonal variations of secondary organic aerosol from terpenoids over China, J. Geophys. Res.-Atmos., 121, 14661–14678, https://doi.org/10.1002/2016jd025467, 2016b.
Emygdio, A. P. M., Andrade, M. d. F., Gonçalves, F. L. T., Engling, G., Zanetti, R. H. D. S., and Kumar, P.: Biomarkers as indicators of fungal biomass in the atmosphere of São Paulo, Brazil, Sci. Total Environ., 612, 809–821, 2018.
Fine, P. M., Cass, G. R., and Simoneit, B. R. T.: Chemical characterization of fine particle emissions from the wood stove combustion of prevalent United States tree species, Environ. Eng. Sci., 21, 705–721, https://doi.org/10.1089/ees.2004.21.705, 2004.
Fu, P., Kawamura, K., Chen, J., and Miyazaki, Y.: Secondary production of organic aerosols from biogenic VOCs over Mt. Fuji, Japan, Environ. Sci. Technol., 48, 8491–8497, 2014.
Fu, P. Q., Kawamura, K., Pavuluri, C. M., Swaminathan, T., and Chen, J.: Molecular characterization of urban organic aerosol in tropical India: contributions of primary emissions and secondary photooxidation, Atmos. Chem. Phys., 10, 2663–2689, https://doi.org/10.5194/acp-10-2663-2010, 2010.
Fujii, Y., Kawamoto, H., Tohno, S., Oda, M., Iriana, W., and Lestari, P.: Characteristics of carbonaceous aerosols emitted from peatland fire in Riau, Sumatra, Indonesia (2): Identification of organic compounds, Atmos. Environ., 110, 1–7, 2015.
George, S. K., Nair, P. R., Parameswaran, K., Jacob, S., and Abraham, A.: Seasonal trends in chemical composition of aerosols at a tropical coastal site of India, J. Geophys. Res.-Atmos., 113, D16209, https://doi.org/10.1029/2007jd009507, 2008.
Giri, D., Murthy, V. K., Adhikary, P. R., and Khanal, S. N.: Cluster analysis applied PM10 concentration data for determination of sources and spatial patterns in ambient air-quality of Khatmandu Valley, Curr. Sci. India, 93, 684–688, 2007.
Graham, B., Mayol-Bracero, O. L., Guyon, P., Roberts, G. C., Decesari, S., Facchini, M. C., Artaxo, P., Maenhaut, W., Koll, P., and Andreae, M. O.: Water-soluble organic compounds in biomass burning aerosols over Amazonia – 1. Characterization by NMR and GC-MS, J. Geophys. Res.-Atmos., 107, 8047, https://doi.org/10.1029/2001jd000336, 2002.
Guenther, A., Hewitt, C. N., Erickson, D., Fall, R., Geron, C., Graedel, T., Harley, P., Klinger, L., Lerdau, M., McKay, W. A., Pierce, T., Scholes, B., Steinbrecher, R., Tallamraju, R., Taylor, J., and Zimmerman, P.: A global model of natural volatile organic compound emissions, J. Geophys. Res.-Atmos., 100, 8873–8892, https://doi.org/10.1029/94jd02950, 1995.
Guenther, A., Karl, T., Harley, P., Wiedinmyer, C., Palmer, P. I., and Geron, C.: Estimates of global terrestrial isoprene emissions using MEGAN (Model of Emissions of Gases and Aerosols from Nature), Atmos. Chem. Phys., 6, 3181–3210, https://doi.org/10.5194/acp-6-3181-2006, 2006.
Gupta, A. K., Karar, K., and Srivastava, A.: Chemical mass balance source apportionment of PM10 and TSP in residential and industrial sites of an urban region of Kolkata, India, J. Hazard. Mater., 142, 279–287, https://doi.org/10.1016/j.jhazmat.2006.08.013, 2007.
Ho, K. F., Engling, G., Ho, S. S. H., Huang, R., Lai, S., Cao, J., and Lee, S. C.: Seasonal variations of anhydrosugars in PM2.5 in the Pearl River Delta Region, China, Tellus B, 66, 22577, https://doi.org/10.3402/tellusb.v66.22577, 2014.
Holden, A. S., Sullivan, A. P., Munchak, L. A., Kreidenweis, S. M., Schichtel, B. A., Malm, W. C., and Collett Jr., J. L.: Determining contributions of biomass burning and other sources to fine particle contemporary carbon in the western United States, Atmos. Environ., 45, 1986–1993, https://doi.org/10.1016/j.atmosenv.2011.01.021, 2011.
Hu, Q.-H., Xie, Z.-Q., Wang, X.-M., Kang, H., He, Q.-F., and Zhang, P.: Secondary organic aerosols over oceans via oxidation of isoprene and monoterpenes from Arctic to Antarctic, Sci. Rep., 3, 2280, https://doi.org/10.1038/srep02280, 2013.
Iinuma, Y., Böge, O., Gnauk, T., and Herrmann, H.: Aerosol-chamber study of the α-pinene ∕ O3 reaction: influence of particle acidity on aerosol yields and products, Atmos. Environ., 38, 761–773, 2004.
Jathar, S. H., Gordon, T. D., Hennigan, C. J., Pye, H. O. T., Pouliot, G., Adams, P. J., Donahue, N. M., and Robinson, A. L.: Unspeciated organic emissions from combustion sources and their influence on the secondary organic aerosol budget in the United States, P. Natl. Acad. Sci. USA, 111, 10473–10478, https://doi.org/10.1073/pnas.1323740111, 2014.
Kang, M., Fu, P., Kawamura, K., Yang, F., Zhang, H., Zang, Z., Ren, H., Ren, L., Zhao, Y., Sun, Y., and Wang, Z.: Characterization of biogenic primary and secondary organic aerosols in the marine atmosphere over the East China Sea, Atmos. Chem. Phys., 18, 13947–13967, https://doi.org/10.5194/acp-18-13947-2018, 2018.
Kawamura, K. and Bikkina, S.: A review of dicarboxylic acids and related compounds in atmospheric aerosols: Molecular distributions, sources and transformation, Atmos. Res., 170, 140–160, 2016.
Kawamura, K. and Sakaguchi, F.: Molecular distributions of water soluble dicarboxylic acids in marine aerosols over the Pacific Ocean including tropics, J. Geophys. Res.-Atmos., 104, 3501–3509, https://doi.org/10.1029/1998jd100041, 1999.
Kim, B. M., Park, J.-S., Kim, S.-W., Kim, H., Jeon, H., Cho, C., Kim, J.-H., Hong, S., Rupakheti, M., Panday, A. K., Park, R. J., Hong, J., and Yoon, S.-C.: Source apportionment of PM10 mass and particulate carbon in the Kathmandu Valley, Nepal, Atmos. Environ., 123, 190–199, https://doi.org/10.1016/j.atmosenv.2015.10.082, 2015.
Kiros, F., Shakya, K. M., Rupakheti, M., Regmi, R. P., Maharjan, R., Byanju, R. M., Naja, M., Mahata, K., Kathayat, B., and Peltier, R. E.: Variability of Anthropogenic Gases: Nitrogen Oxides, Sulfur Dioxide, Ozone and Ammonia in Kathmandu Valley, Nepal, Aerosol Air Qual. Res., 16, 3088–3101, https://doi.org/10.4209/aaqr.2015.07.0445, 2016.
Kleindienst, T. E., Jaoui, M., Lewandowski, M., Offenberg, J. H., Lewis, C. W., Bhave, P. V., and Edney, E. O.: Estimates of the contributions of biogenic and anthropogenic hydrocarbons to secondary organic aerosol at a southeastern US location, Atmos. Environ., 41, 8288–8300, https://doi.org/10.1016/j.atmosenv.2007.06.045, 2007.
Kondo, A., Kaga, A., Imamura, K., Inoue, Y., Sugisawa, M., Shrestha, M. L., and Sapkota, B.: Investigation of air pollution concentration in Kathmandu valley during winter season, J. Environ. Sci., 17, 1008–1013, 2005.
Kourtchev, I., Ruuskanen, T., Maenhaut, W., Kulmala, M., and Claeys, M.: Observation of 2-methyltetrols and related photo-oxidation products of isoprene in boreal forest aerosols from Hyytiälä, Finland, Atmos. Chem. Phys., 5, 2761–2770, https://doi.org/10.5194/acp-5-2761-2005, 2005.
Laskin, A., Laskin, J., and Nizkorodov, S. A.: Chemistry of Atmospheric Brown Carbon, Chem. Rev., 115, 4335–4382, 2015.
Lawrence, M. G. and Lelieveld, J.: Atmospheric pollutant outflow from southern Asia: a review, Atmos. Chem. Phys., 10, 11017–11096, https://doi.org/10.5194/acp-10-11017-2010, 2010.
Li, J., Wang, G., Aggarwal, S. G., Huang, Y., Ren, Y., Zhou, B., Singh, K., Gupta, P. K., Cao, J., and Zhang, R.: Comparison of abundances, compositions and sources of elements, inorganic ions and organic compounds in atmospheric aerosols from Xi'an and New Delhi, two megacities in China and India, Sci. Total Environ., 476, 485–495, https://doi.org/10.1016/j.scitotenv.2014.01.011, 2014.
Li, J., Wang, G., Ren, Y., Wang, J., Wu, C., Han, Y., Zhang, L., Cheng, C., and Meng, J.: Identification of chemical compositions and sources of atmospheric aerosols in Xi'an, inland China during two types of haze events, Sci. Total Environ., 566, 230–237, https://doi.org/10.1016/j.scitotenv.2016.05.057, 2016.
Li, J., Wang, G., Wu, C., Cao, C., Ren, Y., Wang, J., Li, J., Cao, J., Zeng, L., and Zhu, T.: Characterization of isoprene-derived secondary organic aerosols at a rural site in North China Plain with implications for anthropogenic pollution effects, Sci. Rep., 8, 535, https://doi.org/10.1038/s41598-017-18983-7, 2018.
Liang, L., Engling, G., Du, Z., Cheng, Y., Duan, F., Liu, X., and He, K.: Seasonal variations and source estimation of saccharides in atmospheric particulate matter in Beijing, China, Chemosphere, 150, 365–377, https://doi.org/10.1016/j.chemosphere.2016.02.002, 2016.
Liang, L., Engling, G., Du, Z., Duan, F., Cheng, Y., Liu, X., and He, K.: Contribution of fungal spores to organic carbon in ambient aerosols in Beijing, China, Atmos. Pollut. Res., 8, 351–358, https://doi.org/10.1016/j.apr.2016.10.007, 2017.
Mahata, K. S., Panday, A. K., Rupakheti, M., Singh, A., Naja, M., and Lawrence, M. G.: Seasonal and diurnal variations in methane and carbon dioxide in the Kathmandu Valley in the foothills of the central Himalayas, Atmos. Chem. Phys., 17, 12573–12596, https://doi.org/10.5194/acp-17-12573-2017, 2017.
Mahata, K. S., Rupakheti, M., Panday, A. K., Bhardwaj, P., Naja, M., Singh, A., Mues, A., Cristofanelli, P., Pudasainee, D., Bonasoni, P., and Lawrence, M. G.: Observation and analysis of spatiotemporal characteristics of surface ozone and carbon monoxide at multiple sites in the Kathmandu Valley, Nepal, Atmos. Chem. Phys., 18, 14113–14132, https://doi.org/10.5194/acp-18-14113-2018, 2018.
Miyazaki, Y., Jung, J., Fu, P., Mizoguchi, Y., Yamanoi, K., and Kawamura, K.: Evidence of formation of submicrometer water-soluble organic aerosols at a deciduous forest site in northern Japan in summer, J. Geophys. Res.-Atmos., 117, D19213, https://doi.org/10.1029/2012jd018250, 2012.
Mkoma, S. L., Kawamura, K., and Fu, P. Q.: Contributions of biomass/biofuel burning to organic aerosols and particulate matter in Tanzania, East Africa, based on analyses of ionic species, organic and elemental carbon, levoglucosan and mannosan, Atmos. Chem. Phys., 13, 10325–10338, https://doi.org/10.5194/acp-13-10325-2013, 2013.
Mues, A., Rupakheti, M., Münkel, C., Lauer, A., Bozem, H., Hoor, P., Butler, T., and Lawrence, M. G.: Investigation of the mixing layer height derived from ceilometer measurements in the Kathmandu Valley and implications for local air quality, Atmos. Chem. Phys., 17, 8157-8176, https://doi.org/10.5194/acp-17-8157-2017, 2017.
Mues, A., Lauer, A., Lupascu, A., Rupakheti, M., Kuik, F., and Lawrence, M. G.: WRF and WRF-Chem v3.5.1 simulations of meteorology and black carbon concentrations in the Kathmandu Valley, Geosci. Model Dev., 11, 2067–2091, https://doi.org/10.5194/gmd-11-2067-2018, 2018.
Muzzini, E. and Aparicio, G.: Urban Growth and Spatial Transition in Nepal: An Initial Assessment, World Bank Publications, 2013.
Myers-Pigg, A. N., Griffin, R. J., Louchouarn, P., Norwood, M. J., Sterne, A., and Cevik, B. K.: Signatures of Biomass Burning Aerosols in the Plume of a Saltmarsh Wildfire in South Texas, Environ. Sci. Technol., 50, 9308–9314, https://doi.org/10.1021/acs.est.6b02132, 2016.
Myriokefalitakis, S., Fanourgakis, G., and Kanakidou, M.: The Contribution of Bioaerosols to the Organic Carbon Budget of the Atmosphere, in: Perspectives on Atmospheric Sciences, Cham, 845–851, 2017.
Oanh, N. T. K., Hang, N. T., Aungsiri, T., Worrarat, T., and Danutawat, T.: Characterization of Particulate Matter Measured at Remote Forest Site in Relation to Local and Distant Contributing Sources, Aerosol Air Qual. Res., 16, 2671–2684, https://doi.org/10.4209/aaqr.2015.12.0677, 2016.
Panday, A. K. and Prinn, R. G.: Diurnal cycle of air pollution in the Kathmandu Valley, Nepal: Observations, J. Geophys. Res.-Atmos., 114, D09305, https://doi.org/10.1029/2008jd009777, 2009.
Pudasainee, D., Sapkota, B., Shrestha, M. L., Kaga, A., Kondo, A., and Inoue, Y.: Ground level ozone concentrations and its association with NOx and meteorological parameters in Kathmandu valley, Nepal, Atmos. Environ., 40, 8081–8087, https://doi.org/10.1016/j.atmosenv.2006.07.011, 2006.
Putero, D., Cristofanelli, P., Marinoni, A., Adhikary, B., Duchi, R., Shrestha, S. D., Verza, G. P., Landi, T. C., Calzolari, F., Busetto, M., Agrillo, G., Biancofiore, F., Di Carlo, P., Panday, A. K., Rupakheti, M., and Bonasoni, P.: Seasonal variation of ozone and black carbon observed at Paknajol, an urban site in the Kathmandu Valley, Nepal, Atmos. Chem. Phys., 15, 13957–13971, https://doi.org/10.5194/acp-15-13957-2015, 2015.
Puxbaum, H. and Tenze-Kunit, M.: Size distribution and seasonal variation of atmospheric cellulose, Atmos. Environ., 37, 3693–3699, https://doi.org/10.1016/s1352-2310(03)00451-5, 2003.
Rajput, N. and Lakhani, A.: Measurements of polycyclic aromatic hydrocarbons in an urban atmosphere of Agra, India, Atmosfera, 23, 165–183, 2010.
Ram, K., Sarin, M. M., and Hegde, P.: Long-term record of aerosol optical properties and chemical composition from a high-altitude site (Manora Peak) in Central Himalaya, Atmos. Chem. Phys., 10, 11791–11803, https://doi.org/10.5194/acp-10-11791-2010, 2010.
Ramanathan, V., Chung, C., Kim, D., Bettge, T., Buja, L., Kiehl, J. T., Washington, W. M., Fu, Q., Sikka, D. R., and Wild, M.: Atmospheric brown clouds: Impacts on South Asian climate and hydrological cycle, P. Natl. Acad. Sci. USA, 102, 5326–5333, https://doi.org/10.1073/pnas.0500656102, 2005.
Ramanathan, V., Li, F., Ramana, M. V., Praveen, P. S., Kim, D., Corrigan, C. E., Nguyen, H., Stone, E. A., Schauer, J. J., Carmichael, G. R., Adhikary, B., and Yoon, S. C.: Atmospheric brown clouds: Hemispherical and regional variations in long-range transport, absorption, and radiative forcing, J. Geophys. Res.-Atmos., 112, D22S21, https://doi.org/10.1029/2006jd008124, 2007.
Reisen, F., Meyer, C. P., and Keywood, M. D.: Impact of biomass burning sources on seasonal aerosol air quality, Atmos. Environ., 67, 437–447, 2013.
Rupakheti, D., Adhikary, B., Praveen, P. S., Rupakheti, M., Kang, S., Mahata, K. S., Naja, M., Zhang, Q., Panday, A. K., and Lawrence, M. G.: Pre-monsoon air quality over Lumbini, a world heritage site along the Himalayan foothills, Atmos. Chem. Phys., 17, 11041–11063, https://doi.org/10.5194/acp-17-11041-2017, 2017.
Rupakheti, M., Panday, A. K., Lawrence, M. G., Kim, S. W., Sinha, V., Kang, S. C., Naja, M., Park, J. S., Hoor, P., Holben, B., Sharma, R. K., Mues, A., Mahata, K. S., Bhardwaj, P., Sarkar, C., Rupakheti, D., Regmi, R. P., and Gustafsson, Ö.: Air pollution in the Himalayan foothills: overview of the SusKat-ABC international air pollution measurement campaign in Nepal, Atmos. Chem. Phys., in preparation, 2019.
Sang, X.-F., Chan, C.-Y., Engling, G., Chan, L.-Y., Wang, X.-M., Zhang, Y.-N., Shi, S., Zhang, Z.-S., Zhang, T., and Hu, M.: Levoglucosan enhancement in ambient aerosol during springtime transport events of biomass burning smoke to Southeast China, Tellus B, 63, 129–139, https://doi.org/10.1111/j.1600-0889.2010.00515.x, 2011.
Sang, X., Zhang, Z., Chan, C., and Engling, G.: Source categories and contribution of biomass smoke to organic aerosol over the southeastern Tibetan Plateau, Atmos. Environ., 78, 113–123, 2013.
Sarkar, C., Sinha, V., Kumar, V., Rupakheti, M., Panday, A., Mahata, K. S., Rupakheti, D., Kathayat, B., and Lawrence, M. G.: Overview of VOC emissions and chemistry from PTR-TOF-MS measurements during the SusKat-ABC campaign: high acetaldehyde, isoprene and isocyanic acid in wintertime air of the Kathmandu Valley, Atmos. Chem. Phys., 16, 3979–4003, https://doi.org/10.5194/acp-16-3979-2016, 2016.
Sarkar, C., Sinha, V., Sinha, B., Panday, A. K., Rupakheti, M., and Lawrence, M. G.: Source apportionment of NMVOCs in the Kathmandu Valley during the SusKat-ABC international field campaign using positive matrix factorization, Atmos. Chem. Phys., 17, 8129–8156, https://doi.org/10.5194/acp-17-8129-2017, 2017.
Shah, M. H. and Shaheen, N.: Annual and seasonal variations of trace metals in atmospheric suspended particulate matter in Islamabad, Pakistan, Water Air Soil Poll., 190, 13–25, 2008.
Shakya, K. M., Rupakheti, M., Aryal, K., and Peltier, R. E.: Respiratory Effects of High Levels of Particulate Exposure in a Cohort of Traffic Police in Kathmandu, Nepal, J. Occup. Environ. Med., 58, e218–25, https://doi.org/10.1097/JOM.000000000000075, 2016.
Shakya, K. M., Rupakheti, M., Shahi, A., Maskey, R., Pradhan, B., Panday, A., Puppala, S. P., Lawrence, M., and Peltier, R. E.: Near-road sampling of PM2.5, BC, and fine-particle chemical components in Kathmandu Valley, Nepal, Atmos. Chem. Phys., 17, 6503–6516, https://doi.org/10.5194/acp-17-6503-2017, 2017.
Sheesley, R. J., Schauer, J. J., Chowdhury, Z., Cass, G. R., and Simoneit, B. R. T.: Characterization of organic aerosols emitted from the combustion of biomass indigenous to South Asia, J. Geophys. Res.-Atmos., 108, 4285, https://doi.org/10.1029/2002jd002981, 2003.
Shen, R.-Q., Ding, X., He, Q.-F., Cong, Z.-Y., Yu, Q.-Q., and Wang, X.-M.: Seasonal variation of secondary organic aerosol tracers in Central Tibetan Plateau, Atmos. Chem. Phys., 15, 8781–8793, https://doi.org/10.5194/acp-15-8781-2015, 2015.
Simoneit, B. R. T.: Biomass burning – A review of organic tracers for smoke from incomplete combustion, Appl. Geochem., 17, 129–162, https://doi.org/10.1016/s0883-2927(01)00061-0, 2002.
Simoneit, B. R. T., Elias, V. O., Kobayashi, M., Kawamura, K., Rushdi, A. I., Medeiros, P. M., Rogge, W. F., and Didyk, B. M.: Sugars – Dominant water-soluble organic compounds in soils and characterization as tracers in atmospheric particulate matter, Environ. Sci. Technol., 38, 5939–5949, https://doi.org/10.1021/es0403099, 2004.
Stockwell, C. E., Christian, T. J., Goetz, J. D., Jayarathne, T., Bhave, P. V., Praveen, P. S., Adhikari, S., Maharjan, R., DeCarlo, P. F., Stone, E. A., Saikawa, E., Blake, D. R., Simpson, I. J., Yokelson, R. J., and Panday, A. K.: Nepal Ambient Monitoring and Source Testing Experiment (NAMaSTE): emissions of trace gases and light-absorbing carbon from wood and dung cooking fires, garbage and crop residue burning, brick kilns, and other sources, Atmos. Chem. Phys., 16, 11043–11081, https://doi.org/10.5194/acp-16-11043-2016, 2016.
Stone, E. A., Zhou, J., Snyder, D. C., Rutter, A. P., Mieritz, M., and Schauer, J. J.: A Comparison of Summertime Secondary Organic Aerosol Source Contributions at Contrasting Urban Locations, Environ. Sci. Technol., 43, 3448–3454, https://doi.org/10.1021/es8025209, 2009.
Stone, E. A., Schauer, J. J., Pradhan, B. B., Dangol, P. M., Habib, G., Venkataraman, C., and Ramanathan, V.: Characterization of emissions from South Asian biofuels and application to source apportionment of carbonaceous aerosol in the Himalayas, J. Geophys. Res.-Atmos., 115, D06301, https://doi.org/10.1029/2009jd011881, 2010.
Stone, E. A., Nguyen, T. T., Pradhan, B. B., and Dangol, P. M.: Assessment of biogenic secondary organic aerosol in the Himalayas, Environ. Chem., 9, 263–272, https://doi.org/10.1071/en12002, 2012.
Surratt, J. D., Chan, A. W. H., Eddingsaas, N. C., Chan, M., Loza, C. L., Kwan, A. J., Hersey, S. P., Flagan, R. C., Wennberg, P. O., and Seinfeld, J. H.: Reactive intermediates revealed in secondary organic aerosol formation from isoprene, P. Natl. Acad. Sci. USA, 107, 6640–6645, https://doi.org/10.1073/pnas.0911114107, 2010.
Szidat, S., Jenk, T. M., Synal, H.-A., Kalberer, M., Wacker, L., Hajdas, I., Kasper-Giebl, A., and Baltensperger, U.: Contributions of fossil fuel, biomass-burning, and biogenic emissions to carbonaceous aerosols in Zurich as traced by 14C, J. Geophys. Res.-Atmos., 111, D07206, https://doi.org/10.1029/2005JD006590, 2006.
Tripathee, L., Kang, S., Rupakheti, D., Cong, Z., Zhang, Q., and Huang, J.: Chemical characteristics of soluble aerosols over the central Himalayas: insights into spatiotemporal variations and sources, Environ. Sci. Poll. Res., 24, 24454–24472, https://doi.org/10.1007/s11356-017-0077-0, 2017.
Wan, E. C. H. and Yu, J. Z.: Analysis of sugars and sugar polyols in atmospheric aerosols by chloride attachment in liquid chromatography/negative ion electrospray mass spectrometry, Environ. Sci. Technol., 41, 2459–2466, https://doi.org/10.1021/es062390g, 2007.
Wan, X., Kang, S., Wang, Y., Xin, J., Liu, B., Guo, Y., Wen, T., Zhang, G., and Cong, Z.: Size distribution of carbonaceous aerosols at a high-altitude site on the central Tibetan Plateau (Nam Co Station, 4730 m a.s.l.), Atmos. Res., 153, 155–164, https://doi.org/10.1016/j.atmosres.2014.08.008, 2015.
Wan, X., Kang, S., Li, Q., Rupakheti, D., Zhang, Q., Guo, J., Chen, P., Tripathee, L., Rupakheti, M., Panday, A. K., Wang, W., Kawamura, K., Gao, S., Wu, G., and Cong, Z.: Organic molecular tracers in the atmospheric aerosols from Lumbini, Nepal, in the northern Indo-Gangetic Plain: influence of biomass burning, Atmos. Chem. Phys., 17, 8867–8885, https://doi.org/10.5194/acp-17-8867-2017, 2017.
Wan, X., Kawamura, K., Ram, K., Kang, S., Loewen, M., Gao, S., Wu, G., Fu, P., Zhang, Y., Bhattarai, H., and Cong, Z.: Aromatic acids as biomass-burning tracers in atmospheric aerosols and ice cores: A review, Environ. Poll., 247, 216–228, 2019.
Wang, W., Wu, M. H., Li, L., Zhang, T., Liu, X. D., Feng, J. L., Li, H. J., Wang, Y. J., Sheng, G. Y., Claeys, M., and Fu, J. M.: Polar organic tracers in PM2.5 aerosols from forests in eastern China, Atmos. Chem. Phys., 8, 7507–7518, https://doi.org/10.5194/acp-8-7507-2008, 2008.
Wang, X., Gong, P., Sheng, J., Joswiak, D. R., and Yao, T.: Long-range atmospheric transport of particulate Polycyclic Aromatic Hydrocarbons and the incursion of aerosols to the southeast Tibetan Plateau, Atmos. Environ., 115, 124–131, https://doi.org/10.1016/j.atmosenv.2015.04.050, 2015.
Wester, P., Mishra, A., Mukherji, A., and Shrestha, A. B. E.: The Hindu Kush Himalaya Assessment: Mountains, Climate Change, Sustainability and People, Springer Nature Switzerland AG, Cham, 2019.
WHO: Air quality guidelines: global update 2005: particulate matter, ozone, nitrogen dioxide, and sulfur dioxide, World Health Organization, available at: http://www.euro.who.int/en/health-topics/environment-and-health/air-quality/publications/pre2009/air-quality-guidelines.-global-update-2005.-particulate-matter,-ozone,-nitrogen-dioxide-and-sulfur-dioxide (last access: 24 February 2019), 2006.
Wu, G., Wan, X., Gao, S., Fu, P., Yin, Y., Li, G., Zhang, G., Kang, S., Ram, K., and Cong, Z.: Humic-Like Substances (HULIS) in Aerosols of Central Tibetan Plateau (Nam Co, 4730 m asl): Abundance, Light Absorption Properties, and Sources, Environ. Sci. Technol., 52, 7203–7211, https://doi.org/10.1021/acs.est.8b01251, 2018.
Xu, L., Guo, H., Boyd, C. M., Klein, M., Bougiatioti, A., Cerully, K. M., Hite, J. R., Isaacman-VanWertz, G., Kreisberg, N. M., Knote, C., Olson, K., Koss, A., Goldstein, A. H., Hering, S. V., de Gouw, J., Baumann, K., Lee, S.-H., Nenes, A., Weber, R. J., and Ng, N. L.: Effects of anthropogenic emissions on aerosol formation from isoprene and monoterpenes in the southeastern United States, P. Natl. Acad. Sci. USA, 112, E4509, https://doi.org/10.1073/pnas.1512279112, 2015.
Yttri, K. E., Dye, C., and Kiss, G.: Ambient aerosol concentrations of sugars and sugar-alcohols at four different sites in Norway, Atmos. Chem. Phys., 7, 4267–4279, https://doi.org/10.5194/acp-7-4267-2007, 2007.
Yue, S., Ren, H., Fan, S., Sun, Y., Wang, Z., and Fu, P.: Springtime precipitation effects on the abundance of fluorescent biological aerosol particles and HULIS in Beijing, Sci. Rep., 6, 29618, https://doi.org/10.1038/srep29618, 2016.
Zhang, H., Surratt, J. D., Lin, Y. H., Bapat, J., and Kamens, R. M.: Effect of relative humidity on SOA formation from isoprene/NO photooxidation: enhancement of 2-methylglyceric acid and its corresponding oligoesters under dry conditions, Atmos. Chem. Phys., 11, 6411–6424, https://doi.org/10.5194/acp-11-6411-2011, 2011.
Zhang, Y., Shao, M., Zhang, Y., Zeng, L., He, L., Zhu, B., Wei, Y., and Zhu, X.: Source profiles of particulate organic matters emitted from cereal straw burnings, J. Environ. Sci., 19, 167–175, https://doi.org/10.1016/s1001-0742(07)60027-8, 2007.
Zhang, Y.-L., Huang, R.-J., El Haddad, I., Ho, K.-F., Cao, J.-J., Han, Y., Zotter, P., Bozzetti, C., Daellenbach, K. R., Canonaco, F., Slowik, J. G., Salazar, G., Schwikowski, M., Schnelle-Kreis, J., Abbaszade, G., Zimmermann, R., Baltensperger, U., Prévôt, A. S. H., and Szidat, S.: Fossil vs. non-fossil sources of fine carbonaceous aerosols in four Chinese cities during the extreme winter haze episode of 2013, Atmos. Chem. Phys., 15, 1299–1312, https://doi.org/10.5194/acp-15-1299-2015, 2015.
Zhu, C., Kawamura, K., and Kunwar, B.: Organic tracers of primary biological aerosol particles at subtropical Okinawa Island in the western North Pacific Rim, J. Geophys. Res.-Atmos., 120, 5504–5523, https://doi.org/10.1002/2015jd023611, 2015.
Zhu, C., Kawamura, K., Fukuda, Y., Mochida, M., and Iwamoto, Y.: Fungal spores overwhelm biogenic organic aerosols in a midlatitudinal forest, Atmos. Chem. Phys., 16, 7497–7506, https://doi.org/10.5194/acp-16-7497-2016, 2016.