the Creative Commons Attribution 4.0 License.
the Creative Commons Attribution 4.0 License.
 | 27 Feb 2019
Tornado-scale vortices in the tropical cyclone boundary layer: numerical simulation with the WRF–LES framework
Qingyuan Liu
Yubin Li
A tornado-scale vortex in the tropical cyclone (TC) boundary layer (TCBL) has been observed in intense hurricanes and the associated intense turbulence poses a severe threat to the manned research aircraft when it penetrates hurricane eyewalls at a lower altitude. In this study, a numerical experiment in which a TC evolves in a large-scale background over the western North Pacific is conducted using the Advanced Weather Research and Forecast (WRF) model by incorporating the large-eddy simulation (LES) technique. The simulated tornado-scale vortex shows features similar to those revealed with limited observational data, including the updraft–downdraft couplet, the sudden jump of wind speeds, the location along the inner edge of the eyewall, and the small horizontal scale. It is suggested that the WRF–LES framework can successfully simulate the tornado-scale vortex with grids at a resolution of 37 m that cover the TC eye and eyewall.
The simulated tornado-scale vortex is a cyclonic circulation with a small horizontal scale of ∼1 km in the TCBL. It is accompanied by strong updrafts (more than 15 m s−1) and large vertical components of relative vorticity (larger than 0.2 s−1). The tornado-scale vortex favorably occurs at the inner edge of the enhanced eyewall convection or rainband within the saturated, high-θe layer, mostly below an altitude of 2 km. In nearly all the simulated tornado-scale vortices, the narrow intense updraft is coupled with the relatively broad downdraft, constituting one or two updraft–downdraft couplets, as observed by the research aircraft. The presence of the tornado-scale vortex also leads to significant gradients in the near-surface wind speed and wind gusts.


Tropical cyclones (TCs) pose a severe risk to life and property in TC-prone areas and the risk will increase due to the rapidly rising coastal population and number of buildings (Pielke et al., 2008; Zhang et al., 2009). One of the major TC threats is damaging winds. Uneven damage patterns often show horizontal scales ranging from a few hundred meters to several kilometers (Wakimoto and Black, 1994; Wurman and Kosiba, 2018), suggesting that TC threats are associated with both sustained winds and gusts. The latter are believed to result from small-scale coherent structures in the TC boundary layer (Wurman and Winslow, 1998; Morrison et al., 2005; Lorsolo et al., 2008; Kosiba et al., 2013; Kosiba and Wurman, 2014). The small-scale coherent structures may have significant implications for the vertical transport of energy in TCs and thus TC intensity and structure (Zhu, 2008; Rotunno et al., 2009; Zhu et al., 2013; Green and Zhang, 2014, 2015; Gao et al., 2017). While understanding of the coherent structure is very important for mitigating TC damage and understanding of TC intensity and structure changes, for now direct in situ observation and remote-sensing measurements can only provide very limited information.
In the TC boundary layer (TCBL), observational analyses suggest that horizontal streamwise roll vortices prevail with sub-kilometer to multi-kilometer wavelengths (Wurman and Winslow, 1998; Katsaros et al., 2002; Morrison et al., 2005; Lorsolo et al., 2008; Ellis and Businger, 2010; Foster, 2013). Studies found that the rolls can result from the inflection point instability of the horizontal wind profiles in the TCBL (Foster, 2005; Gao and Ginis, 2014) and have significant influences on the vertical transport of energy in TCs (Zhu, 2008; Rotunno et al., 2009; Zhu et al., 2013; Green and Zhang, 2014, 2015; Gao et al., 2017). The TCBL is known to play a critical role in transporting energy and controlling TC intensity (Braun and Tao, 2000; Rotunno et al., 2009; Smith and Montgomery, 2010; Bryan, 2012; Zhu et al., 2013; Green and Zhang, 2015).
Another important small-scale feature is the so-called eyewall vorticity maximum (EVM) (Marks et al., 2008) or tornado-scale vortices in the TCBL (Wurman and Kosiba, 2018; Wu et al., 2018). So far, our understanding is mainly from a few observational analyses based on limited data collected during the research aircraft penetration of hurricane eyewalls. A WP-3D research aircraft from National Oceanic and Atmospheric Administration (NOAA) encountered three strong updraft–downdraft couplets within 1 min while penetrating the eyewall of category 5 Hurricane Hugo (1989) at 450 m in altitude (Marks et al., 2008). The severe turbulence caused the failure of one of the four engines and the people on board were at a severe risk. The aircraft finally escaped with the help of a U.S. Air Force reconnaissance WC-130 aircraft, which found a safe way out through the eyewall on the northeast side of Hugo. Since then aircraft missions have been prohibited in the boundary layer of the TC eyewall. Later analysis indicated that the dangerous turbulence was associated with a tornado-scale vortex, which is comparable to a weak tornado in terms of its diameter of about 1 km and the estimated peak cyclonic vorticity of 0.125 s−1 (Marks et al., 2008). Such strong turbulence was also observed in Hurricanes Isabel (2003) and Felix (2007) below 3 km (Aberson et al., 2006, 2017). So far, little is known about the structure and evolution of the tornado-scale vortex.
With advances in numerical models and computational capability, the large-eddy simulation (LES) technique has been incorporated into the Advanced Weather Research and Forecast (WRF) model (Mirocha et al., 2010) and an increasing number of TC simulations have been conducted with horizontal grid spacing of less than 1 km (Zhu, 2008; Rotunno et al., 2009; Bryan et al., 2014; Stern and Bryan, 2014; Rotunno and Bryan, 2014; Green and Zhang, 2015). In LES, the energy-producing scales of three-dimensional (3-D) atmospheric turbulence in the planetary boundary layer (PBL) are explicitly resolved, while the smaller-scale portion of the turbulence is parameterized (Mirocha et al., 2010). Effort has been made to simulate the structure of the TC PBL eddies and the associated influence on TC intensity. Zhu (2008) simulated the structure of the coherent large-eddy circulations and the induced vertical transport using the WRF–LES framework with horizontal resolutions of 300 and 100 m. When the horizontal resolution was increased from 185 to 62 m on the f plane, Rotunno et al. (2009) found a sharp increase in randomly distributed small-scale turbulent eddies, while 1 min mean TC intensity began to decrease. Green and Zhang (2015) performed several 6 h one-way simulations of Hurricane Katrina (2005) without a boundary layer parameterization (horizontal resolutions of 333, 200, and 111 m). Rotunno et al. (2009) and Green and Zhang (2015) suggest that the horizontal resolution should be below 100 m to simulate the development of 3-D turbulent eddies in the TCBL. Ito et al. (2017) found that the near-surface coherent structures can be successfully simulated by using the horizontal resolution of 70 m, which appears to be caused by an inflection-point instability of both radial and tangential winds.
It is clear that understanding of the tornado-scale vortex would enhance the safety of flights into very intense TCs. In addition, tornado-scale vortices may contribute to TC intensification by mixing the high-entropy air in the eye into the eyewall (Persing and Montgomery, 2003; Montgomery et al., 2006; Aberson et al., 2006). By simulating tornado-scale vortices in the TCBL, this study will particularly focus on the spatial distribution of occurrence of the tornado-scale vortices and the features of their 3-D structures.
In this study a semi-idealized numerical simulation is conducted using version 3.2.1 of the WRF model. Following Wu and Chen (2016), two steps were taken to construct the initial conditions for the numerical experiment. A symmetric vortex was first spun up without the environmental flow on an f plane for 18 h and then the vortex was embedded in the large-scale background of Typhoon Matsa (2005) from 00:00 UTC 5 August to 12:00 UTC 6 August. The large-scale environment was derived from the National Centers for Environmental Prediction (NCEP) Final (FNL) Operational Global Analysis data with resolution of 1.0∘ × 1.0∘ using a 20-day low-pass Lanczos filter (Duchon, 1979).
The spun-up vortex is initially located at the center of Typhoon Matsa (25.4∘ N, 123.0∘ E). The outermost domain (centered at 30.0∘ N, 132.5∘ E) covers an area of 6210 km × 5170 km with a horizontal grid spacing of 27 km. The numerical experiment is designed with six two-way interactive domains embedded in the 27 km resolution domain to simulate energetic three-dimensional turbulent eddies in the TC eyewall and their influence on the TC vortex, mesoscale rainbands, and convective clouds. The horizontal spacing decreases by a factor of 3 with the domain level. The corresponding horizontal resolutions are 9 km, 3 km, 1 km, 1∕3 km (333 m), 1∕9 km (∼111 m), and 1∕27 km (∼37 m) and the numbers of their grid meshes are 230×210, 432×399, 333×333, 501×501, 1351×1351, and 2431×2431, respectively. The innermost domain covers the inner region of the simulated TC (90×90 km), including the eye and eyewall. Except for the 27 and 9 km resolution domains, the other domains move with the TC. The model consists of 75 vertical levels (19 levels below 2 km) with a top of 50 hPa. All lands in the model are removed and the experiment is run over the open ocean with a constant sea surface temperature of 29 ∘C.
The physics options used in the simulation are as follows. The Kain–Fritsch cumulus parameterization scheme and the WRF single-moment three-class scheme are used in the outermost domain (Kain and Fritsch, 1993). The WRF six-class scheme is selected in the nested domains with no cumulus parameterization scheme (Hong and Lim, 2006). The Rapid Radiative Transfer Model (RRTM) and the Dudhia shortwave radiation scheme are used for calculating long-wave radiation and shortwave radiation (Mlawer et al., 1997; Dudhia, 1989). The LES technique is used in the sub-kilometer domains (Mirocha et al., 2010) and the Yonsei University scheme is adopted for PBL parameterization in the other domains (Noh et al., 2003).
The model is run for 36 h and the 1∕9 km resolution and 1∕27 km resolution domains are activated at 24 h. In the following analysis, we will focus on the hourly output from 26 to 36 h. The TC center is determined with a variational approach in which it is located until the maximum azimuthal mean tangential wind speed is obtained (Wu et al., 2006).
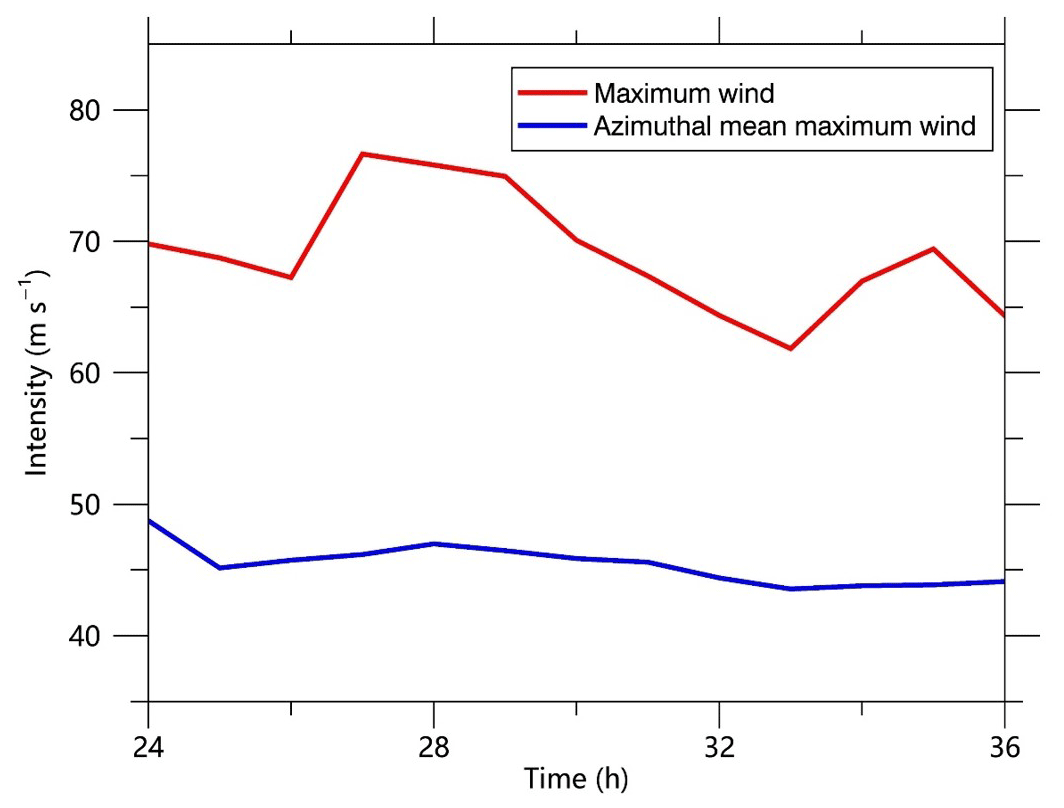
Figure 1Intensity of the simulated tropical cyclone during 24–36 h in terms of maximum instantaneous (red) and azimuthal mean (blue) instantaneous wind speeds at 10 m.
The simulated TC takes a north-northwest track (not shown). Figure 1 shows its intensity in terms of the maximum instantaneous and azimuthally averaged wind speeds at 10 m in the 1∕27 km resolution domain. The instantaneous winds are obtained directly from the model output without any time averaging. The azimuthal wind speed is the wind speed averaged azimuthally with respect to the TC center. The instantaneous maximum wind speed fluctuates between 61.8 and 76.6 m s−1 during the 12 h period, while the fluctuations in the azimuthal maximum wind speed are relatively small, ranging from 43.5 to 48.8 m s−1. In particular, the TC maintains the azimuthal mean maximum wind speed of ∼45 m s−1 after the innermost domain has been activated for 2 h.
Figure 2a shows the simulated 500 m radar reflectivity at 27 h, indicating that the eyewall is open to the south of the TC center. We examine the radar reflectivity field and find that the opened eyewall persists during the 10 h period (not shown). In addition, the location of the enhanced convection relative to the TC center is generally steady. It is well known that the eyewall asymmetry is associated with the vertical shear of the environmental flow (Frank and Ritchie, 2001; Braun and Wu, 2007). In this study the vertical wind shear is calculated as the difference of wind vectors between 200 and 850 hPa within a radius of 300 km. As shown in the figure, the mean shear is 7.0 m s−1 to the southeast over the 10 h period. In agreement with the previous studies, the enhanced eyewall reflectivity is generally observed in the downshear left side. There are relatively small changes in the radius of maximum wind (RMW) during the 10 h period, ranging from 28.2 to 30.7 km at 500 m.

Figure 2Simulated radar reflectivity (dBZ) at 500 m (a) and wind speed (m s−1) at 10 m (b) within an area of 80 km × 80 km at 27 h. The plus signs and solid circles indicate the TC center and the radius of maximum wind at 500 m. The red dots indicate locations of tornado-scale vortices. The rectangle shows the area used in Fig. 3a. The arrow shows the vertical wind shear of 7.0 m s−1 between 200 and 850 hPa.
Using the fine-scale dual Doppler data in the right front quadrant and eye of Hurricane Frances (2014) as it made landfall in Florida, Kosiba and Wurman (2014) found linear coherent structures with a wavelength of 400–500 m near the surface. Figure 2b shows the simulated near-surface (10 m) wind speeds in the inner region at 27 h. The instantaneous wind speed is dominated by quasi-linear coherent structures in the eyewall region. The intense instantaneous wind speeds coincide with the TC-scale shear-induced enhanced eyewall convection shown in Fig. 2a. In order to clearly show the quasi-linear features, we plot the instantaneous wind speed in an area of 10 km × 7 km at this time (Fig. 3a). The small area is located in the eyewall to the east of the TC center (Fig. 2b). The streaks of alternating high and low wind speeds can be clearly seen and are roughly aligned with the TC-scale flow with an outward angle. We can see that the instantaneous wind speed exhibits large gradients across the streaks.
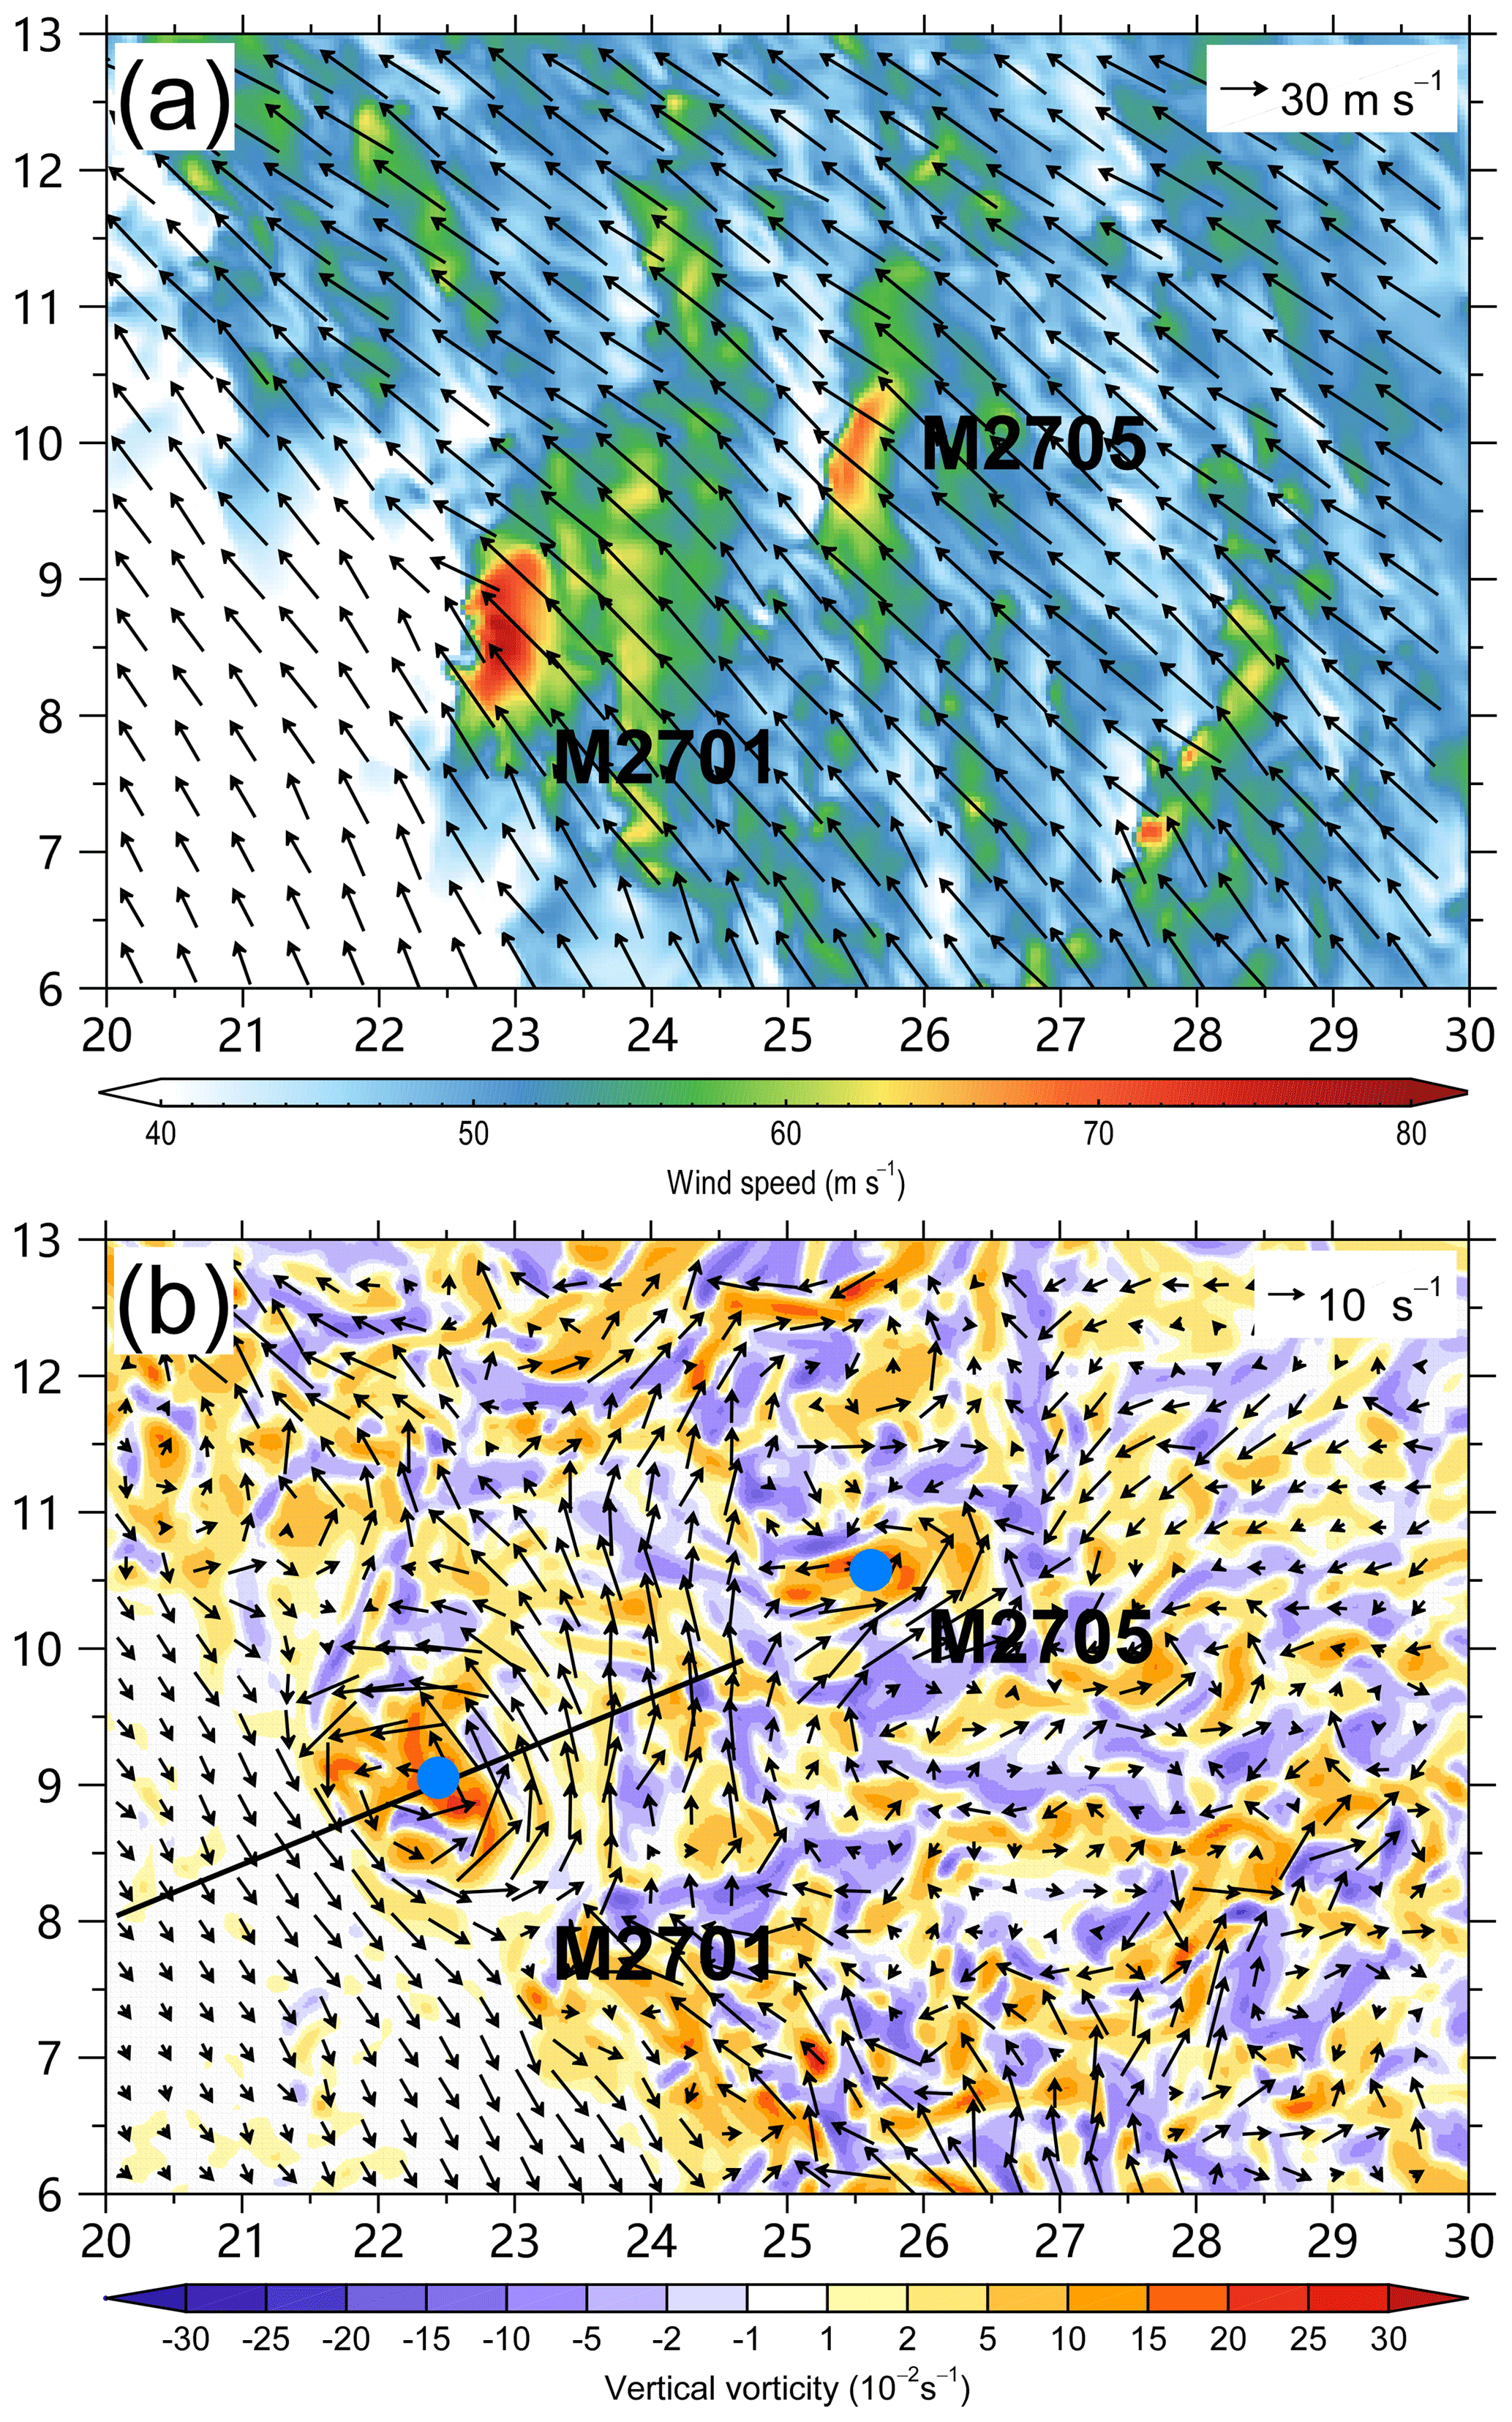
Figure 3(a) 10 m wind speed (m s−1) and wind vectors and (b) the perturbation wind vectors and vertical component of relative vorticity (shading) at 500 m in the area shown in Fig. 2b. The straight line is the location of the vertical cross section in Fig. 7 and M2701 and M2705 are the two tornado-scale vortices in the small area. The blue dots indicate their locations.
Figure 3b shows the perturbation wind field at 500 m in the small area. The perturbation winds are obtained by subtracting an 8 km moving mean. We compared the perturbation winds with different sizes of the moving window. While the perturbation wind fields are very similar, the maximum wind speeds generally increase with the increasing window size. When the window size is larger than 8 km, there is little change in the perturbation wind speed. The simulated small-scale circulations are similar to those found from instead calculating the perturbations by subtracting the symmetric and wavenumber 1–3 components with respect to the TC center (not shown). In the perturbation wind field, we can see two small-scale cyclonic circulations. The most distinct one has a diameter of ∼2 km. In the next section, the two cyclones are identified as two tornado-scale vortices (M2701 and M2705). In the study, the simulated tornado-scale vortex is named with four digits. While the first two digits indicate the hours of the simulation, the last two digits show the series number at the same hour. Comparing Fig. 3a and b indicates that the two tornado-scale vortices also correspond to enhanced wind speeds at 10 m.
As mentioned in Sect. 1, analyses of a few real cases in intense Atlantic hurricanes indicate that the tornado-scale vortex is a small-scale feature that occurs in the turbulent TC boundary layer, with vertical motion and relative vorticity extremes. Aberson et al. (2006, 2017) analyzed the extreme updrafts in Hurricanes Isabel (2003) and Felix (2007) and suggested that the strong updrafts were likely associated with a small-scale vortex. The updraft of 22 m s−1 in Isabel was detected by a GPS dropwindsonde at just about 1300 m (Aberson et al., 2006; Stern and Bryan, 2018), while the updraft of 31 m s−1 in Hurricane Felix (2007) was observed at the flight altitude (∼3 km). Marks et al. (2008) found that the EVM in Hurricane Hugo (1989) was associated with a maximum vertical motion of 21 m s−1 and a maximum vertical relative vorticity of 0.125 s−1 at the altitude of 450 m. Based on these studies, a small-scale vortex associated with extreme wind speed can be treated as a tornado-scale vortex (Wurman and Kosiba, 2018; Wu et al., 2018). The tornado-scale vortex in the simulated TC is subjectively defined as a small-scale cyclonic circulation with the diameter of 1–2 km below the altitude of 3 km, containing maximum upward motion larger than 20 m s−1 and maximum vertical relative vorticity larger than 0.2 s−1. The grid points that satisfy the thresholds of vertical motion and vertical relative vorticity belong to the same tornado-scale vortex if they are within a distance of 1 km in the horizontal or vertical directions. We detect the tornado-scale vortices using the output at 1 h intervals from 26 to 36 h. A few variables are also stored at 3 s intervals during a 22 min period starting at 30 h.
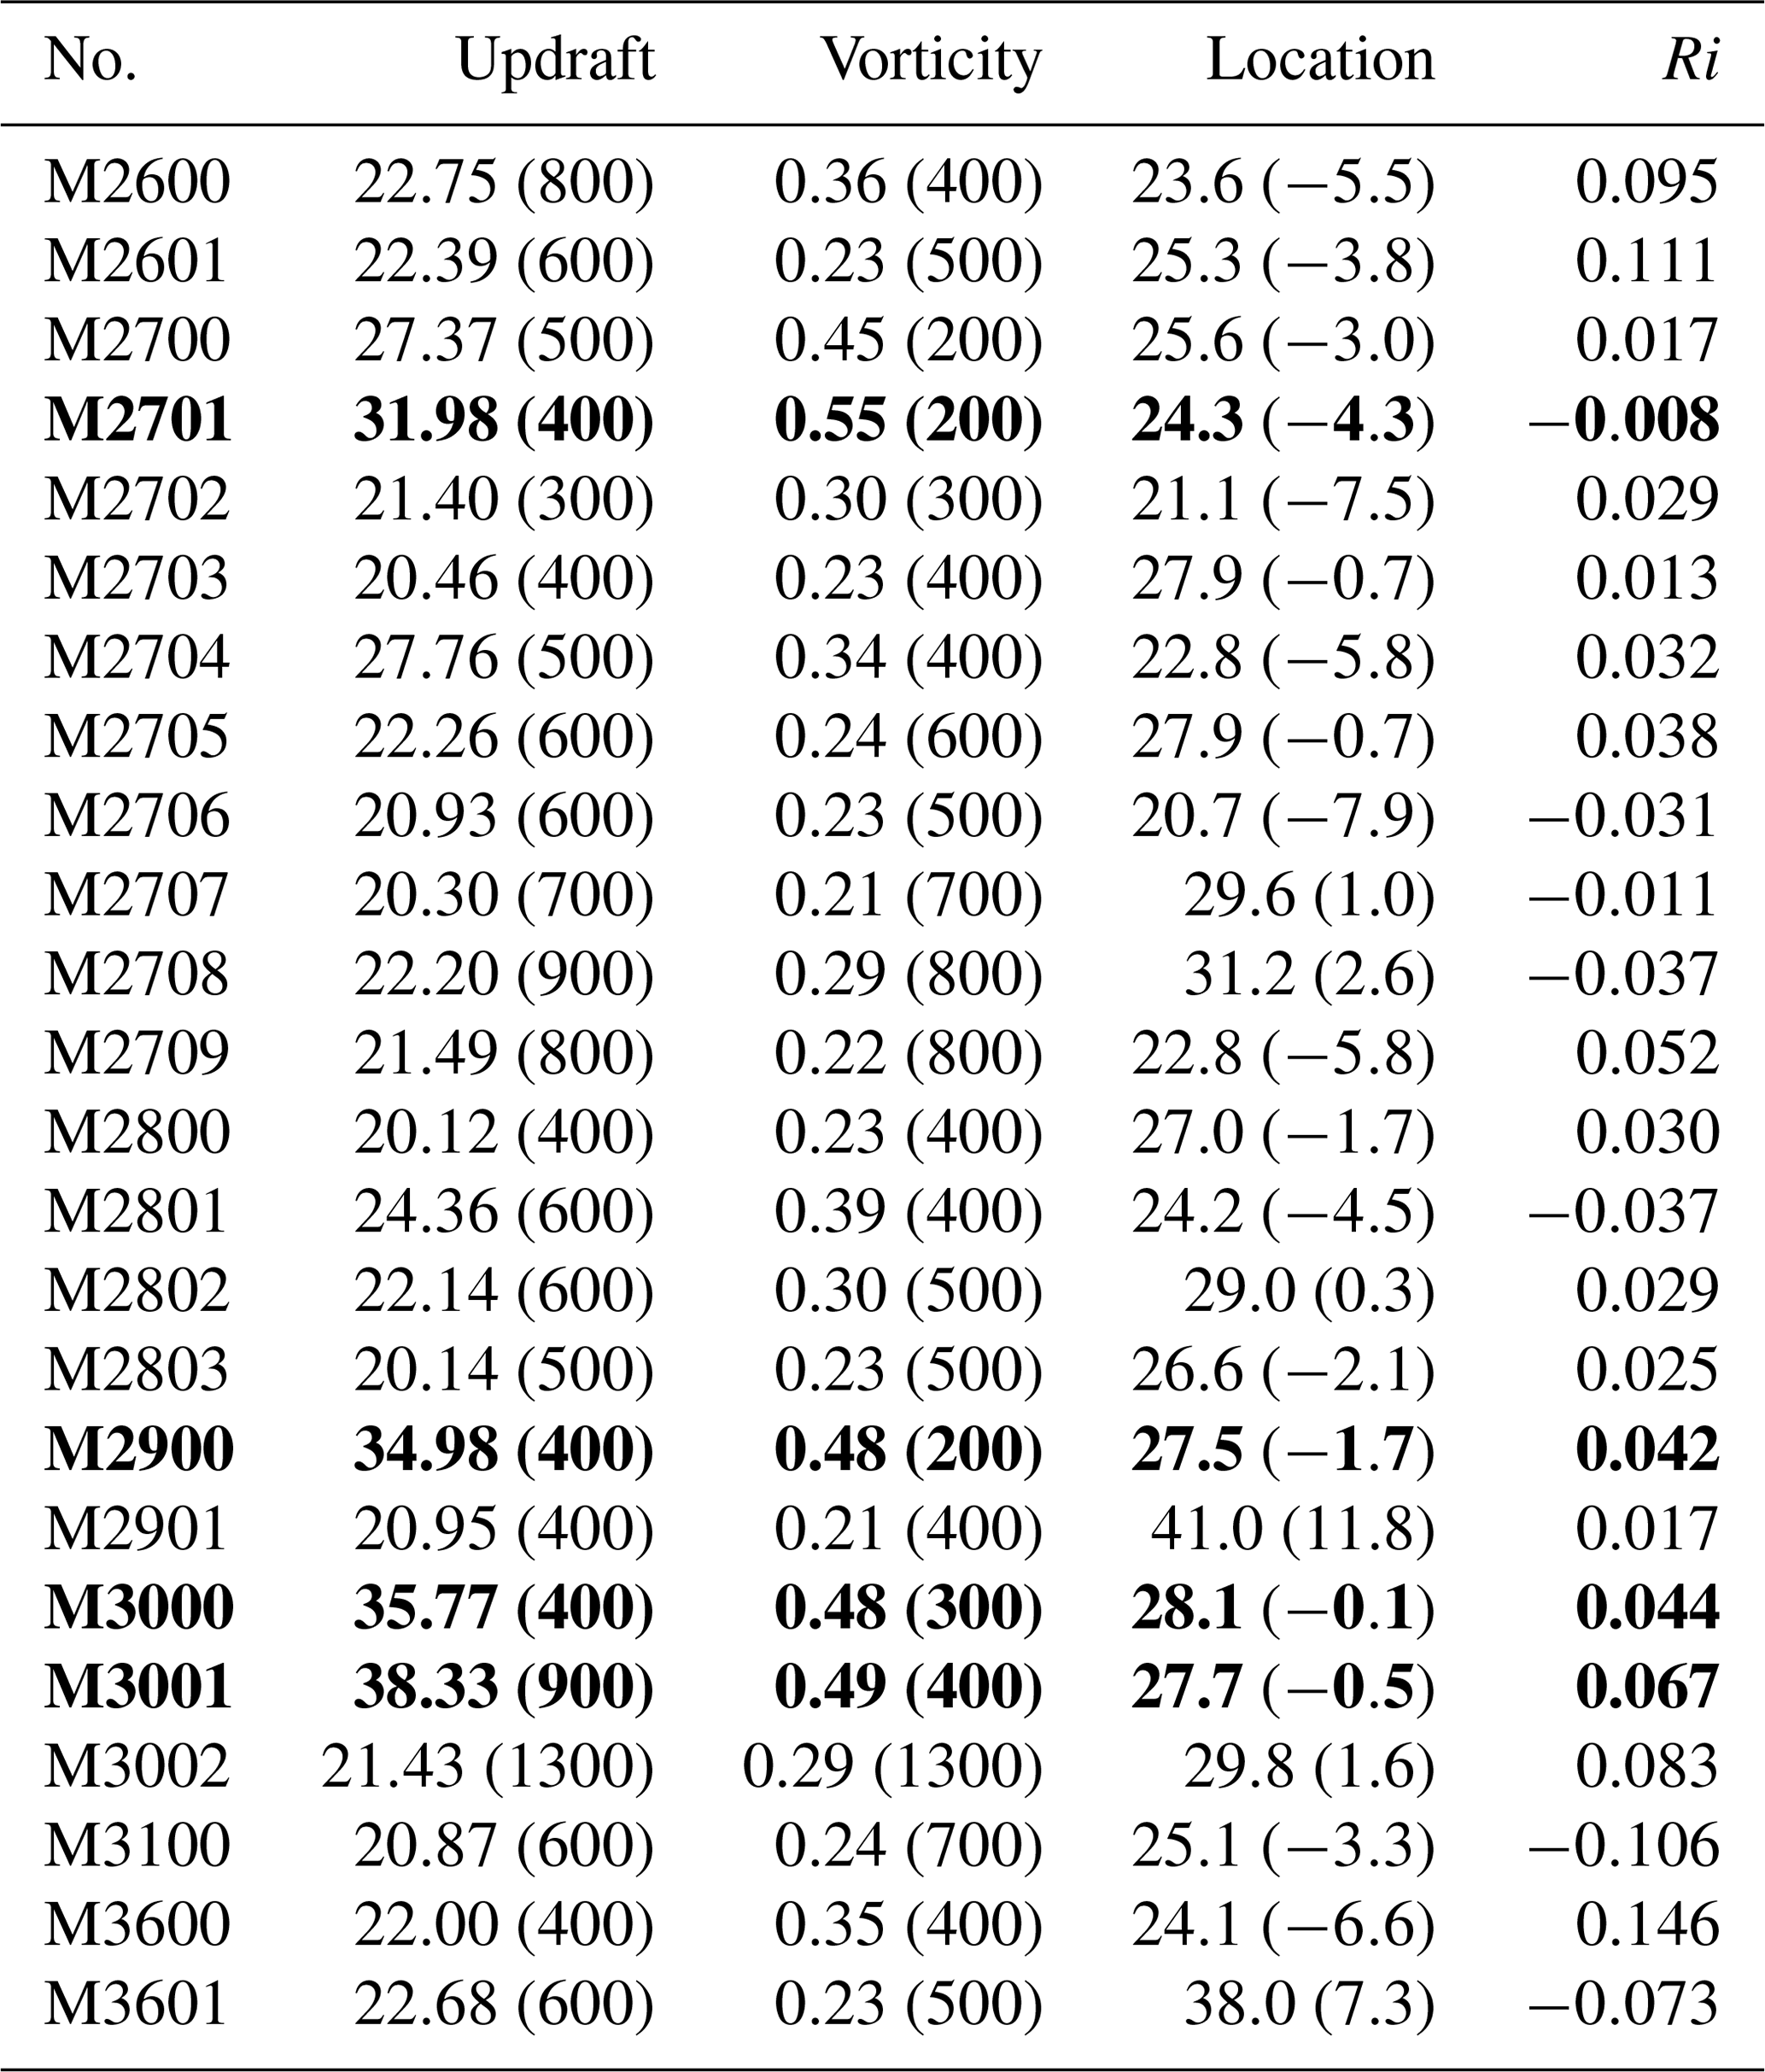
There are 24 tornado-scale vortices identified at the 11 hourly output times (Table 1). There are four tornado-scale vortices with maximum vertical motion of more than 30 m s−1 and maximum vertical component of relative vorticity larger than 0.4 s−1. Except for the two tornado-scale vortices at 36 h, the others occur during 26–31 h with 10 cases at 27 h. The lull period is coincident with a relatively weaker instantaneous maximum wind speed at 10 m, although there is little difference in the azimuthal mean maximum wind speed (Fig. 1). Examination indicates that the 10 m instantaneous wind speed maximum at 27 h is associated with M2701. It is suggested that the tornado-scale vortex can lead to the strongest wind gust in a TC.
Table 1List of the identified tornado-scale vortices in the TCBL with the maximum updraft (m s−1) and vertical relative vorticity (s−1) and the corresponding altitudes (m) in the parentheses. The location column lists the radial distance from the TC center and the relative distance to the 500 m radius of maximum wind in the parentheses. The Richardson number (Ri) is averaged over the layer between 200 and 800 m within a radius of 1.5 km. The four strongest EVMs are indicated in bold.
Some previous studies argued that the presence of mesovortices intensifies the TC by mixing the high-entropy air in the eye into the eyewall (Persing and Montgomery, 2003; Montgomery et al., 2006; Aberson et al., 2006). As shown in Fig. 1, the azimuthal mean maximum wind speed does not show any jump at 27 h, when there are 10 identified tornado-scale vortices. In the following discussion, we will show that the mixing indeed exists, but its effect on the azimuthal maximum wind speed cannot be detected. This is similar to the conclusion from idealized numerical experiments conducted by Bryan and Rotunno (2009). In fact, the azimuthal maximum wind speed (∼45 m s−1) is rather steady during the 10 h period after the innermost domain has been activated for 2 h.
The number of the identified tornado-scale vortices is sensitive to the threshold of vertical motion. If we relax the threshold of maximum vertical motion to 15 m s−1, we can identify 89 tornado-scale vortices during the 10 h period (Fig. 4a). Nearly all the tornado-scale vortices still occur in the same semicircle of the enhanced eyewall reflectivity. This relationship between the vertical wind shear orientation and the spatial distribution of extreme updrafts is consistent with what Stern et al. (2016) found from dropsonde observations in many storms. In our experiment, a few variables are also stored at 3 s intervals during a 22 min period from the 31st hour. The duration of the tornado-scale vortex is examined in the 3 s output. The duration is counted as the continuous period during which the maximum vertical motion and vertical relative vorticity are not less than the thresholds. For the thresholds of 20 m s−1 in vertical motion and 0.2 s−1 in vertical relative vorticity, the mean duration is 40 seconds and the longest is 138 s. We can conclude that the identified tornado-scale vortices are not repeatedly counted in the hourly output. The durations of tornado-scale vortices are consistent with observational and numerical studies (Wurman and Kosiba, 2018; Stern and Bryan, 2018).
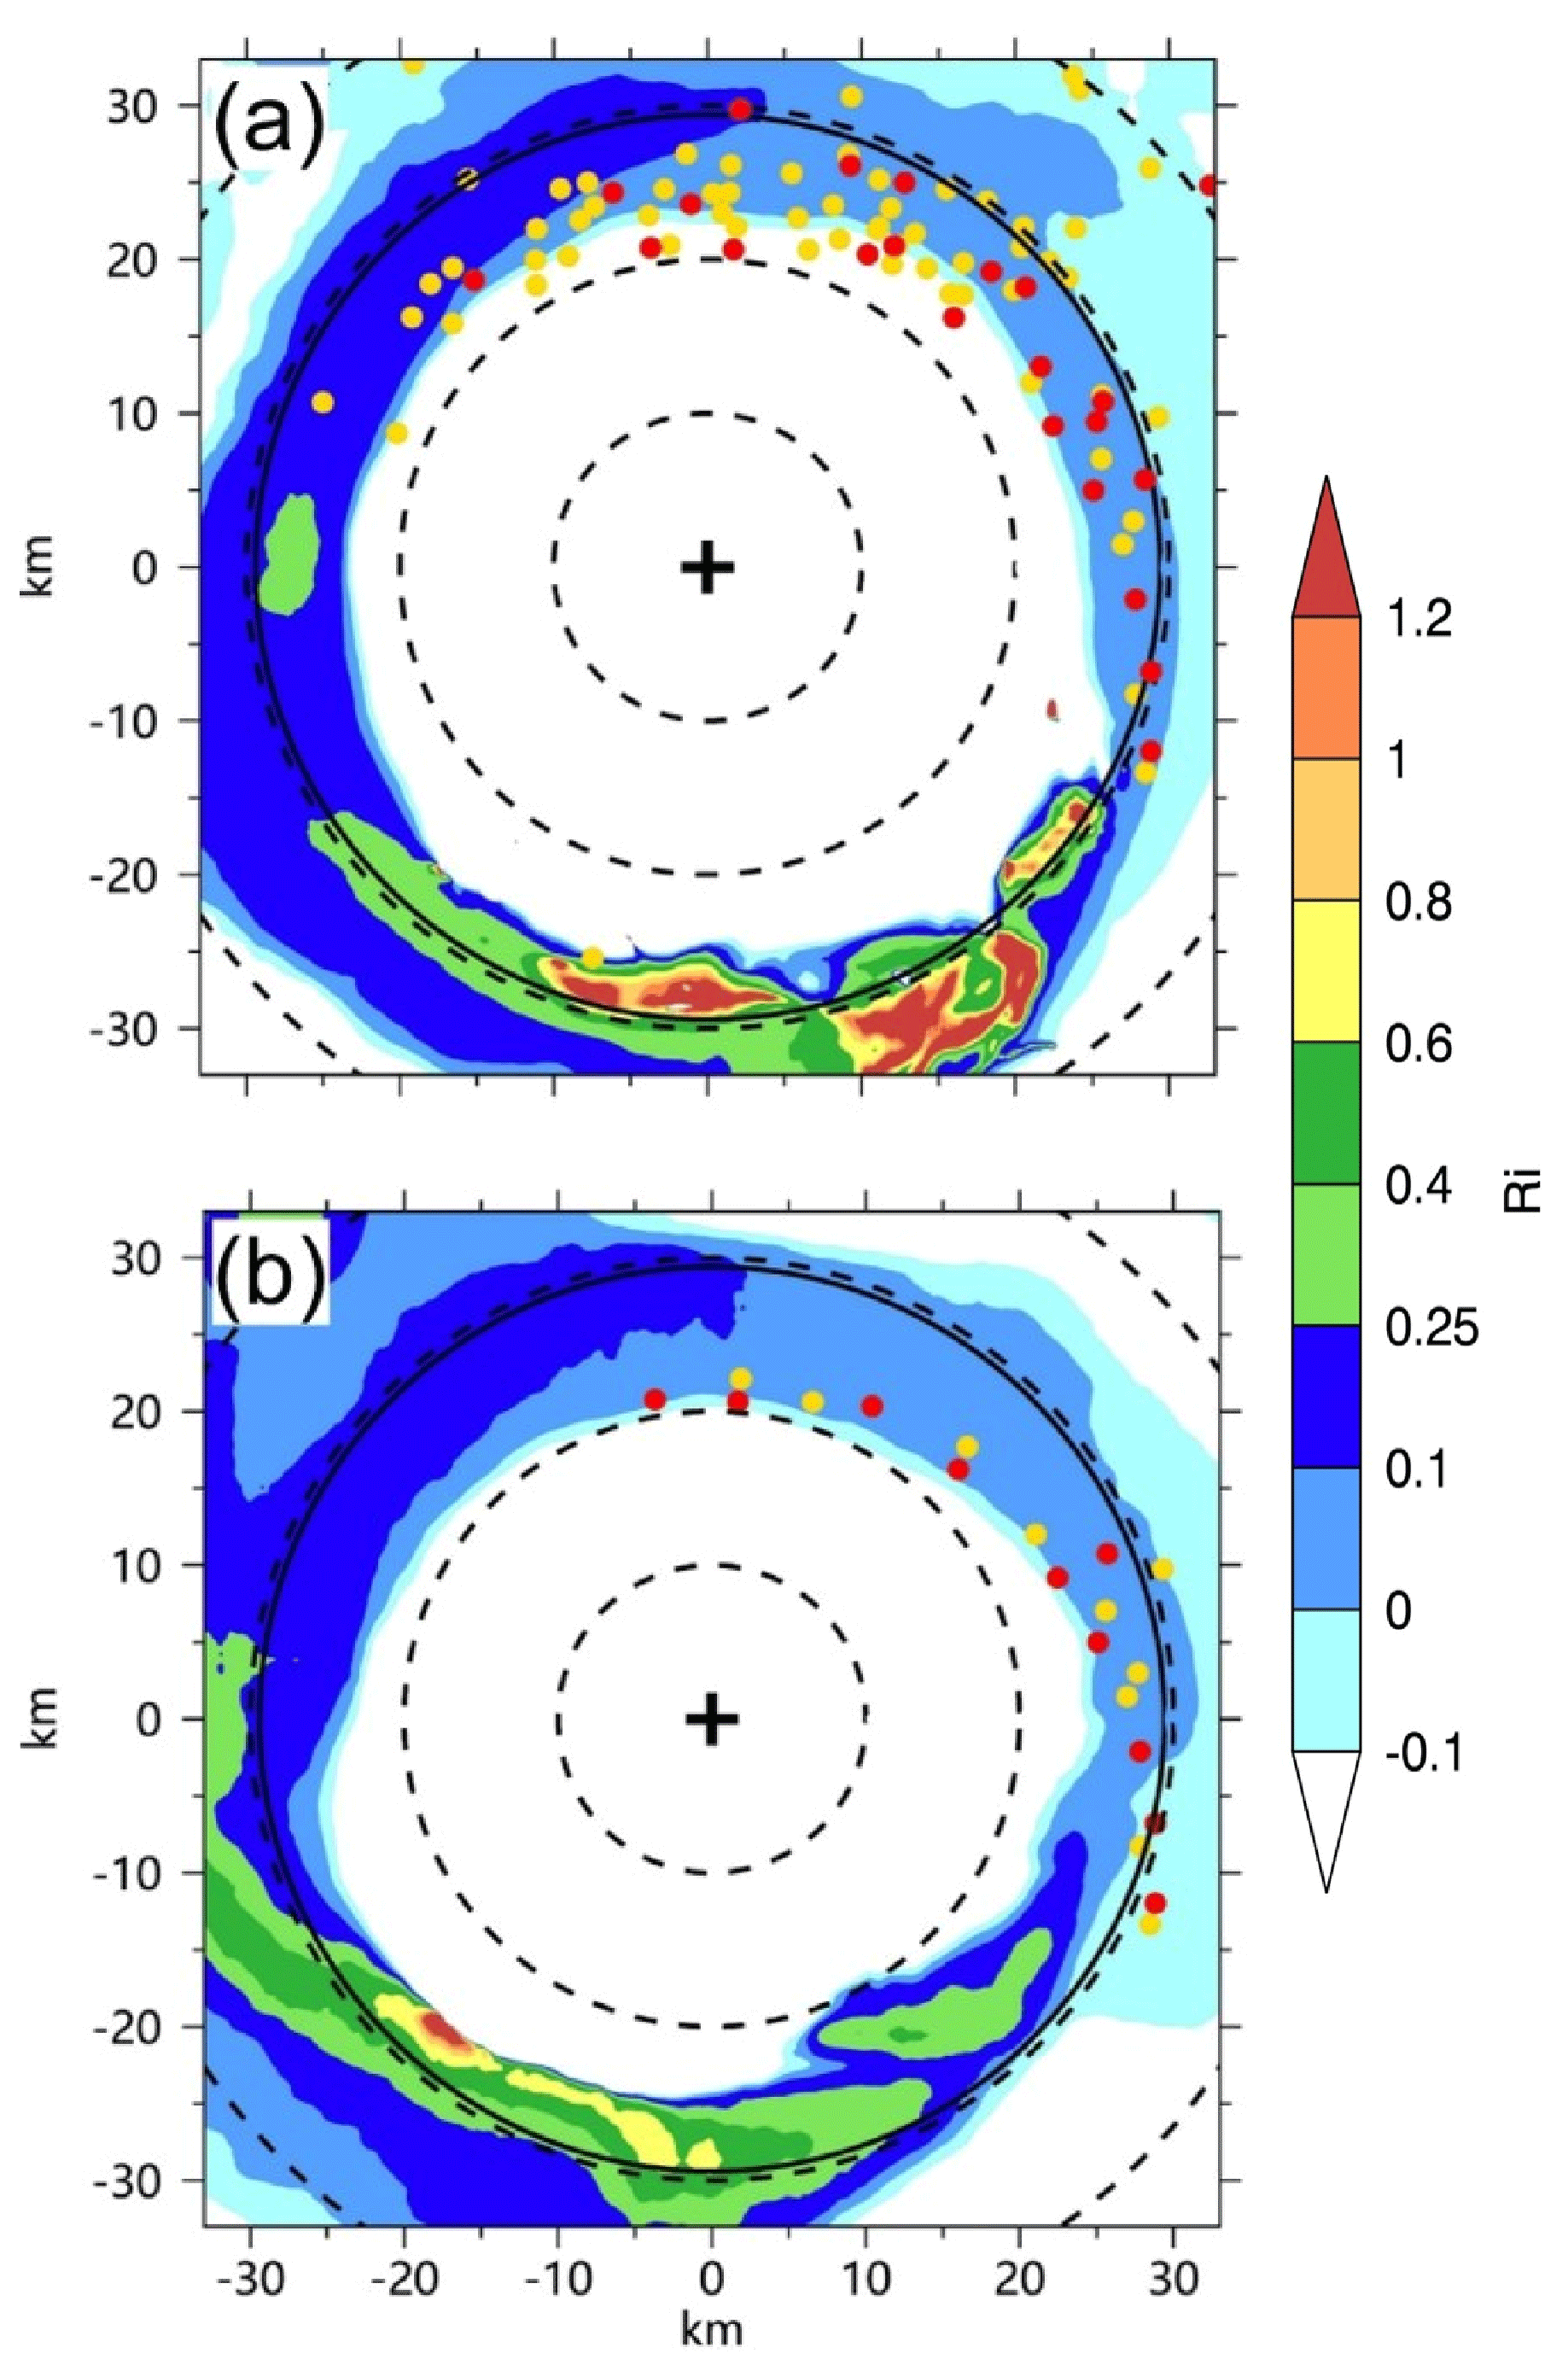
Figure 4(a) Horizontal distribution of the tornado-scale vortices identified with the thresholds of 15 m s−1 (yellow dots) and 20 m s−1 (red dots) in vertical motion and the Richardson number (shading) averaged over 26–36 h; (b) the same as (a), but for 27 h. The solid circle is the 500 m radius of maximum wind and dashed circles indicate the distances from the TC center at 10 km intervals.
Figure 4a shows the location of the maximum vertical motions of the detected tornado-scale vortices including 89 vortices identified with the threshold of maximum vertical motion of 15 m s−1. Different criteria give a similar distribution pattern of tornado-scale vortices; thus we just discuss the 24 tornado-scale vortices defined under the threshold of maximum vertical motion of 20 m s−1 in the following discussion. The tornado-scale vortices exclusively occur in the semicircle with intense convection from the southeast to the northwest (Fig. 2a). Nearly all of the identified cases occur in the inward side of the RMW or close to the RMW (e.g., Stern et al., 2016; Stern and Bryan, 2018), with two exceptions that are located outside of the RMW (Fig. 4a). One is M2901, which is 11.8 km from the RMW, and the other is M3601, which is 7.3 km from the RMW (Table 1). Close examination indicates that these two tornado-scale vortices occur between two high reflectivity bands (not shown).
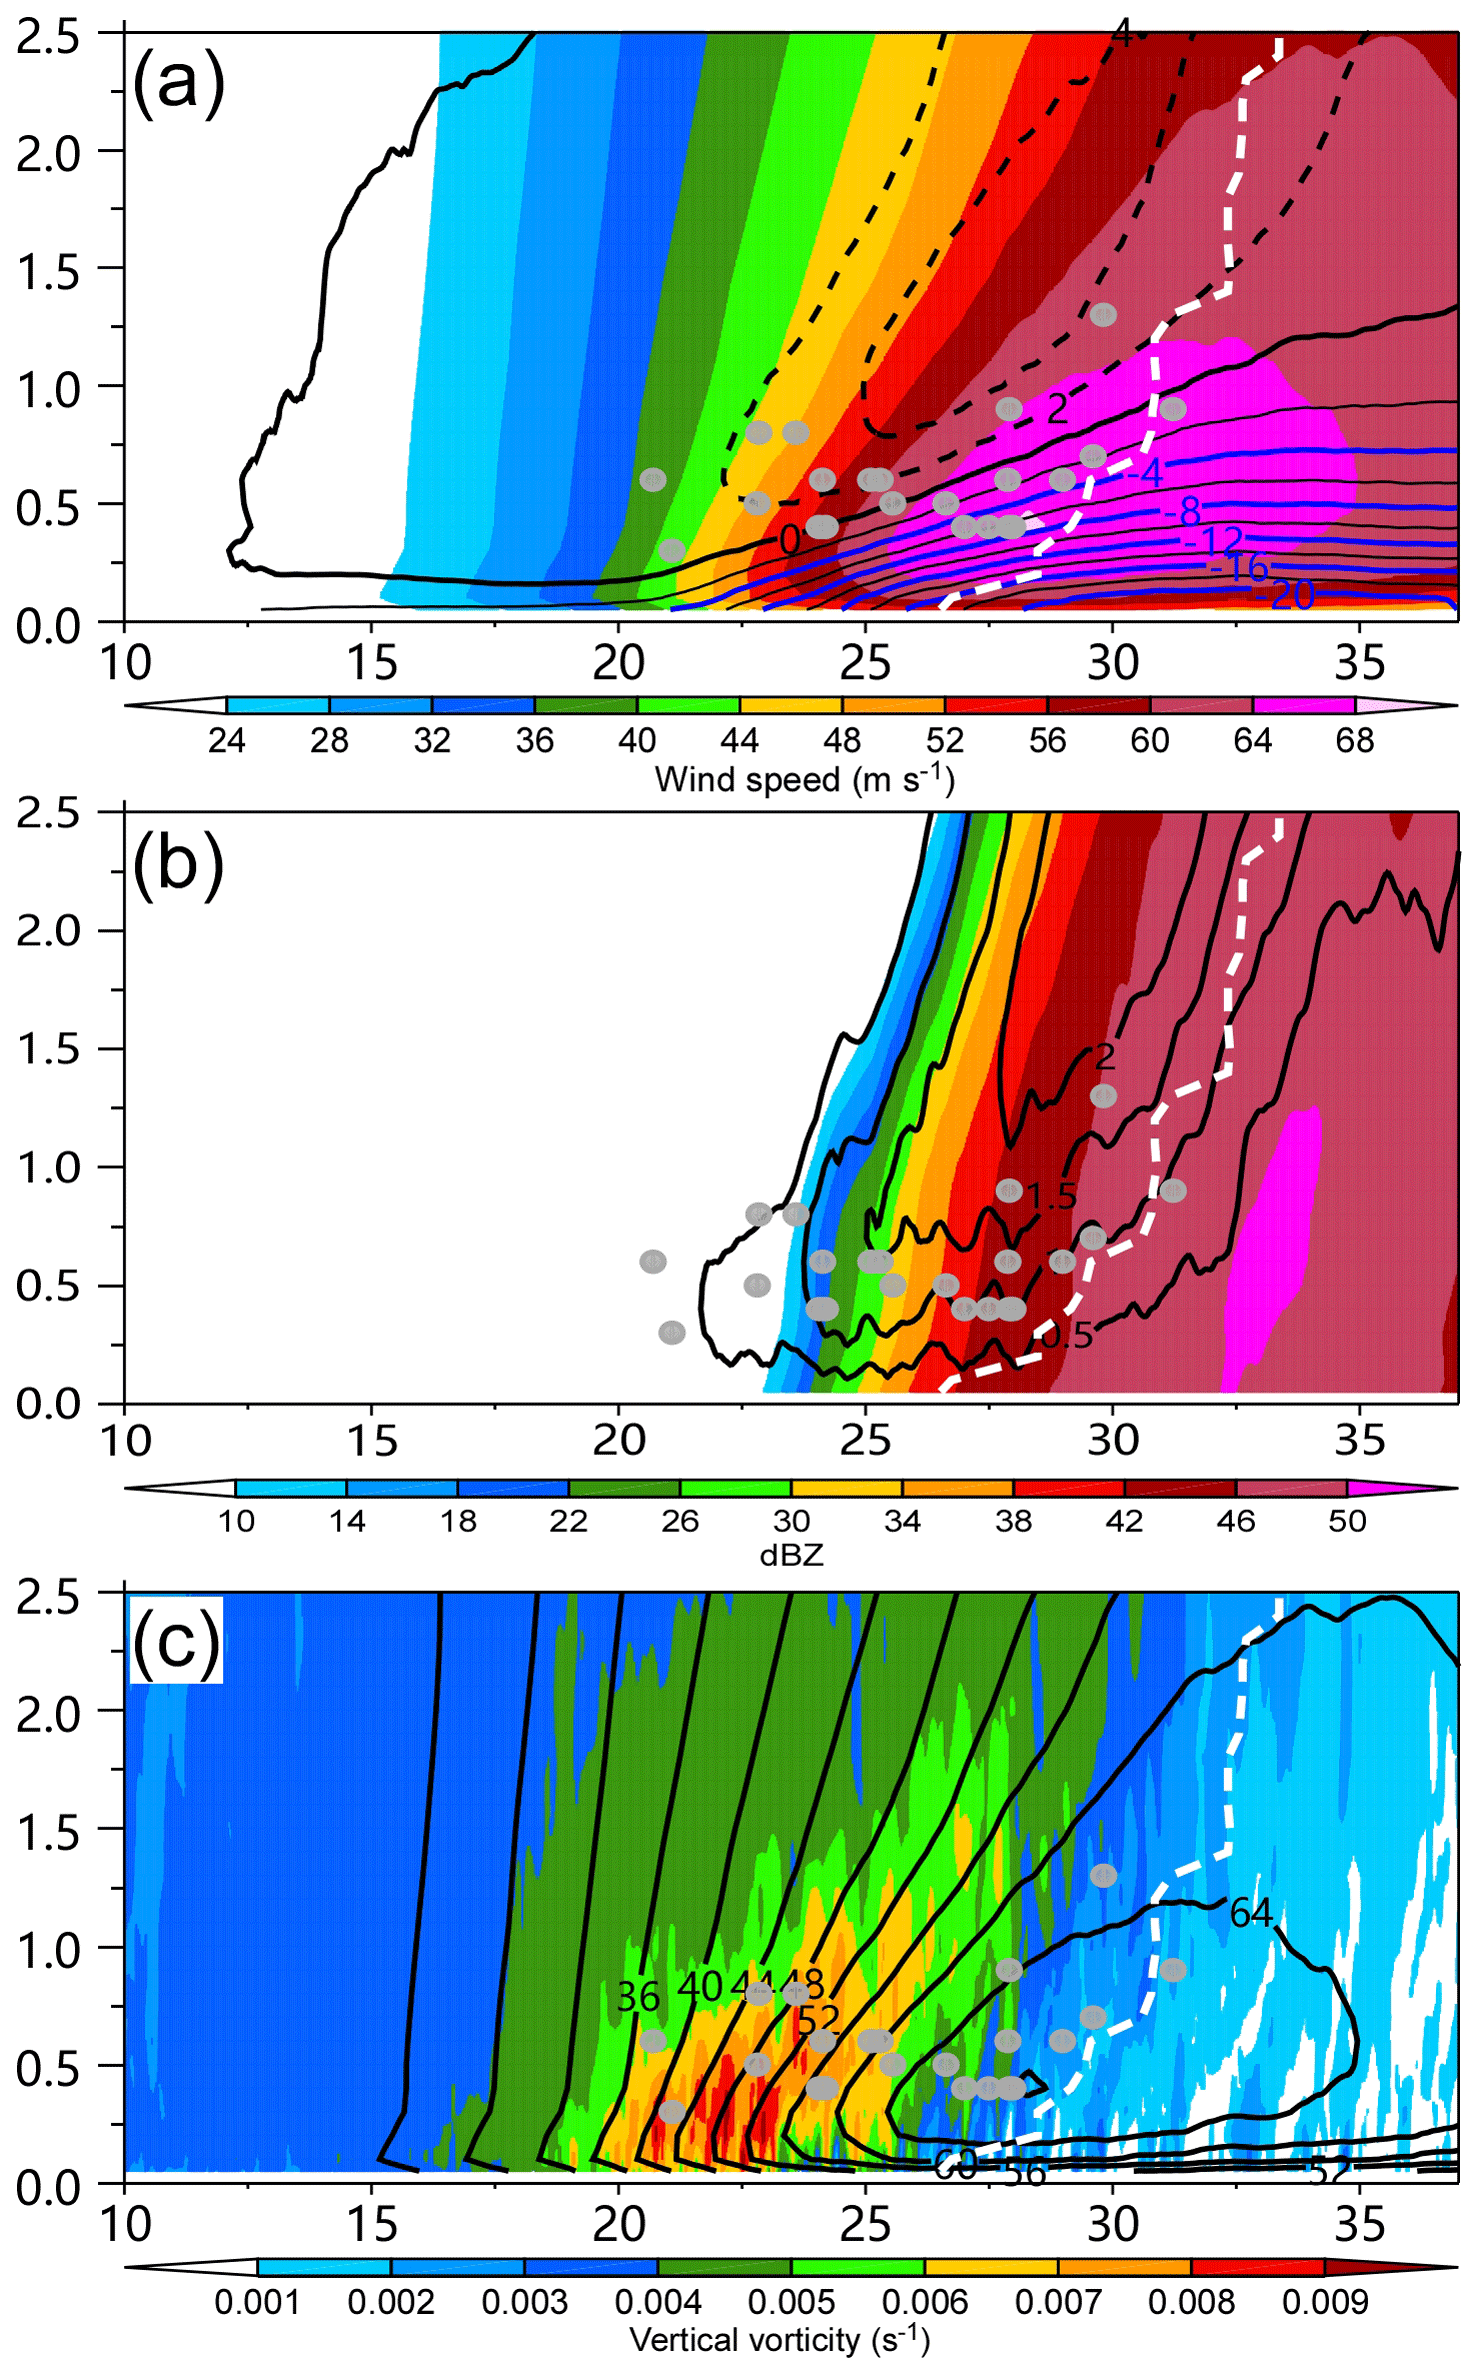
Figure 5Radial–height cross sections of (a) tangential (shading) and radial (contour, interval: 2 m s−1) wind speeds, (b) upward motion (contour, interval: 0.5 m s−1) and radar reflectivity (shading), and (c) tangential wind (contour, interval: 4 m s−1) and the vertical component of relative vorticity (shading, unit: s−1), which are averaged over the northeastern quadrant during 26–36 h. The dots are the locations of identified tornado-scale vortices. The white dashed lines indicate the radius of maximum wind. The vertical and horizontal axes indicate the altitude (km) from the surface and the relative distances (km) from the TC center.
Although the real tornado-scale vortices were observed by chance, they were also associated with the intense radar reflectivity within the hurricane eyewall and sharp horizontal reflectivity gradients (Aberson et al., 2006, 2017; Marks et al., 2008). In agreement with these studies, all of the simulated tornado-scale vortices are associated with sharp horizontal reflectivity gradients and most of them occur in the inner edge of the intense eyewall convection within the RMW. As shown in Fig. 2a, all 10 cases at 27 h are located in the inner edge of the intense reflectivity. It is suggested that the tornado-scale vortex favorably occurs at the inner edge of the intense eyewall convection.
The gradient Richardson number (Ri) has largely been used as a criterion for assessing the stability of stratified shear flow. It is defined by
where is the square of the Brunt–Väisälä frequency, is the square of vertical shear of the horizontal velocity, g is the gravity acceleration, θe is the equivalent potential temperature, u is the zonal wind speed, and v is the meridional wind speed. z is the vertical coordinate. Using the smoothed fields, we also calculate the Richardson number for each tornado-scale vortex (Table 1). It is calculated at each level and then averaged over a layer between 200 and 800 m within a radius of 1.5 km from the location of the maximum vertical motion. The Richardson number is small, and it is negative for seven cases. As suggested by Stern et al. (2016), the strong updraft is mainly within a kilometer of the surface and it is implausible for buoyancy to be the primary mechanism for vertical acceleration. In Fig. 4a, the Richardson number is also plotted, which is averaged over the 10 h period. We can see that the tornado-scale vortices generally occur in the areas with a Richardson number of less than 0.25. It is indicated that the flow in these areas is dynamically unstable and turbulent. The areas coincide with the semicircle of the enhanced eyewall convection. Figure 4b further shows the field of the Richardson number at 27 h. The 10 tornado-scale vortices are all in an environment with a Richardson number of less than 0.1. Since the Richardson number is calculated as the ratio of the moist static stability to the vertical wind shear in the TCBL, we speculate that the strong vertical wind shear in the inward side of the intense eyewall convection is an important factor for the development of tornado-scale vortices.
Figure 5 shows the vertical cross sections of tangential wind, radial wind, vertical motion, reflectivity, and vertical relative vorticity below 2.5 km, which are averaged in the northeast quadrant over a 10 h period. Note that the radial locations of M2901 and M3601 are not shown in Fig. 5 due to the effect of the limited innermost domain on the calculation of the azimuthal mean. Note that there are relatively small changes in the RMW during the 10 h period. The maximum vertical motions associated with the tornado-scale vortices are located inside the tilted RMW between the altitudes of 300 and 1300 m. Most of them (71 %) are found between 400 and 600 m. The height of the maximum vertical motions becomes higher when the inflow layer deepens outward. Figure 5b and c further indicate that the tornado-scale vortices are generally found in the region of strong vertical motion averaged over the northeastern quadrant, where the vortices are detected, and large vertical relative vorticity with a sharp horizontal reflectivity gradient on the inward side of the eyewall.
Using the high-resolution model output, we can explore the structural features of the simulated tornado-scale vortex. After examination of all 24 identified tornado-scale vortices, we find that they can be classified into three categories based on their vertical structure, especially in terms of their vertical extent, stratification, and near-surface wind jump.

Figure 6(a) The streamlines of the horizontal perturbation winds for M2701 and the wind speed (shading) at the altitude of 10 m. (b) The nearly vertical slice of the perturbation winds for M2701 with the red oval indicating the updraft–downdraft couplet. (c) The streamlines of the three-dimensional perturbation wind for M2701. The warm (cold) color of the streamline indicates the upward (downward) vertical velocity perturbation and the vectors show the near-surface wind fields. The vertical and horizontal axes indicate the altitude (km) from the surface and the relative distances (km) from the nearest corner, respectively.
The first category includes 17 cases, accounting for 71 % of the total. Their structural features can be represented by M2701, one of the four strongest tornado-scale vortices, located 4.3 km inward from the 500 m RMW (Table 1). In fact, the four strongest belong to the same category. In this category, nearly all of the maximum vertical motions occur around the altitude of 500 m, except M3001. The maximum vertical motion of M2701 is 31.98 m s−1 at the altitude of 400 m, while the maximum vertical relative vorticity of 0.55 s−1 occurs at 200 m (Table 1). The 3-D structure of the tornado-scale vortex can be clearly demonstrated by the streamlines of perturbation winds near the strong updraft (Fig. 6). The flows curl cyclonically upward from the surface (Fig. 6a). The tornado-scale vortex is manifested by a small-scale circulation extending upward to ∼1.5 km. In addition, the tornado-scale vortex is closely associated with updraft–downdraft couplets (Fig. 6b). Figure 6c shows that the tornado-scale vortex is a complex twisted vortex system. The system has strong horizontal circulation below 1 km and it turns into vertical circulation as the height increases. So it contains both strong horizontal and vertical circulations.
Figure 7 shows the vertical cross section of vertical motion, equivalent potential temperature, and simulated radar reflectivity along the line in Fig. 3b for M2701. The inflow from the outward side and the outflow from the eye side converge near the surface to the strong updraft that is below ∼1.5 km. On the top of the updraft, there is a layer of high equivalent potential temperature (θe) (Fig. 7b). To the eye side of the updraft, there is a high-θe layer below ∼1.5 km. The high-θe layer tilts upward and extends outward. The large radar reflectivity can be found below the high-θe layer (Fig. 7c). The intense updraft is located in the inner edge of the large radar reflectivity region. In addition, as suggested by Aberson et al. (2006) and Marks et al. (2008), the strong updraft is within a saturated layer (Fig. 8a), coinciding with high vertical relative vorticity (Fig. 8c).
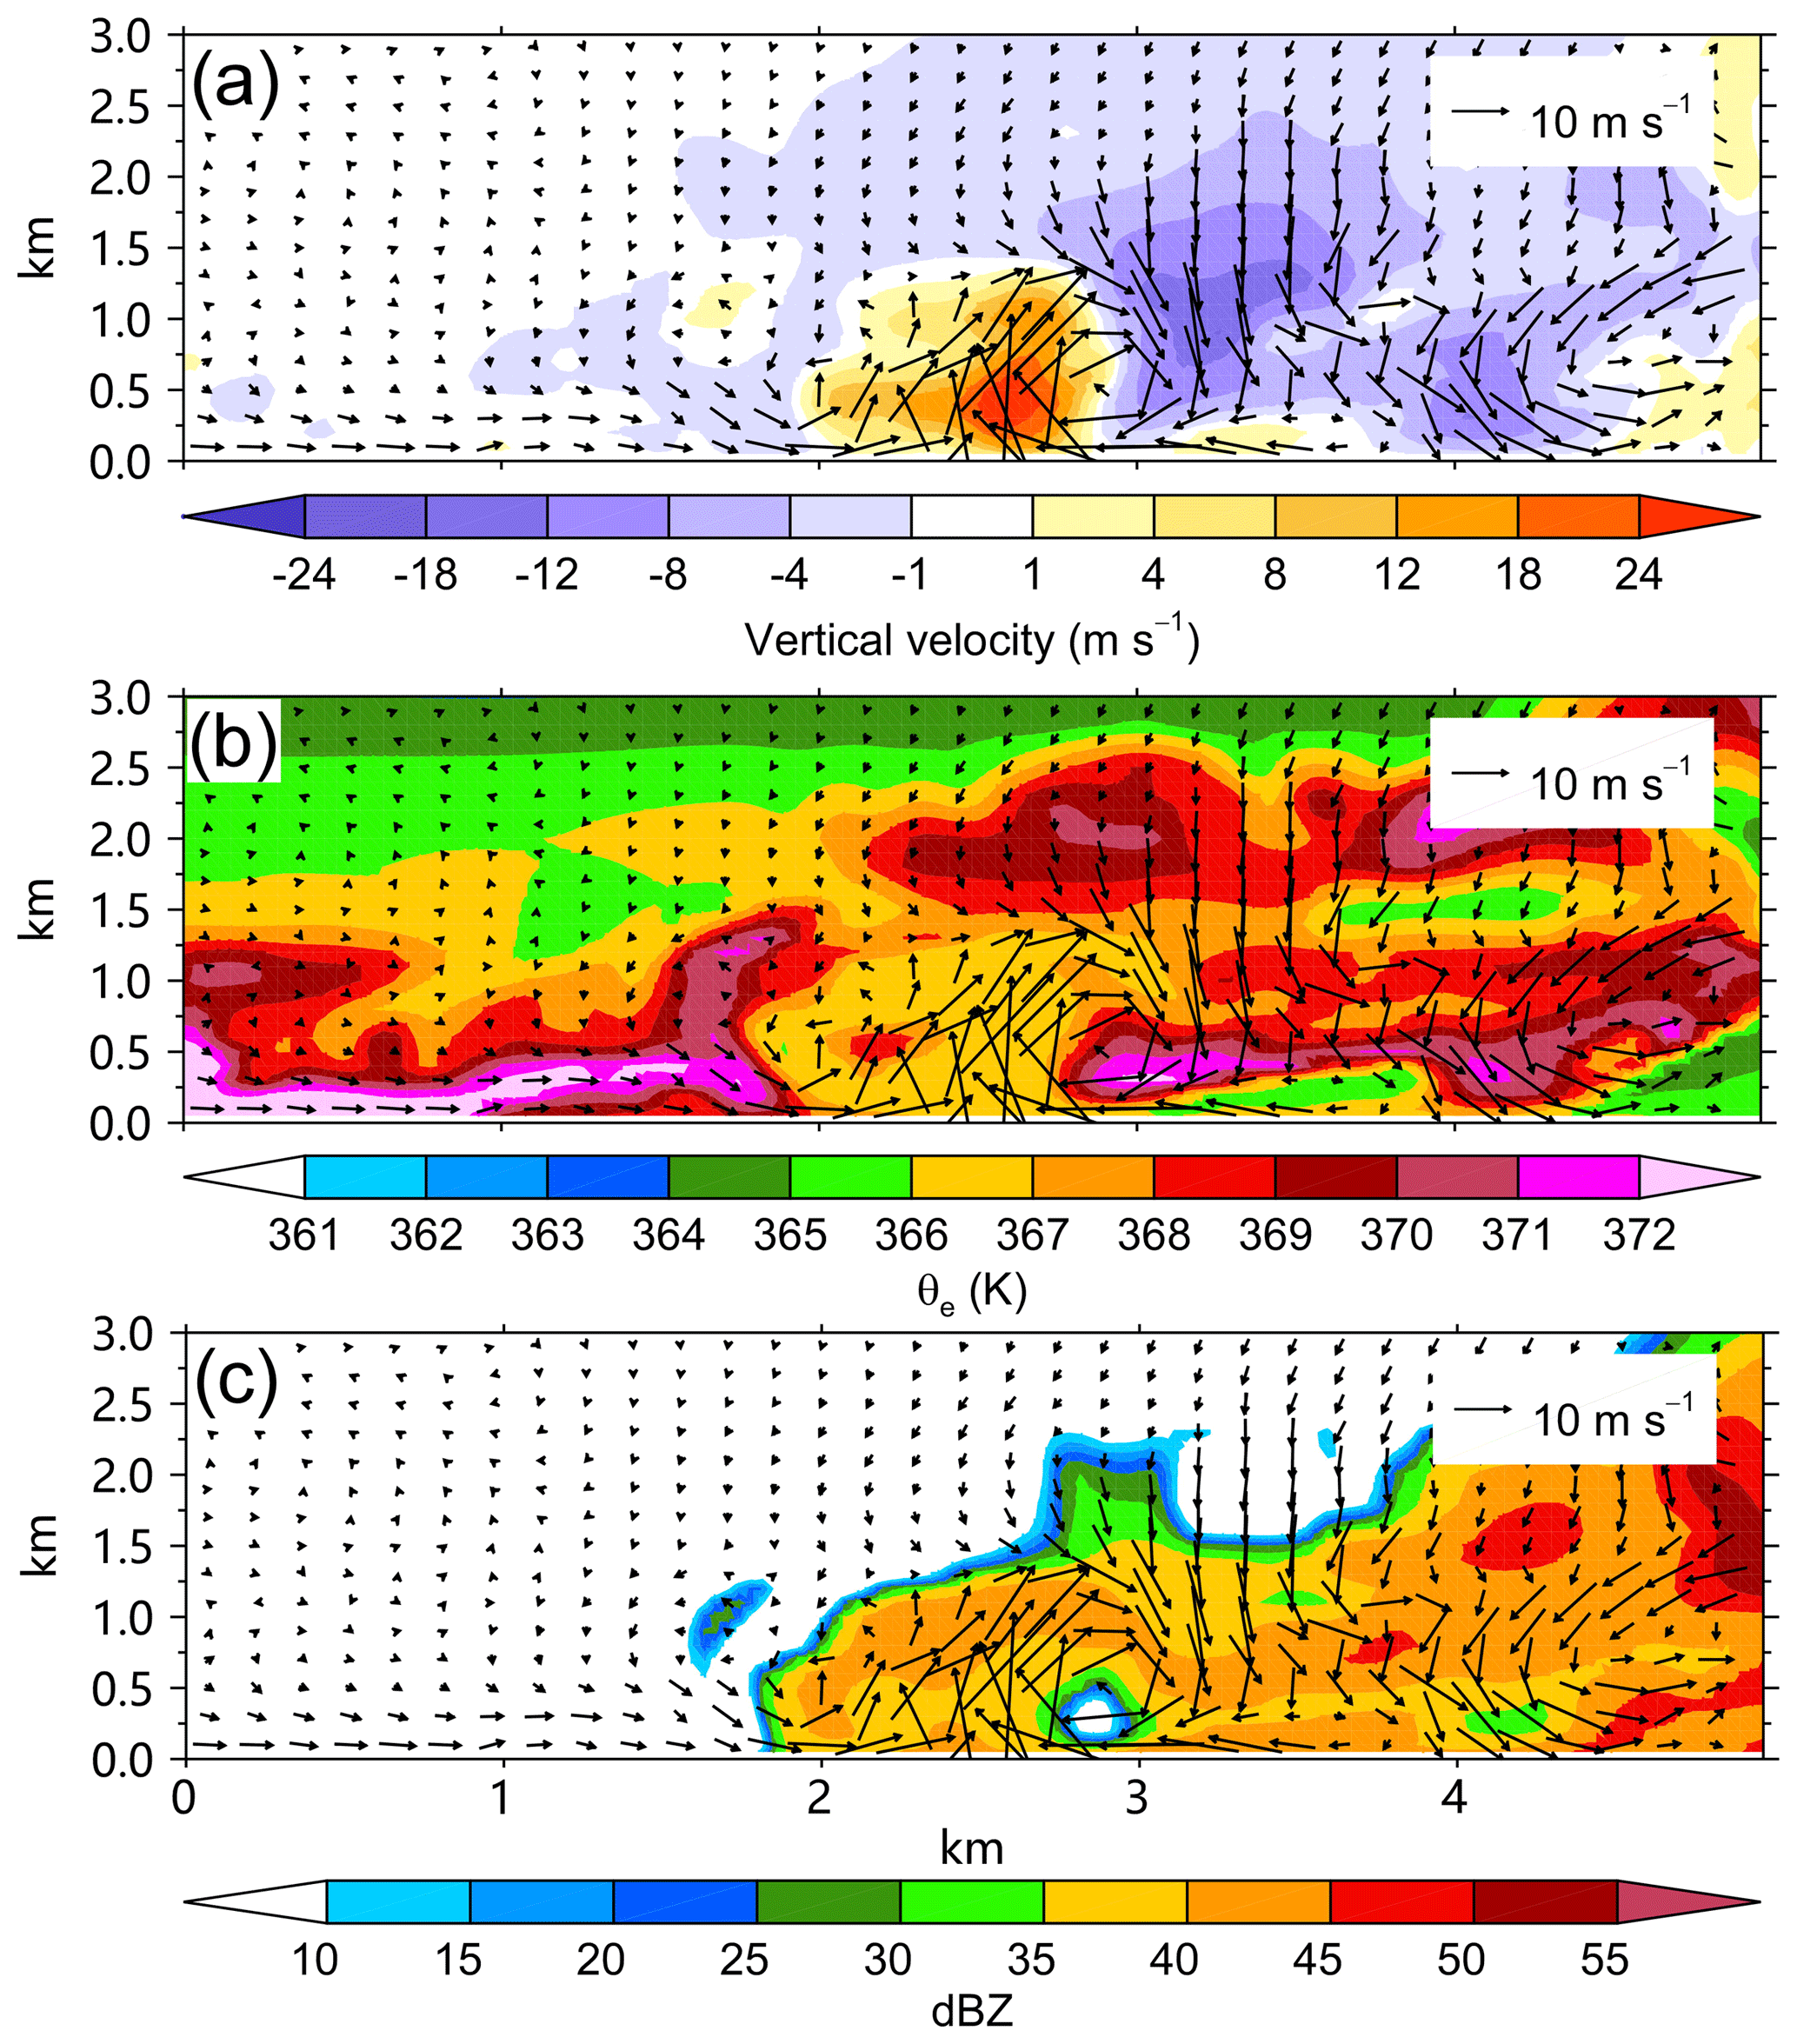
Figure 7The radial–height cross sections of the perturbation winds (vector) and (a) perturbation vertical motion, (b) equivalent potential temperature, and (c) radar reflectivity (shading) for M2701 along the line in Fig. 3b. The abscissa indicates the relative outward distance.
To the right of the updraft (Fig. 7b), another high-θe layer can be seen at the altitude of ∼500 m. We check other cases in this category of vortices and find that the lower-altitude high-θe layer is not always present. The downward motion at ∼500 m may be responsible for the lower-altitude high-θe layer. The relatively low θe near the surface corresponds to the inflow layer. The high-θe air meets with the cold inflow air, resulting in relatively lower θe in the strong updraft. It is indicated that the high-θe air in the eye is locally entrained into the TC eyewall.
Some previous studies have shown that the quasi-linear bands are closely associated with the horizontal rolls in the TC boundary layer, with alternating upward and downward momentum transport on either side of the rolls (Wurman and Winslow, 1998; Katsaros et al., 2002; Morrison et al., 2005; Lorsolo et al., 2008; Ellis and Businger, 2010; Foster, 2013). To demonstrate the relationship, Fig. 8b shows the radial profile of winds along the line shown in Fig. 3b and the corresponding wind speeds at 10 and 400 m. The figure clearly shows that the wind speed fluctuations at 10 m are associated with the changes of the vertical motions in Fig. 7a. The wind speed jump (Fig. 8b) is significant across the intense updraft (Fig. 7a). At 10 m, the wind speed suddenly increases from ∼30 to ∼60 m s−1. Note that the wind speed jump is larger at 400 m, ranging from ∼35 to ∼95 m s−1. Marks et al. (2008) reported that the wind speed at 450 m in altitude increased rapidly from <40 to 89 m s−1 in Hurricane Hugo (1989) when the NOAA research aircraft encountered an EVM. We argue that the superposition of the horizontal cyclonic circulation of the tornado-scale vortices plays an important role in enhancing wind gusts on its radially outward side.
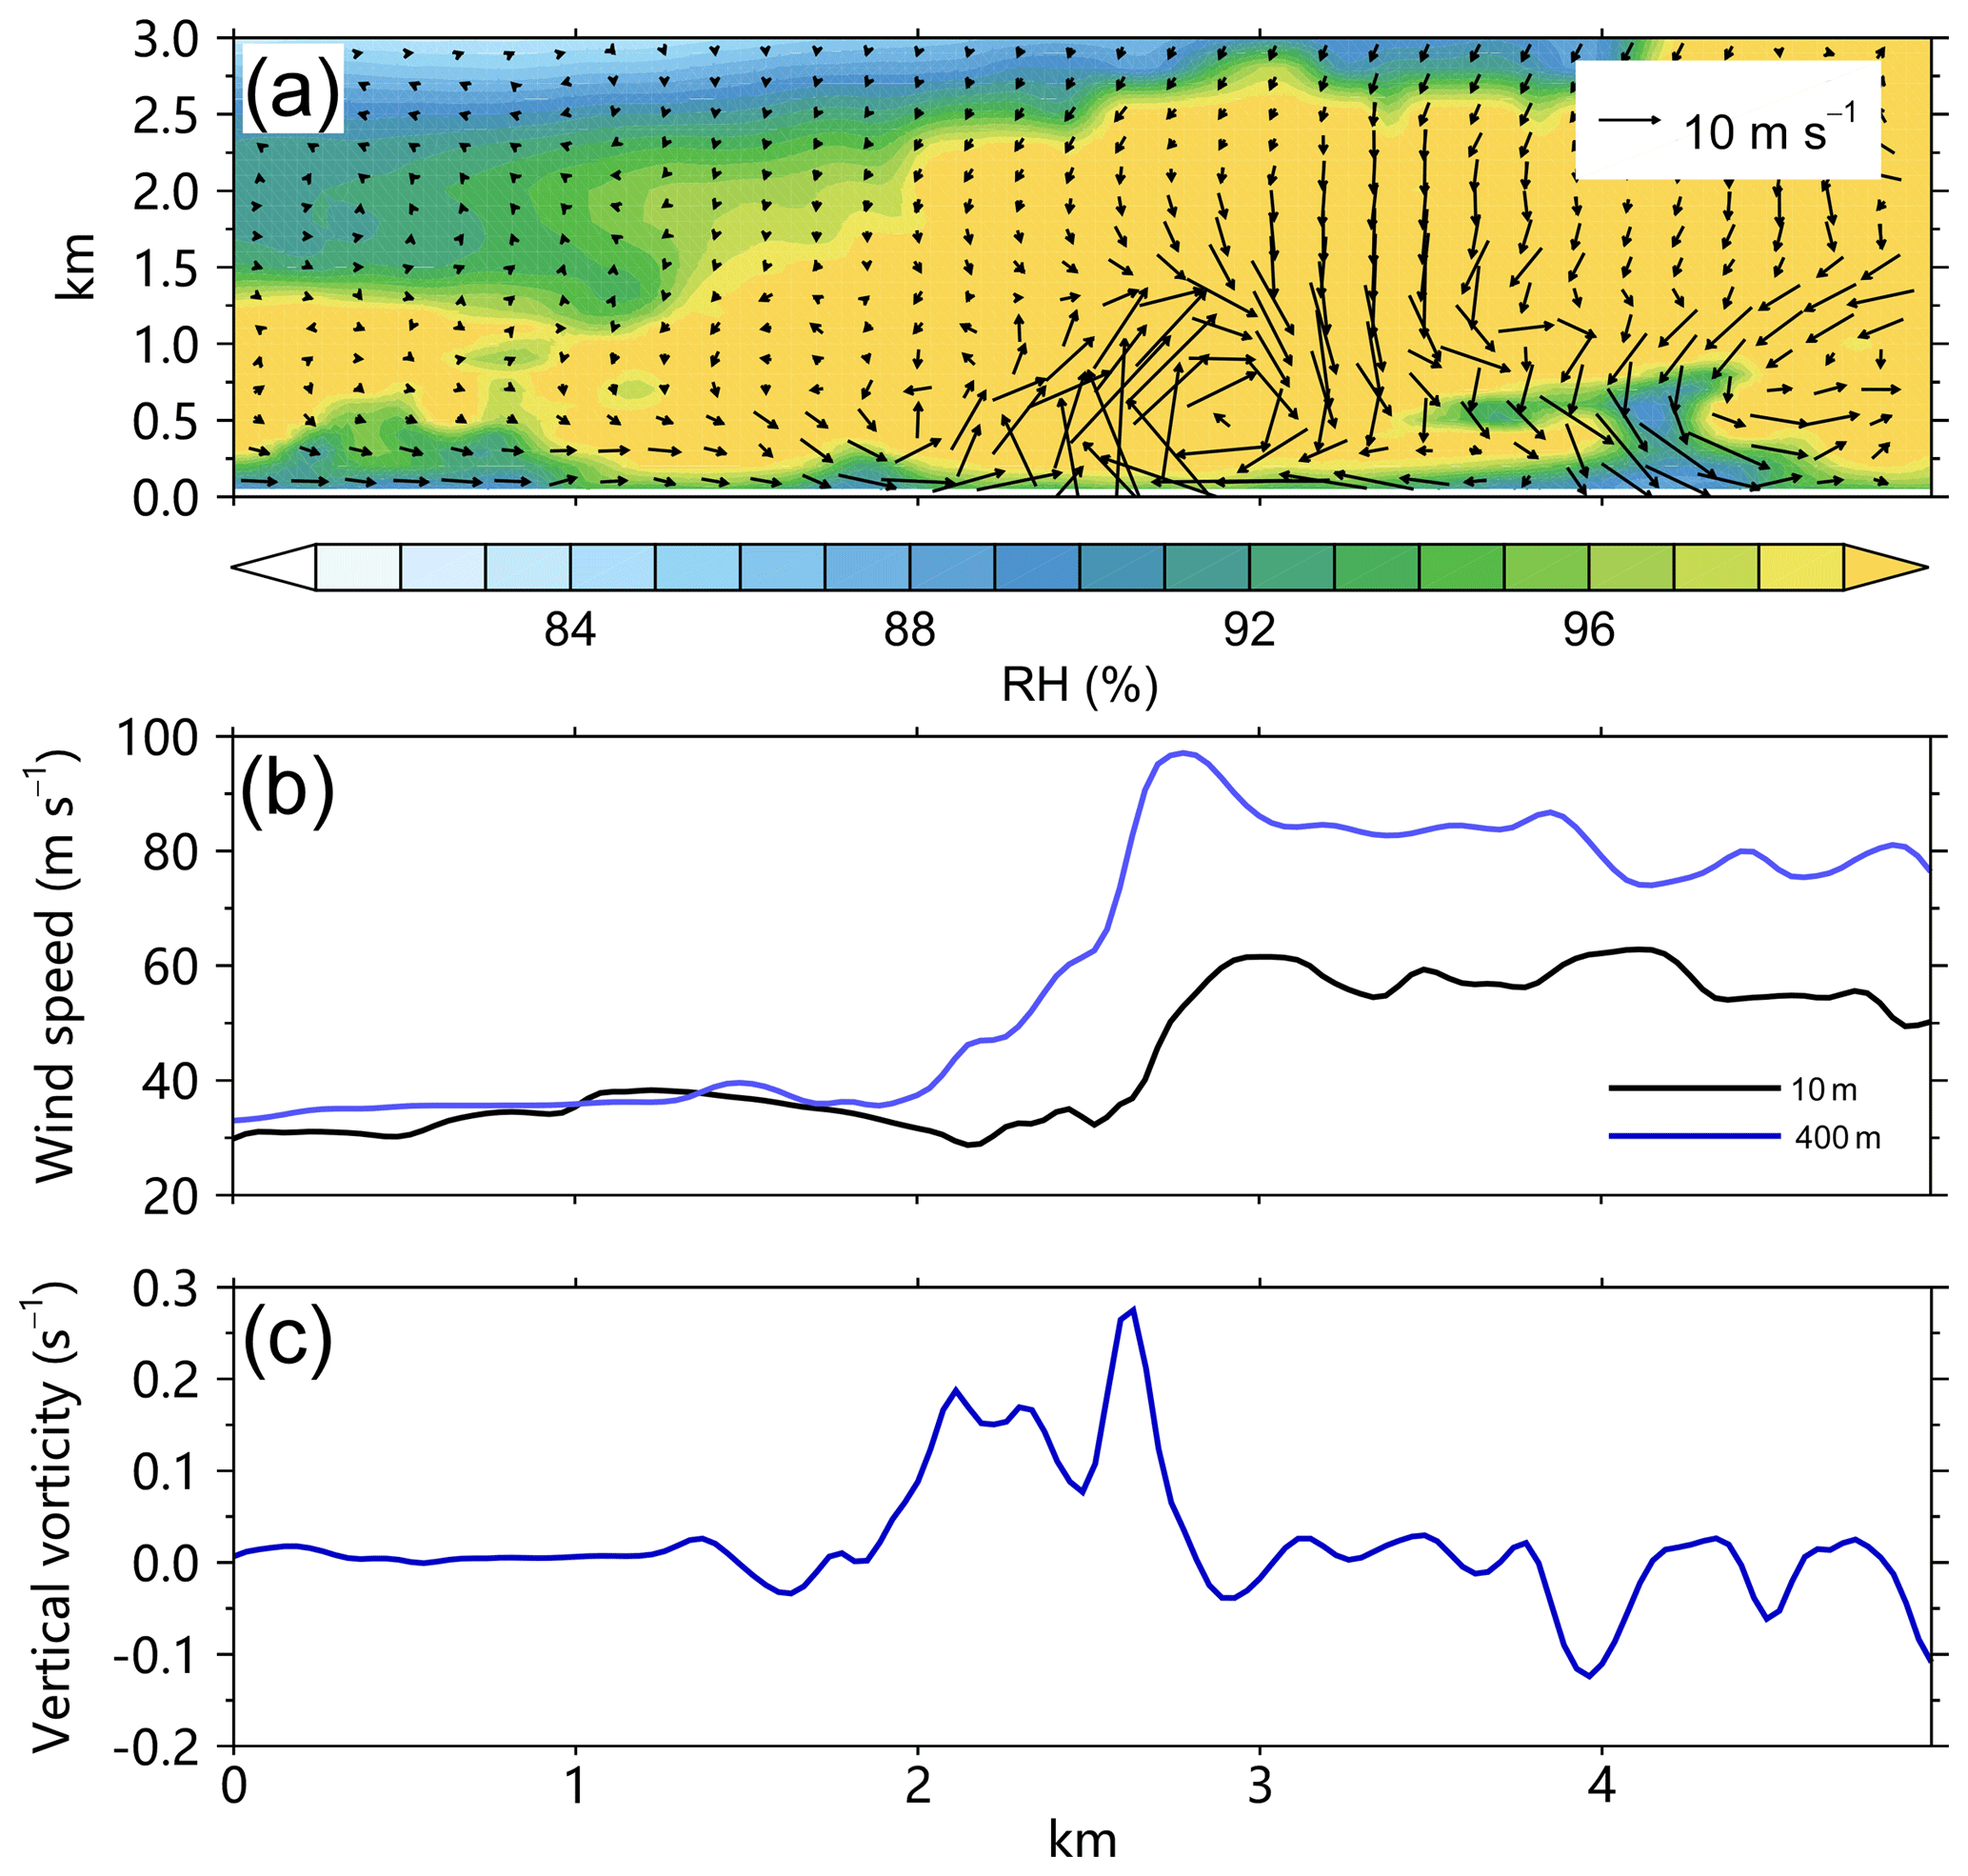
Figure 8(a) The radial–height cross section of perturbation winds (vector) and relative humidity (shading) for M2701, (b) the 400 m (blue) and 10 m (black) wind speeds, and the 400 m vertical relative vorticity for M2701 along the line in Fig. 3b. The abscissa indicates the relative outward distance.
There are three tornado-scale vortices in the second category, including M2706, M2707, and M2708. The structural features can be represented by M2708. In M2708, the maximum vertical motion and vertical relative vorticity occur at 900 and 800 m, respectively (Table 1). The vertical motion of more than 8 m s−1 extends vertically from near the surface to ∼2 km (Fig. 9a). In this category, we cannot see the warm air with high θe (Fig. 9b) and the strong updraft is located in a statically unstable stratification (Table 1). The wind speed at the altitude of 900 m varies by ∼20 m s−1 across the updraft, while the wind speed gradient is relatively weak at 10 m (Fig. 9c).
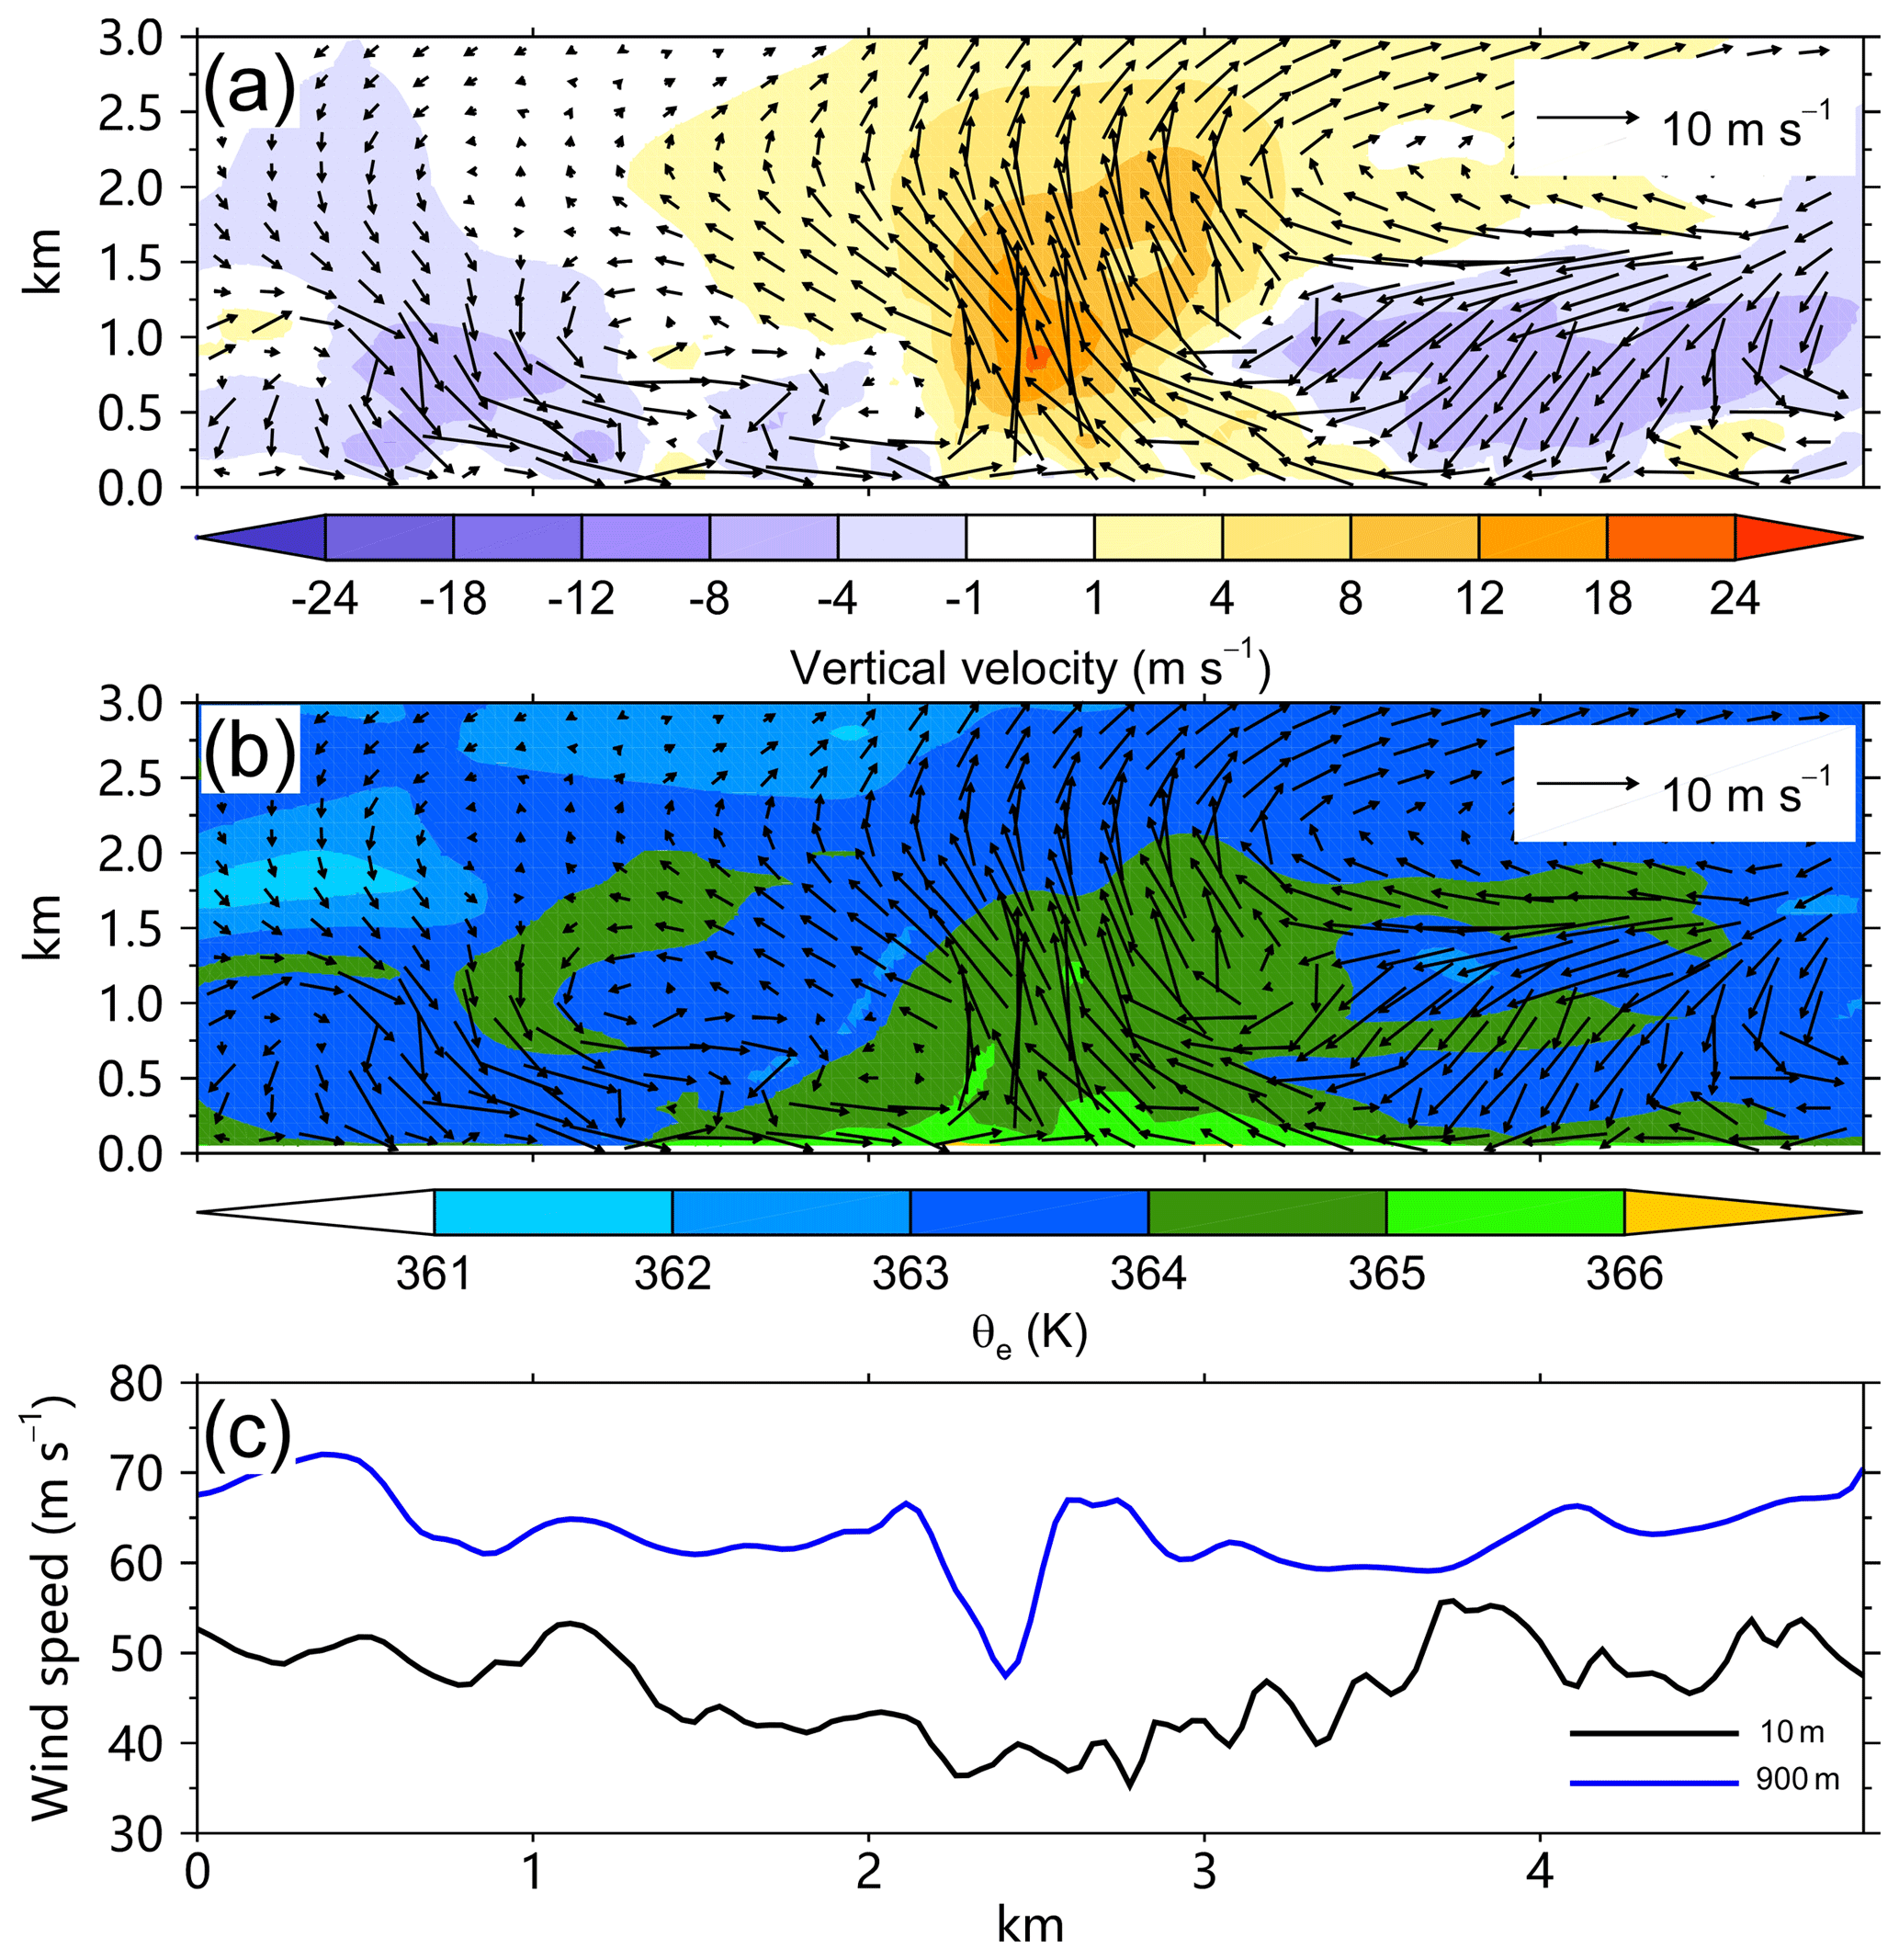
Figure 9The radial–height cross sections of the perturbation winds (vector) and (a) perturbation vertical motion, (b) equivalent potential temperature for M2708, and (c) the corresponding 900 m (blue) and 10 m (black) wind speeds. The abscissa indicates the relative outward distance.
The third category includes four cases: M2600, M2703, M2705, and M3002, in which the updraft occurs in a statically stable stratification (Table 1). Here we use M3002 as an example to show its vertical structure. As shown in Fig. 10a, the updraft is elevated between 0.5 and 2 km. The maximum vertical motion and relative vorticity are found at the altitude of 1300 m. In this category, a pronounced feature is the deep low-θe (less than 364 K) layer in the inflow layer (Fig. 10b). As shown in Fig. 10c, the gradient of the wind speed at 10 m is not clear while there is a speed jump of ∼30 m s−1 in the vicinity of the updraft at 1300 m.

Figure 10The radial–height cross sections of the perturbation winds (vector) and (a) perturbation vertical motion, (b) equivalent potential temperature for M3002, and (c) the corresponding 1300 m (blue) and 10 m (black) wind speeds. The abscissa indicates the relative outward distance.
Previous studies suggest that the horizontal resolution should be below 100 m to simulate the development of 3-D turbulent eddies in the TCBL (Rotunno et al., 2009; Green and Zhang, 2015). Based on our numerical experiment, the tornado-scale vortex can be successfully simulated with the grids at the resolution of 37 m. It should be noted that we have 12 vertical levels below 1 km. Vertical resolution in the innermost domain is relatively coarse compared to the horizontal spacing of 37 m. We also conducted an experiment (not shown) with the innermost domain resolution of 111 m. In this experiment, the vertical resolution and horizontal resolution are comparable in the TC boundary layer, and the tornado-scale vortices can also be found in the experiment. At this time, we are not sure if these three categories represent different phases in the life cycle of these coherent structures, and since the 3 s output does not contain the thermodynamic variables, we cannot examine the hydrostatic stratification.
A tornado-scale vortex or EVM in the TCBL has been observed in intense hurricanes and is always associated with strong turbulence. To understand the complicated interactions of the large-scale background flow, TC vortex, mesoscale organization, and fine-scale turbulent eddies, a numerical experiment in which a TC evolves in a typical large-scale background over the western North Pacific is conducted using the WRF–LES framework with six nested grids. The simulated tornado-scale vortex shows features similar to those revealed with limited observations. It is suggested that the WRF–LES framework can successfully simulate the tornado-scale vortex with the grids at the resolution of 37 m that covers the TC eye and eyewall.
Following Wu et al. (2018), the tornado-scale vortex can be defined as a small-scale cyclonic circulation with a maximum vertical motion of no less than 20 m s−1 and maximum vertical relative vorticity no less than 0.2 s−1. A total of 24 tornado-scale vortices can be identified at the 11 hourly output times. Nearly all of them are within or close to the RMW. Most of them occur in the inward side of the intense eyewall convection, mostly below the altitude of 2 km. Tornado-scale vortices are mostly in neutral or stable stratification within the saturated high-θe layer. The tornado-scale vortex generally occurs in the areas with a Richardson number of less than 0.25. We speculate that the strong vertical wind shear in the inward side of the intense eyewall convection is an important factor for the development of tornado-scale vortices.
The simulated tornado-scale vortex has a small horizontal scale of 1–2 km in the TCBL. It is accompanied by strong updrafts and a cyclonic circulation with large vertical components of relative vorticity. The tornado-scale vortex is closely associated with horizontal rolls. In nearly all of the simulated tornado-scale vortex cases, the narrow intense updraft is coupled with the relatively broad downdraft (figures not shown), constituting an updraft–downdraft couplet or horizontal rolling vortex, as observed by the research aircraft. Since the tornado-scale vortex is associated with intense updrafts and strong wind gusts, its presence can pose a severe threat to the eyewall penetration of manned research aircraft, and the strong wind gusts associated with tornado-scale vortices can pose a severe risk to coastal life and property.
Due to the large number, the simulation data are available on request. Please contact the corresponding author.
LW designed research; LW, QL, and YL performed research; LW, QL, and YL analyzed data; and LW wrote the paper.
The authors declare that they have no conflict of interest.
We thank Ping Zhu of Florida International University for aiding with the
WRF–LES framework. This research was jointly supported by the National Basic
Research Program of China (2015CB452803), the National Natural Science
Foundation of China (41730961, 41675051, 41675009), and Jiangsu Provincial
Natural Science Fund Project (BK20150910). The numerical simulation was
carried out on the Tianhe Supercomputer, China.
Edited by: Yun Qian
Reviewed by: five
anonymous referees
Aberson, S. D., Black, M., Montgomery, M. T., and Bell, M.: Hurricane Isabel (2003): New Insights Into the Physics of Intense Storms. Part II: Extreme Localized Wind, B. Am. Meteorol. Soc., 87, 1335–1348, 2006.
Aberson, S. D., Zhang, J. A., and Ocasio, K. N.: An Extreme Event in the Eyewall of Hurricane Felix on 2 September 2007, Mon. Weather Rev., 145, 2083–2092, 2017.
Braun, S. A. and Tao, W.-K.: Sensitivity of High-Resolution Simulations of Hurricane Bob (1991) to Planetary Boundary Layer Parameterizations, Mon. Weather Rev., 128, 3941–3961, 2000.
Braun, S. A. and Wu, L.: A Numerical Study of Hurricane Erin (2001). Part II: Shear and the Organization of Eyewall Vertical Motion, Mon. Weather Rev., 135, 1179–1194, 2007.
Bryan, G. H.: Effects of surface exchange coefficients and turbulence length scales on the intensity and structure of numerically simulated hurricanes. Mon. Weather Rev., 140, 1125–1143, 2012.
Bryan, G. H. and Rotunno, R.: The influence of near-surface, high-entropy air in hurricane eyes on maximum hurricane intensity, J. Atmos. Sci., 66, 148–158, 2009.
Bryan, G. H., Stern, D. P., and Rotunno, R.: A Framework for Studying the Inner Core of Tropical Cyclones Using Large Eddy Simulation, 31st Conference on Hurricanes and Tropical Meteorology, Am. Meteorol. Soc., San Diego, Calif., 2014.
Duchon, C. E.: Lanczos filtering in one and two dimensions, J. Appl. Meteorol., 18, 1016–1022, 1979.
Dudhia, J.: Numerical study of convection observed during the winter monsoon experiment using a mesoscale two-dimensional model, J. Atmos. Sci., 46, 3077–3107, 1989.
Ellis, R. and Businger, S.: Helical Circulations in the Typhoon Boundary Layer, J. Geophys. Res., 115, D06205, https://doi.org/10.1029/2009JD011819, 2010.
Foster, R.: Why rolls are prevalent in the hurricane boundary layer, J. Atmos. Sci., 62, 2647–2661, 2005.
Foster, R.: Signature of Large Aspect Ratio Roll Vortices in Synthetic Aperture Radar Images of Tropical Cyclones, Oceanography, 26, 58–67, 2013.
Frank, W. M. and Ritchie, E. A.: Effects of vertical wind shear on the intensity and structure of numerically simulated hurricanes, Mon. Weather Rev., 129, 2249–2269, 2001.
Gao, K. and Ginis, I.: On the Generation of Roll Vortices due to the Inflection Point Instability of the Hurricane Boundary Layer Flow, J. Atmos. Sci., 71, 4292–4307, 2014.
Gao, K., Ginis, I., Doyle, J. D., and Jin, Y.: Effect of Boundary Layer Roll Vortices on the Development of an Axisymmetric Tropical Cyclone, J. Atmos. Sci., 74, 2737–2759, 2017.
Green, B. W. and Zhang, F.: Sensitivity of Tropical Cyclone Simulations to Parametric Uncertainties in Air–Sea Fluxes and Implications for Parameter Estimation, Mon. Weather Rev., 142, 2290–2308, 2014.
Green, B. W. and Zhang, F.: Numerical simulations of Hurricane Katrina (2005) in the turbulent gray zone, J. Adv. Model. Earth Sy., 7, 142–161, 2015.
Hong, S.-Y. and Lim, J.-O. J.: The WRF single-moment 6-class microphysics scheme (WSM6), J. Korean Meteor. Soc., 42, 129–151, 2006.
Ito, J., Oizumi, T., and Niino, H.: Near-surface coherent structures explored by large eddy simulation of entire tropical cyclones, Sci. Rep.-UK, 7, 3798, https://doi.org/10.1038/s41598-017-03848-w, 2017.
Kain, J. S. and Fritch, J. M.: Convective parameterization for mesoscale models: The Kain–Fritch scheme, The Representation of Cumulus Convection in Numerical Models, Meteor. Monogr., Am. Meteorol. Soc., 46, 165–170, 1993.
Katsaros, K. B., Vachon, P. W., Liu, W. T., and Black, P. G.: Microwave remote sensing of tropical cyclones from space, J. Oceanogr., 58, 137–151, 2002.
Kosiba, K., Wurman, J., Masters, F. J., and Robinson, P.: Mapping of Near-Surface Winds in Hurricane Rita Using Finescale Radar, Anemometer, and Land-Use Data, Mon. Weather Rev., 141, 4337–4349, 2013.
Kosiba, K. A. and Wurman, J.: Finescale Dual-Doppler Analysis of Hurricane Boundary Layer Structures in Hurricane Frances (2004) at Landfall, Mon. Weather Rev., 142, 1874–1891, 2014.
Lorsolo, S., Schroeder, J. L., Dodge, P., and Marks, F.: An Observational Study of Hurricane Boundary Layer Small-Scale Coherent Structures, Mon. Weather Rev., 136, 2871–2893, 2008.
Marks, F. D., Black, P. G., Montgomery, M. T., and Burpee, R. W.: Structure of the Eye and Eyewall of Hurricane Hugo (1989), Mon. Weather Rev., 136, 1237–1259, 2008.
Mirocha, J. D., Lundquist, J. K., and Kosović, B.: Implementation of a Nonlinear Subfilter Turbulence Stress Model for Large-Eddy Simulation in the Advanced Research WRF Model, Mon. Weather Rev., 138, 4212–4228, 2010.
Mlawer, E. J., Taubman, S. J., Brown, P. D., Iacono, M. J., and Clough, S. A.: Radiative transfer for inhomogeneous atmosphere: RRTM, a validated correlated-k model for the longwave, J. Geophys. Res., 102, 16663–16682, 1997.
Montgomery, M. T., Bell, M. M., Aberson, S. D., and Black, M. L.: Hurricane Isabel (2003): New Insights into the Physics of Intense Storms. Part I: Mean Vortex Structure and Maximum Intensity Estimates, B. Am. Meteorol. Soc., 87, 1335–1347, 2006.
Morrison, I., Businger, S., Marks, F., Dodge, P., and Businger, J. A.: An Observational Case for the Prevalence of Roll Vortices in the Hurricane Boundary Layer, J. Atmos. Sci., 62, 2662–2673, 2005.
Noh, Y., Cheon, W. G., Hong, S.-Y., and Raasch, S.: Improvement of the K-profile model for the planetary boundary layer based on large-eddy simulation data, Bound.-Lay. Meteorol., 107, 401–427, 2003.
Persing, J. and Montgomery, M. T.: Hurricane Superintensity, J. Atmos. Sci., 60, 2349–2371, 2003.
Pielke, R. A., Gratz, J., Landsea, C. W., Collins, D., Saunders, M. A., and Musulin, R.: Normalized Hurricane Damage in the United States: 1900–2005, Nat. Hazards Rev., 9, 29–42, 2008.
Rotunno, R. and Bryan, G. H.: Effects of resolved turbulence in a large eddy simulation of a hurricane, 31st Conference on Hurricanes and Tropical Meteorology, Am. Meteorol. Soc., San Diego, Calif., 2014.
Rotunno, R., Chen, Y., Wang, W., Davis, C., Dudhia, J., and Holland, G. J.: Large-Eddy Simulation of an Idealized Tropical Cyclone, B. Am. Meteorol. Soc., 90, 1783–1788, 2009.
Smith, R. K. and Montgomery, M. T.: Hurricane boundary-layer theory, Q. J. Roy. Meteorol. Soc., 136, 1665–1670, 2010.
Stern, D. P. and Bryan, G. H.: The structure and dynamics of coherent vortices in the eyewall boundary layer of tropical cyclones, 31st Conference on Hurricanes and Tropical Meteorology, Am. Meteorol. Soc., San Diego, Calif., 2014.
Stern, D. P. and Bryan, G. H.: Using Simulated Dropsondes to Understand Extreme Updrafts and Wind Speeds in Tropical Cyclones, Mon. Weather Rev., 146, 3901–3925, 2018.
Stern, D. P., Bryan, G. H., and Aberson, S. D.: Extreme Low-Level Updrafts and Wind Speeds Measured by Dropsondes in Tropical Cyclones, Mon. Weather Rev., 144, 2177–2204, 2016.
Wakimoto, R. M. and Black, P. G.: Damage Survey of Hurricane Andrew and Its Relationship to the Eyewall, B. Am. Meteorol. Soc., 75, 189–200, 1994.
Wu, L. and Chen, X.: Revisiting the steering principal of tropical cyclone motion in a numerical experiment, Atmos. Chem. Phys., 16, 14925–14936, https://doi.org/10.5194/acp-16-14925-2016, 2016.
Wu, L., Braun, S. A., Halverson, J., and Heymsfield, G.: A numerical study of Hurricane Erin (2001). Part I: Model verification and storm evolution, J. Atmos. Sci., 63, 65–86, 2006.
Wu, L., Liu, Q., and Li, Y.: Prevalence of tornado-scale vortices in the tropical cyclone eyewall, P. Natl. Acad. Sci. USA, 115, 8307–8310, https://doi.org/10.1073/pnas.1807217115, 2018.
Wurman, J. and Kosiba, K.: The Role of Small-Scale vortices in Enhancing Surface Winds and Damage in Hurricane Harvey (2017), Mon. Weather Rev., 146, 713–722, 2018.
Wurman, J. and Winslow, J.: Intense Sub-Kilometer-Scale Boundary Layer Rolls Observed in Hurricane Fran, Science, 280, 555–557, 1998.
Zhang, Q., Wu, L., and Liu, Q.: Tropical Cyclone Damages in China 1983–2006, B. Am. Meteorol. Soc., 90, 489–495, 2009.
Zhu, P.: Simulation and Parameterization of the Turbulent Transport in the Hurricane Boundary Layer by Large Eddies, J. Geophys. Res., 113, D17104, https://doi.org/10.1029/2007JD009643, 2008.
Zhu, P., Menelaou, K., and Zhu, Z.: Impact of Subgrid-Scale Vertical Turbulent Mixing on Eyewall Asymmetric Structures and Mesovortices of Hurricanes: Impact of SGS Vertical Turbulent Mixing on Eyewall Asymmetries, Q. J. Roy. Meteor. Soc., 140, 416–438, 2013.