the Creative Commons Attribution 4.0 License.
the Creative Commons Attribution 4.0 License.
 | 26 Feb 2019
Simulations of black carbon (BC) aerosol impact over Hindu Kush Himalayan sites: validation, sources, and implications on glacier runoff
Sauvik Santra
Shubha Verma
Koji Fujita
Indrajit Chakraborty
Olivier Boucher
Toshihiko Takemura
John F. Burkhart
Felix Matt
Mukesh Sharma
We estimated the black carbon (BC) concentration over the Hindu Kush Himalayan region (HKH), its impact on snow albedo reduction, and sensitivity on annual glacier runoff over the identified glaciers. These estimates were based on free-running aerosol simulations (freesimu) and constrained aerosol simulations (constrsimu) from an atmospheric general circulation model, combined with numerical simulations of a glacial mass balance model. BC concentration estimated from freesimu performed better over higher altitude (HA) HKH stations than that over lower altitude (LA) stations. The estimates from constrsimu mirrored the measurements well when implemented for LA stations. Estimates of the spatial distribution of BC concentration in the snowpack (BCc) over the HKH region led to identifying a hot-spot zone located around Manora Peak. Among glaciers over this zone, BCc (>60 µg kg−1) and BC-induced snow albedo reduction (≈5 %) were estimated explicitly being high during the pre-monsoon for Pindari, Poting, Chorabari, and Gangotri glaciers (which are major sources of fresh water for the Indian subcontinent). The rate of increase of BCc in recent years (i.e., over the period 1961–2010) was, however, estimated to be the highest for the Zemu Glacier. Sensitivity analysis with a glacial mass balance model indicated the increase in annual runoff from debris-free glacier areas due to BC-induced snow albedo reduction (SAR) corresponding to the BCc estimated for the HKH glaciers was 4 %–18 %, with the highest being for the Milam and Pindari glaciers. The rate of increase in annual glacier runoff per unit BC-induced percentage SAR was specifically high for Milam, Pindari, and Sankalpa glaciers. The source-specific contribution to atmospheric BC aerosols by emission sources led to identifying the potential emission source being primarily from the biofuel combustion in the Indo-Gangetic Plain south of 30∘ N, but also from open burning in a more remote region north of 30∘ N.
- Article
(4419 KB) -
Supplement
(99 KB) - BibTeX
- EndNote


Aerosols are particles in the atmosphere known to impact Earth's climate directly as well as indirectly (Foster, 2007). Aerosols tend to scatter or absorb insolation and thus affect the radiation budget likewise (Ramanathan et al., 2001a, b). Among aerosol constituents, black carbon (BC) is a major absorbing aerosol constituent produced from incomplete combustion of biomass, biofuel, and fossil fuel (Bond et al., 2013). Black carbon impacts the climate through a direct effect by absorbing sunlight (Ramanathan and Carmichael, 2008) and an indirect effect through cloud alterations in precipitation efficiency (Lohmann and Feichter, 2005). Another impact due to absorbing aerosols such as BC exists in the cryosphere by altering the ablation rate of ice and snow (Flanner et al., 2007; Painter et al., 2007). Deposited black carbon over snow enhances absorption of solar radiation, darkens the upper mixing layers of the snowpack thereby reducing the snow albedo (Warren and Wiscombe, 1980), and leads to an accelerated melting of snow (Jacobson, 2004; Flanner et al., 2007). The Himalayan region has been exposed to particulate pollution and deposition of BC as reported in observational studies at high-altitude Himalayan stations (Bonasoni et al., 2012, 2010a, b; Marinoni et al., 2010; Nair et al., 2013; Jacobi et al., 2015). Based on the atmospheric BC measurements at stations (e.g., Nepal Climate Observatory-Pyramid, NCO-P, Hanle) over the Hindu Kush Himalayan (HKH) region, radiative forcing due to BC and the BC-induced snow albedo reduction (SAR) for estimated BC concentrations in snow over the stations was reported in recent studies (Nair et al., 2013; Yasunari et al., 2010). Additionally, the premature ablation of snowpacks over the Himalayan region (at Khumbu valley, Nepal), which brought forward the melting of snowpacks by 17 to 27 days, has also been inferred due to BC-induced SAR based on snowpack modeling (Jacobi et al., 2015). Further, the impact of BC aerosols on the snowpack, surface radiation, and temperature changes over the HKH region based on simulations in global climate models suggest a considerable impact of anthropogenic forcing over the HKH region as compared to that over the Tibetan Plateau. However, the ability of coarse-gridded models to adequately simulate the snow depth and thereby the BC concentration in snow and atmospheric BC radiative forcing is limited (Menon et al., 2010; Ménégoz et al., 2014; Qian et al., 2015).
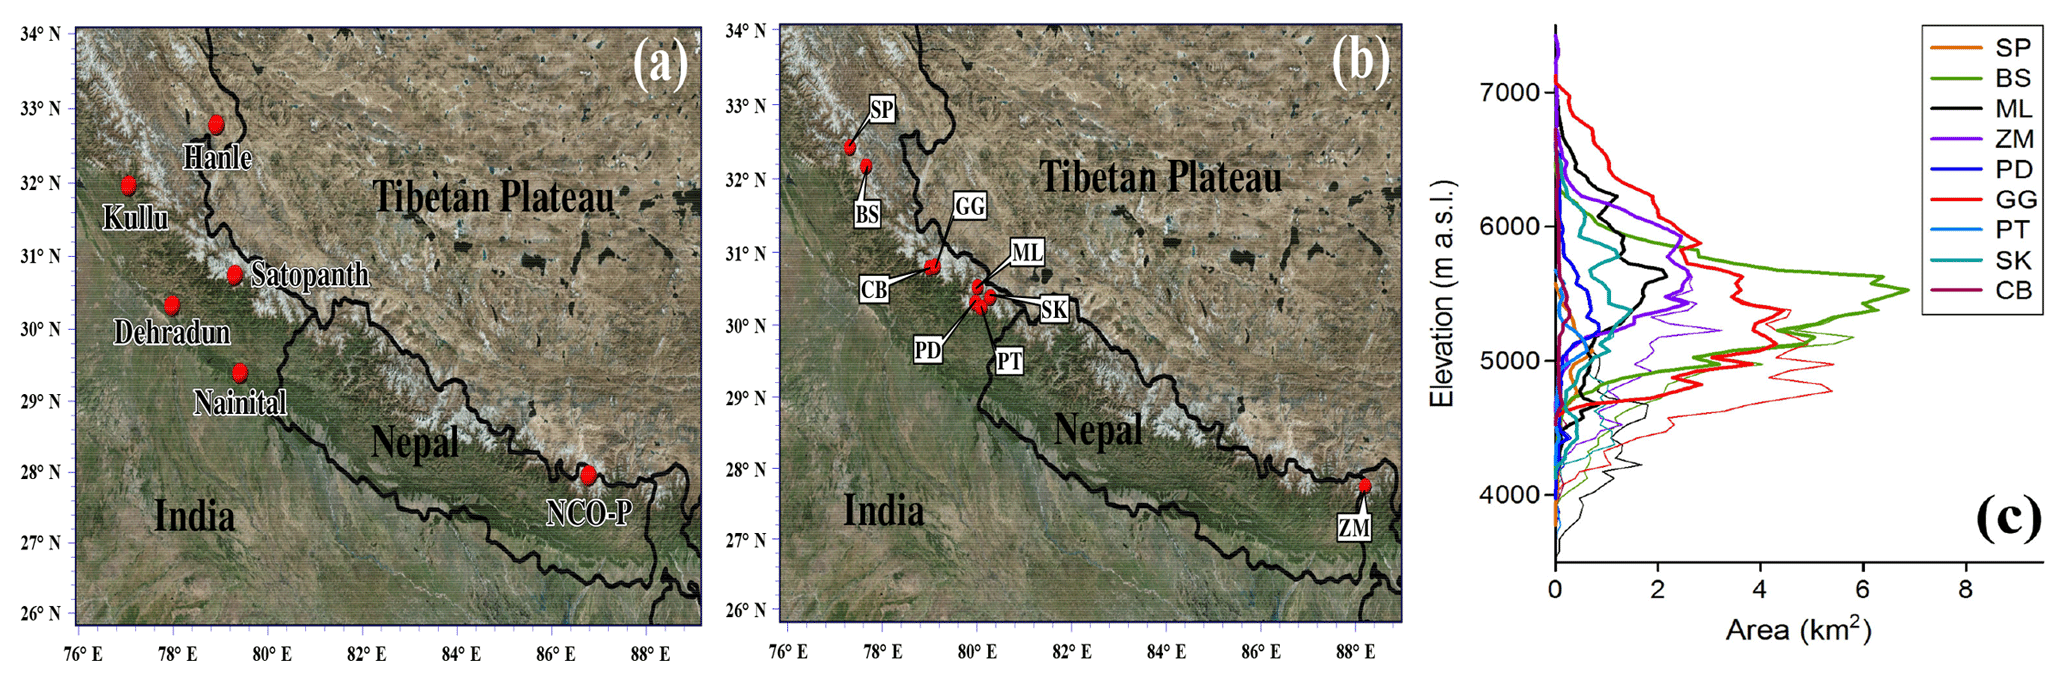
Figure 1Map of the study domain showing (a) six stations of available measurements and (b) simulated glaciers as well as (c) hypsometry of nine glaciers. Outline of glaciers are based on GAMDAM glacier inventory (Nuimura et al., 2015). Thick and thin lines denote debris-free and debris-covered areas, respectively. The debris-covered area was excluded from the calculation. Glacier abbreviations and details are listed in Table 1.
The influence of the albedo change on the glacial mass balance due to an excess and earlier snow melting, and thereby an earlier glacier runoff, is expected to impact the downstream hydrology (Fujita, 2007; Matt et al., 2018; Sakai and Fujita, 2017). This impact is specifically of concern for the HKH region as the Himalayan glaciers are the source of major rivers in South Asia, namely Ganges, Indus, Yamuna, and Brahmaputra (also known as Tsangpo). The inaccessible terrain and severe weather conditions in the higher Himalayan region hinder the measurement of atmospheric BC concentration and BC concentration in snow (Ming et al., 2009) at regular spatial and temporal intervals. The measured data may thus serve as location- and time-specific primary data and not a representative sample of the regional distribution. The simulated BC concentration, using atmospheric chemical transport models (CTMs), which is validated by measurements, can be utilized to predict the spatial mapping of BC distribution over the HKH region. In order to spatially map the estimates of atmospheric BC concentration and BC concentration in snow as adequately as possible, including the corresponding SAR over the HKH region, an integrated approach merging the relevant information from observations with a relatively consistent atmospheric chemical transport model estimates is applied in the present study.
In the present study, we evaluate BC concentration estimated from the free-running aerosol simulations (freesimu) using Laboratoire de Météorologie Dynamique atmospheric general circulation model (LMD-ZT GCM) and Spectral Radiation-Transport Model for Aerosol Species (SPRINTARS) over the HKH region. This evaluation includes a comparison of the simulated BC concentration with observations (refer to Sect. 3.1 and 3.2), thereby leading to the identification of the most consistent freesimu estimates with observations out of the three freesimu. The comparison is done with the available observations at HKH sites (Nair et al., 2013; Marinoni et al., 2010; Babu et al., 2011) for winter (monthly averages of December, January, and February) and pre-monsoon (monthly averages of March, April, and May) season, at locations classified as low-altitude (LA) stations (e.g., Nainital, Kullu, and Dehradun, refer to Fig. 1a), which are in close proximity to emission sources, and high-altitude (HA) stations (e.g., Hanle, NCO-P, and Satopanth, Fig. 1b), which are relatively remotely located and mostly influenced by transport of aerosols. Constrained aerosol simulation (constrsimu) is also formulated (discussed in Sect. 2.2) using the simulated aerosol characteristics from the identified freesimu, and constrsimu estimates are evaluated over the LA stations. Details of the simulation used can be found in Table 2. The impact of BC concentration in the snow (BCc) on SAR is estimated (Sect. 2.3), and numerical simulations of annual glacier runoff height and snow albedo are carried out using a glacial mass balance model (Sect. 2.4) to evaluate the impact of BC-induced SAR on the increase in annual snowmelt runoff from glaciers.
Sangewar and Kulkarni (2011)Mehta et al. (2014)Naithani et al. (2001)Raj (2011)Vohra (1981)Vohra (1981)Vohra (1981)Vohra (1981)Vohra et al. (1993)Table 1Description of glaciers considered in this study.
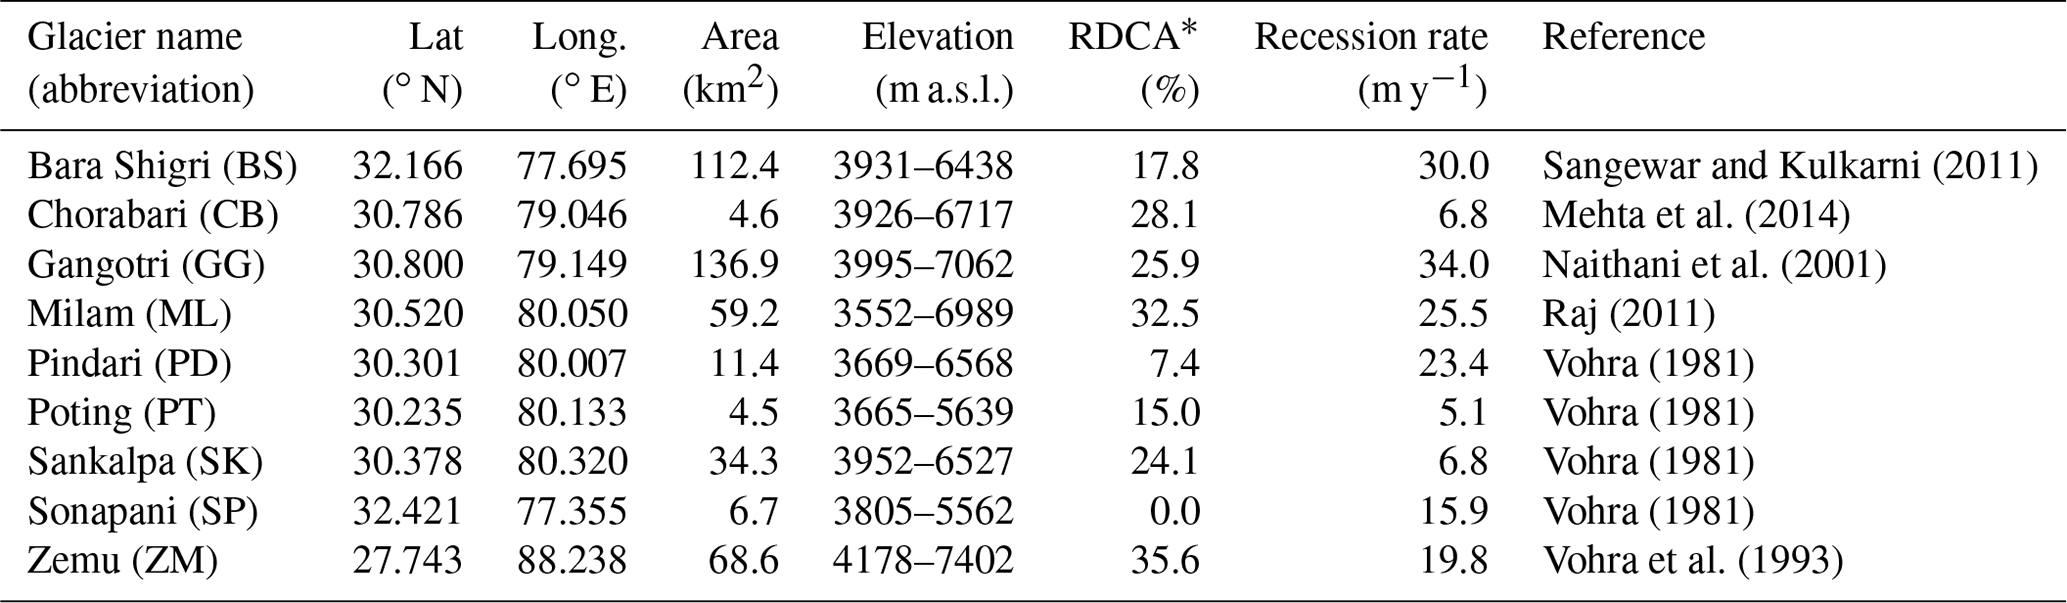
* RDCA: ratio of debris-covered area.
Table 2Details of BC simulation used in this study.
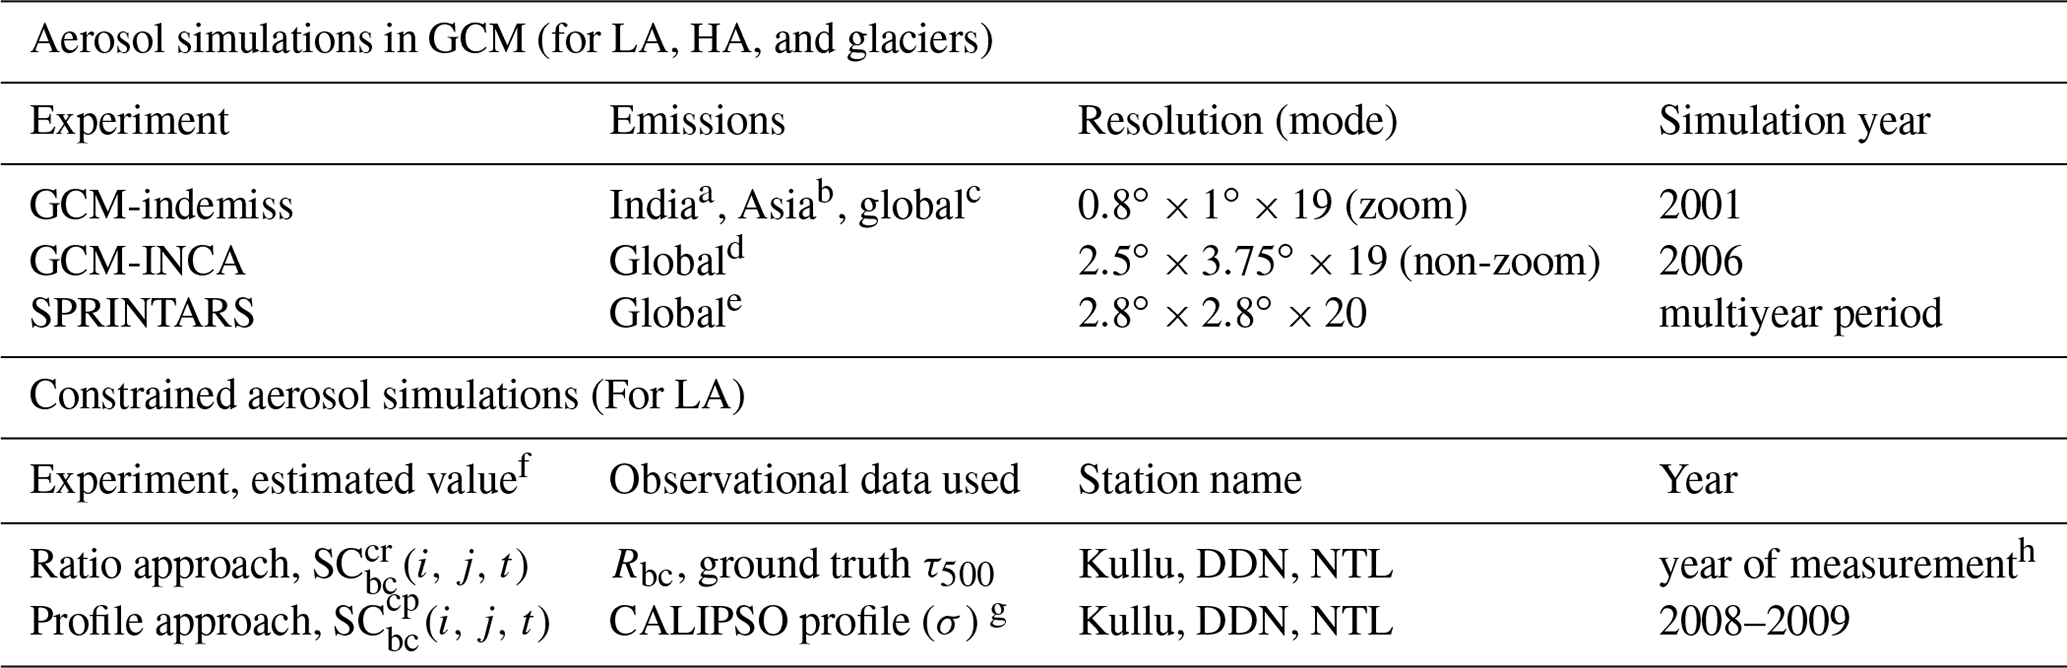
a Reddy and Venkataraman (2002a, b). b Streets et al. (2003a). c Olivier and Berdowski (2001); Cooke et al. (2002); Cooke and Wilson (1996). d Bond et al. (2004); Generoso et al. (2003); Olivier and Berdowski (2001). e Takemura et al. (2000, 2009); Guenther et al. (1995); Spiro et al. (1992). f Estimated value of aerosol species concentration from constrained simulation compared with observation. g Profile of σ to τ at 532 nm from CALIPSO. h Observed ground truth τ500 from available studies NTL 2005–2012, Kullu 2009–2012, and DDN 2007–2010.
In order to examine the source of BC aerosols over the HKH region due to emissions from combustion sectors and that from nearby or remote regions, a source- and region-tagged BC simulation in LMD-ZT GCM (Verma et al., 2011) is also evaluated.
Hence, the specific objectives of this study include evaluations of (1) the atmospheric BC concentration estimated from freesimu and constrsimu over the HKH region, (2) the spatial distribution of BCc and identification of a hot-spot zone and glaciers located in this zone, (3) the impact of BCc on SAR over the glaciers and its potential to increase the annual glacier runoff through numerical simulations with a glacial mass balance model, and (4) the source of origin of BC aerosols over the HKH region. The hypsometry of nine glaciers taken under study (refer to Table 1 and Sect. 2.4) is shown in Fig. 1c. The selected glaciers are widely distributed over the HKH region and located near the zone of high BCc values (discussed in Sect. 3.2). The outline of the glaciers are based on Glacier Area Mapping for Discharge from the Asian Mountains (GAMDAM) glacier inventory (Nuimura et al., 2015).
2.1 Free-running BC simulations in GCM
We evaluate BC surface concentration estimated from three freesimu performed with the LMD-ZT GCM (Hourdin and Armengaud, 1999; Li, 1999; Hourdin et al., 2006) and SPRINTARS (Takemura, 2012) models. The two freesimu with the LMD-ZT GCM comprise of (i) LMD-ZT GCM – with Indian emissions (GCM-indemiss), (ii) LMD-ZT GCM coupled to the Interaction of Chemistry and Aerosol (INCA) model (LMDORINCA) – with global emissions, or namely GCM-INCA. Aerosol simulations in GCMs are also referred as free-running aerosol simulations (freesimu) since simulated aerosol fields are not constrained by observations, unlike constrained simulations (described in Sect. 2.2). We provide only a very brief description of these models here, and detailed information could be obtained from references provided for models. Specific descriptions of aerosol treatment and atmospheric transport for GCM-indemiss are given by Boucher and Pham (2002), Reddy et al. (2004), and Verma et al. (2008); for LMDORINCA by Schulz et al. (2006); and for SPRINTARS by Takemura (2012). GCM-indemiss uses BC emissions over India from Reddy and Venkataraman (2002a, b), over Asia from Streets et al. (2003a), and global emissions of BC are from Cooke et al. (1999) and Cooke and Wilson (1996). BC simulation with GCM-indemiss is carried out with a zoom factor of 3 and 4 applied in latitude and longitude, respectively, having the zoom centralized at 15∘ N and 75∘ E, and extending from 5∘ S to 35∘ N in latitude, and from 50 to 100∘ E in longitude, leading to a resolution of 0.8∘ in latitude and 1∘ in longitude over the zoomed region. The GCM-INCA global emission inventory for BC is from Generoso et al. (2003) and Bond et al. (2004). BC simulation with GCM-INCA is done in non-zoom mode at a horizontal resolution of 2.5∘ in latitude and 3.75∘ in longitude. In both GCM model variants 19 vertical layers with a hybrid sigma-pressure coordinate are used, having 5 layers below 600 hPa and 9 layers above 250 hPa. Model meteorological fields are nudged to 6-hourly data from European Centre for Medium-Range Weather Forecast (ECMWF) meteorological analysis data with a relaxation time of 0.1 day for the year of 2001 in GCM-indemiss, and for 2006 in GCM-INCA.
In SPRINTARS, global emission for BC is adopted from the standard inventories for the Coupled Model Intercomparison Project Phase 5 (CMIP5) (Lamarque et al., 2010; Moss et al., 2010). BC simulation with SPRINTARS is done at a horizontal resolution of approximately with 20 vertical layers based on sigma-pressure levels (Takemura, 2012). These simulations are available for a long-term period from 1851 to 2010. The GCM-indemiss simulation for the year 2001 is compared with SPRINTARS output for 2001 (referred to as SP1). Long-term BC simulation output from SPRINTARS is used to compare model values (referred to as SP2) with observations corresponding to the year of observation. Also, these simulations are used to predict the annual rate of increase in BC concentration over the HKH glaciers as presented in Sect. 3. The 1σ uncertainty in mean model simulated atmospheric BC burden based on evaluation in 16 global aerosol models has been estimated as 42 % (Textor et al., 2006).
Among the three freesimu estimates, the prediction of the GCM-indemiss is found have better conformity with the measured than that of the rest other models (please refer to Sect. 3.1). The freesimu estimates from the GCM-indemiss are therefore used in the constrsimu approach (refer to Sect. 2.2). The freesimu of GCM-indemiss has also the highest conformity with the measurements at HA stations, and hence we utilize BC concentration simulated in GCM-indemiss to estimate BC concentration in snow and BC-induced SAR and their impact over the HKH region (refer to Sects. 2.3 and 3.2).
In order to examine sources of BC aerosol over the HKH region due to emissions from nearby and far-off regions as well as those from various source sectors (e.g., residential biofuel use (BF), open burning of biomass (OB), and fossil fuel (FF) combustion), region- and source-tagged simulations carried out in GCM-indemiss (Verma et al., 2011, 2008) are evaluated. The sectors for the BF source include wood and crop waste for residential cooking and heating, the sectors for OB include forest biomass and agricultural residues, and those for the FF source are coal-fired electric utilities, diesel transport, brick kilns, and the industrial, transportation, and domestic sectors (Reddy and Venkataraman, 2002a, b). Two sets of experiments were carried out, where aerosols were either tagged by source regions (region-tagged simulation) or source sectors (source-tagged simulation). In the region-tagged BC simulations, the BC aerosol transport and atmospheric processes are simulated for each geographical region with the emissions outside that region being switched off. These source regions are the following: (1) Indo-Gangetic Plain (IGP), (2) central India (CNI), (3) south India (SI), (4) northwest India (NWI), (5) Southeast Asia (SEA), (6) East Asia (EA), (7) Africa–west Asia (AFWA), and (8) rest of the world (ROW). In the source-tagged BC simulations, the BC aerosol transport and atmospheric processes are simulated for each of the source sectors – BF, FF, and OB.
Recently, Wang et al. (2014) introduced an explicit aerosol tagging technique, implemented in the Community Atmosphere Model (CAM5), in which BC emitted from 14 independent source regions was tagged and explicitly tracked to quantify source-region-resolved characteristics of BC. This tagging technique has been applied to evaluate the source of origin of BC over the region of Arctic and that over the Himalayas and Tibetan Plateau (HTP) (Wang et al., 2014; Zhang et al., 2015). The tagging technique in CAM5 appears similar to that applied for the region-tagged simulation in GCM-indemiss (Verma et al., 2007, 2008, 2011), though the classified regions of interest in CAM5 and GCM-indemiss are different. The source regions implemented in GCM-indemiss zoom grid were classified on the basis of differences in composition of their aerosol emission fluxes and their proximity to the Indian Ocean and the subcontinent (Verma et al., 2007). The masked regions on the GCM zoom grid are shown as Fig. S1 in the Supplement provided with this paper. The tagged region of “South Asia” (SAS) in Zhang et al. (2015) includes most of the parts of the Indian subcontinent (including together the tagged regions, IGP, CNI, SI, and NWI in GCM-indemiss). The tagged region of “AFWA” in GCM-indemiss includes the combined tagged regions of sub-Saharan Africa (SAF), North Africa (NAF), and the Middle East (MDE) in Zhang et al. (2015).
2.2 Constrained BC simulation
The constrained simulation (constrsimu) approach takes into account the influence of a possible discrepancy in base emissions, the localized effect of high emission flux (from the plains near LA), and the combined effect of interannual variability in meteorological effects (Kumar et al., 2018). This is used to establish an alternate approach for estimating the atmospheric BC concentration by surpassing the error induced specifically due to emissions in source regions which prevail in case of the free-running aerosol simulations. In constrained simulations, GCM-indemiss AOD is constrained by the observed AOD. An inversion algorithm is formulated to obtain the surface concentration of BC from constrained AOD of aerosol constituents. It may be notable that constrained simulations are considered only for the LA stations. For the HA stations which are far away from the source of emissions, the impact of regional emission bias is postulated to be minor, and aerosol pollutants are primarily governed by the atmospheric transport processes (simulated atmospheric residence time) from the surrounding regions. Our postulate is supported by the fact that BC from the freesimu of GCM-indemiss that are underestimated by a large factor at LA stations (refer Sect. 3.1 and Table 4) match consistently well with available observations at HA stations (refer to Sect. 3.1 and Fig. 2). Hence, in the present study, simulated BC from GCM-indemiss is considered a suitable choice (based on analysis of the performance of the model with measurements, discussed in Sect. 3.1) for evaluation of BC-induced SAR and its impact on annual snowmelt runoff from the glaciers under study.
Warren and Wiscombe (1980)Table 3Input parameters for SNICAR-Online model.
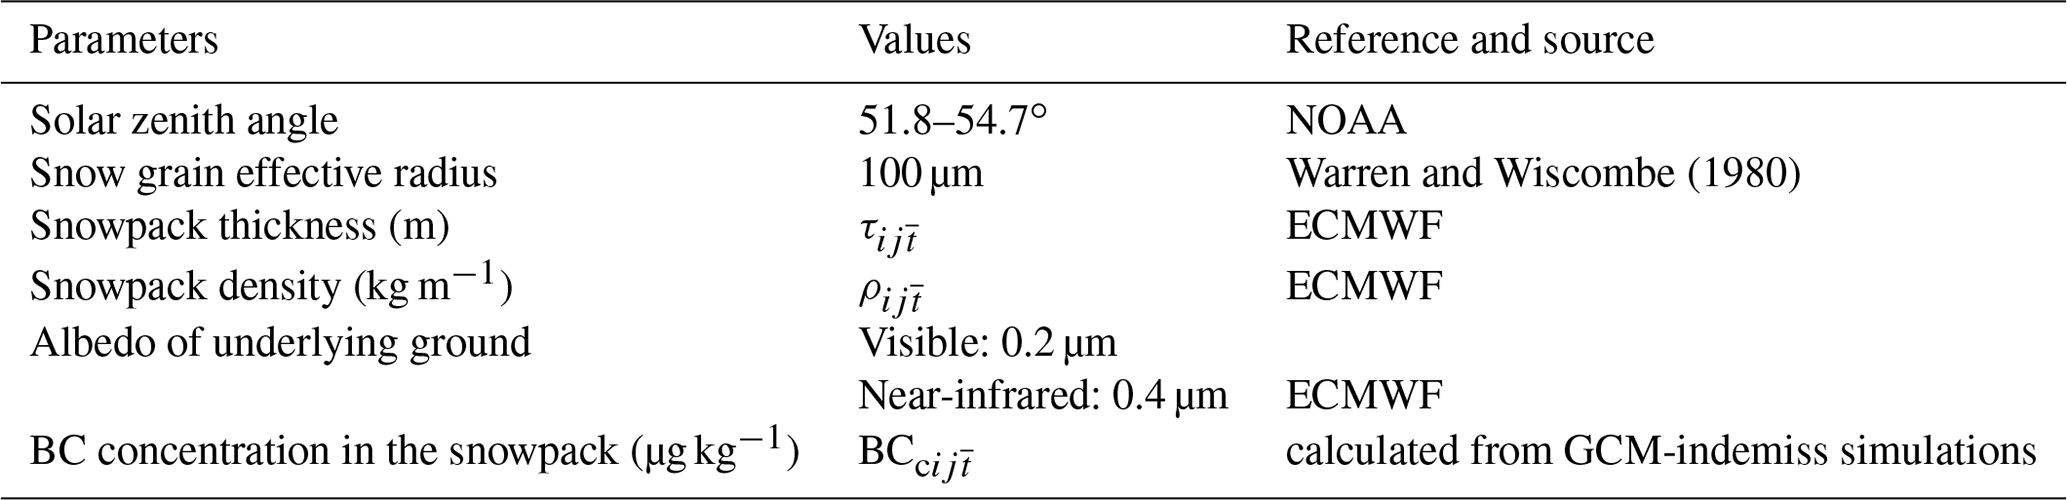
NOAA: National Oceanic and Atmospheric Administration solar position calculator. glacierwise seasonal mean value of snowpack thickness. glacierwise seasonal mean value of snowpack density. = glacierwise seasonal mean value of BCc.
Table 4Comparison of model output range of atmospheric BC concentration with the observed values at different stations.

1 NMB (normalized mean bias, %): .
2 Factor: . 3 win: monthly average value of December, January, and
February. 4 pmn: monthly average value of March, April, and May.
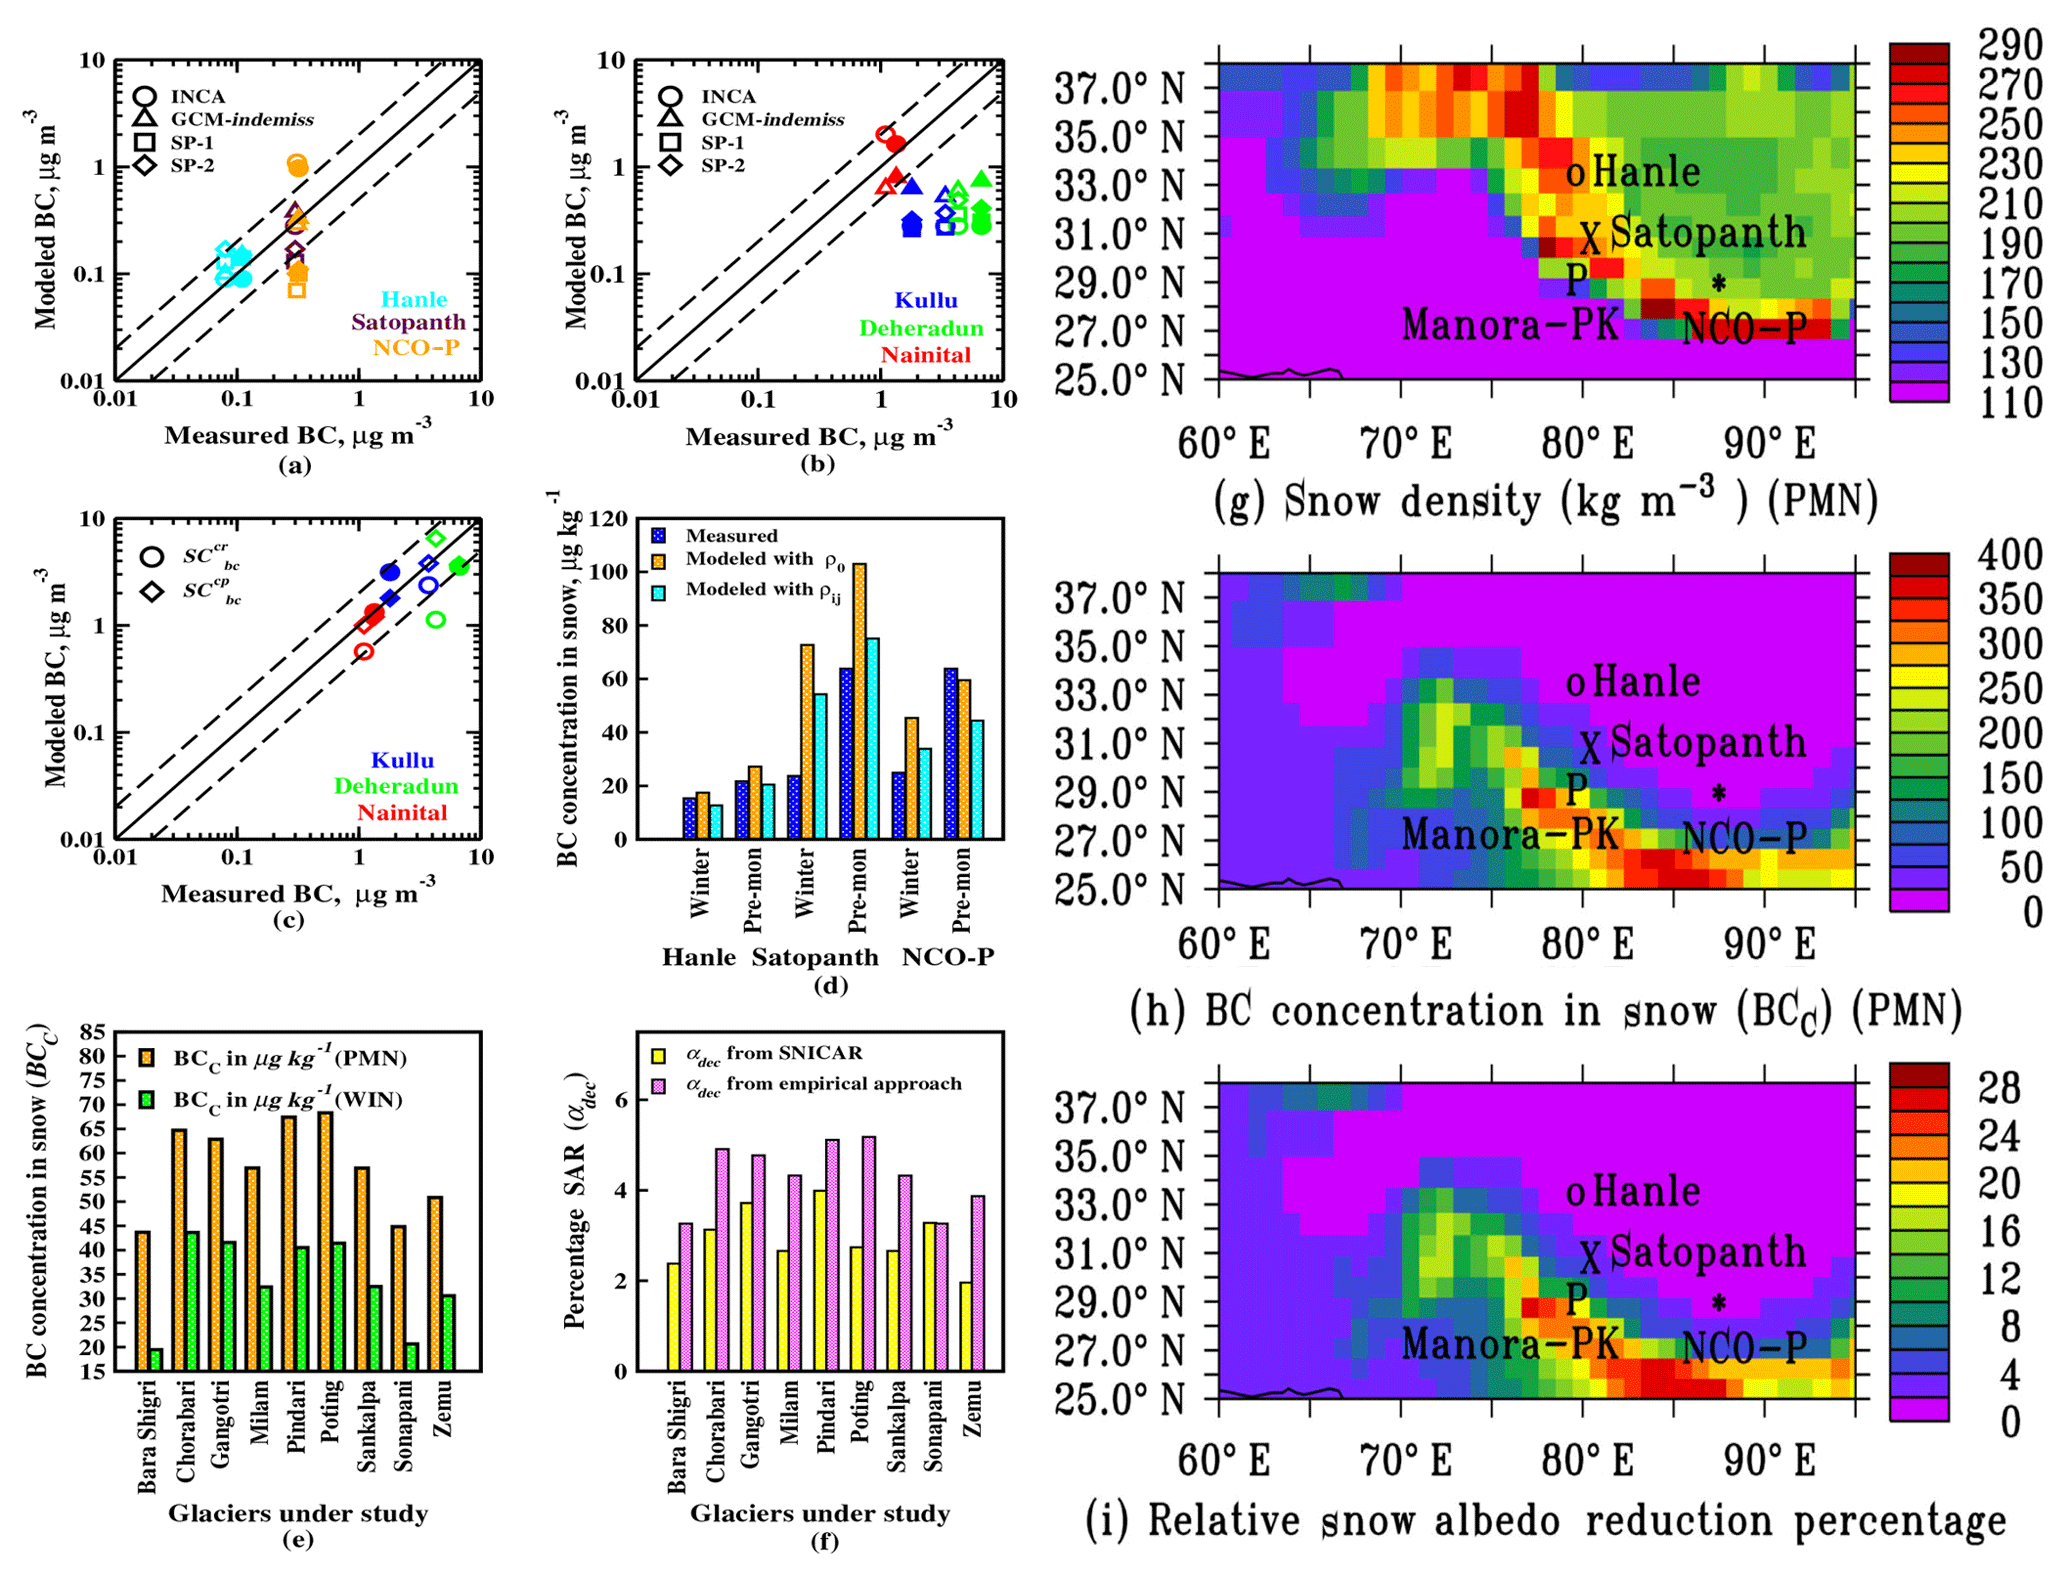
Figure 2Figures showing spatio-seasonal variation of atmospheric mass BC concentration for pre-monsoon (filled symbols) and winter (unfilled symbols) for (a) higher altitude stations, (b) lower altitude stations, (c) modeled versus measured atmospheric BC concentration at lower altitudes using RA and PA, (d) stationwise BC concentration in snow (BCc) and comparison of modeled and measured values for higher altitudes, (e) Glacierwise value of BCc considering only dry deposition for winter and pre-monsoon season, and (f) glacierwise percentage snow albedo reduction (SAR) from both SNICAR and the empirical approach for pre-monsoon; and spatial distribution of (g) averaged snow density from ECMWF for pre-monsoon season (PMN), (h) average of the modeled BCc for PMN, and (i) percentage SAR estimated using empirical approach () for PMN.
The two constrained simulations formulated using the ratio approach (RA) and profile approach (PA) are compared with measurements. On a fundamental basis the two simulations, namely RA and PA, use BC-AOD () and total AOD (τm) from the freesimu of GCM-indemiss to obtain the ratio Rbc as follows:
where specifies the seasonal mean for winter and pre-monsoon. The i and j correspond to the grid positions on the spatial map with the resolution of as in the GCM-indemiss simulation output. The total AOD from GCM-indemiss, τm is constrained with the ground-based observed AOD (τo), which is then scaled with Rbc to calculate the constrained BC-AOD () as given in Eq. (2).
In order to incorporate the for calculating the RA constrained surface concentration of BC, namely , a ratio (ηbc) between the GCM-indemiss BC concentration () and is considered.
The spatial distribution of ηbc is confined to the same resolution as the GCM-indemiss. Using this ηbc the constrained surface concentration is calculated based on the theory that the sensitivity of to is numerically equivalent to the sensitivity of to .
The constrained surface concentration of BC as obtained above by RA is evaluated with measurements.
In the PA, station height specific aerosol extinction coefficients for the corresponding grid coordinates (i,j) are taken into account. This involves the calculation of the monthly mean of the aerosol extinction coefficient (σ) vertical profile derived from Cloud-Aerosol Lidar and Infrared Pathfinder Satellite Observation (CALIPSO). The extinction coefficients are available layerwise at a wavelength of 532 nm and vertical resolution dz=0.06 km. The previously obtained is disaggregated vertically using the retrieved profile of the aerosol extinction coefficient (σ in km−1) from CALIPSO, renormalized by the CALIPSO AOD (τcalip) averaged during the seasonal periods (as indicated by ) at given HKH LA stations to obtain the BC extinction coefficient:
The vertical distribution of the BC concentration, termed as the PA constrained concentration (), is then calculated based on the formula given below:
where αbc is the mass extinction coefficient for BC, taken as 10–16 m2 g−1 (Ram et al., 2010). The uncertainty in the BC surface concentration from constrsimu using the RA, taking into account the uncertainty in observed AOD, αbc, and interannual variability in AOD, is estimated to be within 30 % (Kumar et al., 2018). The uncertainty using the PA, through application of CALIPSO data, is estimated as within 45 %.
2.3 Estimation of BC concentration in snow and its impact on the annual snowmelt runoff for the glaciers under study
BC concentration in the snow (BCc, µg kg−1) during pre-monsoon and winter is calculated with the following equation:
where is the seasonal mean for atmospheric BC mass concentration (µg m−3) simulated with GCM-indemiss, vd is the dry deposition velocity (m s−1), t is the season-specific time interval considered for snow deposition, is the seasonal mean snow density (kg m−3), and d is the snow depth (m). BCc is calculated assuming a uniform distribution of BC in the top 2 cm of pure snow, as it is more contaminated and contributes to a larger albedo reduction than the deeper layers (Tanikawa et al., 2009). Deposition velocity of particles has been inferred to be higher than 0.010 cm s−1 over land (Nho-Kim et al., 2004); the minimal vd of 0.010 cm s−1 is taken in the present study (similar to Yasunari et al., 2010, for the Himalayan glaciers), and a higher vd than the above will lead to increase in estimated BCc.
The uncertainty in the estimated BCc is 69 % due to model uncertainty in and lack of information on vd (model uncertainty for BC dry deposition velocity is 55 %, consistent with that mentioned in Yasunari et al. (2013) as 0.01–0.054 cm s−1). The percentage 1σ variability in the pre-monsoon mean of and is respectively 26 %–30 % and 42 %–55 %. This variability of BCc is estimated as 50 %–70 %.
Deposition of atmospheric BC over the snow also takes place by wet deposition through below cloud scavenging during snowfall events. Calculation of this deposition therefore requires information about size-resolved snow and BC. There is a lack of this information for the Himalayan region from observations and is therefore estimated using numerical models through parameterization of snow scavenging (Ming et al., 2008). Measurements of snowfall from meteorological stations are not available at and around Hanle (Nair et al., 2013) or over the HKH stations under study. Using information from Nair et al. (2013) on the rate of wet scavenging based on atmospheric BC measurements and on snow accumulation depth at Hanle and snow density from ECMWF, our estimated value of BCc from wet deposition is 36 µg kg−1 for the pre-monsoon season (using the prescribed snow density of 195 kg m−3, the value is the same as that in Nair et al., 2013). This value is obtained in the range of 32–90 µg kg−1 for the HKH glaciers, extrapolating the information at Hanle for the entire HKH region and glaciers under study. The total precipitation amount and the precipitation events have been inferred to be notably low during the pre-monsoon season over the HKH region (Bonasoni et al., 2010b; Yasunari et al., 2010). Hence, due to the lack of an adequate estimation of wet deposition, calculation of BC impacts on SAR during the pre-monsoon season is done by neglecting the wet deposition and considering the dry deposition as the governing mechanism for the removal of atmospheric BC during the period of study.
The seasonal mean of spatial distribution of snow density obtained from ECMWF is used to calculate BCc. This calculation is also done assuming the fixed snow density of 195 kg m−3 (for fresh snow) as per information from Yasunari et al. (2010) in order to facilitate the comparison between estimations of BCc from the present study and previous studies over Himalayan stations (e.g., from Nair et al., 2013).
The percentage reduction in snow albedo () (%) for the estimated BC concentration in snow cover (µ g kg−1) is assessed using the following empirical relationship proposed by Ming et al. (2009).
The equation describing the relationship between BC concentration in snow and albedo reduction (Ming et al., 2009) was obtained based on snowpack observations and model calculations. As obtained from Table 4 of Yasunari et al. (2010), the BC-induced SAR over the NCO-P from this equation was within −17 % to 8 % of that estimated for an internal mixture of BC with new snow by Hansen and Nazarenko (2004).
BC-induced SAR is also calculated from the online radiative model, Snow, Ice, and Aerosol Radiation (SNICAR) () (Flanner et al., 2007) to compare with the value obtained from Eq. (8). This calculation is done taking the difference of snow albedo between two sets of simulations with SNICAR, one with BCc and the other without BCc. SNICAR uses parameters such as snow grain size, solar zenith angle, species concentration, albedo of the underlying ground, snowpack thickness, and snowpack density (refer to Table 3). The effective radius of snow grain size is taken as 100 µm (Warren and Wiscombe, 1980) and snowpack density and snowpack thickness are referred from ECMWF gridded archive files corresponding to the period of present study.
The relative percentage of uncertainty in estimated SAR (%) due to uncertainty in BCc is estimated as within 30 %. The percentage 1σ variability in SAR associated with the variability in is 9 %–14 %.
The BC-induced SAR (%) for each of the corresponding HKH stations is calculated. When compared, it is observed that calculated SAR values from SNICAR are lower than those using the empirical approach (refer to Fig. 2e).
Lower values from SNICAR than from the empirical approach is attributed to consideration of external mixing of snow with BC, and possibly a large snow grain size (of 100 µm) for addressing snow aging; a snow grain radius size of 100 to 1000 µm is considered for new and aged snow by Warren and Wiscombe (1980).
The consideration of old aged snow may lead to an enhanced BC accumulation onto the snow surface and a higher reduction of snow albedo than estimated in the present study, taking into account BC accumulation in the top 2 cm of pure snow (not contaminated from the preexisting debris cover). Also, there is a possibility of enrichment of BC in snow (not taken into account in the present study) due to the predominance of sublimation compared to precipitation during the period under study, likely including a higher vd than in the present study, which justifies our assumption that we are using a lower bound estimate of SAR from what could be the actual scenario. Also, BC-induced SAR used in the sensitivity analysis of annual snowmelt runoff for a glacier (discussed in the next section) is considered for BCc with dry deposition only (due to lack of adequate estimations of wet deposition). All the above would thereby lead to an enhanced BCc and impact compared to that estimated in the present study.
The present study aims to evaluate the estimated impact of BC aerosols over the glaciers in the HKH region and identify the glacial region most vulnerable to BC-induced impacts by considering the lower bound estimates of their concentration in snow and the corresponding BC-induced SAR.
2.4 Impact of BC-induced SAR on increase in annual snowmelt runoff for glaciers
SAR is considered one of the precursors of excess snow melting. To quantify the impact of BC concentration in the snowpack on annual snowmelt runoff for the glacier (also termed as annual glacier runoff in the text), we calculated the mass balance and runoff from nine selected glaciers with an energy and mass balance model for glaciers (Fujita and Ageta, 2000) (Table 1 and Fig. 1b). As mentioned earlier, the selected glaciers are widely distributed over the HKH region and located near the zone of high BCc values (discussed in Sect. 3.2). We have used a calculation scheme in which the albedo of the glacier surface was reduced from the albedo value corresponding to the null value of BCc during the control run to an albedo value of 0.5, by which we assumed the glacier surface darkened by BC at a given date, and then snowmelt runoff in the following summer season was calculated (Fujita, 2007). Surface albedo of the control run was not a fixed value, but calculated from snow density so that it changed temporally and spatially. In the calculation, other meteorological parameters were not changed so that we evaluate the impact of surface darkening by BC only. The lower portions of the selected glaciers are covered by debris mantle. The sub-debris ice melt is highly altered with the debris thickness, and the albedo lowering by BC should not affect the ice melting under the debris layer. We, therefore, excluded the debris-covered area (Fig. 1c), which is delineated manually by following previous studies in the eastern Himalayas (Nagai et al., 2016; Ojha et al., 2016, 2017). The calculation was performed with the ERA-Interim reanalysis data (Dee et al., 2011), but precipitation was calibrated to set an initial climatic condition for each glacier, which surely affects glacier response to climate change (Sakai et al., 2015; Sakai and Fujita, 2017). In the calculation, Fujita (2007) has pointed out that the timing of surface darkening affected the consequence of annual runoff significantly. Darkened surfaces during winter could be covered by succeeding snowfall while those in the early melting season significantly enhanced glacier melting and thus runoff. On the other hand, the impact of surface darkening in the late melting season was limited because of the remaining short period for melting. Therefore, in the calculation of this study, the date of albedo lowering was changed at 5-day intervals from October to April. Summer mean albedo and annual runoff were calculated, and then averaged for 35 years (1979–2014). The entire process is carried out for each of the glaciers. The output data set is then further analyzed statistically and discussed in Sect. 3.2.1 and 3.2.2. The results of annual glacier runoff depth and summer mean albedo obtained are then used to generate the data set for values of SAR and the corresponding annual runoff increase (ARI), estimating the respective values with respect to the control run for each of the nine glaciers. The BC-induced SAR values estimated for each of the glaciers under study is then interpolated with the above data set to estimate the corresponding range for ARI, which is analyzed in Sect. 3.2.1.
3.1 Comparison between model estimated and measured BC concentration
Model estimates (free-running simulations and constrained simulations as given in Tables 2 and 3) are compared to measurements. This comparison is presented as a scatter plot in Fig. 2a–d for HA and LA stations. The dashed lines on both the sides of the scatter plot represent a deviation factor of 2 and 0.5, respectively. A detailed performance of the model outputs with respect to the measurements is also provided in Table 4.
3.1.1 Lower altitude stations
At LA stations, estimated values of BC concentration from freesimu of GCM-INCA and SPRINTARS are underestimated by a large factor, being 6 to 23 times the measured values; with that from freesimu of GCM-indemiss being 2 to 11 times (refer to Table 4) and hence exhibiting a better performance than that of the rest of the other models. At LA stations, we also evaluate the estimates from constrsimu (obtained by ratio approach and profile approach; refer to Sect. 2.2) with measurements. The comparison between model estimates (freesimu and constrsimu) and measurements is presented as a scatter plot in Fig. 2b, c. Estimates of BC concentration from constrsimu (Fig. 2c) exhibit a better concurrence than that from freesimu (Fig. 2b), with the measured concentration at all the three LA stations. Among the constrsimu (RA and PA), the RA estimates deviate most of the time by a factor of 2 compared to the measurements (as shown by the dashed lines on both sides of the equivalent line, Fig. 2c), amounting to about 30 %–100 % of the measured values, with the normalized bias being −70 % to −35 %, except for Nainital where the pre-monsoon RA values mirror the measurements. Compared to RA, the PA estimates exhibit a better coherence with the measured values, with these estimates amounting to 90 %–100 % of measured data and a normalized bias of −14 % to 13 %. It is seen that the absolute bias for PA estimates is within their estimated uncertainty of as large as 45 % (as discussed in Sect. 2.2). A better conformity of PA estimates with the measured data also emphasizes the consideration of vertical profiles of BC aerosols, and comparison of model values near approximate height corresponding to the field measurements. Also, a better performance of constrsimu compared to freesimu estimates authenticates our postulate that inappropriate estimates of emission in the freesimu is the primary reason for anomalous prediction by the models at LA stations which are in proximity to emission sources.
3.1.2 Higher altitude stations
The modeled values of simulated BC concentration from freesimu at HA stations (relatively remotely located and mostly influenced by transport of aerosols) (Fig. 2a) have more agreement to the field measurements than that at LA stations (Fig. 2b). It may be noted that HA stations are accompanied with relatively lower values (0.08 to 0.4 µg m−3) of measured BC concentration compared to LA stations (1.1 to 6.5 µg m−3).
While estimates from GCM-indemiss have a normalized bias (NB) range of −6 % to 30 % at HA stations for both pre-monsoon and winter seasons, those from GCM-INCA exhibit a normalized bias range of −17 % to 17 %, except at NCO-P, where the overestimation by the model is as high as 2–8 times for both the seasons. SPRINTARS simulations for versions SP1 (year of simulation 2001) and SP2 (year corresponding to the year of measurement) show a general negative bias range of −21 % to −70 %, except at Hanle, where SPRINTARS exhibits a positive bias of 30 % to 120 %. GCM-indemiss values are hence further analyzed by comparing them with SPRINTARS (SP1 simulation). GCM-indemiss values are 3–4 times that of the SPRINTARS values for all the stations in both seasons except at Hanle, where the predicted concentrations by both are similar. The variability in annual mean of BC concentration (2000–2010) simulated from SPRINTARS is less than 1 % and that for years corresponding to the measurement is 4 %–8 %; this is consistent with the interannual variability estimated in measured BC concentration which is 7 %–9 %. The long-term SPRINTARS simulations for BC concentration are used to estimate the rate of increase (with respect to 1961) in BC concentration and thereby in BC concentration in snow (BCc).
Among the three freesimu estimates, especially that of GCM-indemiss (which is also at a higher spatial resolution than rest other models) has the highest conformity with the measurements at HA stations. Also, the normalized mean bias (NMB) of freesimu from GCM-indemiss for HA is within the estimated 1σ uncertainty in mean model simulated atmospheric BC burden. It may be noted that the features of a relatively lower magnitude and spatial variability of measured BC concentration over HA stations, compared to that over LA stations, are also seen in freesimu of GCM-indemiss estimates. The estimated atmospheric BC concentration over the HKH glaciers is as low as 0.251–0.253 µg m−3 over the Bara Shigri (northern Himalayas) and Zemu (eastern Himalayas) glaciers to as large as 0.517–0.532 µg m−3 over the Chorabari and Gangotri (northern Himalayas) glaciers. Hence, our analysis of the model estimates indicate that freesimu estimates of GCM-indemiss used to evaluate BC distribution for HA stations and HKH glaciers reasonably and consistently represent the relative degree of transport of BC and thereby the feature of spatial and seasonal BC distribution across the HKH sites, including the HKH glaciers. Although, to further reduce the NMB of GCM-indemiss estimates with respect to the respective observations over the HKH stations and obtain a more accurate magnitude of BC concentration over the HKH glaciers, it is required to examine BC transport simulation in the freesimu of the CTM with a better resolved fine grid scale transport processes and vertical distribution. This requirement is indeed justified as the improved prediction of constrsimu is estimated for BC concentration from the PA compared to that from the RA, with the consideration of the vertical profile of BC aerosols and comparison of the model values near approximate height corresponding to the field measurements at LA stations (please refer to Fig. 2c, Table 4, and Sect. 3.1.1). The setup of a simulation experiment with a better spatially and vertically resolved BC transport processes with the freesimu of a CTM for the HKH region is under progress, also with an implementation of the improved and the latest BC emissions over the Indian region as an input into the model. Results from this simulation will be presented in a future study. Thus, discrepancies between model and measurements at HA stations is likely attributed to uncertainties which stem out from instrument error, analytical errors, and detection capability (pertaining to measurements of low values of atmospheric BC concentration), including the degree of accuracy of model processes governing the atmospheric residence time of BC aerosols over HA stations (pertaining to freesimu simulations). In summary, our analysis shows that model estimates (freesimu of GCM-indemiss over HA stations and HKH glaciers and constrsimu over LA stations) with the estimated uncertainty (as large as 45 %) adequately represent, in general, the feature and magnitude of BC distribution over the HKH sites.
As discussed previously, the freesimu of GCM-indemiss has the highest conformity with the measurements at HA stations; hence we utilize BC concentration simulated in GCM-indemiss to estimate BC concentration in snow and BC-induced SAR and their impact over the HKH region.
3.2 Analysis of spatial distribution of BC concentration in snow: estimates of impact on SAR and annual glacier runoff
The comparison of BC concentration in snow (BCc) between GCM-indemiss-derived values and those obtained from available studies (e.g., Nair et al., 2013; Yasunari et al., 2010) at HKH HA stations is presented in Fig. 2d. As mentioned earlier, snow density used to estimate BCc is extracted from the ECMWF ERA-Interim daily reanalysis data set. In order to compare our BCc estimates with those from available studies, we also estimate BCc using the fixed snow density of 195 kg m−3 as done in the available studies. These estimates using fixed snow density and those using ECMWF data at HA stations are presented in Fig. 2d.
The estimated value of BCc from the present study compares well with that obtained from previous work and has a variation of 10 % to 27 % from the earlier studies. These estimates compare relatively well at Hanle and NCO-P; however, at Satopanth during winter they are overestimated compared to the respective measured value. The percentage difference of BCc estimates using fixed snow density with respect to that using ECMWF retrieved values is found to be 34 %–38 %. The estimated BCc (with fresh snow consideration) over HKH glaciers (refer to Fig. 2e) during the pre-monsoon (20–68 µg kg−1) and that during the month of June (84 µg kg−1) in the present study is inferred to be comparable to that measured over the southeastern Tibetan Plateau e.g., for fresh snow and ice samples (four numbers during June) at Demula Glacier (29.26∘ N, 97.02∘ E; 56.6±26.1 µg kg−1) (Zhang et al., 2017). This inference is consistent with the observational studies indicating the BC concentration in snow over the southeastern Tibetan Plateau is the most comparable to those over the Himalayan regions (Zhang et al., 2017). We also compare the estimated BCc from our study with the observed values at a few other stations over the Himalayas (e.g., East Rongbuk Glacier, Kangwure, Qiangyong). This comparison over the mentioned stations has also been carried out in a study by Kopacz et al. (2011) using estimates from Geos-Chem simulations. The estimated BCc from the present study at East Rongbuk Glacier (28∘ N, 88∘ E) for the month of October (Ming et al., 2009), at Kangwure (28.5∘ N, 85.8∘ E), and Qiangyong (28.3∘ N, 90.3∘ E) for the month of July (Xu et al., 2006) are respectively 13, 17, and 24 µg kg−1, which are found to be lower than the respective observed values by 27 %, 23 %, and 44 %. Some of the above discrepancies are expected due to the comparison of the model estimates, which are monthly averaged (corresponding to the month of observation), with the respective measured values at stations which are mostly based on a single sample observation (Ming et al., 2009; Xu et al., 2006). The above bias is, however, within the range of uncertainty in BCc as estimated in the present study. It is also noted that the bias in the estimated BCc for the above stations as obtained from the Geos-Chem simulations (Kopacz et al., 2011) is respectively −155 %, −22 % (negative bias indicates the model value is higher than the observed), and 54 %, which is found to be higher than that from the present study. The lower estimated values of BCc than the measured, specifically at Qiangyong, are, although, as expected in our study due to non-consideration of wet deposition in the estimation of BCc. Nevertheless, the comparable values of the model estimates (within the range of uncertainty in BCc) with the respective observation indicate the conformity with our consideration of the dry deposition as a governing removal process of atmospheric BC during the period of study over the region.
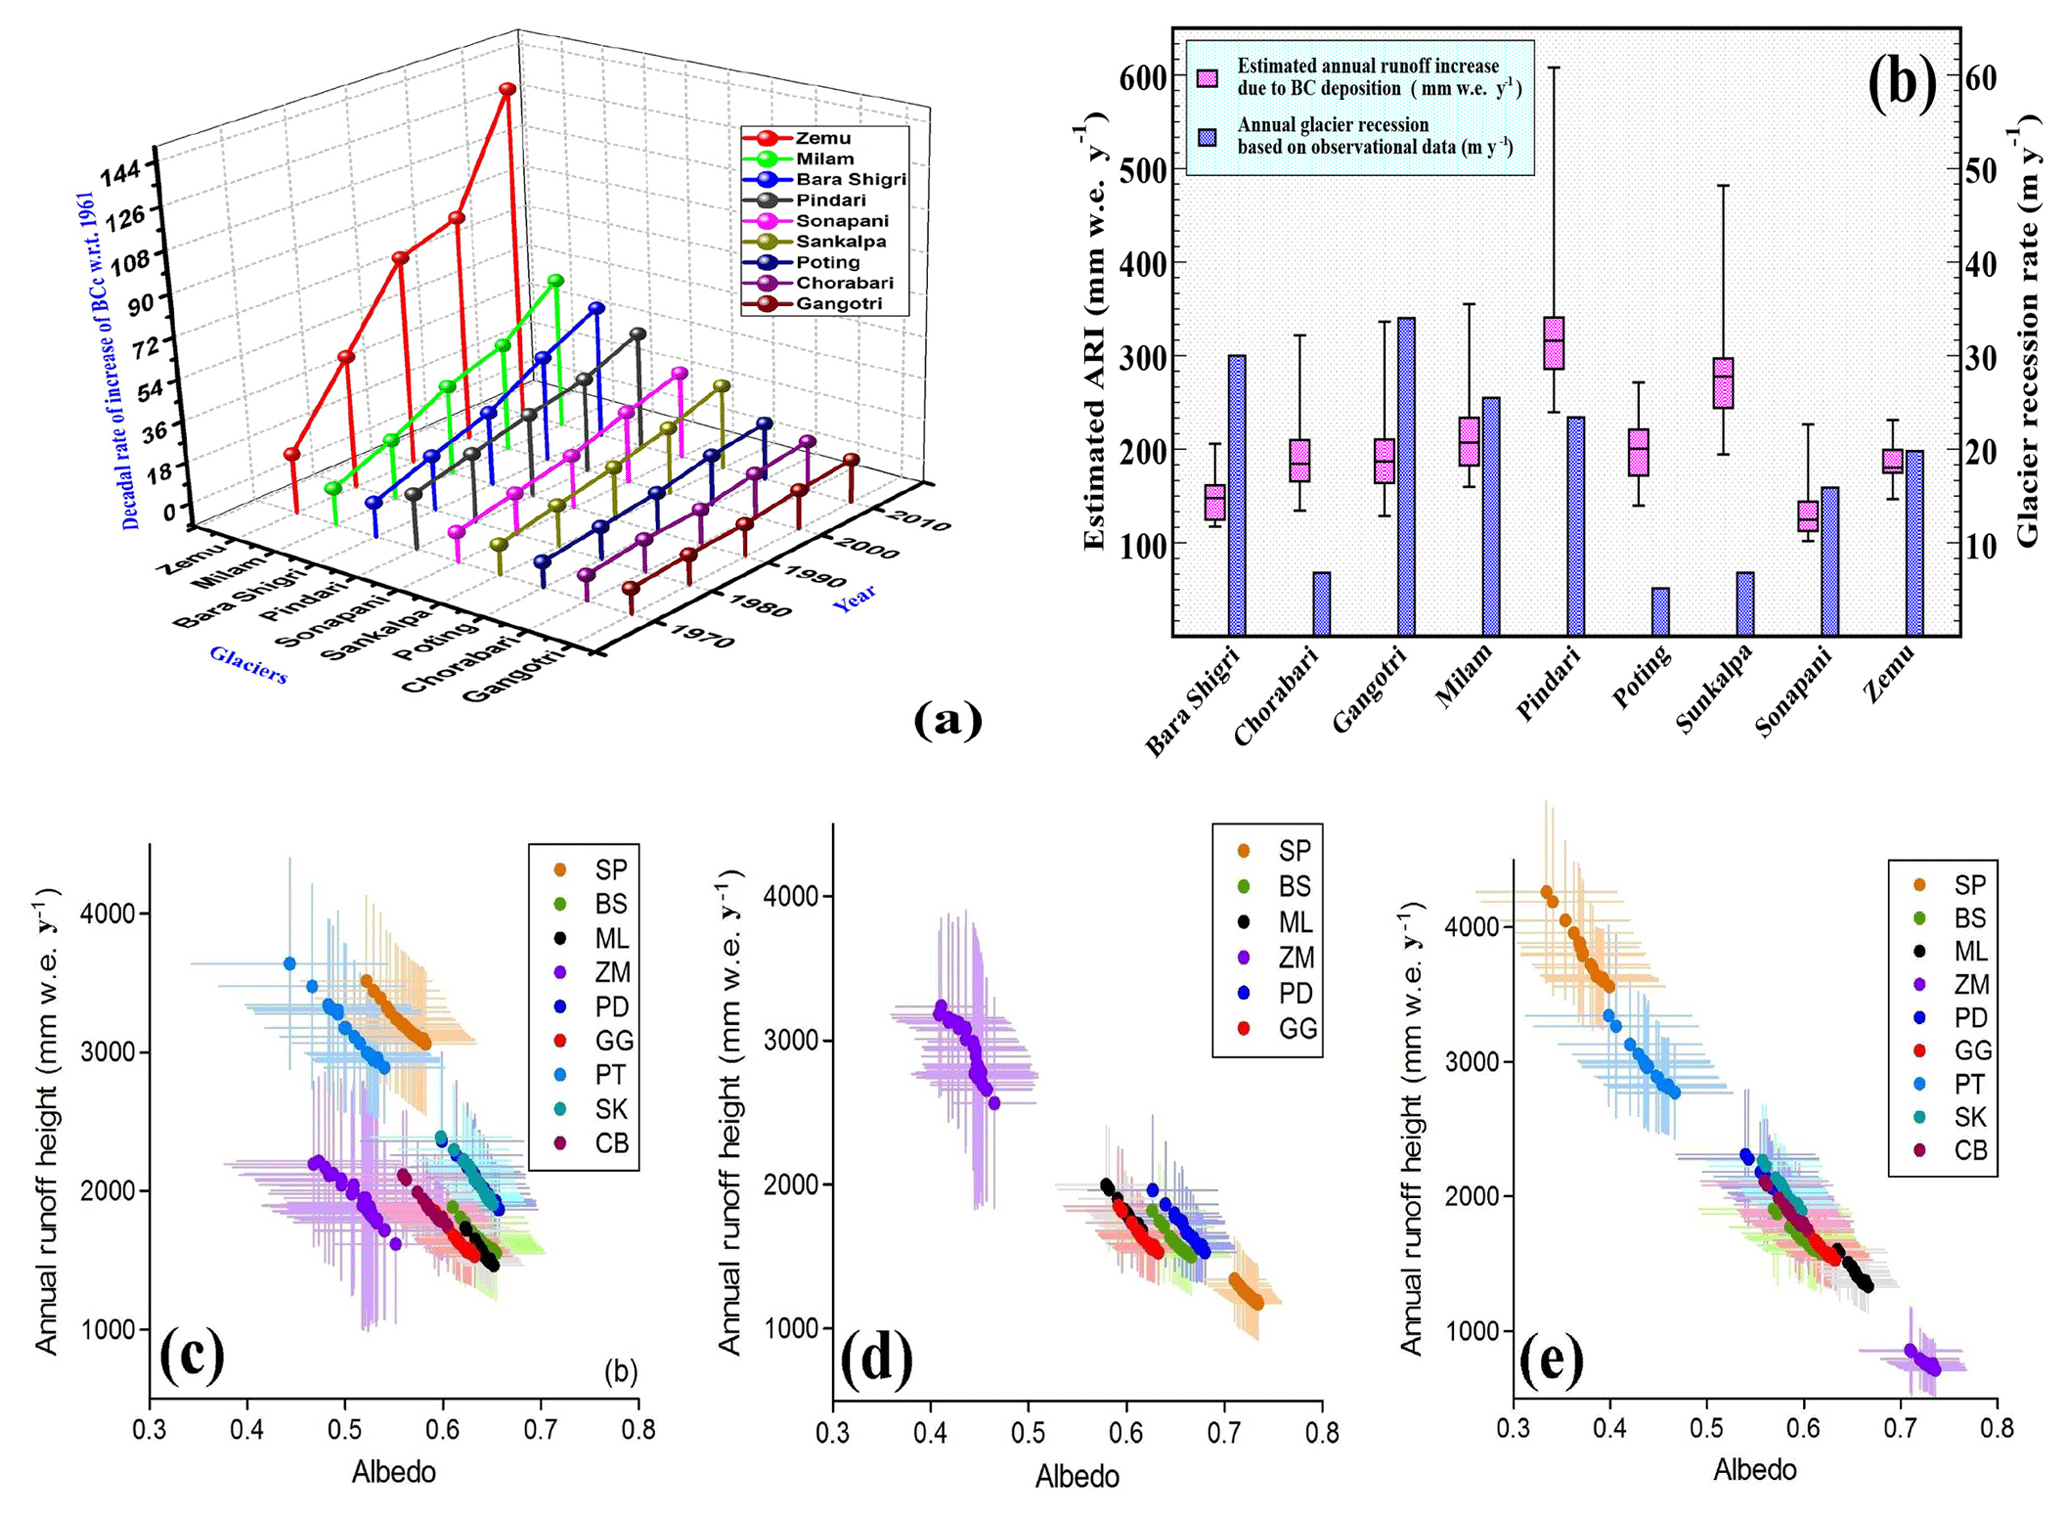
Figure 3(a) Glacierwise decadal trend (1961–2010, percent rate of increase with respect to 1961) of BCc based on atmospheric BC concentration (µg m−3) modeled over the glacier using SPRINTARS, (b) estimated increase in annual glacier runoff (mm w.e. y−1) shown as box-and-whisker plot and average yearly recession (m y−1) for the nine glaciers, (c) simulated summer mean albedo and annual runoff depth of glaciers, and those of sensitivity analysis for (d) a single glacier hypsometry at different ERA-Interim grids and (e) different glacier hypsometries at a single ERA-Interim grid.
We further examine the estimates of BCc and the relative percentage SAR (%) for the HKH glaciers under study as presented in Fig. 2e and 2f, respectively. The pre-monsoon mean of BCc and BC-induced SAR for the HKH glaciers is higher by 39 %–76 % than the winter mean. Among the glaciers, Pindari, Poting, Chorabari, and Gangotri, located over the northern HKH region near the Manora Peak, all exhibit specifically high values of BCc (63–68 µg kg−1) and BC-induced SAR (≈5 %).
We also evaluate the percentage rate of increase in BCc estimates over the HKH glaciers from 1961 to 2010 (with respect to 1961) (Fig. 3a) estimated from the available long-term simulation of atmospheric BC concentration in SPRINTARS. While there is a relative increase of BCc from 1961 to 2010 for all glaciers under study, the percentage increase for Pindari Glacier is 26 % compared to that for Zemu, Milam, and Bara Shigri being 130 %, 55 % and 50 %, respectively.
The decadal increase indicates the possibility of the largest relative impact due to BCc on BC-induced glacial mass balance for the Zemu Glacier (over eastern Himalayas) under conditions of similar glacier hypsometry and climatic setting. Nevertheless, the BCc for Pindari Glacier is about 7 times that for the Zemu Glacier and hence would be more vulnerable than Zemu to these impacts. A sensitivity analysis of the change in the glacial mass balance due to relative change in hypsometry and climatic setting is discussed in Sect. 3.2.2.
In order to identify the location of the hot spots over the HKH region, we also analyze the spatial distribution of pre-monsoon mean of BCc (Fig. 2h) and SAR (Fig. 2i). The spatial distribution of pre-monsoon mean of snow density from the ECMWF is presented in Fig. 2g. The pre-monsoon mean of snow density is seen in the range 190–290 kg m−3 over the HKH glaciers. Please refer to Fig. 1b for the locations of the glaciers in the study region. High BCc (40 to 125 µg kg−1) and the BC-induced SAR (2 % to 10 %) over the HKH region are located between coordinates 26 to 33∘ N and 70 to 90∘ E, specifically over the grids around Manora Peak. A gradually increasing trend westwards from NCO-P and moving north towards Hanle over the snow-covered (Fig. 2) HKH region is observed in the spatial distribution of BCc and SAR. The extent of the glaciers studied under this work (as listed in Fig. 1b) over the region of 78 to 27 to 34∘ N and 88∘ E thus allows us to locate the glaciers which are the most affected due to BCc; this is examined in the next section. The ablation zone of Gangotri Glacier (located from the field measurements), which lies at approximately 30∘93′ N and 79∘ E, is also found to be within the zone of predicted high BCc values. High BCc in the range of 55 to 100 µg kg−1 in the ablation zone of Gangotri near the snout, Gomukh (source of the Bhagirathi River, one of the primary headstreams of the Ganges River), is estimated in the present study.
Table 5Sensitivity of annual runoff and runoff increase (ARI) to albedo change for the glaciers considered in this study, along with sensitivity of annual runoff to albedo due to change in climatic condition and glacier hypsometry.
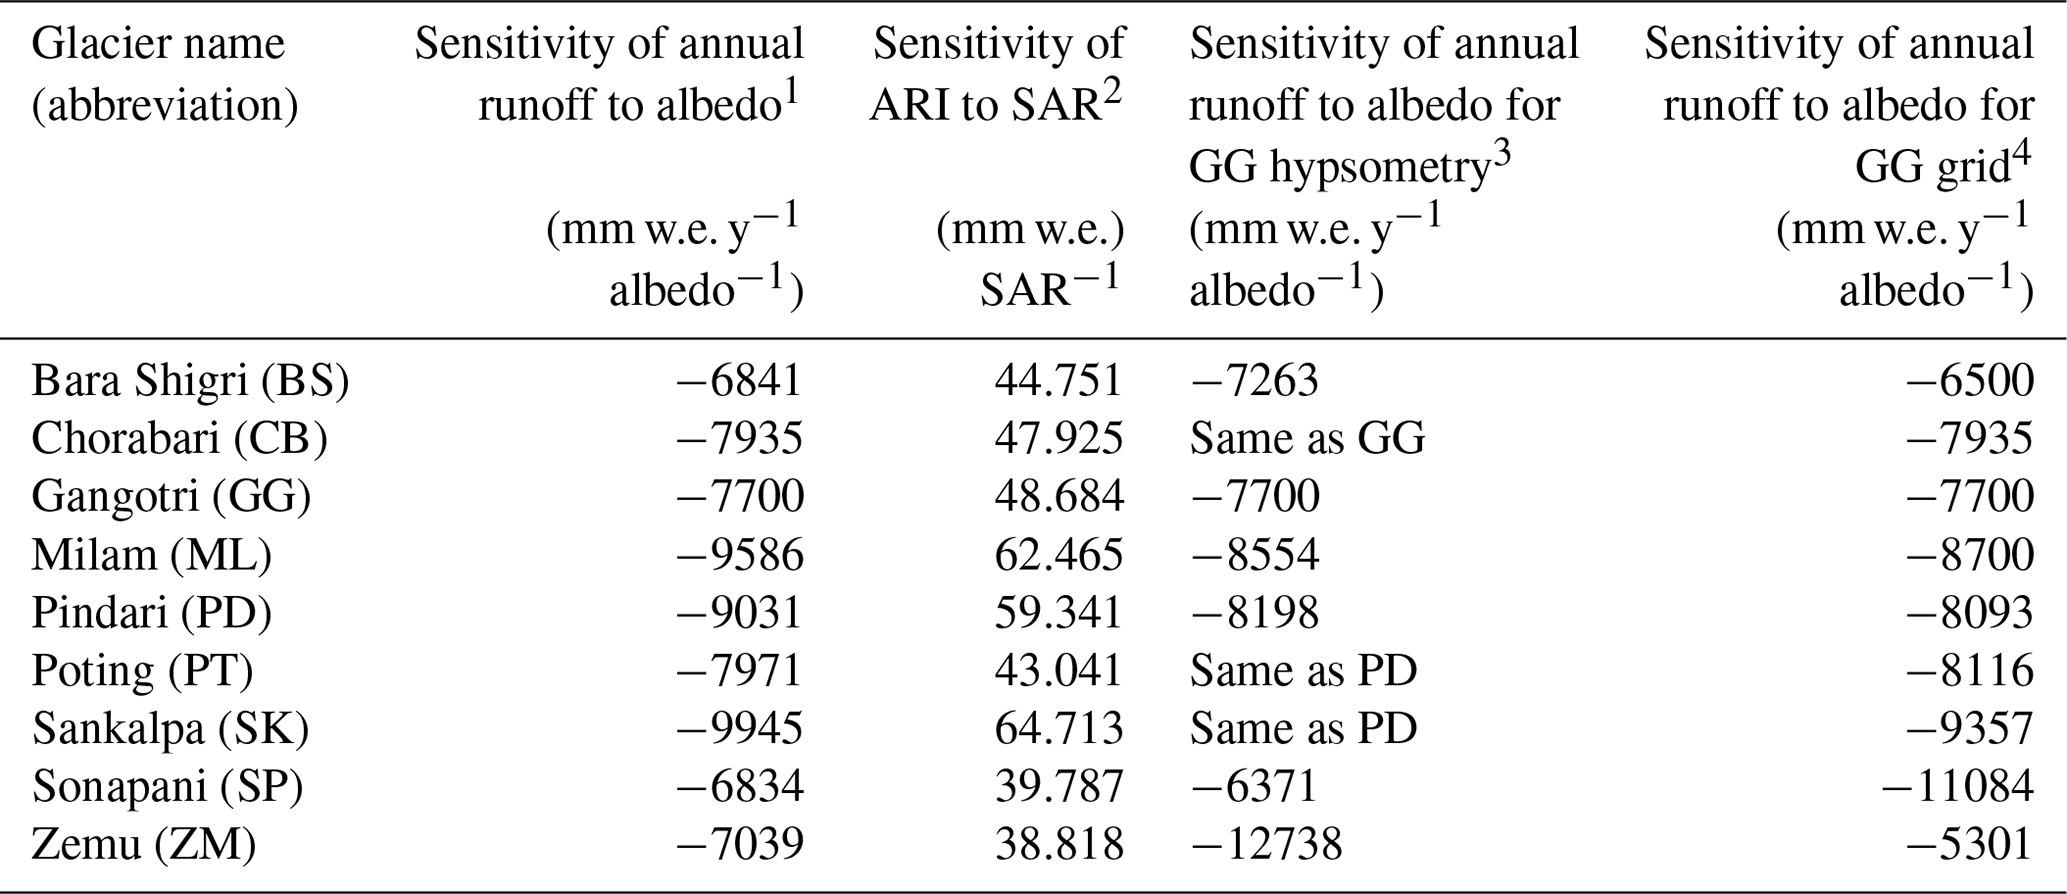
1 Slope of annual runoff (mm w.e. y−1) to albedo from Fig. 3c. 2 Slope of increase in annual runoff (mm w.e.) to BC-induced percentage SAR. 3 Slope of annual runoff (mm w.e. y−1) to albedo from Fig. 3d, where Gangotri hypsometry implies that the calculation with the same hypsometry of Gangotri Glacier as a sensitivity test of different climatic conditions by using the single hypsometry. 4 Slope of annual runoff (mm w.e. y−1) to albedo from Fig. 3e, where Gangotri grid implies that the calculation with the same ERA-Interim grid including Gangotri Glacier as a sensitivity test of different hypsometry by using the single ERA-Interim grid.
3.2.1 Estimates of impact on annual glacier runoff
The simulated impact of albedo reduction on annual snowmelt runoff (millimeters of water equivalent per year, mm w.e. y−1) from glaciers using a glacial mass balance model (Fujita and Ageta, 2000) is presented in Fig. 3c. Error bars of each point are calculated as the standard deviations of the 35-year simulated period (1979–2014). The gradient of linear regression (Fig. 3c, Table 5), which represents the amount of annual glacier snowmelt runoff increase per unit decrease in albedo, is indicative of the sensitivity of a glacier to albedo change. This gradient is estimated as −6834 to −9945 mm w.e. y−1 (refer to Table 5) per unit of albedo decrease for HKH glaciers under study. The annual glacier snowmelt runoff increase per unit decrease in albedo for a cold Tibetan glacier has been estimated as about 3670 mm w.e. y−1 (Fujita, 2007; Fujita et al., 2007). This indicates the HKH glaciers are about 2–3 times more sensitive to albedo change (i.e., a higher rate of glacier runoff increase per unit decrease in albedo) than the cold Tibetan glacier. Our derived BC-induced SAR values for each of the HKH glaciers (Fig. 2f) are then incorporated (Sect. 2.4) into the results of the numerical simulation to calculate the increase in annual snowmelt runoff from the glaciers, which is displayed as a box plot in Fig. 3b. The figure presents the estimated ARI in mm w.e. y−1 for debris-free part of glaciers under study along with glacierwise average annual recession in meters (as obtained from available observational studies, refer to Table 1). The calculated values of ARI due to BC-induced SAR (Fig. 3b) show the median value of ARI for the HKH glaciers under study being greater than 120 mm w.e. y−1, with the highest value (316 mm w.e. y−1) for the Pindari Glacier and followed by that for the Sankalpa Glacier (278 mm w.e. y−1). Although the median ARI for Milam Glacier is around 261 mm w.e. y−1 (lower than the Pindari), this glacier witnesses the highest percentage increase (18 %) of ARI with respect to the control run (with null value of BCc), followed by Pindari (16 % increase). The mean BC-induced ARI across the glaciers is in the range 135–321 mm w.e. y−1, with the highest (lowest) being for Pindari (Sonapani). The 1σ variability in ARI across them due to BC-induced SAR is estimated as 58 mm w.e. y−1. The calculated values of the rate of ARI per unit BC-induced SAR (%) as shown in Table 5, indicate this rate being specifically high (>55 mm w.e. y−1 per unit % SAR) for Milam, Pindari, and Sankalpa glaciers. From the figure, it can also be seen that the Gangotri Glacier is the most rapidly shrinking one among the HKH glaciers under study, having maximum yearly recession of as high as 34 m, (Sangewar and Kulkarni, 2011), followed by Bara Shigri, Milam, and Pindari. Five out of the total nine glaciers are retreating at a rate higher than 20 m per year (range varying from 6.8 to 34 m y−1), which is really alarming.
The percentage uncertainty in albedo due to the impact of surface darkening by BC associated with the different climatic conditions is 5 %–20 % and in the corresponding estimated annual snowmelt runoff is 13 %–47 % (Fig. 3c). The uncertainty in the corresponding increase in annual snowmelt runoff (Fig. 3b) is 10 %–23 %.
In summary, the present study leads to identify the glaciers over the HKH region being vulnerable to BC-induced impacts, which includes those affected by a large value of BCc and BC-induced SAR (e.g., Pindari, Poting, Chorabari, and Gangotri), in addition to those being specifically highly sensitive to BC-induced impacts (e.g., Sankalpa, Pindari, Milam, and Zemu). The Pindari Glacier feeds the river Pindar, which runs for 124 km with a catchment area of 1688 km before its confluence with river Alaknanda at Karnaprayag. It is highly essential that the ARI from this glacier be quantified to manage the abundant meltwater. Our analyses show that there is an enhanced BCc in the present decade as compared to the earlier decades due to the enhanced BC concentrations originating from anthropogenic activities.
3.2.2 Sensitivity analysis of the annual glacier runoff–albedo relationship
The estimated impact of BCc on annual glacier runoff is affected not only by the amount of deposited BC but also by glacier hypsometry and climatic setting. To quantify these effects, we further calculated the sensitivity of annual glacier runoff to albedo change with two different configurations: (1) with a single glacier hypsometry at different ERA-Interim grids, and (2) with different glacier hypsometries at a single ERA-Interim grid. Configuration (1) demonstrates how different climatic settings affect the annual runoff sensitivity (Fig. 3d) while configuration (2) shows how different altitudinal profiles affect the results (Fig. 3e). We use the hypsometry of Gangotri Glacier (GG) because of its wide range in altitude (Fig. 1c). Configuration (1) resulted in similar annual runoff heights (Fig. 3d) and annual runoff sensitivity (GG hypsometry, Table 5) for the neighboring grids (ML and PD) except for two grids (BS and ZM). Zemu Glacier (ZM) is located in the eastern Himalayas and is thus situated at higher elevation than the other glaciers (Fig. 1c). If the GG hypsometry is applied to the ZM grid, the large ablation area should produce more meltwater under warmer conditions. Albedo reduction should enhance the ice melting in such a way that warmer the condition, the more the runoff. This is why the annual runoff sensitivity is so negative. On the other hand, Sonapani Glacier (SP) is the northwestern margin of the study's domain. A larger accumulation area of the GG Glacier than the SP Glacier should reduce the area-averaged annual runoff because the albedo reduction should not affect glacier melting at high altitudes. Configuration (2) demonstrates how glacier hypsometry affects the amount and sensitivity of annual runoff (GG grid, Table 5 and Fig. 3e). Neighboring glaciers (ML, PD, GG, PT, SK, and CB) show similar results to the control calculation (Fig. 3c), while glaciers from different climates show contrasting results. The ZM Glacier is situated at a higher altitude than the GG Glacier (Fig. 1c), and the amount and sensitivity of annual runoff are significantly reduced, and vice versa for the SP Glacier (Fig. 3e and Table 5). Spatial contrast of climate and glacier hypsometry affects how these glaciers respond to surface darkening by BC.
We believe the heterogeneity in ARI estimated across the glaciers to be reasonably adequate. This is because of the application of the consistent estimates of atmospheric BC from the freesimu of GCM-indemiss, which showed the best conformity with observations, and the merging of these estimates with the relevant information from the available observation over the HKH sites to assess the impact of BC aerosols over the HKH glaciers. Further, the estimated BCc from our study (please refer to Sect. 3.2) has been found to be consistent with the available information on observed values at the stations over the Himalayas (e.g., East Rongbuk Glacier, Kangwure, Qiangyong). Furthermore, the BC-induced ARI is estimated based on the sensitivity of glacier runoff to albedo change for each of the glaciers under study using a glacier energy–mass balance model. The present study evaluated the estimated impact of BC aerosols over the glaciers in the HKH region and identified the glacial region most vulnerable to BC-induced impacts, considering the lower bound estimates of their concentration in snow and the corresponding BC-induced SAR. Though, it is believed that the feature of the spatial distribution of BC-induced impacts as estimated from the integrated modeling approach in the present study is reasonably consistent. It is, however, required to examine a more accurate magnitude of these impacts on the individual glaciers with the improved estimates (reduced bias with observations) of atmospheric BC concentration, in conjunction with the improved representation of aerosol processes and parameterization applied for the HKH sites in the model. This improvement is mainly concerned with the aided information required from more detailed and frequent aerosol observations of crucial aerosol parameters including the dry and wet deposition rates and mixing of BC in snow, in addition to that of meteorology, e.g., snowpack density and height, precipitation, snow grain size, and surface albedo, over a widely distributed stations across the HKH sites. The uncertainty in estimated BC concentration in snow, which further propagates in estimated SAR and ARI, is mainly due to the lack of information on aerosol processes for the HKH sites. The prevailing uncertainty on atmosphere–cryosphere processes and the hindrance in obtaining a more robust estimate of the aerosol impact on Himalayan glaciers due to too sparse and short-term observations have also been inferred in previous studies (e.g., Qian et al., 2015; Ménégoz et al., 2014; Matt et al., 2018). It is also, therefore, necessary to carry out a more detailed validation of model estimates for BC aerosols along with the meteorology with a widely distributed observations across the HKH sites.
3.3 Source of origin of BC aerosols over HKH region
3.3.1 Contribution of BC emissions from nearby and far-off regions to BC aerosols
The relative distribution (%) of BC surface concentration (Fig. 4I) and BC-AOD (Fig. 4II) due to BC emissions originating from the nearby region, IGP (BC concentration or BC-AOD due to emissions from the IGP to the total BC concentration or BC-AOD) and the far-off region, AFWA during winter and pre-monsoon seasons over the HKH region is estimated. These estimations are done from region-tagged simulations in the GCM over the HKH region (please refer to Sect. 2.1). The spatial distribution (%) of winter and pre-monsoon mean of surface BC concentration (BC-AOD) due to emissions from the IGP is 70 % to 90 % (45 % to 80 %) of the total surface BC-AOD over the part of the HKH region south of 30∘ N. This distribution decreases as we move towards the north (north of 30∘ N), at higher latitudes in the Himalayan region. The spatial distribution (%) of surface BC-AOD due to emissions from AFWA increases towards the northern grids (north of 30∘ N), with these being 25 % to 40 % (50 % to 60 %) in winter and 15 % to 25 % (40 % to 55 %) in pre-monsoon. It is found that while BC concentration and BC-AOD due to emissions from the IGP have a slightly higher value during pre-monsoon than winter, it is vice versa for those due to emissions from AFWA. These features are inferred likely due to emissions of biomass burning (crop waste and forest fires), which are more prominent during pre-monsoon over the IGP but are more prominent during winter over AFWA, as obtained from the information of fire count data from satellite-based measurements (Pohl et al., 2014; Verma et al., 2014). Estimates of pre-monsoon and winter means of surface BC concentration due to relative contribution (%) of emissions from OB, BF, and FF combustion from source-tagged (refer to Sect. 2.1) BC simulations in LMD-ZT GCM are also presented respectively in Fig. 5a to c and 5d to f. This figure indicates that while BC surface concentration during winter and pre-monsoon are influenced mostly due to biofuel emissions over part of the HKH region south of 30∘ N (where there is a relatively higher contribution from emissions over the IGP), these are due to biomass burning over the north of 30∘ N, thus corroborating the above inference. The high BCc and BC-induced SAR over glaciers near the Manora Peak, over northern Himalayan region, are thus found to be mainly due to contribution of BF emissions from the IGP region.
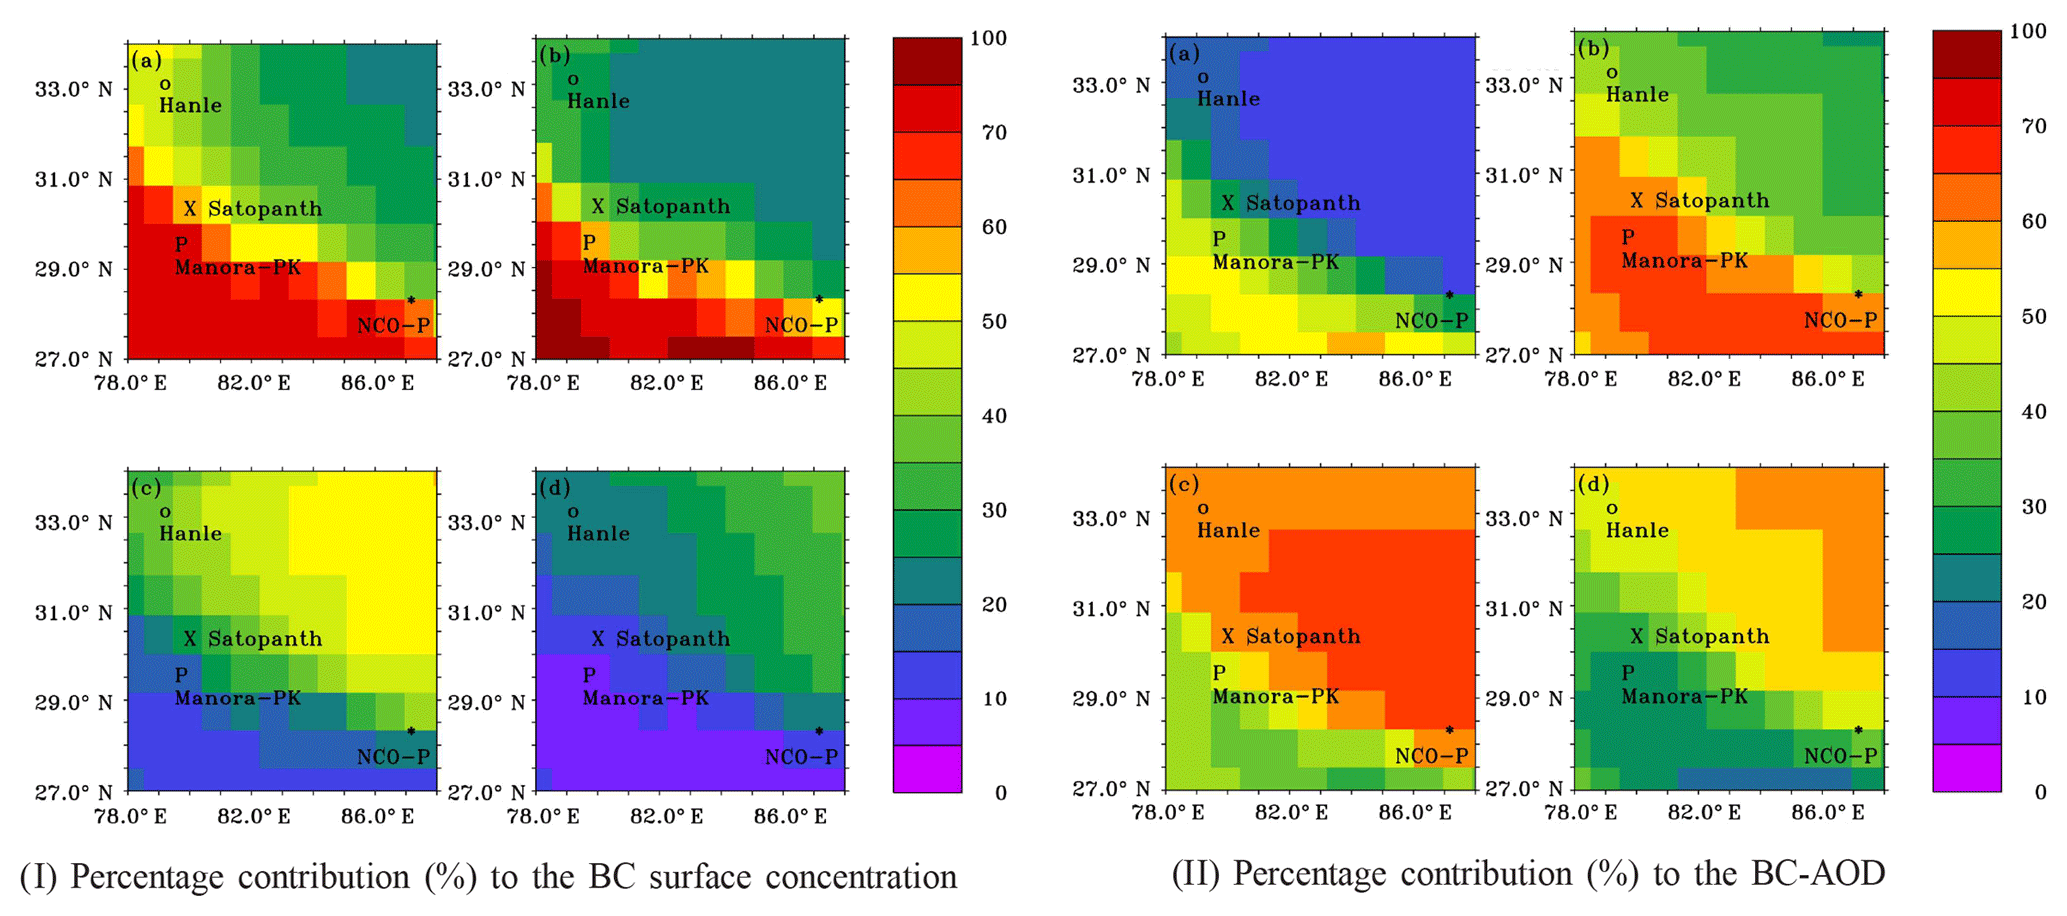
Figure 4Spatial distribution of mean of (I) surface BC concentration and (II) BC-AOD for winter (a, c) and pre-monsoon (b, d) due to relative percentage contribution (%) of emissions from the IGP (a, b) and AFWA (c, d).

Figure 5Spatial distribution of (a–c) pre-monsoon and (d–f) winter mean of surface BC concentration due to relative percentage contribution (%) of BC emissions from open burning (OB), biofuel (BF), and fossil fuel (FF) combustion.
The present study is in agreement with the inference based on the source-tagging technique implemented in CAM5 (as also mentioned in Sect. 2.1) and that using an adjoint of the Geos-Chem model (Zhang et al., 2015; Kopacz et al., 2011) on the predominant contribution from biomass burning (BB) emissions to BC aerosols over the HTP. Although, unlike the previous studies (e.g., Kopacz et al., 2011; Zhang et al., 2015), the present study provides a more specific domain over the HKH region, e.g., south of 30∘ N (covering the region of analysis of BC aerosols for Himalayas in Zhang et al., 2015), where a predominant contribution of BC emissions originating in IGP is evinced, corroborating that originating in SAS by Zhang et al. (2015). An enhanced contribution of emissions from the sub-Saharan Africa region over the Himalayas and central plateau during winter compared to that during pre-monsoon as inferred in Zhang et al. (2015) is also consistent with that in the present study. Further, for the region north of 30∘ N within the HKH region under study (covering the region of analysis of BC aerosols for the central plateau in Zhang et al., 2015), the present study indicates that a predominating contribution to BC aerosols from OB emissions and those originating mainly in AFWA is in disagreement with Zhang et al. (2015), which once again indicates that BC aerosols from BB emissions originate mainly in SAS. This disagreement is expected due to (i) the tagged region of “SAS” in Zhang et al. (2015) also including parts of west Asia, unlike that of a more specific domain over the Indian subcontinent “IGP” in the present study and (ii) the fact that the source of BC is considered from the combined source sector of BF and OB as BB in Zhang et al. (2015), unlike that in the present study. While BC emissions from the BF combustion are predominant over the IGP region (part of SAS from Zhang et al., 2015), these from OB are over the African region specifically during the winter season. It is, however, noted that a considerable contribution of BC emissions from the African region over the Himalayas (Mount Everest), with this being larger than that from the Indian region during the winter month (January) compared to that during the pre-monsoon month (April), has been inferred based on the source analysis using an adjoint of the Geos-Chem model (Kopacz et al., 2011); this inference is in corroboration with the present study.
We evaluated the impact of BC aerosols and their sources of origin over the HKH region and identified the glaciers most sensitive to such impacts. This is done through utilizing BC concentration estimated from the free-running BC simulations (freesimu) with the LMD-ZT GCM and SPRINTARS and that from constrained simulation (constrsimu) approach. Sensitivity analysis of BC-induced snow albedo reduction (SAR) to increases in annual glacier runoff is done through numerical simulations with a glacial mass balance model for the nine identified glaciers.
While freesimu of GCM-indemiss exhibited a relatively good comparison with available observations over the high-altitude locations, the constrsimu exhibited that over the low-altitude (LA) locations. A good comparison of constrsimu indicated the discrepancy in emissions in freesimu being a primary reason for the anomalous performance of freesimu over the LA stations. Estimates of BC concentration in snow (BCc) were consistent with those obtained from available studies, and their spatial mapping led to the identification of the hot-spot zone over the HKH region. Analysis of BCc over the identified glaciers located in the vicinity of the hot-spot zone over the HKH region showed a specifically high BCc and BC-induced SAR over glaciers near the Manora Peak, over northern Himalayan region (e.g., Pindari, Poting, Chorabari, and Gangotri), with their highest being those for Pindari and Poting. Using long-term BC simulations from SPRINTARS, the relative (%) rate of increase of BCc for the present years (with respect to 1961) was the highest (130 %) for the glacier (Zemu) near the eastern Himalayan region, and was 5 times that for the Pindari Glacier, thereby indicating the largest relative impact of the BC-induced glacial mass balance for the Zemu Glacier among glaciers studied, under conditions of similar glacier hypsometry and climatic setting.
Sensitivity analysis of annual glacier runoff to BC-induced albedo change indicated that HKH glaciers are more sensitive than cold Tibetan glaciers. The median of annual glacier runoff increase due to BC-induced SAR was estimated to be greater than 120 mm w.e. y−1 for HKH glaciers, with the highest being for Pindari. Among the HKH glaciers, the rate of increase in annual glacier runoff per unit BC-induced percentage SAR was specifically high for Sankalpa, Pindari, and Milam (over northern Himalayas). The present study provided information on specific glaciers over the HKH region identified as being vulnerable to BC-induced impacts (affected by high BC-induced SAR in addition to those being sensitive to BC-induced impacts). This information about the pollution-induced impact on specific glaciers is also seen to be consistent with that on signatures of observed glacial recession, indicating a relatively higher recession for Gangotri, Milam, and Pindari among the HKH glaciers.
While the source of BC aerosols over the HKH region south of 30∘ N (including the hot-spot zone) was inferred to be primarily from the biofuel emissions originating in the nearby region (IGP), it was actually over the north of 30∘ N from open burning emissions originating in a far-off region (AFWA).
Information on BC-induced impacts on SAR and sensitivity of annual glacier runoff over the HKH region will be utilized in a future study to understand the pollution-induced hydrological changes downstream and also to predict the fate of rivers originating from the region in the long run.
It is targeted to further assess the degree of improvement in the prediction of the magnitude of BC aerosols over the HKH sites through setting up a BC transport simulation with better resolved fine grid scale transport processes and vertical distribution, also including an implementation of the improved and latest BC emissions over the Indian region as an input into the model. Results from this simulation with their implication on HKH glaciers will be presented in a future study.
The data in this study are available from the corresponding author upon request (shubha@iitkgp.ac.in)
The supplement related to this article is available online at: https://doi.org/10.5194/acp-19-2441-2019-supplement.
SS conducted the constrained aerosol simulation experiments, SNICAR simulations, evaluation and validation of estimates from the GCM simulations, calculation of ARI for glaciers, and participated with SV in synthesizing and analyzing the results and writing the paper. SV designed and coordinated the study and also wrote the majority of the paper. KF performed simulation experiments with a glacial mass balance model and provided analysis on the sensitivity of glacier runoff to albedo change. Aerosol simulations in LMD-ZT GCM were conducted by SV along with OB. OB advised throughout in progress and completion of the paper. TT provided the SPRINTARS long-term simulations. IC, JFB, FM, and MS contributed to writing and analysis of results.
The authors declare that they have no conflict of interest.
This work was supported through a grant received from the Department of
Science and Technology (INT/NOR/RCN/P05/2013) and from the Ministry of
Environment, Forest, and Climate Change (14/10/2014-CC (vol. II)), Government of
India. We acknowledge the accomplishment of GCM simulations through computing
time provided by the Institut du Développement et des Ressources en
Informatique Scientifique (IDRIS) of the CNRS, France.
Edited by: Hailong Wang
Reviewed by: two anonymous referees
Babu, S. S., Chaubey, J. P., Krishna Moorthy, K., Gogoi, M. M., Kompalli, S. K., Sreekanth, V., Bagare, S., Bhatt, B. C., Gaur, V. K., Prabhu, T. P., and Singh, N. S.: High altitude (∼4520 m a.m.s.l.) measurements of black carbon aerosols over western trans-Himalayas: Seasonal heterogeneity and source apportionment, J. Geophys. Res.-Atmos., 116, https://doi.org/10.1029/2011JD016722, 2011. a
Bonasoni, P., Cristofanelli, P., Marinoni, A., Pradhan, B., Fuzzi, S., Gobbi, G., Vuillermoz, E., and Laj, P.: High concentration of black carbon observed in the high Himalayas, UNEP Black Carbon E-bulletin, 2, 15273, 2010a. a
Bonasoni, P., Laj, P., Marinoni, A., Sprenger, M., Angelini, F., Arduini, J., Bonafè, U., Calzolari, F., Colombo, T., Decesari, S., Di Biagio, C., di Sarra, A. G., Evangelisti, F., Duchi, R., Facchini, MC., Fuzzi, S., Gobbi, G. P., Maione, M., Panday, A., Roccato, F., Sellegri, K., Venzac, H., Verza, GP., Villani, P., Vuillermoz, E., and Cristofanelli, P.: Atmospheric Brown Clouds in the Himalayas: first two years of continuous observations at the Nepal Climate Observatory-Pyramid (5079 m), Atmos. Chem. Phys., 10, 7515–7531, https://doi.org/10.5194/acp-10-7515-2010, 2010b. a, b
Bonasoni, P., Cristofanelli, P., Marinoni, A., Vuillermoz, E., and Adhikary, B.: Atmospheric pollution in the Hindukush-Himalaya region: Evidence and implications for the regional climate, Mt. Res. Dev., 32, 468–479, 2012. a
Bond, T. C., Streets, D. G., Fernandes, S. D., Nelson, S. M., Yarber, K. F., Woo, J.-H., and Klimoni, Z.: A technology-based global inventory of black and organic carbon emissions from combustion, J. Geophys. Res., 109, D14203, https://doi.org/10.1029/2003JD003697, 2004. a, b
Bond, T. C., Doherty, S. J., Fahey, D. W., Forster, P. M., Berntsen, T., DeAngelo, B. J., Flanner, M. G., Ghan, S., Karcher, B., Koch, D., Kinne, S., Kondo, Y., Quinn, P. K., Sarofim, M. C., Schultz, M. G., Schulz, M., Venkataraman, C., Zhang, H., Zhang, S., Bellouin, N., Guttikunda, S. K., Hopke, P. K., Jacobson, M. Z., Kaiser, J. W., Klimont, Z., Lohmann, U., Schwarz, J. P., Shindell, D., Storelvmo, T., Warren, S. G., and Zender, C. S.: Bounding the role of black carbon in the climate system: A scientific assesment, J. Geophys. Res., 118, 1–173, https://doi.org/10.1002/jgrd.50171, 2013. a
Boucher, O. and Pham, M.: History of sulfate aerosol radiative forcings, Geophys. Res. Lett., 29, 22, https://doi.org/10.1029/2001GL014048, 2002. a
Cooke, W. F. and Wilson, J. J. N.: A global black carbon aerosol model, J. Geophys. Res., 101, 19395–19409, 1996. a, b
Cooke, W. F., Liousse, C., Cachier, H., and Feicher, J.: Construction of a fossil fuel emission data set for carbonaceous aerosol and implementation and radiative impact in the ECHAM4 model, J. Geophys. Res., 104, 22137–22162, 1999. a
Cooke, W. F., Ramaswamy, V., and Kasibhatla, P.: A general circulation model study of the global carbonaceous aerosol distribution, J. Geophys. Res., 107, 4279, ACH 2-1–ACH 2-32, https://doi.org/10.1029/2001JD001274, 2002. a
Dee, D. P., Uppala, S., Simmons, A., Berrisford, P., Poli, P., Kobayashi, S., Andrae, U., Balmaseda, M., Balsamo, G., Bauer, P., Bechtold, P. A., Beljaars, C. M., van de Berg, L., Bidlot, J., Bormann, N., Delsol, C., Dragani, R., Fuentes, M., Geer, A. J., Haimberger, L., Healy, S. B., Hersbach, H., Hólm, E. V., Isaksen, L., Kållberg, P., Köhler, M., Matricardi, M., McNally, A. P., Monge-Sanz, B. M., Morcrette, J.-J., Park, B.-K., Peubey, C., de Rosnay, P., Tavolato, C., Thépaut, J.-N., and Vitart, F.:: The ERA-Interim reanalysis: Configuration and performance of the data assimilation system, Q. J. Roy. Meteor. Soc., 137, 553–597, 2011. a
Flanner, M. G., Zender, C. S., Randerson, J. T., and Rasch, P. J.: Present-day climate forcing and response from black carbon in snow, J. Geophys. Res., 112, D11202, https://doi.org/10.1029/2006JD008003, 2007. a, b, c
Foster, P.: Changes in Atmospheric Constituents and in Radiative Forcing, in: Climate Change 2007: The Physical Science Basis. Contribution of Working Group I to the Fourth Assessment Report of the Intergovernmental Panel on Climate Change, edited by: Solomon, S., Qin, D., Manning, M., Chen, Z., Marquis, M., Averyt, K. B., Tignor, M., and Miller, H. L., 186–217, Cambridge University Press, New York, NY, USA, 2007. a
Fujita, K.: Effect of dust event timing on glacier runoff: sensitivity analysis for a Tibetan glacier, Hydrol. Process., 21, 2892–2896, https://doi.org/10.1002/hyp.6504, 2007. a, b, c
Fujita, K. and Ageta, Y.: Effect of summer accumulation on glacier mass balance on the Tibetan Plateau revealed by mass-balance model, J. Glaciol., 46, 244–252, https://doi.org/10.3189/172756500781832945, 2000. a, b
Fujita, K., Ohta, T., and Ageta, Y.: Characteristics and climatic sensitivities of runoff from a cold-type glacier on the Tibetan Plateau, Hydrol. Process., 21, 2882–2891, https://doi.org/10.1002/hyp.6505, 2007. a
Generoso, S., Bréon, F.-M., Balkanski, Y., Boucher, O., and Schulz, M.: Improving the seasonal cycle and interannual variations of biomass burning aerosol sources, Atmos. Chem. Phys., 3, 1211–1222, https://doi.org/10.5194/acp-3-1211-2003, 2003. a, b
Guenther, A., Hewitt, C. N., Erickson, D., Fall, R., Geron, C., Graedel, T., Harley, P., Klinger, L., Lerdau, M., McKay, W. A., Pierce, T., Scholes, B., Steinbrecher, R., Tallamraju, R., Taylor, J., and Zimmerman, P.: A global model of natural volatile organic compound emissions, J. Geophys. Res., 91, 14367–14376, 1995. a
Hansen, J. and Nazarenko, L.: Soot climate forcing via snow and ice albedos, P. Natl. Acad. Sci. USA, 101, 2, https://doi.org/10.1073/pnas.2237157100, 2004. a
Hourdin, F. and Armengaud, A.: The use of finite-volume methods for atmospheric advection of trace species. Part I: Test of various formulations in a general circulation model, Mon. Weather Rev., 127, 822–837, 1999. a
Hourdin, F., Talagrand, O., and Idelkadi, A.: Eulerian backtracking of atmospheric tracers. II: Numerical aspects, Q. J. Roy. Meteor. Soc., 132, 585–603, 2006. a
Jacobi, H.-W., Lim, S., Ménégoz, M., Ginot, P., Laj, P., Bonasoni, P., Stocchi, P., Marinoni, A., and Arnaud, Y.: Black carbon in snow in the upper Himalayan Khumbu Valley, Nepal: observations and modeling of the impact on snow albedo, melting, and radiative forcing, The Cryosphere, 9, 1685–1699, https://doi.org/10.5194/tc-9-1685-2015, 2015. a, b
Jacobson, M.: Climate response of fossil fuel and biofuel soot, accounting for soot's feedback to snow and sea ice albedo amd emmissivity, J. Geophys. Res., 109, D21201, https://doi.org/10.1029/2004JD004945, 2004. a
Kopacz, M., Mauzerall, D. L., Wang, J., Leibensperger, E. M., Henze, D. K., and Singh, K.: Origin and radiative forcing of black carbon transported to the Himalayas and Tibetan Plateau, Atmos. Chem. Phys., 11, 2837–2852, https://doi.org/10.5194/acp-11-2837-2011, 2011. a, b, c, d, e
Kumar, D. B., Verma, S., Boucher, O., and Wang, R.: Constrained simulation of aerosol species and sources during pre-monsoon season over the Indian subcontinent, Atmos. Res., 214, 91–108, 2018. a, b
Lamarque, J.-F., Bond, T. C., Eyring, V., Granier, C., Heil, A., Klimont, Z., Lee, D., Liousse, C., Mieville, A., Owen, B., Schultz, M. G., Shindell, D., Smith, S. J., Stehfest, E., Van Aardenne, J., Cooper, O. R., Kainuma, M., Mahowald, N., McConnell, J. R., Naik, V., Riahi, K., and van Vuuren, D. P.: Historical (1850–2000) gridded anthropogenic and biomass burning emissions of reactive gases and aerosols: methodology and application, Atmos. Chem. Phys., 10, 7017–7039, https://doi.org/10.5194/acp-10-7017-2010, 2010. a
Li, Z.-X.: Ensemble atmospheric GCM simulation of climate interannual variability from 1979 to 1994, J. Climate, 12, 986–1001, 1999. a
Lohmann, U. and Feichter, J.: Global indirect aerosol effects: a review, Atmos. Chem. Phys., 5, 715–737, https://doi.org/10.5194/acp-5-715-2005, 2005. a
Marinoni, A., Cristofanelli, P., Laj, P., Duchi, R., Calzolari, F., Decesari, S., Sellegri, K., Vuillermoz, E., Verza, G. P., Villani, P., and Bonasoni, P.: Aerosol mass and black carbon concentrations, a two year record at NCO-P (5079 m, Southern Himalayas), Atmos. Chem. Phys., 10, 8551–8562, https://doi.org/10.5194/acp-10-8551-2010, 2010. a, b
Matt, F. N., Burkhart, J. F., and Pietikäinen, J.-P.: Modelling hydrologic impacts of light absorbing aerosol deposition on snow at the catchment scale, Hydrol. Earth Syst. Sci., 22, 179–201, https://doi.org/10.5194/hess-22-179-2018, 2018. a, b
Mehta, M., Dobhal, D., Kesarwani, K., Pratap, B., Kumar, A., and Verma, A.: Monitoring of glacier changes and response time in Chorabari Glacier, Central Himalaya, Garhwal, India, Curr. Sci., 107, 281–289, 2014. a
Ménégoz, M., Krinner, G., Balkanski, Y., Boucher, O., Cozic, A., Lim, S., Ginot, P., Laj, P., Gallée, H., Wagnon, P., Marinoni, A., and Jacobi, H. W.: Snow cover sensitivity to black carbon deposition in the Himalayas: from atmospheric and ice core measurements to regional climate simulations, Atmos. Chem. Phys., 14, 4237–4249, https://doi.org/10.5194/acp-14-4237-2014, 2014. a, b
Menon, S., Koch, D., Beig, G., Sahu, S., Fasullo, J., and Orlikowski, D.: Black carbon aerosols and the third polar ice cap, Atmos. Chem. Phys., 10, 4559–4571, https://doi.org/10.5194/acp-10-4559-2010, 2010. a
Ming, J., Cachier, H., Xiao, C., Qin, D., Kang, S., Hou, S., and Xu, J.: Black carbon record based on a shallow Himalayan ice core and its climatic implications, Atmos. Chem. Phys., 8, 1343–1352, https://doi.org/10.5194/acp-8-1343-2008, 2008. a
Ming, J., Xiao, C. D., Cachier, H., Qin, D. H., Qin, X., Li, Z. Q., and Pu, J. C.: Black carbon (bc) in the snow of glaciers in west china and its potential effects on albedos, Atmos. Res., 92, 114–123, https://doi.org/10.1016/J.ATMOSRES.2008.09.007, 2009. a, b, c, d, e
Moss, R. H., Edmonds, J. A., Hibbard, K. A., Manning, M. R., Rose, S. K., Van Vuuren, D. P., Carter, T. R., Emori, S., Kainuma, M., Kram, T., Meehl, G. A., Mitchell, J. F. B., Nakicenovic, N., Riahi, K., Smith, S. J., Stouffer, R. J., Thomson, A. M., Weyant, J. P., and Wilbanks, T. J.: The next generation of scenarios for climate change research and assessment, Nature, 463, 747–756, 2010. a
Nagai, H., Fujita, K., Sakai, A., Nuimura, T., and Tadono, T.: Comparison of multiple glacier inventories with a new inventory derived from high-resolution ALOS imagery in the Bhutan Himalaya, The Cryosphere, 10, 65–85, https://doi.org/10.5194/tc-10-65-2016, 2016. a
Nair, V. S., Babu, S. S., Moorthy, K. K., Sharma, A. K., Marinoni, A., and Ajai: Black carbon aerosols over the Himalayas: direct and surface albedo forcing, Tellus B, 65, 1019–1024, https://doi.org/10.3402/tellusb.v65i0.19738, 2013. a, b, c, d, e, f, g, h
Naithani, A. K., Nainwal, H., Sati, K., and Prasad, C.: Geomorphological evidences of retreat of the Gangotri glacier and its characteristics, Curr. Sci., 80, 87–94, 2001. a
Nho-Kim, E.-Y., Michou, M., and Peuch, V.-H.: Parameterization of size-dependent particle dry deposition velocities for global modeling, Atmos. Environ., 38, 1933–1942, 2004. a
Nuimura, T., Sakai, A., Taniguchi, K., Nagai, H., Lamsal, D., Tsutaki, S., Kozawa, A., Hoshina, Y., Takenaka, S., Omiya, S., Tsunematsu, K., Tshering, P., and Fujita, K.: The GAMDAM glacier inventory: a quality-controlled inventory of Asian glaciers, The Cryosphere, 9, 849–864, https://doi.org/10.5194/tc-9-849-2015, 2015. a, b
Ojha, S., Fujita, K., Asahi, K., Sakai, A., Lamsal, D., Nuimura, T., and Nagai, H.: Glacier area shrinkage in eastern Nepal Himalaya since 1992 using high-resolution inventories from aerial photographs and ALOS satellite images, J. Glaciol., 62, 512–524, https://doi.org/10.1017/jog.2016.61, 2016. a
Ojha, S., Fujita, K., Sakai, A., Nagai, H., and Lamsal, D.: Topographic controls on the debris-cover extent of glaciers in the Eastern Himalayas: Regional analysis using a novel high-resolution glacier inventory, Quatern. Int., 455, 82–92, https://doi.org/10.1016/j.quaint.2017.08.007, 2017. a
Olivier, J. G. J. and Berdowski, J. J. M.: Global emissions sources and sinks, in: The Climate System, edited by: Berdowski, J., Guicherit, R. and Heij, B. J., A. A. Balkema Publishers/Swets & Zeitlinger Publishers, Lisse, the Netherlands, ISBN 90-5809-255-0, 2001. a, b
Painter, J.: Deglaciation in the Andean region, Human development report, 2008, United Nations Development Programme (UNDP) by the United Nations' global development network, 2007. a
Pohl, K., Cantwell, M., Herckes, P., and Lohmann, R.: Black carbon concentrations and sources in the marine boundary layer of the tropical Atlantic Ocean using four methodologies, Atmos. Chem. Phys., 14, 7431–7443, https://doi.org/10.5194/acp-14-7431-2014, 2014. a
Qian, Y., Yasunari, T. J., Doherty, S. J., Flanner, M. G., Lau, W. K., Ming, J., Wang, H., Wang, M., Warren, S. G., and Zhang, R.: Light-absorbing particles in snow and ice: Measurement and modeling of climatic and hydrological impact, Adv. Atmos. Sci., 32, 64–91, 2015. a, b
Raj, K. B. G.: Recession and reconstruction of Milam Glacier, Kumaon Himalaya, observed with satellite imagery, Curr. Sci., 100, 1420–1425, 2011. a
Ram, K., Sarin, M., and Tripathi, S.: Inter–comparison of thermal and optical methods for determination of atmospheric black carbon and attenuation coefficient from an urban location in northern India, Atmos. Res., 97, 335–342, https://doi.org/10.1016/j.atmosres.2010.04.006, 2010. a
Ramanathan, V. and Carmichael, G.: Global and regional climate changes due to black carbon, Nat. Geosci., 1, 221–227, 2008. a
Ramanathan, V., Crutzen, P., Lelieveld, J., Mitra, A., Althausen, D., Andrae, M., Cantrell, W., Cass, G., Chung, C., Clarke, A., Coakley, J., Collins, W., Conant, W., Dulac, F., Heintzenberg, J., Heymsfield, A., Holben, B., Howell, S., Hudson, J., Jayaraman, A., Kiehl, J., Krishnamurti, T., Lubin, D., McFarquhar, G., Novakov, T., Orgen, J., Prospero, I., Quinn, P., Rajeev, K., Rasch, P., Rupert, S., Sadourny, R., and Valero, F.: Indian Ocean Experiment: An integrated analysis of the climate forcing and effects of the great Indo-Asian haze, J. Geophys. Res., 106, 28371–28398, 2001a. a
Ramanathan, V., Crutzen, P. J., Kiehl, J. T., and Rosenfeld, D.: Aerosols, Climate, and the Hydrological Cycle, Science, 294, 2119–2124, 2001b. a
Reddy, M. S. and Venkataraman, C.: Inventory of aerosol and sulphur dioxide emissions from India: I – Fossil fuels combustion, Atmos. Environ., 36, 677–697, 2002a. a, b, c
Reddy, M. S. and Venkataraman, C.: Inventory of aerosol and sulphur dioxide emissions from India: II – Biomass combustion, Atmos. Environ., 36, 699–712, 2002b. a, b, c
Reddy, M. S., Boucher, O., Venkataraman, C., Verma, S., Léon, J.-F., Bellouin, N., and Pham, M.: General circulation model estimates of aerosol transport and radiative forcing during Indian Ocean Experiment, J. Geophys. Res., 109, D16205, https://doi.org/10.1029/2004JD004557, 2004. a
Sakai, A. and Fujita, K.: Contrasting glacier responses to recent climate change in high-mountain Asia, Sci. Rep., 7, 13717, https://doi.org/10.1038/s41598-017-14256-5, 2017. a, b
Sakai, A., Nuimura, T., Fujita, K., Takenaka, S., Nagai, H., and Lamsal, D.: Climate regime of Asian glaciers revealed by GAMDAM glacier inventory, The Cryosphere, 9, 865–880, https://doi.org/10.5194/tc-9-865-2015, 2015. a
Sangewar, C. and Kulkarni, A.: Observational studies of the recent past, Report of the Study Group on Himalayan glaciers prepared for the Office of the Principal Scientific Adviser to the Government of India, New Delhi, India, PSA/2011/2, 2576, 2011. a, b
Schulz, M., Textor, C., Kinne, S., Balkanski, Y., Bauer, S., Berntsen, T., Berglen, T., Boucher, O., Dentener, F., Guibert, S., Isaksen, I. S. A., Iversen, T., Koch, D., Kirkevåg, A., Liu, X., Montanaro, V., Myhre, G., Penner, J. E., Pitari, G., Reddy, S., Seland, Ø., Stier, P., and Takemura, T.: Radiative forcing by aerosols as derived from the AeroCom present-day and pre-industrial simulations, Atmos. Chem. Phys., 6, 5225–5246, https://doi.org/10.5194/acp-6-5225-2006, 2006. a
Spiro, P. A., Jacob, D. J., and Logan, J. A.: Global inventory of sulfur emissions with 1×1 resolution, J. Geophys. Res.-Atmos., 97, 6023–6036, 1992. a
Streets, D. G., Bond, T. C., Carmichael, G. R., Fernandes, S. D., Fu, Q., He, D., Klimont, Z., Nelson, S. M., Tsai, N. Y., Wang, M. Q., Woo, J.-H., and Yarber, K. F.: An inventory of gaseous and primary aerosol emissions in Asia in the year 2000, J. Geophys. Res., 108, 8809, https://doi.org/10.1029/2002JD003093, 2003a. a, b
Takemura, T.: Distributions and climate effects of atmospheric aerosols from the preindustrial era to 2100 along Representative Concentration Pathways (RCPs) simulated using the global aerosol model SPRINTARS, Atmos. Chem. Phys., 12, 11555–11572, https://doi.org/10.5194/acp-12-11555-2012, 2012. a, b, c
Takemura, T., Egashira, M., Matsuzawa, K., Ichijo, H., O'ishi, R., and Abe-Ouchi, A.: A simulation of the global distribution and radiative forcing of soil dust aerosols at the Last Glacial Maximum, Atmos. Chem. Phys., 9, 3061–3073, https://doi.org/10.5194/acp-9-3061-2009, 2009. a
Takemura, T. H., Okamoto, H., Maruyama, Y., Numaguti, A., Higurashi, A., and Nakajima, T.: Global three-dimensional simulation of the aerosol optical thickness distribution of various origins, J. Geophys. Res., 105, 17853–17873, 2000. a
Tanikawa, T., Stamnes, K., Aoki, T., Kuchiki, K., Hachikubo, A., and Sugiura, K.: Effects of snow impurities and vertical profile on snow albedo and reflectance, Eos Trans, AGU, Fall Meeting Suppl., San Francisco, California, USA, 90, 2009. a
Textor, C., Schulz, M., Guibert, S., Kinne, S., Balkanski, Y., Bauer, S., Berntsen, T., Berglen, T., Boucher, O., Chin, M., Dentener, F., Diehl, T., Easter, R., Feichter, H., Fillmore, D., Ghan, S., Ginoux, P., Gong, S., Grini, A., Hendricks, J., Horowitz, L., Huang, P., Isaksen, I., Iversen, I., Kloster, S., Koch, D., Kirkevåg, A., Kristjansson, J. E., Krol, M., Lauer, A., Lamarque, J. F., Liu, X., Montanaro, V., Myhre, G., Penner, J., Pitari, G., Reddy, S., Seland, Ø., Stier, P., Takemura, T., and Tie, X.: Analysis and quantification of the diversities of aerosol life cycles within AeroCom, Atmos. Chem. Phys., 6, 1777–1813, https://doi.org/10.5194/acp-6-1777-2006, 2006. a
Verma, S., Venkataraman, C., Boucher, O., and Ramachandran, S.: Source evaluation of aerosols measured during the Indian Ocean Experiment using combined chemical transport and back trajectory modeling, J. Geophys. Res., 112, D11210, https://doi.org/10.1029/2006JD007698, 2007. a, b
Verma, S., Venkataraman, C., and Boucher, O.: Origin of surface and columnar INDOEX aerosols using source- and region-tagged emissions transport in a general circulation model, J. Geophys. Res., 113, D24211, https://doi.org/10.1029/2007JD009538, 2008. a, b, c
Verma, S., Venkataraman, C., and Boucher, O.: Attribution of aerosol radiative forcing over India during the winter monsoon to emissions from source categories and geographical regions, Atmos. Environ., 45, 4398–4407, https://doi.org/10.1016/j.atmosenv.2011.05.048, 2011. a, b, c
Verma, S., Bhanja, S., Pani, S., and Misra, A.: Aerosol optical and physical properties during winter monsoon pollution transport in an urban environment, Environ. Sci. Pollut. R., 21, 4977–4994, https://doi.org/10.1007/s11356-013-2383-5, 2014. a
Vohra, C.: Himalayan glaciers, The Himalaya: the Aspects of change, Oxford University Press, India, 138–151, 1981. a, b, c, d
Vohra, C.: In Harnessing Eastern Himalayan Rivers, Konark Publishers, New Delhi, India, 1993. a
Wang, H., Rasch, P. J., Easter, R. C., Singh, B., Zhang, R., Ma, P.-L., Qian, Y., Ghan, S. J., and Beagley, N.: Using an explicit emission tagging method in global modeling of source-receptor relationships for black carbon in the Arctic: Variations, sources, and transport pathways, J. Geophys. Res.-Atmos., 119, 12888–12909, https://doi.org/10.1002/2014JD022297, 2014. a, b
Warren, S. G. and Wiscombe, W. J.: A model for the spectral albedo of Snow. II: Snow containing atmospheric aerosols, J. Atmos. Sci., 106, 2734–2745, 1980. a, b, c, d
Xu, B., Yao, T., Liu, X., and Wang, N.: Elemental and organic carbon measurements with a two-step heating–gas chromatography system in snow samples from the Tibetan Plateau, Ann. Glaciol., 43, 257–262, 2006. a, b
Yasunari, T. J., Bonasoni, P., Laj, P., Fujita, K., Vuillermoz, E., Marinoni, A., Cristofanelli, P., Duchi, R., Tartari, G., and Lau, K.-M.: Estimated impact of black carbon deposition during pre-monsoon season from Nepal Climate Observatory – Pyramid data and snow albedo changes over Himalayan glaciers, Atmos. Chem. Phys., 10, 6603–6615, https://doi.org/10.5194/acp-10-6603-2010, 2010. a, b, c, d, e, f
Yasunari, T. J., Tan, Q., Lau, K.-M., Bonasoni, P., Marinoni, A., Laj, P., Ménégoz, M., Takemura, T., and Chin, M.: Estimated range of black carbon dry deposition and the related snow albedo reduction over Himalayan glaciers during dry pre-monsoon periods, Atmos. Environ., 78, 259–267, 2013. a
Zhang, R., Wang, H., Qian, Y., Rasch, P. J., Easter, R. C., Ma, P.-L., Singh, B., Huang, J., and Fu, Q.: Quantifying sources, transport, deposition, and radiative forcing of black carbon over the Himalayas and Tibetan Plateau, Atmos. Chem. Phys., 15, 6205–6223, https://doi.org/10.5194/acp-15-6205-2015, 2015. a, b, c, d, e, f, g, h, i, j, k, l, m
Zhang, Y., Kang, S., Cong, Z., Schmale, J., Sprenger, M., Li, C., Yang, W., Gao, T., Sillanpää, M., Li, X., Liu, Y., Chen, P., and Zhang, X.: Light-absorbing impurities enhance glacier albedo reduction in the southeastern Tibetan plateau, J. Geophys. Res.-Atmos., 122, 6915–6933, 2017. a, b