the Creative Commons Attribution 4.0 License.
the Creative Commons Attribution 4.0 License.
 | 12 Feb 2019
Importance of biogenic volatile organic compounds to acyl peroxy nitrates (APN) production in the southeastern US during SOAS 2013
Shino Toma
Steve Bertman
Christopher Groff
Fulizi Xiong
Paul B. Shepson
Paul Romer
Kaitlin Duffey
Paul Wooldridge
Ronald Cohen
Karsten Baumann
Eric Edgerton
Abigail R. Koss
Joost de Gouw
Allen Goldstein
Weiwei Hu
Jose L. Jimenez
Gas-phase atmospheric concentrations of peroxyacetyl nitrate (PAN), peroxypropionyl nitrate (PPN), and peroxymethacryloyl nitrate (MPAN) were measured on the ground using a gas chromatograph electron capture detector (GC-ECD) during the Southern Oxidants and Aerosols Study (SOAS) 2013 campaign (1 June to 15 July 2013) in Centreville, Alabama, in order to study biosphere–atmosphere interactions. Average levels of PAN, PPN, and MPAN were 169, 5, and 9 pptv, respectively, and the sum accounts for an average of 16 % of NOy during the daytime (10:00 to 16:00 local time). Higher concentrations were seen on average in air that came to the site from the urban NOx sources to the north. PAN levels were the lowest observed in ground measurements over the past two decades in the southeastern US. A multiple regression analysis indicates that biogenic volatile organic compounds (VOCs) account for 66 % of PAN formation during this study. Comparison of this value with a 0-D model simulation of peroxyacetyl radical production indicates that at least 50 % of PAN formation is due to isoprene oxidation. MPAN has a statistical correlation with isoprene hydroxynitrates (IN). Organic aerosol mass increases with gas-phase MPAN and IN concentrations, but the mass of organic nitrates in particles is largely unrelated to MPAN.
- Article
(3718 KB) -
Supplement
(1029 KB) - BibTeX
- EndNote


Acyl peroxy nitrates (carboxylic nitric anhydrides) (APN, RC(O)OONO2), products of the photooxidation of volatile organic compounds (VOCs) in the presence of nitrogen oxides (), play an important role in the chemistry of both gases and particles in the troposphere. Measurements around the world have shown that APN can comprise 15 %–40 % of total gas-phase oxidized nitrogen (NOy) in rural and forested areas, including the eastern United States depending on how aged the air sampled at the site is (e.g., Trainer et al., 1993; Nouaime et al., 1998). The fraction depends on air mass history and conditions, since wet deposition of nitric acid, the other major component, will affect total NOy levels. APN are ubiquitous reservoir species for NOx and radicals in the atmosphere that affect the lifetime of NOx and enhance tropospheric O3 formation (Carter et al., 1981). In addition, they are significant health hazards for both humans and plants (Finlayson-Pitts and Pitts, 2000; Kleindienst et al., 1990).
The peroxyacyl (PA) radicals that are the immediate precursors of APN can form directly from aldehydes via hydrogen abstraction or from intermediate fragmentation of larger organic compounds and hence can have both anthropogenic and biogenic origins (Roberts, 2007). Peroxyacetyl nitrate (PAN) is the simplest and most abundant of the APN, typically accounting for more than three-quarters of the total APN concentration. Scission of the thermally weak bond to NO2 regenerates the PA radical (Reaction R1). Permanent loss of PAN occurs when the PA radical is lost (Reaction R2). With sufficient NOx, this occurs via reduction by NO, and gas-phase PAN thermal lifetime, assuming steady-state for PA, depends on the ratio NO∕NO2 as Eq. (1). Peroxy radicals compete with NO for reaction with PA at low NOx.
Peroxypropionyl nitrate (PPN) and peroxymethacryloyl nitrate (MPAN) also are observed in the field (e.g., Nouaime et al., 1998; Pippin et al., 2001; Roberts et al., 2002). PAN is formed from both anthropogenic and biogenic hydrocarbon precursors. PPN, on the other hand, is formed primarily from anthropogenic hydrocarbons (AHCs) (e.g., propanal, propane, 1-butene), while MPAN is derived from methacrolein (MACR), an oxidation product of the mostly biogenic hydrocarbon (BHC) isoprene (e.g., Biesenthal and Shepson, 1997; Carter and Atkinson, 1996).
Recent laboratory experiments have suggested that OH reaction with the double bond of MPAN could be involved in the formation of secondary organic aerosol (SOA) (Chan et al., 2010; Kjaergaard et al., 2012; Lin et al., 2013; Nguyen et al., 2015; Surratt et al., 2010; Worton et al., 2013). This pathway is currently treated in a few models that include isoprene (e.g., Pye et al., 2013, 2015; Jenkin et al., 2015; Wennberg et al., 2018), although isoprene is the biogenic non-methane hydrocarbon with the greatest global emission rate (Guenther et al., 1995), the contribution of isoprene photooxidation to secondary organic aerosol formation may be underestimated.
We measured APN concentration during the SOAS 2013 campaign to characterize the systematic behavior and levels of individual APN species at an urban-impacted forest and to assess the current state of the attribution of PAN formation to biogenic and anthropogenic precursors quantitatively using several statistical methods. Finally, we compared MPAN with another nitrogen compound in the gas phase, total isoprene hydroxynitrates (IN), and with organic nitrates or total organic aerosol (OA) in the particle phase to investigate relationships that might explain their influence on SOA formation.
Ground-based measurements were conducted from 1 June to 15 July 2013 at the Southeastern Aerosol Research and Characterization (SEARCH) Centreville (CTR) site, which is located in mixed deciduous–evergreen forest in the Talladega National Forest near Brent, Alabama (lat: +32∘54′11.81, long: −87∘14′59.79). The major anthropogenic influence at this site comes from the cities of Tuscaloosa and Birmingham, which are located 50 km northwest and 80 km northeast, respectively. The meteorological conditions of the ground site have been described in detail in Carlton et al. (2018) and Hidy et al. (2014).
Measurements of APN using similar methods to those described below were made in Dickson, TN, from 15 June to 14 July, 1999 as part of the Southern Oxidants Study (SOS) (Cowling et al., 1998) and are referred to in the text. The site is in an area of mixed deciduous forest and pasture land located near Montgomery Bell State Park about 60 km west–southwest (upwind) of downtown Nashville, TN (Chen, 2001). While in a different part of the southeast, we believe that the distance from major urban areas makes this site a good comparison.
APN were quantified using a custom gas chromatograph (GC) equipped with a Shimadzu GC-Mini-2 63Ni electron capture detector (ECD) maintained at 55 ∘C (described by Nouaime et al., 1998). A polar column (RESTEK, Rtx-200, 15 m × 0.53 mm ID × 1 µm) was kept at 15 ∘C to minimize thermal decomposition of APN compounds. Helium was used as a carrier (8 cm3 min−1) with N2 make-up gas (3 cm3 min−1). Ambient air was drawn through a 1∕4 in. OD PFA Teflon tube from 8.2 m height above the ground at 1 SLPM and a subsample of this air was drawn through a 1 cm3 sample loop at 50 sccm. The residence time was approximately 9 s. The sample loop contents were injected into the column at 20 min intervals via a six-port Teflon valve (Hamilton). The baseline and sensitivity of the GC-ECD were checked every day during the campaign using standard addition of gas streams from liquid standards added to ambient air scrubbed through a charcoal trap at the beginning of the sampling line. In this way, the impact of the inlet line was accounted for in the calibration. Separate calibrations were performed with synthetic PAN, PPN, and MPAN samples in dodecane or tridecane maintained at ice water temperature in diffusion cells. The level of analyte in each synthetic compound was determined with a chemiluminescence NOx analyzer (Themo Environmental Instruments, Inc., Model 42S) equipped with a Mo converter held at 325 ∘C. The converter efficiency was tested by O3 titration of NO to NO2. Calibration of the NOx analyzer was done against a NIST-traceable cylinder of 2 ppmv NO in N2 (SCOTT-MARRIN, INC). Based on sensitivity and background measurements, the detection limits () for PAN, PPN, and MPAN were estimated as 2.5, 3.6, and 3.9 pptv, respectively. Uncertainty determined by error propagation, most of which came from the chemiluminescence NOx analyzer, was estimated to be 20 % RSD.
Measurements of other trace gases, such as NOy (total reactive nitrogen measured by catalytic conversion), NOx, and O3, wind direction, temperature, and boundary layer height were made by Atmospheric Research & Analysis, Inc. (ARA) as described by Hidy et al. (2014). Boundary layer heights were calculated by ARA using lidar back-scatter measurements from a Lufft CHM 15k ceilometer. Total isoprene hydroxynitrate (IN) concentrations were determined by Purdue University using a chemical ionization mass spectrometer (CIMS) with operating conditions described by Xiong et al. (2015). VOC measurements, including isobutane, isopentane, MACR, and isoprene, were measured by NOAA ESRL Chemical Sciences Division and University of California, Berkeley (Goldstein group) using a GC-MS. Particle-phase organic nitrates (pONs) were measured by University of California, Berkeley (Cohen group) using thermal dissociation laser-induced fluorescence (TD-LIF), described by Rollins et al. (2010), and by University of Colorado with a high-resolution time-of-flight aerosol mass spectrometer (HR-ToF-AMS) described by DeCarlo et al. (2006) and Hu et al. (2015). A comparison in Lee et al. (2016) found that the pONs-TD-LIF was generally higher by a factor of ∼5 than pONs-HR-ToF-AMS. Both sets of data provide a reasonable range of pONs concentration. Total OA mass was measured using HR-ToF-AMS.
3.1 General behavior of APN in 2013
Figure 1 shows a time series of PAN, PPN, and MPAN throughout the campaign. Data that were below detection limit (BDL) are plotted at half of the reported detection limit for that compound. This was done to distinguish the BDL points from missing data due to tests, calibrations, and the periodic existence of a noise interference that often appeared during this campaign and could not be eliminated, and to not lose the low concentration information content. Relatively high levels of APN were observed as periodic spikes during the campaign, but overall APN levels were lower than most other measurements in the southeast made over the last 20 years (see Sect. 3.2). A local biomass burning event was observed on 4 June (Washenfelder et al., 2015), which resulted in an unusually high level of PAN of around 1600 pptv and an extreme deviation from the median. Hence, the data on 4 June were removed from statistical analyses.
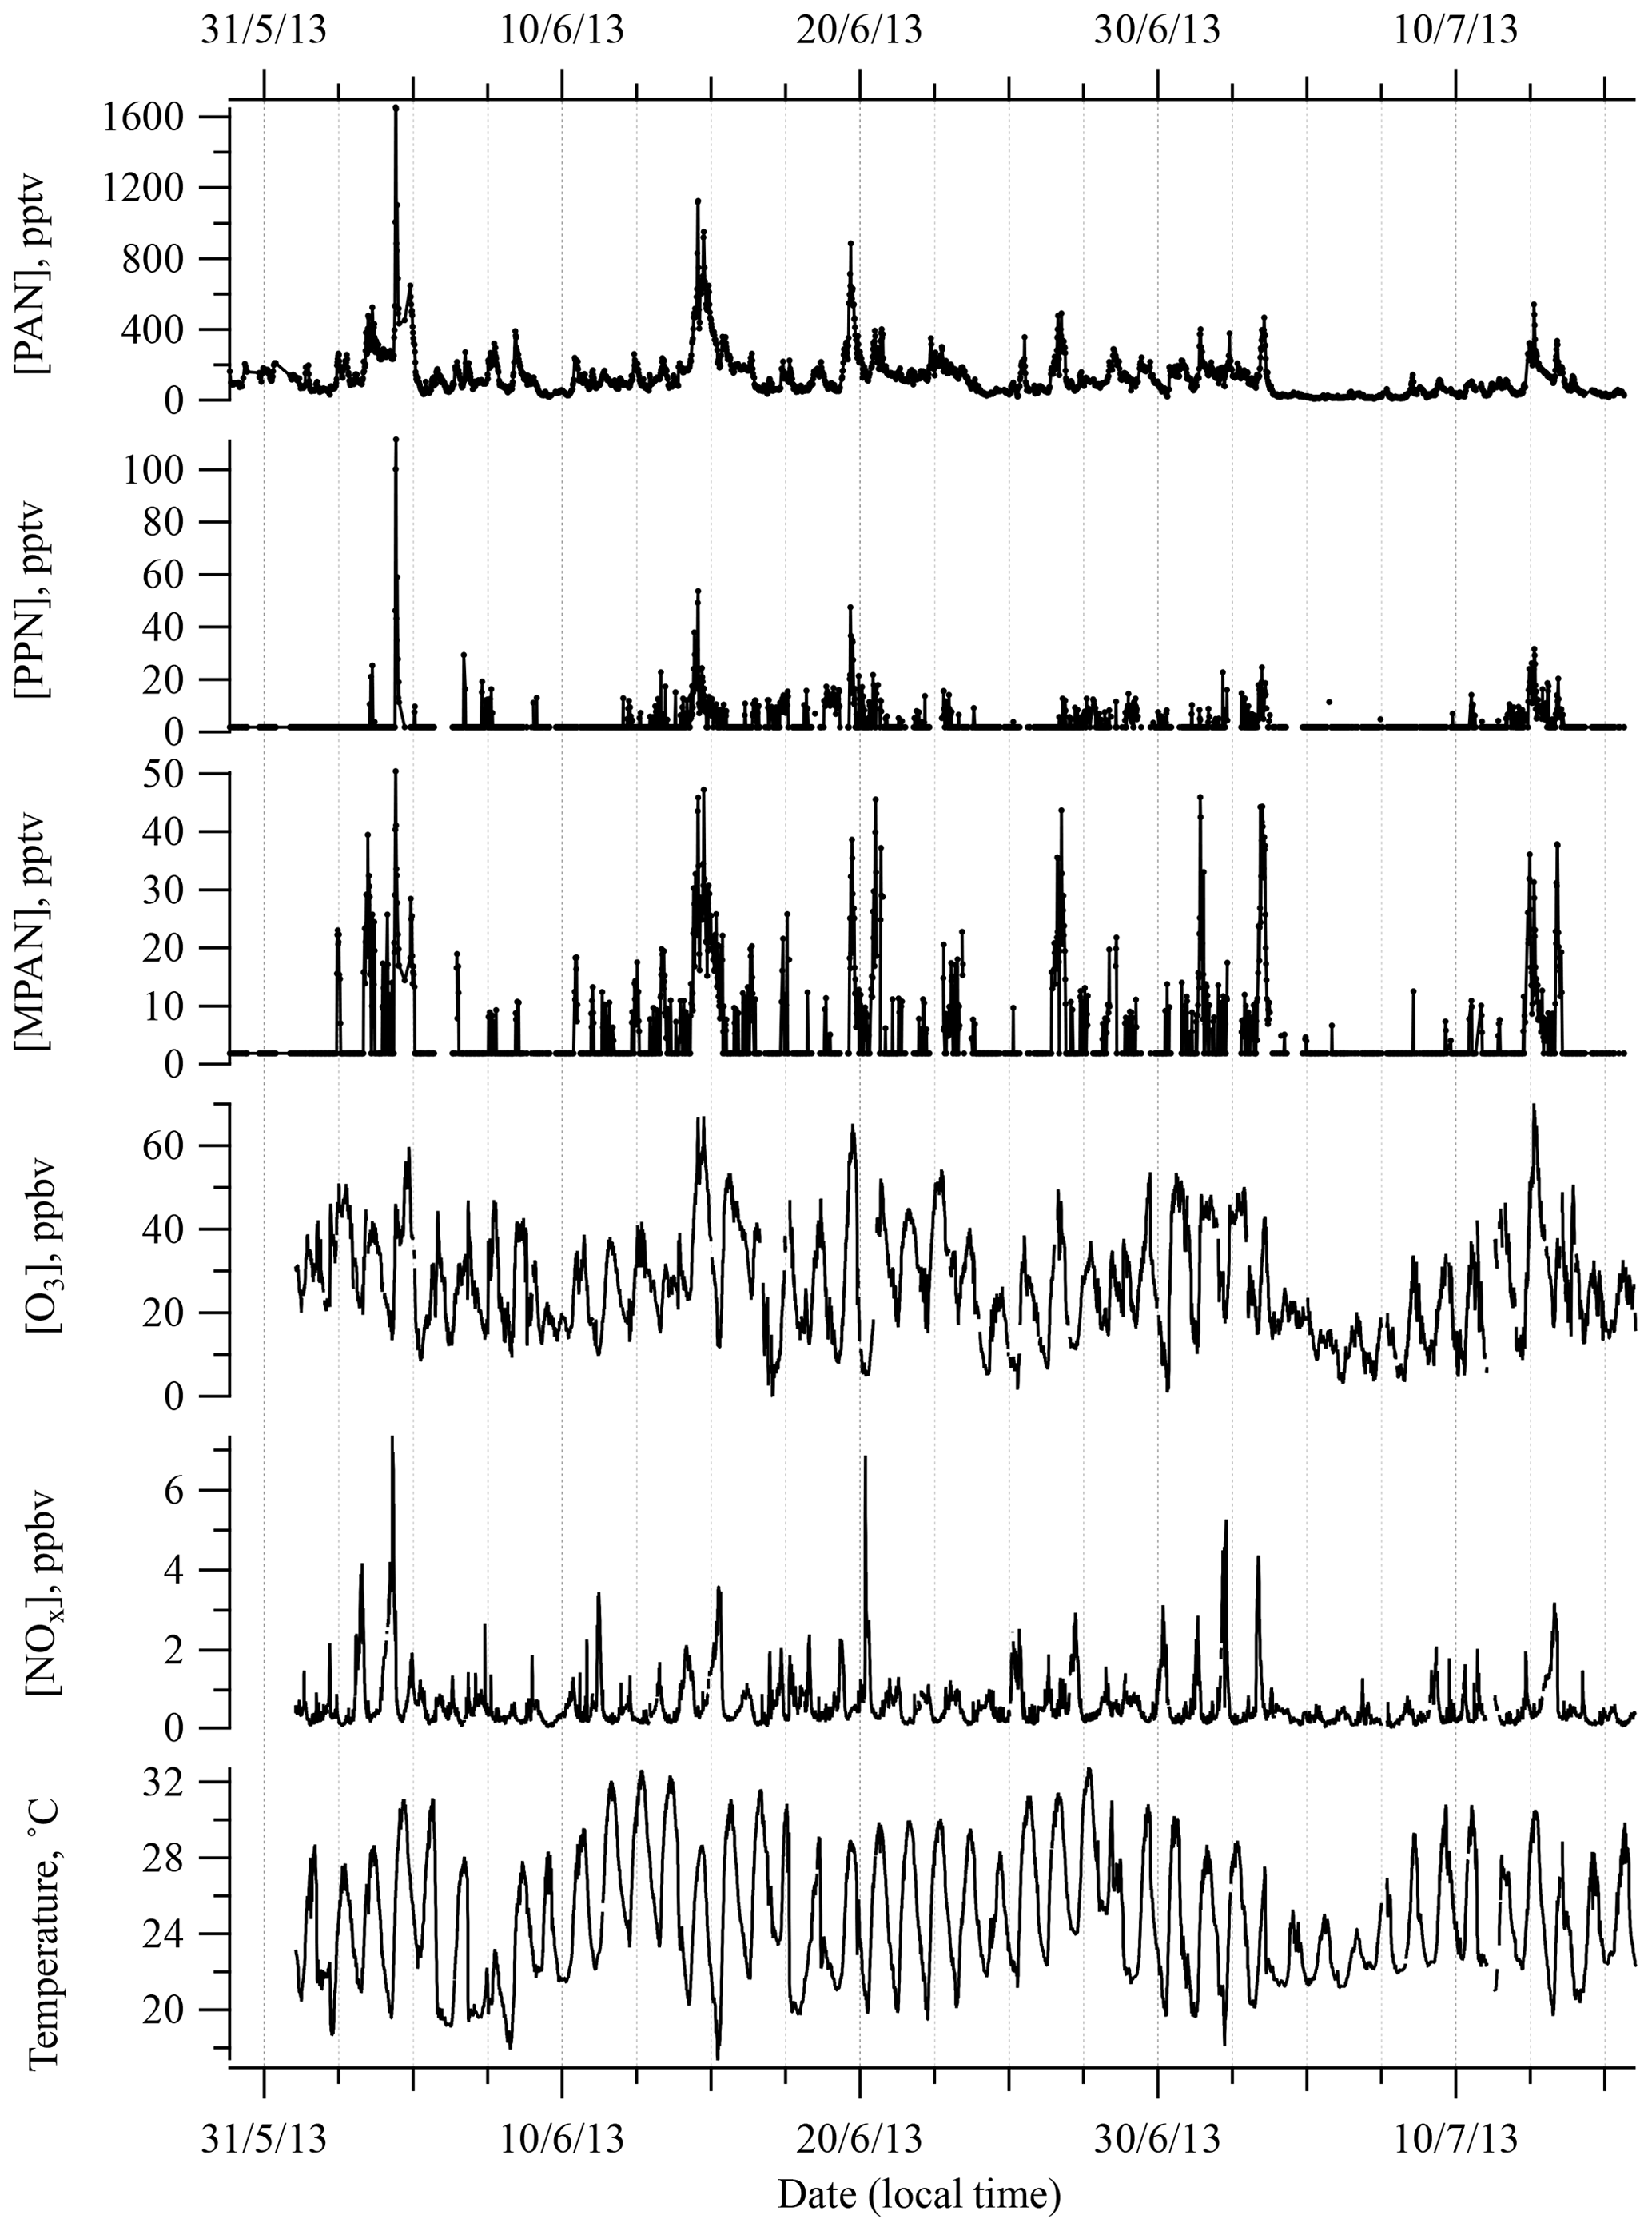
Figure 1Time series of PAN, PPN, MPAN , O3, and NOx, and temperature during SOAS 2013 campaign. Data that were below detection limit (BDL) are included at half of the detection limit.
General descriptive statistics for all daytime data are summarized in Table 1. Daytime was defined as 10:00 to 16:00 local time (CDT). PAN was consistently the most abundant peroxyacyl nitrate compound, the mean daytime levels accounting for approximately 90 % of total APN. In Table 1, “APN” describes the sum of individual PAN, PPN, and MPAN values. The average of the ratio of APN ∕ NOy during daytime was 0.16. Peroxyacryloyl nitrate (APAN) was also observed occasionally during the campaign. APAN has been proposed to arise from 1,3-butadiene, either from anthropogenic sources or biomass burning, and from direct emission of acrolein (Roberts et al., 2001; Tanimoto and Akimoto, 2001). Our data did not show a strong relationship to biomass burning events, as identified by Washenfelder et al. (2015), although an instrument interference problem limited the amount of reportable APAN data, so no clear conclusion can be drawn.
Table 1Summary of selective Southern Oxidants Study (SOS) data since 1990. Mean ± standard deviation.

1 a.g.l. means above ground level. Daytime is 10:00–16:00 local time. 2 The data on 4 June were not included. PPN and
MPAN include data below the detection limit, 1.8 and 1.9 pptv, respectively.
3 APN were
calculated as the sum of PAN, PPN, and MPAN.
The data were recalculated based on time and day. 4 Frost et
al. (1998). 5 Buhr et al. (1995). 6 Cantrell et al. (1992).
7 Roberts et al. (1998). 8 Baumann et al. (2000). 9 Starn et
al. (1998). 10 Nouaime et
al. (1998). 11 Barket et al. (2004).
12 Roberts et al. (2002). 13 Thornton et al. (2002).
Although sampled air most frequently came from the south during the SOAS 2013 campaign, air from the north contained levels of APN that were twice as large as from south. The averages of PAN, PPN, and MPAN with air from the north were 182, 5.3, and 8.4 pptv, respectively, while averages of air from south showed 94.6, 2.8, and 3.6 pptv. Polar plots of PAN, PPN, and MPAN as a function of surface wind direction are shown in Fig. S3 in the Supplement with wind frequency. This elevated northern distribution is also seen with NOx and O3 reflecting the influence of anthropogenic pollution sources from Tuscaloosa, Birmingham, and Atlanta.
Plots of diurnal mean separated by surface wind direction (Fig. 2) indicate a noticeable pattern in PAN, PPN, and MPAN from the north and a much weaker pattern in southerly air. Levels of all three APN were highest (also with greatest variance) during the daytime on average. The diurnal cycle for PPN was less pronounced because of the low concentrations observed over the campaign. The PAN diurnal pattern was generally similar to those reported for Nashville in 1995 and 1999 (Nouaime et al., 1998; Roberts et al., 2002) resulting from early morning breakup of a nocturnal inversion that was commonly observed at the site. Similar behavior is observed at SOAS in ozone, NOx, and isoprene. The diurnal behavior and midday means of APN ∕ NOy are very similar between the Dickson site and the SOAS site (Fig. S4a).
A calculation of PAN thermal decomposition lifetime using ambient temperature and [NO]∕[NO2] shows that the effective lifetime changes little over the course of the afternoon, which suggests that PAN levels fluctuate during early afternoon mostly due to dilution by boundary layer growth. Boundary layer height increased by a factor of 2–3 from 09:00 to 15:00 on average, based on lidar measurements.
3.2 Historical PAN measurements in the southeastern US over the last 23 years
APN compounds have been measured at various rural and urban locations within the southeastern US over the last 23 years. Observations from six sites, Elberton (GA) 1990; Rural Oxidants in a Southern Environment (ROSE; AL) 1990 and 1992; New Hendersonville (TN) 1994; Youth Inc. (TN) 1995; Dickson (TN) 1999; and Cornelia Fort Airpark (TN) 1999, are compared here with SOAS 2013 data (a map of the locations is shown in Fig. S2 and descriptive statistics of APN and other trace gases are summarized in Table 1).

Figure 2Diurnal behavior of PAN, PPN, and MPAN during SOAS 2013 with wind from the south and north.
Binned PAN concentrations during the daytime (10:00–16:00) are plotted as a function of the concentration of NOx (grouped into deciles) in Fig. 3a. Urban areas have higher PAN and NOx concentrations than rural areas. The only site sampled in more than 1 year was ROSE, where PAN levels in 1990 were more than twice as high as in 1992. Overall, the PAN concentrations were variable between sites and years. A log-normal curve fit of the data in Fig. 3a shows an asymmetric peak in the concentration at around 3.5 ppb NOx. PAN concentration increases approximately linearly with NOx up to 2 ppb and beyond the peak it decreases slowly with further increases in NOx. Similar behavior was observed in the relationship between O3 and NOx concentration in Fig. 3b with a maximum around 1.5 ppb NOx.
The relationship of O3 production with NOx and VOC concentrations is typically discussed in terms of “NOx-limited” and “VOC-limited” regimes (Finlayson-Pitts and Pitts, 2000; Milford et al., 1994; Chameides et al., 1992), although there has been less discussion of the sensitivity of PAN production to these reactants. This curve is reminiscent of the modeled O3 production rate as a function of NOx and HOx () in Thornton et al. (2002) from OH oxidation of VOC based on measurements from Cornelia Fort Airpark in 1999. At low NO concentration, O3 production rate increases with NO, since OH is regenerated via HO2+NO and the primary chain termination reactions are HOx+HOx. At higher NO concentrations, O3 production rate slows as OH is consumed by NOx-removing chain termination reactions (HO+NO2 and ) that become faster than HOx+HOx reactions. The peak in Fig. 3 is related to the crossover point between NOx-limited and NOx-saturated. A high HOx production rate enhances the O3 production rate with NO for low NO and the crossover point shifts to higher NO. The relationship based on field data in Fig. 3 is phenomenological and reflects a complex combination of production and loss processes. Untangling the exact mechanisms that contribute to the observed behavior was not investigated, although several mechanisms could contribute. For instance, older air masses would reflect different PAN∕NOx ratios. Based on average APN∕NOy ratios (Fig. S4a), the air masses experienced at Dickson and SOAS were of similar ages. Differential loss rates for PAN and NOx or overall shorter lifetimes could yield lower absolute values and could also influence this ratio. As seen in Fig. 1, and explained in Hidy et al. (2014), ozone, NOx, and photolysis rates were all lower at this ground site than in previous years, which likely results in lower overall oxidation rates due to lower radical production rate. Lower radical production rate also increases the isoprene lifetime and leads to larger midday average levels of isoprene than seen in other southeastern ground sites (Table 1).
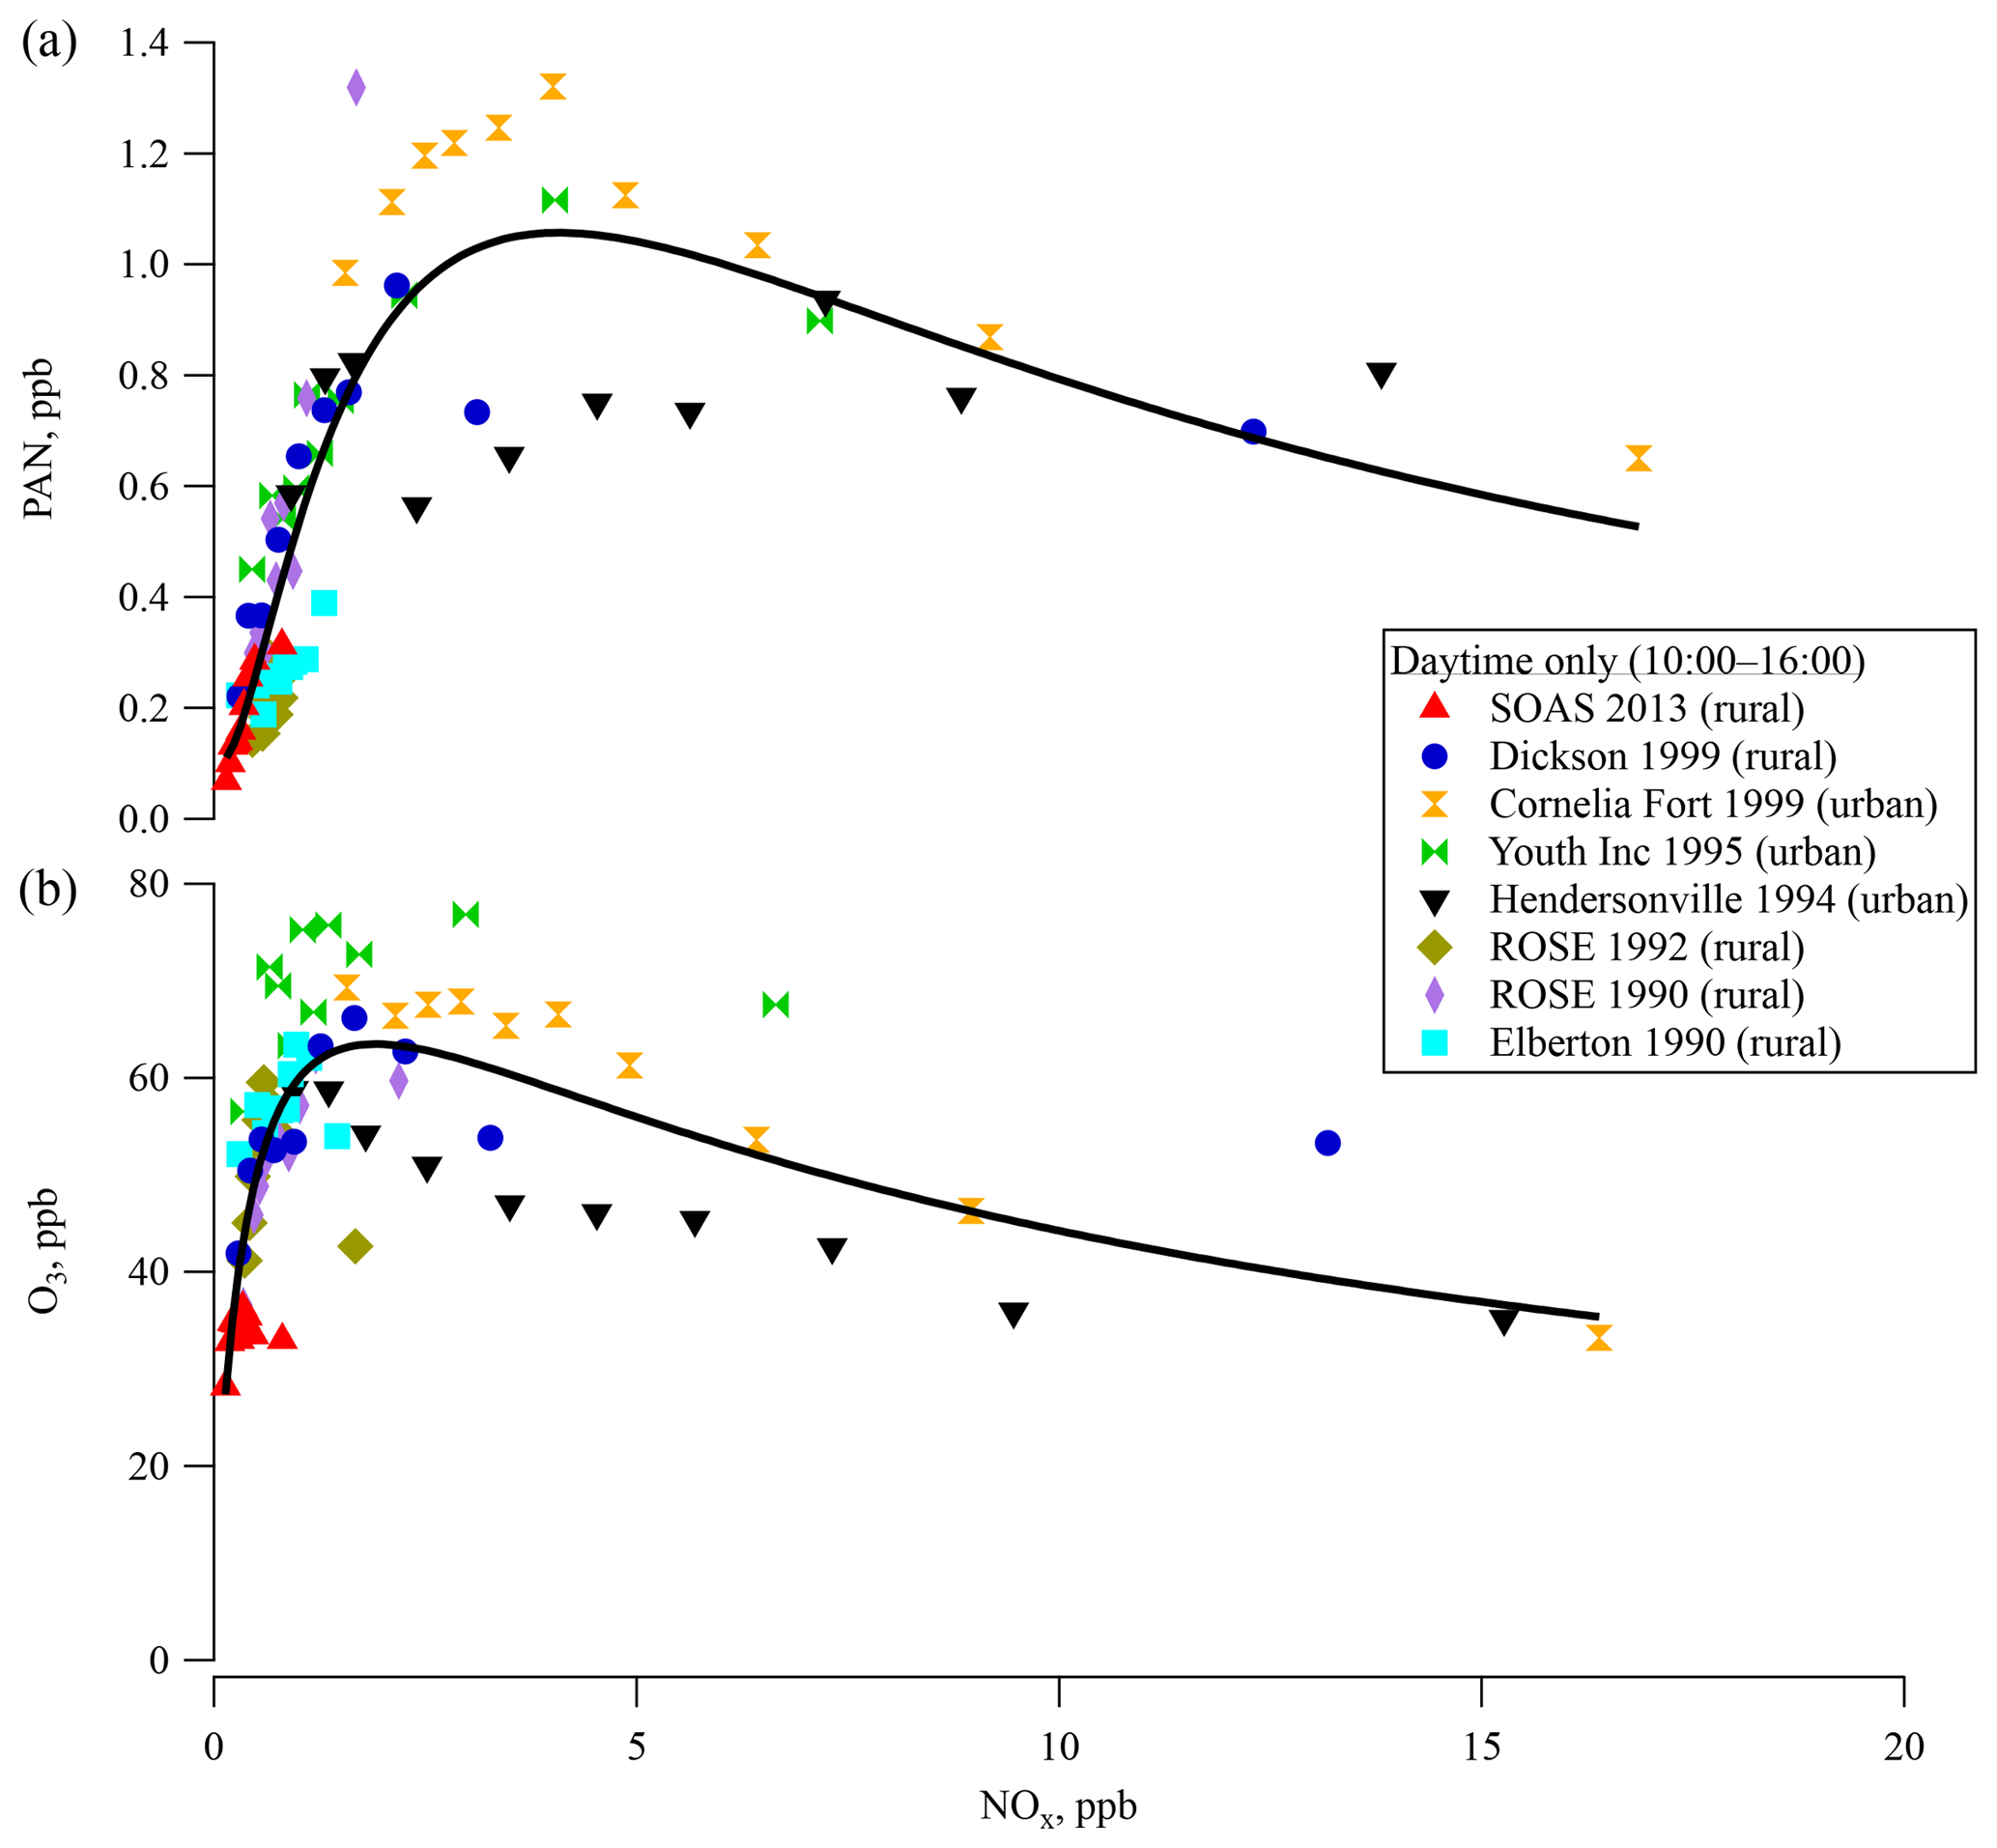
Figure 3Surface (a) PAN and (b) ozone concentrations for each ground site in the southeastern US over the last 23 years for 10:00–16:00 as a function of the concentration of NOx in deciles. The solid line indicates a fit line for all measurements.
The covariance between PAN and O3 (Bottenheim et al., 1994) due to their common photochemical pathway in the atmosphere suggests that the steep increase of PAN concentrations with NOx at low NOx in Fig. 3a could result from NOx-limited chemistry. PAN at sites with lower NOx levels seem to be more sensitive to NOx concentrations, as is seen for most of the rural sites in this region. The slow decrease of PAN concentration at higher NOx levels such as those seen at more urban sites could result from faster radical termination rates, and thus slower VOC oxidation rates. This empirically derived distinction is likely related to differences in reaction rates with peroxy radicals that could be investigated computationally. PAN, O3, and NOx levels in the southeast were all lowest at SOAS 2013. As NOx levels continue to decrease in the country (Blanchard et al., 2012; Russell et al., 2012; USEPA, 2018), PAN production rates might become more widely sensitive to NOx. Emission inventories for anthropogenic VOC emissions have steadily decreased in the southeast over the last few decades. Mean isobutane and isopentane levels measured at the Centreville site were 70 % lower in 2013 than in 1993 (Hagerman et al., 1997). VOC measurements at SEARCH sites show more consistent BVOC levels over the same time (Hagerman et al., 1997; Hidy et al., 2014; USEPA, 2018; Eric Edgerton, unpublished data).
3.3 Anthropogenic vs. biogenic contribution to PAN production
3.3.1 Description of MLR and its statistical meaning
A multiple linear regression (MLR) has been used to quantify PAN precursors (Roberts et al., 2002, 1998; Williams et al., 1997). Since the thermal decomposition rates of APN are similar (Roberts and Bertman, 1992), and MPAN and PPN are formed from BHC and AHC, respectively, and PAN is formed from both, [PAN] can be approximately represented as a weighted linear combination of [MPAN] and [PPN]. The combination of BHC and AHC chemistry is indicated by MPAN and PPN. The linear model is applied as in Eq. (2).
Here, A is the intercept (describing background PAN levels) and B1 and B2 are partial regression coefficients, estimated using a computer software program based on field observations. The MLR statistical analysis includes estimation of A, B1 and B2, overall F test and a t test, and diagnostic procedures (e.g., Mendenhall et al., 2008). The F test is used to investigate the statistical significance of the model in Eq. (2) using an analysis of variance (ANOVA) table. The strength of the model is evaluated using the coefficient of determination R2 between predicted and measured [PAN] (also provided through this statistical analysis). The individual t test, which is based on the Student's t statistic, is used to investigate the statistical significance of the individual B1 and B2. In a MLR statistical analysis, the magnitude of the standardized partial regression coefficients, βi, which is calculated as a product of partial regression coefficient and the ratio between the standard deviation of the respective independent variable (MPAN or PPN) and the standard deviation of the dependent variable (PAN), is frequently used to compare the relative contribution of independent variables. The results of MLR statistical analysis are summarized in Tables S1 and S2.
Tatsuoka (1971) showed that R2 from the MLR is equal to the sum of the product of the βi and the zero-order (simple bivariate) correlation, ri, which are obtained as results of MLR (see Table S2). That is, . Therefore, we used the fraction of R2 based on the strength of relationship in each [MPAN] and [PPN] to [PAN] to describe the relative importance of BHC and AHC. Each partial R2 is obtained as shown in Eqs. (3) and (4).
This approach allows us to directly treat the R2 in the MLR to assess the relative importance of BHC and AHC, including the strength of correlation with PAN.
Results from SOAS were compared with similar PAN data collected from Dickson, TN, in 1999, another rural southeastern site, which show that the MLR model and regression coefficients for both MPAN and PPN at both sites were statistically significant for predicting PAN (see Tables S1 and S2). During SOAS 2013, 60 % of the variance in the measurements was explained by the MLR model (R2=0.601). At the Dickson site in 1999, 77 % of the variance was explained by the MLR model (R2=0.766). The R2 of MLR in the SOAS 2013 data was lower than that in Dickson 1999, which might result from the lower absolute PAN levels during SOAS 2013. In particular, SOAS MPAN and PPN data included a large number of below detection limit measurements, while Dickson 1999 data did not. The means of PAN, MPAN, and PPN in Dickson 1999 were 3 times higher than the mean for SOAS 2013, while NOx levels were 5 times higher (see Table 1). In Fig. 4, the relative importance of BHC and AHC was standardized to compare SOAS 2013 and Dickson 1999. Based on the PAN precursors represented by the variance explained by the MLR, standardized relative percentiles ( and ) estimate that 66 % of PAN at SOAS 2013 came from biogenic precursors. In comparison, biogenic influence (mostly isoprene) from Dickson accounted for only 25 % of PAN. Although both sampling locations were located in rural areas, the results using MLR indicate that the HC precursors were different.
3.3.2 Comparison of contribution of isoprene oxidation with computational modeling
We used two computational approaches to assess the contribution of isoprene oxidation to PAN formation by (1) orthogonal distance regression (ODR) between field measurements of MPAN and PAN and (2) simulation of the production of peroxyacetyl (PA) radicals, precursors of PAN, using an ambient 0-D photochemical model.
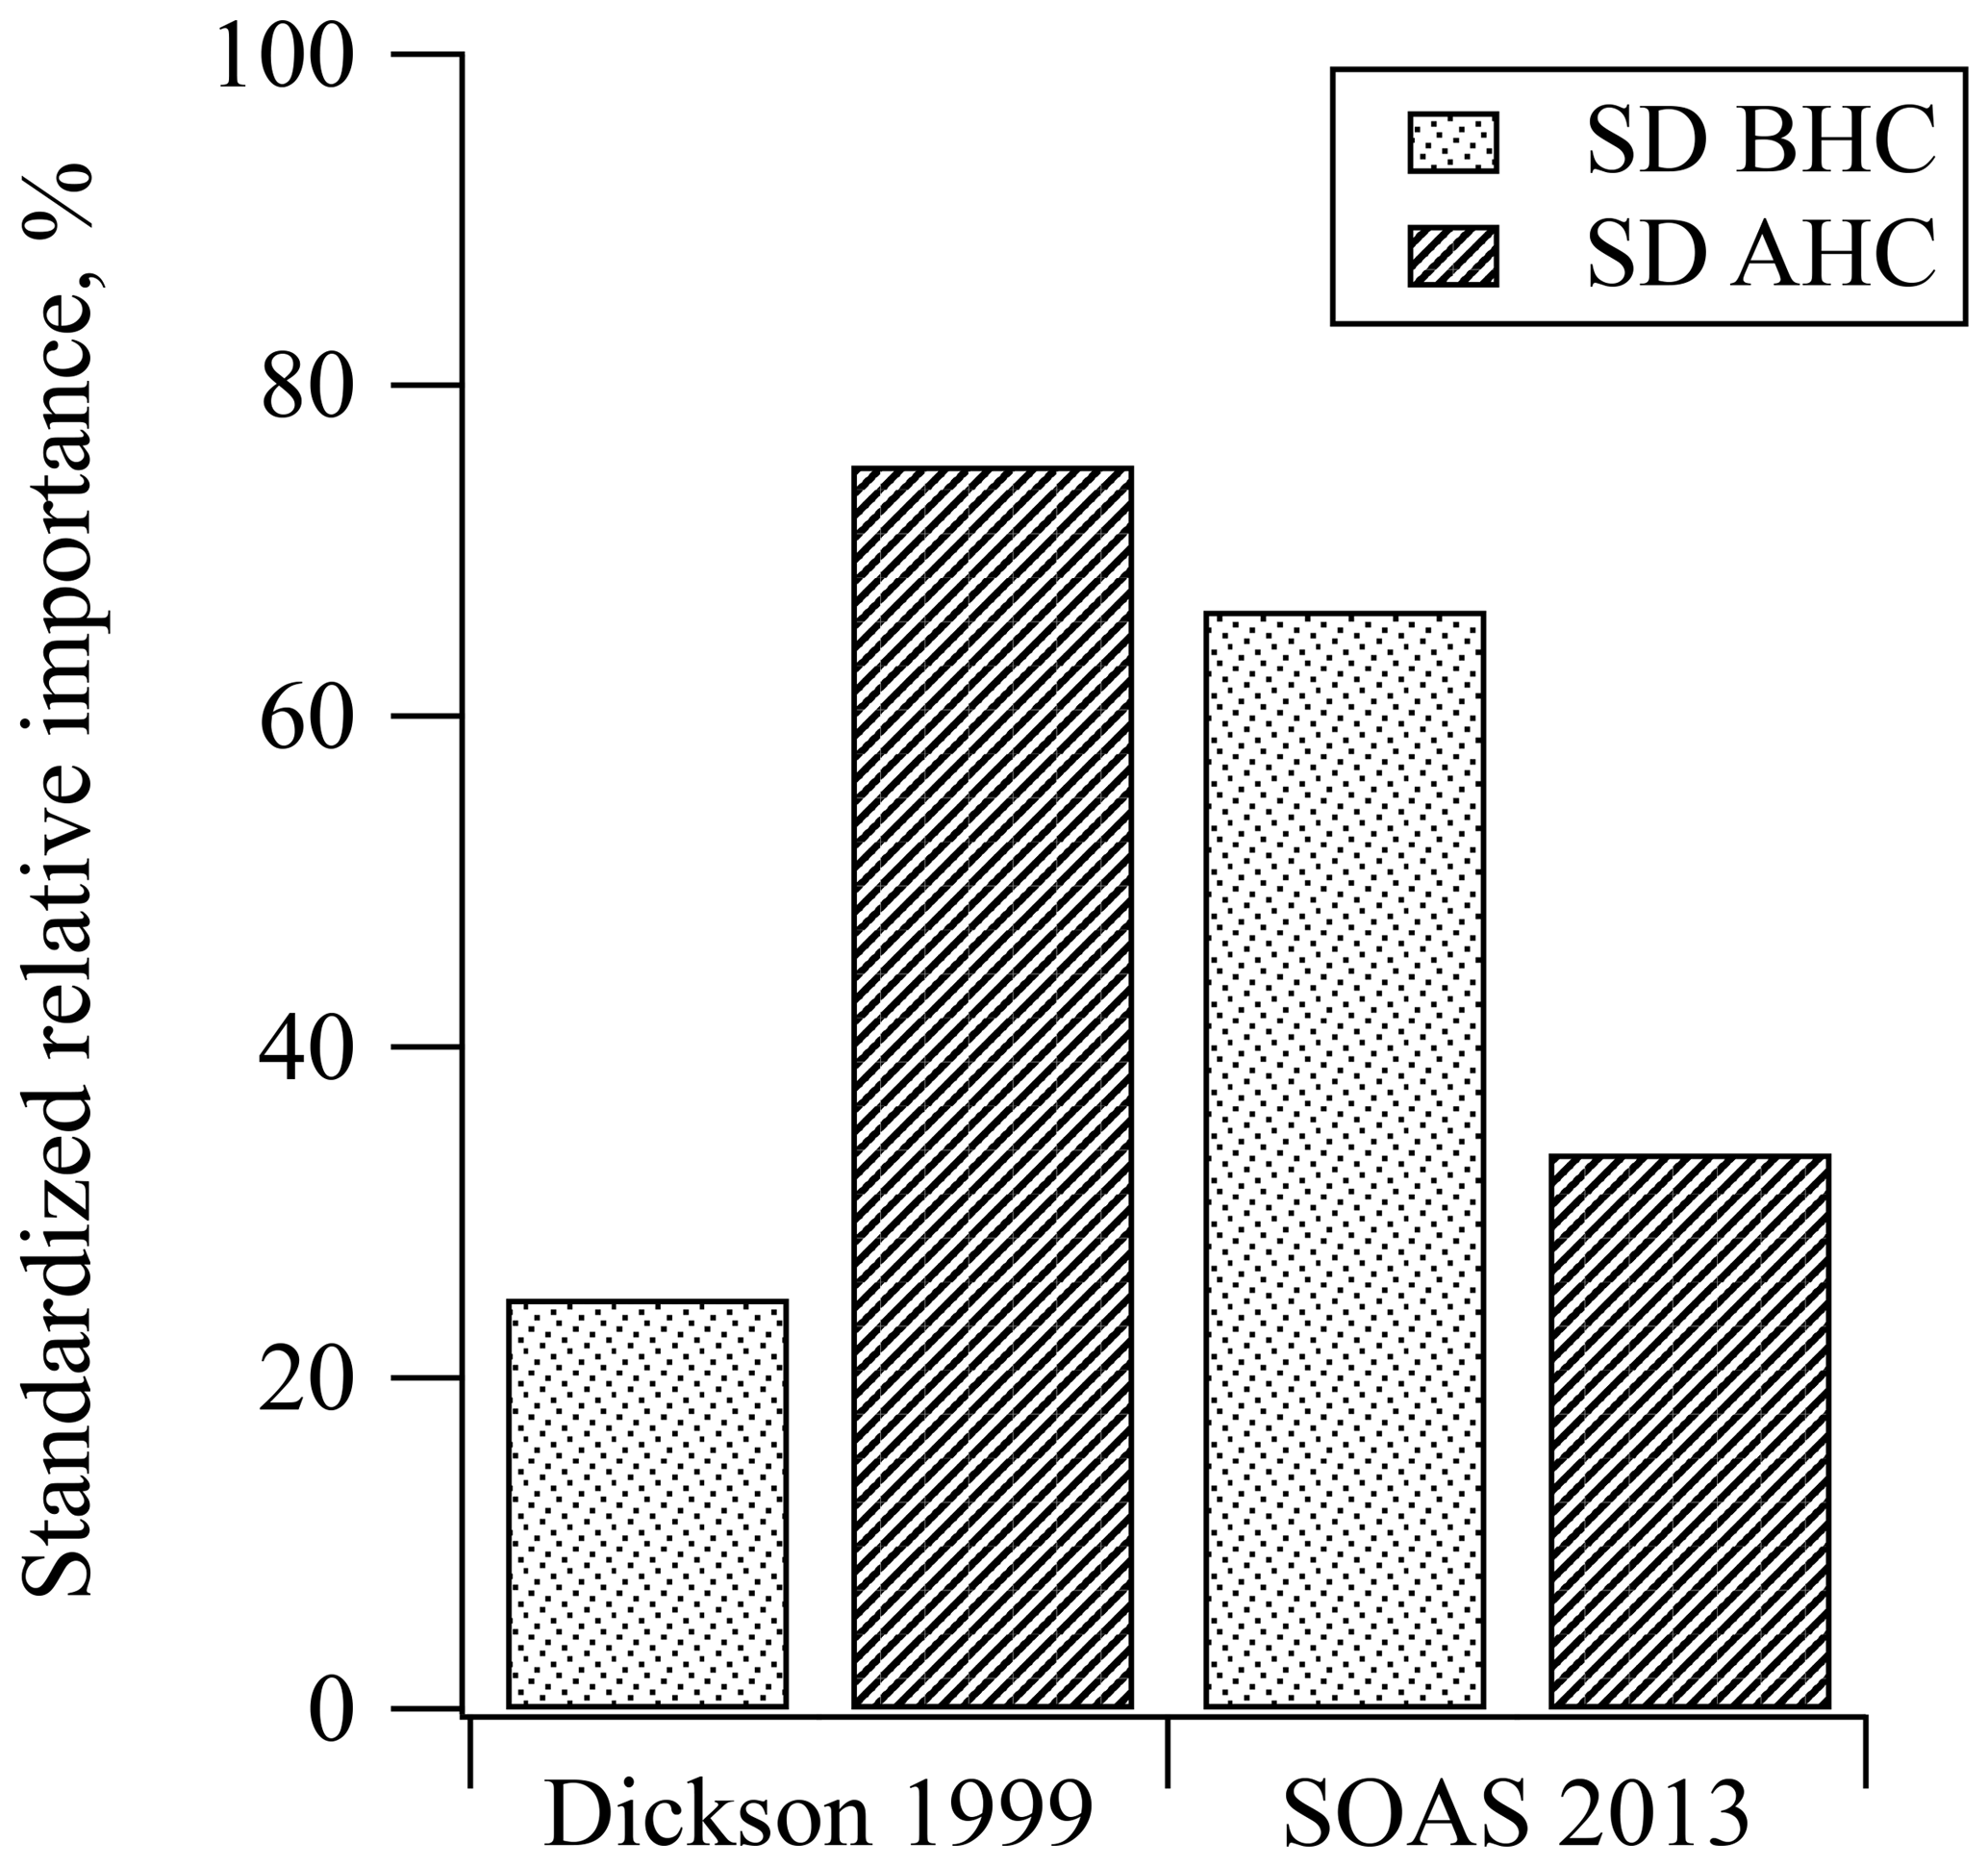
Figure 4Comparison of standardized relative contribution to PAN formation from biogenic and anthropogenic hydrocarbons during the daytime in Dickson, TN, in 1999 and SOAS, in Centreville, AL, in 2013. The std. BHC and std. AHC mean standardized the relative importance of biogenic hydrocarbon and anthropogenic hydrocarbon, respectively.
In ODR, the fraction of PAN production from isoprene oxidation can be expressed as . Assuming that MPAN is solely derived from isoprene oxidation, the relative yield of was obtained from an isoprene oxidation chamber experiment as 0.15±0.03 RSD. The reaction was initiated with 1.37 ppm isoprene, 268 ppb NO, and 206 ppb NO2 under 5 % RH in a 5.5 m3 Teflon cylindrical bag. The OH radical was produced by photolysis of HONO. The fraction of PAN production from isoprene oxidation to total PAN formation in the field was rearranged as the following equation.
The was obtained from measurements in SOAS 2013 as the slope of the linear regression line of [MPAN] to [PAN].
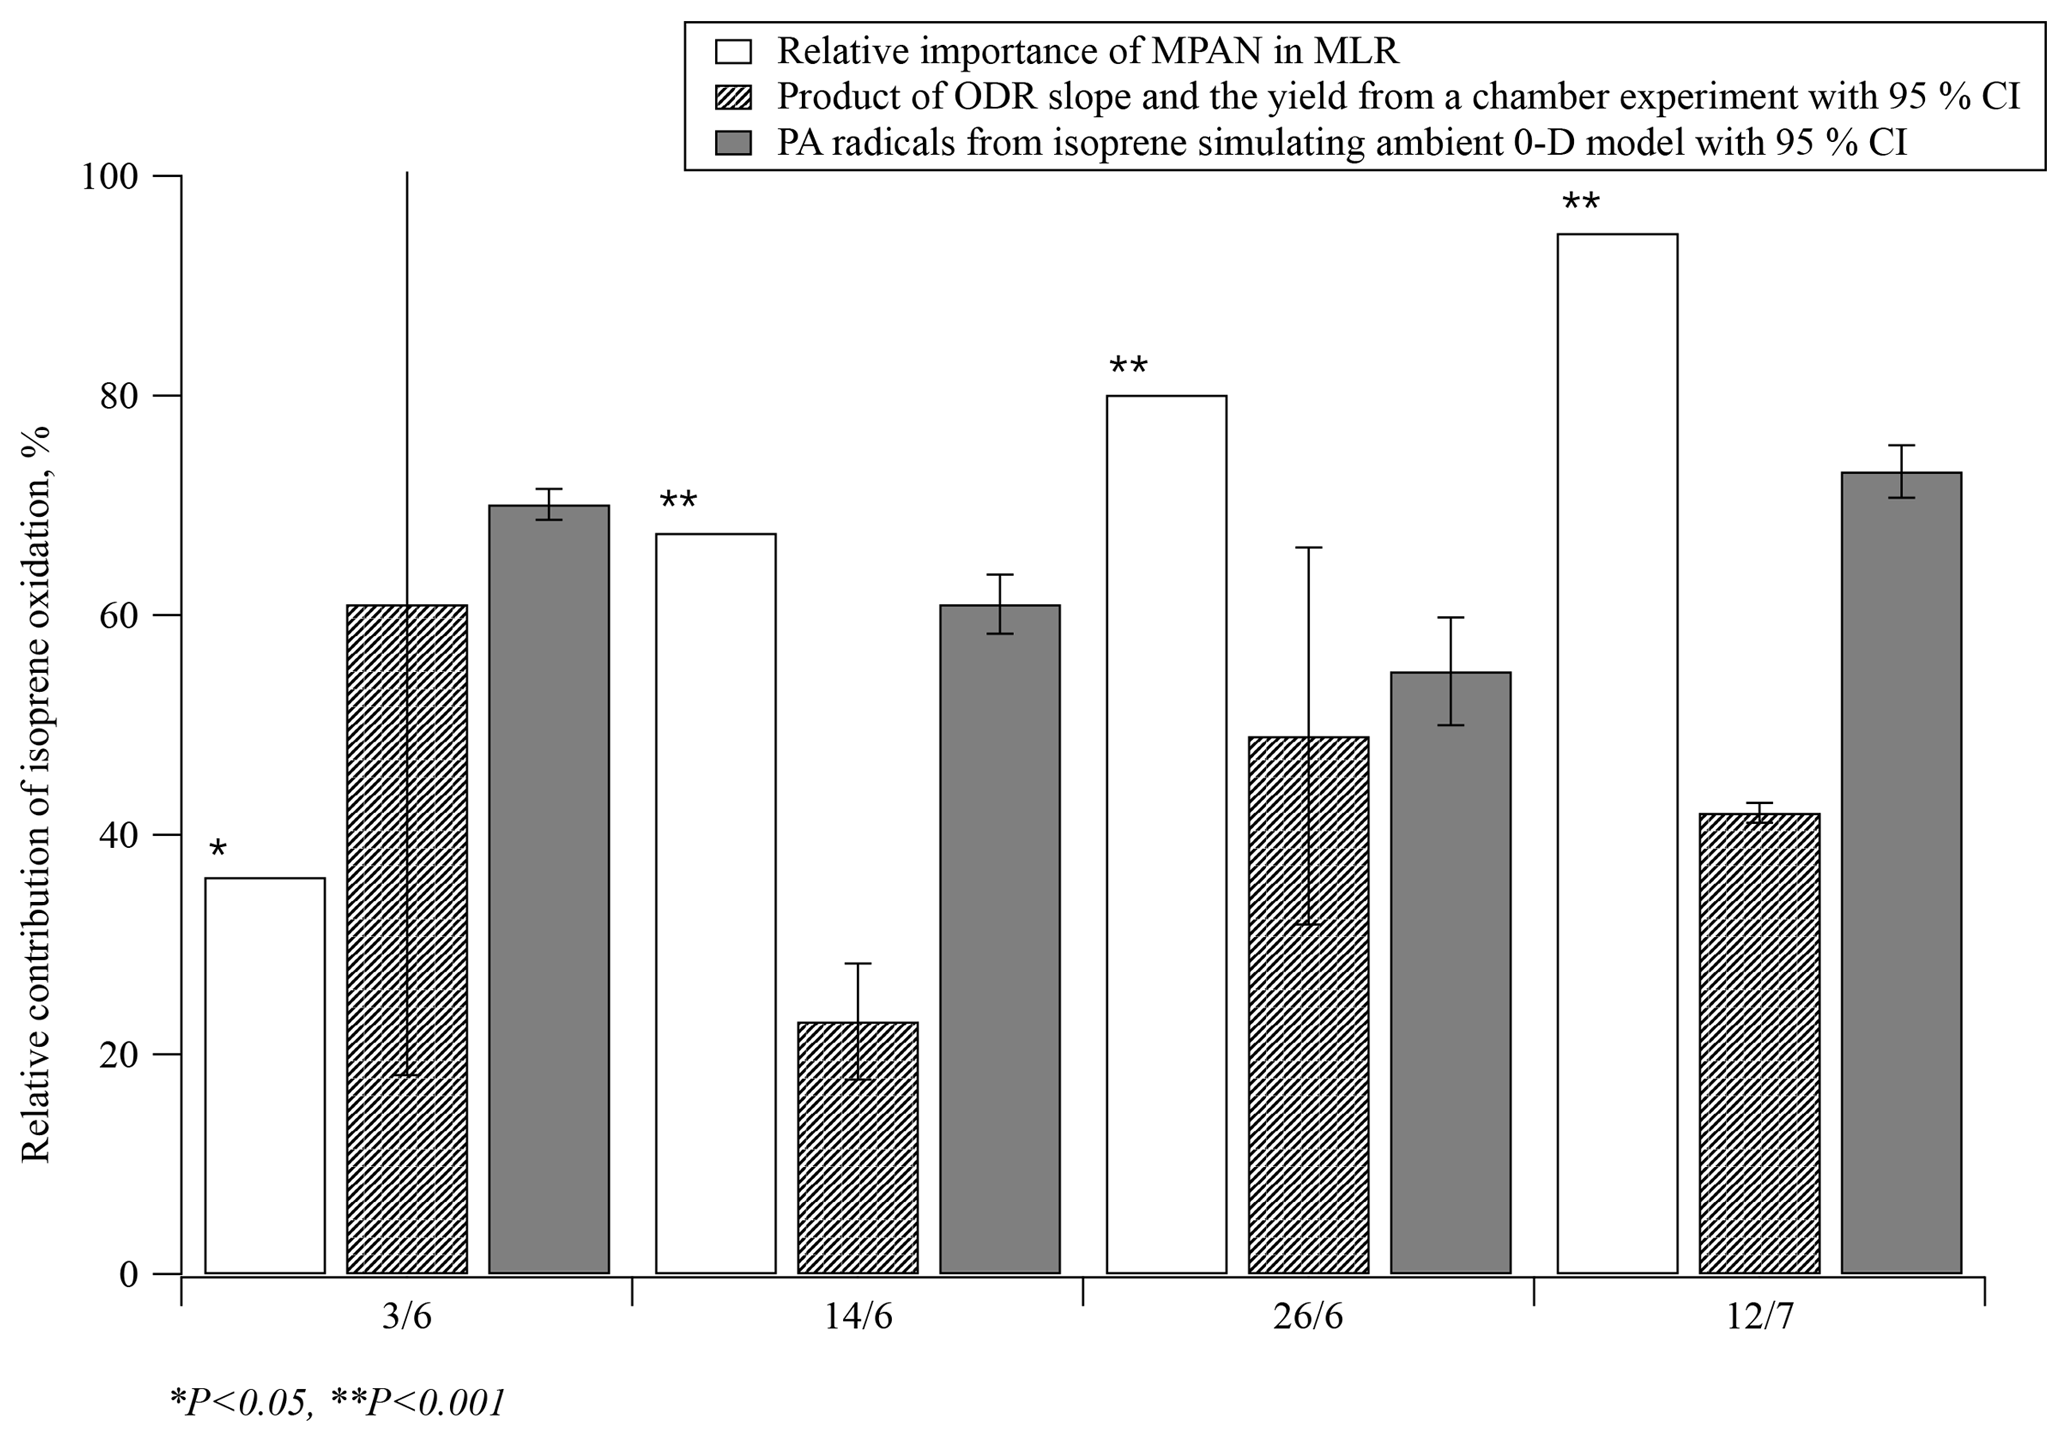
Figure 5Estimates of the relative contribution of isoprene oxidation to PAN formation during four specific days of SOAS 2013 using three different approaches: multiple regression analysis, ODR with chamber data, and simulation of PA radicals using a 0-D model. P indicates the calculated probability of the t test; CI = confidence interval.
In the 0-D photochemical model simulation, the relative contribution to peroxyacetyl (PA) radicals from VOCs present at the field site is based on the Master Chemical Mechanism (MCM) v3.3. The ambient model included not only isoprene and its oxidation products (including CH3C(O)CHO) but also acetone, acetaldehyde, and some monoterpenes as precursors. The detail of the parameters for the MCM set are described in Groff (2015).
These two methods were compared with the relative importance of BHC, , from the MLR model in this work. Then, 4 days (3 June 12:30–18:00, 14 June 11:30–18:00, 26 June 11:00–18:00, and 12 July 13:00–18:00) of data from SOAS 2013 were selected to run the 0-D model because the production ratio using ODR can only be used when PAN, MPAN and NOx concentrations were appropriately high. The time ranges were chosen so that the boundary layer height would be stable and any dilution effect would be minimal. Results of the comparison are plotted in Fig. 5. Although the relative importance of BHC in the MLR model was less than 40 % on 3 June, it was statistically dominant on the other 3 days accounting for more than 68 % (PPN on 3 June did not have a significant level for the prediction PAN in MLR analysis, p=0.600). By comparison, the estimated contribution of isoprene oxidation using ODR on 3 June had the steepest slope; however, the range of the 95 % confidence interval (CI) on this day was large. On the other 3 days, the relative contributions of isoprene oxidation using ODR were estimated at 23 %–49 %, lower than the results derived from the other two methods. This might be due to the differences between the chamber experiment and ambient conditions. Specifically, the ratio of secondary to primary oxidation products varies between chamber and ambient conditions, with likely relatively greater primary products under chamber conditions. Since PAN is formed via the oxidation of secondary products of isoprene, the [MPAN]∕[PAN]isoprene ratio would be higher in the chamber experiment than in ambient environment. This ratio is expected to derive results that are biased low, when used to estimate the ambient isoprene-derived PAN concentration. In addition, photolysis rates also are significantly different between the chamber and the field conditions. The results of the 0-D model suggest that isoprene oxidation significantly contributed to PAN formation with a mean range of 55 %–73 % over all selected days. Hence, both methods, the MLR and the 0-D model, indicate that isoprene oxidation was the main source when high levels of PAN were observed during SOAS 2013.
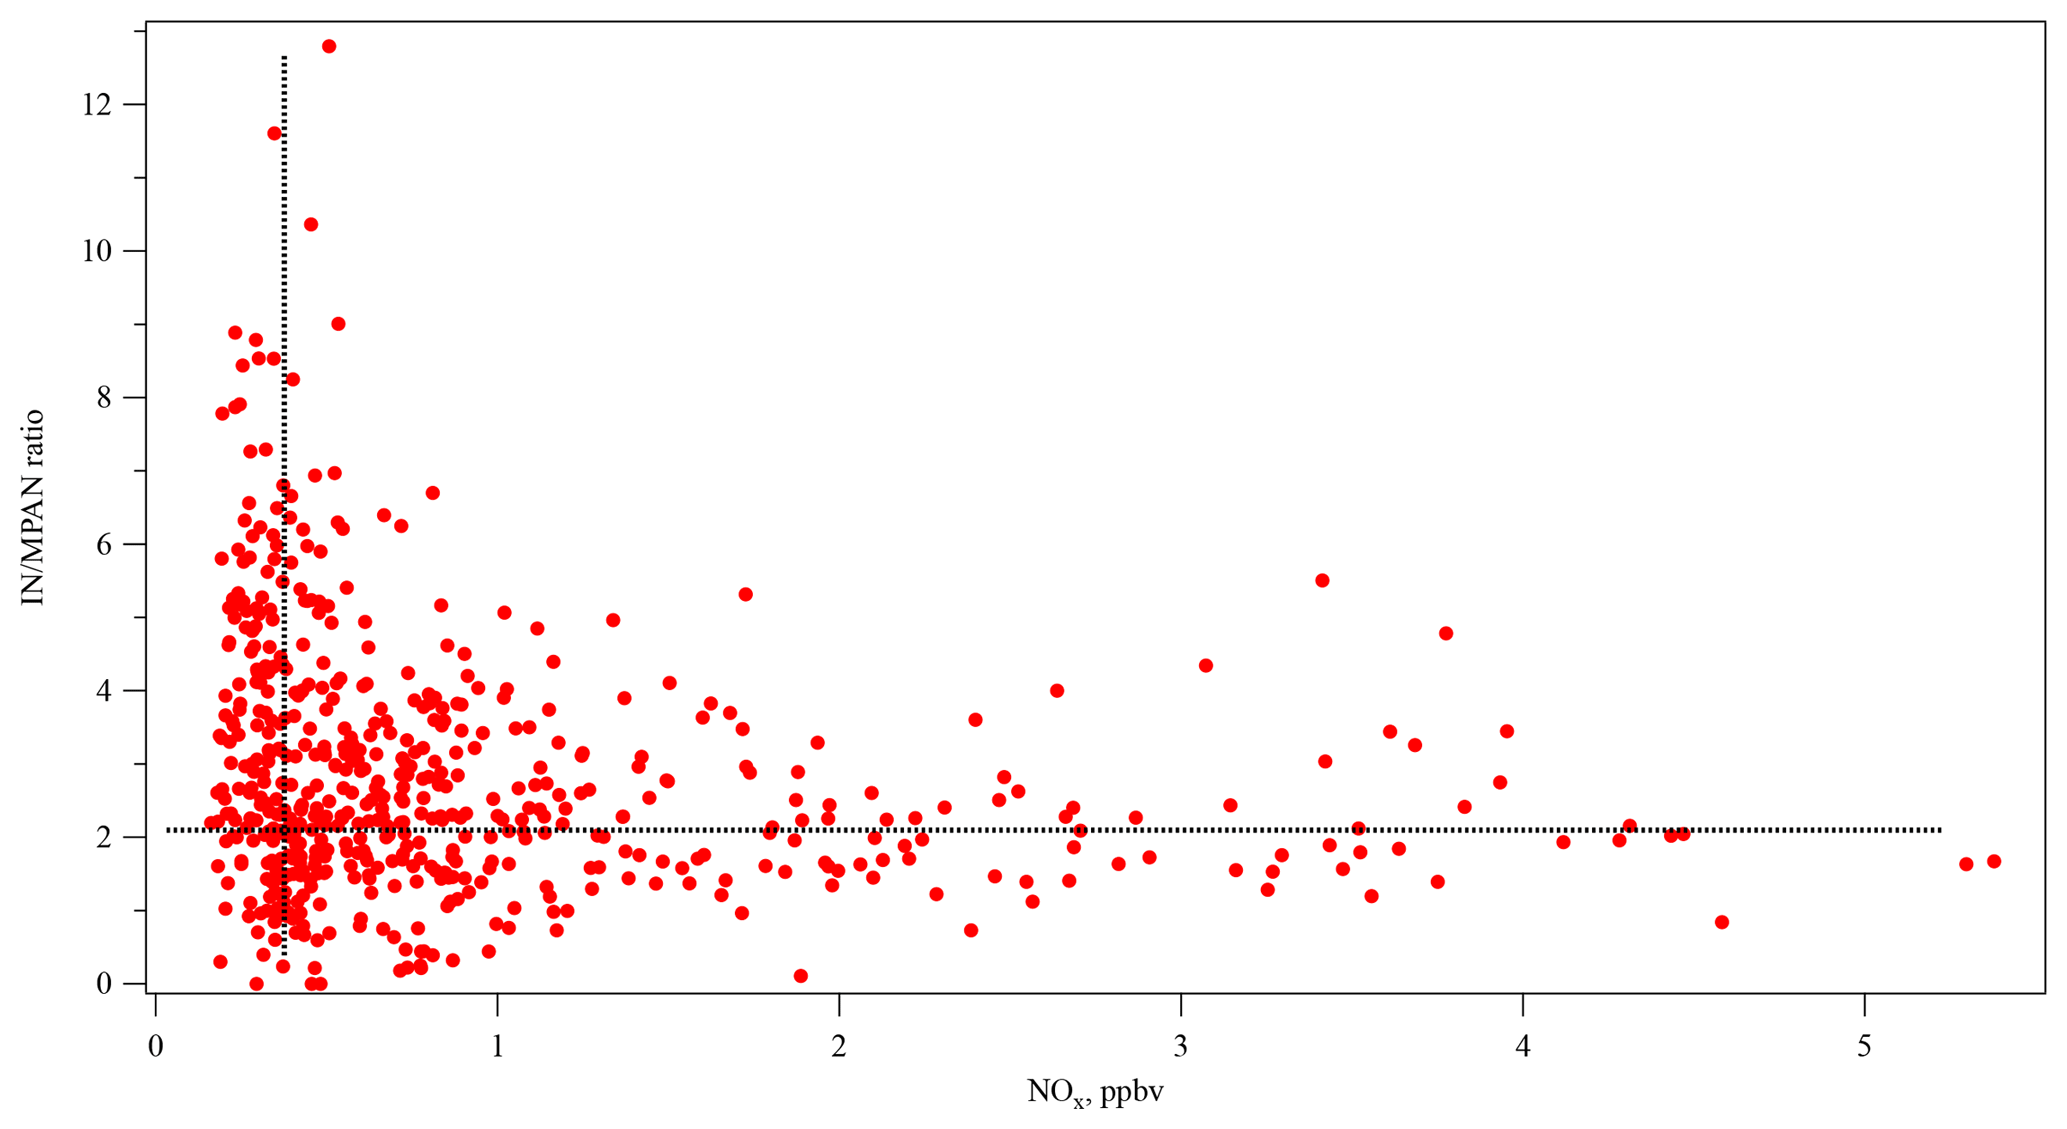
Figure 6The relationship of daytime IN ∕ MPAN ratio with NOx concentration (10:00–16:00). (The dashed vertical and horizontal lines are used for reference only.)
4.1 Comparison among MACR, IN, and MPAN
MACR is a first-generation product of isoprene photooxidation mechanisms, and MPAN is derived from MACR oxidation (Bertman and Roberts, 1991; Kjaergaard et al., 2012). With enough NOx, the OH adduct of isoprene that is the precursor to MACR in these mechanisms is also a precursor of gas-phase isomers of isoprene hydroxynitrates (IN) (Shepson, 2007; Grossenbacher et al., 2001, 2004; Barker et al., 2003; Paulot et al., 2009a; Lockwood et al., 2010). Xiong et al. (2015) reported IN at SOAS, which affords the opportunity to study this aspect of NOx sensitivity of isoprene oxidation. In this work, the daytime (10:00–16:00) relationships among MPAN, MACR, and IN at SOAS were investigated using the Pearson's correlation statistical test. Missing data were treated as pairwise deletion (not listwise deletion). The correlation coefficient between the first-generation products of isoprene, MACR, and IN was 0.528 (p<0.001) and indicated a statistically significant positive correlation, as would be expected. According to the known chemical pathways, a strong relationship is expected between MACR and MPAN, while a weak relationship is expected between IN and MPAN given that IN is a primary product, while MPAN is secondary. The results show, however, that daytime data over the whole campaign did not show a statistically significant correlation between MACR and MPAN (r=0.148, p=0.104). In contrast, IN has a statistically significant positive correlation with MPAN (r=0.499, p<0.001). Likely this relationship is a result of the NOx dependence of both organic nitrate products. Because MACR can be produced in the absence of NOx (Paulot et al., 2009b; Liu et al., 2013; Mao et al., 2013), MPAN is more dependent on NOx than on MACR at this site, and isoprene nitrates constitute a larger fraction of gas-phase organic nitrates from BVOC than MPAN does, consistent with Romer et al. (2016). Figure 6 shows that the IN ∕ MPAN ratio varies over a large range when NOx<1 ppb, corresponding to the range of high P(HOx) described by Thornton et al. (2002). At higher NOx levels, the ratio remains fairly constant around 2.5–3. This figure is suggestive of different chemical regimes operating under different NOx conditions, reminiscent of the behavior of differential alkane loss when dominated either by OH or halogen chemistry in Jobson et al. (1994). The higher loss rate for MPAN expected with higher levels of HOx may drive the IN ∕ MPAN ratio at lower NOx levels.
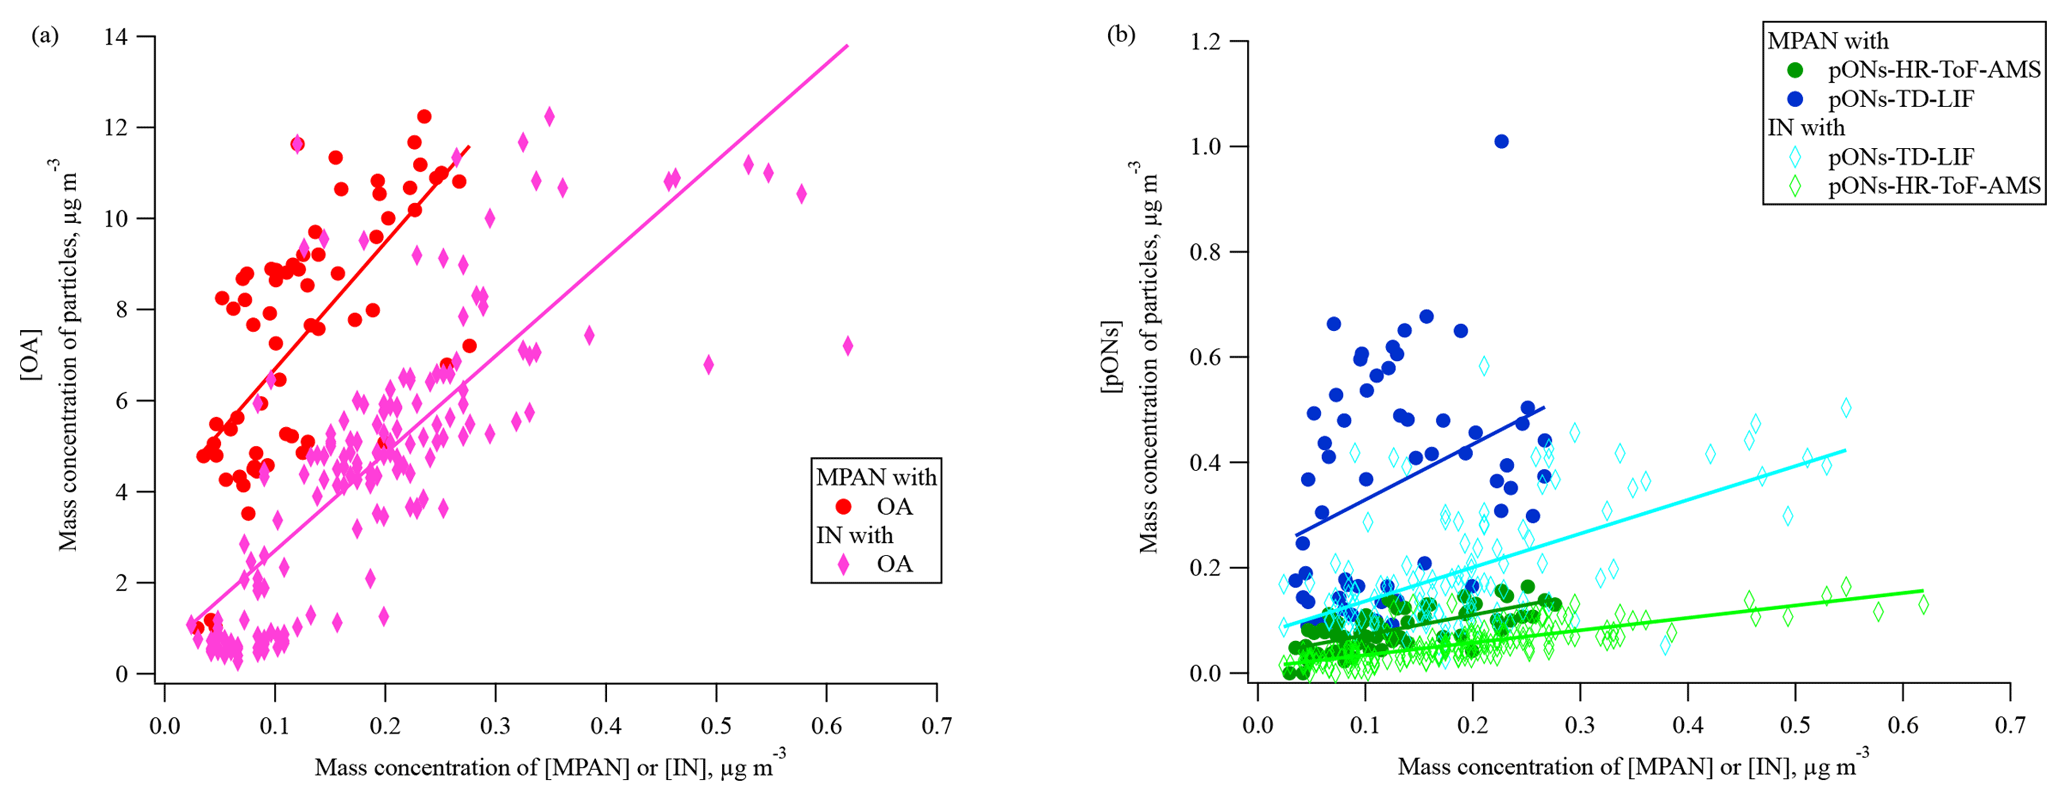
Figure 7The relationship between mass of MPAN or IN in the gas phase and in organic aerosol during the daytime 29 June–15 July (the time period when data on pONs-TD-LIF were available). (a) OA is organic aerosol (without organic nitrate) and (b) pONs is particle-phase organic nitrates. MPAN has a linear slope (R2) of 27.8 (0.455) vs. OA, 0.4 (0.437) vs. pONs-HR-ToF-AMS, and 1.1 (0.120) vs. pONs-TD-LIF. IN has a linear slope (R2) of 21.4 (0.606) vs. OA, 0.2 (0.603) vs. pONs-HR-ToF-AMS, and 0.6 (0.341) vs. pONs-TD-LIF.
4.2 Gas-phase MPAN vs. organic aerosol mass
During SOAS 2013, Lee et al. (2016) estimated that the particle-phase organic nitrates (pONs) accounted for 3 % of total organic aerosol (OA) mass, on average, during the day (12:00–16:00) and BVOC precursors strongly impacted the diel trends of pONs. Laboratory experiments suggest that MPAN can play a key role in SOA formation under high NOx conditions, C4-hydroxynitrate-PAN or hydroxymethyl-methyl-α-lactone (HMML) (Kjaergaard et al., 2012; Nguyen et al., 2015; Wennberg et al., 2018) and methacrylic acid epoxide (MAE) (Worton et al., 2013) have been proposed as precursors for uptake into the particle-phase from MPAN oxidation. Nguyen et al. (2015) estimated the SOA yield as approximately ∼60 % by mole from MPAN + OH reaction in the absence of NOx. IN is also expected to contribute to SOA formation (Jacobs et al., 2014). Organic nitrate involvement in SOA formation suggests a relationship between gas-phase MPAN and IN with particle mass, although the nitrogen could be unretained in the particle. Figure 7a and b show the relationship of gas-phase MPAN and IN with daytime particle measurements. As MPAN and IN concentrations increase, Fig. 7a and b show that OA mass increases, while pONs mass increases very little (measured by both HR-ToF-AMS and TD-LIF), although the slopes of MPAN and IN vs. pONs are statistically different from zero. The relative magnitude of the response of OA and pONs to increases in MPAN and IN suggests that they may contribute to OA growth more than to pONs growth. Although this may suggest that if MPAN oxidation by OH is involved in particle growth, the nitrogen from MPAN is not represented in aerosol organic nitrate. Oxidation of MPAN modeled from MACR + OH results at FIXCIT (Nguyen et al., 2014) using measured total peroxynitrates and kinetics of the isoprene mechanism in MCM v3.3.1 (Jenkin et al., 2015) showed a positive relationship between MPAN oxidation and pONs formation, although with a yield <3 % (Paul Romer, personal communication, 2018). Results of direct reaction of MPAN + OH suggest that it is unlikely that pONs formation is mainly derived from MPAN + OH reaction, even in the presence of NOx (Tran Nguyen and Paul Wennberg, personal communication, 2018). This small contribution of isoprene oxidation compounds to pONs formation is consistent with reported modeling of pONs formation (Xu et al., 2015; Ayres et al., 2015; Pye et al., 2015). Ayres et al. (2015) suggest that pONs formation at SOAS was dominated by nighttime reactions of NO3 radicals with BVOCs rather than daytime reactions, and more from monoterpene oxidation than isoprene oxidation. MPAN uptake on aerosols results in the formation of aerosol-phase organosulfates (Worton et al., 2013), which also contributes to the weak dependence of pONs on MPAN.
Rather, MPAN is likely a precursor of low vapor pressure products that undergo aerosol uptake. The correlation between INs and MPAN with OA may reflect that much of the OA derives from BVOC oxidation, and the conditions that lead to large rates of BVOC emission and oxidation (high T and radiation) simultaneously produce OA, along with INs and MPAN. That OA does not correlate well with condensed phase organic nitrate reflects the fast hydrolysis of organic nitrates in the aerosol phase at a low aerosol pH (Rindelaub et al., 2016; Jacobs et al., 2014; Guo et al., 2015). While organic nitrates such as the INs may partition to the aerosol phase, they are quickly converted to inorganic nitrate ion and other products by hydrolysis.
The level of APN compounds measured at the ground site during SOAS 2013 is lower than measured in the southeastern US over the past two decades. We show here that PAN concentrations at SOAS were limited by NOx availability. Russell et al. (2012) show that NOx in the eastern US has been decreasing rapidly, due to effective emission control, and lower NOx levels seem to result in lower ambient PAN concentrations. As this process continues, PAN may continue to be a smaller fraction of NOy, as peroxy radicals such as CH3C(O)OO react with HO2 and RO2 rather than with NOx. PAN appears to be most sensitive up to [NOx] of approximately 3.5 ppb, above which PAN concentrations switch to a NOx-saturated (or VOC-limited) regime. Overall, MPAN did not show a statistically significant correlation with MACR, but did show a statistically positive correlation with IN. These results indicate that both organic nitrate products were NOx dependent (MPAN being more sensitive to NOx than to MACR precursor) at SOAS.
We estimate that biogenic precursors, particularly isoprene, account for more than half of PAN and that gas-phase MPAN shows a correlation with OA growth consistent with laboratory and chamber studies, but less correlation with nitrogen-containing pONs during the daytime. This may suggest that the nitrogen of MPAN is removed during oxidation to other low vapor pressure products involved in particle growth, as suggested by the HMML (Kjaergaard et al., 2012) and MAE mechanisms (Worton et al., 2013).
The data from this large, collaborative study (including the data used in this paper as well as others) are all available from https://esrl.noaa.gov/csd/groups/csd7/measurements/2013senex/ (last access: 28 January 2019).
The supplement related to this article is available online at: https://doi.org/10.5194/acp-19-1867-2019-supplement.
ST and SB measured APN by GC-ECD; CG and PBS performed the 0-D modeling; FX and PBS measured isoprene nitrates; PR, KD, PW, and RC measured total APN by thermal conversion and LIF; KB and EE measured APN by chemiluminescence as well as inorganic gases; ARK, JdG, and AG measured organic gases by GCMS; WH and JLJ measured particles by AMS; ST wrote the first version of the paper. The co-authors contributed to the interpretation of the results and the writing of the paper.
The authors declare that they have no conflict of interest.
This publication was developed under assistance agreements awarded by the U.S. Environmental Protection Agency. It has not been formally reviewed by the EPA. The views expressed in this document are solely those of the authors and do not necessarily reflect those of the Agency. The EPA does not endorse any products or commercial services mentioned in this publication.
This research was supported by EPA STAR grant 83540901-0-RD. We thank the
people of the SOAS 2013 campaign. We thank James Roberts, David Parrish,
Eric Williams, and Martin Buhr for providing NOAA data of PAN and other
trace gases from Elberton, ROSE, Henderson, and Cornelia Fort ground sites.
We thank Tran Nguyen and Paul Wennberg for sharing data from FIXCIT. Weiwei Hu and
Jose L. Jimenez were supported by NSF AGS-1822664 and EPA STAR 83587701-0. NSF grant
AGS-1352972 supported Cohen group work at UC Berkeley. VOC measurements at
the SEARCH Jefferson Street (Atlanta) site were funded by Southern Company
Services, Inc. (Birmingham, AL, USA) and the Electric Power Research
Institute (Palo Alto, CA, USA).
Edited by: Jennifer G. Murphy
Reviewed by: two anonymous referees
Ayres, B. R., Allen, H. M., Draper, D. C., Brown, S. S., Wild, R. J., Jimenez, J. L., Day, D. A., Campuzano-Jost, P., Hu, W., de Gouw, J., Koss, A., Cohen, R. C., Duffey, K. C., Romer, P., Baumann, K., Edgerton, E., Takahama, S., Thornton, J. A., Lee, B. H., Lopez-Hilfiker, F. D., Mohr, C., Wennberg, P. O., Nguyen, T. B., Teng, A., Goldstein, A. H., Olson, K., and Fry, J. L.: Organic nitrate aerosol formation via NO3 + biogenic volatile organic compounds in the southeastern United States, Atmos. Chem. Phys., 15, 13377–13392, https://doi.org/10.5194/acp-15-13377-2015, 2015.
Barker, J. R., Lohr, L. L., Shroll, R. M., and Reading, S.: Modeling the Organic Nitrate Yields in the Reaction of Alkyl Peroxy Radicals with Nitric Oxide. 2. Reaction Simulations, J. Phys. Chem. A, 107, 7434–7444, https://doi.org/10.1021/jp034638j, 2003.
Barket, D. J., Jr., Grossenbacher, J. W., Hurst, J. M., Shepson, P. B., Olszyna, K., Thornberry, T., Carroll, M. A., Roberts, J., Stroud, C., Bottenheim, J., and Biesenthal, T.: A study of the NOx dependence of isoprene oxidation, J. Geophys. Res., 109, D11310, https://doi.org/10.1029/2003JD003965, 2004.
Baumann, K., Williams, E. J., Angevine, W. M., Roberts, J. M., Norton, R. B., Frost, G. J., Fehsenfeld, F. C., Springston, S. R., Bertman, S. B., and Hartsell, B.: Ozone production and transport near Nashville, Tennessee: Results from the 1994 study at New Hendersonville, J. Geophys. Res., 105, 9137–9153, https://doi.org/10.1029/1999JD901017, 2000.
Bertman, S. B. and Roberts, J. M.: A PAN analog from isoprene photooxidation, Geophys. Res. Lett., 18, 1461–1464, 1991.
Biesenthal, T. A. and Shepson, P. B.: Observations of anthropogenic inputs of the isoprene oxidation products methyl vinyl ketone and methacrolein to the atmosphere, Geophys. Res. Lett., 24, 1375–1378, https://doi.org/10.1029/97GL01337, 1997.
Blanchard, C. L., Hidy, G. M., Tanenbaum, S., Edgerton, E. S., and Hartsell, B. E.: The Southeastern Aerosol Research and Characterization (SEARCH) study: Temporal trends in gas and PM concentrations and composition, 1999–2010, J. Air Waste Manage. Assoc., 63, 247–259, 2012.
Bottenheim, J. W., Sirois, A., Brice, K. A., and Gallant, A. J.: Five years of continuous observations of PAN and ozone at a rural location in eastern Canada, J. Geophys. Res., 99, 5333–5352, https://doi.org/10.1029/93JD02716, 1994.
Buhr, M., Parrish, D., Elliot, J., Holloway, J., Carpenter, J., Goldan, P., Kuster, W., Trainer, M., Montzka, S., McKeen, S., and Fehsenfeld, F.: Evaluation of ozone precursor source types using principal component analysis of ambient air measurements in rural Alabama, J. Geophys. Res., 100, 22853–22860, https://doi.org/10.1029/95JD01837, 1995.
Cantrell, C. A., Lind, J. A., Shetter, R. E., Calvert, J. G., Goldan, P. D., Kuster, W., Fehsenfeld, F. C., Montzka, S. A., Parrish, D. D., Williams, E. J., Buhr, M. P., Westberg, H. H., Allwine, G., and Martin, R.: Peroxy radicals in the ROSE experiment: Measurement and theory, J. Geophys. Res., 97, 20671–20686, https://doi.org/10.1029/92JD01727, 1992.
Carlton, A. G., de Gouw, J., Jimenez, J. L., Ambrose, J. L., Attwood, A. R., Brown, S., Baker, K. R., Brock, C., Cohen, R. C., Edgerton, S., Farkas, C., Farmer, D., Goldstein, A. H., Gratz, L., Guenther, A., Hunt, S., Jaeglé, L., Jaffe, D. A., Mak, J., McClure,C., Nenes, A., Nguyen, T. K., Pierce, J. R., De Sa, S., Selin, N. E., Shah, V., Shaw, S., Shepson, P. B., Song, S., Stutz, J., Surratt, J., Turpin, B. J., Warneke, C., Washenfelder, R. A., Wennberg, P. O., and Zhou, X.: Synthesis of the Southeast Atmosphere Studies: Investigating Fundamental Atmospheric Chemistry Questions, B. Am. Meteorol. Soc., 99, 547–567, https://doi.org/10.1175/BAMS-D-16-0048.1, 2018.
Carter, W. P. and Atkinson, R.: Development and evaluation of a detailed mechanism for the atmospheric reactions of isoprene and NOx, Int. J. Chem. Kinet., 28, 497–530, 1996.
Carter, W. P. L., Winer, A. M., and Pitts, J. N.: Effect of peroxyacetyl nitrate on the initiation of photochemical smog, Environ. Sci. Technol., 15, 831–834, https://doi.org/10.1021/es00089a010, 1981.
Chameides, W. L., Fehsenfeld, F., Rodgers, M. O., Cardelino, C., Martinez, J., Parrish, D., Lonneman, W., Lawson, D. R., Rasmussen, R. A., Zimmerman, P., Greenberg, J., Mlddleton, P., and Wang, T.: Ozone precursor relationships in the ambient atmosphere, J. Geophys. Res., 97, 6037–6055, https://doi.org/10.1029/91JD03014, 1992.
Chan, A. W. H., Chan, M. N., Surratt, J. D., Chhabra, P. S., Loza, C. L., Crounse, J. D., Yee, L. D., Flagan, R. C., Wennberg, P. O., and Seinfeld, J. H.: Role of aldehyde chemistry and NOx concentrations in secondary organic aerosol formation, Atmos. Chem. Phys., 10, 7169–7188, https://doi.org/10.5194/acp-10-7169-2010, 2010.
Chen, W.: PAN, PPN and MPAN measurements and the quantitative relationship of PAN and MPAN in biogenic hydrocarbon conditions, Master's thesis, Western Michigan University, Kalamazoo, USA, 2001.
Cowling, E. B., Chameides, W. L., Kiang, C. S., Fehsenfeld, F. C., and Meagher, J. F.: Introduction to special section: Southern Oxidants Study Nashville/Middle Tennessee Ozone Study, J. Geophys. Res., 103, 22209–22212, https://doi.org/10.1029/98JD01770, 1998.
DeCarlo, P. F., Kimmel, J. R., Trimborn, A., Northway, M. J., Jayne, J. T., Aiken, A. C., Gonin, M., Fuhrer, K., Horvath, T., Docherty, K. S., Worsnop, D. R., and Jimenez, J. L.: Field-Deployable, High-Resolution, Time-of-Flight Aerosol Mass Spectrometer, Anal. Chem., 78, 8281–8289, https://doi.org/10.1021/ac061249n, 2006.
Finlayson-Pitts, B. J. and Pitts, J. N., Jr: Chemistry of the Upper and Lower Atmosphere: theory, experiments, and applications, Academic Press, San Diego, CA, USA, 2000.
Frost, G. J., Trainer, M., Allwine, G., Buhr, M. P., Calvert, J. G., Cantrell, C. A., Fehsenfeld, F. C., Goldan, P. D., Herwehe, J., Hübler, G., Kuster, W. C., Martin, R., Mcmillen, R. T., Montzka, S. A., Norton, R. B., Parrish, D. D., Ridley, B. A., Shetter, R. E., Watkinds, J. G., Westberg, H. H., and Williams, E. J.: Photochemical ozone production in the rural southeastern United States during the 1990 Rural Oxidants in the Southern Environment (ROSE) program, J. Geophys. Res., 103, 22491–22508, https://doi.org/10.1029/98JD00881, 1998.
Groff, C.: Impact of Biogenic Volatile Organic Compounds on Peroxyacetyl Nitrate Production in the Southeast United States, Master's Thesis, Purdue University, West Lafayette, USA, 2015.
Grossenbacher, J. W., Couch, T., Shepson, P. B., Thornberry, T., Witmer-Rich, M., Carroll, M. A., Faloona, I., Tan, D., Brune, W., Ostling, K., and Bertman, S.: Measurements of isoprene nitrates above a forest canopy, J. Geophys. Res., 106, 24429–24438, 2001.
Grossenbacher, J. W., Barket Jr., D. J., Shepson, P. B, Carroll, M. A., Olszyna, K., and Apel, E.: A comparison of isoprene nitrate concentrations at two forest-impacted sites, J. Geophys. Res., 109, 2049, https://doi.org/10.1029/2003JD003966, 2004.
Guenther, A., Hewitt, C. N., Erickson, D., Fall, R., Geron, C., Graedel, T., Harley, P., Klinger, L., Lerdau, M., Mckay, W. A., Pierce, T., Scholes, B., Steinbrecher, R., Tallamraju, R., Taylor, J., and Zimmerman, P.: A global model of natural volatile organic compound emissions, J. Geophys. Res., 100, 8873, https://doi.org/10.1029/94JD02950, 1995.
Guo, H., Xu, L., Bougiatioti, A., Cerully, K. M., Capps, S. L., Hite Jr., J. R., Carlton, A. G., Lee, S.-H., Bergin, M. H., Ng, N. L., Nenes, A., and Weber, R. J.: Fine-particle water and pH in the southeastern United States, Atmos. Chem. Phys., 15, 5211–5228, https://doi.org/10.5194/acp-15-5211-2015, 2015.
Hagerman, L. M., Aneja, V. P., and Lonneman W.: Characterization of non-methane hydrocarbons in the rural southeast United States, Atmos. Environ., 31, 4017–4038, 1997.
Hidy, G. M., Blanchard, C. L., Baumann, K., Edgerton, E., Tanenbaum, S., Shaw, S., Knipping, E., Tombach, I., Jansen, J., and Walters, J.: Chemical climatology of the southeastern United States, 1999–2013, Atmos. Chem. Phys., 14, 11893–11914, https://doi.org/10.5194/acp-14-11893-2014, 2014.
Hu, W. W., Campuzano-Jost, P., Palm, B. B., Day, D. A., Ortega, A. M., Hayes, P. L., Krechmer, J. E., Chen, Q., Kuwata, M., Liu, Y. J., de Sá, S. S., McKinney, K., Martin, S. T., Hu, M., Budisulistiorini, S. H., Riva, M., Surratt, J. D., St. Clair, J. M., Isaacman-Van Wertz, G., Yee, L. D., Goldstein, A. H., Carbone, S., Brito, J., Artaxo, P., de Gouw, J. A., Koss, A., Wisthaler, A., Mikoviny, T., Karl, T., Kaser, L., Jud, W., Hansel, A., Docherty, K. S., Alexander, M. L., Robinson, N. H., Coe, H., Allan, J. D., Canagaratna, M. R., Paulot, F., and Jimenez, J. L.: Characterization of a real-time tracer for isoprene epoxydiols-derived secondary organic aerosol (IEPOX-SOA) from aerosol mass spectrometer measurements, Atmos. Chem. Phys., 15, 11807–11833, https://doi.org/10.5194/acp-15-11807-2015, 2015.
Jacobs, M. I., Burke, W. J., and Elrod, M. J.: Kinetics of the reactions of isoprene-derived hydroxynitrates: gas phase epoxide formation and solution phase hydrolysis, Atmos. Chem. Phys., 14, 8933–8946, https://doi.org/10.5194/acp-14-8933-2014, 2014.
Jenkin, M. E., Young, J. C., and Rickard, A. R.: The MCM v3.3.1 degradation scheme for isoprene, Atmos. Chem. Phys., 15, 11433–11459, https://doi.org/10.5194/acp-15-11433-2015, 2015.
Jobson, B. T., Niki, H., Yokouchi, Y., Bottenheim, J., Hopper, F., and Leaitch, R.: Measurements of C2-C6 hydrocarbons during the Polar Sunrise 1992 Experiment: Evidence for Cl atom and Br atom chemistry, J. Geophys. Res., 99, 25355–25368, 1994.
Kjaergaard, H. G., Knap, H. C., Ørnsø, K. B., Jørgensen, S., Crounse, J. D., Paulot, F., and Wennberg, P. O.: Atmospheric Fate of Methacrolein. 2. Formation of Lactone and Implications for Organic Aerosol Production, J. Phys. Chem. A, 116, 5763–5768, https://doi.org/10.1021/jp210853h, 2012.
Kleindienst, T. E., Shepson, P. B., Smith, D. F., Hudgens, E. E., Nero, C. M., Cupitt, L. T., Bufalini, J. J., and Claxton, L. D.: Comparison of mutagenic activities of several peroxyacyl nitrates, Environ. Mol. Mutagen., 16, 70–80, 1990.
Lee, B. H., Mohr, C., Lopez-Hilfiker, F. D., Lutz, A., Hallquist, M., Lee, L., Romer, P., Cohen, R. C., Iyer, S., Kurtén, T., Hu, W., Day, D. A., Campuzano-Jost, P., Jimenez, J. L., Xu, L., Ng, N. L., Guo, H., Weber, R. J., Wild, R. J., Brown, S. S., Koss, A., de Gouw, J., Olson, K., Goldstein, A. H., Seco, R., Kim, S., McAvey, K., Shepson, P. B., Starn, T., Baumann, K., Edgerton, E. S., Liu, J., Shilling, J. E., Miller, D. O., Brune, W., Schobesberger, S., D'Ambro, E. L., and Thornton, J. A.: Highly functionalized organic nitrates in the southeast United States: Contribution to secondary organic aerosol and reactive nitrogen budgets, P. Natl. Acad. Sci. USA, 113, 1516–1521, https://doi.org/10.1073/pnas.1508108113, 2016.
Lin, Y.-H., Zhang, H., Pye, H. O., Zhang, Z., Marth, W. J., Park, S., Arashiro, M., Cui, T., Budisulistiorini, S. H., and Sexton, K. G.: Epoxide as a precursor to secondary organic aerosol formation from isoprene photooxidation in the presence of nitrogen oxides, P. Natl. Acad. Sci. USA, 110, 6718–6723, https://doi.org/10.1073/pnas.1221150110, 2013.
Liu, Y. J., Herdlinger-Blatt, I., McKinney, K. A., and Martin, S. T.: Production of methyl vinyl ketone and methacrolein via the hydroperoxyl pathway of isoprene oxidation, Atmos. Chem. Phys., 13, 5715–5730, https://doi.org/10.5194/acp-13-5715-2013, 2013.
Lockwood, A. L., Shepson, P. B., Fiddler, M. N., and Alaghmand, M.: Isoprene nitrates: preparation, separation, identification, yields, and atmospheric chemistry, Atmos. Chem. Phys., 10, 6169–6178, https://doi.org/10.5194/acp-10-6169-2010, 2010.
Mao, J., Paulot, F., Jacob, D. J., Cohen, R. C., Crounse, J. D., Wennberg, P. O., Keller, C. A., Hudman, R. C., Barkley, M. P., and Horowitz, L. W.: Ozone and organic nitrates over the eastern United States: Sensitivity to isoprene chemistry, J. Geophys. Res., 118, 11256–11268, 2013.
Mendenhall, W., Beaver, R. J., and Beaver, B. M.: Introduction to Probability and Statistics, 13 edn., Brooks/Cole, Cengage Learning, Belmont, CA, USA, 2008.
Milford, J. B., Gao, D., Sillman, S., Blossey, P., and Russell, A. G.: Total reactive nitrogen (NOy) as an indicator of the sensitivity of ozone to reductions in hydrocarbon and NOx emissions, J. Geophys. Res., 99, 3533–3542, 1994.
Nguyen, T. B., Crounse, J. D., Schwantes, R. H., Teng, A. P., Bates, K. H., Zhang, X., St. Clair, J. M., Brune, W. H., Tyndall, G. S., Keutsch, F. N., Seinfeld, J. H., and Wennberg, P. O.: Overview of the Focused Isoprene eXperiment at the California Institute of Technology (FIXCIT): mechanistic chamber studies on the oxidation of biogenic compounds, Atmos. Chem. Phys., 14, 13531–13549, https://doi.org/10.5194/acp-14-13531-2014, 2014.
Nguyen, T. B., Bates, K. H., Crounse, J. D., Schwantes, R. H., Zhang, X., Kjaergaard, H. G., Surratt, J. D., Lin, P., Laskin, A., Seinfeld, J. H., and Wennberg, P. O.: Mechanism of the hydroxyl radical oxidation of methacryloyl peroxynitrate (MPAN) and its pathway toward secondary organic aerosol formation in the atmosphere, Phys. Chem. Chem. Phys., 17, 17914–17926, https://doi.org/10.1039/C5CP02001H, 2015.
Nouaime, G., Bertman, S. B., Seaver, C., Elyea, D., Huang, H., Shepson, P. B., Starn, T. K., Riemer, D. D., Zika, R. G., and Olszyna, K.: Sequential oxidation products from tropospheric isoprene chemistry: MACR and MPAN at a NOx-rich forest environment in the southeastern United States, J. Geophys. Res., 103, 22463–22471, https://doi.org/10.1029/98JD00320, 1998.
Paulot, F., Crounse, J. D., Kjaergaard, H. G., Kroll, J. H., Seinfeld, J. H., and Wennberg, P. O.: Isoprene photooxidation: new insights into the production of acids and organic nitrates, Atmos. Chem. Phys., 9, 1479–1501, https://doi.org/10.5194/acp-9-1479-2009, 2009a.
Paulot, F., Crounse, J. D., Kjaergaard, H. G., Kürten, A., Clair, J. M. S., Seinfeld, J. H., and Wennberg, P. O.: Unexpected Epoxide Formation in the Gas-Phase Photooxidation of Isoprene, Science, 325, 730–733, https://doi.org/10.1126/science.1172910, 2009b.
Pippin, M., Bertman, S., Thornberry, T., Town, M., Carroll, M. A., and Sillman, S.: Seasonal variations of PAN, PPN, and O3 at the upper Midwest PROPHET site, J. Geophys. Res., 106, 24451–24463, https://doi.org/10.1029/2001JD900222, 2001.
Pye, H. O. T., Pinder, R. W., Piletic, I. R., Xie, Y., Capps, S. L., Lin, Y.-H., Surratt, J. D., Zhang, Z., Gold, A., Luecken, D. J., Hutzell, W. T., Jaoui, M., Offenberg, J. H., Kleindienst, T. E., Lewandowski, M., and Edney, E. O.: Epoxide Pathways Improve Model Predictions of Isoprene Markers and Reveal Key Role of Acidity in Aerosol Formation, Environ. Sci. Technol., 47, 11056–11064, https://doi.org/10.1021/es402106h, 2013.
Pye, H. O. T., Luecken, D. J., Xu, L., Boyd, C. M., Ng, N. L., Baker, K. R., Ayres, B. R., Bash, J. O., Baumann, K., Carter, W. P. L., Edgerton, E., Fry, J. L., Hutzell, W. T., Schwede, D. B., and Shepson, P. B.: Modeling the Current and Future Roles of Particulate Organic Nitrates in the Southeastern United States, Environ. Sci. Technol., 49, 14195–14203, https://doi.org/10.1021/acs.est.5b03738, 2015.
Rindelaub, J. D., Borca, C. H., Hostetler, M. A., Slade, J. H., Lipton, M. A., Slipchenko, L. V., and Shepson, P. B.: The acid-catalyzed hydrolysis of an α-pinene-derived organic nitrate: kinetics, products, reaction mechanisms, and atmospheric impact, Atmos. Chem. Phys., 16, 15425–15432, https://doi.org/10.5194/acp-16-15425-2016, 2016.
Roberts, J. M.: PAN and Related Compounds, in Volatile Organic Compounds in the Atmosphere, edited by: Koppmann, R., 221–268, Blackwell Publishing Ltd, Oxford, UK, 2007.
Roberts, J. M. and Bertman, S. B.: The thermal decomposition of peroxyacetic nitric anhydride (PAN) and peroxymethacrylic nitric anhydride (MPAN), Int. J. Chem. Kinet., 24, 297–307, 1992.
Roberts, J. M., Williams, J., Baumann, K., Buhr, M. P., Goldan, P. D., Holloway, J., Hübler, G., Kuster, W. C., McKeen, S. A., and Ryerson, T. B.: Measurements of PAN, PPN, and MPAN made during the 1994 and 1995 Nashville Intensives of the Southern Oxidant Study: Implications for regional ozone production from biogenic hydrocarbons, J. Geophys. Res., 103, 22473–22490, 1998.
Roberts, J. M., Flocke, F., Weinheimer, A., Tanimoto, H., Jobson, B. T., Riemer, D., Apel, E., Atlas, E., Donnelly, S., and Stroud, V.: Observations of APAN during TexAQS 2000, Geophys. Res. Lett., 28, 4195–4198, 2001.
Roberts, J. M., Flocke, F., Stroud, C. A., Hereid, D., Williams, E., Fehsenfeld, F., Brune, W., Martinez, M., and Harder, H.: Ground-based measurements of peroxycarboxylic nitric anhydrides (PANs) during the 1999 Southern Oxidants Study Nashville Intensive, J. Geophys. Res., 107, 4554, https://doi.org/10.1029/2001JD000947, 2002.
Rollins, A. W., Smith, J. D., Wilson, K. R., and Cohen, R. C.: Real Time In Situ Detection of Organic Nitrates in Atmospheric Aerosols, Environ. Sci. Technol., 44, 5540–5545, https://doi.org/10.1021/es100926x, 2010.
Romer, P. S., Duffey, K. C., Wooldridge, P. J., Allen, H. M., Ayres, B. R., Brown, S. S., Brune, W. H., Crounse, J. D., de Gouw, J., Draper, D. C., Feiner, P. A., Fry, J. L., Goldstein, A. H., Koss, A., Misztal, P. K., Nguyen, T. B., Olson, K., Teng, A. P., Wennberg, P. O., Wild, R. J., Zhang, L., and Cohen, R. C.: The lifetime of nitrogen oxides in an isoprene-dominated forest, Atmos. Chem. Phys., 16, 7623–7637, https://doi.org/10.5194/acp-16-7623-2016, 2016.
Russell, A. R., Valin, L. C., and Cohen, R. C.: Trends in OMI NO2 observations over the United States: effects of emission control technology and the economic recession, Atmos. Chem. Phys., 12, 12197–12209, https://doi.org/10.5194/acp-12-12197-2012, 2012.
Shepson, P. B.: Organic Nitrates, in Volatile Organic Compounds in the Atmosphere, chap. 7, edited by: Koppmann, R., 269–291, Blackwell Publishing Ltd, Oxford, UK, 2007.
Starn, T. K., Shepson, P. B., Bertman, S. B., White, J. S., Splawn, B. G., Riemer, D. D., Zika, R. G., and Olszyna, K.: Observations of isoprene chemistry and its role in ozone production at a semirural site during the 1995 Southern Oxidants Study, J. Geophys. Res., 103, 22425–22435, https://doi.org/10.1029/98JD01279, 1998.
Surratt, J. D., Chan, A. W. H., Eddingsaas, N. C., Chan, M., Loza, C. L., Kwan, A. J., Hersey, S. P., Flagan, R. C., Wennberg, P. O., and Seinfeld, J. H.: Atmospheric Chemistry Special Feature: Reactive intermediates revealed in secondary organic aerosol formation from isoprene, P. Natl. Acad. Sci. USA, 107, 6640–6645, https://doi.org/10.1073/pnas.0911114107, 2010.
Tanimoto, H. and Akimoto, H.: A new peroxycarboxylic nitric anhydride identified in the atmosphere: CH2=CHC(O)OONO2 (APAN), Geophys. Res. Lett., 28, 2831–2834, 2001.
Tatsuoka, M. M.: Multivariate Analysis: Techniques for Educational and Psychological Research, John Wiley & Sons, New York, USA, 1971.
Thornton, J. A., Wooldridge, P. J., Cohen, R. C., Martinez, M., Harder, H., Brune, W. H., Williams, E. J., Roberts, J. M., Fehsenfeld, F. C., Hall, S. R., Shetter, R. E., Wert, B. P., and Fried, A.: Ozone production rates as a function of NOx abundances and HOx production rates in the Nashville urban plume, J. Geophys. Res., 107, F12417, https://doi.org/10.1029/2001JD000932, 2002.
Trainer, M., Parrish, D. D., Buhr, M. P., Norton, R. B., Fehsenfeld, F. C., Anlauf, K. G., Bottenheim, J. W., Tang, Y. Z., Wiebe, H. A., Roberts, J. M., Tanner, R. L., Newman, L., Bowersox, V. C., Meagher, J. F., Olszyna, K. J., Rodgers, M. O., Wang, T., Berresheim, H., Demerjian, K. L., and Roychowdhury, U. K.: Correlation of ozone with NOy in photochemically aged air, J. Geophys. Res., 98, 2917–2925, https://doi.org/10.1029/92JD01910, 1993.
USEPA: https://www.epa.gov/air-trends/, last access: 28 January 2019.
Washenfelder, R. A., Attwood, A. R., Brock, C. A., Guo, H., Xu, L., Weber, R. J., Ng, N. L., Allen, H. M., Ayres, B. R., Baumann, K., Cohen, R. C., Draper, D. C., Duffey, K. C., Edgerton, E., Fry, J. L., Hu, W. W., Jimenez, J. L., Palm, B. B., Romer, P., Stone, E. A., Wooldridge, P. J., and Brown, S. S.: Biomass burning dominates brown carbon absorption in the rural southeastern United States, Geophys. Res. Lett., 42, 653–664, https://doi.org/10.1002/2014GL062444, 2015.
Wennberg, P. O., Bates, K. H., Crounse, J. D., Dodson, L. G., McVay, R. C., Mertens, L. A., Nguyen, T. B., Praske, E., Schwantes, R. H., Smarte, M. D., St Clair, J. M., Teng, A. P., Zhang, X., and Seinfeld, J. H.: Gas-Phase Reactions of Isoprene and Its Major Oxidation Products, Chem. Rev., 118, 3337–3390, https://doi.org/10.1021/acs.chemrev.7b00439, 2018.
Williams, J., Roberts, J. M., Fehsenfeld, F. C., Bertman, S. B., Buhr, M. P., Goldan, P. D., Hübler, G., Kuster, W. C., Ryerson, T. B., Trainer, M., and Young, V.: Regional ozone from biogenic hydrocarbons deduced from airborne measurements of PAN, PPN, and MPAN, Geophys. Res. Lett., 24, 1099–1102, https://doi.org/10.1029/97GL00548, 1997.
Worton, D. R., Surratt, J. D., LaFranchi, B. W., Chan, A. W. H., Zhao, Y., Weber, R. J., Park, J.-H., Gilman, J. B., de Gouw, J., Park, C., Schade, G., Beaver, M., Clair, J. M. S., Crounse, J., Wennberg, P., Wolfe, G. M., Harrold, S., Thornton, J. A., Farmer, D. K., Docherty, K. S., Cubison, M. J., Jimenez, J. L., Frossard, A. A., Russell, L. M., Kristensen, K., Glasius, M., Mao, J., Ren, X., Brune, W., Browne, E. C., Pusede, S. E., Cohen, R. C., Seinfeld, J. H., and Goldstein, A. H.: Observational Insights into Aerosol Formation from Isoprene, Environ. Sci. Technol., 47, 11403–11413, https://doi.org/10.1021/es4011064, 2013.
Xiong, F., McAvey, K. M., Pratt, K. A., Groff, C. J., Hostetler, M. A., Lipton, M. A., Starn, T. K., Seeley, J. V., Bertman, S. B., Teng, A. P., Crounse, J. D., Nguyen, T. B., Wennberg, P. O., Misztal, P. K., Goldstein, A. H., Guenther, A. B., Koss, A. R., Olson, K. F., de Gouw, J. A., Baumann, K., Edgerton, E. S., Feiner, P. A., Zhang, L., Miller, D. O., Brune, W. H., and Shepson, P. B.: Observation of isoprene hydroxynitrates in the southeastern United States and implications for the fate of NOx, Atmos. Chem. Phys., 15, 11257–11272, https://doi.org/10.5194/acp-15-11257-2015, 2015.
Xu, L., Guo, H., Boyd, C. M., Klein, M., Bougiatioti, A., Cerully, K. M., Hite, J. R., Isaacman-VanWertz, G., Kreisberg, N. M., Knote, C., Olson, K., Koss, A., Goldstein, A. H., Hering, S. V., de Gouw, J., Baumann, K., Lee, S.-H., Nenes, A., Weber, R. J., and Ng, N. L.: Effects of anthropogenic emissions on aerosol formation from isoprene and monoterpenes in the southeastern United States, P. Natl. Acad. Sci. USA, 112, 37–42, https://doi.org/10.1073/pnas.1417609112, 2015.