the Creative Commons Attribution 4.0 License.
the Creative Commons Attribution 4.0 License.
 | 20 Dec 2019
Atmospheric mercury deposition over the land surfaces and the associated uncertainties in observations and simulations: a critical review
Peisheng Zhou
Shuzhen Cao
Yu Zhao
One of the most important processes in the global mercury (Hg) biogeochemical cycling is the deposition of atmospheric Hg, including gaseous elemental mercury (GEM), gaseous oxidized mercury (GOM), and particulate-bound mercury (PBM), to the land surfaces. Results of wet, dry, and forest Hg deposition from global observation networks, individual monitoring studies, and observation-based simulations have been reviewed in this study. Uncertainties in the observation and simulation of global speciated atmospheric Hg deposition to the land surfaces have been systemically estimated based on assessment of commonly used observation methods, campaign results for comparison of different methods, model evaluation with observation data, and sensitivity analysis for model parameterization. The uncertainties of GOM and PBM dry deposition measurements come from the interference of unwanted Hg forms or incomplete capture of targeted Hg forms, while that of GEM dry deposition observation originates from the lack of a standardized experimental system and operating procedure. The large biases in the measurements of GOM and PBM concentrations and the high sensitivities of key parameters in resistance models lead to high uncertainties in GOM and PBM dry deposition simulation. Non-precipitation Hg wet deposition could play a crucial role in alpine and coastal regions, and its high uncertainties in both observation and simulation affect the overall uncertainties of Hg wet deposition. The overall uncertainties in the observation and simulation of the total global Hg deposition were estimated to be ± (25–50) % and ± (45–70) %, respectively, with the largest contributions from dry deposition. According to the results from uncertainty analysis, future research needs were recommended, among which a global Hg dry deposition network, unified methods for GOM and PBM dry deposition measurements, quantitative methods for GOM speciation, campaigns for comprehensive forest Hg behavior, and more efforts in long-term Hg deposition monitoring in Asia are the top priorities.
- Article
(3246 KB) -
Supplement
(282 KB) - BibTeX
- EndNote


Mercury (Hg) is a global pollutant, characterized by its neurotoxicity, persistency, and bioaccumulation effect. It undergoes regional or global long-range transport via atmospheric circulation, deposition to local or remote areas, methylation in ecosystems, and accumulation through the food chain, posing high risks to human health and the environment (Obrist et al., 2018). Hg in the atmosphere has three major forms: gaseous elemental mercury (GEM), gaseous oxidized mercury (GOM), and particulate-bound mercury (PBM). The sum of GEM and GOM is called total gaseous mercury (TGM), and the sum of GOM and PBM is also known as reactive mercury (RM). GEM is the predominant form of atmospheric Hg (> 90 %), with a long residence time of several months to over 1 year due to its chemical inertness and low solubility. GOM used to be estimated to account for less than 1 % of atmospheric Hg, which is easily scavenged by wet deposition, resulting in a short residence time of hours to days (Schroeder and Munthe, 1998; Lindberg et al., 2007). However, recent studies (Lyman et al., 2010; Gustin et al., 2013, 2015; McClure et al., 2014) showed that there could be a significant underestimation of GOM due to the low capture efficiency of the KCl denuder method adopted by most observation sites in the presence of ozone and moisture. PBM (< 10 % of atmospheric Hg) stays in the air for days to several weeks depending on particle size before being scavenged by dry or wet deposition (Schroeder and Munthe, 1998; Lindberg et al., 2007; Ci et al., 2012; Fu et al., 2012; Zhang et al., 2016a).
Deposition is one of the most important processes in global Hg cycling, leading to the sink of atmospheric Hg (Obrist et al., 2018). According to the Global Mercury Assessment 2018 (UN Environment, 2019), the annual Hg deposition to the land surfaces including freshwater is estimated to be 3600 t. Atmospheric Hg deposition can be broadly divided into wet and dry deposition. Hg wet deposition is mostly in the form of precipitation (rain, snow, etc.), with non-negligible contributions from non-precipitation forms (cloud, fog, dew, frost, etc.). Hg dry deposition is highly related to the underlying surfaces, including forest canopies, grasslands, wetlands, agricultural fields, deserts, background non-vegetated soils, and contaminated sites (Zhang et al., 2009). Forest canopy is regarded as an important sink of atmospheric Hg for its special forms of deposition, litterfall, and throughfall (Gustin et al., 2008). Litterfall is a form of indirect Hg dry deposition through foliar uptake of atmospheric Hg, and throughfall includes wet-deposited Hg above the canopy and a portion of dry-deposited Hg washed off from the canopy (Wright et al., 2016). Hg deposition through litterfall has recently attracted much attention through the study of Wang et al. (2016a). The sum of litterfall and throughfall is regarded as the total Hg deposition in forest canopies.
Significant efforts have been made in the past decade in quantifying atmospheric Hg deposition through both direct observations and model simulations, especially of dry deposition (Lyman et al., 2009, 2014; Zhang et al., 2009; Holmes et al., 2011; Lai et al., 2011; Castro et al., 2012; Sexauer Gustin et al., 2012; Peterson et al., 2012; L. Zhang et al., 2012; Fang et al., 2013; Sather et al., 2013, 2014; Huang and Gustin, 2015a; Weiss-Penzias et al., 2016a; Zhang et al., 2016b; Hall et al., 2017; Sprovieri et al., 2017). Yet large uncertainties still exist due to limitations of the current methods for Hg deposition measurements and modeling (Gustin et al., 2015). The purpose of this paper is to give an overview of the uncertainties in the observation and simulation of global speciated atmospheric Hg deposition over the land surfaces. In this paper, we investigated results from observations and simulations of global Hg deposition, reviewed methods adopted for Hg deposition measurements and modeling, estimated the uncertainties of different methods for different Hg deposition forms, and summarized the overall uncertainty level of the global Hg deposition.
2.1 Wet deposition
Precipitation is the major form of Hg wet deposition. There have been several observation networks of Hg wet deposition through precipitation. The Global Mercury Observation System (GMOS) is so far the only global-scale network covering the Northern Hemisphere, the tropics, and the Southern Hemisphere (Sprovieri et al., 2017). The Mercury Deposition Network (MDN) of the National Atmospheric Deposition Program (NADP) in North America is the earliest continental-scale network specifically for Hg deposition (Prestbo and Gay, 2009; Weiss-Penzias et al., 2016a). Hg wet deposition is also monitored in the European Monitoring and Evaluation Programme (EMEP) for Europe (Tørseth et al., 2012; Bieser et al., 2014). A new Asia–Pacific Mercury Monitoring Network (APMMN) has recently been established (Sheu et al., 2019).
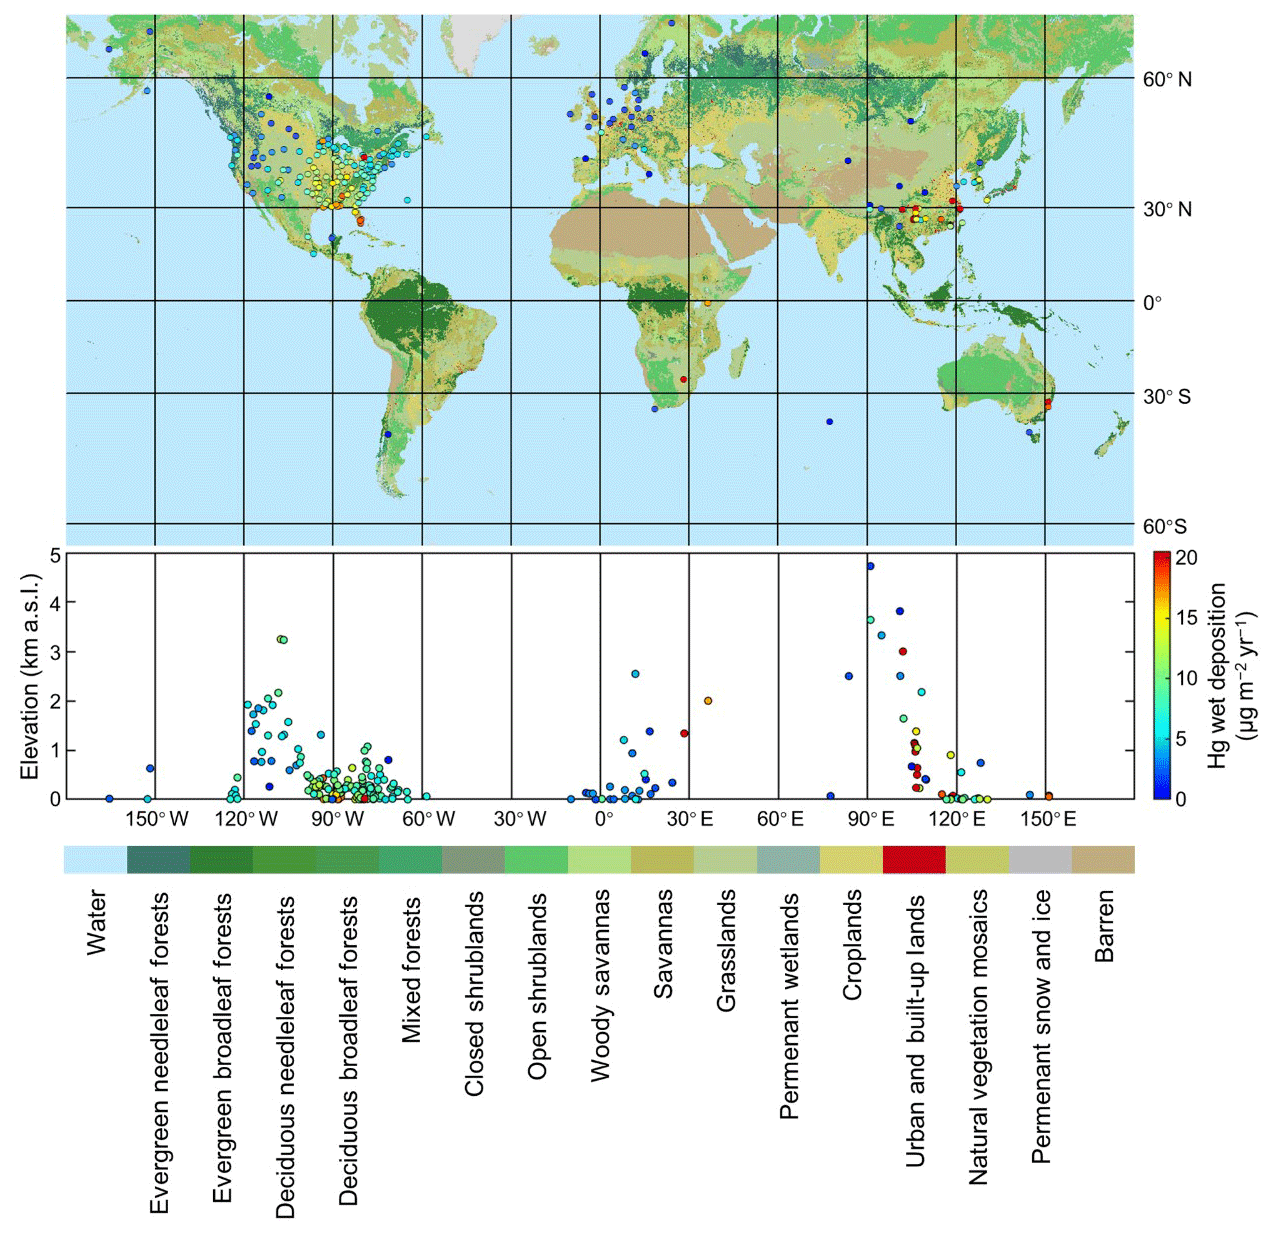
Figure 1Global distribution of the observed Hg wet deposition fluxes by observation networks around the world (µg m−2 yr−1).

Figure 2Global distribution of the (a) GOM, (b) PBM, and (c) GEM dry deposition fluxes (µg m−2 yr−1) from observation-based estimation.
Sprovieri et al. (2017) reported a 5-year record (2011–2015) of Hg wet deposition at 17 selected GMOS monitoring sites, which provided a global baseline of the Hg wet deposition flux including regions in the Southern Hemisphere and tropical areas. The annual averages (multiple year ranges) of Hg wet deposition in the Northern Hemisphere, the tropics, and the Southern Hemisphere were 2.9 (0.2–6.7), 4.7 (2.4–7.0), and 1.9 (0.3–3.3) µg m−2 yr−1, respectively. The MDN network has a much longer history dating back to the 1990s. Weiss-Penzias et al. (2016a) analyzed records from 19 sites in the United States (US) and Canada between 1997 and 2013 and discovered trends of Hg concentration in wet deposition, with the early time period (1998–2007) producing a significantly negative trend ( % yr−1) and the late time period (2008–2013) a flat slope (not significant). Therefore, the MDN data of 136 sites for the time period of 2008–2015 (http://nadp.slh.wisc.edu/mdn, last access: 18 December 2019) were used in Fig. 1 to represent the recent background Hg wet deposition level in North America. Fu et al. (2016a) summarized wet deposition measurements from seven monitoring sites in China. The annual Hg wet deposition fluxes at six rural sites were on average 4.8 µg m−2 yr−1, while the annual flux at an urban site was as high as 12.6 µg m−2 yr−1.
Figure 1 summarizes the global distribution of the observed Hg wet deposition fluxes based on results from both these global or regional networks and individual studies. Overall, East Asia has the highest wet deposition flux (on average 16.1 µg m−2 yr−1), especially in the southern part of China where the RM concentration level is relatively high (Fu et al., 2008, 2010a, b, 2016a; Guo et al., 2008; Wang et al., 2009; Ahn et al., 2011; Huang et al., 2012b, 2013a, 2015; Seo et al., 2012; Sheu and Lin, 2013; Marumoto and Matsuyama, 2014; Xu et al., 2014; Zhu et al., 2014; Zhao et al., 2015; Han et al., 2016; Ma et al., 2016; Nguyen et al., 2016; Qin et al., 2016; Sommar et at., 2016; Cheng et al., 2017; Travnikov et al., 2017; Chen et al., 2018; Lu and Liu, 2018). North America has an average Hg wet deposition flux of 9.1 µg m−2 yr−1 and exhibits a descending spatial profile from the southeastern part to the northwestern part, which is consistent with the distribution of the atmospheric Hg concentration (L. Zhang et al., 2012; Gichuki and Mason, 2014; Lynam et al., 2017). Europe has the lowest Hg wet deposition level (on average 3.4 µg m−2 yr−1) according to the available observation and simulation data (Connan et al., 2013; Bieser et al., 2014; Siudek et al., 2016). Observation data for the tropics and the Southern Hemisphere are scarce with large uncertainties (Wetang'ula, 2011; Gichuki and Manson, 2013; Sprovieri et al., 2017). The one exceptional tropical site with a wet deposition flux of 16.8 µg m−2 yr−1 is in Kenya, while the other sites in the tropics are all in Mexico (Wetang'ula, 2011; Hansen and Gay, 2013). The two sites in the Southern Hemisphere with annual precipitation of over 4000 mm are in Australia and have wet deposition fluxes of 29.1 and 18.2 µg m−2 yr−1, respectively (Dutt et al., 2009). Seen from the bottom part of Fig. 1, Hg wet deposition flux is not significantly correlated with elevation.
Studies on non-precipitation Hg wet deposition (e.g., cloud, fog, dew, and frost) are very limited so far. Fog or cloud Hg deposition is not yet considered in the global Hg wet deposition observation network. However, studies (Stankwitz et al., 2012; Weiss-Penzias et al., 2016b; Gerson et al., 2017) have shown that cloud and fog water have higher Hg concentrations than precipitation water in the same region, and cloud and fog could have a remarkable contribution to Hg wet deposition in high-elevation forests and near-water surfaces. Stankwitz et al. (2012) and Gerson et al. (2017) found the average cloud Hg deposition fluxes of two North American montane forests to be 7.4 and 4.3 µg m−2 during the research periods, respectively, equivalent to rainfall Hg deposition. On the California coastline, fog Hg deposition, with only 2 % volume proportion, accounts for 13 % of the total wet deposition (Weiss-Penzias et al., 2016b). Converse et al. (2014) found the annual dew and frost Hg deposition at a high-elevation meadow in the US to be about 0.12 µg m−2 yr−1, 2–3 orders of magnitude smaller than wet deposition through precipitation. More standardized methods are in urgent need of non-precipitation Hg wet deposition measurements.
2.2 Dry deposition
Figure 2 shows the global distribution of the GOM, PBM, and GEM dry deposition fluxes from observation-based estimation, either direct observation of dry deposition or simulation based on Hg concentration observation. The global Hg dry deposition network is very immature compared to the wet deposition network due to the inconsistency in methods for estimation. GOM dry deposition fluxes were either measured by the surrogate surface methods or simulated based on GOM concentration measurements. PBM dry deposition fluxes were mainly estimated from the measurements of total or size-resolved PBM concentrations. GEM dry deposition fluxes were measured by different types of methods, including the surrogate surface methods, the enclosure methods, and the micrometeorological methods.
Wright et al. (2016) presented an overview of GOM and PBM dry deposition. In their work, the observation or simulation years for nearly one-third of the reviewed studies were earlier than 2005, and only studies conducted in North America and Asia were summarized. Therefore, this study included more studies carried out in recent years and limited the observation or simulation year to no earlier than 2005. Also, studies in Europe and China were summarized in this study. As shown in Fig. 2, most studies on GOM dry deposition were conducted in North America and Europe, among which direct observations of GOM dry deposition are mainly from North America (Lyman et al., 2007, 2009; Weiss-Penzias et al., 2011; Lombard et al., 2011; Castro et al., 2012; Sexauer Gustin et al., 2012; Peterson et al., 2012; L. Zhang et al., 2012; Sather et al., 2013, 2014; Bieser et al., 2014; Wright et al., 2014; Huang and Guatin, 2015a; Enrico et al., 2016; Han et al., 2016; Zhang et al., 2016b; Huang et al., 2017). Regardless of the estimating methods, the average GOM dry deposition flux in North America (6.4 µg m−2 yr−1) is higher than in Europe (3.0 µg m−2 yr−1). There have been very few studies on GOM dry deposition in Asia. A significant correlation (R2=0.532, p < 0.01) was found between the elevation and the GOM dry deposition flux (see Fig. 3), which could be due to higher GOM concentrations at higher elevation and stronger atmospheric turbulence (Huang and Gustin, 2015a). Nevertheless, significant discrepancies were found between the GOM dry deposition fluxes from direct observations and from model simulations based on measurements of GOM concentrations (see Fig. 4). Results from size-resolved PBM analysis and PBM dry deposition models show that East Asia has a much higher average of PBM dry deposition flux (45.3 µg m−2 yr−1) than North America (1.1 µg m−2 yr−1) (Fang et al., 2012a, b; Zhu et al., 2014; Zhang et al., 2015; Huang et al., 2016; Guo et al., 2017).
Zhu et al. (2016) reviewed the air–surface exchange of GEM. The observation years for most of the reviewed studies were earlier than 2005. Since GEM concentrations decreased significantly from the early 1990s to 2005 in most regions in the world (Y. Zhang et al., 2016), this study included more recent studies and limited the observation or simulation year to no earlier than 2005. The average GEM dry deposition is lower in Europe (4.3±8.1 µg m−2 yr−1) but higher in North America with more variation (5.2±15.5 µg m−2 yr−1) (Castelle et al., 2009; Baya and Heyst, 2010; Converse et al., 2010; Miller et al., 2011). The four Asian sites all show negative values, indicating the role of East Asia as a net emission source rather than a net deposition sink (Luo et al., 2016; Ci et al., 2016; Yu et al., 2018). However, the GEM dry deposition observations in Asia are still very limited.
Hg dry deposition is highly related to the underlying surfaces. Figure 5 exhibits the dry deposition fluxes of GOM, PBM, and GEM for different terrestrial surface types. As shown in Fig. 5a, high GOM dry deposition levels were found for grasslands (mainly alpine meadows) and savannas. This is probably because of the enhanced Hg oxidation process at high elevations with more halogen free radicals or more intensive solar radiations (Huang and Gustin, 2015a). Urban areas also have high GOM dry deposition fluxes due to high GOM concentrations. The low GOM dry deposition fluxes on moist surfaces (near-water surfaces and croplands) might be partially because of fog and dew scavenging (Malcolm and Keeler, 2002; Zhang et al., 2009). The PBM dry deposition flux is high on surfaces with high human activities (urban areas and croplands) and low in vegetative areas, implying the heavier PM pollution in urban and rural areas than in remote areas (Fig. 5b). Short-term observation of GEM dry deposition shows high fluctuation. Therefore, we summarized model estimations and one annual observation dataset (L. Zhang et al., 2012; Bieser et al., 2014; Zhang et al., 2016b; Enrico et al., 2016) and found that the GEM dry deposition does not only depend on GEM concentration, but also on the air–soil Hg exchange compensation point (Luo et al., 2016). Regarding the annual air–surface Hg exchange, instead of an important natural source, forests tend to be a net sink of atmospheric Hg (Fig. 5c).
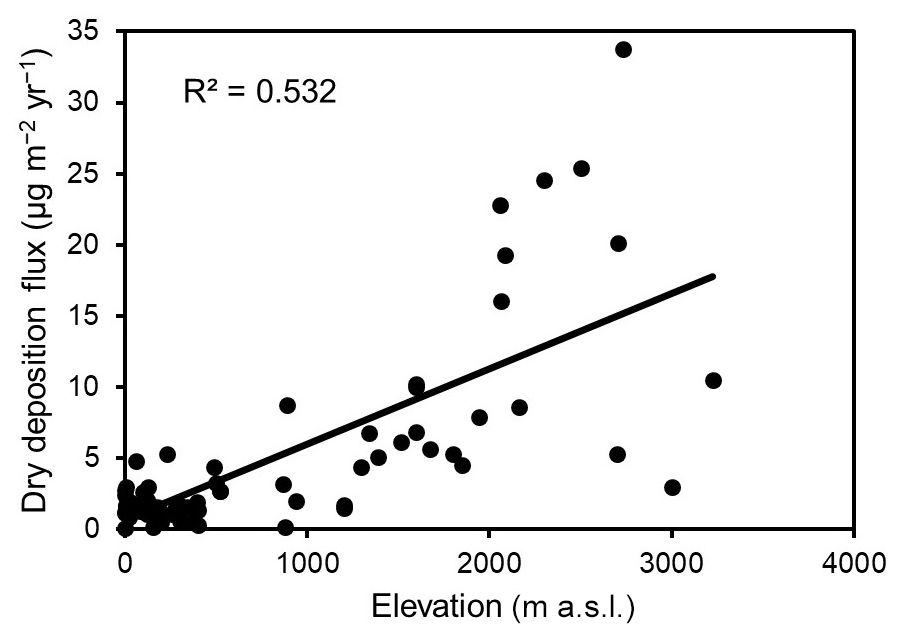
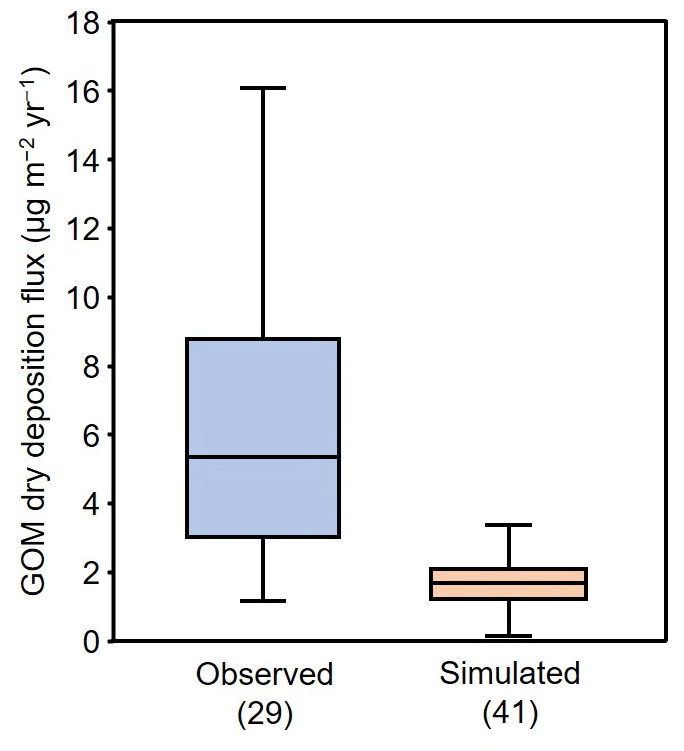
Figure 4Comparison between the GOM dry deposition fluxes from direct observations and from model simulations based on measurements of GOM concentrations. The numbers in brackets stand for the numbers of samples.
2.3 Forest deposition
Hg deposition in forests is mainly in the forms of litterfall and throughfall. Wright et al. (2016) also made an extensive review of litterfall and throughfall Hg deposition. Wang et al. (2016a) made a comprehensive assessment of the global Hg deposition through litterfall and found litterfall Hg deposition an important input to terrestrial forest ecosystems (1180±710 Mg yr−1). Not many new studies on forest Hg deposition have been reported since then. Therefore, here we only briefly introduce the spatial distribution of forest Hg deposition. South America was estimated to bear the highest litterfall Hg deposition (65.8±57.5 µg m−2 yr−1) around the world (Teixeira et al., 2012, 2017; Buch et al., 2015; Fostier et al., 2015; Fragoso et al., 2018; Shen et al., 2019). There have been numerous forest Hg deposition studies in the recent decade in East Asia with the second highest average litterfall Hg deposition flux (35.5±27.7 µg m−2 yr−1) (Wan et al., 2009; Wang et al., 2009; Fu et al., 2010a, b, 2016a; Gong et al., 2014; Luo et al., 2016; Ma et al., 2015, 2016; Han et al., 2016; Wang et al., 2016b; Zhou et al., 2016, 2017). Lower levels of litterfall Hg deposition fluxes were found in North America (12.3±4.9 µg m−2 yr−1) and Europe (14.4±5.8 µg m−2 yr−1) (Larssen et al., 2008; Obrist et al., 2009, 2012; Fisher and Wolfe, 2012; Juillerat et al., 2012; Risch and Kenski, 2018; Risch et al., 2012, 2017; Benoit et al., 2013; Navrátil et al., 2014; Gerson et al., 2017). Throughfall Hg deposition is another important way for Hg input in forests. Wright et al. (2016) summarized previous studies and reported the median throughfall Hg deposition to be 49.0, 16.3, and 7.0 µg m−2 yr−1 in Asia, Europe, and North America, respectively. Large discrepancies in Asian co-located comparisons between rainfall and throughfall Hg depositions (32.9±18.9 and 13.3±8.6 µg m−2 yr−1, respectively) could indicate a high dry deposition level in Asian forests (Wan et al., 2009; Wang et al., 2009, 2016b; Fu et al., 2010a, b, 2016a; Luo et al., 2016; Ma et al., 2015, 2016; Han et al., 2016; Zhou et al., 2016).
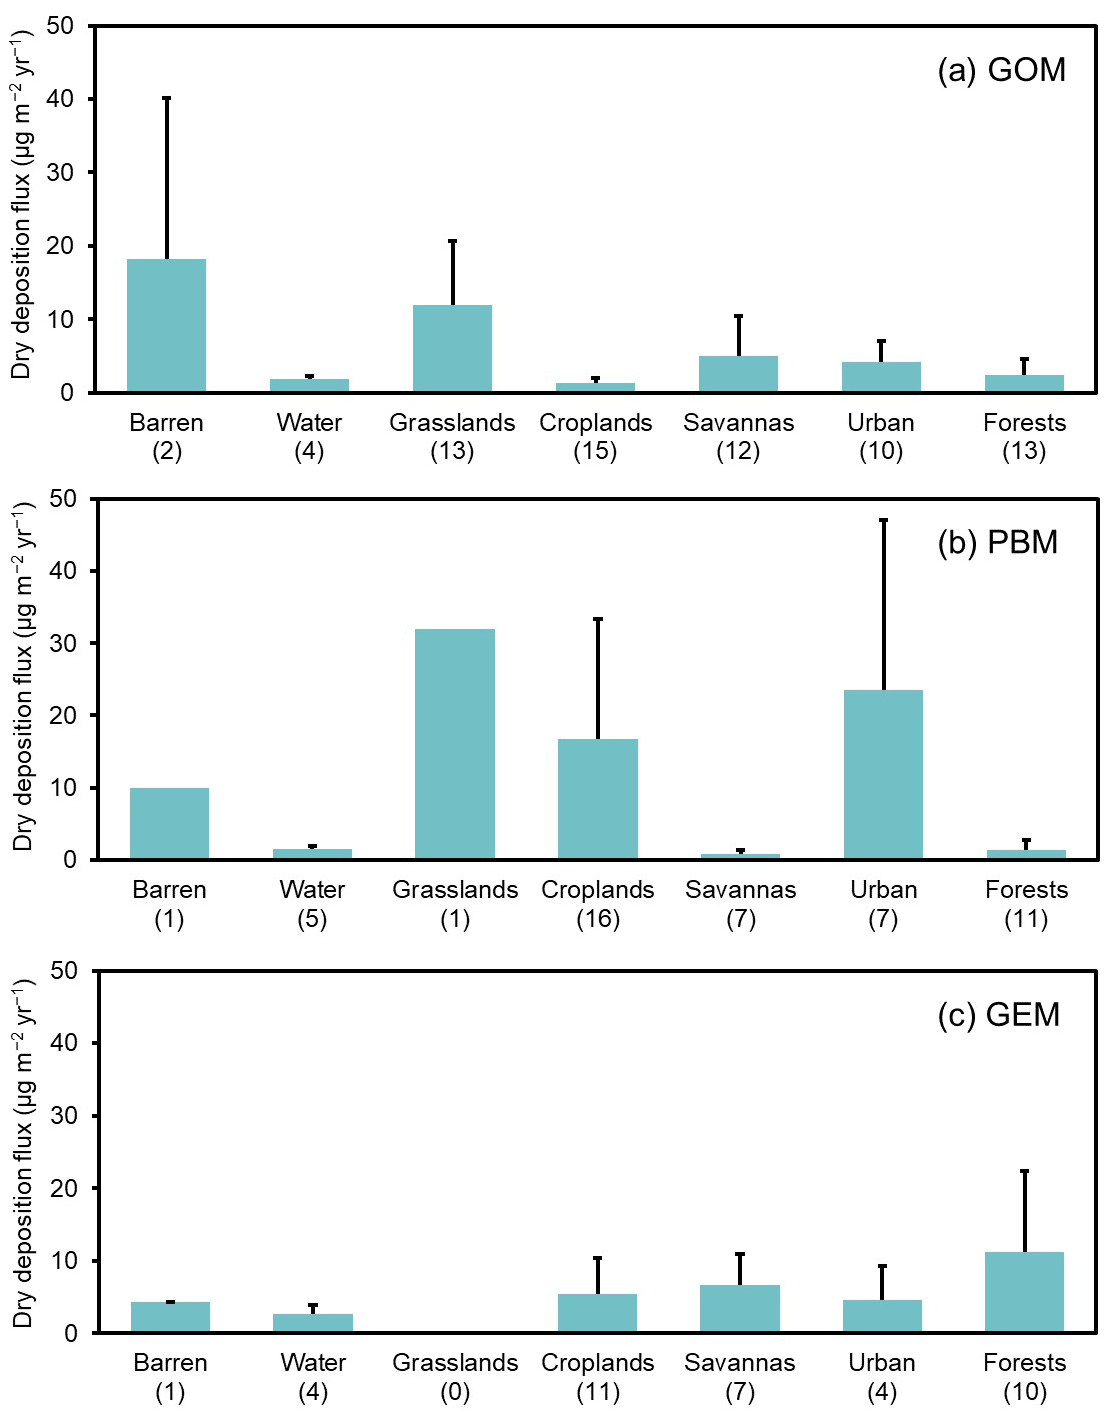
Figure 5Dry deposition fluxes (cyan columns with black bars as standard deviations) of (a) GOM, (b) PBM, and (c) GEM for different terrestrial surface types. “Water” stands for the terrestrial surfaces near water. The numbers in brackets stand for the numbers of samples.
3.1 Uncertainties in the measurements of Hg wet deposition
3.1.1 Measurements of Hg wet deposition through precipitation
Hg wet deposition through precipitation, mostly rainfall, is easier to measure than dry deposition and usually more reliable. The rainfall Hg wet deposition flux is calculated as follows (Zhao et al., 2018):
where Fwet,rainfall is the total rainfall Hg wet deposition flux; n is the number of precipitation events during a certain period; Ci is the total Hg concentration in rainwater during Event i; and Di is the precipitation depth of Event i. As shown in Eq. (1), the overall uncertainty in rainfall Hg wet deposition originates from both the analytical methods of Hg concentration in rainwater and the measurements of precipitation depth.
Both manual and automatic precipitation sample collectors were used in previous studies (Fu et al., 2010a; Gratz and Keeler, 2011; Marumoto and Matsuyama, 2014; Zhu et al., 2014; Brunke et al., 2016; Chen et al., 2018). Automatic precipitation sample collectors cover the lid automatically when it is not raining to prevent potential contamination, while manual collectors require manually placing collectors before precipitation events and require them to be retrieved after events. The measurements of precipitation volume by samplers have non-negligible uncertainties (Wetherbee, 2017). The relative standard deviations (RSDs) of daily and annual precipitation depth measurements in MDN were estimated to be 15 % and 10 %, respectively (Wetherbee et al., 2005). The event-based sampling volume biases of two types of samplers used in APMMN were estimated to be up to 11 %–18 % (Sheu et al., 2019).
The total Hg concentration in rainwater samples is usually analyzed by oxidation, purge and trap, and cold vapor atomic fluorescence spectrometry (CVAFS) following USEPA (2002). GMOS reported the ongoing precision recovery (OPR) for every 12 samples to be generally within 93 %–109 % (Sprovieri et al., 2017). The relative percentage difference (RPD) for MDN precipitation Hg analysis is generally within 10 % according to inter-laboratory comparisons (Wetherbee and Martin, 2018). For individual studies (Fu et al., 2010a; Huang et al., 2015; Zhao et al., 2018), the RSD is also generally less than 10 %.
The overall relative uncertainty of the precipitation Hg wet deposition flux was calculated to be approximately ± (15–20) % using the following equation:
where δF (wet) and UF (wet) are the relative and absolute uncertainties of Hg wet deposition flux, respectively; δC and UC are the relative and absolute uncertainties of the total Hg concentration in precipitation water, respectively; and δD and UD are the relative and absolute uncertainties of the precipitation depth, respectively.
3.1.2 Measurements of Hg wet deposition through cloud, fog, dew, and frost
Non-precipitation Hg wet deposition, e.g., cloud, fog, dew, and frost, could account for a notable proportion of the total wet deposition in montane, coastal, arid, and semi-arid areas (Lawson et al., 2003; Sheu and Lin, 2011; Stankwitz et al., 2012; Blackwell and Driscoll, 2015b). Quantifying Hg in cloud or fog helps better understand the impact of long-range transport and local sources on global Hg cycling (Malcolm et al., 2003). The non-precipitation Hg deposition flux is calculated as follows:
where Fwet,non-precipitation is the non-precipitation Hg deposition flux; m is the number of non-precipitation wet deposition events during a certain period; Cj is the total Hg concentration in non-precipitation wet deposition water during Event j; and Dj is the non-precipitation wet deposition depth of Event j.
Both active and passive collectors have been used to collect cloud or fog water (Lawson et al., 2003; Malcolm et al., 2003; Kim et al., 2006; Sheu and Lin, 2011; Schwab et al., 2016; Weiss-Penzias et al., 2018). The major uncertainty lies in the deposition depth. The deposition depth of cloud, fog, dew, or frost is usually modeled based on meteorology (Converse et al., 2014; Katata, 2014). The fog deposition depth can be measured by standard fog collectors (SFC). The uncertainty of fog deposition depth measurements is mainly from the collecting efficiency of SFC depending on the wind speed, wind direction, or mesh types (Weiss-Penzias et al., 2016b; Fernandez et al., 2018). Montecinos et al. (2018) evaluated the collection efficiency of SFC to be up to 37 %. Therefore, there is extremely large uncertainty in the measurements of the fog deposition depth. Based on the fog deposition studies (Weiss-Penzias et al., 2016b; Fernandez et al., 2018; Montecinos et al., 2018), the overall uncertainty of non-precipitation Hg deposition flux observation is estimated to be ± (200–300) %. Note that the true uncertainty range is not symmetric about the mean because some of the underlying variables are lognormally distributed (Streets et al., 2005). A better interpretation of “± (200–300) %” might be “within a factor of 3–4”.
3.2 Uncertainties in the measurements of Hg dry deposition
Direct measurements of the Hg dry deposition flux are technically challenging: large uncertainties still exist in quantifying Hg dry deposition accurately (Wright et al., 2016). Three major categories of methods for direct Hg dry deposition measurements are the surrogate surface methods, the enclosure methods, and the micrometeorological methods (Zhang et al., 2009; Huang et al., 2014).
3.2.1 Measurements of RM (GOM and PBM) dry deposition
Most of the RM dry deposition measurements used the surrogate surface methods (Huang et al., 2014; Wright et al., 2016). The micrometeorological methods and the enclosure methods were also adopted in some studies (Poissant et al., 2004; Zhang et al., 2005; Skov et al., 2006) but not widely used due to the high uncertainties in the measurements of GOM and PBM concentrations using the Tekran system. For the surrogate surface methods, the RM dry deposition flux is determined using the following equation (Huang et al., 2014):
where Fdry,SS is the Hg dry deposition flux using the surrogate surface methods; M is the total Hg amount collected on the material during the sampling period; A is the surface area of the collection material; and t is the exposure time.
Different surrogate surfaces were used to measure different RM forms. Mounts with cation-exchange membranes (CEMs) are widely used for GOM dry deposition measurements (Lyman et al., 2007, 2009; Castro et al., 2012; Huang et al., 2012a; Peterson et al., 2012; Sather et al., 2013). The down-facing aerodynamic mount with CEM is considered to be the most reliable deployment for GOM dry deposition measurements so far (Lyman et al., 2009; Huang et al., 2014). Knife-edge surrogate surface (KSS) samplers with quartz fiber filters (QFFs) and dry deposition plates (DDPs) with overhead projection films were deployed for PBM dry deposition measurements (Lai et al., 2011; Fang et al., 2012b, 2013). However, these samplers are not well verified to reflect the deposition velocity of PBM and hence are not widely accepted. KCl-coated QFFs were used to measure the total RM (GOM+PBM) dry deposition but failed to capture GOM efficiently (Lyman et al., 2009; Lai et al., 2011).
The uncertainties of RM dry deposition mainly come from the capture efficiency of the sampling surface, the turbulent condition near the surface, and the analysis of the membrane. CEMs exhibited a GOM capture rate of 51 %–107 % in an active sampling system (Huang and Gustin, 2015b). The CEM mounts designed to measure only GOM dry deposition capture part of fine PBM (Lyman et al., 2009; Huang et al., 2014), while the KSS samplers with QFFs designed to measure only PBM dry deposition may also collect part of GOM (Rutter and Schauer, 2007; Gustin et al., 2015). Based on the RM concentration measurements and the surrogate surface method evaluations, the GOM concentration related uncertainty is estimated to be ±50 % (Lyman et al., 2009, 2010; Gustin et al., 2012; Fang et al., 2013; Zhang et al., 2013; Huang et al., 2014). The design of the sampler (e.g., the sampler orientation, the shape of the sampler, variation in turbulence, low surface resistances, passivation) leads to the surface capture efficiency related uncertainty which is about ±50 % for GOM (Lyman et al., 2009; Lai et al., 2011; Huang et al., 2012a). The overall uncertainty in surface capture efficiency could decline to about ±30 % at annual level. Calculating based on the method described by Eq. (2), the overall uncertainty of GOM dry deposition observation is ± (60–70) %. There is not enough information to quantify the overall uncertainty of PBM dry deposition observation in a similar way. However, its uncertainty is usually considered to be higher than that of GOM dry deposition measurements. Based on the distribution of daily samples in the study of Fang et al. (2012b), the overall uncertainty of PBM dry deposition measurements is assumed to be ± (80–100) %.
3.2.2 Measurements of GEM dry deposition
GEM has a low dry deposition velocity due to its mild activity, high volatility, and low water solubility, and deposited GEM could re-emit into the atmosphere (Bullock et al., 2008; Fu et al., 2016b). Various methods have been applied to studies on air–surface GEM exchange, among which the enclosure methods and the micrometeorological methods were most commonly used (Zhang et al., 2009; Agnan et al., 2016; Zhu et al., 2016; Yu et al., 2018). Both Agnan et al. (2016) and Zhu et al. (2016) have presented comprehensive reviews on air–surface GEM exchange and introduced the two types of methods for measurements. The uncertainty of air–surface GEM exchange flux using the micrometeorological methods was estimated to be up to ±30 % (Meyers et al., 1996; Lindberg and Meyers, 2001; Fritsche et al., 2008; Sommer et al., 2013a; W. Zhu et al., 2015). However, Zhu et al. (2016) summarized existing air–surface GEM exchange studies and found that the mean flux using micrometeorological methods is higher than using DFCs by a factor of 2. Agnan et al. (2016) found the uncertainty of GEM flux to be in the range of −180 % to +120 %. Therefore, the overall uncertainty of GEM dry deposition observation is estimated to be ± (100–200) %.
3.3 Uncertainties in the measurements of Hg deposition in forests
In forest ecosystems, the presence of canopy changes the form of Hg deposition. The sum of litterfall and throughfall is more commonly used to represent the total Hg deposition in forests (Wang et al., 2016a; Wright et al., 2016).
3.3.1 Litterfall Hg deposition measurements
Litterfall Hg deposition includes the dry and wet deposited Hg on leaves and bark as well as the captured Hg emitted from the soil (Blackwell and Driscoll, 2015a; Wright et al., 2016). Litterfall Hg deposition flux is calculated as follows (Fisher and Wolfe, 2012):
where Flitterfall is the litterfall Hg deposition flux; EA is the litterfall trap area expansion factor (note: leaves outside the area above the trap could fall into the trap due to horizontal air fluctuation); Cl is the Hg mass concentration in litterfall; Ml is the total dry weight of litterfall; A is the litterfall trap area; and t is the sampling time.
Litterfall samples are collected during the leaf-growing or -falling seasons with litterfall traps or collectors (Fisher and Wolfe, 2012). Total litterfall consists of leaves and needles, woody material such as twigs and bark, and reproductive bodies such as flowers, seeds, fruits, and nuts (Meier et al., 2006; Risch et al., 2012). The total litter mass collected by different samplers could cause a RSD of 16 % (Risch et al., 2012, 2017). The Hg content in litterfall can be determined by thermal decomposition, amalgamation, and cold vapor atomic absorption spectrophotometry (CVAAS) following EPA Method 7473 (Richardson and Friedland, 2015; Fu et al., 2016a; Zhou et al., 2017; Risch et al., 2017). Alternatively, the litterfall samples can be digested and analyzed following EPA Method 1631E (Fu et al., 2010a; Fisher and Wolfe, 2012). The uncertainty in litterfall Hg content analysis is about ±7 % according to the Litterfall Mercury Monitoring Network developed by NADP (Risch et al., 2017) and individual studies (Benoit et al., 2013; Ma et al., 2015; Zhou et al., 2016; Gerson et al., 2017).
Therefore, the event-based uncertainty of litterfall Hg deposition observation is estimated to be ±18 % based on Eq. (2). The Litterfall Mercury Monitoring Network and many other studies only collect litterfall during the falling season each year, which will cause some underestimation. Moreover, based on the assumption that the total Hg concentration in litterfall is linearly accumulated during the growing season, some studies estimated litterfall Hg concentration by multiplying a scale factor, which may cause extra uncertainty (Bushey et al., 2008; Poissant et al., 2008; Fu et al., 2010a; Gong et al., 2014). Taking this into consideration, the overall uncertainty of litterfall Hg deposition observation is estimated to be ± (20–30) %.
3.3.2 Throughfall Hg deposition measurements
Throughfall Hg deposition includes the wet-deposited Hg passing through the canopy and a portion of dry-deposited Hg washed off from the canopy (Blackwell and Driscoll, 2015a; Wright et al., 2016). Throughfall Hg deposition flux is calculated as follows (Fisher and Wolfe, 2012):
where Fthroughfall is the throughfall Hg deposition flux; EA is the throughfall funnel area expansion factor; Ct is the Hg mass concentration in throughfall; Vt is the total volume of throughfall; A is the throughfall funnel area; and t is the sampling time.
Throughfall under canopy is usually collected using a passive bulk throughfall collector with a funnel connected to a bottle for water storage (Wang et al., 2009; Fisher and Wolfe, 2012; Åkerblom et al., 2015) or collected as open-field rain collection if the environmental condition permits (Choi et al., 2008; Fu et al., 2010a, b; Han et al., 2016). Attention should be paid to potential litterfall contamination and cloud or fog deposition influence at high-elevation sites if the collector is not sheathed (Fisher and Wolfe, 2012; Wright et al., 2016). Throughfall samples are usually analyzed following EPA Method 1631E (Fisher and Wolfe, 2012). Therefore, throughfall Hg deposition should have a similar uncertainty to rainfall Hg deposition. Considering the possible interference for throughfall sample collection, the overall uncertainty of throughfall Hg deposition observation is estimated as ± (20–30) %.
4.1 Uncertainties in models for Hg wet deposition
4.1.1 Model for precipitation Hg wet deposition
Hg wet deposition through precipitation is an important process in global or regional chemical transport models (CTMs), such as GEOS-Chem and CMAQ-Hg (Lin et al., 2010; Y. Zhang et al., 2012; Bieser et al., 2014; J. Zhu et al., 2015; Horowitz et al., 2017). As shown in Eq. (1), precipitation Hg wet deposition is the product of the total Hg concentration in rainwater and the precipitation depth. In CTMs, the precipitation Hg concentration contains more uncertain factors. Hg in rainwater originates from the scavenging of GOM and PBM in both free troposphere and boundary layer. Based on previous modeling work for Hg wet deposition in the United States using GEOS-Chem (Selin and Jacob, 2008), GOM and PBM contributed 89 % and 11 % to the total Hg wet deposition, respectively, and 60 % of the GOM-induced wet deposition originated from scavenging in the free troposphere. Seo et al. (2012) and Cheng et al. (2015) also reported a higher scavenging coefficient for GOM than for PBM. Therefore, Hg redox chemistry in the free troposphere, aqueous-phase Hg speciation, aqueous-phase sorption, and the scavenging process tend to be the dominant sources of uncertainties (Lin et al., 2006, 2007; Cheng et al., 2015).
In the simulation of Hg wet deposition by the GEOS-Chem model, the uncertainty of precipitation depth is usually within ±10 % because it is based on assimilated meteorological observations from the Goddard Earth Observing System (GEOS) instead of meteorological models (Y. Zhang et al., 2012). Y. Zhang et al. (2012) conducted a nested-grid simulation of Hg over North America using GEOS-Chem and reported the normalized bias of the annual Hg wet deposition flux as ranging from −14 % to +27 % compared to the MDN observations. Horowitz et al. (2017) used GEOS-Chem to reproduce observed Hg wet deposition fluxes over North America, Europe, and China and also got low bias (0 %–30 %). The CMAQ-Hg model exhibits a higher uncertainty level because the precipitation depth is simulated by meteorological models (e.g., MM5 or WRF) and its uncertainty has a strong impact on model prediction on Hg wet deposition (Lin et al., 2006). In the study of Bullock et al. (2009), the precipitation simulated by MM5 was on average 12 % greater than observed and the CMAQ simulation of Hg wet deposition was on average about 15 % above the MDN observations. However, different boundary conditions could cause a 25 % difference (Bullock et al., 2009). Holloway et al. (2012) found that the CMAQ-Hg model underestimated wet deposition by 21 % on an annual basis and showed average errors of 55 %. Based on the comparison between observed and modeled results and the sensitivity of key parameters, the overall uncertainty of precipitation Hg wet deposition simulation is estimated to be ± (30–50) % depending on the adopted models.
4.1.2 Model for non-precipitation Hg wet deposition
Non-precipitation Hg wet deposition simulation has never been considered in CTMs, but performed in some individual studies with Hg concentration data for cloud, fog, dew, or frost samples (Ritchie et al., 2006; Converse et al., 2014; Blackwell and Driscoll, 2015b). Non-precipitation deposition depth can be estimated using resistance models, analytical models, or sophisticated atmosphere–soil–vegetation models. Katata (2014) reviewed different types of models for fog deposition estimation and found the four most sensitive factors to be canopy homogeneity, droplet size spectra, droplet capture efficiency, and canopy structure. Since fog is the most important form of non-precipitation deposition, the overall uncertainty in the simulation of non-precipitation Hg wet deposition is estimated to be ± (200–300) % or a factor of 3–4 based on the sensitivity analysis in the study of Katata (2014).
4.2 Uncertainties in models for Hg dry deposition
Hg dry deposition flux is proportional to the corresponding Hg concentration (Zhang et al., 2009):
where Fdry is the Hg dry deposition flux; Cz is the Hg concentration at reference height z; and vd is the dry deposition velocity.
In this part, the uncertainties of speciated Hg concentration measurements are first discussed, followed by the uncertainty analyses of Hg dry deposition models.
4.2.1 Uncertainties in speciated Hg concentration measurements
Although many new methods and apparatus have been or are being developed to better determine speciated Hg concentrations in ambient air, up to now the Tekran 2537/1130/1135 system is still the most widely used commercial instrument for continuous measurements of speciated Hg (Gustin et al., 2015). Regional and global monitoring networks such as the Atmospheric Mercury Network (AMNet) and GMOS have all used the Tekran systems and developed systematic quality assurance and quality control (QA/QC) protocols to ensure data quality (Obrist et al., 2018). Therefore, this section is mainly to assess the uncertainties of the Tekran system.
Tekran 2537 uses a pair of gold trap cartridges (A/B) to capture GEM in order to achieve continuous observation and to reduce the uncertainty of GEM measurements. The standard operating procedure (SOP) of GMOS for the determination of GEM requires the RPD of the average of five consecutive A trap concentrations and five consecutive B trap concentrations to be less than 10 % (Sprovieri et al., 2017). In field comparisons held by EMEP, the RSDs from Tekran measurements are also generally within 10 % (Aas, 2006). However, in the Reno Atmospheric Mercury Intercomparison eXperiment (RAMIX) campaign, the RPD between two co-located Tekran systems was as high as 25 %–35 % (Gustin et al., 2013). This was possibly related to other factors, such as the configuration of the manifold, which could be occasional or systemic. Therefore, the overall uncertainty of GEM concentration measurements by the Tekran system is estimated to be ± (10–30) %.
Tekran 1130 uses a KCl-coated denuder to pre-concentrate GOM, and the collected GOM is then thermally desorbed at 500 ∘C and converted to GEM for quantification. A number of studies have reported the significant interference of ozone and humidity on the GOM capture rate of the denuder (Lyman et al., 2010; Jaffe et al., 2014; McClure et al., 2014; Gustin et al., 2015). McClure et al. (2014) found that the KCl-coated denuder only captures 20 %–54 % HgBr2 in the ambient air under the influence of humidity and ozone. Huang et al. (2013b) compared denuder- and membrane-based methods and reported that the KCl-coated denuder only captures 27 %–60 % of the GOM measured by CEMs. Discrepancy with a factor of 2–3 at times was found between the Tekran system and other new methods in the RAMIX campaign (Gustin et al., 2013). Cheng and Zhang (2017) developed a numerical method to assess the uncertainty of GOM measurements and estimated the GOM concentrations measured at 13 AMNet sites to be underestimated by a factor of 1.3 to more than 2. Gustin et al. (2015) reported that the capture efficiency ratio of CEMs over the denuder method for five major GOM compounds ranges from 1.6 to 12.6. Recent studies (Huang and Gustin, 2015a; Huang et al., 2017) applied a correction factor of 3 for Tekran GOM data when modeling dry deposition flux. Therefore, the overall uncertainty of the GOM concentration measured by the Tekran system is estimated to be ±200 % or within a factor of 3. It should be noted that the correction factor of 3 is not universally applicable. Different humidity levels or ozone concentrations lead to a significant change in underestimation. Different chemical forms of GOM also have different KCl capture efficiencies. Therefore, accurate quantification methods for measuring the total and chemically speciated GOM concentration are urgently needed.
Tekran 1135 uses a quartz filter downstream the KCl denuder to collect PM2.5, and the collected fine particles are then thermally desorbed at 800 ∘C at a pyrolyzer and converted to GEM for the quantification of PBM, or rather PBM2.5. The uncertainties in PBM concentration measurements have not been systemically assessed so far. Gustin et al. (2015) pointed out that breakthrough of GOM from the upstream denuder could result in the retention of GOM on the quartz filter and induce consequent PBM overestimation. The RAMIX campaign showed that the RSD of PBM measurements was 70 %–100 % when the Tekran systems were free standing (Gustin et al., 2013). Coarse PBM is neglected in Tekran measurements with an impactor removing all coarse particles. However, based on the estimation of Zhang et al. (2016b), about 30 % of PBM could be on coarse particles. Regarding the limited evidence from previous studies, the overall uncertainty of the PBM concentration measured by the Tekran system is estimated to be ±100 % or a factor of 2.
4.2.2 Resistance model for GOM dry deposition
Based on Eq. (7), the dry deposition velocity (vd) is the key parameter in the determination of Hg dry deposition flux. It can be estimated using a resistance model (Zhang et al., 2002, 2003):
where Ra is the aerodynamic resistance depending on the meteorological conditions and the land use category; Rb is the quasi-laminar resistance, a function of friction velocity and the molecular diffusivity of each chemical species (Zhang et al., 2002); and Rc is the canopy resistance which can be further parameterized as follows:
where Wst is the fraction of stomatal blocking under wet conditions; Rst is the stomatal resistance; Rm is the mesophyll resistance; and Rns is the non-stomatal resistance which is comprised of in-canopy, soil, and cuticle resistances. Cuticle and soil resistances for GOM are scaled to those of SO2 and O3 by the following equation:
where Rx is the cuticle or soil resistance; α and β are two scaling parameters (Zhang et al., 2003; L. Zhang et al., 2012). Among the numerous parameters in the resistance model, the two scaling factors for the non-stomatal resistance components regarding the solubility and reactivity of the chemical species are the most sensitive ones. The values for HNO3 () used to be applied in the model for GOM (Marsik et al., 2007; Castro et al., 2012; L. Zhang et al., 2012). However, some other studies found the values for HONO () are probably more suitable for GOM due to equivalent effective Henry's law constants (H∗) between HONO and HgCl2 (Lyman et al., 2007). Huang and Gustin (2015a) indicated that no single value could be used to calculate GOM dry deposition due to the unknown GOM compounds. Various values for the two scaling parameters (, 5, 7, and 10) were used in Huang et al. (2017) to identify dominant GOM deposition species.
The uncertainties of Ra and Rb are estimated to be generally small, within the range of ±30 % (Zhang et al., 2003; Huang et al., 2012a), while the uncertainty of Rc usually has a larger impact, especially through the selection of α and β. Lyman et al. (2007) changed the values of α and β from 2 to 10 and found a 120 % enhancement of vd. With a correction factor of 3 for the GOM concentration measured by Tekran, Huang and Gustin (2015a) got similar modeled and measured GOM dry deposition values with a bias of up to ±100 %. Huang et al. (2017) also applied the correction factor of 3, tested different values of α and β, and found the bias of GOM dry deposition simulation to be up to a factor of 2.5. As discussed above, the overall uncertainty of the GOM concentration measured by Tekran is within a factor of 3. If the GOM dry deposition simulation is directly based on the Tekran GOM data, its uncertainty level would be much higher than a factor of 3. However, recent studies (Huang et al., 2014, 2017; Huang and Gustin, 2015a) have used a correction factor of 3 for GOM concentration data which offsets the uncertainty of GOM dry deposition. Therefore, the overall uncertainty in GOM dry deposition simulation is estimated to be a factor of 2.5–4 or ± (150–300) %.
4.2.3 Resistance model for PBM dry deposition
For PBM dry deposition, resistance models regarding both fine and coarse particles are more and more widely applied based on the theory that vd for atmospheric particles strongly depends on particle size (Dastoor and Larocque, 2004; Zhang et al., 2009; Zhang and He, 2014). Many independent studies (Fang et al., 2012b; Zhu et al., 2014) showed that Hg in coarse particles constitutes a large mass fraction of the total PBM, which was previously neglected. PBM measured by Tekran 2537/1130/1135 only considers fine particles. Taking coarse particles into consideration, the total PBM dry deposition is calculated as follows (Zhang et al., 2016b):
where Fdry,PBM is the total PBM dry deposition flux; Cf is the mass concentration of PBM in fine particles; vf and vc are the dry deposition velocities of PBM for fine and coarse particles, respectively; and f is the mass fraction of PBM in coarse particles. vf and vc can be calculated using the following equation (Zhang et al., 2001):
where vx is vf or vc; vg is the gravitational settling velocity; Ra is the aerodynamic resistance; and Rs is the surface resistance which can be parameterized as a function of collection efficiencies from Brownian diffusion, impaction, and interception mechanisms (L. Zhang et al., 2012; Zhang et al., 2016b). Zhang and He (2014) have developed an easier bulk algorithm based on the vx scheme of Zhang et al. (2001) to make this model more widely applicable in monitoring networks.
Zhang et al. (2001) conducted a model comparison with two PBM dry deposition schemes, and the results showed that the differences between models are generally within the range of 20 %. However, recent studies found the proportion of coarse particles plays a crucial role in the evaluation of PBM dry deposition velocity (Zhang et al., 2016b). Zhang et al. (2016b) assumed that 30 % of the total PBM is on coarse particles and found that 44 % PBM deposition was caused by coarse particle deposition. We tested the model used by Zhang et al. (2016b) and found a 2-fold change when we increased the coarse PBM proportion from 30 % to 50%. In other words, the uncertainty of the PBM deposition velocity could be about ± (60–100) %. As discussed above, the overall uncertainty of the PBM concentration measured by Tekran is about ± 100 %. Considering both aspects and applying the calculation method based on Eq. (2), the overall PBM uncertainty in GOM dry deposition simulation is estimated to be ± (120–150) %.
4.2.4 Bidirectional model for GEM dry deposition
GEM dry deposition can also be calculated using the resistance model with different parameters. However, the re-emission and natural emission of GEM must be taken into consideration. Net GEM dry deposition is estimated from the difference between the estimated unidirectional deposition flux and the modeled total re-emission plus natural emission in the resistance model (L. Zhang et al., 2012).
A bidirectional air–surface exchange model modified from the resistance model is more and more recommended in recent years (Zhang et al., 2009, 2016b; Bash, 2010; Wang et al., 2014; Zhu et al., 2016). In the bidirectional scheme, the GEM dry deposition flux can be calculated as follows (Zhang et al., 2009):
where Fdry,GEM is the net GEM dry deposition flux; χa is the GEM concentration at a reference height; Ra, Rb, Rst, Rm, Rac, Rg, and Rcut are aerodynamic, quasi-laminar, stomatal, mesophyll, in-canopy aerodynamic, ground surface, and cuticle resistances, respectively (Zhang et al., 2016b); and χst and χg are canopy, stomatal, and ground surface compensation points, respectively. Based on observations of different land use categories, Wright and Zhang (2015) have proposed a range of χst and χg.
The studies of L. Zhang et al. (2012) and Zhang et al. (2016b) have shown the great importance of the previously neglected GEM dry deposition. Due to the presence of natural emission and re-emission of GEM, the net GEM dry deposition has a higher uncertainty level than GOM and PBM dry deposition. Although both the studies of L. Zhang et al. (2012) and Zhang et al. (2016b) reported the uncertainty of net GEM dry deposition to be on average about a factor of 2, there were many exceptions (over a factor of 2–5) according to L. Zhang et al. (2012), especially when the net GEM dry deposition fluxes were at a low level. Based on the above concern and the sensitivity analysis conducted in the study of Zhang et al. (2016b), the overall uncertainty of the net GEM dry deposition simulation is within a factor of 2 or ±100 % when GEM dominates the total Hg dry deposition, while it could be as high as a factor of 5 or ±400 % when GOM+PBM dominate the total dry deposition.
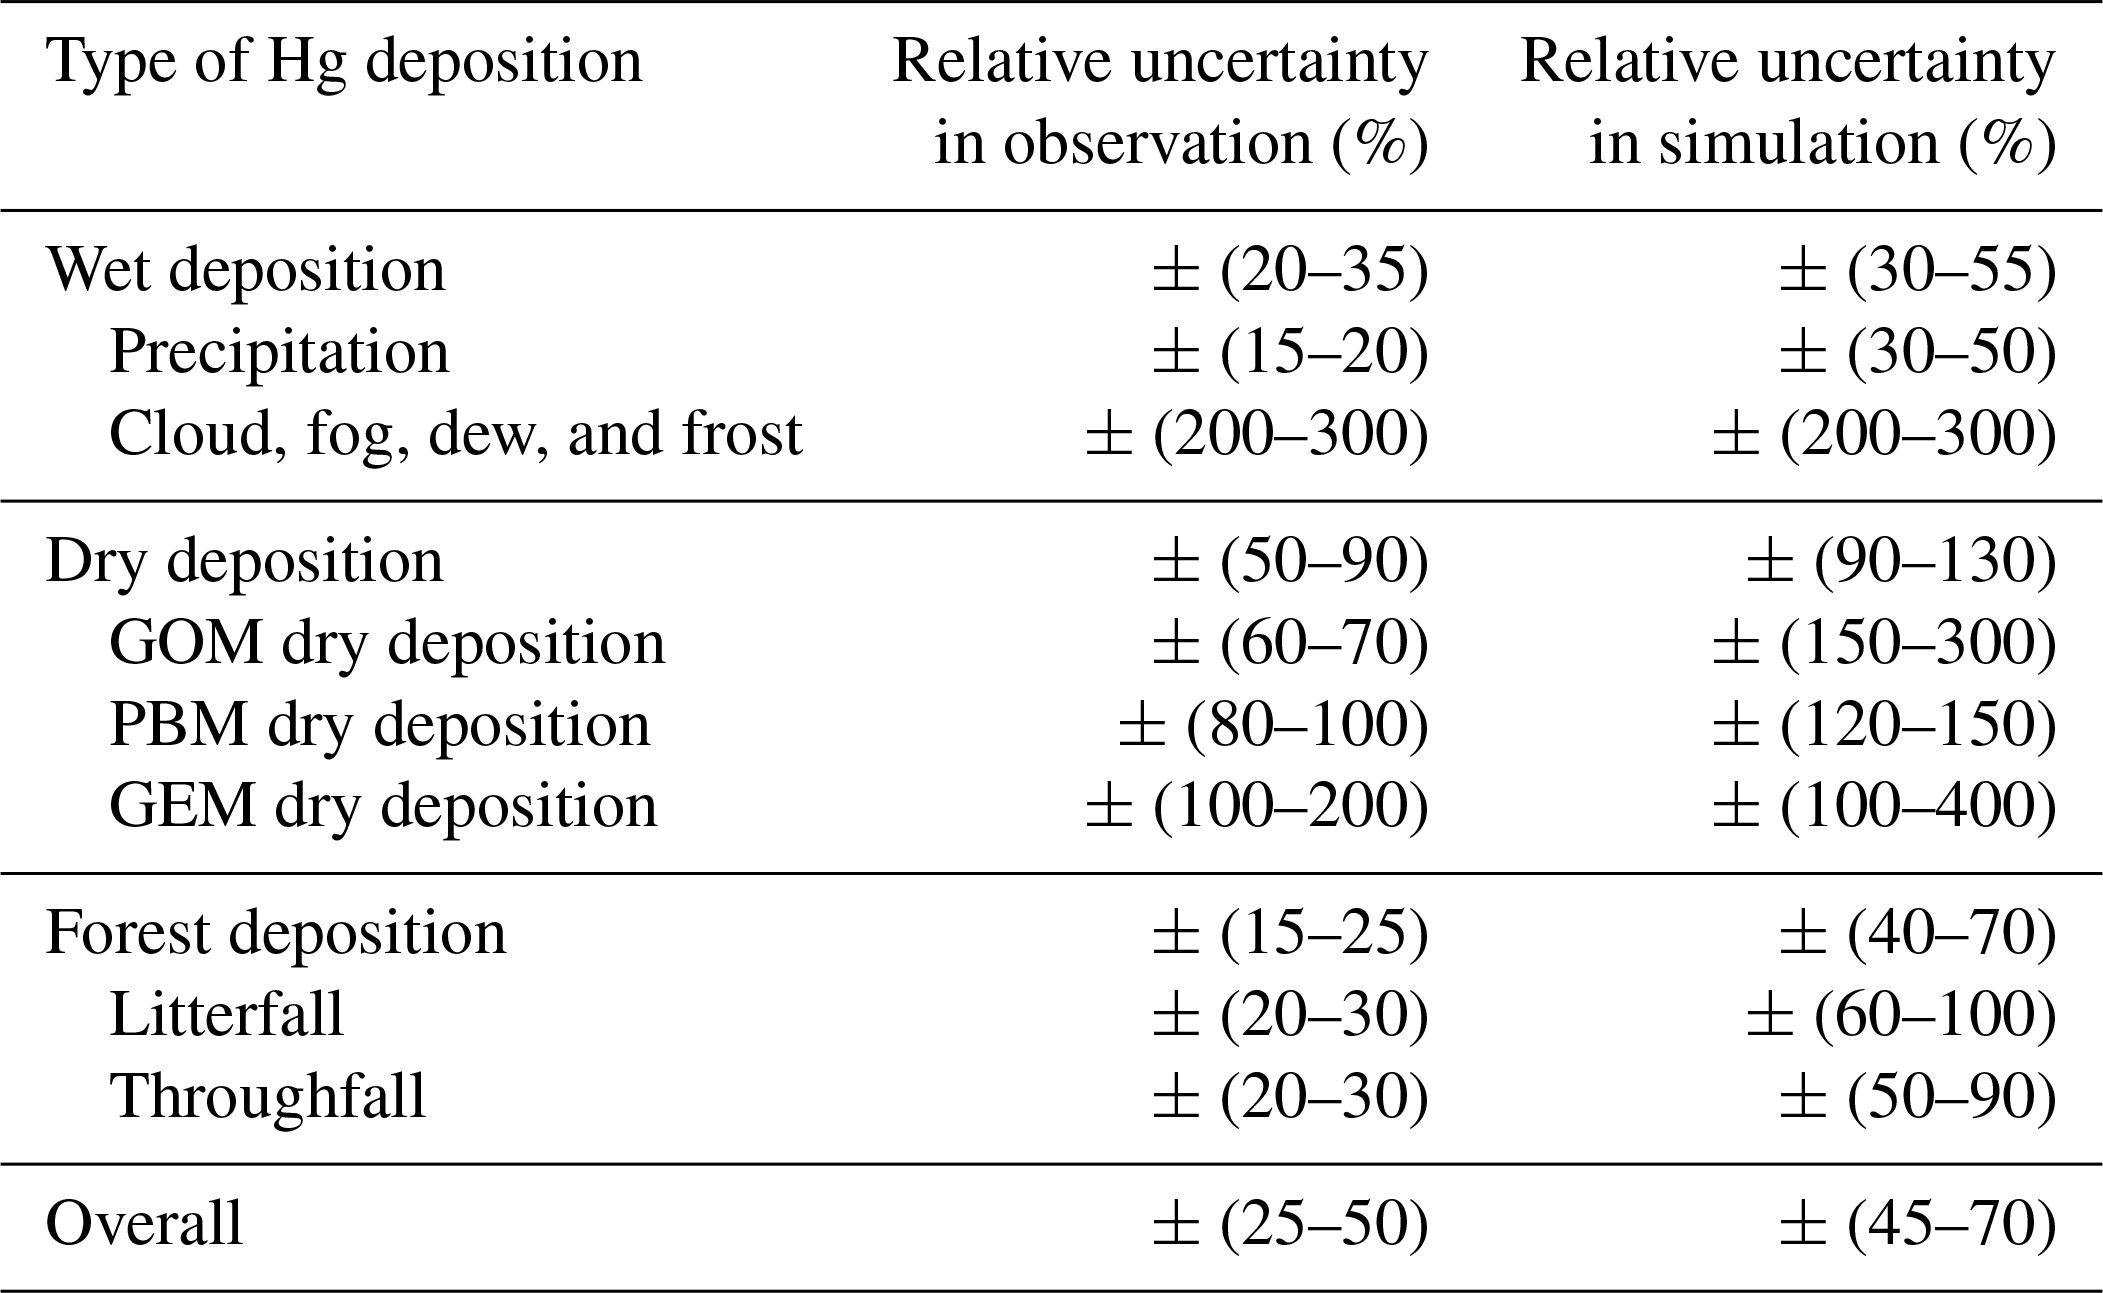
Table 1Summary of relative uncertainties of different types of Hg deposition to terrestrial surfaces.
4.3 Uncertainties in models for forest Hg deposition
The study of Wang et al. (2016a) is to date the only modeling study for litterfall Hg deposition. Monte Carlo simulation was adopted to assess the global Hg deposition through litterfall based on the measured litterfall Hg concentrations and the global litterfall biomass distribution. The estimated global annual Hg deposition through litterfall was reported to be 1180 t with a relative uncertainty of ±60 %. At the site-level comparison, the difference is within a factor of 2. Therefore, the overall uncertainty of litterfall Hg deposition is estimated to be ± (60–100) %. There is no modeling study on throughfall Hg deposition so far. Consequently, we can only use the overall uncertainty of wet and dry deposition simulation to represent throughfall, which will be discussed in the next section.
Based on the review work above, the overall uncertainties of wet, dry, and forest Hg deposition can be calculated using the following equation:
where δA, δB, and δA+B are the relative uncertainties of Part A, Part B, and the total deposition flux, respectively; UA, UB, and UA+B are the absolute uncertainties of them, respectively; FA+B is the total deposition flux; and PA and PB are the proportions of Part A and Part B deposition fluxes, respectively.
Table 1 summarizes the previously estimated relative uncertainties for wet, dry, and forest Hg deposition fluxes. Although the uncertainty of precipitation Hg deposition flux is low, the uncertainty of non-precipitation Hg deposition has been neglected. Due to the condensation effect, non-precipitation deposition could contribute an equivalent or even larger proportion to Hg wet deposition than rainfall (Stankwitz et al., 2012; Blackwell and Driscoll, 2015b; Weiss-Penzias et al., 2016b; Gerson et al., 2017). Considering the global area of hotspot regions for cloud, fog, dew, and frost, such as alpine and coastal regions, the overall contribution of non-precipitation deposition to Hg wet deposition is approximately 5 %–10 %. Given the high uncertainty level of non-precipitation Hg deposition, the overall uncertainties in the observation and simulation of global Hg wet deposition are estimated to be ± (20–35) % and ± (30–55) %, respectively.
Hg dry deposition has a much larger uncertainty level than wet deposition from both observation and simulation perspectives. High GOM deposition fluxes were exhibited in North America, while high PBM deposition fluxes were found in East Asia (Wright et al., 2016). Based on the global observation and simulation data (Wright et al., 2016; Zhang et al., 2016b), the ratio of global GOM dry deposition over PBM dry deposition could be in the range of 1:1 to 3:1, and the ratio of global GEM dry deposition over RM (GOM+PBM) dry deposition could be in the range of 1:9 to 9:1. Therefore, the overall uncertainties in the observation and simulation of global Hg dry deposition are estimated to be ± (50–90) % and ± (90–130) %, respectively.
Without studies specifically on throughfall deposition modeling, the uncertainty of throughfall Hg deposition simulation has been estimated based on the uncertainties of both wet and dry deposition simulation and turned out to be about ± (50–90) %. Studies on both litterfall and throughfall Hg deposition (Larssen et al., 2008; Navrátil et al., 2014; Luo et al., 2016; Ma et al., 2015; Fu et al., 2016a; Wang et al., 2016a; Gerson et al., 2017) showed that the relative contributions of litterfall and throughfall could be in the range of 2:3 to 4:1. Accordingly, the overall uncertainties in the observation and simulation of global forest Hg deposition are estimated to be ± (15–25) % and ± (40–70) %, respectively.
Based on global and regional modeling studies (Selin and Jacob, 2008; Wang et al., 2016a; UN Environment, 2019), the relative contributions of wet, dry, and litterfall Hg deposition are estimated to be approximately . With the previously estimated uncertainty ranges for wet, dry, and litterfall deposition, the overall uncertainties in the observation and simulation of global total Hg deposition are calculated to be ± (25–50) % and ± (45–70) %, respectively. It should be noted that the low overall uncertainty for observation can only be achieved when Hg deposition networks are established worldwide.
With a big effort of literature review, this study has estimated the uncertainties in the observation and simulation of global Hg deposition to the land surfaces through different pathways. The implications from the comprehensive uncertainty analysis and the derivative research needs in the future are as follows.
-
The observation methods for both wet and forest Hg deposition fluxes have low uncertainty levels. Although large uncertainties still exist in the methods for Hg dry deposition measurements, the overall uncertainty in global Hg deposition observation can be as low as ± (25–50) %. Optimized surrogate surfaces and DFCs are economic approaches for RM and GEM measurements, respectively, and could be useful methods for the global dry deposition network.
-
Methods with high time resolution for the accurate measurements of GOM and PBM concentrations are urgently needed. On account of the GOM dry deposition velocity, the chemical form of GOM also plays a crucial role. Different model parameterizations should be applied for different GOM species. Therefore, quantification methods for measuring different GOM species need to be developed to improve the simulation of GOM dry deposition flux.
-
More comparisons between observation and simulation of the GEM dry deposition flux should be conducted to improve model parameterization. Moreover, the GEM deposition process is complicated in forests. It is useful to measure the above-canopy apparent deposition flux, the under-canopy dry deposition flux, the litterfall deposition flux, and the throughfall deposition flux at the same site to get a more comprehensive understanding of the process.
-
Non-precipitation Hg wet deposition has been neglected in the global monitoring networks and modeling studies. Cloud, fog, or even dew and frost Hg deposition could be quite important in hotspot regions, such as alpine and coastal areas. It could be enriched in aqueous Hg and affect other deposition processes, or in other words, change the overall Hg residence time. Extremely large uncertainties still exist in both observation and simulation of non-precipitation Hg wet deposition. More standardized sampling methods are required for long-term observation of non-precipitation Hg wet deposition.
-
Asia has the highest atmospheric Hg concentration level. However, the Hg deposition studies in Asia are still quite limited. The Hg wet deposition network in Asia is not as mature as in North America and Europe, and there are only a few scattered studies on dry deposition in East Asia. The Hg wet and dry deposition processes in Asia could be quite different from those in North America and Europe because of the high atmospheric Hg and high PM conditions in Asia.
Data presented in this study were all generated from the published literature and are available from the original researchers. Data in this research are available in the Supplement.
The supplement related to this article is available online at: https://doi.org/10.5194/acp-19-15587-2019-supplement.
LZ designed the review framework. LZ and PZ did the most literature review work with contributions from SC and YZ. LZ prepared the manuscript with contributions from all the co-authors.
The authors declare that they have no conflict of interest.
This review work was supported by the National Natural Science Foundation of China (no. 21876077) and the Fundamental Research Funds for the Central Universities in China (no. 14380080, no. 14380092, and no. 14380124).
This research has been supported by the National Natural Science Foundation of China (grant no. 21876077) and the Fundamental Research Funds for the Central Universities in China (grant nos. 14380080, 14380080, and 14380124).
This paper was edited by Leiming Zhang and reviewed by four anonymous referees.
Aas, W. (Ed.): Data quality 2004, quality assurance, and field comparisons, C587 EMEP/CCC-Report 4/2006, NILU, Kjeller, Norway, 2006.
Agnan, Y., Le Dantec, T., Moore, C. W., Edwards, G. C., and Obrist, D.: New constraints on terrestrial surface atmosphere fluxes of gaseous elemental mercury using a global database, Environ. Sci. Technol., 50, 507–524, https://doi.org/10.1021/acs.est.5b04013, 2016.
Ahn, M. C., Yi, S. M., Holsen, T. M., and Han, Y. J.: Mercury wet deposition in rural Korea: concentrations and fluxes, J. Environ. Monitor., 13, 2748–2754, https://doi.org/10.1039/c1em10014a, 2011.
Åkerblom, S., Meili, M., and Bishop, K.: Organic matter in rain: an overlooked influence on mercury deposition, Environ. Sci. Tech. Let., 2, 128–132, https://doi.org/10.1021/acs.estlett.5b00009, 2015.
Bash, J. O.: Description and initial simulation of a dynamic bidirectional air-surface exchange model for mercury in Community Multiscale Air Quality (CMAQ) model, J. Geophys. Res., 115, D06305, https://doi.org/10.1029/2009jd012834, 2010.
Baya, A. P. and Van Heyst, B.: Assessing the trends and effects of environmental parameters on the behaviour of mercury in the lower atmosphere over cropped land over four seasons, Atmos. Chem. Phys., 10, 8617–8628, https://doi.org/10.5194/acp-10-8617-2010, 2010.
Benoit, J. M., Cato, D. A., Denison, K. C., and Moreira, A. E.: Seasonal mercury dynamics in a New England vernal pool, Wetlands, 33, 887–894, https://doi.org/10.1007/s13157-013-0447-4, 2013.
Bieser, J., De Simone, F., Gencarelli, C., Geyer, B., Hedgecock, I., Matthias, V., Travnikov, O., and Weigelt, A.: A diagnostic evaluation of modeled mercury wet depositions in Europe using atmospheric speciated high-resolution observations, Environ. Sci. Pollut. R., 21, 9995–10012, https://doi.org/10.1007/s11356-014-2863-2, 2014.
Blackwell, B. D. and Driscoll, C. T.: Using foliar and forest floor mercury concentrations to assess spatial patterns of mercury deposition, Environ. Pollut., 202, 126–134, https://doi.org/10.1016/j.envpol.2015.02.036, 2015a.
Blackwell, B. D. and Driscoll, C. T.: Deposition of mercury in forests along a montane elevation gradient, Environ. Sci. Technol., 49, 5363–5370, https://doi.org/10.1021/es505928w, 2015b.
Brunke, E.-G., Walters, C., Mkololo, T., Martin, L., Labuschagne, C., Silwana, B., Slemr, F., Weigelt, A., Ebinghaus, R., and Somerset, V.: Mercury in the atmosphere and in rainwater at Cape Point, South Africa, Atmos. Environ., 125, 24–32, https://doi.org/10.1016/j.atmosenv.2015.10.059, 2016.
Buch, A. C., Correia, M. E., Teixeira, D. C., and Silva-Filho, E. V.: Characterization of soil fauna under the influence of mercury atmospheric deposition in Atlantic Forest, Rio de Janeiro, Brazil, J. Environ. Sci., 32, 217–227, https://doi.org/10.1016/j.jes.2015.01.009, 2015.
Bullock, O. R., Atkinson, D., Braverman, T., Civerolo, K., Dastoor, A., Davignon, D., Ku, J. Y., Lohman, K., Myers, T. C., Park, R. J., Seigneur, C., Selin, N. E., Sistla, G., and Vijayaraghavan, K.: The North American Mercury Model Intercomparison Study (NAMMIS): Study description and modelto-model comparisons, J. Geophys. Res.-Atmos., 113, D17310, https://doi.org/10.1029/2008jd009803, 2008.
Bullock, O. R., Atkinson, D., Braverman, T., Civerolo, K., Dastoor, A., Davignon, D., Ku, J.-Y., Lohman, K., Myers, T. C., Park, R. J., Seigneur, C., Selin, N. E, Sistla, G., and Vijayaraghavan, K.: An analysis of simulated wet deposition of mercury from the North American Mercury Model Intercomparison Study, J. Geophys. Res.-Atmos., 114, D08301, https://doi.org/10.1029/2008jd011224, 2009.
Bushey, J. T., Nallana, A. G., Montesdeoca, M. R., and Driscoll, C. T.: Mercury dynamics of a northern hardwood canopy, Atmos. Environ., 42, 6905–6914, https://doi.org/10.1016/j.atmosenv.2008.05.043, 2008.
Castelle, S., Schäfer, J., Blanc, G., Dabrin, A., Lanceleur, L., and Masson, M.: Gaseous mercury at the air–water interface of a highly turbid estuary (Gironde Estuary, France), Mar. Chem., 117, 42–51, https://doi.org/10.1016/j.marchem.2009.01.005, 2009.
Castro, M. S., Moore, C., Sherwell, J., and Brooks, S. B.: Dry deposition of gaseous oxidized mercury in Western Maryland, Sci. Total Environ., 417–418, 232–240, https://doi.org/10.1016/j.scitotenv.2011.12.044, 2012.
Chen, L., Li, Y., Liu, C., Guo, L., and Wang, X.: Wet deposition of mercury in Qingdao, a coastal urban city in China: Concentrations, fluxes, and influencing factors, Atmos. Environ., 174, 204–213, https://doi.org/10.1016/j.atmosenv.2017.11.059, 2018.
Cheng, I. and Zhang, L.: Uncertainty assessment of gaseous oxidized mercury measurements collected by Atmospheric Mercury Network, Environ. Sci. Technol., 51, 855–862, 2017.
Cheng, I., Zhang, L., and Mao, H.: Relative contributions of gaseous oxidized mercury and fine and coarse particle-bound mercury to mercury wet deposition at nine monitoring sites in North America, J. Geophys. Res.-Atmos., 120, 8549–8562, https://doi.org/10.1002/2015jd023769, 2015.
Cheng, Z. L., Luo, Y., Zhang, T., and Duan, L.: Deposition of Sulfur, Nitrogen and Mercury in Two Typical Forest Ecosystems in Southern China, Environ. Sci., 38, 5004–5011, https://doi.org/10.13227/j.hjkx.201705103, 2017 (in Chinese).
Choi, H.-D., Sharac, T. J., and Holsen, T. M.: Mercury deposition in the Adirondacks: A comparison between precipitation and throughfall, Atmos. Environ., 42, 1818–1827, https://doi.org/10.1016/j.atmosenv.2007.11.036, 2008.
Ci, Z., Peng, F., Xue, X., and Zhang, X.: Air–surface exchange of gaseous mercury over permafrost soil: an investigation at a high-altitude (4700 m a.s.l.) and remote site in the central Qinghai–Tibet Plateau, Atmos. Chem. Phys., 16, 14741–14754, https://doi.org/10.5194/acp-16-14741-2016, 2016.
Ci, Z. J., Zhang, X. S., and Wang, Z. W.: Enhancing atmospheric mercury research in China to improve the current understanding of the global mercury cycle: The need for urgent and closely coordinated efforts, Environ. Sci. Technol., 46, 5636–5642, 2012.
Connan, O., Maro, D., Hébert, D., Roupsard, P., Goujon, R., Letellier, B., and Le Cavelier, S.: Wet and dry deposition of particles associated metals (Cd, Pb, Zn, Ni, Hg) in a rural wetland site, Marais Vernier, France, Atmos. Environ., 67, 394–403, https://doi.org/10.1016/j.atmosenv.2012.11.029, 2013.
Converse, A. D., Riscassi, A. L., and Scanlon, T. M.: Seasonal variability in gaseous mercury fluxes measured in a high-elevation meadow, Atmos. Environ., 44, 2176–2185, https://doi.org/10.1016/j.atmosenv.2010.03.024, 2010.
Converse, A. D., Riscassi, A. L., and Scanlon, T. M.: Seasonal contribution of dewfall to mercury deposition determined using a micrometeorological technique and dew chemistry, J. Geophys. Res.-Atmos., 119, 284–292, https://doi.org/10.1002/2013JD020491, 2014.
Dastoor, A. P. and Larocque, Y.: Global circulation of atmospheric mercury: a modelling study, Atmos. Environ., 38, 147–161, https://doi.org/10.1016/j.atmosenv.2003.08.037, 2004.
Dutt, U., Nelson, P. F., Morrison, A. L., and Strezov, V.: Mercury wet deposition and coal-fired power station contributions: An Australian study, Fuel Process. Technol., 90, 1354–1359, https://doi.org/10.1016/j.fuproc.2009.06.019, 2009.
Enrico, M., Roux, G. L., Marusczak, N., Heimburger, L. E., Claustres, A., Fu, X., Sun, R., and Sonke, J. E.: Atmospheric mercury transfer to peat bogs dominated by gaseous elemental mercury dry deposition, Environ. Sci. Technol., 50, 2405–2412, https://doi.org/10.1021/acs.est.5b06058, 2016.
Fang, G.-C., Tsai, J.-H., Lin, Y.-H., and Chang, C.-Y.: Dry deposition of atmospheric particle-bound mercury in the Middle Taiwan, Aerosol Air Qual. Res., 12, 1298–1308, https://doi.org/10.4209/aaqr.2012.04.0093, 2012a.
Fang, G. C., Zhang, L., and Huang, C. S.: Measurements of size-fractionated concentration and bulk dry deposition of atmospheric particulate bound mercury, Atmos. Environ., 61, 371–377, https://doi.org/10.1016/j.atmosenv.2012.07.052, 2012b.
Fang, G.-C., Lin, Y.-H., and Chang, C.-Y.: Use of mercury dry deposition samplers to quantify dry deposition of particulate-bound mercury and reactive gaseous mercury at a traffic sampling site, Environ. Forensics, 14, 182–186, https://doi.org/10.1080/15275922.2013.814177, 2013.
Fernandez, D., Torregrosa, A., Weiss-Penzias, P., Zhang, B. J., Sorensen, D., Cohen, R. E., McKinley, G. H., Kleingartner, L., Oliphant, A., and Bowman, M.: Fog Water Collection Effectiveness: Mesh Intercomparisons, Aerosol Air Qual. Res., 18, 270–283, https://doi.org/10.4209/aaqr.2017.01.0040, 2018.
Fisher, L. S. and Wolfe, M. H.: Examination of mercury inputs by throughfall and litterfall in the Great Smoky Mountains National Park, Atmos. Environ., 47, 554–559, https://doi.org/10.1016/j.atmosenv.2011.10.017, 2012.
Fostier, A. H., Melendez-Perez, J. J., and Richter, L.: Litter mercury deposition in the Amazonian rainforest, Environ. Pollut., 206, 605–610, https://doi.org/10.1016/j.envpol.2015.08.010, 2015.
Fragoso, C. P., Bernini, E., Araújo, B. F., Almeida, M. G. D., and Rezende, C. E. D.: Mercury in litterfall and sediment using elemental and isotopic composition of carbon and nitrogen in the mangrove of Southeastern Brazil, Estuar. Coast. Shelf S., 202, 30–39, https://doi.org/10.1016/j.ecss.2017.12.005, 2018.
Fritsche, J., Obrist, D., Zeeman, M., Conen, F., Eugster, W., and Alewell, C.: Elemental mercury fluxes over a sub-alpine grassland determined with two micrometeorological methods, Atmos. Environ., 42, 2922–2933, https://doi.org/10.1016/j.atmosenv.2007.12.055, 2008.
Fu, X., Feng, X., Zhu, W., Zheng, W., Wang, S., and Lu, J. Y.: Total particulate and reactive gaseous mercury in ambient air on the eastern slope of the Mt. Gongga area, China, Appl. Geochem., 23, 408–418, https://doi.org/10.1016/j.apgeochem.2007.12.018, 2008.
Fu, X., Feng, X., Zhu, W., Rothenberg, S., Yao, H., and Zhang, H.: Elevated atmospheric deposition and dynamics of mercury in a remote upland forest of southwestern China, Environ. Pollut., 158, 2324–2333, https://doi.org/10.1016/j.envpol.2010.01.032, 2010a.
Fu, X. W., Feng, X., Dong, Z. Q., Yin, R. S., Wang, J. X., Yang, Z. R., and Zhang, H.: Atmospheric gaseous elemental mercury (GEM) concentrations and mercury depositions at a high-altitude mountain peak in south China, Atmos. Chem. Phys., 10, 2425–2437, https://doi.org/10.5194/acp-10-2425-2010, 2010b.
Fu, X., Feng, X., Sommar, J., and Wang, S.: A review of studies on atmospheric mercury in China, Sci. Total Environ., 421–422, 73–81, https://doi.org/10.1016/j.scitotenv.2011.09.089, 2012.
Fu, X., Yang, X., Lang, X., Zhou, J., Zhang, H., Yu, B., Yan, H., Lin, C.-J., and Feng, X.: Atmospheric wet and litterfall mercury deposition at urban and rural sites in China, Atmos. Chem. Phys., 16, 11547–11562, https://doi.org/10.5194/acp-16-11547-2016, 2016a.
Fu, X., Marusczak, N., Heimbürger, L.-E., Sauvage, B., Gheusi, F., Prestbo, E. M., and Sonke, J. E.: Atmospheric mercury speciation dynamics at the high-altitude Pic du Midi Observatory, southern France, Atmos. Chem. Phys., 16, 5623–5639, https://doi.org/10.5194/acp-16-5623-2016, 2016b.
Gerson, J. R., Driscoll, C. T., Demers, J. D., Sauer, A. K., Blackwell, B. D., Montesdeoca, M. R., Shanley, J. B., and Ross, D. S.: Deposition of mercury in forests across a montane elevation gradient: Elevational and seasonal patterns in methylmercury inputs and production, J. Geophys. Res.-Biogeo., 122, 1922–1939, https://doi.org/10.1002/2016jg003721, 2017.
Gichuki, S. W. and Mason, R. P.: Mercury and metals in South African precipitation, Atmos. Environ., 79, 286–298, https://doi.org/10.1016/j.atmosenv.2013.04.009, 2013.
Gichuki, S. W. and Mason, R. P.: Wet and dry deposition of mercury in Bermuda, Atmos. Environ., 87, 249–257, https://doi.org/10.1016/j.atmosenv.2014.01.025, 2014.
Gong, P., Wang, X. P., Xue, Y. G., Xu, B. Q., and Yao, T. D.: Mercury distribution in the foliage and soil profiles of the Tibetan forest: processes and implications for regional cycling, Environ. Pollut., 188, 94–101, https://doi.org/10.1016/j.envpol.2014.01.020, 2014.
Gratz, L. E. and Keeler, G. J.: Sources of mercury in precipitation to Underhill, VT, Atmos. Environ., 45, 5440–5449, https://doi.org/10.1016/j.atmosenv.2011.07.001, 2011.
Guo, J., Kang, S., Huang, J., Zhang, Q., Rupakheti, M., Sun, S., Tripathee, L., Rupakheti, D., Panday, A. K., Sillanpaa, M., and Paudyal, R.: Characterizations of atmospheric particulate-bound mercury in the Kathmandu Valley of Nepal, South Asia, Sci. Total Environ., 579, 1240–1248, https://doi.org/10.1016/j.scitotenv.2016.11.110, 2017.
Guo, Y., Feng, X., Li, Z., He, T., Yan, H., Meng, B., Zhang, J., and Qiu, G.: Distribution and wet deposition fluxes of total and methyl mercury in Wujiang River Basin, Guizhou, China, Atmos. Environ., 42, 7096–7103, https://doi.org/10.1016/j.atmosenv.2008.06.006, 2008.
Gustin, M. S., Lindberg, S. E., and Weisberg, P. J.: An update on the natural sources and sinks of atmospheric mercury, Appl. Geochem., 23, 482–493, https://doi.org/10.1016/j.apgeochem.2007.12.010, 2008.
Gustin, M. S., Huang, J., Miller, M. B., Peterson, C., Jaffe, D. A., Ambrose, J., Finley, B. D., Lyman, S. N., Call, K., Talbot, R., Feddersen, D., Mao, H., and Lindberg, S. E.: Do we understand what the mercury speciation instruments are actually measuring? Results of RAMIX, Environ. Sci. Technol., 47, 7295–7306, https://doi.org/10.1021/es3039104, 2013.
Gustin, M. S., Amos, H. M., Huang, J., Miller, M. B., and Heidecorn, K.: Measuring and modeling mercury in the atmosphere: a critical review, Atmos. Chem. Phys., 15, 5697–5713, https://doi.org/10.5194/acp-15-5697-2015, 2015.
Hall, N. L., Dvonch, J. T., Marsik, F. J., Barres, J. A., and Landis, M. S.: An artificial turf-based surrogate surface collector for the direct measurement of atmospheric mercury dry deposition, Int. J. Environ. Res. Public Health, 14, 173, https://doi.org/10.3390/ijerph14020173, 2017.
Han, J.-S., Seo, Y.-S., Kim, M.-K., Holsen, T. M., and Yi, S.-M.: Total atmospheric mercury deposition in forested areas in South Korea, Atmos. Chem. Phys., 16, 7653–7662, https://doi.org/10.5194/acp-16-7653-2016, 2016.
Hansen, A. M. and Gay, D. A.: Observations of mercury wet deposition in Mexico, Environ. Sci. Pollut. R. Int., 20, 8316–8325, https://doi.org/10.1007/s11356-013-2012-3, 2013.
Holloway, T., Voigt, C., Morton, J., Spak, S. N., Rutter, A. P., and Schauer, J. J.: An assessment of atmospheric mercury in the Community Multiscale Air Quality (CMAQ) model at an urban site and a rural site in the Great Lakes Region of North America, Atmos. Chem. Phys., 12, 7117–7133, https://doi.org/10.5194/acp-12-7117-2012, 2012.
Holmes, H. A., Pardyjak, E. R., Perry, K. D., and Abbott, M. L.: Gaseous dry deposition of atmospheric mercury: A comparison of two surface resistance models for deposition to semiarid vegetation, J. Geophys. Res., 116, S14306, https://doi.org/10.1029/2010jd015182, 2011.
Horowitz, H. M., Jacob, D. J., Zhang, Y., Dibble, T. S., Slemr, F., Amos, H. M., Schmidt, J. A., Corbitt, E. S., Marais, E. A., and Sunderland, E. M.: A new mechanism for atmospheric mercury redox chemistry: implications for the global mercury budget, Atmos. Chem. Phys., 17, 6353–6371, https://doi.org/10.5194/acp-17-6353-2017, 2017.
Huang, J. and Gustin, M. S.: Use of passive sampling methods and models to understand sources of mercury deposition to high elevation sites in the Western United States, Environ. Sci. Technol., 49, 432–441, https://doi.org/10.1021/es502836w, 2015a.
Huang, J. and Gustin, M. S.: Uncertainties of gaseous oxidized mercury measurements using KCl-coated denuders, cation-exchange membranes, and nylon membranes: Humidity influences, Environ. Technol., 49, 6102–6108, https://doi.org/10.1021/acs.est.5b00098, 2015b.
Huang, J., Choi, H. D., Landis, M. S., and Holsen, T. M.: An application of passive samplers to understand atmospheric mercury concentration and dry deposition spatial distributions, J. Environ. Monit., 14, 2976–2982, https://doi.org/10.1039/c2em30514c, 2012a.
Huang, J., Kang, S. C., Zhang, Q. G., Yan, H. Y., Guo, J. M., Jenkins, M. G., Zhang, G. S., and Wang, K.: Wet deposition of mercury at a remote site in the Tibetan Plateau: Concentrations, speciation, and fluxes, Atmos. Environ., 62, 540–550, https://doi.org/10.1016/j.atmosenv.2012.09.003, 2012b.
Huang, J., Kang, S., Wang, S., Wang, L., Zhang, Q., Guo, J., Wang, K., Zhang, G., and Tripathee, L.: Wet deposition of mercury at Lhasa, the capital city of Tibet, Sci. Total Environ., 447, 123–132, https://doi.org/10.1016/j.scitotenv.2013.01.003, 2013a.
Huang, J. Y., Miller, M. B., Weiss-Penzias, P., and Gustin, M. S.: Comparison of Gaseous Oxidized Hg Measured by KCl-Coated Denuders, and Nylon and Cation Exchange Membranes, Environ. Sci. Technol., 47, 7307–7316, 2013b.
Huang, J., Lyman, S. N., Hartman, J. S., and Gustin, M. S.: A review of passive sampling systems for ambient air mercury measurements, Environ. Sci.-Proc. Imp., 16, 374–392, https://doi.org/10.1039/c3em00501a, 2014.
Huang, J., Kang, S., Zhang, Q., Guo, J., Sillanpaa, M., Wang, Y., Sun, S., Sun, X., and Tripathee, L.: Characterizations of wet mercury deposition on a remote high-elevation site in the southeastern Tibetan Plateau, Environ. Pollut., 206, 518–526, https://doi.org/10.1016/j.envpol.2015.07.024, 2015.
Huang, J., Kang, S., Guo, J., Zhang, Q., Cong, Z., Sillanpää, M., Zhang, G., Sun, S., and Tripathee, L.: Atmospheric particulate mercury in Lhasa city, Tibetan Plateau, Atmos. Environ., 142, 433–441, https://doi.org/10.1016/j.atmosenv.2016.08.021, 2016.
Huang, J., Miller, M. B., Edgerton, E., and Sexauer Gustin, M.: Deciphering potential chemical compounds of gaseous oxidized mercury in Florida, USA, Atmos. Chem. Phys., 17, 1689–1698, https://doi.org/10.5194/acp-17-1689-2017, 2017.
Jaffe, D. A., Lyman, S., Amos, H. M., Gustin, M. S., Huang, J., Selin, N. E., Levin, L., ter Schure, A., Mason, R. P., Talbot, R., Rutter, A., Finley, B., Jaeglé, L., Shah, V., McClure, C., Ambrose, J., Gratz, L., Lindberg, S., Weiss-Penzias, P., Sheu, G.-R., Feddersen, D., Horvat, M., Dastoor, A., Hynes, A. J., Mao, H., Sonke, J. E., Slemr, F., Fisher, J. A., Ebinghaus, R., Zhang, Y., and Edwards, G.: Progress on Understanding Atmospheric Mercury Hampered by Uncertain Measurements, Environ. Sci. Technol., 48, 7204–7206, https://doi.org/10.1021/es5026432, 2014.
Juillerat, J. I., Ross, D. S., and Bank, M. S.: Mercury in litterfall and upper soil horizons in forested ecosystems in Vermont, USA, Environ. Toxicol. Chem., 31, 1720–1729, https://doi.org/10.1002/etc.1896, 2012.
Katata, G.: Fogwater deposition modeling for terrestrial ecosystems: A review of developments and measurements, J. Geophys. Res.-Atmos., 119, 8137–8159, https://doi.org/10.1002/2014jd021669, 2014.
Kim, M.-G., Lee, B.-K., and Kim, H.-J.: Cloud/fog water chemistry at a high elevation site in South Korea, J. Atmos. Chem., 55, 13–29, https://doi.org/10.1007/s10874-005-9004-8, 2006.
Lai, S. O., Huang, J., Hopke, P. K., and Holsen, T. M.: An evaluation of direct measurement techniques for mercury dry deposition, Sci. Total Environ., 409, 1320–1327, https://doi.org/10.1016/j.scitotenv.2010.12.032, 2011.
Larssen, T., de Wit, H. A., Wiker, M., and Halse, K.: Mercury budget of a small forested boreal catchment in southeast Norway, Sci. Total Environ., 404, 290–296, https://doi.org/10.1016/j.scitotenv.2008.03.013, 2008.
Lawson, S. T., Scherbatskoy, T. D., Malcolm, E. G., and Keeler, G. J.: Cloud water and throughfall deposition of mercury and trace elements in a high elevation spruce–fir forest at Mt. Mansfield, Vermont, J. Environ. Monitor., 5, 578–583, https://doi.org/10.1039/b210125d, 2003.
Lin, C.-J., Pongprueksa, P., Lindberg, S. E., Pehkonen, S. O., Byun, D., and Jang, C.: Scientific uncertainties in atmospheric mercury models I: Model science evaluation, Atmos. Environ., 40, 2911–2928, 2006.
Lin, C.-J., Pongprueksa, P., Lindberg, S. E., Pehkonen, S. O., Jang, C., Braverman, T., and Ho, T. C.: Scientific uncertainties in atmospheric mercury models II: Sensitivity analysis in the CONUS domain, Atmos. Environ., 41, 6544–6560, 2007.
Lin, C.-J., Pan, L., Streets, D. G., Shetty, S. K., Jang, C., Feng, X., Chu, H.-W., and Ho, T. C.: Estimating mercury emission outflow from East Asia using CMAQ-Hg, Atmos. Chem. Phys., 10, 1853–1864, https://doi.org/10.5194/acp-10-1853-2010, 2010.
Lindberg, S. and Meyers, T.: Development of an automated micrometeorological method for measuring the emission of mercury vapor from wetland vegetation, Wetl. Ecol. Manag., 9, 333–347, 2001.
Lindberg, S. E., Bullock, R., Ebinghaus, R., Engstrom, D., Feng, X. B., Fitzgerald, W., Pirrone, N., Prestbo, E., and Seigneur, C.: A synthesis of progress and uncertainties in attributing the sources of mercury in deposition, Ambio, 36, 19–32, 2007.
Lombard, M. A. S., Bryce, J. G., Mao, H., and Talbot, R.: Mercury deposition in Southern New Hampshire, 2006–2009, Atmos. Chem. Phys., 11, 7657–7668, https://doi.org/10.5194/acp-11-7657-2011, 2011.
Lu, A. and Liu, H.: Study on the time distribution characteristics and source of wet deposition mercury in weinan city, Journal of Arid Land Resources and Environment, 32, 62–67, https://doi.org/10.13448/j.cnki.jalre.2018.108, 2018 (in Chinese).
Luo, Y., Duan, L., Driscoll, C. T., Xu, G. Y., Shao, M. S., Taylor, M., Wang, S. X., and Hao, J. M.: Foliage/atmosphere exchange of mercury in a subtropical coniferous forest in south China, J. Geophys. Res.-Biogeo., 121, 2006–2016, https://doi.org/10.1002/2016jg003388, 2016.
Lyman, S. N., Gustin, M. S., Prestbo, E. M., and Marsik, F. J.: Estimation of dry deposition of atmospheric mercury in Nevada by direct and indirect methods, Environ. Sci. Technol., 41, 1970–1976, 2007.
Lyman, S. N., Gustin, M. S., Prestbo, E. M., Kilner, P. I., Edgerton, E., and Hartsell, B.: Testing and application of surrogate surfaces for understanding potential gaseous oxidized mercury dry deposition, Environ. Sci. Technol., 43, 6235–6241, 2009.
Lyman, S. N., Jaffe, D. A., and Gustin, M. S.: Release of mercury halides from KCl denuders in the presence of ozone, Atmos. Chem. Phys., 10, 8197–8204, https://doi.org/10.5194/acp-10-8197-2010, 2010.
Lynam, M., Dvonch, J. T., Barres, J., and Percy, K.: Atmospheric wet deposition of mercury to the Athabasca Oil Sands Region, Alberta, Canada, Air Qual. Atmos. Health, 11, 83–93, https://doi.org/10.1007/s11869-017-0524-6, 2017.
Lynam, M. M., Dvonch, J. T., Hall, N. L., Morishita, M., and Barres, J. A.: Spatial patterns in wet and dry deposition of atmospheric mercury and trace elements in central Illinois, USA, Environ. Sci. Pollut. R. Int., 21, 4032–4043, https://doi.org/10.1007/s11356-013-2011-4, 2014.
Ma, M., Wang, D., Du, H., Sun, T., Zhao, Z., and Wei, S.: Atmospheric mercury deposition and its contribution of the regional atmospheric transport to mercury pollution at a national forest nature reserve, southwest China, Environ. Sci. Pollut. R. Int., 22, 20007–20018, https://doi.org/10.1007/s11356-015-5152-9, 2015.
Ma, M., Wang, D., Du, H., Sun, T., Zhao, Z., Wang, Y., and Wei, S.: Mercury dynamics and mass balance in a subtropical forest, southwestern China, Atmos. Chem. Phys., 16, 4529–4537, https://doi.org/10.5194/acp-16-4529-2016, 2016.
Malcolm, E. G. and Keeler, G. J.: Measurements of Mercury in Dew: Atmospheric Removal of Mercury Species to a Wetted Surface, Environ. Sci. Technol., 36, 2815–2821, https://doi.org/10.1021/es011174z, 2002.
Malcolm, E. G., Keeler, G. J., Lawson, S. T., and Sherbatskoy, T. D.: Mercury and trace elements in cloud water and precipitation collected on Mt. Mansfield, Vermont, J. Environ. Monitor., 5, 584–590, https://doi.org/10.1039/b210124f, 2003.
Marsik, F. J., Keeler, G. J., and Landis, M. S.: The dry-deposition of speciated mercury to the Florida Everglades: Measurements and modeling, Atmos. Environ., 41, 136–149, https://doi.org/10.1016/j.atmosenv.2006.07.032, 2007.
Marumoto, K. and Matsuyama, A.: Mercury speciation in wet deposition samples collected from a coastal area of Minamata Bay, Atmos. Environ., 86, 220–227, https://doi.org/10.1016/j.atmosenv.2013.12.011, 2014.
McClure, C. D., Jaffe, D. A., and Edgerton, E. S.: Evaluation of the KCl denuder method for gaseous oxidized mercury using HgBr2 at an in-service AMNet site, Environ. Sci. Technol., 48, 11437–11444, https://doi.org/10.1021/es502545k, 2014.
Meier, C. E., Stanturf, J. A., and Gardiner, E. S.: Litterfall in the hardwood forest of a minor alluvial floodplain, Forest Ecol. Manag., 234, 60–57, https://doi.org/10.1016/j.foreco.2006.06.026, 2006.
Meyers, T. P., Hall, M. E., Lindberg, S. E., and Kim, K.: Use of the modified Bowen-ratio technique to measure fluxes of trace gases, Atmos. Environ., 30, 3321–3329, 1996.
Miller, M. B., Gustin, M. S., and Eckley, C. S.: Measurement and scaling of air-surface mercury exchange from substrates in the vicinity of two Nevada gold mines, Sci. Total Environ., 409, 3879–3886, https://doi.org/10.1016/j.scitotenv.2011.05.040, 2011.
Montecinos, S., Carvajal, D., and Cereceda, P., Concha, M.: Collection efficiency of fog events, Atmos. Res., 209, 163–169, https://doi.org/10.1016/j.atmosres.2018.04.004, 2018.
Navrátil, T., Shanley, J., Rohovec, J., Hojdová, M., Penížek, V., and Buchtová, J.: Distribution and pools of mercury in Czech forest soils, Water Air Soil Poll., 225, 1829, https://doi.org/10.1007/s11270-013-1829-1, 2014.
Nguyen, D. L., Kim, J. Y., Shim, S. G., Ghim, Y. S., and Zhang, X. S.: Shipboard and ground measurements of atmospheric particulate mercury and total mercury in precipitation over the Yellow Sea region, Environ. Pollut., 219, 262–274, https://doi.org/10.1016/j.envpol.2016.10.020, 2016.
Obrist, D., Johnson, D. W., and Lindberg, S. E.: Mercury concentrations and pools in four Sierra Nevada forest sites, and relationships to organic carbon and nitrogen, Biogeosciences, 6, 765–777, https://doi.org/10.5194/bg-6-765-2009, 2009.
Obrist, D., Johnson, D. W., and Edmonds, R. L.: Effects of vegetation type on mercury concentrations and pools in two adjacent coniferous and deciduous forests, J. Plant Nutr. Soil Sc., 175, 68–77, https://doi.org/10.1002/jpln.201000415, 2012.
Obrist, D., Kirk, J. L., Zhang, L., Sunderland, E. M., Jiskra, M., and Selin, N. E.: A review of global environmental mercury processes in response to human and natural perturbations: Changes of emissions, climate, and land use, Ambio, 47, 116–140, https://doi.org/10.1007/s13280-017-1004-9, 2018.
Peterson, C., Alishahi, M., and Gustin, M. S.: Testing the use of passive sampling systems for understanding air mercury concentrations and dry deposition across Florida, USA, Sci. Total Environ., 424, 297–307, https://doi.org/10.1016/j.scitotenv.2012.02.031, 2012.
Poissant, L., Pilote, M., Xu, X., and Zhang, H.: Atmospheric mercury speciation and deposition in the Bay St. Francois wetlands, J. Geophys. Res., 109, D11301, https://doi.org/10.1029/2003JD004364,2004.
Poissant, L., Pilote, M., Yumvihoze, E., and Lean, D.: Mercuryconcentrations and foliage/atmosphere fluxes in a maple forestecosystem in Quebec, Canada, J. Geophys. Res.-Atmos., 113, 10307–10319, https://doi.org/10.1029/2007jd009510, 2008.
Prestbo, E. M. and Gay, D. A.: Wet deposition of mercury in the US and Canada, 1996–2005: Results and analysis of the NADP mercury deposition network (MDN), Atmos. Environ., 43, 4223–4233, https://doi.org/10.1016/j.atmosenv.2009.05.028, 2009.
Qin, C., Wang, Y., Peng, Y., and Wang, D.: Four-year record of mercury wet deposition in one typical industrial city in southwest China, Atmos. Environ., 142, 442–451, https://doi.org/10.1016/j.atmosenv.2016.08.016, 2016.
Richardson, J. B. and Friedland, A. J.: Mercury in coniferous and deciduous upland forests in northern New England, USA: implications of climate change, Biogeosciences, 12, 6737–6749, https://doi.org/10.5194/bg-12-6737-2015, 2015.
Risch, M. and Kenski, D.: Spatial Patterns and Temporal Changes in Atmospheric-Mercury Deposition for the Midwestern USA, 2001–2016, Atmosphere, 9, 29, https://doi.org/10.3390/atmos9010029, 2018.
Risch, M. R., DeWild, J. F., Krabbenhoft, D. P., Kolka, R. K., and Zhang, L.: Mercury in Litterfall at Selected National Atmospheric Deposition Program Mercury Deposition Network Sites in the Eastern United States, 2007–2009, Environ. Pollut., 161, 284–290, 2012.
Risch, M. R., DeWild, J. F., Gay, D. A., Zhang, L., Boyer, E. W., and Krabbenhoft, D. P.: Atmospheric mercury deposition to forests in the eastern USA, Environ. Pollut., 228, 8–18, https://doi.org/10.1016/j.envpol.2017.05.004, 2017.
Ritchie, C. D., Richards, W., and Arp, P. A.: Mercury in fog on the Bay of Fundy (Canada), Atmos. Environ., 40, 6321–6328, https://doi.org/10.1016/j.atmosenv.2006.05.057, 2006.
Rutter, A. P. and Schauer, J. J.: The effect of temperature on the gas-particle partitioning of reactive mercury in atmospheric aerosols, Atmos. Environ., 41, 8647–8657, https://doi.org/10.1016/j.atmosenv.2007.07.024, 2007.
Sather, M. E., Mukerjee, S., Smith, L., Mathew, J., Jackson, C., Callison, R., Scrapper, L., Hathcoat, A., Adam, J., Keese, D., Ketcher, P., Brunette, R., Karlstrom, J., and Van der Jagt, G.: Gaseous oxidized mercury dry deposition measurements in the Four Corners area and Eastern Oklahoma, U.S.A, Atmos. Pollut. Res., 4, 168–180, https://doi.org/10.5094/apr.2013.017, 2013.
Sather, M. E., Mukerjee, S., Allen, K. L., Smith, L., Mathew, J., Jackson, C., Callison, R., Scrapper, L., Hathcoat, A., Adam, J., Keese, D., Ketcher, P., Brunette, R., Karlstrom, J., and Van der Jagt, G.: Gaseous oxidized mercury dry deposition measurements in the southwestern USA: A comparison between Texas, Eastern Oklahoma, and the Four Corners Area, Sci. World J., 2014, 580723, https://doi.org/10.1155/2014/580723, 2014.
Schroeder, W. H. and Munthe, J.: Atmospheric mercury – An overview, Atmos. Environ., 32, 809–822, 1998.
Schwab, J. J., Casson, P., Brandt, R., Husain, L., Dutkewicz, V., Wolfe, D., Demerjian, K. L., Civerolo, K. L., Rattigan, O. V., Felton, H. D., and Dukett, J. E.: Atmospheric chemistry measurements at Whiteface Mountain, NY: Cloud water chemistry, precipitation chemistry, and particulate matter, Aerosol Air Qual. Res., 16, 841–854, https://doi.org/10.4209/aaqr.2015.05.0344, 2016.
Selin, N. E. and Jacob, D. J.: Seasonal and spatial patterns of mercury wet deposition in the United States: Constraints on the contribution from North American anthropogenic sources, Atmos. Environ., 42, 5193–5204, https://doi.org/10.1016/j.atmosenv.2008.02.069, 2008.
Seo, Y.-S., Han, Y.-J., Choi, H.-D., Holsen, T. M., and Yi, S.-M.: Characteristics of total mercury (TM) wet deposition: Scavenging of atmospheric mercury species, Atmos. Environ., 49, 69–76, https://doi.org/10.1016/j.atmosenv.2011.12.031, 2012.
Sexauer Gustin, M., Weiss-Penzias, P. S., and Peterson, C.: Investigating sources of gaseous oxidized mercury in dry deposition at three sites across Florida, USA, Atmos. Chem. Phys., 12, 9201–9219, https://doi.org/10.5194/acp-12-9201-2012, 2012.
Shen, G., Chen, D., Wu, Y., Liu, L., and Liu, C.: Spatial patterns and estimates of global forest litterfall, Ecosphere, 10, 1–13, https://doi.org/10.1002/ecs2.2587, 2019.
Sheu, G.-R. and Lin, N.-H.: Mercury in cloud water collected on Mt. Bamboo in northern Taiwan during the northeast monsoon season, Atmos. Environ., 45, 4454–4462, https://doi.org/10.1016/j.atmosenv.2011.05.036, 2011.
Sheu, G.-R. and Lin, N.-H.: Characterizations of wet mercury deposition to a remote islet (Pengjiayu) in the subtropical Northwest Pacific Ocean, Atmos. Environ., 77, 474–481, https://doi.org/10.1016/j.atmosenv.2013.05.038, 2013.
Sheu, G.-R., Gay, D. A., Schmeltz, D., Olson, M., Chang, S.-C., Lin, D.-W., and Nguyen, L. S. P.: A new monitoring effort for Asia: the Asia Pacific Mercury Monitoring Network (APMMN), Atmosphere, 10, 481, https://doi.org/10.3390/atmos10090481, 2019.
Siudek, P., Kurzyca, I., and Siepak, J.: Atmospheric deposition of mercury in central Poland: Sources and seasonal trends, Atmos. Res., 170, 14–22, https://doi.org/10.1016/j.atmosres.2015.11.004, 2016.
Skov, H., Brooks, S. B., Goodsite, M. E., Lindberg, S. E., Meyers, T. P., Landis, M. S., Larsen, M. R. B., Jensen, B., McConville, G., and Christensen, J.: Fluxes of reactive gaseous mercury measured with a newly developed method using relaxed eddy accumulation, Atmos. Environ., 40, 5452–5463, https://doi.org/10.1016/j.atmosenv.2006.04.061, 2006.
Sommar, J., Zhu, W., Lin, C.-J., and Feng, X.: Field approaches to measure Hg exchange between natural surfaces and the atmosphere – A review, Crit. Rev. Env. Sci. Tec., 43, 1657–1739, https://doi.org/10.1080/10643389.2012.671733, 2013a.
Sommar, J., Zhu, W., Shang, L., Lin, C.-J., and Feng, X.: Seasonal variations in metallic mercury (Hg0) vapor exchange over biannual wheat–corn rotation cropland in the North China Plain, Biogeosciences, 13, 2029–2049, https://doi.org/10.5194/bg-13-2029-2016, 2016.
Sprovieri, F., Pirrone, N., Bencardino, M., D'Amore, F., Angot, H., Barbante, C., Brunke, E.-G., Arcega-Cabrera, F., Cairns, W., Comero, S., Diéguez, M. D. C., Dommergue, A., Ebinghaus, R., Feng, X. B., Fu, X., Garcia, P. E., Gawlik, B. M., Hageström, U., Hansson, K., Horvat, M., Kotnik, J., Labuschagne, C., Magand, O., Martin, L., Mashyanov, N., Mkololo, T., Munthe, J., Obolkin, V., Ramirez Islas, M., Sena, F., Somerset, V., Spandow, P., Vardè, M., Walters, C., Wängberg, I., Weigelt, A., Yang, X., and Zhang, H.: Five-year records of mercury wet deposition flux at GMOS sites in the Northern and Southern hemispheres, Atmos. Chem. Phys., 17, 2689–2708, https://doi.org/10.5194/acp-17-2689-2017, 2017.
Stankwitz, C., Kaste, J. M., and Friedland, A. J.: Threshold increases in soil lead and mercury from tropospheric deposition across an elevational gradient, Environ. Sci. Technol., 46, 8061–8068, https://doi.org/10.1021/es204208w, 2012.
Streets, D. G., Hao, J. M., Wu, Y., Jiang, J. K., Chan, M., Tian, H. Z., and Feng, X. B.: Anthropogenic mercury emissions in China, Atmos. Environ., 39, 7789–7806, https://doi.org/10.1016/j.atmosenv.2005.08.029, 2005.
Teixeira, D. C., Montezuma, R. C., Oliveira, R. R., and Silva-Filho, E. V.: Litterfall mercury deposition in Atlantic forest ecosystem from SE-Brazil, Environ. Pollut., 164, 11–15, https://doi.org/10.1016/j.envpol.2011.10.032, 2012.
Teixeira, D. C., Lacerda, L. D., and Silva-Filho, E. V.: Mercury sequestration by rainforests: The influence of microclimate and different successional stages, Chemosphere, 168, 1186–1193, https://doi.org/10.1016/j.chemosphere.2016.10.081, 2017.
Tørseth, K., Aas, W., Breivik, K., Fjæraa, A. M., Fiebig, M., Hjellbrekke, A. G., Lund Myhre, C., Solberg, S., and Yttri, K. E.: Introduction to the European Monitoring and Evaluation Programme (EMEP) and observed atmospheric composition change during 1972–2009, Atmos. Chem. Phys., 12, 5447–5481, https://doi.org/10.5194/acp-12-5447-2012, 2012.
Travnikov, O., Angot, H., Artaxo, P., Bencardino, M., Bieser, J., D'Amore, F., Dastoor, A., De Simone, F., Diéguez, M. D. C., Dommergue, A., Ebinghaus, R., Feng, X. B., Gencarelli, C. N., Hedgecock, I. M., Magand, O., Martin, L., Matthias, V., Mashyanov, N., Pirrone, N., Ramachandran, R., Read, K. A., Ryjkov, A., Selin, N. E., Sena, F., Song, S., Sprovieri, F., Wip, D., Wängberg, I., and Yang, X.: Multi-model study of mercury dispersion in the atmosphere: atmospheric processes and model evaluation, Atmos. Chem. Phys., 17, 5271–5295, https://doi.org/10.5194/acp-17-5271-2017, 2017.
UN Environment: Global Mercury Assessment 2018, UN Environment Programme, Chemicals and Health Branch, Geneva, Switzerland, 2019.
USEPA: Method 1631, Revision E: Mercury in Water by Oxidation, Purge and Trap, and Cold Vapor Atomic Fluorescence Spectrometry, United States Environmental Protection Agency, Washington, DC, USA, 10–46, available at: http://water.epa.gov/scitech/methods/cwa/metals/mercury/index.cfm (last access: 27 December 2014), 2002.
Wan, Q., Feng, X., Lu, J., Zheng, W., Song, X., Li, P., Han, S., and Xu, H.: Atmospheric mercury in Changbai Mountain area, northeastern China II. The distribution of reactive gaseous mercury and particulate mercury and mercury deposition fluxes, Environ. Res., 109, 721–727, https://doi.org/10.1016/j.envres.2009.05.006, 2009.
Wang, X., Lin, C.-J., and Feng, X.: Sensitivity analysis of an updated bidirectional air–surface exchange model for elemental mercury vapor, Atmos. Chem. Phys., 14, 6273–6287, https://doi.org/10.5194/acp-14-6273-2014, 2014.
Wang, X., Bao, Z., Lin, C. J., Yuan, W., and Feng, X.: Assessment of global mercury deposition through litterfall, Environ. Sci. Technol., 50, 8548–8557, https://doi.org/10.1021/acs.est.5b06351, 2016a.
Wang, X., Lin, C.-J., Lu, Z., Zhang, H., Zhang, Y., and Feng, X.: Enhanced accumulation and storage of mercury on subtropical evergreen forest floor: Implications on mercury budget in global forest ecosystems, J. Geophys. Res.-Biogeo., 121, 2096–2109, https://doi.org/10.1002/2016jg003446, 2016b.
Wang, Z., Zhang, X., Xiao, J., Ci, Z., and Yu, P.: Mercury fluxes and pools in three subtropical forested catchments, southwest China, Environ. Pollut., 157, 801–808, https://doi.org/10.1016/j.envpol.2008.11.018, 2009.
Weiss-Penzias, P., Fernandez, D., Moranville, R., and Saltikov, C.: A low cost system for detecting fog events and triggering an active fog water collector, Aerosol Air Qual. Res., 18, 214–233, https://doi.org/10.4209/aaqr.2016.11.0508, 2018.
Weiss-Penzias, P. S., Gustin, M. S., and Lyman, S. N.: Sources of gaseous oxidized mercury and mercury dry deposition at two southeastern U.S. sites, Atmos. Environ., 45, 4569–4579, https://doi.org/10.1016/j.atmosenv.2011.05.069, 2011.
Weiss-Penzias, P. S., Gay, D. A., Brigham, M. E., Parsons, M. T., Gustin, M. S., and Ter Schure, A.: Trends in mercury wet deposition and mercury air concentrations across the U.S. and Canada, Sci. Total Environ., 568, 546–556, https://doi.org/10.1016/j.scitotenv.2016.01.061, 2016a.
Weiss-Penzias, P., Coale, K., Heim, W., Fernandez, D., Oliphant, A., Dodge, C., Hoskins, D., Farlin, J., Moranville, R., and Olson, A.: Total- and monomethyl-mercury and major ions in coastal California fog water: Results from two years of sampling on land and at sea, Elem. Sci. Anth., 4, 1–18, https://doi.org/10.12952/journal.elementa.000101, 2016b.
Wetang'ula: Preliminary assessment of total mercury in bulk precipitation around Olkaria Area, Kenya, Journal of Environmental Science and Engineering, 1585–1595, 2011.
Wetherbee, G. A.: Precipitation collector bias and its effects on temporal trends and spatial variability in National Atmospheric Deposition Program/National Trends Network data, Environ. Pollut., 223, 90–101, https://doi.org/10.1016/j.envpol.2016.12.036, 2017.
Wetherbee, G. A. and Martin, R. A.: External Quality Assurance Project Report for the National Atmospheric Deposition Program's National Trends Network and Mercury Deposition Network, 2015–2016, U.S. Geological Survey, Reston, Virginia, 2018.
Wetherbee, G. A., Latysh, N. E., Gordon, J. D., and Krabbenhoft, D. P.: Spatial and temporal variability of the overall error of National Atmospheric Deposition Program measurements determined by the USGS co-located–sampler program, water years 1989–2001, Environ. Pollut., 135, 407–418, https://doi.org/10.1016/j.envpol.2004.11.014, 2005.
Wright, G., Gustin, M. S., Weiss-Penzias, P., and Miller, M. B.: Investigation of mercury deposition and potential sources at six sites from the Pacific Coast to the Great Basin, USA, Sci. Total Environ., 470–471, 1099–1113, https://doi.org/10.1016/j.scitotenv.2013.10.071, 2014.
Wright, L. P. and Zhang, L.: An approach estimating bidirectional air-surface exchange for gaseous elemental mercury at AMNet sites, J. Adv. Model. Earth Sy., 7, 35–49, https://doi.org/10.1002/2014ms000367, 2015.
Wright, L. P., Zhang, L., and Marsik, F. J.: Overview of mercury dry deposition, litterfall, and throughfall studies, Atmos. Chem. Phys., 16, 13399–13416, https://doi.org/10.5194/acp-16-13399-2016, 2016.
Xu, L., Chen, J., Yang, L., Yin, L., Yu, J., Qiu, T., and Hong, Y.: Characteristics of total and methyl mercury in wet deposition in a coastal city, Xiamen, China: Concentrations, fluxes and influencing factors on Hg distribution in precipitation, Atmos. Environ., 99, 10–16, https://doi.org/10.1016/j.atmosenv.2014.09.054, 2014.
Yu, Q., Luo, Y., Wang, S., Wang, Z., Hao, J., and Duan, L.: Gaseous elemental mercury (GEM) fluxes over canopy of two typical subtropical forests in south China, Atmos. Chem. Phys., 18, 495–509, https://doi.org/10.5194/acp-18-495-2018, 2018.
Zhang, H. H., Poissant, L., Xu, X. H., and Pilote, M.: Explorative and innovative dynamic flux bag method development and testing for mercury air-vegetation gas exchange fluxes, Atmos. Environ., 39, 7481–7493, https://doi.org/10.1016/j.atmosenv.2005.07.068, 2005.
Zhang, L. and He, Z.: Technical Note: An empirical algorithm estimating dry deposition velocity of fine, coarse and giant particles, Atmos. Chem. Phys., 14, 3729–3737, https://doi.org/10.5194/acp-14-3729-2014, 2014.
Zhang, L., Brook, J. R., and Vet, R.: A revised parameterization for gaseous dry deposition in air-quality models, Atmos. Chem. Phys., 3, 2067–2082, https://doi.org/10.5194/acp-3-2067-2003, 2003.
Zhang, L., Blanchard, P., Gay, D. A., Prestbo, E. M., Risch, M. R., Johnson, D., Narayan, J., Zsolway, R., Holsen, T. M., Miller, E. K., Castro, M. S., Graydon, J. A., Louis, V. L. St., and Dalziel, J.: Estimation of speciated and total mercury dry deposition at monitoring locations in eastern and central North America, Atmos. Chem. Phys., 12, 4327–4340, https://doi.org/10.5194/acp-12-4327-2012, 2012.
Zhang, L., Wang, S. X., Wang, L., and Hao, J. M.: Atmospheric mercury concentration and chemical speciation at a rural site in Beijing, China: implications of mercury emission sources, Atmos. Chem. Phys., 13, 10505–10516, https://doi.org/10.5194/acp-13-10505-2013, 2013.
Zhang, L., Wang, S., Wu, Q., Wang, F., Lin, C.-J., Zhang, L., Hui, M., Yang, M., Su, H., and Hao, J.: Mercury transformation and speciation in flue gases from anthropogenic emission sources: a critical review, Atmos. Chem. Phys., 16, 2417–2433, https://doi.org/10.5194/acp-16-2417-2016, 2016a.
Zhang, L., Wu, Z., Cheng, I., Wright, L. P., Olson, M. L., Gay, D. A., Risch, M. R., Brooks, S., Castro, M. S., Conley, G. D., Edgerton, E. S., Holsen, T. M., Luke, W., Tordon, R., and Weiss-Penzias, P.: The estimated six-year mercury dry deposition across North America, Environ. Sci. Technol., 50, 12864–12873, https://doi.org/10.1021/acs.est.6b04276, 2016b.
Zhang, L. M., Gong, S. L., Padro, J., and Barrie, L.: A size-segregated particle dry deposition scheme for an atmospheric aerosol module, Atmos. Environ., 35, 549–560, https://doi.org/10.1016/S1352-2310(00)00326-5, 2001.
Zhang, L. M., Moran, M. D., Makar, P. A., Brook, J. R., and Gong, S. L.: Modelling gaseous dry deposition in AURAMS: A unified regional air-quality modelling system, Atmos. Environ., 36, 537–560, https://doi.org/10.1016/S1352-2310(01)00447-2, 2002.
Zhang, L. M., Wright, L. P., and Blanchard, P.: A review of current knowledge concerning dry deposition of atmospheric mercury, Atmos. Environ., 43, 5853–5864, https://doi.org/10.1016/j.atmosenv.2009.08.019, 2009.
Zhang, Y., Jaeglé, L., van Donkelaar, A., Martin, R. V., Holmes, C. D., Amos, H. M., Wang, Q., Talbot, R., Artz, R., Brooks, S., Luke, W., Holsen, T. M., Felton, D., Miller, E. K., Perry, K. D., Schmeltz, D., Steffen, A., Tordon, R., Weiss-Penzias, P., and Zsolway, R.: Nested-grid simulation of mercury over North America, Atmos. Chem. Phys., 12, 6095–6111, https://doi.org/10.5194/acp-12-6095-2012, 2012.
Zhang, Y., Liu, R., Wang, Y., Cui, X., and Qi, J.: Change characteristic of atmospheric particulate mercury during dust weather of spring in Qingdao, China, Atmos. Environ., 102, 376–383, https://doi.org/10.1016/j.atmosenv.2014.12.005, 2015.
Zhang, Y., Jacob, D. J., Horowitz, H. M., Chen, L., Amos, H. M., Krabbenhoft, D. P., Slemr, F., St Louis, V. L., and Sunderland, E. M.: Observed decrease in atmospheric mercury explained by global decline in anthropogenic emissions, P. Natl. Acad. Sci. USA, 113, 526–531, 2016.
Zhao, L. S., Xu, L. L., Wu, X., Zhao, G. Q., Jiao, L., Chen, J. S., Hong Y. W., Deng J. J., Chen, Y. T., Yang, K., Hu, G. R., and Yu, R. L.: Characteristics and sources of mercury in precipitation collected at the urban, suburban and rural sites in a city of Southeast China, Atmos. Res., 211, 21–29, https://doi.org/10.1016/j.atmosres.2018.04.019, 2018.
Zhao, Z., Wang, D., Wang, Y., Mu, Z., and Zhu, J.: Wet deposition flux and runoff output flux of mercury in a typical small agricultural watershed in Three Gorges Reservoir areas, Environ. Sci. Pollut. R. Int., 22, 5538–5551, https://doi.org/10.1007/s11356-014-3701-2, 2015.
Zhou, J., Wang, Z., Sun, T., Zhang, H., and Zhang, X.: Mercury in terrestrial forested systems with highly elevated mercury deposition in southwestern China: The risk to insects and potential release from wildfires, Environ. Pollut., 212, 188–196, https://doi.org/10.1016/j.envpol.2016.01.003, 2016.
Zhou, J., Wang, Z., Zhang, X., and Gao, Y.: Mercury concentrations and pools in four adjacent coniferous and deciduous upland forests in Beijing, China, J. Geophys. Res.-Biogeo., 122, 1260–1274, https://doi.org/10.1002/2017jg003776, 2017.
Zhu, J., Wang, T., Talbot, R., Mao, H., Yang, X., Fu, C., Sun, J., Zhuang, B., Li, S., Han, Y., and Xie, M.: Characteristics of atmospheric mercury deposition and size-fractionated particulate mercury in urban Nanjing, China, Atmos. Chem. Phys., 14, 2233–2244, https://doi.org/10.5194/acp-14-2233-2014, 2014.
Zhu, J., Wang, T., Bieser, J., and Matthias, V.: Source attribution and process analysis for atmospheric mercury in eastern China simulated by CMAQ-Hg, Atmos. Chem. Phys., 15, 8767–8779, https://doi.org/10.5194/acp-15-8767-2015, 2015.
Zhu, W., Sommar, J., Lin, C.-J., and Feng, X.: Mercury vapor air–surface exchange measured by collocated micrometeorological and enclosure methods – Part I: Data comparability and method characteristics, Atmos. Chem. Phys., 15, 685–702, https://doi.org/10.5194/acp-15-685-2015, 2015.
Zhu, W., Lin, C.-J., Wang, X., Sommar, J., Fu, X., and Feng, X.: Global observations and modeling of atmosphere–surface exchange of elemental mercury: a critical review, Atmos. Chem. Phys., 16, 4451–4480, https://doi.org/10.5194/acp-16-4451-2016, 2016.
- Abstract
- Introduction
- Observation-based estimation of global Hg deposition
- Uncertainties in Hg deposition observation
- Uncertainties in Hg deposition simulation
- Summary of uncertainties in Hg deposition to terrestrial surfaces
- Implications and future research needs
- Data availability
- Author contributions
- Competing interests
- Acknowledgements
- Financial support
- Review statement
- References
- Supplement