the Creative Commons Attribution 4.0 License.
the Creative Commons Attribution 4.0 License.
 | 06 Feb 2019
Two pathways of how remote SST anomalies drive the interannual variability of autumnal haze days in the Beijing–Tianjin–Hebei region, China
Jing Wang
Zhiwei Zhu
Li Qi
Qiaohua Zhao
Jinhai He
Julian X. L. Wang
Analogous to the circumstances in wintertime, the increasing severity of autumnal haze pollution over the Beijing–Tianjin–Hebei (BTH) region may also lead to impairment of the socioeconomic development and human health in this region. Despite man-made aerosol emissions, the interannual variability of autumnal (September–October–November) haze days (AHDs) in the BTH region (AHDBTH) is apparently tied to the global and regional meteorological anomalies. The present study suggests that an above-normal AHDBTH is closely associated with the simultaneous sea surface temperature (SST) warming in two regions (over the North Atlantic subtropical sector, R1, and over the western North Pacific sector, R2). When the autumnal SST warming in both R1 and R2 is significant, the likelihood of a higher AHDBTH is greatly enhanced. Observational and simulation evidence demonstrated how remote SST anomalies over R1 and R2 influence variation of AHDBTH via two different pathways. Firstly, SST warming in R1 can induce a downstream midlatitudinal Rossby wave train, leading to a barotropic high-pressure and subsidence anomaly over the BTH region. Secondly, SST warming in R2 can also result in air subsidence over the BTH region through an anomalous local meridional cell. Through these two distinct pathways, localized meteorological circumstances conducive to a higher AHDBTH (i.e., repressed planetary boundary layer, weak southerly airflow, and warm and moist conditions) can be established.
- Article
(13291 KB) -
Supplement
(3146 KB) - BibTeX
- EndNote


Aerosol particles (APs) are ubiquitous in the ambient air. Through aerosol-induced thermal forcing, APs can exert profound impacts on regional and large-scale circulation (e.g., Chung et al., 2002; Lau and Kim, 2006; Lau et al., 2006; Liu et al., 2009; C. Li et al., 2016; Wu et al., 2016), as well as global warming (e.g., Charlson et al., 1992; Tett et al., 1999; H. Zhang et al., 2016). Notably, due to the property of light extinction related to high concentrations of APs, especially fine particulate matter (i.e., particulate matter (PM) with an aerodynamic diameter of 2.5 µm or less, PM2.5) (Guo et al., 2014; Z. F. Wang et al., 2014; Li et al., 2017; Seo et al., 2017; Chen et al., 2018; Luan et al., 2018), severe haze weather with low visibility can readily occur (Chen et al., 2012; C. Li et al., 2016; Ding et al., 2017; Seo et al., 2017; Chen et al., 2018).
In recent decades, observational evidence has suggested that China has become one of the most severe AP-loading regions in the world (Tao et al., 2016; C. Li et al., 2016), arguably because of the rapid nationwide industrialization and urbanization (Xu et al., 2015; H. Zhang et al., 2016). High concentrations of APs can lead to the formation of severe haze weather via complicated interactions (Y. S. Wang et al., 2014). Haze weather is not only harmful to human respiratory and cardiovascular systems (Pope III and Dockery, 2006; Tie et al., 2009; Chen et al., 2013; Xu et al., 2013), but also influences vehicular traffic and crop yields (Chameides et al., 1999; Wu et al., 2005). As a result, haze pollution has received considerable attention from the government and the public. Unfortunately, on the one hand, overwhelming industrialization leads to more severe haze contamination over the Beijing–Tianjin–Hebei (BTH) region (Xu et al., 2015), while on the other hand, the trumpet-shaped topography (Fig. 1) of the region is unfavorable for the dissipation of air pollution, thus making the BTH region home to some of the worst haze weather in China. Since the BTH region is the most economically developed region in North China and is at the heart of Chinese politics and culture, severe haze pollution in this region has become a critical issue (e.g., Mu and Zhang, 2014; Wang, 2018), especially since the occurrence of the unprecedented severe haze event in North China in January 2013 (Y. S. Wang et al., 2014; Zhang et al., 2014, 2015; Mu and Zhang, 2014; Tao et al., 2014).
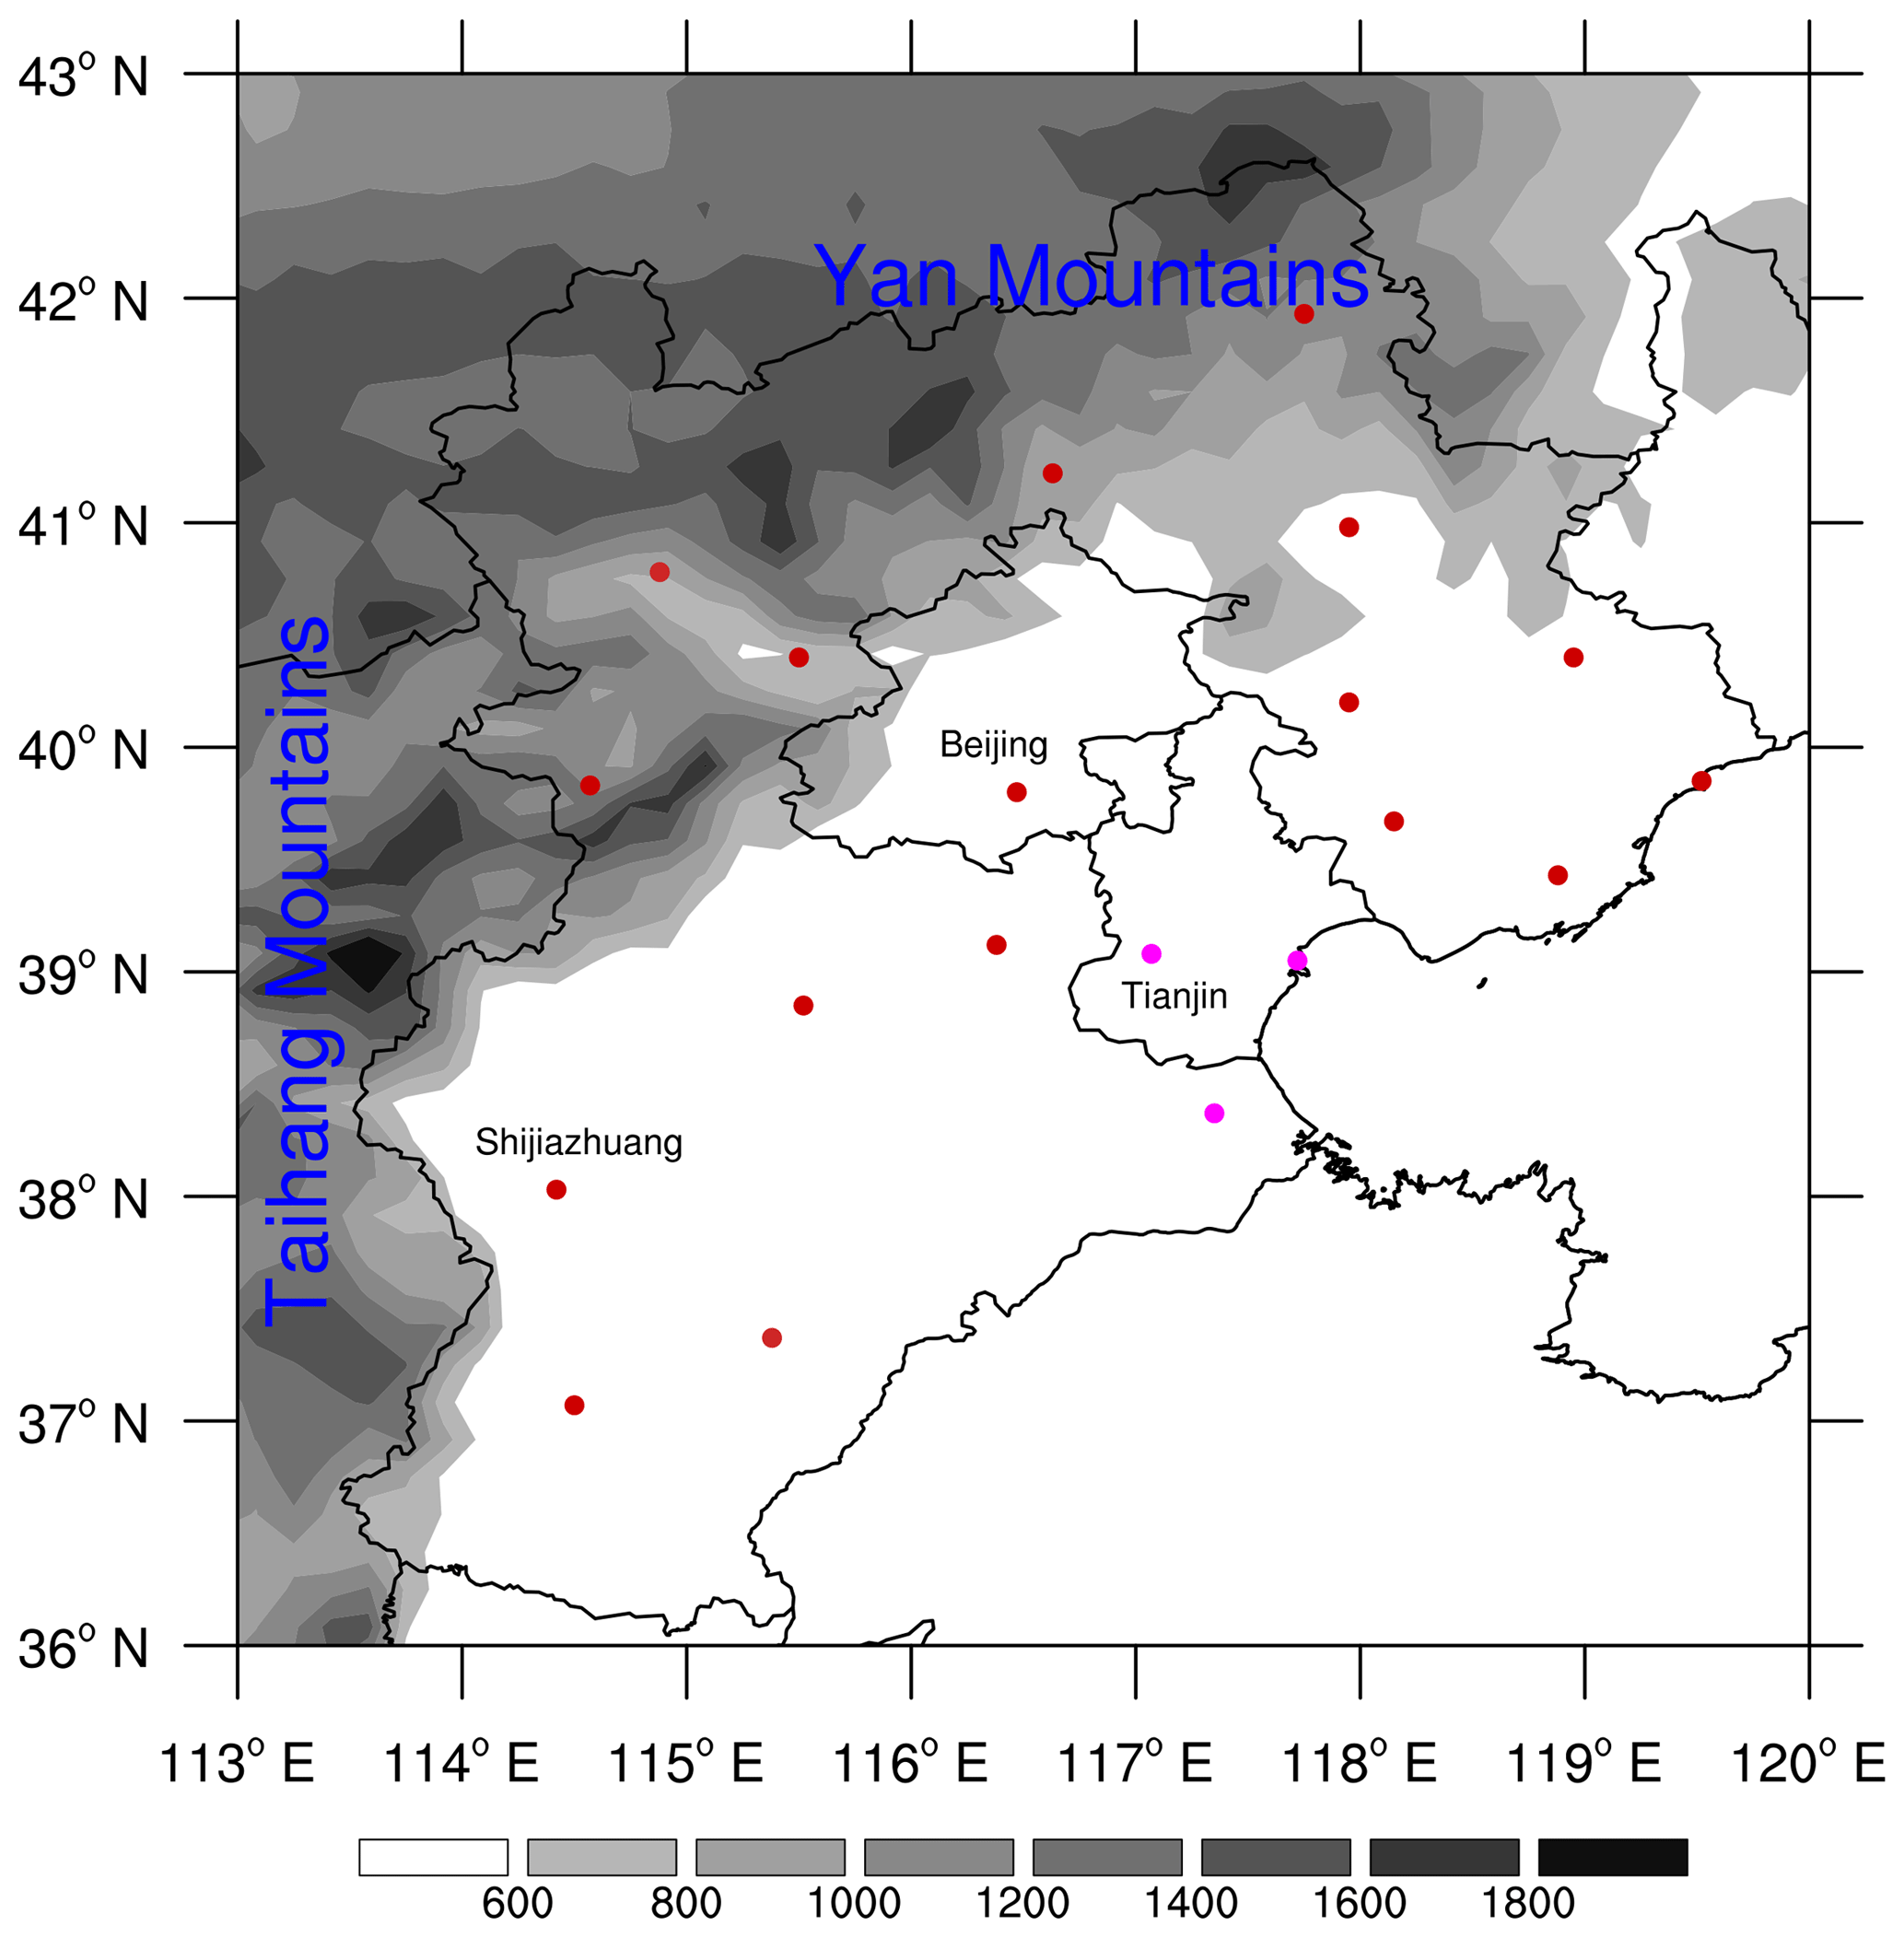
Figure 1Topographic map (shaded; m) for the BTH region and the locations of 20 meteorological sites (colored dots). The dots colored red (light red; magenta) represent significant positive temporal correlation coefficients at the 99 % (95 %; 90 %) confidence level between the AHDBTH and AHDs for every individual site on the interannual timescale.
To date, numerous efforts have been made to explore the causes of wintertime haze pollution over the BTH region and its surroundings, and these previous studies roughly fall into three categories based on the climatological perspective. The first category reports that the joint effects of the emissions of various sources of APs (e.g., Cao et al., 2007; Guo et al., 2011; Zhu et al., 2016) and climate anomalies (e.g., Chen and Wang, 2015; Wang and Chen, 2016; Yin and Wang, 2016; Cai et al., 2017; Wang, 2018) may have brought about the increasing severity of haze pollution over China in recent decades. The second category of studies, meanwhile, underlines the causality of the variation in winter haze days in eastern and northern China from the perspective of climate anomalies (e.g., Q. Li et al., 2016; Yin and Wang, 2016; Pei et al., 2018). For instance, it is suggested that a weakened East Asian winter monsoon (EAWM) system could lead to the above-normal numbers of winter haze days (e.g., Niu et al., 2010; Q. Li et al., 2016; Yin and Wang, 2016). Meanwhile, the variability of EAWM has been shown to be significantly tied to the East Atlantic–West Russia pattern and the Eurasian pattern (Z. Zhang et al., 2016; Yin and Wang, 2017). The third category focuses on the external forcings associated with the variability of winter haze days. These forcings include the sea surface temperature (SST; e.g., Gao and Li, 2015; Wang et al., 2015), Arctic sea ice (e.g., Wang et al., 2015; Zou et al., 2017), Eurasian snowpack (e.g., Yin and Wang, 2017), and the thermal conditions on the Tibetan Plateau (e.g., Xu et al., 2016). However, most of these previous works have focused on wintertime, with little attention having been paid to other seasons.
Autumn is a transitional season from the wet and hot summer to the dry and cold winter. Climatologically, the weather in autumn over the BTH region is quite pleasant, with favorable temperatures and light winds. Outdoor activities and tourism therefore prevail in the autumn season. However, autumn is also a season in which haze weather frequently occurs in the BTH region (Chen and Wang, 2015). The number of autumnal haze days (AHDs) has increased remarkably in recent years. Such an increase in the number of haze days is a potential threat to tourism economics in this region. Therefore, research into the causes of the interannual variation in AHDs in the BTH region (AHDBTH) is imperative. Such work not only provides scientific support for the year-to-year scheduling of anthropogenic emissions for dealing with autumnal haze pollution, but also helps the government with facilitating the arrangement of tourism economics. However, compared to the myriad studies on wintertime haze pollution, autumn haze pollution over the BTH region has attracted far less attention, with only a few case studies on atmospheric circulation having been reported (Yang et al., 2015; Gao and Chen, 2017; Wang et al., 2018). It was this knowledge gap that motivated us to revisit the variability of AHDBTH. Considering that the SST acts as a crucial driver of large-scale climate variability (e.g., Wang et al., 2009; Zhu et al., 2014; He and Zhu, 2015; Xiao et al., 2015; Zhu and Li, 2017; Zhu, 2018), we aimed to figure out the underlying air–sea interaction mechanisms for the interannual AHDBTH variability in the present study.
The remainder of this paper is organized as follows. Section 2 introduces the data, model, and methodology. Section 3 presents the atmospheric anomalies associated with AHDBTH. Section 4 addresses the mechanisms of how remote SST anomalies (SSTAs) drive the interannual variations of AHDBTH. Conclusions and further discussion are provided in the final section.
2.1 Data
The data used in this study are as follows:
-
monthly mean planetary boundary layer height (PBLH), with a horizontal resolution, from the European Centre for Medium-Range Weather Forecasts Interim reanalysis (ERA-Interim) (Dee et al., 2011);
-
monthly mean atmospheric data with a horizontal resolution and total cloud cover (entire atmosphere considered as a single layer; 192 points × 94 points in the horizontal direction), from the National Centers for Environmental Prediction (NCEP)–National Center for Atmospheric Research (NCAR) Reanalysis I (NCEP/NCAR) (Kalnay et al., 1996);
-
monthly mean SST, with a horizontal resolution, of the Extended Reconstructed SST dataset version 5 (ERSST v5; Huang et al., 2017), from the National Oceanic and Atmospheric Administration (NOAA);
-
global monthly precipitation data, with a horizontal resolution, from NOAA's precipitation reconstruction (Chen et al., 2002);
-
ground-timing observation datasets, at 02:00, 08:00, 14:00, and 20:00 (Beijing local time), from the National Meteorological Information Center of China.
The temporal coverage of the PBLH data is from 1979 to 2017, while the remaining datasets are from 1960 to 2017. Here, boreal autumn refers to the seasonal mean for September–October–November (SON).
2.2 Model
The numerical model we employed is an anomaly atmospheric general circulation model (AGCM) based on the Geophysical Fluid Dynamics Laboratory (GFDL) global spectrum dry AGCM (Held and Suarez, 1994). The horizontal resolution is T42, with five evenly spaced sigma levels (σ=p/ps; interval: 0.2; top level: σ=0; bottom level: σ=1). A realistic autumn mean state, obtained from the long-term mean of the NCEP/NCAR reanalysis data, is prescribed as the model basic state. This model has been used to unravel the eddy–mean interaction over East Asia and its downstream climate impacts over North America (Zhu and Li, 2016, 2018).
2.3 Methodology
The definition of a haze day in the present study is identical to the previous studies (e.g., Chen and Wang, 2015), which is based on the ground-timing observations of relative humidity, visibility, and wind speed. It is important to point out that the visibility observations switched from manual to automatic in 2014, and the visibility threshold for haze was thus also slightly modified from then on. Nevertheless, the continuity of the data was not affected. Following Z. Zhang et al. (2016), the mean number of haze days () for AHDBTH was computed by
where n (here, n=20) is the number of meteorological sites distributed within the BTH region (Fig. 1), and N denotes the number of haze days at a site for each autumn.
Similar to the approach proposed by Zhu and Li (2017), the 9-year running mean of the AHDBTH was used to represent the interdecadal component of the AHDBTH, whereas the interannual component was obtained by removing the interdecadal component from the raw AHDBTH. Since there is a tapering problem when calculating the running mean, the first 4 years and the last 4 years of the interdecadal component of the AHDBTH could be estimated using the mean value of the available data with a shorter window. For example, the interdecadal component of the AHDBTH for 2016 and 2017 could be obtained using the mean of 2012–2017 and 2013–2017, respectively. Note that the temporal correlation coefficients (TCCs) between the AHDBTH and every single station were all positive and significant (Fig. 1), indicating the coherency of the interannual variability of autumnal haze days in each station over the BTH region; meanwhile, the distribution of these stations was fairly even. Therefore, the interannual component of the AHDBTH could be a good representation of the year-to-year pollution state over the whole BTH region in autumn.
Linear regression, composite analysis, and correlation were used to examine the circulation and SSTAs that associated with the interannual AHDBTH. The two-tailed Student's t test was employed to evaluate the statistical significance of these analyses. The wave activity flux (WAF; Takaya and Nakamura, 2001) was calculated to depict the tendency of Rossby wave energy propagation.
Figure 2 illustrates the time series of the raw AHDBTH, along with its interdecadal and interannual components. A prominent feature is that the AHDBTH displays both interannual and interdecadal variability. On the interdecadal timescale, the AHDBTH was below average during 1960–1975 and the late 2000s, but above average during 1975–2003, and it increased dramatically after 2009. On the interannual timescale, the AHDBTH presents large differences year by year. For example, the AHDBTH was at its lowest in 2012, but peaked in 2014. Since the interannual variability explains most of the total variances in the AHDBTH variability, in this study we investigate the atmospheric anomalies and unravel the underlying physical processes associated with the AHDBTH on the interannual timescale.
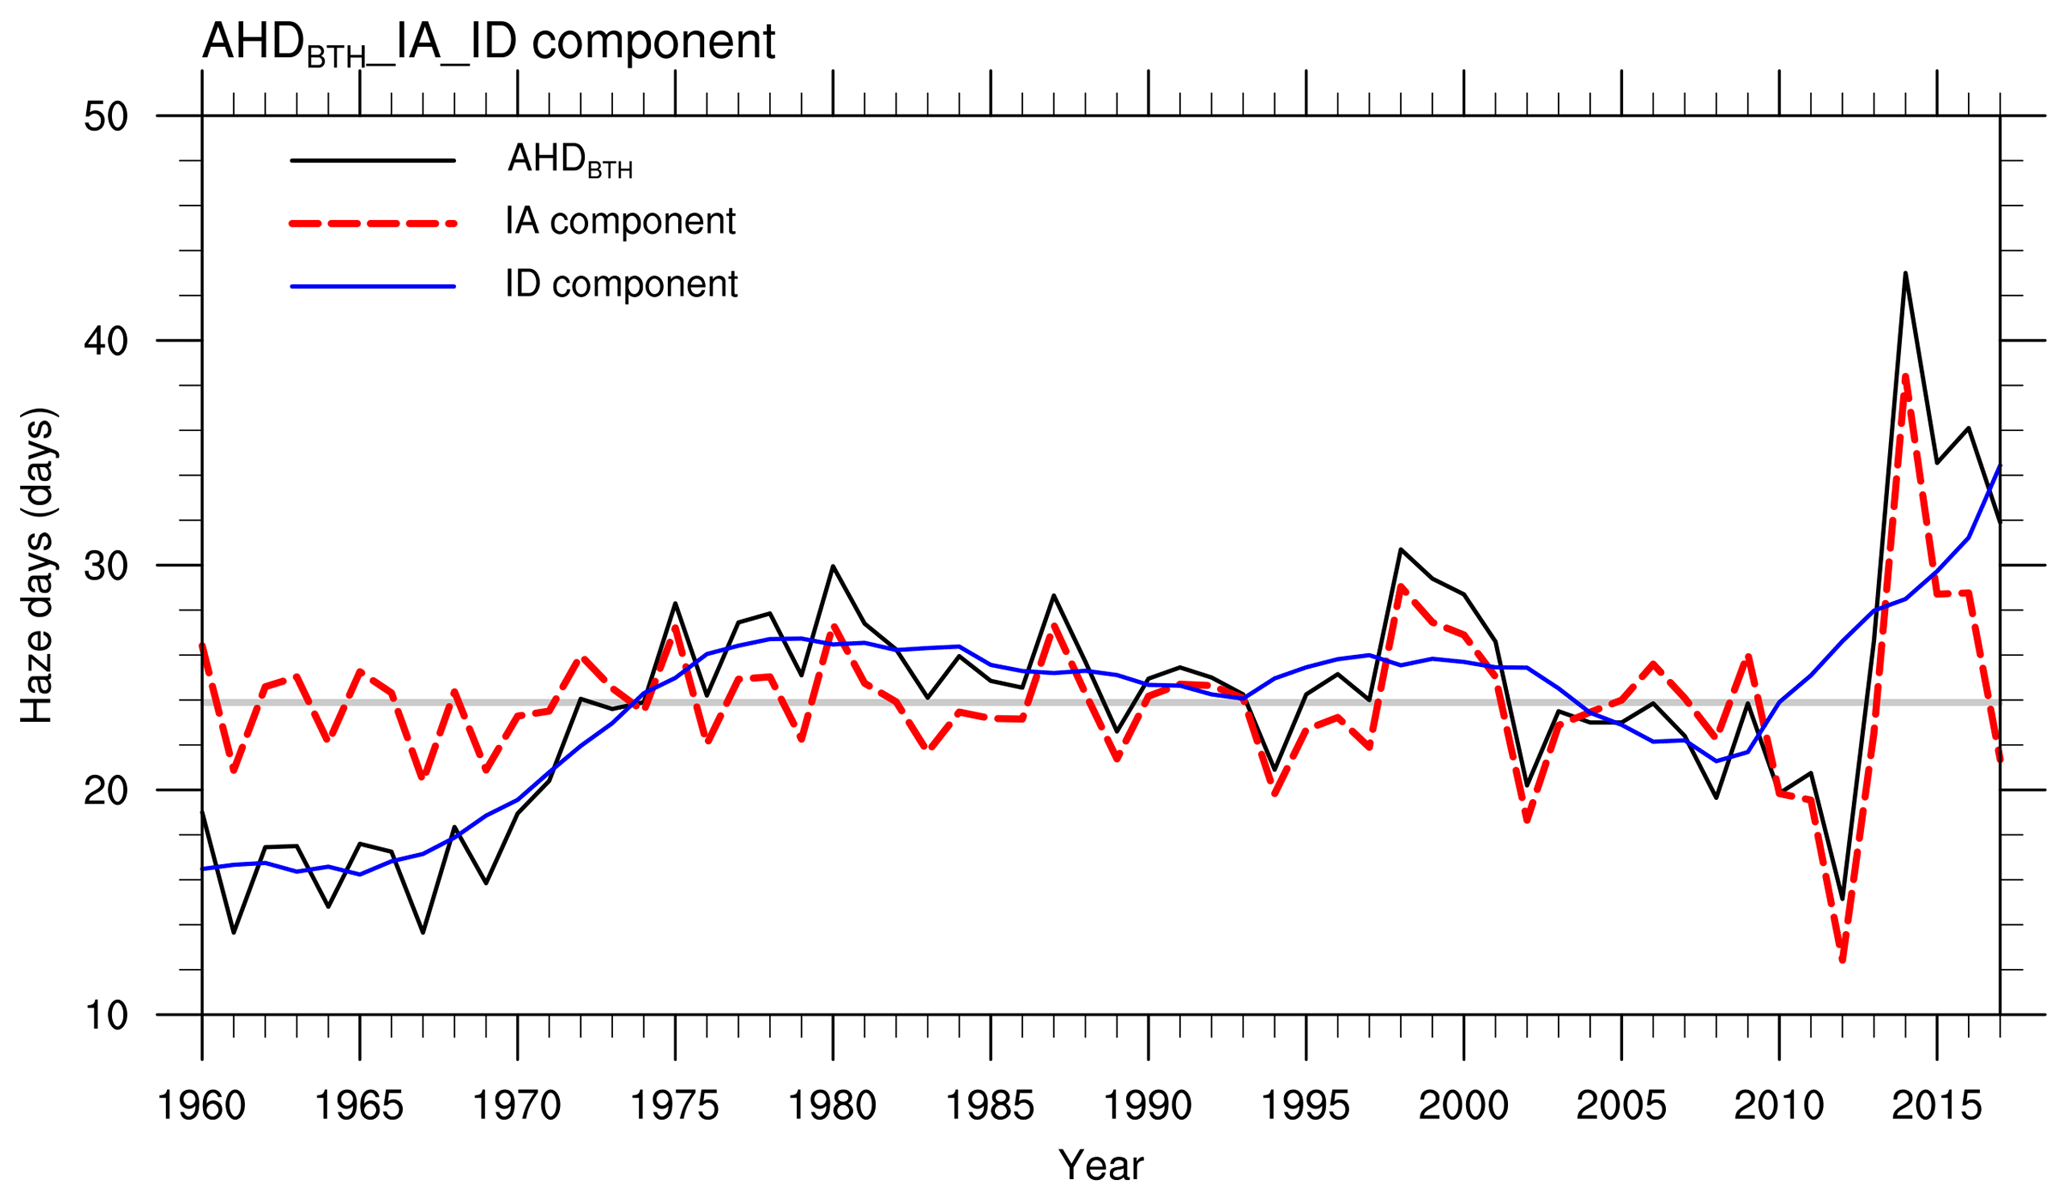
Figure 2Time series of the raw AHDBTH (black line; days), along with its interdecadal component (blue line; days) and interannual component (red line; days), for the period 1960–2017. The gray horizontal line delineates the average climate value of the raw AHDBTH during 1960–2017.
Close scrutiny of the large-scale and localized dynamic and thermodynamic fields associated with the AHDBTH could advance our understanding of the underlying mechanisms. In this regard, we firstly examine the climatological-mean autumnal 500 hPa geopotential height (Z500), 850 hPa winds (UV850), and total cloud, along with the surface relative humidity and surface air temperature that potentially impact the climate over the BTH region (Fig. 3). There is a shallow mid-tropospheric trough over coastal East Asia (Fig. 3a), which resembles the trough in winter (Zhao et al., 2018; Pei et al., 2018) but with a smaller magnitude. Behind the trough, a clear anticyclonic circulation appears over central–eastern China, with remarkable westerly and northwesterly winds dominating the BTH region (Fig. 3a). Cool and dry air from higher latitudes is advected by the winds, and the BTH region is thus much cooler and drier and has less cloud than other regions at the same latitudes (e.g., central Japan). As such, the autumnal BTH region features breezy and windy conditions, with low surface relative humidity (Fig. 3b), reducing the likelihood of haze there via the effect of cold advection and ventilation. Note, however, that if the breezy conditions are interrupted, haze pollution is likely to occur. One may ask whether a higher AHDBTH is related to the interference of such breezy conditions. Figures 4 and 5 were therefore plotted to examine the associated atmospheric parameters and circulations. For simplicity, the regression and composite analyses in this study reported hereafter are interpreted with respect to positive phase of AHDBTH anomalies only.
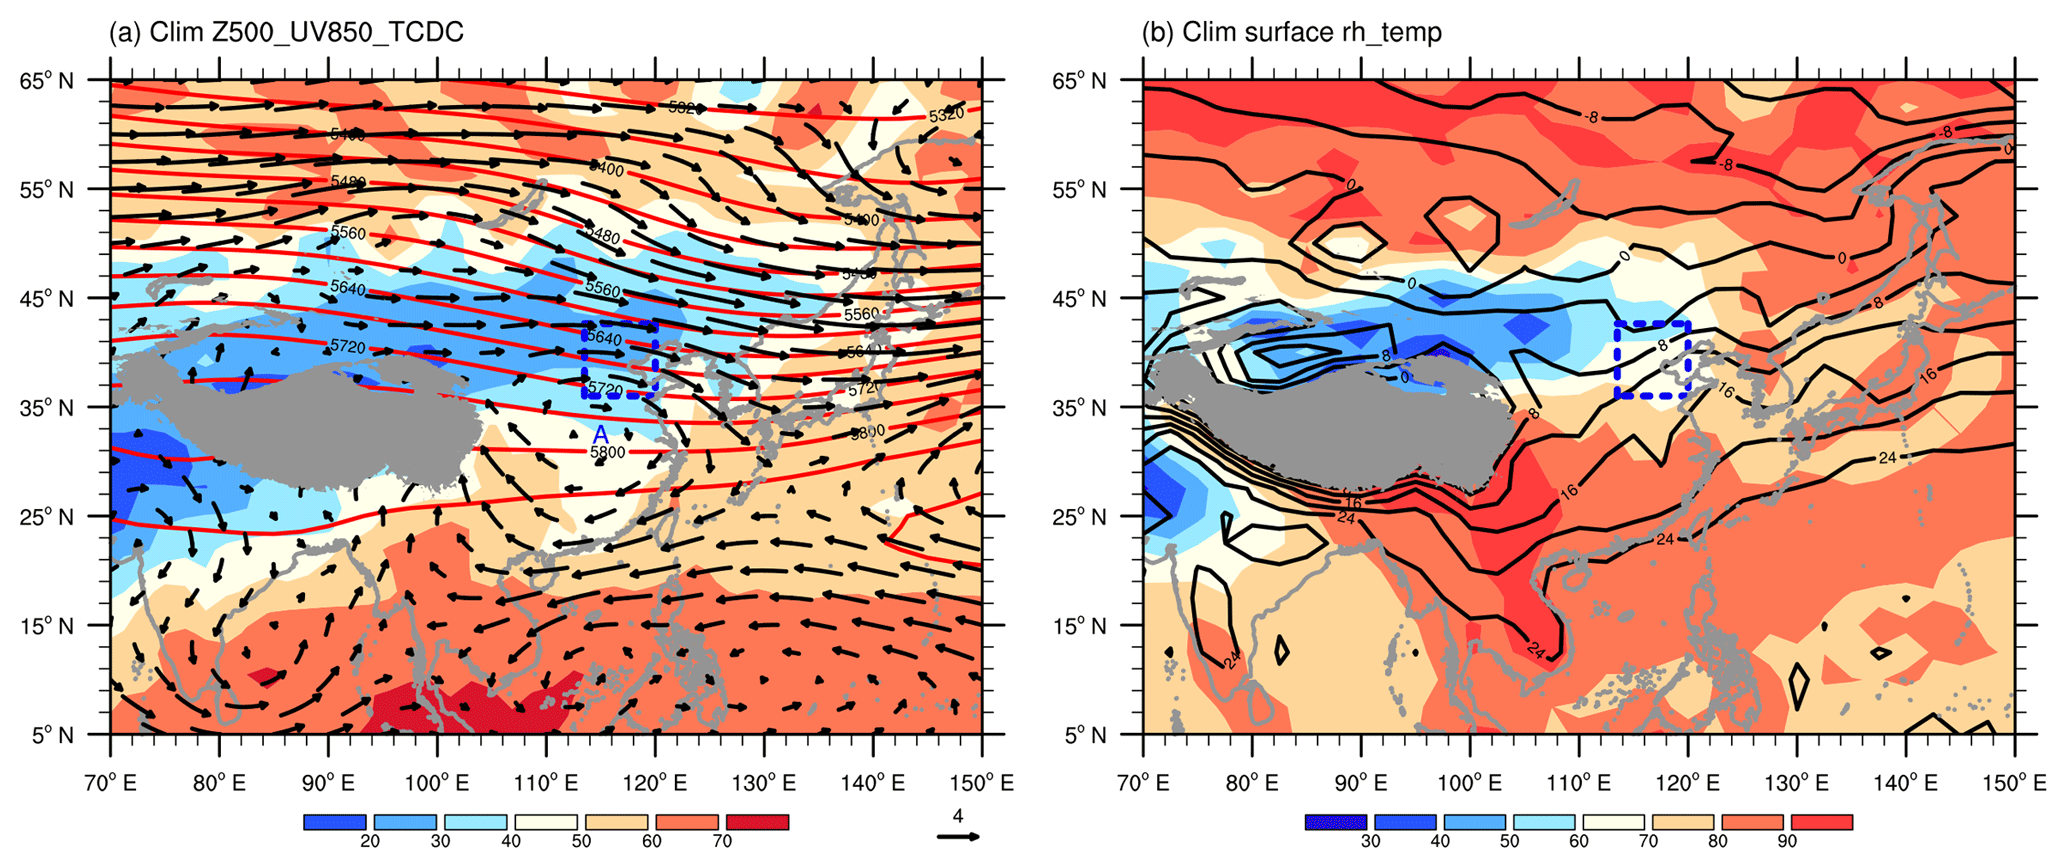
Figure 3The climatological-mean (1960–2017) autumnal (a) Z500 (contours; gpm), UV850 (vectors; m s−1) and total cloud (shaded; %) and (b) surface relative humidity (shaded; %) and surface air temperature (contours; ∘C). The gray shaded area denotes the Tibetan Plateau, and the blue dashed box delineates the research domain of the BTH region. The letter A represents the center of anticyclonic circulation.
Previous studies have revealed that haze pollution is closely correlated with local meteorological parameters in the planetary boundary layer (e.g., You et al., 2017; Chen et al., 2018). Figure 4 suggests that an above-normal AHDBTH is tied to a localized increase of surface relative humidity (Fig. 4a) and surface air temperature (Fig. 4b), along with a decrease of surface wind speed (Fig. 4c), sea-level pressure (SLP) (Fig. 4d), and PBLH (Fig. 4e). The question is, what causes the above anomalous parameters that are favorable for a higher AHDBTH?

Figure 4Regressed patterns of autumnal meteorological parameters onto the interannual component of the AHDBTH, including (a) surface relative humidity (shaded; %C), (b) surface air temperature (shaded; ∘C), (c) surface wind speed (shaded; m s−1), (d) SLP (shaded; hPa), (e) PBLH (shaded; m), and (f) 500 hPa omega (shaded; 10−2 Pa s−1). Regression coefficients that are significant at the 90 % confidence level are stippled. The blue dashed box outlines the research domain of the BTH region.
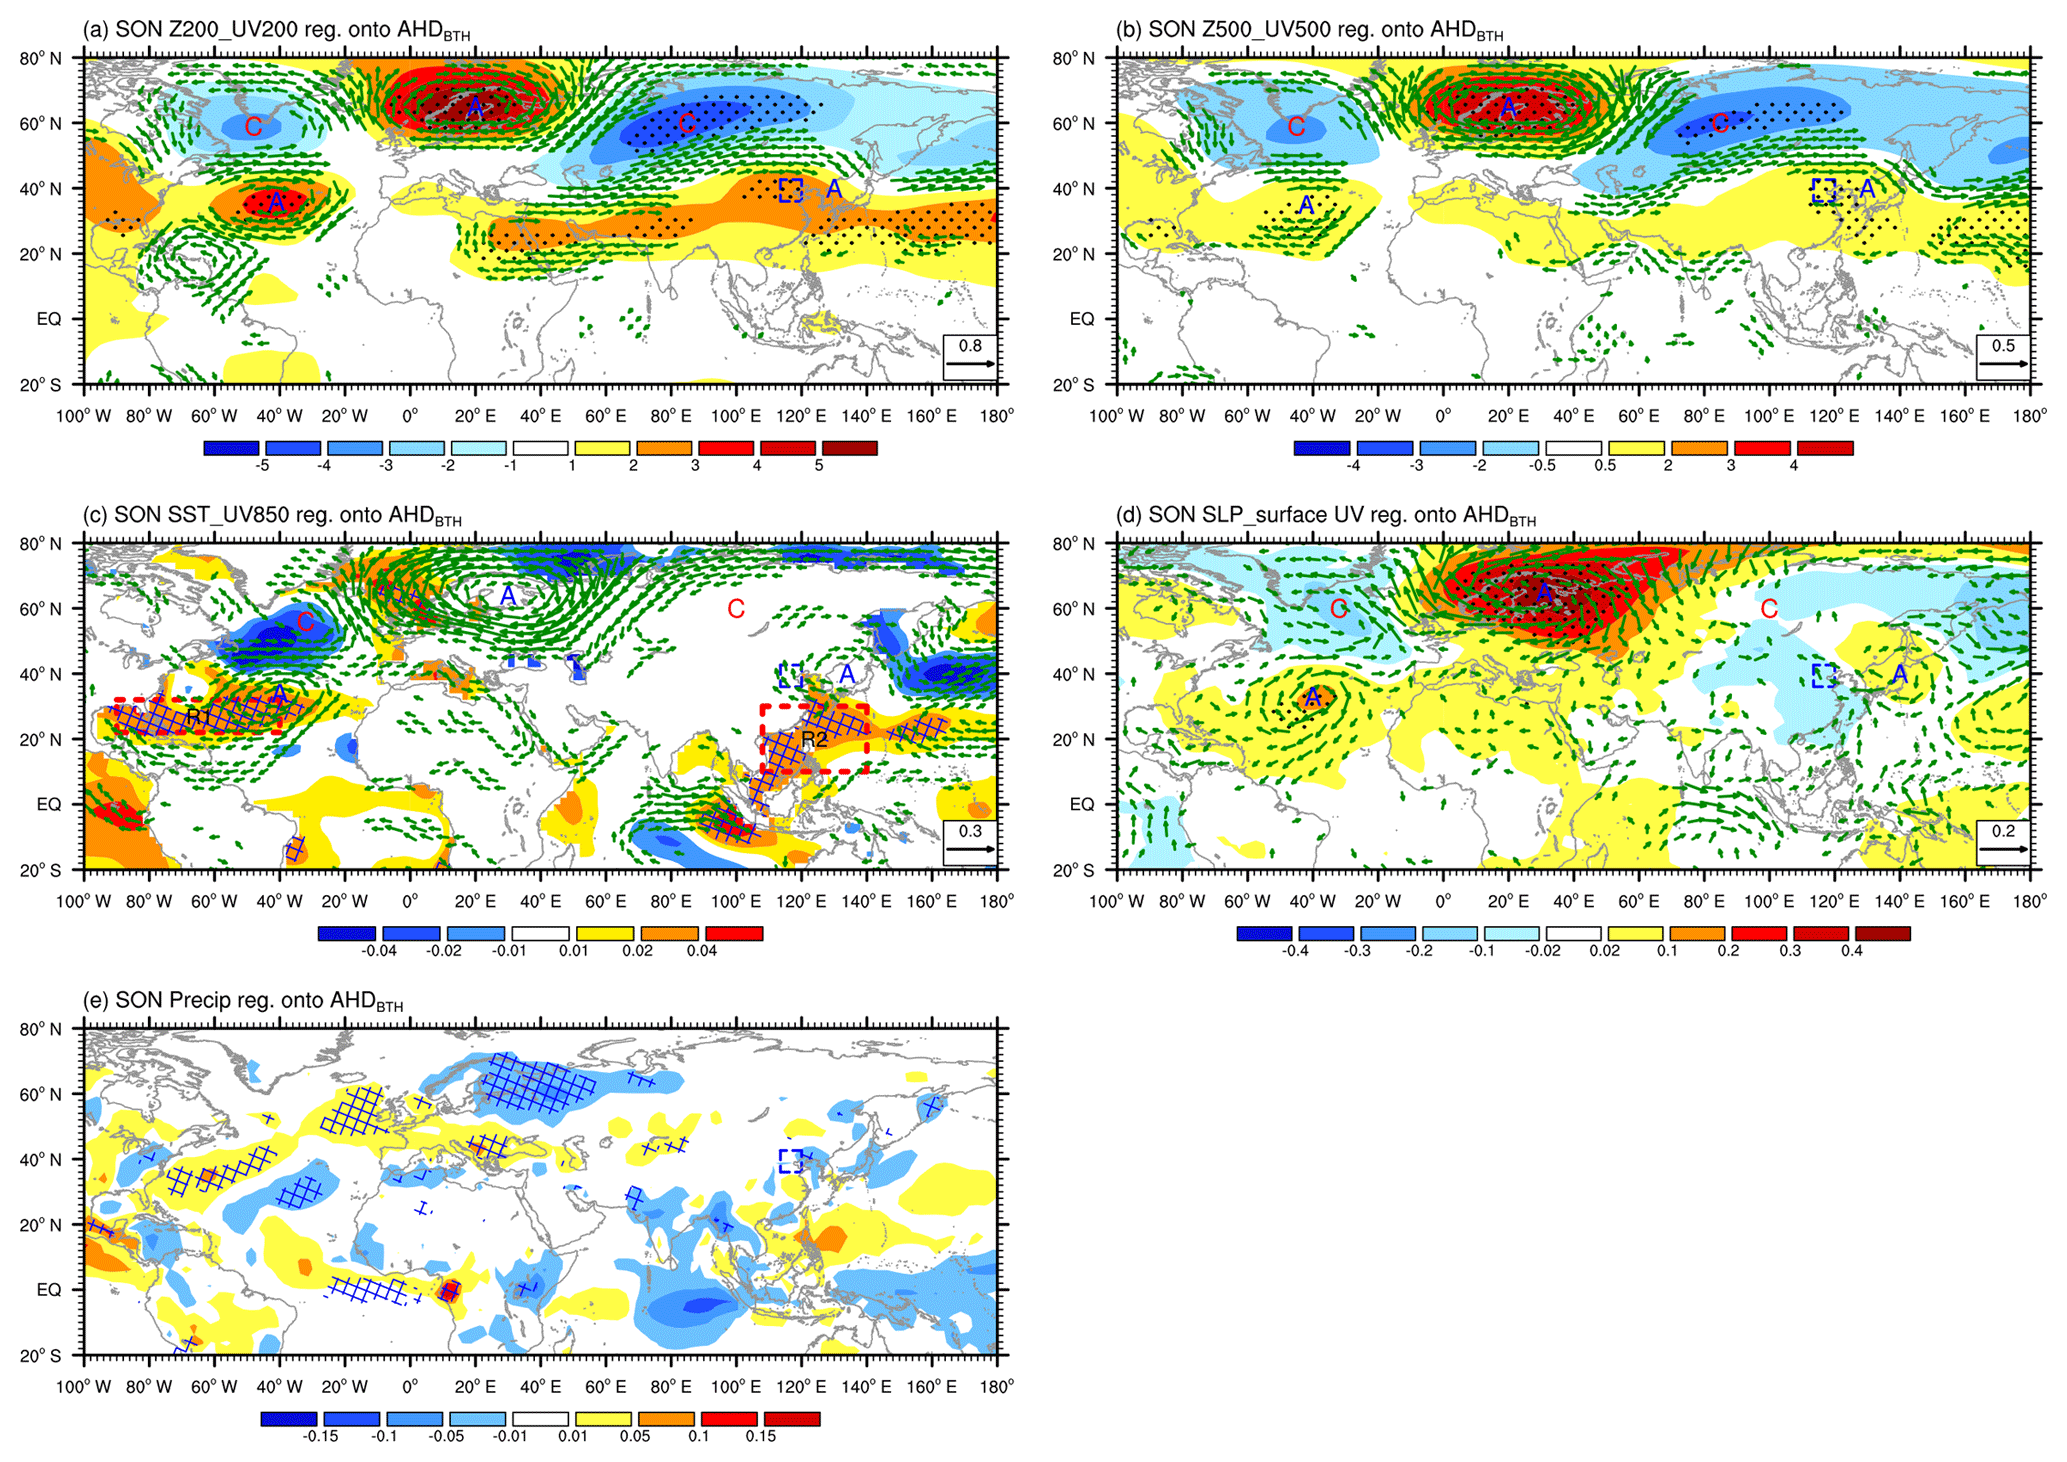
Figure 5Regressed anomalies of autumnal (a) 200 hPa geopotential height (Z200; shaded; gpm) and 200 hPa winds (UV200; vectors; m s−1), (b) Z500 (shaded; gpm) and 500 hPa winds (UV500; vectors; m s−1), (c) SST (shaded; ∘C) and UV850 (vectors; m s−1), (d) SLP (shaded; hPa) and surface winds (vectors; m s−1), and (e) precipitation (shaded; mm day−1), with respect to the interannual component of the AHDBTH. Regression coefficients that are significant at the 95 % (90 %) confidence level are stippled (crosshatched). In panels (a) and (b), only the wind vectors with statistical significance above the 90 % confidence level are shown. In panel (c), the two red dashed rectangles, labeled R1 and R2, are the key regions where SSTAs are significantly correlated with the interannual component of the AHDBTH; vectors with scales less than 0.05 m s−1 are omitted. In panel (d), vectors with scales less than 0.03 m s−1 are omitted. The blue dashed box delineates the research domain of the BTH region. The letters A and C represent the centers of anticyclonic and cyclonic anomalies, respectively.
Figure 5 shows the associated large-scale atmospheric circulation anomalies at different levels of the troposphere. In Fig. 5a–d, the most noticeable feature is that there is a planetary-scale, quasi-barotropic Rossby wave train emanating from the North Atlantic subtropical sector. In addition to an anticyclonic anomaly centered over the North Atlantic subtropics, this teleconnection pattern has another two pairs of anomalous cyclones (low pressure) and anticyclones (high pressure) stretching across Eurasia to Northeast Asia, i.e., a cyclonic anomaly centered over the ocean south of Greenland, an anticyclonic anomaly centered over Scandinavia, a cyclonic anomaly centered over the adjacent area of central Siberia, and an anticyclonic anomaly centered over the Sea of Japan (SJ). In general, based on the regressed atmospheric fields, the teleconnection has a much larger amplitude in the upper troposphere (Fig. 5a) than that in the mid-troposphere (Fig. 5b) and lower troposphere (Fig. 5c). Intriguingly, from the surface projection of the above quasi-barotropic teleconnection pattern (Fig. 5d), we can discern a positive phase of the North Atlantic Oscillation-like mode in connection with this pattern (Hurrell and Deser, 2009).
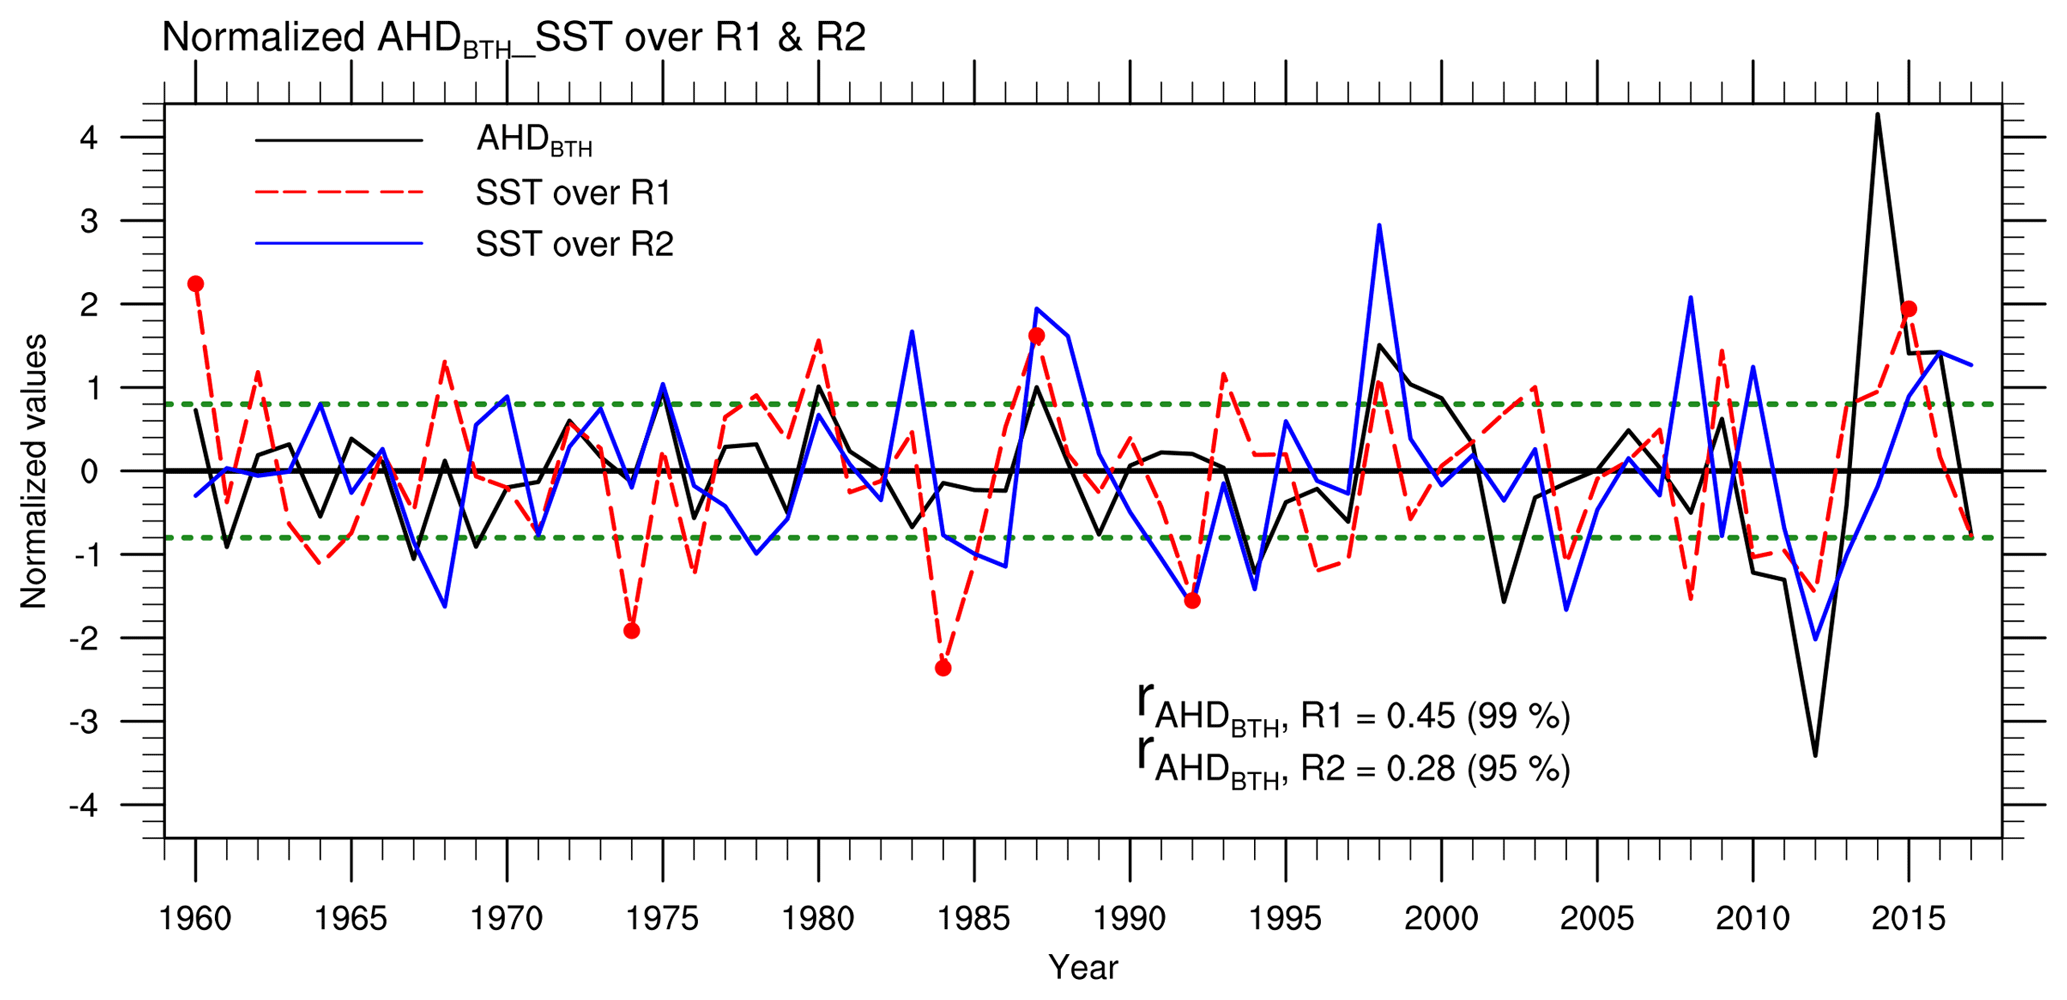
Figure 6Time series of the normalized interannual component of the AHDBTH (black line), along with the simultaneous SST over R1 (red line) and R2 (blue line) for the period 1960–2017. The horizontal dashed lines denote 0.8 of the standard deviation. The numerals labeled at the bottom represent the correlation coefficients (r) between the AHDBTH and simultaneous SST over R1 and R2, respectively. The upper and lower dots on the red line indicate the three highest and lowest years of SST over R1, respectively.
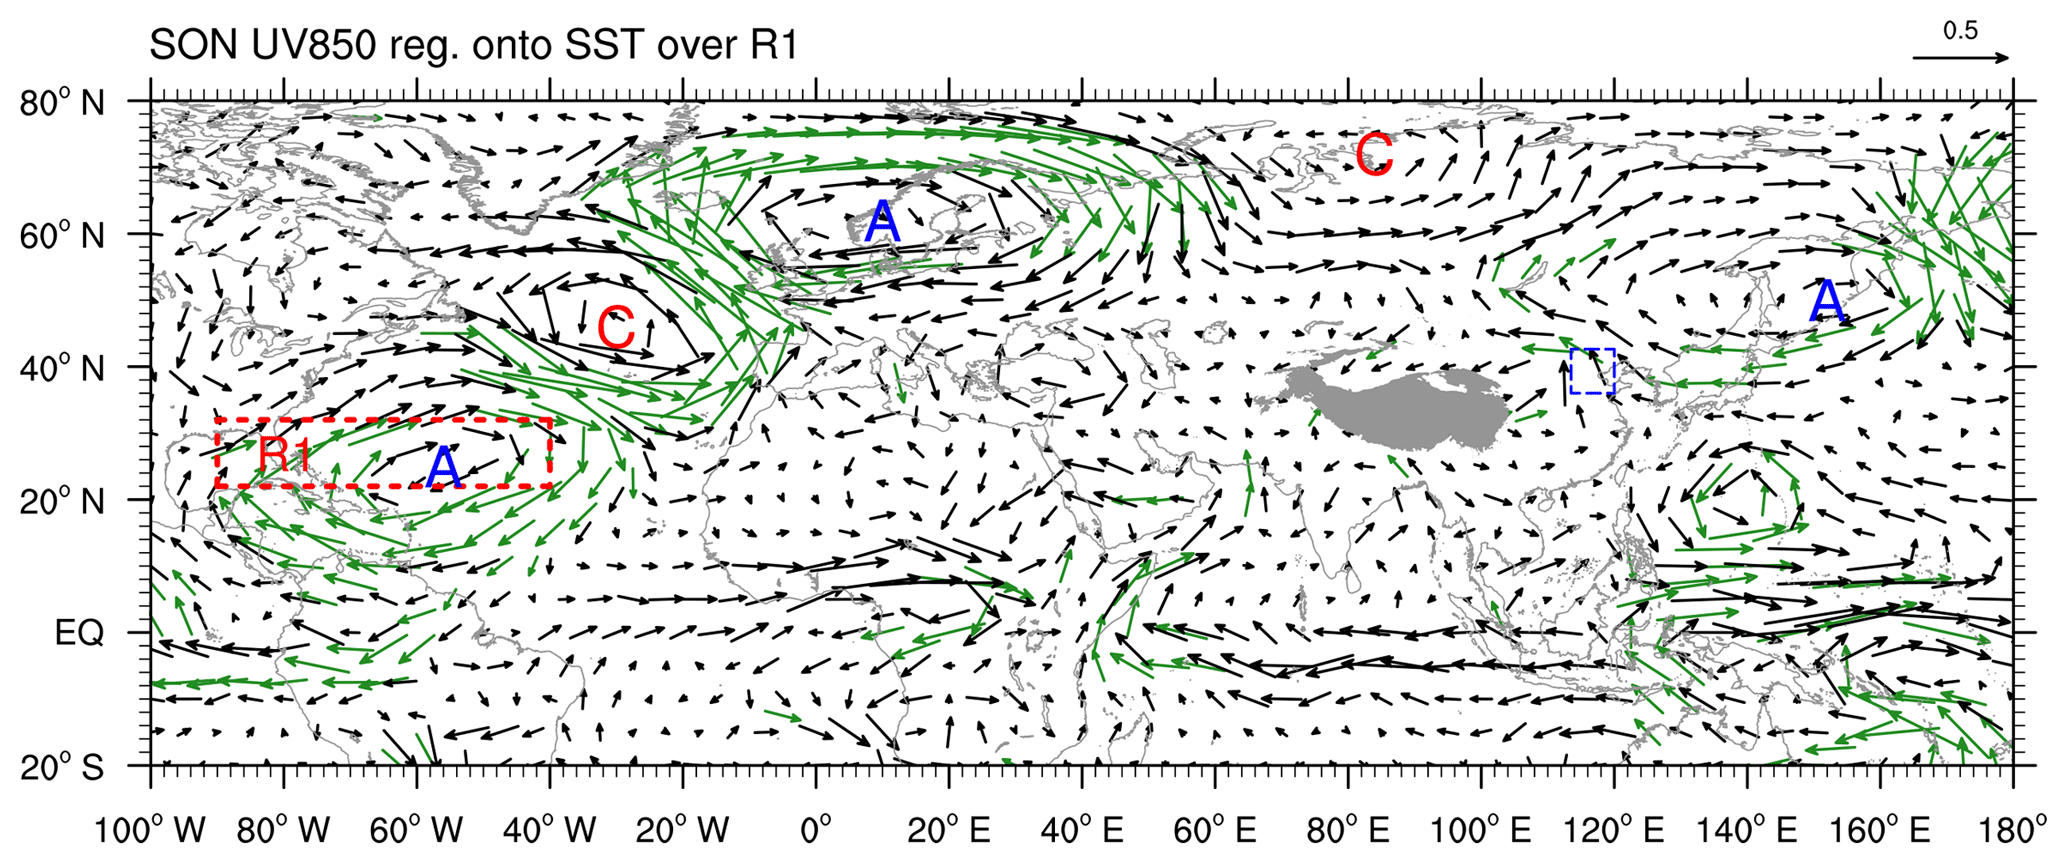
Figure 7Regressed anomalies of autumnal UV850 (vectors; m s−1) with respect to the simultaneous interannual component of the SST over R1. Green arrows represent the wind vectors with statistical significance above the 90 % confidence level. The red dashed rectangle labeled R1 is the key region where SSTAs are significantly correlated with the interannual component of the AHDBTH. The blue dashed box delineates the research domain of the BTH region. The gray shaded area denotes the Tibetan Plateau. The letters A and C represent the centers of anticyclonic and cyclonic anomalies, respectively.
Among all the height anomalies within the teleconnection, the anomalous quasi-barotropic Northeast Asian anticyclonic anomaly centered over the SJ (ASJ) plays a direct role in driving a higher AHDBTH. The related physical–meteorological causes are as follows: there are southerly and southeasterly anomalies along the western flank of the ASJ in the lower troposphere (Fig. 5c and d), manifesting the capability of suppressed atmospheric horizontal diffusion, and thus favoring a buildup of substantial local and nonlocal APs and warmer moisture over the BTH region (Yang et al., 2015, 2016) under the specific topographical forcing of the Taihang Mountains and Yan Mountains (Fig. 1). On the other hand, the significant positive pressure anomaly in the middle to upper parts of the ASJ (Fig. 5a and b) not only impedes the intrusion of cold air into the BTH region, but also facilitates consistent air subsidence over the BTH region and its surrounding areas (Fig. 4f), resulting in the decrease of the PBLH and increase of static stability (i.e., the dampened vertical dispersion of the atmosphere). Consequently, the meteorological conditions connected to a higher AHDBTH are adverse to the autumnal mean climate state (Fig. 3).
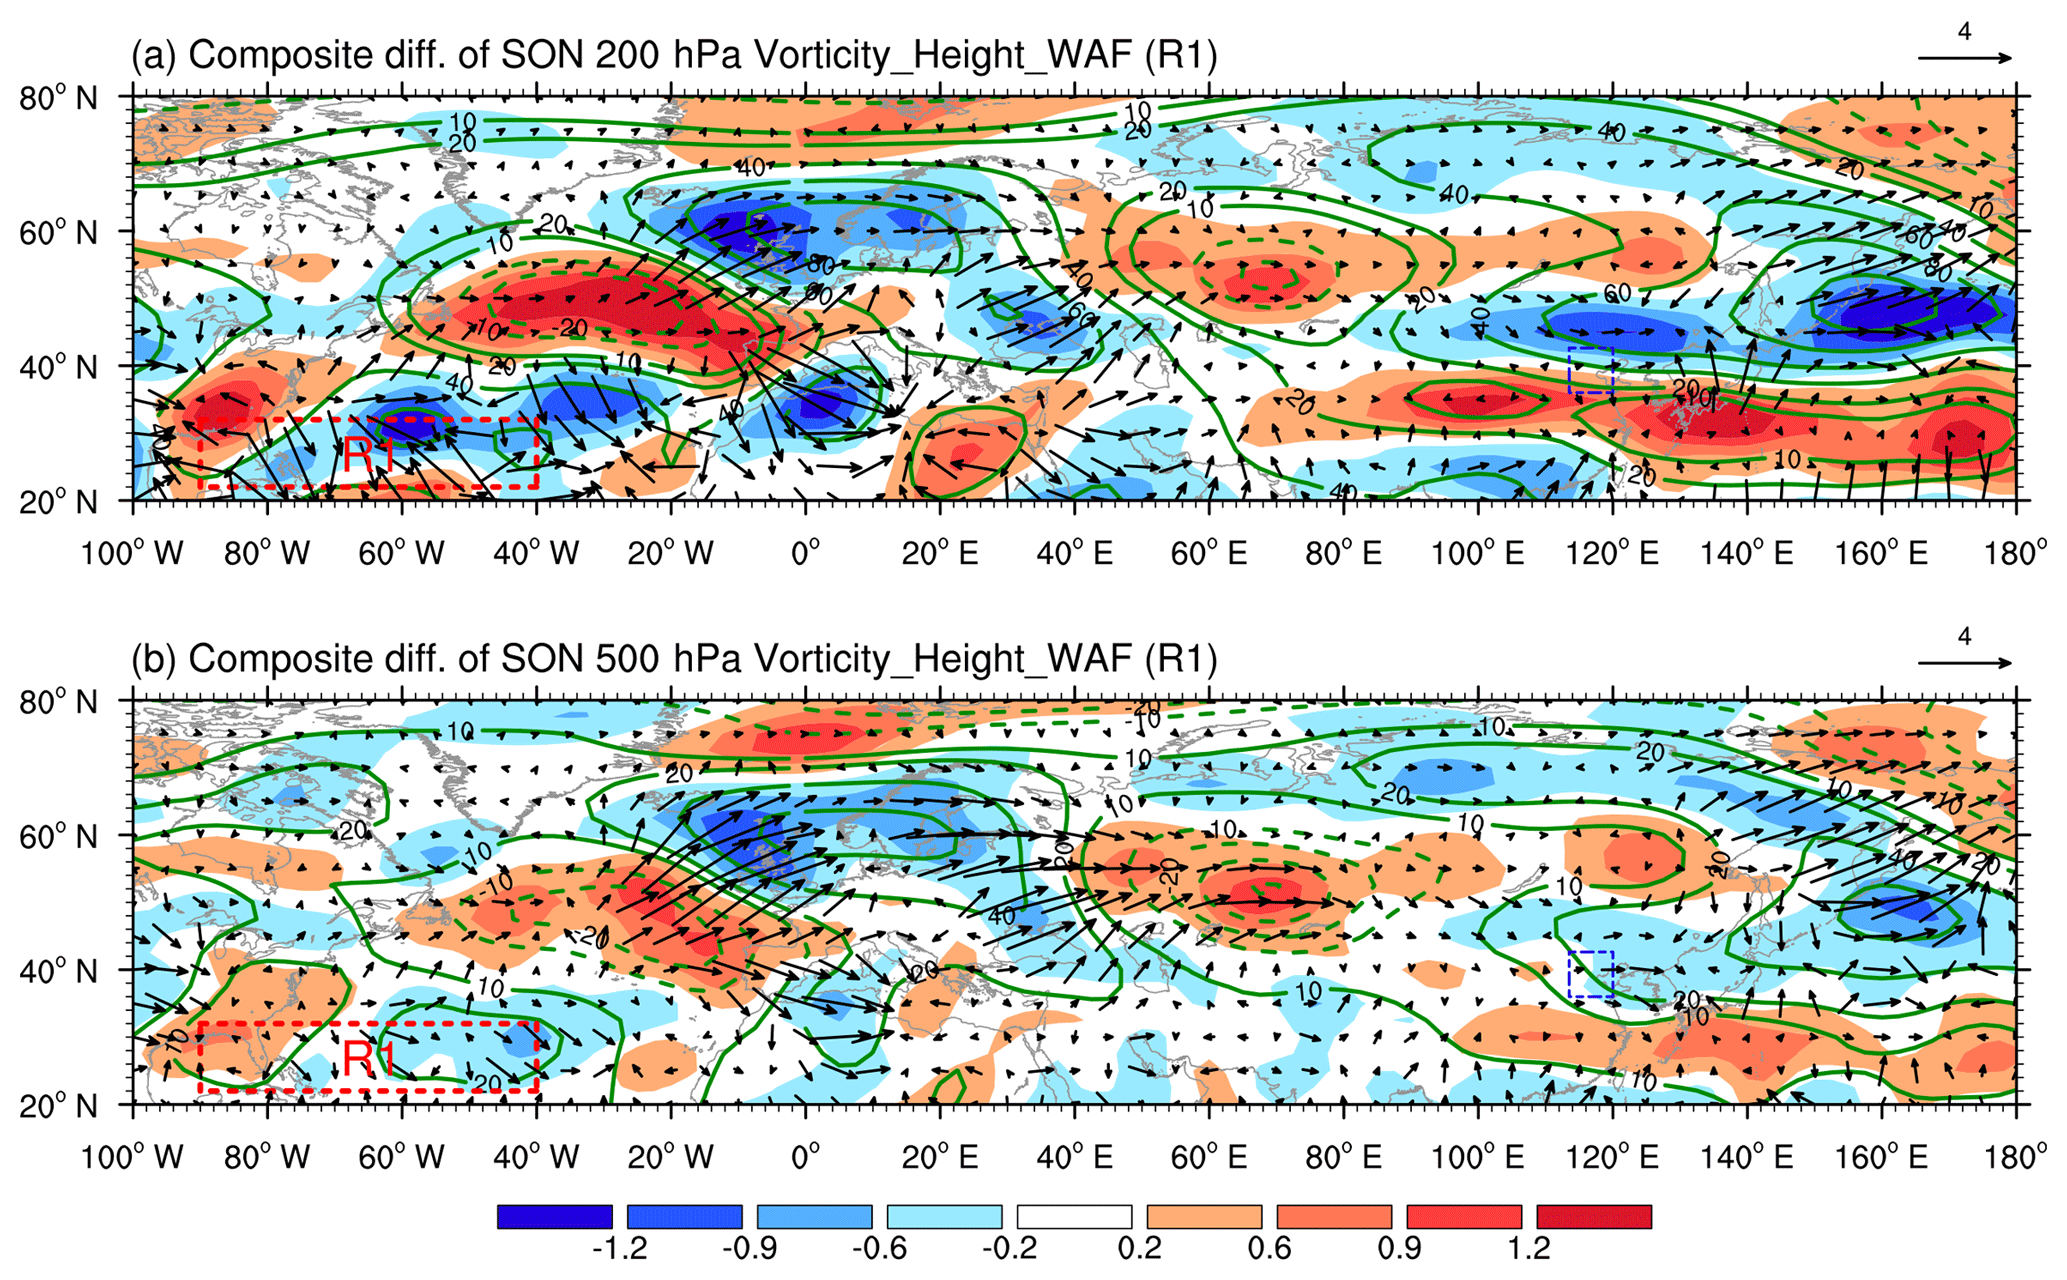
Figure 8The autumnal composite differences of (a) 200 and (b) 500 hPa WAF (vectors; m2 s−2), geopotential height (contours; gpm), and relative vorticity (shaded; 10−5 s−1) between the three highest and three lowest years of simultaneous SST over R1 (highest minus lowest), as shown in Fig. 6. The red dashed rectangle labeled R1 is the key region where SSTAs are significantly correlated with the interannual component of the AHDBTH. The blue dashed box delineates the research domain of the BTH region.

Figure 9Regressed anomalies of autumnal (a) UV850 (vectors; m s−1) and SST (shaded; ∘C) and (b) precipitation (shaded; mm day−1) with respect to the simultaneous interannual component of the SST over R2. In panel (a), green arrows represent the wind vectors with statistical significance above the 99 % confidence level, and vectors with scales less than 0.05 m s−1 are omitted. Regression coefficients that are significant at the 99 % confidence level are crosshatched. The dashed red rectangle labeled R2 is the key region where SSTAs are significantly correlated with the interannual component of the AHDBTH. The blue dashed box delineates the research domain of the BTH region. The gray shaded area denotes the Tibetan Plateau. The letter A (C) represents the center of the anticyclonic (cyclonic) anomaly.
To summarize, the ASJ and the associated subsidence can induce the capacity for suppressed local horizontal and vertical dispersion over the BTH region and its surrounding areas, as shown in the above-mentioned anomalous parameters (Fig. 4); and these parameters are further responsible for the accumulation and secondary formation and hygroscopic growth of APs (Jacob and Winner, 2009; Ding and Liu, 2014; Mu and Liao, 2014; Jia et al., 2015). As such, the haze pollution over the BTH region is readily established within a narrow space. Therefore, the question of how the above-normal AHDBTH is stimulated could plausibly be transferred into how the ASJ is developed and sustained. In fact, the ASJ and the associated air subsidence are modulated by remote SSTAs. We tackle the underlying mechanisms in the next section.
4.1 Observational diagnoses
Figure 5c shows that an above-normal AHDBTH is closely correlated with SST warming in two key regions: one is the North Atlantic subtropical sector (R1: 22–32∘ N, 90–40∘ W), and the other is the western North Pacific sector (R2: 10–30∘ N, 108–140∘ E), with its southern portion belonging to the Western Pacific Warm Pool (You et al., 2018). One may ask why we chose these two key SSTA regions. Firstly, the subtropical North Atlantic is the only region over the North Atlantic that highly correlated with the AHDBTH on the interannual timescale. Although the regression SSTA pattern over the North Atlantic looks like a tripole SST pattern which has profound impacts on Eurasian climate (e.g., Zuo et al., 2013), the relationship between AHDBTH and the simultaneous North Atlantic tripole (NAT) SST pattern is insignificant. The correlation coefficient between AHDBTH and the NAT SST index (Deser and Michael, 1997) is only 0.17. Therefore, we chose the middle oceanic region of the North Atlantic as the key region for AHDBTH. Secondly, the positive correlated SSTA over both the R1 and R2 region can induce a positive rainfall anomaly (diabatic heating; Figs. 5e, 9b), and the SSTAs should play an active role in local air–sea interaction and in turn influence the large-scale circulation. Therefore, we chose the R1 and R2 as the key SSTA regions from statistical diagnosis and on a physical basis. Figure 6 further depicts that the SON SSTs over both R1 and R2 are positively correlated with AHDBTH, and the TCC between the AHDBTH and SON SST over R1 (R2) is 0.45 (0.28), exceeding the 99 % (95 %) confidence level. By virtue of the above analyses, we speculate that the SST over R1 may play a more important role than that over R2 in driving a higher AHDBTH. Note, however, that when the SON SSTs over R1 and R2 are both obviously elevated, the AHDBTH is more likely to be higher than normal, such as in 1980, 1987, and 2015. As indicated above, the AHDBTH is closely correlated with the ASJ and the associated air subsidence, which allows us to speculate that the positive SSTAs over R1 and R2 might drive the interannual variability of AHDBTH by modulating the intensity of the ASJ and associated subsidence. To validate this hypothesis, we firstly examine the pathway of SSTAs over R1 in driving AHDBTH.
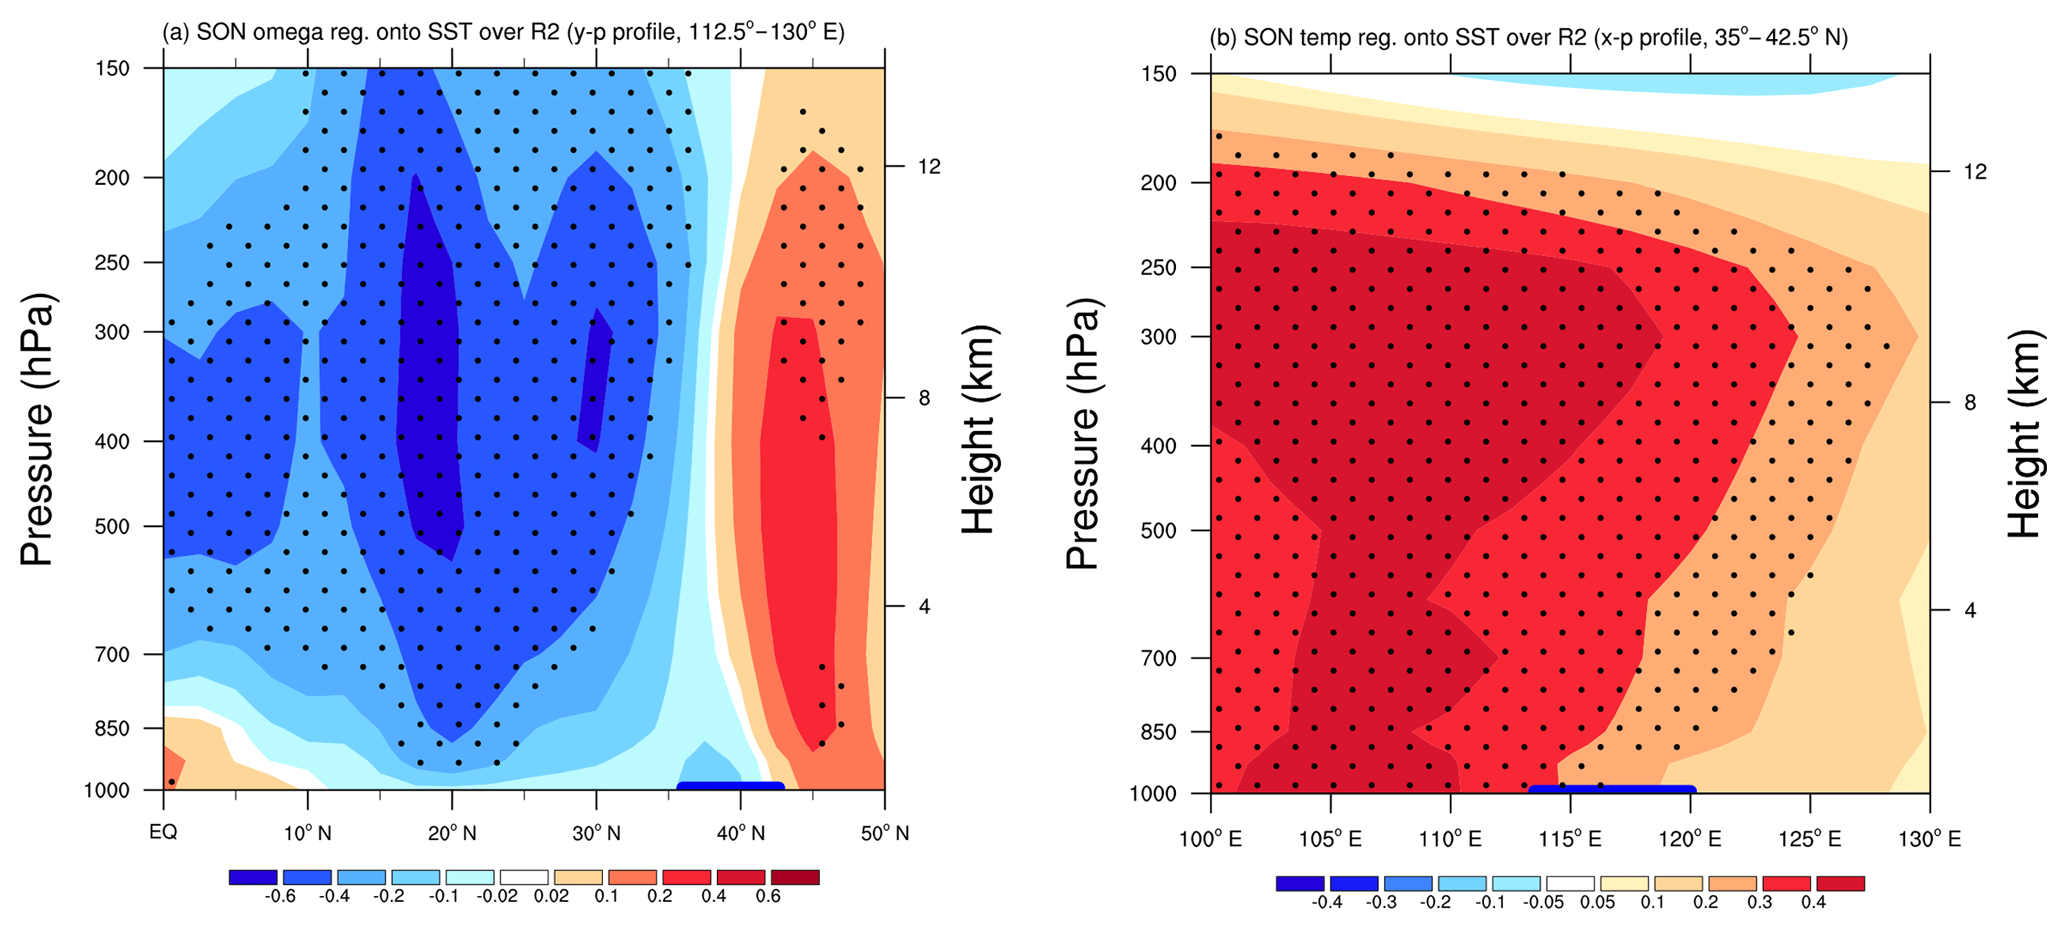
Figure 10(a) Latitude–height cross section (112.5–130∘ E) of the autumnal omega (shaded; 10−2 Pa s−1) and (b) longitude–height section (35–42.5∘ N) of the autumnal air temperature (shaded; ∘C) anomalies regressed onto the simultaneous interannual component of the SST over R2. Regression coefficients that are significant at the 90 % confidence level are stippled. The thick blue horizontal bars superimposed onto the abscissa of panels (a) and (b) indicate the latitudes and longitudes of the BTH region, respectively.

Figure 11The response of anomalous (a) Z200 (shaded; 10 gpm) and UV200 (vectors; m s−1) and (b) Z500 (shaded; 10 gpm) and UV500 (vectors; m s−1) in H_NAS. The red contours indicate the imposed idealized heating. The blue dashed box delineates the research domain of the BTH region. The letters A and C represent the centers of anticyclonic and cyclonic anomalies, respectively.
Figure 5c suggests that the SST warming in R1 may induce larger-area low-level easterly anomalies to the east, leading to anticyclonic wind shear over this region. In such a scenario, an anticyclonic anomaly is induced (Fig. 5c), with its center to the northeast of R1. Along the western flank of this anticyclonic anomaly, warm and moist airflows move northwards. When these warm and moist airflows meet cold air mass in the areas to the north of R1, enhanced precipitation is thus generated (Fig. 5e). Meanwhile, the resultant enhanced rainfall condensation heating induces a cyclonic anomaly to the north, thereby exciting the other two pairs of the aforementioned teleconnection pattern along the westerly jet, as demonstrated by the Rossby wave train induced by SST warming in R1 (Figs. 7 and 8). Specifically, from the regressed SON UV850 (Fig. 7), we can see that the SST warming in R1 can indeed induce a significant low-level teleconnection pattern arising from the North Atlantic subtropics, bearing a close resemblance to that in Fig. 5c; and to the north of R1, where the rainfall condensation heating is triggered, the corresponding WAF exhibits a distinctive arc-shaped trajectory, perturbing the other two pairs of cyclones and anticyclones of the teleconnection (Fig. 8). This teleconnection extends from the North Atlantic towards Scandinavia, goes through the Eurasia, and arrives in Northeast Asia. Therefore, by means of this trajectory, Rossby wave energy in the middle (Fig. 8b) and upper (Fig. 8a) troposphere may propagate southeastwards into the ASJ and its surrounding region, favoring the formation and sustainability of the ASJ and the associated air subsidence. In this context, the associated meteorological parameters (Fig. S1 in the Supplement), which resemble those tied to a higher AHDBTH (Fig. 4), might increase the likelihood of SON haze pollution over the BTH region. Again, this induced teleconnection is quasi-barotropic in structure, with its magnitude larger in the upper troposphere (Fig. 8a), which is consistent with that in Fig. 5a.
As for the role of R2 SST warming (Fig. 9a), we find that, corresponding to the SSTAs over R2, there is a cyclonic anomaly to the west of R2. In addition, substantial SSTA-induced low-level easterly anomalies appear to the southeast of R2; meanwhile, a large-scale anticyclonic anomaly to the northeast is triggered, with its center situated over the North Pacific. In such a scenario, R2 is thoroughly controlled by significant warm and humid airflows transported from the eastern flank of the cyclonic anomaly and the western flank of the anticyclonic anomaly, respectively (Fig. 9a). Furthermore, the airflow convergence primarily occurs over the southwestern portion of R2, where the strongly significant and positive rainfall anomaly is triggered (Fig. 9b). Thus, the enhanced significant rainfall heating may greatly intensify the ascending motion over R2 and the adjacent region, resulting in subsidence over the BTH region and Northeast Asia via an anomalous local meridional cell (Fig. 10a). As such, the BTH region is dominated by significant warm temperatures in the middle and upper troposphere (Fig. 10b). Accordingly, the ASJ and the downward motion, as well as the low-level stability over the BTH region, are well maintained and reinforced. Under such circumstances, the vertical transport of APs is restricted (Zhang et al., 2014; Pei et al., 2018) and the near-surface winds are weakened (Q. Li et al., 2016). The parameters associated with SST warming in R2 (Fig. S2) also support the formation of haze weather over the BTH region.
4.2 Numerical model simulations
Two experiments were conducted to further validate the above-mentioned two pathways of how SSTAs drive the variation of AHDBTH. The first experiment (H_NAS) simulated the responses to the heating induced by SSTAs over R1 (Fig. 11). H_NAS was imposed with a specified heating centered over the region to the north of R1 (center: 37.67∘ N, 64.69∘ W) that largely matched with the SON positive rainfall anomaly as shown in Fig. 5e. The second experiment (H_WNP) mimicked the responses to the prescribed heating over the neighboring areas of R2 (center: 9.77∘ N, 109.69∘ E; Fig. 12), where the corresponding regressed precipitation rate was the most significant, as exhibited in Fig. 9b. The heating had a cosine-squared profile in an elliptical region in the horizontal direction. The maximum heating, with an amplitude of 1 K day−1, was set at 300 hPa.
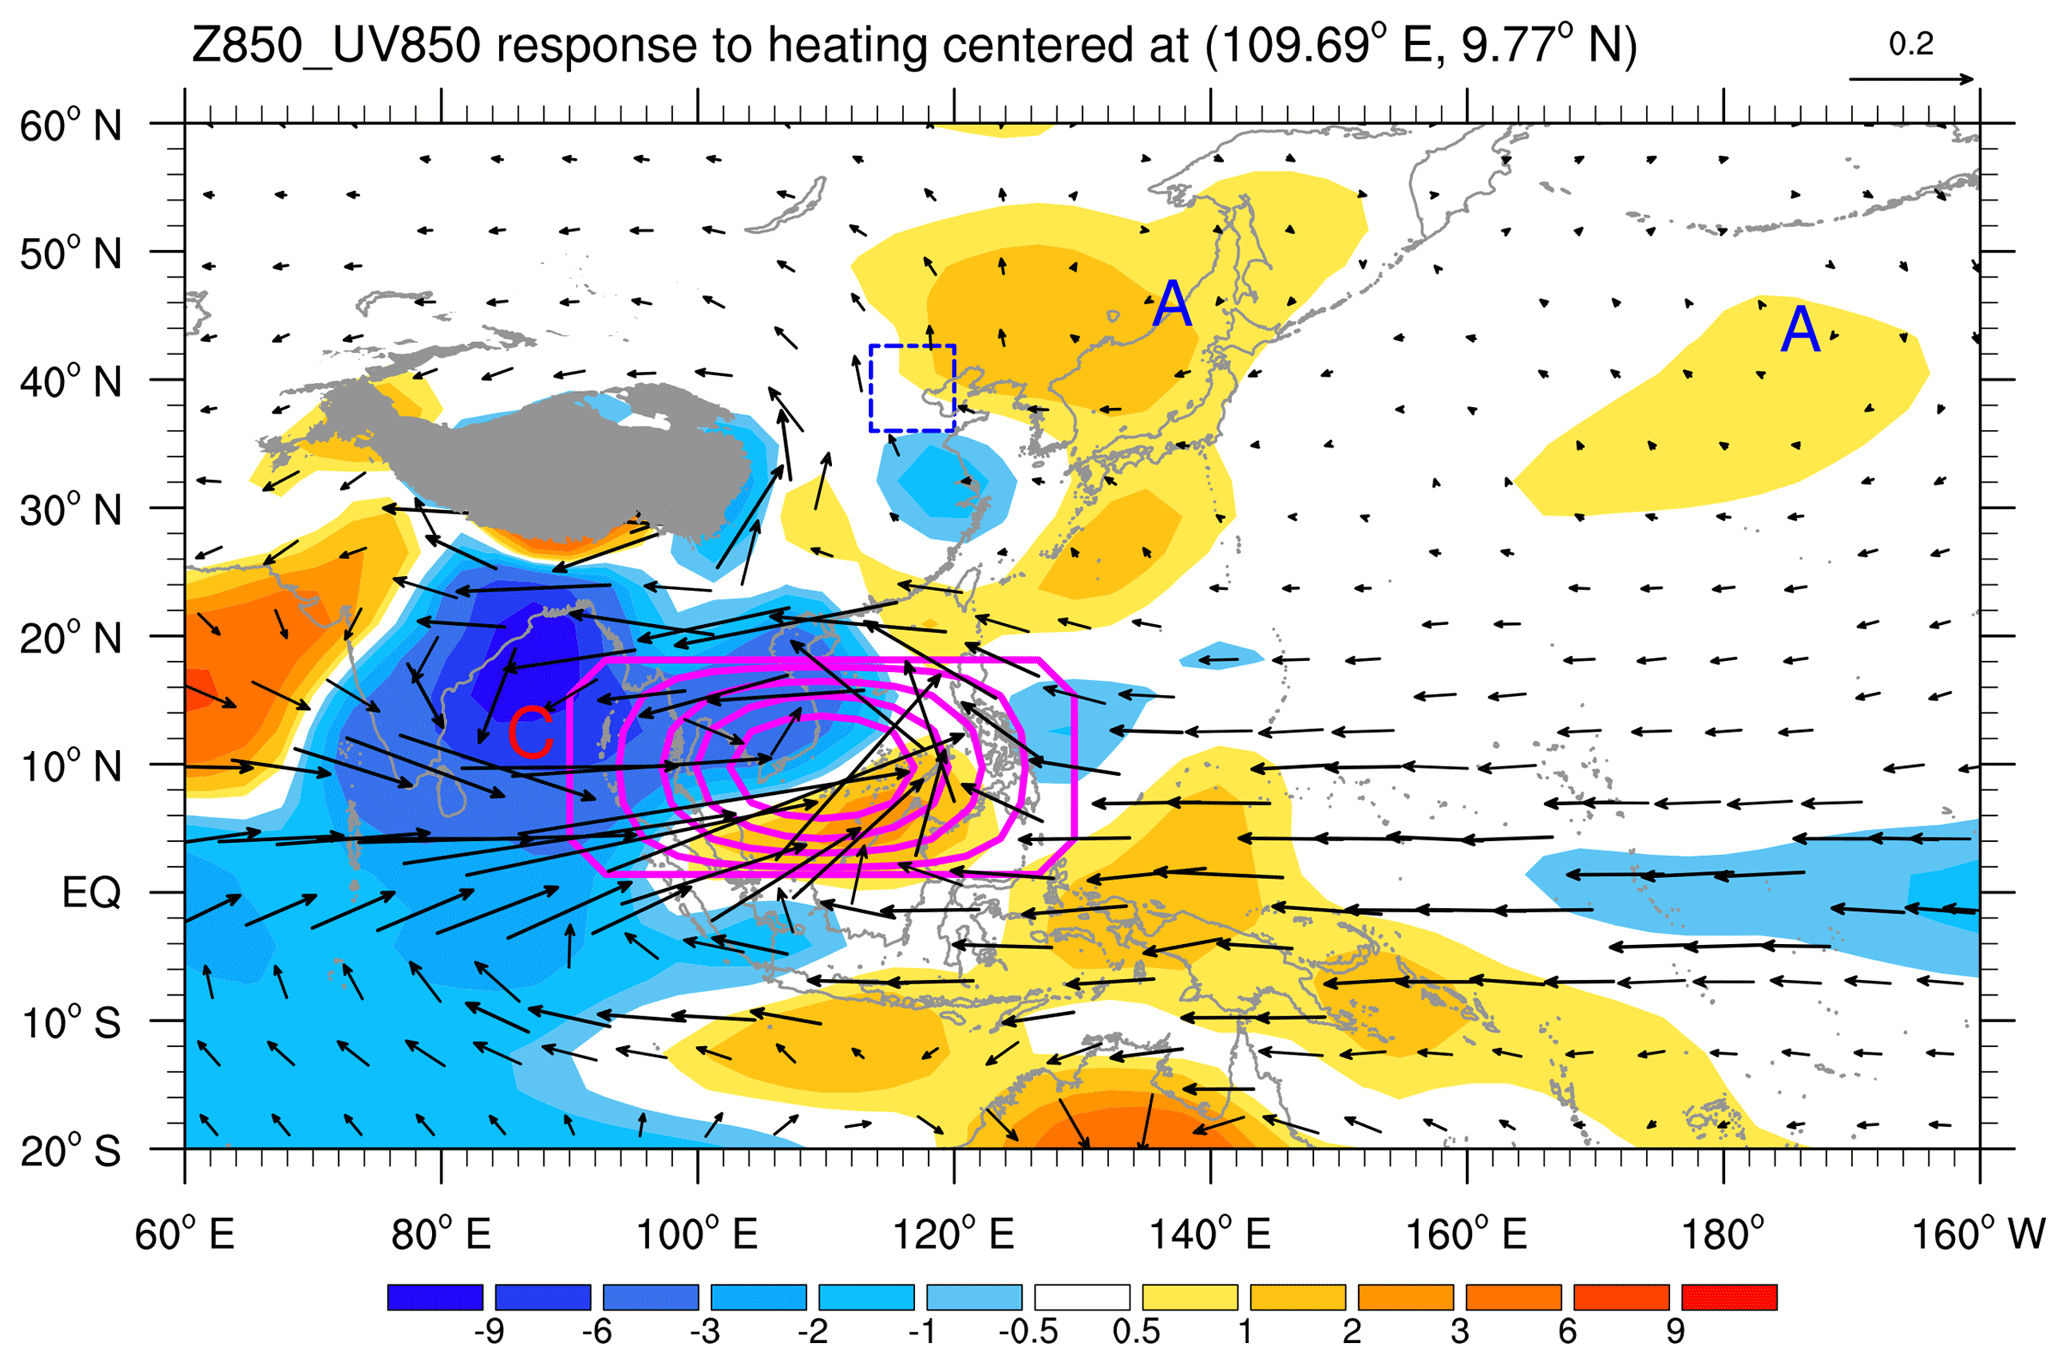
Figure 12The response of Z850 (shaded; 10 gpm) and UV850 (vectors; m s−1) in H_WNP. The magenta contours indicate the imposed idealized heating. The blue dashed box delineates the research domain of the BTH region. The gray shaded area denotes the Tibetan Plateau. The letter A (C) represents the center of the anticyclonic (cyclonic) anomaly.

Figure 13Schematic diagram encapsulating the SSTA-induced (warming in R1 and R2) physical mechanisms and pathways connected to above-normal AHDBTH years on the interannual timescale. Anomalous quasi-barotropic anticyclones (A) and cyclones (C) are indicated by blue and red elliptical cycles with arrows, respectively, denoting large-scale Rossby wave train triggered by the heating to the north of R1. Green arrows depict the key horizontal low-level (850 hPa) airflows. The red, azure, and green arrows together exhibit the vertical overturning circulation tied to the SST warming in R2. The left-hand (right-hand) side of the pattern resembling a cloud, with violet short dashed lines, presents the significant anomalous precipitation induced by SSTAs over R1 (R2). The blue dashed box delineates the research domain of the BTH region.
Figure 11 presents the 200 and 500 hPa geopotential height and wind responses to the specified heating over the North Atlantic subtropical region. As anticipated, the equilibrium state (mean output from day 40 to day 60) of the Z200 (Fig. 11a) and Z500 (Fig. 11b) responses to the heating resembles the aforementioned teleconnection (Fig. 5a and b), and the simulated response of the Z200 anomalies is generally larger than its counterpart at 500 hPa (Fig. 11b), which concurs with the observational evidence. Further, a similar low-level portion of the ASJ could also be simulated (figure not shown). As a result, a strengthened ASJ is induced.
Figure 12 delineates the 850 hPa geopotential height (Z850) and UV850 responses to the specified heating centered at 9.77∘ N, 109.69∘ E. Although there are some differences in spatial distribution compared with the observations, the well-organized cyclonic anomaly to the west of the heating center and the anticyclonic anomaly over Northeast Asia can be well simulated (Fig. 12). Meanwhile, the middle to upper parts of the ASJ and the coherent tropospheric subsidence over the BTH region and the Northeast Asian anticyclonic anomaly were also simulated well (figure not shown).
To sum up, from observational diagnoses and numerical simulations, we can conclude that there are two distinct pathways regarding how remote SSTAs impact the formation and maintenance of the ASJ and the associated air subsidence. One pathway operates via a heating-induced large-scale teleconnection pattern arising from SST warming in R1, and the other is connected to an anomalous local meridional cell triggered by heating-reinforced ascending motion via local SST warming over R2.
Motivated by a lack of in-depth understanding with respect to the interannual variations of the AHDBTH, in the present study we explored the related climate anomalies (localized meteorological parameters and large-scale atmospheric and oceanic anomalies) tied to the AHDBTH. We have substantiated that an above-normal AHDBTH is closely correlated with the simultaneous SST warming in two key regions (R1 over the North Atlantic subtropical sector and R2 over the western North Pacific sector), and once the SON SST warming in both R1 and R2 is remarkably significant, their joint climate impacts can greatly enhance the likelihood of an above-normal AHDBTH.
Potential mechanisms associated with an above-normal AHDBTH have been proposed through further investigations. Since the ASJ and the associated subsidence over the ASJ and the surrounding region can yield meteorological circumstances conducive to enhancing the likelihood of haze pollution in the BTH region, the issue of an above-normal AHDBTH can be reasonably transferred into uncovering how the SON ASJ and associated air subsidence are developed and sustained. We found that there are two different pathways. First, SST warming in R1 can induce a downstream Rossby wave teleconnection, and the associated Rossby wave energy can propagate into Northeast Asia through an arc-shaped trajectory, developing and strengthening the ASJ and the associated subsidence over the BTH region. The other pathway, however, operates through localized heating-reinforced ascending motion over R2, also resulting in subsidence over the BTH region via an anomalous local meridional cell.
AGCM simulations supported our hypothesis. With prescribed heating over the region to the north of R1, a quite similar teleconnection – starting from the North Atlantic subtropics – was triggered. If we imposed an idealized heating over the adjacent R2, where the corresponding precipitation rate was the most significant, the significant low-level convergence around the heated areas was simulated, inducing the ASJ-resembled circulation to the north and the subsidence over the BTH region. However, because the model we used is an intermediate anomaly AGCM, and the heating prescribed in the model is idealized, the simulated patterns were slightly spatially different to those observed. Although the model cannot reproduce the geopotential height and wind anomalies perfectly, it can still support our proposed mechanisms. As a summary, a schematic illustration (Fig. 13) of the occurrence of a higher AHDBTH is provided, which encapsulates the major characteristics of the two pathways of how remote SSTAs over R1 and R2 drive the AHDBTH, respectively.
From the perspective of seasonal prediction, among all the previous individual months of boreal summer (June–July–August), the SON SST in R1 (R2) was most significantly correlated with the August SST in R1 (R2) on the interannual timescale, with a TCC of 0.35 (0.61) that exceeded the 95 % (99 %) confidence level. This suggests that, when the August SST over R1 (R2) is higher, the subsequent SON SST over R1 (R2) is more likely to become warmer. As such, the previous August SSTA over R1 (R2) could serve as a possible precursor for the seasonal prediction of the AHDBTH.
In this study, we solely emphasize the potential impacts of SSTAs on the interannual variations of the AHDBTH. It should be noted that other external forcings, such as the Arctic sea ice (e.g., Wang et al., 2015), Eurasian snowpack, thermal conditions on the Tibetan Plateau (e.g., Xu et al., 2016), and soil moisture, may also exert profound impacts on haze pollution over China. Studying the mechanisms tied to these forcings may enhance the seasonal prediction skill for the AHDBTH. Meanwhile, in this study, we only focus on the variability of AHDBTH on the interannual timescale. Is the proposed mechanism of AHDBTH still at play on the intraseasonal timescale? Is it possible to make an extended-range forecast of the occurrence of haze days? These topics are of both scientific and practical importance and merit further exploration.
The atmospheric data and land-surface data are available from the NCEP/NCAR data archive at https://www.esrl.noaa.gov/psd/data/gridded/data.ncep (NCEP/NCAR, 2018). The SST data were downloaded from https://www.esrl.noaa.gov/psd/data/gridded/data.noaa (NOAA, 2018a). The precipitation data were downloaded from https://www.esrl.noaa.gov/psd/data/gridded/data (NOAA, 2018b). The monthly PBLH data are available on the ERA-Interim website at https://www.ecmwf.int/en/research/climate-reanalysis/ (ERA-Interim, 2018). The ground observations are from the National Meteorological Information Center of China (http://data.cma.cn/; CMA, 2018).
The supplement related to this article is available online at: https://doi.org/10.5194/acp-19-1521-2019-supplement.
The authors declare that they have no conflict of interest.
JW analyzed the observational data. ZZ and JW designed the numerical experiments. JW and ZZ wrote the manuscript. LQ, QZ, JH, and JXW were involved in the scientific interpretation and discussion.
This work was supported by the National Key Research and Development
Program of China (grant 2018YFC1505905) and the National Natural Science Foundation of China (grant 41605035).
Edited by: Stefano Galmarini
Reviewed by: two anonymous referees
Cai, W. J., Li, K., Liao, H., Wang, H. J., and Wu, L. X.: Weather conditions conducive to Beijing severe haze more frequent under climate change, Nat. Clim. Change, 7, 257–262, https://doi.org/10.1038/nclimate3249, 2017.
Cao, J. J., Lee, S. C., Chow, J. C., Watson, J. G., Ho, K. F., Zhang, R. J., Jin, Z. D., Shen, Z. X., Chen, G. C., Kang, Y. M., Zou, S. C., Zhang, L. Z., Qi, S. H., Dai, M. H., Cheng, Y., and Hu, K.: Spatial and seasonal distributions of carbonaceous aerosols over China, J. Geophys. Res.-Atmos., 112, D22S11, 10.1029/2006JD008205, 2007.
Chameides, W. L., Yu, H., Liu, S. C., Bergin, M., Zhou, X., Mearns, L., Wang, G., Kiang, C. S., Saylor, R. D., Luo, C., Huang, Y., Steiner, A., and Giorgi, F.: Case study of the effects of atmospheric aerosols and regional haze on agriculture: An opportunity to enhance crop yields in China through emission controls?, P. Natl. Acad. Sci. USA, 96, 13626–13633, https://doi.org/10.1073/pnas.96.24.13626, 1999.
Charlson, R. J., Schwartz, S. E., Hales, J. M., Cess, R. D., Coakley Jr, J. A., Hansen, J. E., and Hofmann, D. J.: Climate forcing by anthropogenic aerosols, Science, 255, 423–430, https://doi.org/10.1126/science.255.5043.423, 1992.
Chen, H. P. and Wang, H. J.: Haze Days in North China and the associated atmospheric circulations based on daily visibility data from 1960 to 2012, J. Geophys. Res.-Atmos., 120, 5895–5909, https://doi.org/10.1002/2015JD023225, 2015.
Chen, J., Zhao, C. S., Ma, N., Liu, P. F., Göbel, T., Hallbauer, E., Deng, Z. Z., Ran, L., Xu, W. Y., Liang, Z., Liu, H. J., Yan, P., Zhou, X. J., and Wiedensohler, A.: A parameterization of low visibilities for hazy days in the North China Plain, Atmos. Chem. Phys., 12, 4935–4950, https://doi.org/10.5194/acp-12-4935-2012, 2012.
Chen, M. Y., Xie, P. P., Janowiak, J. E., and Arkin, P. A.: Global land precipitation: A 50-yr monthly analysis based on gauge observations, J. Hydrometeorol., 3, 249–266, https://doi.org/10.1175/1525-7541(2002)003<0249:glpaym>2.0.co;2, 2002.
Chen, Y. N., Zhu, Z. W., Luo, L., and Zhang, J. W.: Severe haze in Hangzhou in winter 2013/14 and associated meteorological anomalies, Dynam. Atmos. Oceans, 81, 73–83, https://doi.org/10.1016/j.dynatmoce.2018.01.002, 2018.
Chen, Y. Y., Ebenstein, A., Greenstone, M., and Li, H. B.: Evidence on the impact of sustained exposure to air pollution on life expectancy from China's Huai River policy, P. Natl. Acad. Sci. USA, 110, 12936–12941, https://doi.org/10.1073/pnas.1300018110, 2013.
Chen, Z., Xie, X., Cai, J., Chen, D., Gao, B., He, B., Cheng, N., and Xu, B.: Understanding meteorological influences on PM2.5 concentrations across China: a temporal and spatial perspective, Atmos. Chem. Phys., 18, 5343–5358, https://doi.org/10.5194/acp-18-5343-2018, 2018.
Chung, C. E., Ramanathan, V., and Kiehl, J. T.: Effects of the South Asian absorbing haze on the Northeast monsoon and surface–air heat exchange, J. Climate, 15, 2462–2476, https://doi.org/10.1175/1520-0442(2002)015<2462:EOTSAA>2.0.CO;2, 2002.
CMA: China ground observation data sets, available at: http://data.cma.cn/, last access: 10 January 2018 (in Chinese).
Dee, D. P., Uppala, S. M., Simmons, A. J., Berrisford, P., Poli, P., Kobayashi, S., Andrae, U., Balmaseda, M. A., Balsamo, G., Bauer, P., Bechtold, P., Beljaars, A. C. M., van de Berg, L., Bidlot, J., Bormann, N., Delsol, C., Dragani, R., Fuentes, M., Geer, A. J., Haimberger, L., Healy, S. B., Hersbach, H., Hólm, E. V., Isaksen, L., Kållberg, P., Köhler, M., Matricardi, M., McNally, A. P., Monge-Sanz, B. M., Morcrette, J. J., Park, B. K., Peubey, C., de Rosnay, P., Tavolato, C., Thépaut, J. N., and Vitart, F.: The ERA-Interim reanalysis: configuration and performance of the data assimilation system, Q. J. Roy. Meteor. Soc., 137, 553–597, https://doi.org/10.1002/qj.828, 2011.
Deser, C. and Michael S. T.: Atmosphere-ocean interaction on weekly timescales in the North Atlantic and Pacific, J. Climate, 10, 393–408, 1997.
Ding, Y. H. and Liu, Y. J.: Analysis of long-term variations of fog and haze in China in recent 50 years and their relations with atmospheric humidity, Sci. China Earth Sci., 57, 36–46, https://doi.org/10.1007/s11430-013-4792-1, 2014.
Ding, Y. H., Wu, P., Liu, Y. J., and Song, Y. F.: Environmental and dynamic conditions for the occurrence of persistent haze events in North China, Engineering, 3, 266–271, https://doi.org/10.1016/J.ENG.2017.01.009, 2017.
ERA-Interim: PBLH data sets, available at: https://www.ecmwf.int/en/research/climate-reanalysis/era-interim, last access: 10 January 2018.
Gao, H. and Li, X.: Influences of El Nino Southern Oscillation events on haze frequency in eastern China during boreal winters, Int. J. Climatol., 35, 2682–2688, https://doi.org/10.1002/joc.4133, 2015.
Gao, Y. and Chen, D.: A dark October in Beijing 2016, Atmos. Oceanic Sci. Lett., 10, 206–213, https://doi.org/10.1080/16742834.2017.1293473, 2017.
Guo, J. P., Zhang, X. Y., Wu, Y. R., Zhaxi, Y. Z., Che, H. Z., La, B., Wang, W., and Li, X. W.: Spatio-temporal variation trends of satellite-based aerosol optical depth in China during 1980–2008, Atmos. Environ., 45, 6802–6811, https://doi.org/10.1016/j.atmosenv.2011.03.068, 2011.
Guo, S., Hu, M., Zamora, M. L., Peng, J. F., Shang, D. J., Zheng, J., Du, Z. F., Wu, Z. J., Shao, M., Zeng, L. M., Molina, M. J., and Zhang, R. Y.: Elucidating severe urban haze formation in China, P. Natl. Acad. Sci. USA, 111, 17373–17378, https://doi.org/10.1073/pnas.1419604111, 2014.
He, J. H. and Zhu, Z. W.: The relation of South China Sea monsoon onset with the subsequent rainfall over the subtropical East Asia, Int. J. Climatol., 35, 4547–4556, https://doi.org/10.1002/joc.4305, 2015.
Held, I. M. and Suarez, M. J.: A proposal for the intercomparison of the dynamical cores of atmospheric general circulation models, B. Am. Meteorol. Soc., 75, 1825–1830, https://doi.org/10.1175/1520-0477(1994)075<1825:apftio>2.0.co;2, 1994.
Huang, B. Y., Thorne, P. W., Banzon, V. F., Boyer, T., Chepurin, G., Lawrimore, J. H., Menne, M. J., Smith, T. M., Vose, R. S., and Zhang, H. M.: Extended Reconstructed Sea Surface Temperature, version 5 (ERSSTv5): Upgrades, validations, and intercomparisons, J. Climate, 30, 8179–8205, https://doi.org/10.1175/jcli-d-16-0836.1, 2017.
Hurrell, J. W. and Deser, C.: North Atlantic climate variability: The role of the North Atlantic Oscillation, J. Mar. Syst., 78, 28–41, https://doi.org/10.1016/j.jmarsys.2008.11.026, 2009.
Jacob, D. J. and Winner, D. A.: Effect of Climate Change on Air Quality, Atmos. Environ., 43, 51–63, https://doi.org/10.1016/j.atmosenv.2008.09.051, 2009.
Jia, B., Wang, Y., Yao, Y., and Xie, Y.: A new indicator on the impact of large-scale circulation on wintertime particulate matter pollution over China, Atmos. Chem. Phys., 15, 11919–11929, https://doi.org/10.5194/acp-15-11919-2015, 2015.
Kalnay, E., Kanamitsu, M., Kistler, R., Collins, W., Deaven, D., Gandin, L., Iredell, M., Saha, S., White, G., Woollen, J., Zhu, Y., Leetmaa, A., Reynolds, R., Chelliah, M., Ebisuzaki, W., Higgins, W., Janowiak, J., Mo, K. C., Ropelewski, C., Wang, J., Jenne, R., and Joseph, D.: The NCEP/NCAR 40-year reanalysis project, B. Am. Meteorol. Soc., 77, 437–471, https://doi.org/10.1175/1520-0477(1996)077<0437:tnyrp>2.0.co;2, 1996.
Lau, K. M. and Kim, K. M.: Observational relationships between aerosol and Asian monsoon rainfall, and circulation, Geophys. Res. Lett., 33, L21810, https://doi.org/10.1029/2006GL027546, 2006.
Lau, K. M., Kim, M. K., and Kim, K. M.: Asian summer monsoon anomalies induced by aerosol direct forcing: the role of the Tibetan Plateau, Clim. Dynam., 26, 855–864, https://doi.org/10.1007/s00382-006-0114-z, 2006.
Li, C., Martin, R. V., Boys, B. L., van Donkelaar, A., and Ruzzante, S.: Evaluation and application of multi-decadal visibility data for trend analysis of atmospheric haze, Atmos. Chem. Phys., 16, 2435–2457, https://doi.org/10.5194/acp-16-2435-2016, 2016.
Li, Q., Zhang, R. H., and Wang, Y.: Interannual variation of the wintertime fog–haze days across central and eastern China and its relation with East Asian winter monsoon, Int. J. Climatol., 36, 346–354, https://doi.org/10.1002/joc.4350, 2016.
Li, R., Hu, Y., Li, L., Fu, H., and Chen, J.: Real-time aerosol optical properties, morphology and mixing states under clear, haze and fog episodes in the summer of urban Beijing, Atmos. Chem. Phys., 17, 5079–5093, https://doi.org/10.5194/acp-17-5079-2017, 2017.
Li, Z. Q., Lau, W. K. M., Ramanathan, V., Wu, G., Ding, Y., Manoj, M. G., Liu, J., Qian, Y., Li, J., Zhou, T., Fan, J., Rosenfeld, D., Ming, Y., Wang, Y., Huang, J., Wang, B., Xu, X., Lee, S. S., Cribb, M., Zhang, F., Yang, X., Zhao, C., Takemura, T., Wang, K., Xia, X., Yin, Y., Zhang, H., Guo, J., Zhai, P. M., Sugimoto, N., Babu, S. S., and Brasseur, G. P.: Aerosol and monsoon climate interactions over Asia, Rev. Geophys., 54, 866–929, https://doi.org/10.1002/2015RG000500, 2016.
Liu, Y., Sun, J. R., and Yang, B.: The effects of black carbon and sulphate aerosols in China regions on East Asia monsoons, Tellus B, 61, 642–656, https://doi.org/10.1111/j.1600-0889.2009.00427.x, 2009.
Luan, T., Guo, X., Guo, L., and Zhang, T.: Quantifying the relationship between PM2.5 concentration, visibility and planetary boundary layer height for long-lasting haze and fog-haze mixed events in Beijing, Atmos. Chem. Phys., 18, 203–225, https://doi.org/10.5194/acp-18-203-2018, 2018.
Mu, M. and Zhang, R. H.: Addressing the issue of fog and haze promising perspective from meteorological science and technology, Sci. China Earth Sci., 57, 1–2, https://doi.org/10.1007/s11430-013-4791-2, 2014.
Mu, Q. and Liao, H.: Simulation of the interannual variations of aerosols in China: role of variations in meteorological parameters, Atmos. Chem. Phys., 14, 9597–9612, https://doi.org/10.5194/acp-14-9597-2014, 2014.
NCEP/NCAR: NCEP/NCAR Reanalysis data sets, available at: http://www.esrl.noaa.gov/psd/data/gridded/data.ncep.reanalysis.html, last access: 10 January 2018.
Niu, F., Li, Z. Q., Li, C., Lee, K. H., and Wang, M. Y.: Increase of wintertime fog in China: Potential impacts of weakening of the Eastern Asian monsoon circulation and increasing aerosol loading, J. Geophys. Res., 115, D00K20, https://doi.org/10.1029/2009JD013484, 2010.
NOAA: NOAA Extended Reconstructed Sea Surface Temperature (SST) V5 data sets, available at: https://www.esrl.noaa.gov/psd/data/gridded/data.noaa.ersst.v5.html, last access: 10 January 2018a.
NOAA: NOAA precipitation datasets, available at: https://www.esrl.noaa.gov/psd/data/gridded/data.prec.html, last access: 10 January 2018b.
Pei, L., Yan, Z., Sun, Z., Miao, S., and Yao, Y.: Increasing persistent haze in Beijing: potential impacts of weakening East Asian winter monsoons associated with northwestern Pacific sea surface temperature trends, Atmos. Chem. Phys., 18, 3173–3183, https://doi.org/10.5194/acp-18-3173-2018, 2018.
Pope III, C. A. and Dockery, D. W.: Health effects of fine particulate air pollution: Lines that connect, J. Air Waste Manage., 56, 709–742, https://doi.org/10.1080/10473289.2006.10464485, 2006.
Seo, J., Kim, J. Y., Youn, D., Lee, J. Y., Kim, H., Lim, Y. B., Kim, Y., and Jin, H. C.: On the multiday haze in the Asian continental outflow: the important role of synoptic conditions combined with regional and local sources, Atmos. Chem. Phys., 17, 9311–9332, https://doi.org/10.5194/acp-17-9311-2017, 2017.
Takaya, K. and Nakamura, H.: A formulation of a phase-independent wave-activity flux for stationary and migratory quasigeostrophic eddies on a zonally varying basic flow, J. Atmos. Sci., 58, 608–627, https://doi.org/10.1175/1520-0469(2001)058<0608:afoapi>2.0.co;2, 2001.
Tao, M. H., Chen, L. F., Xiong, X. Z., Zhang, M. G., Ma, P. F., Tao, J. H., and Wang, Z. F.: Formation process of the widespread extreme haze pollution over northern China in January 2013: Implications for regional air quality and climate, Atmos. Environ., 98, 417–425, https://doi.org/10.1016/j.atmosenv.2014.09.026, 2014.
Tao, M. H., Chen, L. F., Wang, Z. F., Wang, J., Tao, J. H., and Wang, X. H.: Did the widespread haze pollution over China increase during the last decade? A satellite view from space, Environ. Res. Lett., 11, 054019, https://doi.org/10.1088/1748-9326/11/5/054019, 2016.
Tett, S. F. B., Stott, P. A., Allen, M. R., Ingram, W. J., and Mitchell, J. F. B.: Causes of twentieth-century temperature change near the Earth's surface, Nature, 399, 569–572, https://doi.org/10.1038/21164, 1999.
Tie, X. X., Wu, D., and Brasseur, G.: Lung cancer mortality and exposure to atmospheric aerosol particles in Guangzhou, China, Atmos. Environ., 43, 2375–2377, https://doi.org/10.1016/j.atmosenv.2009.01.036, 2009.
Wang, H. J.: On assessing haze attribution and control measures in China, Atmos. Oceanic Sci. Lett., 11, 120–122, https://doi.org/10.1080/16742834.2018.1409067, 2018.
Wang, H.-J. and Chen, H.-P.: Understanding the recent trend of haze pollution in eastern China: roles of climate change, Atmos. Chem. Phys., 16, 4205–4211, https://doi.org/10.5194/acp-16-4205-2016, 2016.
Wang, H. J., Chen, H. P., and Liu, J. P.: Arctic sea ice decline intensified haze pollution in eastern China, Atmos. Oceanic Sci. Lett., 8, 1–9, https://doi.org/10.3878/AOSL20140081, 2015.
Wang, J., He, J. H., Liu, X. F., and Wu, B. G.: Interannual variability of the Meiyu onset over Yangtze-Huaihe River Valley and analyses of its previous strong influence signal, Chin. Sci. Bull., 54, 687–695, https://doi.org/10.1007/s11434-008-0534-8, 2009.
Wang, J., Zhang, X. Y., Cai, Z. Y., Wang, D. Z., and Chen, H.: Meteorological causes of a heavy air pollution process in Tianjin and its prediction analyses, Environ. Sci. Technol., 38, 77–82, 2015 (in Chinese).
Wang, J., Zhao, Q. H., Zhu, Z. W., Qi, L., Wang, J. X. L., and He, J. H.: Interannual variation in the number and severity of autumnal haze days in the Beijing–Tianjin–Hebei region and associated atmospheric circulation anomalies, Dynam. Atmos. Oceans, 84, 1–9, https://doi.org/10.1016/j.dynatmoce.2018.08.001, 2018.
Wang, Y. S., Yao, L., Wang, L. L., Liu, Z. R., Ji, D. S., Tang, G. Q., Zhang, J. K., Sun, Y., Hu, B., and Xin, J. Y.: Mechanism for the formation of the January 2013 heavy haze pollution episode over central and eastern China, Sci. China Earth Sci., 57, 14–25, https://doi.org/10.1007/s11430-013-4773-4, 2014.
Wang, Z. F., Li, J., Wang, Z., Yang, W. Y., Tang, X., Ge, B. Z., Yan, P. Z., Zhu, L. L., Chen, X. S., Chen, H. S., Wang, W., Li, J. J., Liu, B., Wang, X. Y., Wang, W., Zhao, Y. L., Lu, N., and Su, D. B.: Modeling study of regional severe hazes over mid-eastern China in January 2013 and its implications on pollution prevention and control, Sci. China Earth Sci., 57, 3–13, https://doi.org/10.1007/s11430-013-4793-0, 2014.
Wu, D., Tie, X. X., Li, C. C., Ying, Z. M., Kai-Hon Lau, A., Huang, J., Deng, X. J., and Bi, X. Y.: An extremely low visibility event over the Guangzhou region: A case study, Atmos. Environ., 39, 6568–6577, https://doi.org/10.1016/j.atmosenv.2005.07.061, 2005.
Wu, G. X., Li, Z. Q., Fu, C. B., Zhang, X. Y., Zhang, R. Y., Zhang, R. H., Zhou, T. J., Li, J. P., Li, J. D., Zhou, D. G., Wu, L., Zhou, L. T., He, B., and Huang, R. H.: Advances in studying interactions between aerosols and monsoon in China, Sci. China Earth Sci., 59, 1–16, https://doi.org/10.1007/s11430-015-5198-z, 2016.
Xiao, D., Li, Y., Fan, S. J., Zhang, R. H., Sun, J. R., and Wang, Y.: Plausible influence of Atlantic Ocean SST anomalies on winter haze in China, Theor. Appl. Climatol., 122, 249–257, https://doi.org/10.1007/s00704-014-1297-6, 2015.
Xu, P., Chen, Y. F., and Ye, X. J.: Haze, air pollution, and health in China, Lancet, 382, 2067, https://doi.org/10.1016/S0140-6736(13)62693-8, 2013.
Xu, X., Zhao, T., Liu, F., Gong, S. L., Kristovich, D., Lu, C., Guo, Y., Cheng, X., Wang, Y., and Ding, G.: Climate modulation of the Tibetan Plateau on haze in China, Atmos. Chem. Phys., 16, 1365–1375, https://doi.org/10.5194/acp-16-1365-2016, 2016.
Xu, X. D., Wang, Y. J., Zhao, T. L., Cheng, X. H., Meng, Y. Y., and Ding, G. A.: “Harbor” effect of large topography on haze distribution in eastern China and its climate modulation on decadal variations in haze China, Chin. Sci. Bull., 60, 1132–1143, https://doi.org/10.1360/N972014-00101, 2015 (in Chinese).
Yang, Y., Liao, H., and Lou, S. J.: Decadal trend and interannual variation of outflow of aerosols from East Asia: Roles of variations in meteorological parameters and emissions, Atmos. Environ., 100, 141–153, https://doi.org/10.1016/j.atmosenv.2014.11.004, 2015.
Yang, Y., Liao, H., and Lou, S. J.: Increase in winter haze over eastern China in recent decades: Roles of variations in meteorological parameters and anthropogenic emissions, J. Geophys. Res.-Atmos., 121, 13050–013065, https://doi.org/10.1002/2016JD025136, 2016.
Yang, Y. R., Liu, X. G., Qu, Y., An, J. L., Jiang, R., Zhang, Y. H., Sun, Y. L., Wu, Z. J., Zhang, F., Xu, W. Q., and Ma, Q. X.: Characteristics and formation mechanism of continuous hazes in China: a case study during the autumn of 2014 in the North China Plain, Atmos. Chem. Phys., 15, 8165–8178, https://doi.org/10.5194/acp-15-8165-2015, 2015.
Yin, Z. and Wang, H.: Seasonal prediction of winter haze days in the north central North China Plain, Atmos. Chem. Phys., 16, 14843–14852, https://doi.org/10.5194/acp-16-14843-2016, 2016.
Yin, Z. and Wang, H.: Role of atmospheric circulations in haze pollution in December 2016, Atmos. Chem. Phys., 17, 11673–11681, https://doi.org/10.5194/acp-17-11673-2017, 2017.
You, T., Wu, R. G., Huang, G., and Fan, G. Z.: Regional meteorological patterns for heavy pollution events in Beijing, J. Meteor. Res., 31, 597–611, https://doi.org/10.1007/s13351-017-6143-1, 2017.
You, Y. C., Cheng, X. G., Zhao, T. L., Xu, X. D., Gong, S. L., Zhang, X. Y., Zheng, Y., Che, H. Z., Yu, C., Chang, J. C., Ma, G. X., and Wu, M.: Variations of haze pollution in China modulated by thermal forcing of the Western Pacific Warm Pool, Atmosphere, 9, 1–11, https://doi.org/10.3390/atmos9080314, 2018.
Zhang, H., Zhao, S. Y., Wang, Z. L., Zhang, X. Y., and Song, L. C.: The updated effective radiative forcing of major anthropogenic aerosols and their effects on global climate at present and in the future, Int. J. Climatol., 36, 4029–4044, https://doi.org/10.1002/joc.4613, 2016.
Zhang, L., Wang, T., Lv, M. Y., and Zhang, Q.: On the severe haze in Beijing during January 2013: Unraveling the effects of meteorological anomalies with WRF-Chem, Atmos. Environ., 104, 11–21, https://doi.org/10.1016/j.atmosenv.2015.01.001, 2015.
Zhang, R. H., Li, Q., and Zhang, R. N.: Meteorological conditions for the persistent severe fog and haze event over eastern China in January 2013, Sci. China Earth Sci., 57, 26–35, https://doi.org/10.1007/s11430-013-4774-3, 2014.
Zhang, Z., Zhang, X., Gong, D., Kim, S.-J., Mao, R., and Zhao, X.: Possible influence of atmospheric circulations on winter haze pollution in the Beijing-Tianjin-Hebei region, northern China, Atmos. Chem. Phys., 16, 561–571, https://doi.org/10.5194/acp-16-561-2016, 2016.
Zhao, S., Zhang, H., and Xie, B.: The effects of El Niño-Southern Oscillation on the winter haze pollution of China, Atmos. Chem. Phys., 18, 1863–1877, https://doi.org/10.5194/acp-18-1863-2018, 2018.
Zhu, X. W., Tang, G. Q., Hu, B., Wang, L. L., Xin, J. Y., Zhang, J. K., Liu, Z. R., Münkel, C., and Wang, Y. S.: Regional pollution and its formation mechanism over North China Plain: A case study with ceilometer observations and model simulations, J. Geophys. Res.-Atmos., 121, 14574–14588, https://doi.org/10.1002/2016JD025730, 2016.
Zhu, Z. W.: Breakdown of the relationship between Australian summer rainfall and ENSO caused by tropical Indian Ocean SST warming, J. Climate, 31, 2321–2336, https://doi.org/10.1175/jcli-d-17-0132.1, 2018.
Zhu, Z. W. and Li, T.: A new paradigm for continental U.S. summer rainfall variability: Asia–North America teleconnection, J. Climate, 29, 7313–7327, https://doi.org/10.1175/jcli-d-16-0137.1, 2016.
Zhu, Z. W. and Li, T.: The record-breaking hot summer in 2015 over Hawaii and its physical causes, J. Climate, 30, 4253–4266, https://doi.org/10.1175/JCLI-D-16-0438.1, 2017.
Zhu, Z. W. and Li, T.: Amplified contiguous United States summer rainfall variability induced by East Asian monsoon interdecadal change, Clim. Dynam., 50, 3523–3536, https://doi.org/10.1007/s00382-017-3821-8, 2018.
Zhu, Z. W., Li, T., and He, J. H.: Out-of-Phase relationship between boreal spring and summer decadal rainfall changes in southern China, J. Climate, 27, 1083–1099, https://doi.org/10.1175/jcli-d-13-00180.1, 2014.
Zou, Y. F., Wang, Y. H., Zhang, Y. Z., and Koo, J.-H.: Arctic sea ice, Eurasia snow, and extreme winter haze in China, Sci. Adv., 3, e1602751, https://doi.org/10.1126/sciadv.1602751, 2017.
Zuo, J. Q., Li, W. J., Sun, C. H., Xu, L., and Ren, H. L.: Impact of the North Atlantic sea surface temperature tripole on the East Asian summer monsoon, Adv. Atmos. Sci., 30, 1173–1186, https://doi.org/10.1007/s00376-012-2125-5, 2013.