the Creative Commons Attribution 4.0 License.
the Creative Commons Attribution 4.0 License.
 | 11 Dec 2019
Climate benefits of proposed carbon dioxide mitigation strategies for international shipping and aviation
Catherine C. Ivanovich
Pedro Piris-Cabezas
Annie Petsonk
While individual countries work to achieve and strengthen their nationally determined contributions (NDCs) to the Paris Agreement, the growing emissions from two economic sectors remain largely outside most countries' NDCs: international shipping and international aviation. Reducing emissions from these sectors is particularly challenging because the adoption of any policies and targets requires the agreement of a large number of countries. However, the International Maritime Organization (IMO) and the International Civil Aviation Organization (ICAO) have recently announced strategies to reduce carbon dioxide (CO2) emissions from their respective sectors. Here we provide information on the climate benefits of these proposed measures, along with related potential measures. Given that the global average temperature has already risen 1 ∘C above preindustrial levels, there is only 1.0 or 0.5 ∘C of additional “allowable warming” left to stabilize below the 2 or 1.5 ∘C thresholds, respectively. We find that if no actions are taken, CO2 emissions from international shipping and aviation may contribute roughly equally to an additional combined 0.12 ∘C to global temperature rise by end of century – which is 12 % and 24 % of the allowable warming we have left to stay below the 2 or 1.5 ∘C thresholds (1.0 and 0.5 ∘C), respectively. However, stringent mitigation measures may avoid over 85 % of this projected future warming from the CO2 emissions from each sector. Quantifying the climate benefits of proposed mitigation pathways is critical as international organizations work to develop and meet long-term targets.


There are clear benefits to limiting global average temperature rise to 1.5 ∘C above preindustrial levels (Intergovernmental Panel on Climate Change, 2018). However, in order to achieve this, carbon dioxide (CO2) emissions likely need to reach net zero around mid-century (Intergovernmental Panel on Climate Change, 2018). This would require unprecedented changes to energy systems, land use, transportation, infrastructure, and industry worldwide.
Two sectors for which establishing carbon dioxide mitigation policy is particularly complex are international aviation and shipping. The Conference of the Parties to the United Nations Framework Convention on Climate Change (UNFCCC) in the late 1990s urged that emissions reductions from these sectors be pursued through the UN's International Civil Aviation Organization (ICAO, established 1944) and International Maritime Organization (IMO, established 1948), respectively (United Nations Framework Convention on Climate Change, 1997). While the existence of these UN bodies unites global perspectives for regulation development, this arrangement also requires the agreement of a large number of countries for the adoption of any new policies and targets, a feat much more difficult than if only one or several countries were involved.
While current emissions from international aviation and shipping account for around 4 % of global energy-related CO2 emissions (IMO, 2014; ICAO, 2019a; International Energy Agency, 2018), emissions from each sector are forecasted to increase anywhere from 200 % to 400 % (Lee, 2018) and 50 % to 250 % (IMO, 2014) by mid-century, respectively, in the absence of effective policy.
Therefore, to support the objectives of the Paris Agreement adopted in 2015, the ICAO and IMO have recently announced strategies to reduce carbon dioxide emissions from international aviation and shipping, respectively. As part of a “basket of measures” to address aviation emissions, including a CO2 efficiency standard for aircraft, the ICAO adopted a resolution in 2016 to establish a Carbon Offsetting and Reduction Scheme for International Aviation (CORSIA). CORSIA requires states to ensure airlines limit their net emissions of carbon dioxide to 2020 levels and allows airlines the flexibility to achieve those reductions directly through improved technologies and operations by reducing emissions outside the sector and by using fuels that have lower emissions on a life-cycle basis. Efforts are now underway to implement CORSIA, while ensuring that these emissions reductions are not double-counted (once by Paris Parties where the reductions occur and again by airlines in CORSIA). A long-term goal for international aviation CO2 emissions has been in development since 2008, but the ICAO has yet to formally adopt such a target.
On the other hand, the IMO announced in 2018 a minimum ambition long-term target of cutting international shipping emissions by at least 50 % by 2050 compared to 2008, followed by rapid full decarbonization (IMO, 2018). This long-term target was preceded by various policy options facilitating the reduction of carbon dioxide emissions from the shipping sector. These policies include the Energy Efficiency Design Index (EEDI), which requires increasingly stringent minimum energy efficiency levels for new ships, and the Ship Energy Efficiency Management Plan (SEEMP), which provides an approach for monitoring the energy efficiency of current fleets in use.
While both of these measures – CORSIA and the IMO target – will reduce carbon dioxide emissions from international aviation and shipping, respectively, it is important to analyze the impact that these measures will have on global warming. This information is further important as the ICAO 2019 Assembly considers the next steps and the IMO revises and reviews its long-term target in 2023 and 2028.
Several studies have previously quantified the current and future climate impacts of the transport sector, including aviation and shipping. Many studies aggregate the climate impacts of each sector through the use of CO2 equivalence (CO2e) (Lee et al., 2010; Lee, 2018; Eyring et al., 2010; Azar and Johansson, 2012). While the use of this simple metric attempts to describe the global warming intensity associated with the emission of multiple greenhouse gases, it does not account for continuous emissions or convey warming impacts over time (Ocko et al., 2017). Studies that do investigate the climate impacts of these sectors over time often consider the effects of a single emissions pulse or sustained present-day emissions (Fuglestvedt et al., 2009; Berntsen and Fuglestvedt, 2008; Unger et al., 2010).
There are a few studies that have modeled the contribution to warming from future aviation and shipping emissions pathways. One of the earliest estimates was published in the IPCC special report on aviation and its impact on the global atmosphere in 1999 (Intergovernmental Panel on Climate Change, 1999); the report estimated aviation's expected business-as-usual (BAU) contribution to warming in the year 2050 at 0.05 to 0.09 ∘C. Skeie et al. (2009) also analyzed future warming impacts from shipping and aviation and included prospective technological improvements in addition to BAU projections. The authors estimated that aviation's contribution to warming in 2100 will range from 0.11 to 0.28 ∘C, while the shipping sector's contribution will range from −0.01 to 0.25 ∘C, depending on future trends in global economic development. The cooling impact of the shipping sector by mid-century was estimated by Lund et al. (2012) at −0.02 to −0.04 ∘C, depending on the assumed emissions scenario. Huszar et al. (2013) estimated that the CO2 emissions from global aviation would produce 0.1 ∘C of warming by the end of the century, and an additional 0.1 ∘C of warming would stem from non-CO2 impacts. More recent estimates from Terrenoire et al. (2019) project that CO2 emissions from the global aviation sector will be responsible for up to 0.1 ∘C by the end of the century in the absence of mitigation action.
Here we build on these previous analyses by providing information on the climate benefits over time of all proposed and prospective mitigation strategies to date in terms of expected avoided warming compared to BAU projections. We focus our analysis on international emissions as opposed to total emissions (international and domestic). We avoid simple metrics, which do not account for continuous emissions or convey warming impacts over time, by employing a reduced-complexity climate model. We also account for all climate pollutant emissions from aviation and shipping. We consider the proposed target for international shipping paired with current mitigation policies and more stringent potential revisions, along with various pathways for international aviation that include current CORSIA targets, an extension of CORSIA, and similar targets as those agreed upon by the shipping industry.
Action by both sectors simultaneously is essential because the economics of transport are intertwined. Moreover, the climate impacts of international aviation and shipping are inextricably linked; the success of each industry in its efforts to limit greenhouse gas emissions could drive down the costs of climate solutions and open up new clean fuel supply chains.
2.1 Business-as-usual emissions from international bunkers
We account for present-day and future emissions of both CO2 and non-CO2 pollutants from international shipping and aviation in our BAU baseline scenarios. Projected emissions over time can be found in Fig. 1.
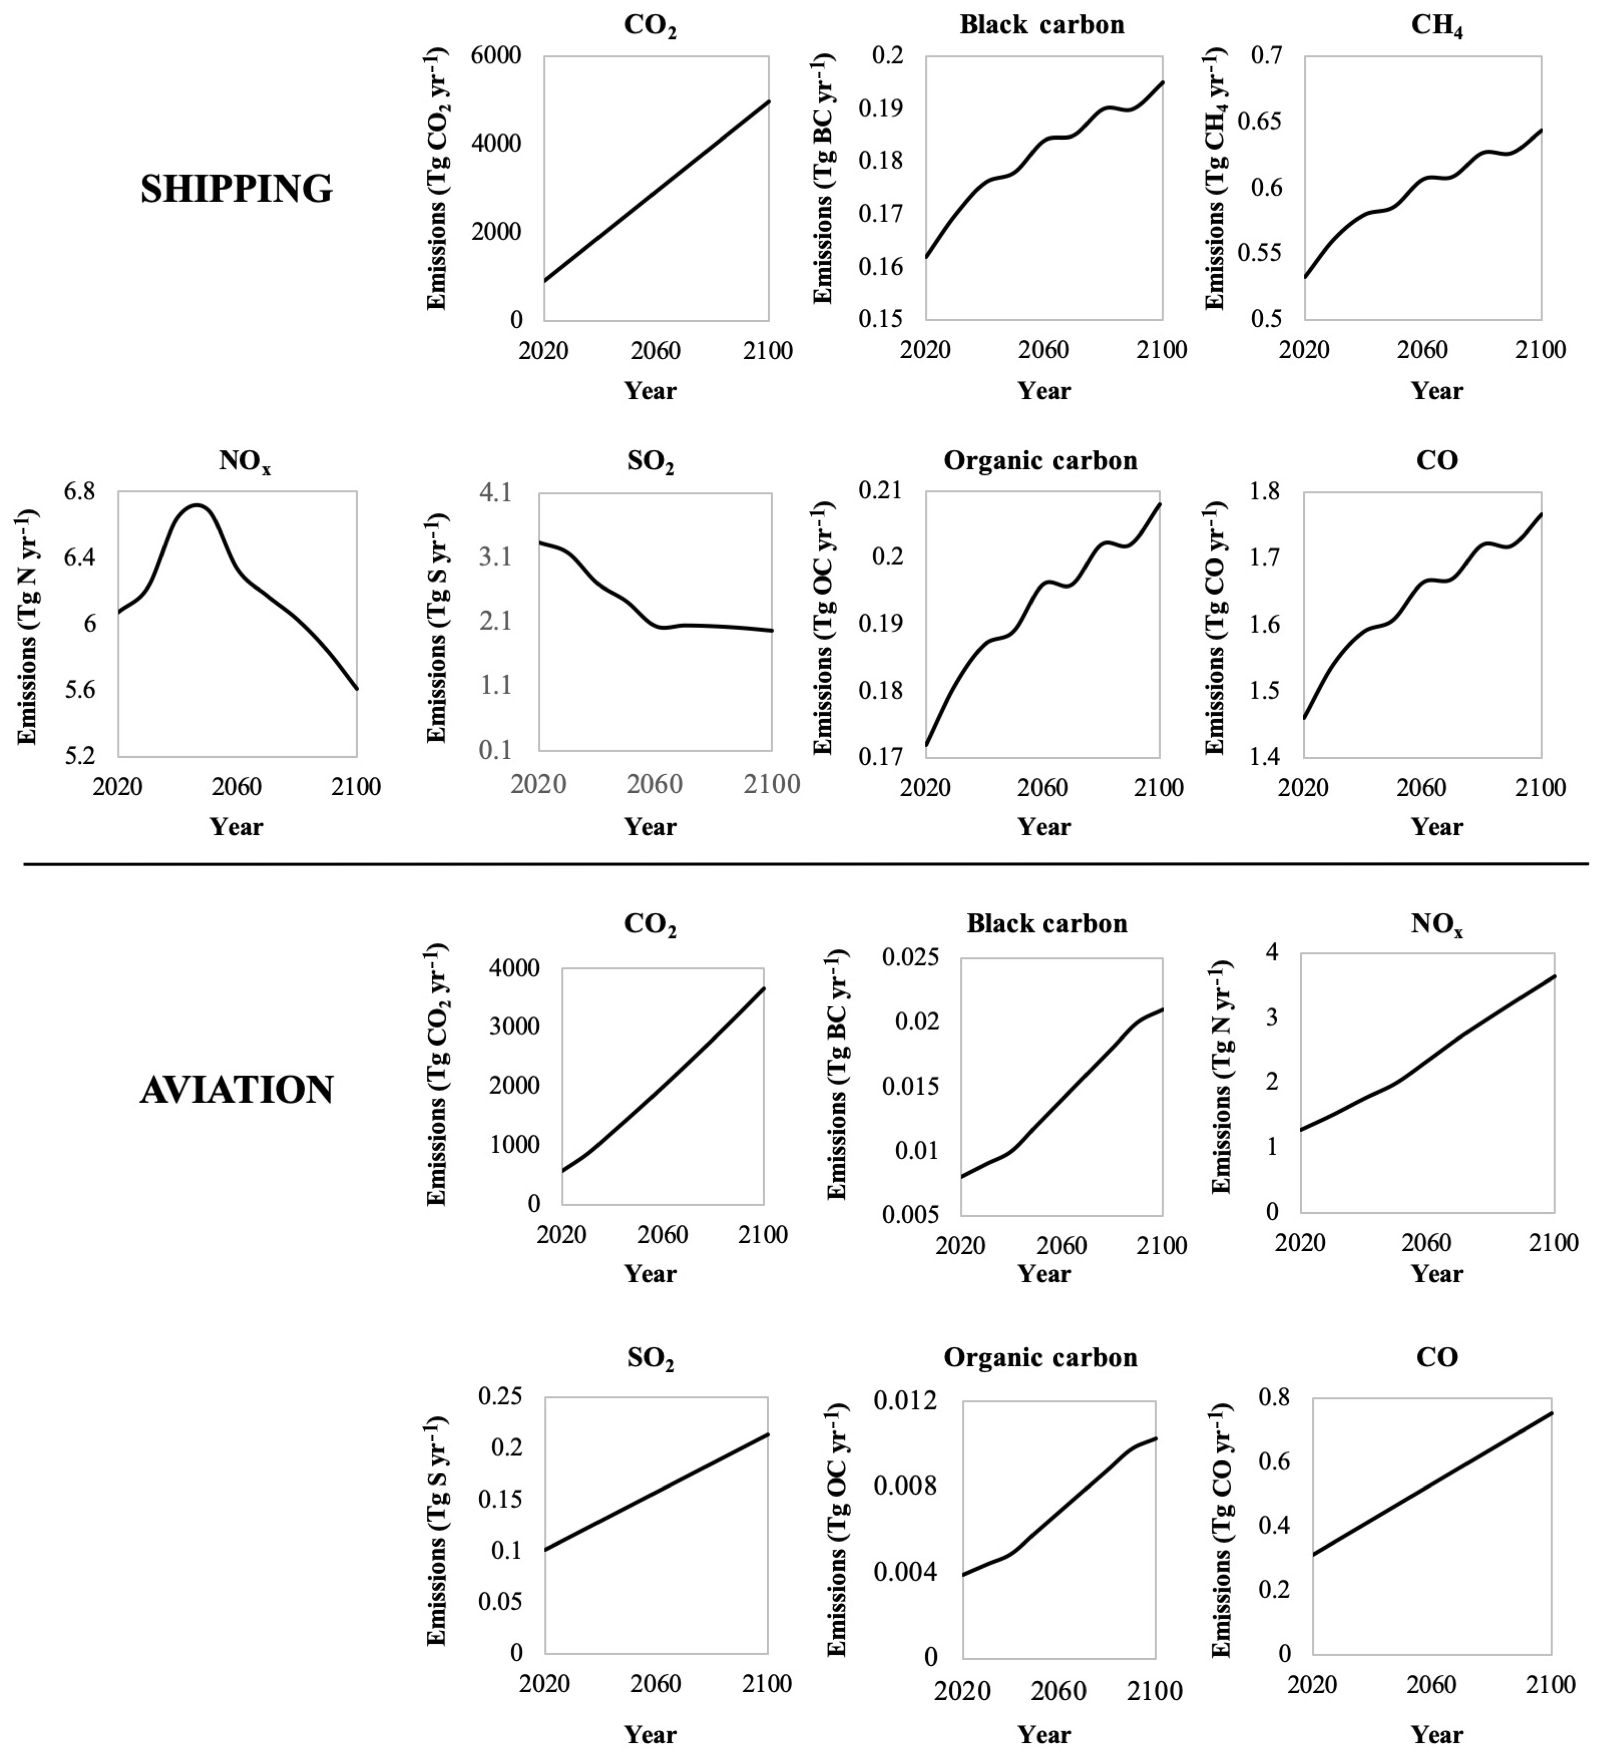
Figure 1Projected future emissions from international shipping and aviation. Shipping CO2 emissions data from the Third IMO Greenhouse Gas Study (IMO, 2014) and the Update of Maritime Greenhouse Gas Emission Projections (Hoen et al., 2017). Aviation CO2 emissions data from Present and Future Trends in Aircraft Noise and Emissions (ICAO, 2019a). Both datasets end in 2050; shipping data are linearly extrapolated through the year 2100, and aviation data utilize the described growth extrapolation after 2040 through the year 2100. Aviation black carbon and NOx emissions as well as shipping black carbon, CH4, NOx, SO2 (adjusted based on IMO's recently adopted sulfur fuel regulation), organic carbon, and CO extracted from the RCP database for the RCP8.5 scenario. Aviation SO2 and CO are linearly extrapolated from the EDGAR dataset, and aviation organic carbon emissions are derived from their relationship with black carbon emissions.
2.1.1 International shipping
International shipping CO2 emissions data for the years 2007 to 2030 are taken from the Third IMO Greenhouse Gas Study (IMO, 2014) and for the years 2030 to 2050 are taken from the Update of Maritime Greenhouse Gas Emission Projections (Hoen et al., 2017). Following the 2015 to 2050 growth trend for international shipping, CO2 emissions are linearly extrapolated through the year 2100. These projections include estimated CO2 emissions reductions associated with the implementation of EEDI and SEEMP. Because estimations of how these programs will impact the non-CO2 emissions from international shipping are uncertain, they are not included in the baseline emissions profiles for the sector.
For non-CO2 emissions, BAU projections for shipping are taken from the Representative Concentration Pathways database (RCP database) using the scenario that most closely represents BAU – RCP8.5 (Riahi et al., 2007). Data are available for the historical and projected shipping emissions of methane (CH4), nitrogen oxides (NOx), carbon monoxide (CO), sulfur dioxide (SO2), black carbon, and organic carbon. These projections include progressive reductions of sulfur dioxide emissions associated with the amendments to MARPOL Annex VI, which leads to a 0.5 % sulfur dioxide emissions cap in 2020. However, this simplified approach does not consider current emission control areas (ECAs) around the United States, Canada, and the European Union (mandating a cap of 0.1 % sulfur) or the potential for ECAs to be declared in additional regions of the world.
2.1.2 International aviation
International aviation CO2 emissions data for the years 2010 to 2050 are taken from Present and Future Trends in Aircraft Noise and Emissions (ICAO, 2019a). We extrapolate the aviation CO2 emissions for the Low Aircraft Technology and Moderate Operational Improvement Scenario through the year 2100 following the 2020 and 2050 trend.
Given that there is a range of reasonable growth patterns for aviation emissions in particular (Lee, 2018; Skeie et al., 2009), and our results depend on this baseline, we ran a set of sensitivity tests to evaluate the influence of different CO2 BAU projection growth patterns on the perceived avoided warming impacts. The two sensitivity tests considered are based on an exponential growth rate pattern through 2100 following the 2005–2050 trend for the high and low demand forecasts as depicted in a previous version of Present and Future Trends in Aircraft Noise and Emissions (ICAO, 2013). These emissions estimates are scaled down to calculate the corresponding Low Aircraft Technology and Moderate Operational Improvement Scenario proportionally to the latest ICAO forecast (2019a), resulting in declining growth rate patterns in which growth rates follow their 2020–2050 declining trend until plateauing at 0 % – as is the case for the low demand scenario. These sensitivity tests are analyzed in addition to the Low Aircraft Technology and Moderate Operational Improvement Scenario noted above for a total of three analyzed BAU scenarios for aviation. Because of uncertainties associated with how the emissions of non-CO2 pollutants are linked to these different CO2 growth rates, we focused our sensitivity tests on emissions of CO2 in particular. The CO2 emissions profiles used for this sensitivity analysis are shown in Fig. 2. We note that all other figures in the paper reflect the Low Aircraft Technology and Moderate Operational Improvement Scenario, which depicts a limited growth pattern for international aviation as this provides a middle-of-the-road estimation.
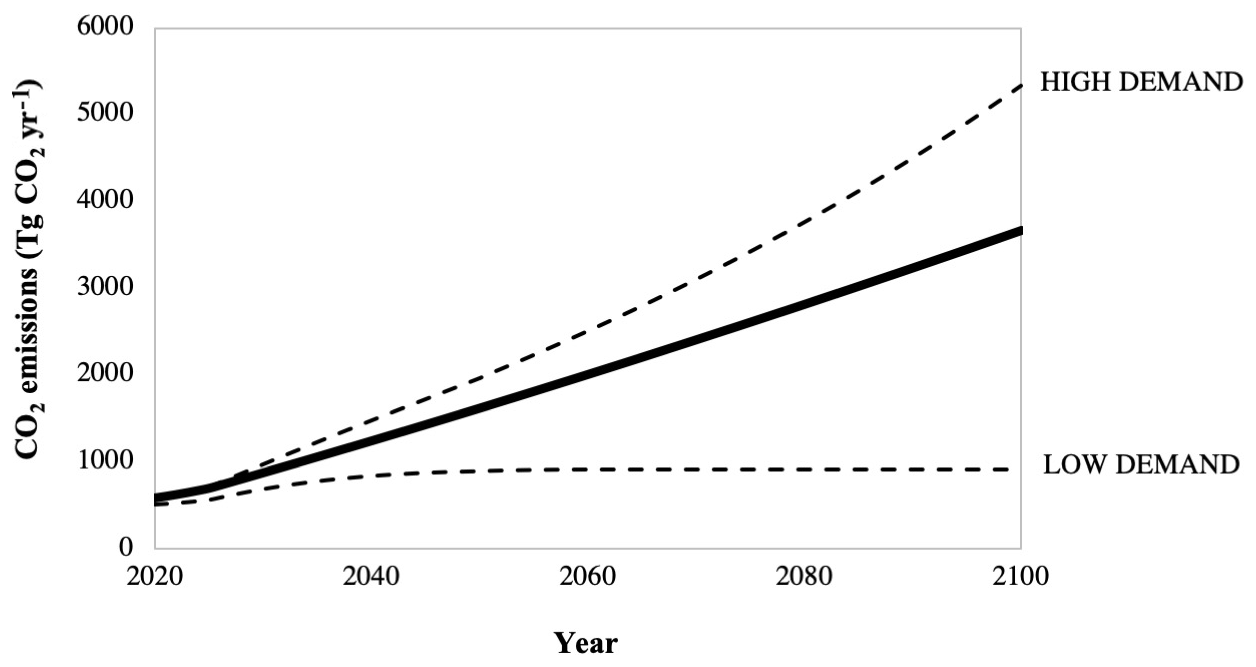
Figure 2Projected future emissions from international aviation used for sensitivity analysis. The sensitivity tests (dashed lines) are based on an exponential growth rate pattern through 2100 following the 2005–2050 trend for the high and low demand forecasts as depicted in a previous version of Present and Future Trends in Aircraft Noise and Emissions (ICAO, 2013).
Aviation emissions data for black carbon and nitrogen oxides are also taken from the RCP database using scenario RCP8.5. Given that the RCP data include emissions projections for both international and domestic aviation, we use historical data from the Emissions Database for Global Atmospheric Research (EDGAR; Crippa et al., 2016) to estimate the percent of total emissions from global aviation attributed to international flights (using the most recent data from 2012). Historical international aviation emissions data for sulfur dioxide and carbon monoxide are taken from the EDGAR database and are linearly extrapolated for each gas in order to match the growth patterns for the other non-CO2 climate pollutant emissions associated with aviation. We estimate international aviation organic carbon emissions based on the RCP black carbon data and using the organic-to-black-carbon ratio (0.49) provided by EDGAR for international aviation emissions (Crippa et al., 2016), again adjusted to reflect only the emissions from international flights. The BAU projections for international aviation sulfur dioxide, carbon monoxide, and organic carbon are added to the business-as-usual scenario including all natural and anthropogenic climate forcings in order to account for their original absence in the RCP8.5 database.
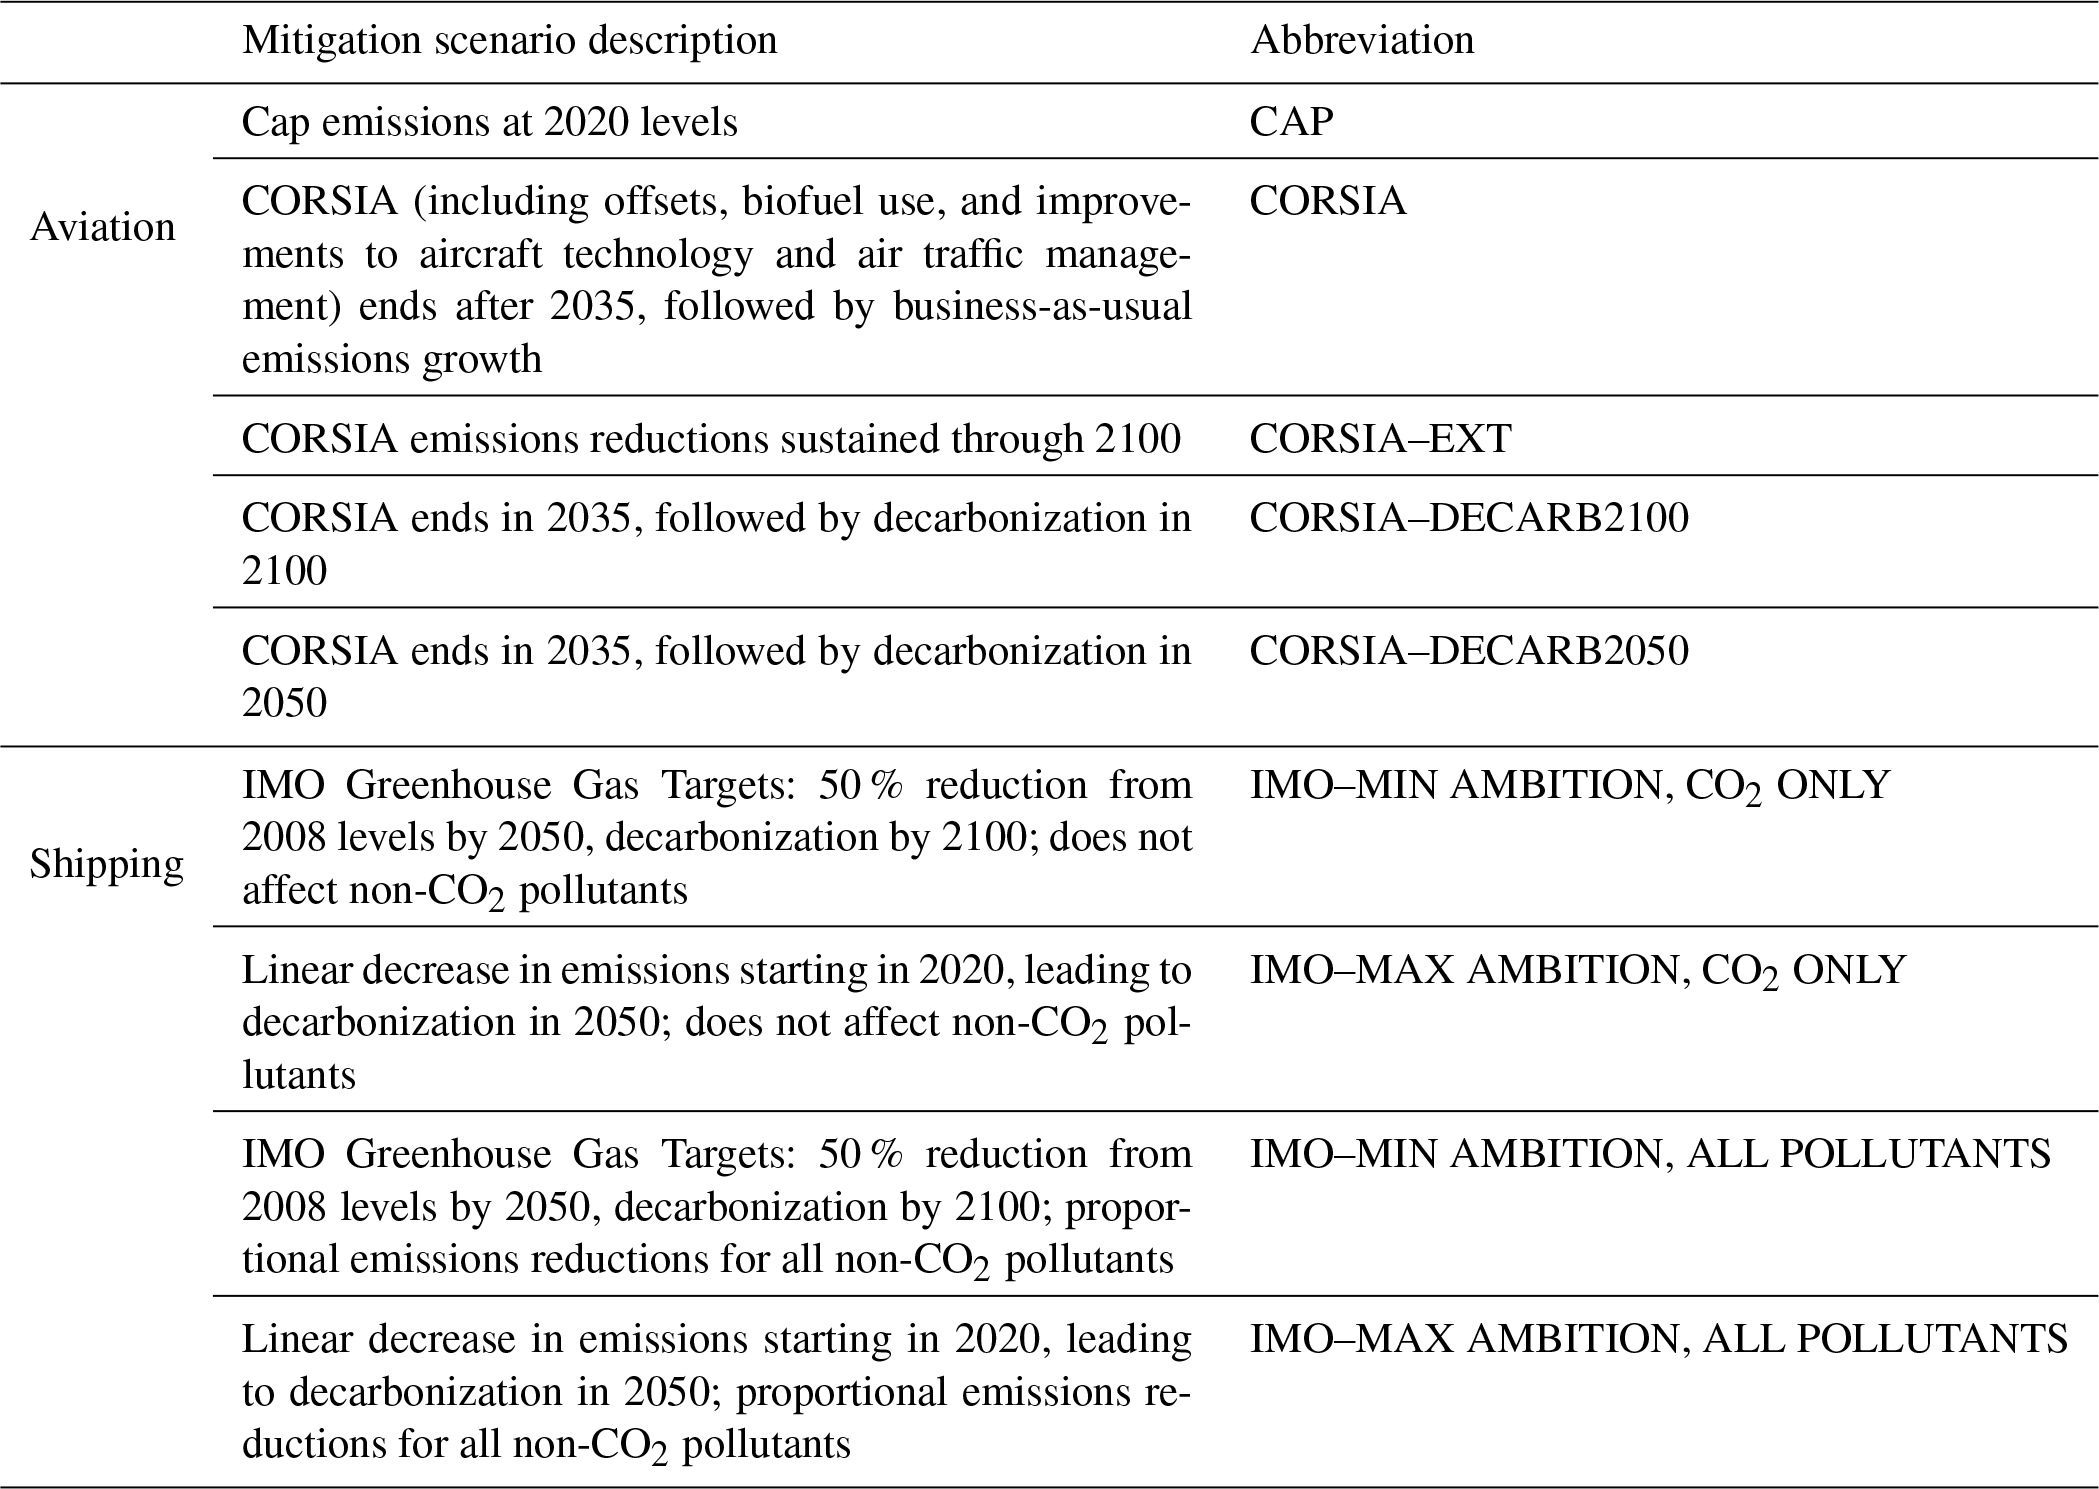
Table 1Descriptions of mitigation scenarios analyzed in this study for international aviation and shipping.
2.2 Mitigation scenarios
The mitigation emissions pathways are developed based on a series of agreed upon, proposed, or prospective policy scenarios for international shipping and aviation (Table 1). For international shipping, we analyze two mitigation scenarios: (i) the IMO's recently agreed upon minimum ambition mitigation target of reducing carbon intensity by at least 40 % below 2008 levels by 2030 and total emissions by 50 % below 2008 levels by 2050, followed by full decarbonization of the sector; and (ii) the maximum ambition scenario consistent with pathways to achieve the 1.5 ∘C target (Intergovernmental Panel on Climate Change, 2018) in which a 40 % reduction in emissions by 2030 is followed by decarbonization of the sector by the year 2050. These scenarios assume a linear reduction in emissions between target years, specifically 2015, 2030, 2050, and 2100 for the minimum ambition target and 2015, 2030, and 2050 for the maximum ambition target.
While these policies are motivated by the intention to reduce emissions of CO2, non-CO2 climate pollutant emissions will likely be impacted as well – although how will depend on the specific methods used to achieve the CO2 targets (Balacombe et al., 2019; Bouman et al., 2017), which are currently undecided. Therefore, we analyze scenarios in which the CO2 mitigation methods do not affect other pollutants and scenarios in which the CO2 mitigation methods affect other pollutants proportionally; the desire is to capture a range of plausible climate benefits.
Several policy measures have been suggested to reduce carbon dioxide emissions from international aviation. Here we analyze a scenario with the emissions reductions necessary in order to maintain a cap on net emissions of international flights to year-2020 levels and four scenarios based on the adoption of CORSIA. The CORSIA-based scenarios include the following: (i) emissions reductions due to offsets, biofuel use, and improvements in aircraft technology and air traffic management through 2035; (ii) an extension of CORSIA through 2100; (iii) full decarbonization of the international aviation sector by 2100 following CORSIA's completion in 2035; and (iv) full decarbonization of the international aviation sector by 2050 following CORSIA's completion in 2035.
All CORSIA-based scenarios include the maximum potential contribution of improved technology and management (and this maximum potential encompasses the anticipated effects of the ICAO CO2 standard); however, the CORSIA component of the scenario only affects CO2 emissions given that this is an offsetting program. Projections for the CO2 emissions reductions associated with CORSIA through the year 2035 are based on the latest list of participating member countries from the ICAO (ICAO, 2016, 2019b) and using the Environmental Defense Fund's aviation emissions interactive tool (Environmental Defense Fund, 2019). While CORSIA aims to offset international aviation emissions to the point of capping emissions at year-2020 levels, country exemptions to the program allow a small portion of emissions above this cap to remain uncovered. Because no policies currently exist to limit the emissions attributed to these exempt countries, emissions projections for the CORSIA–EXT scenario extend their current growth rate through the end of the century. Projections concerning how both biofuel use and the improvements to aircraft technology and air traffic management will contribute to the future emission of non-CO2 climate pollutants in the aviation sector are very limited and contain high levels of uncertainty, so this trade-off is not considered in the presented analysis.
2.3 Climate model
We employ the reduced-complexity climate model, Model for the Assessment of Greenhouse-gas Induced Climate Change (MAGICC) version 6, because of its widespread and prominent use and its ability to reliably model climate responses to small forcing changes (Meinshausen et al., 2011a; Ocko et al., 2018). Decades of research have been devoted to improving model parameterizations, and model results demonstrate consistency with sophisticated Coupled Model Intercomparison Project CMIP atmosphere–ocean and C4MIP carbon cycle models (Meinshausen et al., 2011a).
MAGICC contains a hemispherically averaged upwelling–diffusion ocean coupled to a four-box atmosphere (one over land and one over ocean for each hemisphere) and a carbon cycle model, with an average equilibrium climate sensitivity (ECS) of 3 ∘C. Between 1765 and 2005, radiative forcings are determined by historical greenhouse gas concentrations (Meinshausen et al., 2011b), prescribed aerosol forcings and land-use historical forcings (National Aeronautics and Space Administration (NASA) GISS model; http://data.giss.nasa.gov/, last access: 1 November 2019), solar irradiance (Lean, 2010), and historical emissions of ozone precursors (Lamarque et al., 2010). After 2005, radiative forcings are calculated from greenhouse gas emissions (carbon dioxide, methane, nitrous oxide, ozone-depleting substances, and their replacements), tropospheric ozone precursor emissions (carbon monoxide, nitrogen oxides, and non-methane volatile organic carbon), aerosol emissions (sulfate, black and organic carbon, sea salt, and mineral dust), and the indirect effects (first and second) of aerosols.
Whereas the radiative impacts of well-mixed greenhouse gases (such as CO2 and methane) are fairly well understood due to our knowledge of gas absorption, aerosol radiative effects are more complex and uncertain. This is due to the spatial and temporal heterogeneity complicating observations; a variety of possible microphysical and optical properties based on varying sizes, shapes, structures, mixtures, and humidity levels; and interactions with clouds that can impact the lifetime and brightness of the clouds. Given that aerosols are quite relevant to both the aviation and shipping sectors (e.g., Unger et al., 2010), we include their direct and indirect effects in our simulations, noting that caution must be applied in interpreting the results. Aerosol direct forcings are approximated by simple linear forcing–abundance relationships. The indirect effects of sulfate, black carbon, organic carbon, nitrate, and sea salt aerosols are also included. The effect on cloud droplet size is determined by scaling the optical thickness patterns of each species (as described by Hansen et al., 2005) by their respective emissions. The effect of aerosols on cloud cover and lifetime is modeled as a prescribed change in the efficacy of the cloud albedo (for full parameterization details, see Meinshausen et al., 2011a).
We note that all emissions are treated as surface emissions. Aviation emissions in flight occur at higher elevations, and this can affect atmospheric chemistry and radiation processes. For example, when sulfate is located above clouds, the radiative efficiency can be halved (less cooling); in contrast, the radiative efficiency of black carbon can be doubled (more warming) when it is located above clouds (Ocko et al., 2012). On the other hand, using more sophisticated climate models that can resolve horizontal and vertical granularities is often complicated by unforced internal variability that makes isolating the climate impact of relatively small radiative perturbations difficult if not impossible (Ocko et al., 2018).
The latest version of MAGICC is not calibrated for the inclusion of linear contrails and induced cirrus cloudiness from aviation, phenomena in which water vapor and impurities released in aircraft exhaust form cirrus-like clouds. This is an active area of research and significant progress has been made in recent years to better understand these uncertain processes (e.g., Lee et al., 2009; Schumann et al., 2015; Brasseur, 2016; Bock and Burkhardt, 2016). In the absence of these parameterizations in MAGICC, we include a sensitivity analysis to show their potential impact on the BAU radiative forcings and temperature responses to aviation.
We use default MAGICC properties with the exception of a few updates to reflect the most recent state of the science. Specifically, we modify methane's radiative efficiency (accounting for shortwave in addition to longwave absorption) and atmospheric lifetime, as well as tropospheric ozone's radiative efficiency (Etminan et al., 2016; Stevenson et al., 2013). As with climate models of any complexity level, there are limitations in our knowledge of climate and carbon cycle processes, radiative forcings, and especially indirect aerosol effects, which introduce uncertainties within the model. While MAGICC uses several calibration methods to determine its parameters from a large collection of sophisticated models, the comprehensive models will pass along their own uncertainties to MAGICC. Further, due to MAGICC's relative simplicity, parameters are averaged over large spatial scales. This is particularly important to acknowledge as the recent literature has demonstrated that radiative forcings associated with the transport sector can differ based on the regional location at which the transport takes place (Berntsen et al., 2006; Fuglestvedt et al., 2014; Kohler et al., 2013; Fromming et al., 2012; Lund et al., 2017; Skowron et al., 2015), particularly for the impact of non-CO2 emissions.
Other major sources of uncertainty stem from the innate inability to accurately project future emissions due to uncertainties in both the human and the climate components of prediction. All mitigation scenarios are compared to an estimated baseline, and the social and economic data utilized in order to inform this estimated baseline cannot be expected to perfectly match the unpredictable nature of human action. Further, the large spatial scales and parameterizations involved in climate modeling contribute to some degree of uncertainty. A full discussion of model uncertainties can be found in Meinshausen et al. (2011a).
2.4 Climate model simulations
We run 335 year-to-year integrations from the years 1765 to 2100 for a set of 14 different simulations. These simulations are comprised of five BAU pathways and nine mitigation pathways based on current and potential policy scenarios within the international aviation and shipping sectors. For future emissions from sectors other than international aviation and shipping, we use RCP8.5 emissions data, but the climate impacts are subtracted out as described below.
The five BAU scenarios account for warming impacts due to the following: all natural and anthropogenic forcings; isolation of the CO2 emissions from international shipping; isolation of the CO2 emissions from international aviation; isolation of the CO2, black carbon, methane, nitrogen oxide, sulfur dioxide, organic carbon, and carbon monoxide emissions from international shipping; and isolation of the CO2, black carbon, nitrogen oxide, sulfur dioxide, organic carbon, and carbon monoxide emissions from international aviation. The nine mitigation simulations account for the future emissions pathways for the nine policy scenarios outlined in Table 1.
In order to isolate sector emissions in each BAU and mitigation scenario, we subtract the total emissions of all gases and aerosols associated with each sector from the total RCP8.5 emissions of all gases and aerosols in the all-forcings scenario driven by all natural and anthropogenic forcings (Eq. 1). The annual average mean surface temperature changes from these emissions profiles are subtracted from the temperature changes in the all-forcings scenario in order to determine the contribution to future temperature change from each sector (Eq. 2). It is important to note that the background temperature response to other forcings (anthropogenic and natural) can affect the temperature responses to shipping and aviation. Therefore, even though they are ultimately subtracted out in our calculation, they do impact our results, and uncertainties in BAU emissions from other sectors and the resulting temperature effects need to be acknowledged.
Comparisons of each sector's baseline scenario to its respective mitigation scenarios are analyzed independently from other potential mitigation efforts that may occur in the future. Thus, isolating the temperature impacts of a given mitigation scenario does not mandate that all other anthropogenic emissions continue unabated. The same methodology can be used to isolate temperature changes due to individual gases or aerosols for each sector.
3.1 BAU climate responses
Both the shipping and aviation sectors emit a combination of warming and cooling climate pollutants and precursors. The net temperature impact depends on the magnitude of emissions, the radiative efficiencies, and the atmospheric lifetimes of the individual species. CO2 builds up in the atmosphere over time and thus its forcing increases gradually with constant emissions, whereas short-lived species such as all aerosols would yield constant annual forcings with constant emissions. Given that we are analyzing the climate impacts of future emissions from international aviation and shipping (year 2020 through 2100), the near-term radiative forcings (defined as the forcing at the tropopause after stratospheric temperature adjustment) are dominated by non-CO2 pollutants, and the long-term radiative forcings are dominated by CO2 (Fig. 3).
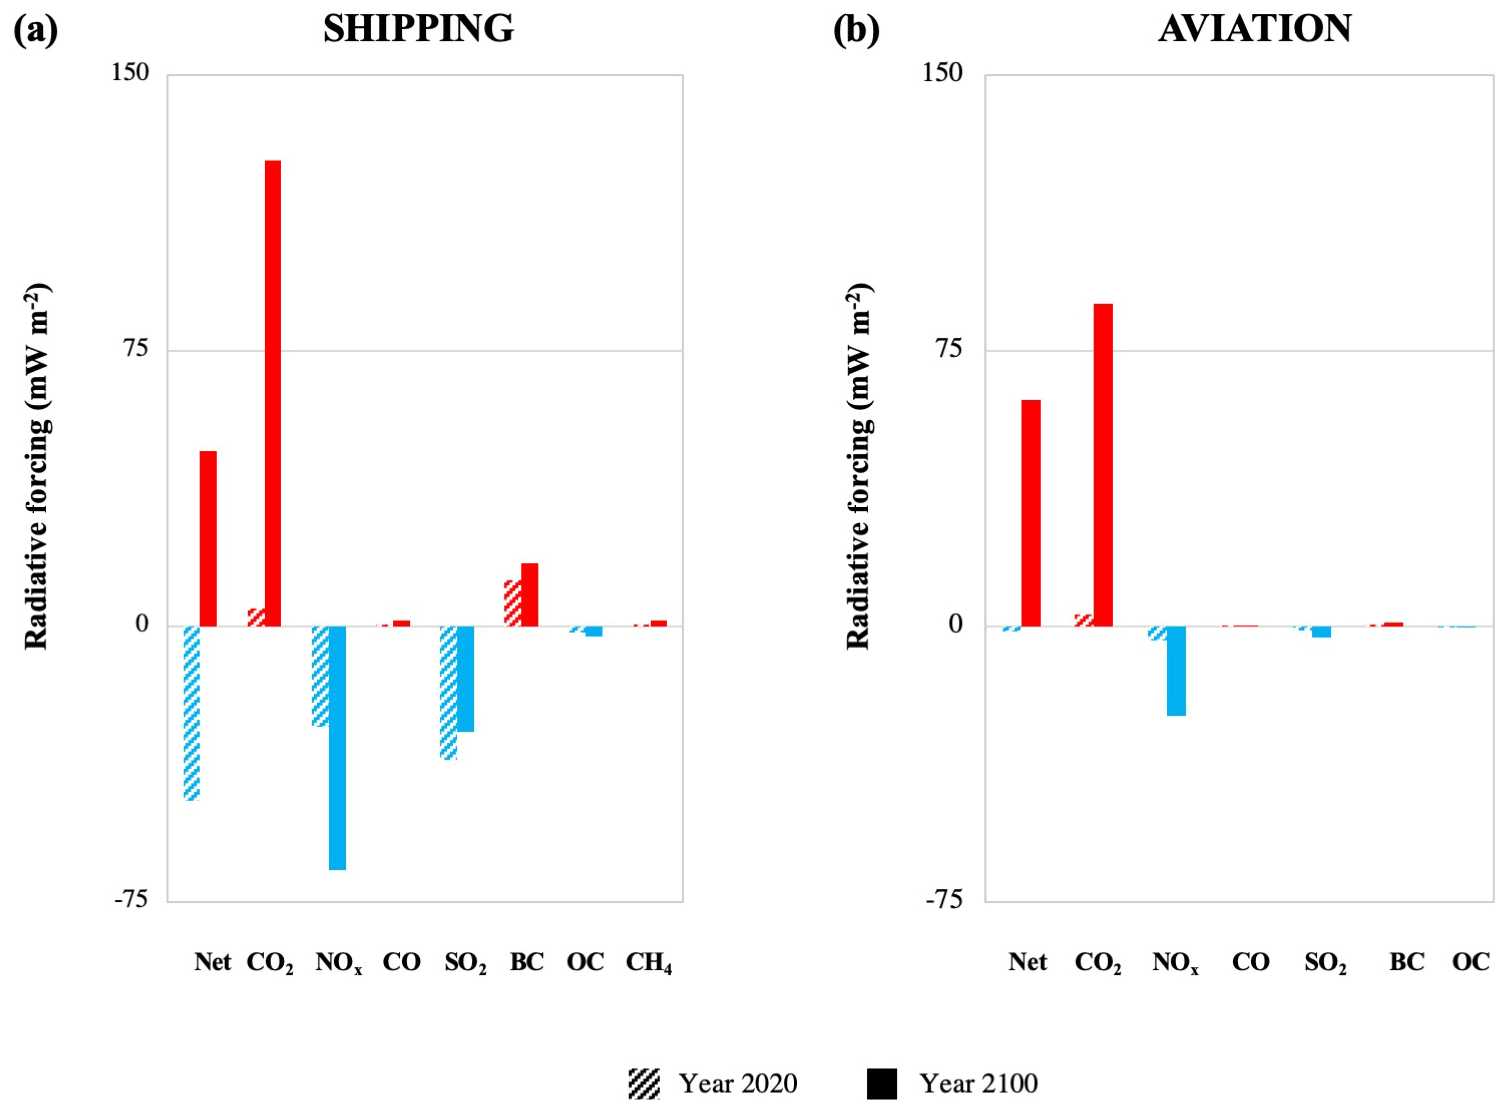
Figure 3Contribution of emittants to radiative forcing in 2100 (defined as the forcing at the tropopause after stratospheric temperature adjustment) from business-as-usual emissions from (a) international shipping and (b) international aviation. Radiative forcings are presented for the year 2020 (hashed), which represent forcings from emissions that year, and the year 2100 (solid), which represent the change in forcings from 2020 to 2100.
The net radiative forcing for international shipping is −47 mW m−2 in 2020 and +48 mW m−2 in 2100. The shift from negative to positive is due to the large increase in CO2 emissions and their accumulation over time in the atmosphere. A considerable amount of the positive radiative forcing from CO2 emissions in 2100 (+127 mW m−2) is offset by a relatively large negative radiative forcing in 2100 from NOx emissions (−66 mW m−2). Net radiative forcing due to NOx emissions is a combination of negative and positive radiative forcings from indirect effects; negative forcings arise from reductions in methane, the production of nitrate, and nitrate's effect on clouds, and positive forcings arise from the production of tropospheric ozone. Indirect aerosol effects from all species yield a radiative forcing of −32 mW m−2 in 2100.
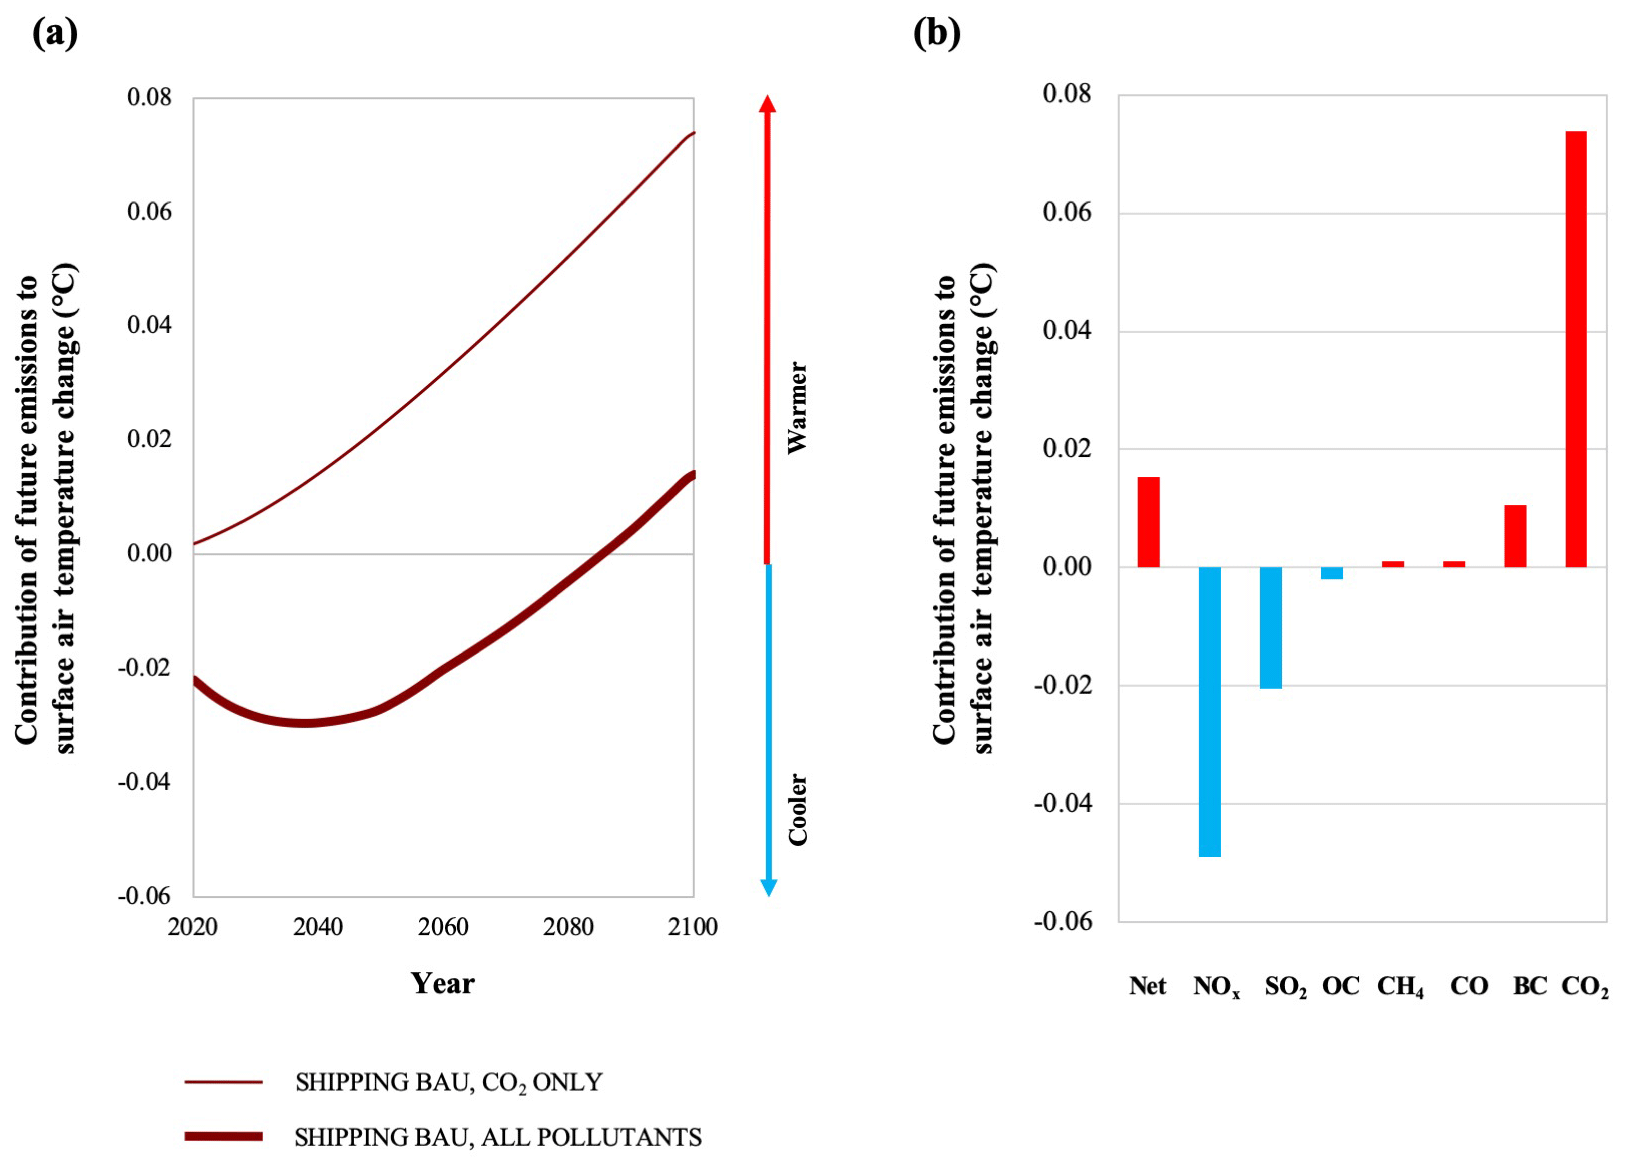
Figure 4Contribution of future emissions to surface air temperature change (∘C) associated with business-as-usual emissions starting in 2020 and continuing through the end of the century from international shipping. Future temperature impacts are presented (a) for emissions of CO2 only (thin line) and all pollutants (thick line), as well as (b) the contribution of individual pollutants in the year 2100.
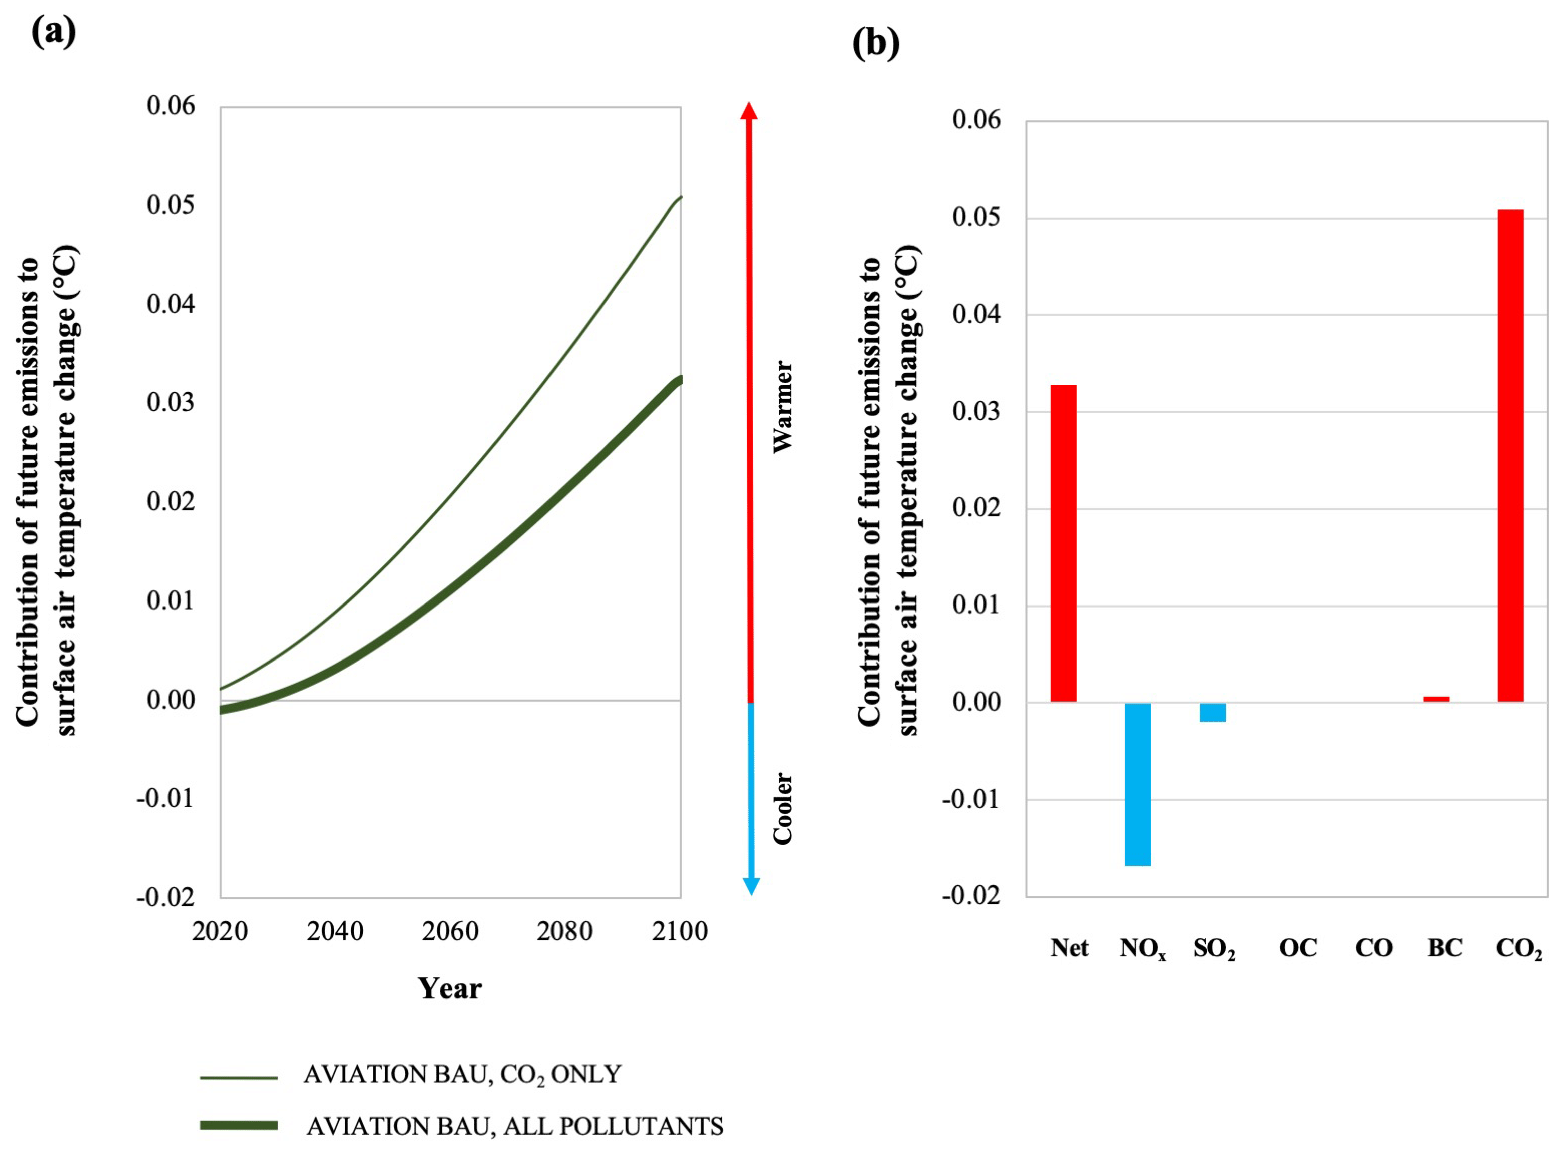
Figure 5Contribution of future emissions to surface air temperature change (∘C) associated with business-as-usual emissions starting in 2020 and continuing through the end of the century from international aviation. Future temperature impacts are presented (a) for emissions of CO2 only (thin line) and all pollutants (thick line), as well as (b) the contribution of individual pollutants in 2100.
Radiative forcings derived in this study from shipping emissions of CO2 and NOx are consistent with the literature. Previous estimates of CO2's present-day (early 2000s) impact range from +26 to +43 mW m−2, corresponding to emissions of 500 and 800 Tg CO2 yr−1 (Eyring et al., 2010). This is consistent with this analysis when accounting for the anticipated growth in CO2 emissions of more than 5-fold by 2100 since the early 2000s (IMO, 2014). Previous studies estimate radiative forcings from NOx that range from +8 to +41 mW m−2 for indirect effects on tropospheric ozone (compared to our value of +25 mW m−2 in 2100) and −56 to −11 mW m−2 for indirect effects on methane (compared to our value of −22 mW m−2 in 2100) for present-day emissions of around 2.9 to 6.5 Tg N yr−1 (we assume NOx emissions of 5.6 Tg N yr−1 in the year 2100) (Eyring et al., 2010). For SO2 emissions from shipping, previous studies estimate direct radiative forcings from −47 to −12 mW m−2 due to the production of sulfate; our estimate is −14 mW m−2 in 2100 from emissions that are lower (2.0 Tg S yr−1) than present-day values in the literature (3.4 to 6.0 Tg S yr−1) (Eyring et al., 2010). Our estimate of direct radiative forcing from black carbon (+5 mW m−2 in 2100 from emissions of 0.2 Tg BC yr−1) is slightly higher than estimates in the literature (+1.1 to +2.9 mW m−2 in 2000–2005 from emissions of 0.05 to 0.3 Tg BC yr−1) (Eyring et al., 2010). Indirect effects of aerosols have enormous ranges in estimates in the literature (Righi et al., 2011), but we note that our estimate appears to be on the lower end.
The net radiative forcing for international aviation emissions (note: not including impacts on contrails and cirrus clouds) is −1.4 mW m−2 in 2020 and +62 mW m−2 in 2100. Although radiative forcings are smaller for CO2 for aviation compared to shipping due to slightly less emissions, there are proportionally less emissions of the negative forcing precursors NOx and SO2, yielding higher net radiative forcing from aviation. As with the shipping forcings, the large CO2 radiative forcing in 2100 (+87 mW m−2) is partially offset by the strong negative forcing from NOx emissions (−24 mW m−2). Indirect aerosol effects from all species yield a radiative forcing of −10 mW m−2 in 2100.
Estimates of present-day radiative forcing from aviation in the literature include both domestic and international emissions, whereas our estimates of future radiative forcings exclude domestic travel. Our estimates of radiative forcing from CO2 emissions are in agreement with previous estimates when accounting for different emissions inputs (such as +87 mW m−2 in 2100 from emissions of 3670 Tg CO2 yr−1 compared to +28 mW m−2 in 2005 from emissions of 641 Tg CO2 yr−1 in Lee et al., 2009). Our estimates for radiative forcings from NOx, SO2 (direct), and black carbon (direct) are slightly smaller than what is presented in the literature, despite larger emissions projected for the year 2100 compared to the present day, but there are large uncertainties associated with these estimates and a low level of scientific understanding (Sausen et al., 2005; Fuglestvedt et al., 2008; Lee et al., 2009). For example, Brasseur (2016) estimate +6 to +37 mW m−2 for indirect effects of NOx emissions on tropospheric ozone (compared to our value of +11 mW m−2 in 2100) and −8 to −12 mW m−2 for indirect effects on methane (compared to our value of −8 mW m−2 in 2100). Gettelman and Chen (2013) conduct a more sophisticated assessment of the climate impact of aviation aerosols than what is presented here and report an estimate of −46 mW m−2 from combined sulfate direct and indirect effects; this is considerably larger than our estimate of −3 mW m−2 in 2100.
Radiative forcings directly impact temperatures – a net positive forcing has a warming tendency, and a net negative forcing has a cooling tendency. Figures 4 and 5 show the temperature responses over time to projected emissions from both sectors. Given that the ambition for the proposed and agreed upon mitigation policies within the international shipping and aviation sectors is based on the need to cut CO2 emissions from each sector, we isolate the temperature impacts from the CO2 emissions in addition to the net effect from all emitted climate pollutants.
Figure 4a shows the impact of future international shipping emissions (beginning in 2020) on surface air temperature change throughout the 21st century. In the year 2020, the impact on temperature represents the contribution from that year's worth of emissions only, and then every year forward represents the cumulative effect as some pollutants build up in the atmosphere over time from continuous emissions. While the CO2 effect is always that of warming and grows over time from both growing emissions and accumulating concentrations due to the long atmospheric lifetime of CO2, the inclusion of all climate pollutants yields a net cooling effect in the near term consistent with the net negative forcings discussed above. It is not until the 2080s that the shipping net effect shifts to warming. This is consistent with Unger et al. (2010), who show strong near-term cooling tendencies from the shipping sector that lessen over time as CO2 builds up in the atmosphere. However, note that their study analyzed perpetual year-2000 emissions and not a BAU scenario. This is also consistent with Fuglestvedt et al. (2009), which predicts that the accepted regulations in the shipping sector's emissions of sulfur dioxide and nitrogen oxides will lead to the sector having a net cooling effect for about 70 years, after which the sector switches to warming. Our analysis predicts a slightly more rapid shift to warming (after about 65 years in 2085), likely due to our inclusion of the warming climate pollutant black carbon, which is not featured in the analysis by Fuglestvedt et al. (2009).
Based on our BAU projections, future CO2 emissions from international shipping result in an additional warming of 0.07 ∘C by the year 2100. However, when all pollutants are considered, the net warming from shipping in 2100 drops to 0.01 ∘C due to the net warming and cooling effects from non-CO2 pollutants (Fig. 4a).
For the year 2100, the temperature impacts attributed individually to emissions of CO2, black carbon, methane, nitrogen oxides, sulfur dioxide, organic carbon, and carbon monoxide are shown in Fig. 4b. The indirect effects of aerosols are included in the analysis of the temperature impacts for each isolated pollutant. Specifically, shipping's cooling effect, which offsets the CO2 warming effect, is dominated by the cooling pollutant precursor nitrogen oxides. The net cooling from nitrogen oxides arises from nitrate formation, indirect aerosol effects from nitrates, the formation of tropospheric ozone, the reduction of methane, and effects of the net forcings on the carbon cycle (cooling in the ocean suppresses CO2 diffusion from the ocean into the atmosphere). Given that sulfur dioxide emissions – a precursor to the cooling pollutant sulfate – are projected to decrease significantly due to the sulfur fuel regulation newly adopted by the IMO, sulfur dioxide from shipping contributes less significantly to cooling. Recent studies have demonstrated the potential for low-sulfur shipping scenarios to reduce the indirect aerosol effect from shipping sulfur emissions (Lauer et al., 2009; Righi et al., 2011). However, the remaining emissions of sulfur dioxide from the shipping sector throughout the century are still responsible for about 0.02 ∘C of cooling by the year 2100.
While BAU organic carbon, carbon monoxide, and methane have nearly negligible contributions to shipping's influence on end of century temperatures, shipping's black carbon emissions are responsible for 0.01 ∘C warming and add to CO2's warming effects (Fig. 4b). We note that for both sectors, our calculations assume no change in the geographical distribution of emissions. Recent literature has demonstrated that the location of non-CO2 emissions can have a large influence on their subsequent climate impact (Fuglestvedt et al., 2014; Kohler et al., 2013; Fromming et al., 2012; Lund et al., 2017; Skowron et al., 2015).
Figure 5a shows the impact of future international aviation emissions (beginning in 2020) on surface air temperature change throughout the 21st century. The contribution of CO2 emissions to future warming over time and in the year 2100 is slightly lower than that from the shipping sector (0.05 ∘C by 2100). However, the inclusion of non-CO2 climate pollutant emissions does not yield a net cooling effect for several decades as it does with shipping and reduces warming by the end of the century to 0.03 ∘C (note that we do not include the impacts on contrails and cirrus clouds here). For a few years, the net temperature impact from future aviation emissions is cooling but then quickly switches to warming and increases steadily through the end of the century (consistent with radiative forcing calculations in Unger et al. (2010) for constant year-2000 emissions). Similar to shipping, the cooling effect is dominated by the cooling precursor gas nitrogen oxide (Fig. 5b). By 2100, nitrogen oxides are responsible for a cooling of 0.02 ∘C, while the end-of-century contributions from all other non-CO2 climate pollutants (sulfur dioxide, organic carbon, carbon monoxide, and black carbon) are negligible. Recall that the indirect effects of aerosols are included in the analysis of the temperature impacts for each isolated pollutant. We note that some studies have investigated the effect of aviation soot on natural cirrus clouds (Penner et al., 2019) or the effect on warm clouds (Gettelman and Chen, 2013; Righi et al., 2013; Kapadia et al., 2016). MAGICC takes into account indirect effects of soot, such as simplified parameterizations of impacts on cloud brightness and lifetime, but does not include more sophisticated treatments as analyzed in previous studies.
Our projections for the contribution to future warming from international shipping and aviation are slightly lower than the estimated range for each sector's 2100 share of warming estimated in Skeie et al. (2009). Our estimate of international aviation's contribution to warming is below the 0.11 to 0.28 ∘C range, but Skeie et al. (2009) analyzed combined domestic and international transport emissions. Further, the new emissions projections generated by the ICAO in 2019 suggest lower projected emissions from aviation over the next century (ICAO, 2019a). Our shipping warming impact estimates are at the lower end of the −0.01 to 0.25 ∘C range, attributed to the differences in methodology discussed below.
First, our model includes indirect aerosol effects, particularly the climate impact associated with the nitrogen oxide production of nitrate aerosols, which yield negative forcings that are not considered in the analysis by Skeie et al. (2009). This inclusion also explains why nitrogen oxides yield net cooling impacts in our analysis, while they yield net warming impacts by Skeie et al. (2009) due mainly to warming from the production of tropospheric ozone not canceled out by cooling from indirect effects.
Second, our shipping estimates are also lower because Skeie et al. (2009) only consider the emissions of CO2, nitrogen oxides, and sulfur dioxide for each sector, and emissions profiles are based on older projections. In particular, the projected emissions of CO2 and nitrogen oxides in Skeie et al. (2009) are both higher than our projected emissions (which both yield more warming impacts in the absence of indirect aerosol effects), while their emissions of sulfur dioxide are lower than our projections (which means less cooling from sulfate). Acknowledging these differences in methodology, we observe the same general warming trends within our scenarios and the literature, wherein aviation emissions exhibit an increasing net warming effect, while shipping emissions result in a declining cooling trend until the end of the century.
In the RCP scenarios presented by Lund et al. (2012), shipping is projected to cause a cooling of between −0.02 and −0.04 ∘C by mid-century. Our analysis estimates that shipping is responsible for −0.03 ∘C in the year 2050, which falls within this range. Further, the authors' findings are in agreement with those presented in this analysis through their observation of warming later in the century once the accumulating CO2 emissions impact overruns the cooling impact of nitrous oxides and sulfur dioxide, particularly due to the reduced sulfur dioxide emissions associated with the implemented fuel regulations.
Our estimates for the contribution to global average temperature in the year 2100 from the aviation sector's CO2 emissions of 0.05 ∘C falls at the lower end of the range presented by Terrenoire et al. (2019), between 0.04 and 0.1 ∘C, based on a set of eight CO2 emissions projections contrasting in traffic growth and efficiency gains. We note that this analysis includes the impact of both domestic and international aviation. Our estimate of the impact of the aviation sector is also less than that of Huszar et al. (2013), at 0.2 or 0.1 ∘C with and without the impact of the non-CO2 signal, respectively. This analysis also does not account for aviation-produced aerosols but does include the impact of water vapor emissions (as well as that of contrail–cirrus), leading to an elevated warming associated with the sector in comparison to our analysis.
Our model does not include radiative effects from linear contrails or contrail-induced cirrus cloudiness. Although studies suggest a low level of scientific understanding for the climate impacts of linear contrails and a very low level of scientific understanding of induced cirrus cloudiness (Lee et al., 2009), considerable work has been done recently towards improving our understanding of these effects. Estimates of the present-day radiative impact of linear contrails range from +3 to +12 mW m−2 (Lee et al., 2009; Brasseur, 2016) and of cirrus cloudiness range from +12 to +63 mW m−2 (Lee et al., 2009; Schumann et al., 2015; Brasseur, 2016; Bock and Burkhardt, 2016); for context, this is compared to around 30 mW m−2 from CO2 emissions – note these values are for both domestic and international aviation. As air traffic rates increase, we expect the radiative forcings from contrails and changes in cirrus cloudiness to increase as well; Bock and Burkhardt (2019) suggest an increase in contrail–cirrus radiative forcing by a factor of 3 from the present day through 2050 due to increases in air traffic and also a slight shift towards higher altitudes.
Without growth in air traffic, the inclusion of these effects would increase our radiative forcing estimates in 2100 by 15 % to 75 % based on the lower and upper estimates of both linear contrails and cirrus cloudiness. Assuming 5-fold growth in air traffic from 2005 to 2100, our radiative forcing estimate from international aviation could increase by 75 % to 350 %. The resulting impact on temperature responses to BAU international aviation could therefore be considerably higher than our projection of 0.05 ∘C in 2100: 0.06 to 0.09 ∘C based on current air traffic patterns and 0.09 to 0.23 ∘C for a 5-fold increase in air traffic.

Figure 6Surface air temperature changes associated with various policy scenarios for emissions mitigation in international (a) shipping and (b) aviation. Each business-as-usual scenario presents the contribution to future surface air temperature from the emissions of all climate pollutants starting in 2020 and continuing through the end of the century.
3.2 Avoided warming from mitigation measures
The policy scenarios analyzed have significant potential to reduce future temperature impacts associated with emissions from the international shipping and aviation sectors (Fig. 6). The IMO greenhouse gas target of a 50 % reduction in CO2 emissions below 2008 levels by 2050 and full decarbonization of the industry by 2100 results in an avoided future warming of 0.06 ∘C by 2100. This avoided warming reduces the shipping sector's contribution to future warming from CO2 by almost 85 % at the end of the century. A more stringent mitigation scenario in which decarbonization is achieved by mid-century (consistent with a 1.5 ∘C warming cap) increases avoided warming to 0.07 ∘C by 2100, or almost 100 % of the original unabated contribution to warming from the sector's CO2 emissions.
Because the non-CO2 climate pollutants emitted by the shipping sector yield a net cooling, the scenarios that reduce their emissions proportional to the reductions in CO2 outlined in each policy increase each scenario's contribution to future warming and consequently reduce their relative avoided warming. Specifically, the IMO minimum and maximum ambition greenhouse gas targets reduce the anticipated BAU warming from the shipping sector by about 0.02 and 0.01 ∘C by the end of the century, respectively (in comparison to 0.06 and 0.07 ∘C in the CO2-only scenarios, respectively). We expect that the true warming mitigation provided by these policies lies within these bounds.
The various mitigation scenarios outlined in Table 1 for the international aviation sector result in an avoided future warming of 0.01 to 0.05 ∘C by 2100 relative to a BAU baseline. Full implementation of CORSIA under current guidelines (ending in 2035 and then allowing emissions to increase along a business-as-usual pathway) results in an avoided warming of 0.01 ∘C by 2100 (a 20 % reduction of warming from a CO2 BAU baseline). However, extending CORSIA's offsetting and reduction program through the end of the century more than doubles the climate benefit (0.02 ∘C avoided warming), avoiding about 40 % of the CO2 BAU baseline warming. The scenario that follows CORSIA and then decarbonizes the sector by the year 2100 (CORSIA-DECARB2100) reduces future warming by 0.04 ∘C by the end of the century, avoiding about 80 % of the CO2 BAU warming. The most aggressive mitigation policy, completing CORSIA followed by decarbonization of the sector by 2050, results in an avoided warming of 0.05 ∘C by 2100 (about a 90 % reduction of warming from a CO2 BAU baseline). The avoided warming in the year 2100 associated with each investigated policy scenario for the emissions mitigation of international shipping and aviation is outlined in Fig. 7.
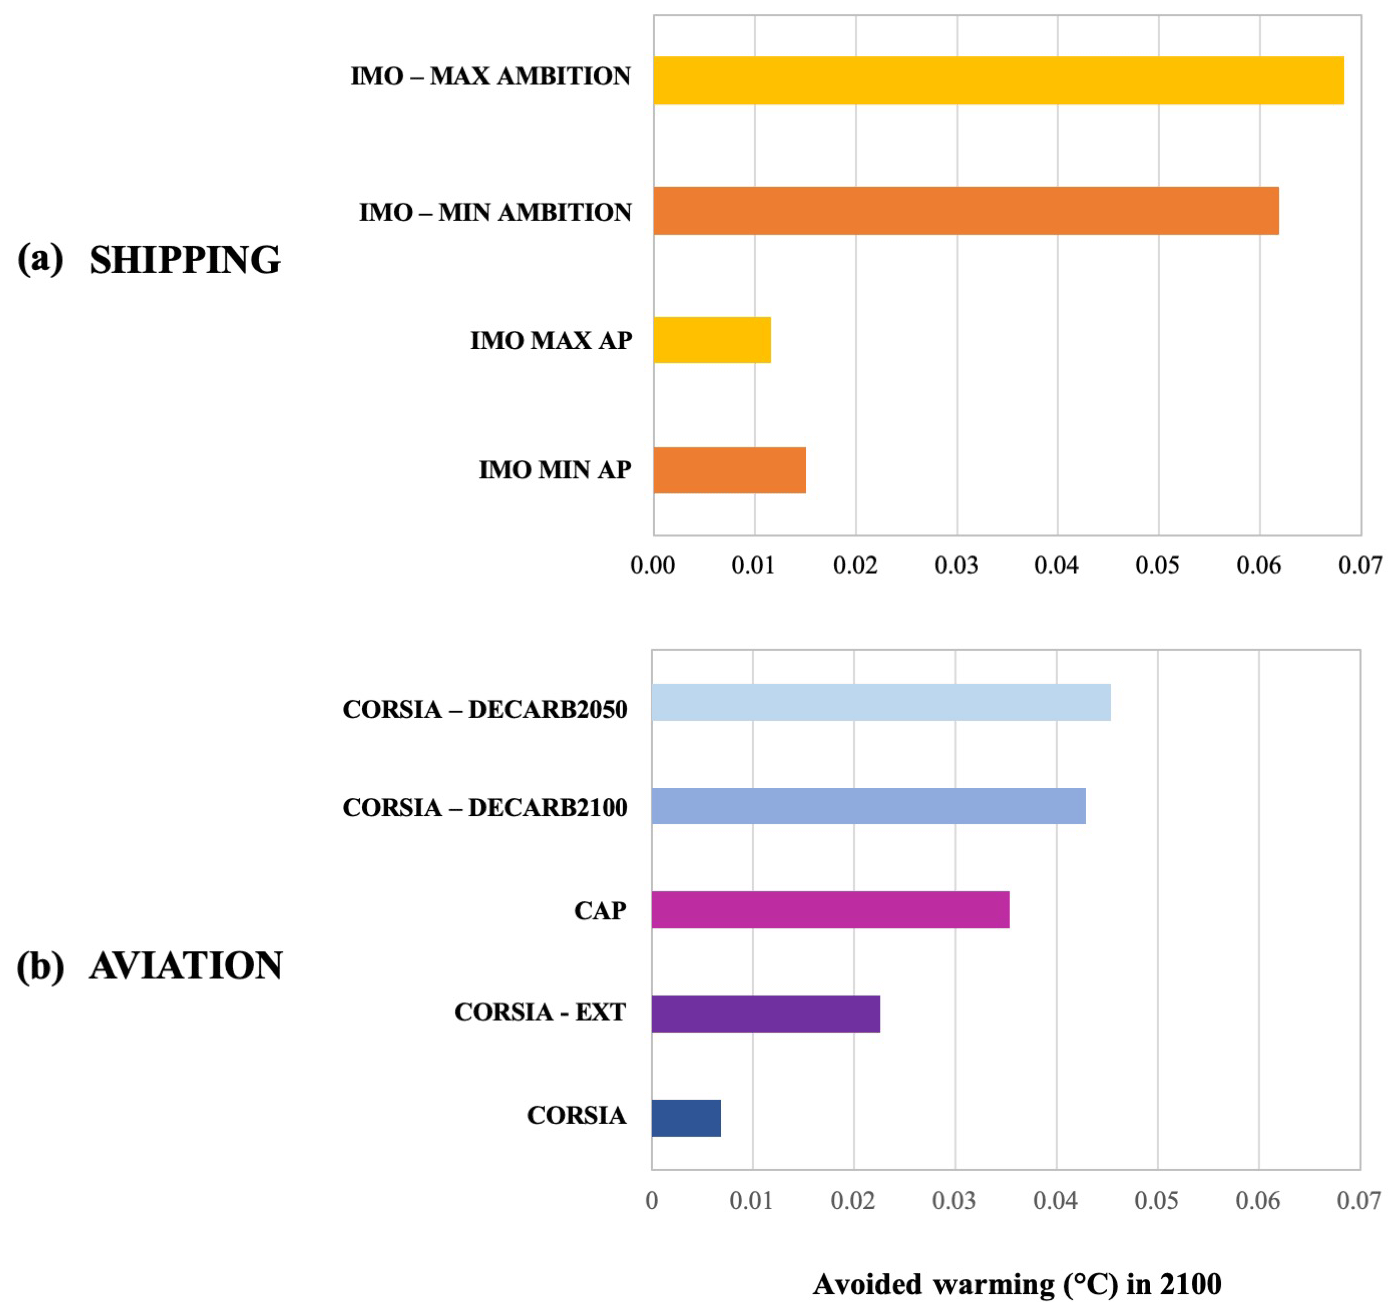
Figure 7Avoided warming in the year 2100 associated with various policy scenarios for emissions mitigation in international (a) shipping and (b) aviation.
The warming mitigation potential of the various policy scenarios associated with aviation were evaluated based on three CO2 BAU growth patterns. While the BAU pathway dictates the magnitude of projected future warming, the associated avoided warming from each policy scenario is relative to the BAU baseline. For international aviation, in comparison to the 0.05 ∘C contribution to future warming from CO2 only expected from the central growth rate pattern, 0.10 and 0.02 ∘C of future warming are expected from the emission of CO2 in the upper and lower emissions growth rate patterns, respectively. The mitigation scenario that mimics the structure of the IMO minimum ambition greenhouse gas target (CORSIA–DECARB2100), for example, is expected to reduce the warming attributed to the emissions of CO2 from the sector by 0.04 ∘C by the end of the century in the limited growth rate pattern and is expected to avoid 0.09 and 0.01 ∘C by the end of the century in the upper and lower growth rate patterns, respectively. These avoided temperatures from the upper, central, and lower growth scenarios represent 87 %, 84 %, and 66 % of the unabated warming levels from CO2 emissions, respectively. While the expected BAU warming from the sector's CO2 emissions varies significantly between each pattern of growth, the potential to reduce this warming through proposed, stringent mitigation scenarios scales proportionally for the two higher emissions growth rate scenarios. In contrast, the BAU lower growth scenario demonstrates a future in which emissions remain relatively close to 2020 levels throughout the century. Because the most stringent policy scenarios investigated in this analysis focus on emissions reductions taking place mid-century to late century, a lower percent of warming reduction is observed for each policy within the lower growth scenario in comparison to the upper and central scenarios.
Although we do not expect that the offsetting programs analyzed here will affect the amount of contrail and cirrus cloud formation and will therefore not impact the avoided warming potential, improvements to aircraft technology and management practices may reduce the prevalence and thickness of these clouds, for example due to increased fuel efficiency. Similarly, we do not consider the reduction of non-CO2 climate pollutants emitted by the aviation sector in the mitigation scenarios. However, offsetting schemes such as CORSIA do implement the use of biofuels as well as aircraft technology and air traffic management improvements, both of which have the potential to impact future emissions of non-CO2 climate pollutants and the density of contrail–cirrus (Bock and Burkhardt, 2019; Caiazzo et al., 2017; Burkhardt et al., 2018). While the influence of these changes on the non-CO2 impact of international aviation is currently not well estimated, their impact should be considered in future analyses as understanding develops.
Quantifying the temperature impacts of future international aviation and shipping emissions – both for business-as-usual pathways and mitigation scenarios – is essential to understanding the benefits of proposed policies and targets. Given that international aviation and shipping are important contributors to the emission of climate pollutants, earlier studies have analyzed their current and BAU future climate impacts using a variety of methods. To build upon these previous analyses, we analyzed the climate benefits over time associated with accepted, proposed, and prospective mitigation policies for each sector. We use a reduced-complexity climate model to determine the BAU temperature contribution due to the future emissions of international aviation and shipping from all emitted climate pollutants and the potential to avoid future warming based on a series of realistic mitigation scenarios.
Using the reduced-complexity climate model MAGICC, we estimate that under BAU conditions, future CO2 emissions (2020 through the end of the century) from the international shipping and aviation sectors would be responsible for 0.07 and 0.05 ∘C of future warming by 2100, respectively (0.01 and 0.03 ∘C when including the sectors' emissions of non-CO2 climate pollutants; additional inclusion of aviation-induced contrails and clouds could increase the warming associated with international aviation by up to 600 %). Planned and proposed mitigation policies in each sector that specifically target CO2 emissions have the potential to significantly reduce this climate impact. However, policies that target the mitigation of non-CO2 climate pollutants, often through air quality management, result in emissions reductions that may not always avoid future warming (Kapadia et al., 2016; Sofiev et al., 2018; Yim et al., 2015). For example, if the emissions of all shipping-produced cooling agents (sulfur dioxide, nitrogen oxides, and organic carbon) were immediately halted and the shipping sector successfully decarbonized by mid-century, the sector would increase the world's temperatures through the end of the century (Fuglestvedt et al., 2009).
Given that we have already reached a global warming level of around 1 ∘C above preindustrial levels (Intergovernmental Panel on Climate Change, 2018), there is an “allowable warming” of 0.5 to 1.0 ∘C of additional warming should we wish to stabilize at the 1.5 or 2 ∘C threshold, respectively. Together, future warming from the CO2 emissions of international shipping and aviation reach about 0.12 ∘C by the end of the century, which is 12 %–24 % of this remaining allowable warming. However, certain policy measures have the potential to significantly avoid the vast majority of this future warming. The IMO minimum ambition greenhouse gas target (decarbonize the sector by 2100) and its mirrored aviation scenario (CORSIA offsetting program extended followed by decarbonizing by 2100) have the potential to reduce future warming associated with the CO2 emissions from each sector by more than 80 %, with even further reductions should both sectors decarbonize by mid-century in comparison to 2100 (a trajectory consistent with achieving 1.5 ∘C of maximum warming).
For context, achieving the Paris Agreement committed pledges and targets is projected to avoid 0.3 ∘C of warming by the end of the century compared to current policies (Climate Action Tracker, 2019). Adding the avoided warming from the already agreed upon international shipping target of decarbonization by the end of the century (0.06 ∘C) and the extension of the CORSIA aviation offsetting program (0.02 ∘C) increases this potential by over 25 %. Further, pursuing the most ambitious, yet feasible, mitigation measures for international shipping and aviation could increase the avoided warming from the Paris Agreement by nearly 50 %. Overall, the proposed and prospective mitigation measures for both of these sectors have considerable climate benefits in the context of achieving international temperature goals.
The MAGICC v6 model executable is available for download at https://www.magicc.org/ (last access: 1 November 2019), although the model itself is closed source. The user manual can be accessed at http://wiki.magicc.org/index.php?title=Manual_MAGICC6_Executable (last access: 1 November 2019). Full model details along with 19 sets of Atmosphere–Ocean General Circulation Model (AOGCM)-calibrated parameters used here for ensemble members are found in Meinshausen et al. (2011a). We update the default values of methane, tropospheric ozone radiative efficiency, and methane atmospheric lifetime to values in Myhre et al. (2013) and Etminan et al. (2016).
Results from MAGICC are available from Catherine C. Ivanovich (civanovich@edf.org) upon request.
CCI and IBO designed the experiments, and CCI carried them out. AP and PPC curated data and provided guidance on the policies. CCI and IBO prepared the paper with contributions from all coauthors.
The authors declare that they have no conflict of interest.
We thank Nathaniel Keohane and Steven Hamburg for reviewing our paper.
Catherine C. Ivanovich was funded by the High Meadows Foundation. Ilissa B. Ocko was funded by the Heising Simons Foundation and the Robertson Foundation.
This paper was edited by Mathias Palm and reviewed by two anonymous referees.
Azar, C. and Johansson, D. J. A.: Valuing the non-CO2 climate impacts of aviation, Clim. Change, 111, 559–579, https://doi.org/10.1007/s10584-011-0168-8, 2012.
Balacombe, P., Brierley, J., Lewis, C., Skatvedt, L., Speirs, J., Hawkes, A., and Staffell, I.: How to decarbonize international shipping: Options for fuels, technologies and policies, Energy Convers. Manag., 182, 72–88, https:// doi.org/10.1016/j.enconman.2018.12.080, 2019.
Berntsen, T. and Fuglestvedt, J.: Global temperature responses to current emissions from the transport sector, P. Natl. Acad. Sci. USA, 105, 19154–19159, https://doi.org/10.1073/pnas.0804844105, 2008.
Berntsen, T. K., Fuglestvedt, J., Myhre, G., Stordal, F., and Berglen, T. F.: Abatement of greenhouse gases: Does location matter?, Clim. Change, 74, 377–411, https://doi.org/10.1007/s10584-006-0433-4, 2006.
Bock, L. and Burkhardt, U.: Reassessing properties and radiative forcing of contrail cirrus using a climate model, J. Geophys. Res.-Atmos., 121, 9717–9736, https://doi.org/10.1002/2016JD025112, 2016.
Bock, L. and Burkhardt, U.: Contrail cirrus radiative forcing for future air traffic, Atmos. Chem. Phys., 19, 8163–8174, https://doi.org/10.5194/acp-19-8163-2019, 2019.
Bouman, E. A., Lindstad, E., Rialland, A. I., and Stromman, A. H.: State-of-the-art technologies, measures, and potential for reducing GHG emissions from shipping – A review, Transp. Res. D., 52, 408–421, https://doi.org/10.1016/j.trd.2017.03.022, 2017.
Brasseur, G.: Impact of aviation on climate: FAA's Aviation Climate Change Research Initiative (ACCRI) Phase II, Bull. Amer., 97, 561–583, https://doi.org/10.1175/BAMS-D-13-00089.1, 2016.
Burkhardt, U., Bock, L., and Bier, A.: Mitigating the contrail cirrus climate impact by reducing aircraft soot number emissions, Clim. At. Sci., 1, 1–7, https://doi.org/10.1038/s41612-018-0046-4, 2018.
Caiazzo, F., Agarwal, A., Speth, R. L., and Barrett, S. R. H.: Impact of biofuels on contrail warming, Environ. Res. Lett., 12, 1–9, https://doi.org/10.1088/1748-9326/aa893b, 2017.
Climate Action Tracker (CAT): Climate Action Tracker (CAT), available at: https://climateactiontracker.org/publications/warming-projections-global-update-dec-2018/, last access: 4 February 2019.
Crippa, M., Janssens-Maenhout, G., Dentener, F., Guizzardi, D., Sindelarova, K., Muntean, M., Van Dingenen, R., and Granier, C.: Forty years of improvements in European air quality: regional policy-industry interactions with global impacts, Atmos. Chem. Phys., 16, 3825–3841, https://doi.org/10.5194/acp-16-3825-2016, 2016.
Environmental Defense Fund (EDF): ICAO's market-based measure, available at: https://www.edf.org/climate/icaos-market-based-measure, last access: 29 January 2019.
Etminan, M., Myhre, G., Highwood, E. J., and Shine, K. P.: Radiative forcing of carbon dioxide, methane, and nitrous oxide: A significant revision of the methane radiative forcing, Geophys. Res. Lett., 43, 12614–12623, https://doi.org/10.1002/2016GL071930, 2016.
Eyring, V., Isaksen, I. S. A., Berntsen, T., Collins, W. J., Corbett, J. J., Endresen, O., Grainger, R. G., Moldanova, J., Schlager, H., and Stevenson, D. S.: Transport impacts on atmosphere and climate: Shipping, Atmos. Environ., 44, 1–37, https://doi.org/10.1016/j.atmosenv.2009.04.059, 2010.
Fromming, C., Ponater, M., Dahlmann, K., Grewe, V., Lee, D. S., and Sausen, R.: Aviation-induced radiative forcing and surface temperature change in dependence of emission altitude, J. Geophys. Res., 117, D19104, https://doi.org/10.1029/2012JD018204, 2012.
Fuglestvedt, J. S., Berntsen, T., Myhre, G., Rypdal, K., and Skeie, R. B.: Climate forcing from the transport sectors, P. Natl. Acad. Sci. USA, 105, 454–458, https://doi.org/10.1073/pnas.0702958104, 2008.
Fuglestvedt, J., Berntsen, T., Eyring, V., Isaksen, I., Lee, D. S., and Sausen, R.: Shipping Emissions: From Cooling to Warming of Climate – and Reducing Impacts on Health, Environ. Sci. Technol., 43, 9057–9062, https://doi.org/10.1021/es901944r, 2009.
Fuglestvedt, J., Dalsoren, S. B., Samset, B. H., Berntsen, T., Myhre, G., Hodnebrog, O., Eide, M. S., and Bergh, T. F.: Climate penalty for shifting shipping to the Arctic, Environ. Sci. Technol., 48, 13273–13279, https://doi.org/10.1021/es502379d, 2014.
Gettelman, A. and Chen, C.: The climate impact of aviation aerosols, Geophys. Res. Lett., 40, 2785–2789, 2013.
Hansen, J., Sato, M., Ruedy, R., Nazarenko, L., Lacis, A., Schmidt, G. A., Russell, G., Aleinov, I., Bauer, M., Bauer, S., Bell, N., Cairns, B., Canuto, V., Chandler, M., Cheng, Y., Del Genio, A., Faluvegi, G., Fleming, E., Friend, A., Hall, T., Jackman, C., Kelley, M., Kiang, N., Koch, D., Lean J., Lerner, J., Lo, K., Menon, S., Miller, R., Minnis, P., Novakov, T., Oinas, V., Perlwitz, J., Perlwitz, J., Rind, D., Romanou, A., Shindell, D., Stone, P., Sun, S., Tausnev, N., Thresher, D., Wielicki, B., Wong, T., Yao, M., and Zhang, S.: Efficacy of climate forcings, J. Geophys. Res., 110, D18104, https://doi.org/10.1029/2005JD005776, 2005.
Hoen, M., Faber, J., and Lee, D. S.: Update of Maritime Greenhouse Gas Emissions Projections, CE Delft, the Netherlands, 46 pp., 2017.
Huszar, P., Teyssèdre, H., Michou, M., Voldoire, A., Olivié, D. J. L., Saint-Martin, D., Cariolle, D., Senesi, S., Salas Y Melia, D., Alias, A., Karcher, F., Ricaud, P., and Halenka, T.: Modeling the present and future impact of aviation on climate: an AOGCM approach with online coupled chemistry, Atmos. Chem. Phys., 13, 10027–10048, https://doi.org/10.5194/acp-13-10027-2013, 2013.
Intergovernmental Panel on Climate Change: Aviation and the Global Atmosphere, edited by: Penner, J. E., Lister, D. H., Griggs, D. J., Dokken, D. J., and McFarland, M., Cambridge University Press, Cambridge, United Kingdom, 373 pp., 1999.
Intergovernmental Panel on Climate Change: Global warming of 1.5 ∘C. An IPCC Special Report on the impacts of global warming of 1.5 ∘C above pre-industrial levels and related global greenhouse gas emission pathways, in the context of strengthening the global response to the threat of climate change, sustainable development, and efforts to eradicate poverty, edited by: Masson-Delmotte, V., Zhai, P., Pörtner, H. O., Roberts, D., Skea, J., Shukla, P. R., Pirani, A., Moufouma-Okia, W., Péan, R. Pidcock, C., Connors, S., Matthews, J. B. R., Chen, Y., Zhou, X., Gomis, M. I., Lonnoy, E., Maycock, T., Tignor, M., and Waterfield, T., Incheon, South Korea, 2018.
International Civil Aviation Organization (ICAO): Present and Future Trends in Aircraft Noise and Emissions, Montreal, Canada, 2013.
International Civil Aviation Organization (ICAO): Resolution A39-3: Consolidated statement of continuing ICAO policies and practices related to environmental protection – Global Market-based Measure (MBM) scheme, Montreal, Canada, 2016.
International Civil Aviation Organization (ICAO): Resolution A40-WP/54: ICAO Glaobal Environmental Trends – Present and Future Aircraft Noise and Emissions, Montreal, Canada, 2019a.
International Civil Aviation Organization (ICAO): CORSIA States for Chapter 3 State Pairs, Montreal, Canada, 2019b.
International Energy Agency: World Energy Outlook, OECD Publishing, Paris, France, 2018.
International Maritime Organization: Third IMO Greenhouse Gas Study 2014, Albert Embankment, London, UK, 327 pp., 2014.
International Maritime Organization (IMO): Adoption of the Initial IMO Strategy on Reduction of GHG Emissions from Ships and Existing IMO Activity Related to Reducing GHG Emissions in the Shipping Sector, Note by the International Maritime Organization to the UNFCCC Talanoa Dialogue, International Maritime Organizatio, London, UK, 2018.
Kapadia, Z. Z., Spracklen, D. V., Arnold, S. R., Borman, D. J., Mann, G. W., Pringle, K. J., Monks, S. A., Reddington, C. L., Benduhn, F., Rap, A., Scott, C. E., Butt, E. W., and Yoshioka, M.: Impacts of aviation fuel sulfur content on climate and human health, Atmos. Chem. Phys., 16, 10521–10541, https://doi.org/10.5194/acp-16-10521-2016, 2016.
Kohler, M. O., Radel, G., Shine, K. P., Rogers, H. L., and Pyle J. A.: Latitudinal variation of the effect of aviation NOx emissions on atmospheric ozone and methane and related climate metrics, Atmos. Environ., 64, 1–9, https://doi.org/10.1016/j.atmosenv.2012.09.013, 2013.
Lamarque, J.-F., Bond, T. C., Eyring, V., Granier, C., Heil, A., Klimont, Z., Lee, D., Liousse, C., Mieville, A., Owen, B., Schultz, M. G., Shindell, D., Smith, S. J., Stehfest, E., Van Aardenne, J., Cooper, O. R., Kainuma, M., Mahowald, N., McConnell, J. R., Naik, V., Riahi, K., and van Vuuren, D. P.: Historical (1850–2000) gridded anthropogenic and biomass burning emissions of reactive gases and aerosols: methodology and application, Atmos. Chem. Phys., 10, 7017–7039, https://doi.org/10.5194/acp-10-7017-2010, 2010.
Lauer, A., Eyring, V., Corbett, J. J., Wang, C., and Winebrake, J. J.: Assessment of near-future policy instruments for oceangoing shipping: Impact on atmospheric aerosol burdens and the Earth's radiation budget, Environ. Sci. Technol., 43, 5592–5598, https://doi.org/10.1021/es900922h, 2009.
Lean, J. L.: Cycles and trends in solar irradiance and climate, Wiley Interdiscip. Rev. Clim. Change, 1, 111–112, https://doi.org/10.1002/wcc.18, 2010.
Lee, D. S.: International aviation and the Paris Agreement temperature goals, Department for Transport, Manchester Metropolitan University, Manchester, UK, 15 pp., 2018.
Lee, D. S., Fahey, D. W., Forster, P. M., Newton, P. J., Wit, R. C. N., Lim, L. L., Owen, B., and Sausen, R.: Aviation and global climate change in the 21st century, Atmos. Environ., 43, 3520–3537, https://doi.org/10.1016/j.atmosenv.2009.04.024, 2009.
Lee, D. S., Pitari, G., Grewe, V., Gierens, K., Penner, J. E., Petzold, A., Prather, M. J., Schumann, U., Bais, A., Berntsen, T., Iachetti, D., Lim, L. L., and Sausen, R.: Transport impacts on atmosphere and climate: Aviation, Atmos. Environ., 44, 4678–4734, https://doi.org/10.1016/j.atmosenv.2009.06.005, 2010.
Lund, M. T., Eyring, V., Fuglestvedt, J., Hendricks, J., Lauer, A., Lee, D., and Righi, M.: Global-mean temperature change from shipping toward 2050: improved representation of the indirect aerosol effect in simple climate models, Environ. Sci. Technol., 46, 8868–8877, https://doi.org/10.1021/es301166e, 2012.
Lund, M. T., Aamaas, B., Berntsen, T., Bock, L., Burkhardt, U., Fuglestvedt, J. S., and Shine, K. P.: Emission metrics for quantifying regional climate impacts of aviation, Earth Syst. Dynam., 8, 547–563, https://doi.org/10.5194/esd-8-547-2017, 2017.
Meinshausen, M., Raper, S. C. B., and Wigley, T. M. L.: Emulating coupled atmosphere-ocean and carbon cycle models with a simpler model, MAGICC6 – Part 1: Model description and calibration, Atmos. Chem. Phys., 11, 1417–1456, https://doi.org/10.5194/acp-11-1417-2011, 2011a.
Meinshausen, M., Smith, S. J., Calvin, K., Daniel, J. S., Kainuma, M. L. T., Lamarque, J. F., Matsumoto, K., Montzka, S. A., Raper, S. C. B., Raihi, K., Thomson, A., Velders, G. J. M., and van Vuuren, D. P. P.: The RCP greenhouse gas concentrations and their extensions from 1765 to 2300, Clim. Change, 109, 213–241, https://doi.org/10.1007/s10584-011-0156-z, 2011b.
Myhre, G., Shindell, D., Bréon, F.-M., Collins, W., Fuglestvedt, J., Huang, J., Koch, D., Lamarque, J.-F., Lee, D., Mendoza, B., Nakajima, T., Robock, A., Stephens, G., Takemura, T., and Zhang, H.: Anthropogenic and natural radiative forcing, in: Climate Change 2013: The Physical Science Basis. Contribution of Working Group I to the Fifth Assessment Report of the Intergovernmental Panel on Climate Change, edited by: Stocker, T. F., Qin, D., Plattner, G.-K., Tignor, M., Allen, S. K., Doschung, J., Nauels, A., Xia, Y., Bex, V., and Midgley, P. M., Cambridge University Press, pp. 659–740, https://doi.org/10.1017/CBO9781107415324.018, 2013.
Ocko, I. B., Ramaswamy, V., Ginoux, P., Ming, Y., and Horowitz, L. W.: Sensitivity of scattering and absorbing aerosol direct radiative forcing to physical climate factors, J. Geophys. Res.-Atmos., 117, 1–13, https://doi.org/10.1029/2012JD018019, 2012.
Ocko, I. B., Hamburg, S. P., Jacob, D. J., Keith, D. W., Keohane, N. O., Oppenheimer, M., Roy-Mayhew, J. D., Schrag, D. P., and Pacala, S. W.: Unmask temporal trade-offs in climate policy debates, Science, 356, 492–493, https://doi.org/10.1126/science.aaj2350, 2017.
Ocko, I. B., Naik, V., and Paynter, D.: Rapid and reliable assessment of methane impacts on climate, Atmos. Chem. Phys., 18, 15555–15568, https://doi.org/10.5194/acp-18-15555-2018, 2018.
Penner, J. E., Zhou, C., Garnier, A., and Mitchell, D. L.: Anthropogenic aerosol indirect effects in cirrus clouds, J. Geophys. Res.-Atmos., 123, 11652–11677, https://doi.org/10.1029/2018JD029204, 2019.
Riahi, K., Gruebler, A., and Nakicenovic, N.: Scenarios of long-term socio-economic and environmental development under climate stabilization, Technol. Forecast. Soc. Change, 74, 887–935, https://doi.org/10.1016/j.techfore.2006.05.026, 2007.
Righi, M., Klinger, C., Eyring, V., Hendricks, J., Lauer, A., and Petzold, A.: Climate impacts of biofuels in shipping: Global model studies of the aerosol indirect effect, Environ. Sci. Technol., 45, 3519–3525, https://doi.org/10.1021/es1036157, 2011.
Righi, M., Hendricks, J., and Sausen, R.: The global impact of the transport sectors on atmospheric aerosol: simulations for year 2000 emissions, Atmos. Chem. Phys., 13, 9939–9970, https://doi.org/10.5194/acp-13-9939-2013, 2013.
Sausen, R., Isaksen, I., Grewe, V., Hauglustaine, D., Lee, D. S., Myhre, G., Kohler, M. O., Pitari, G., Schumann, U., Stordal, F., and Zerefos, C.: Aviation radiative forcing in 2000: An update on IPCC (1999), Meteorol. Z., 14, 555–561, https://doi.org/10.1127/0941-2948/2005/0049, 2005.
Schumann, U., Penner, J. E., Chen, Y., Zhou, C., and Graf, K.: Dehydration effects from contrails in a coupled contrail–climate model, Atmos. Chem. Phys., 15, 11179–11199, https://doi.org/10.5194/acp-15-11179-2015, 2015.
Skeie, B. R., Fuglestvedt, J., Berntsen, T., Tronstad Lund, M., Myhre, G., and Rypdal, K.: Global temperature change from the transport sectors: Historical development and future scenarios, Atmos. Environ., 43, 6260–6270, https://doi.org/10.1016/j.atmosenv.2009.05.025, 2009.
Skowron, A., Lee, D. S., and de Leon, R. R.: Variation of radiative forcings and global warming potentials from regional aviation NOx emissions, Atmos. Environ., 104, 69–78, https://doi.org/10.1016/j.atmosenv.2014.12.043, 2015.
Sofiev, M., Winebrake, J. J., Johansson, L., Carr, E. W., Prank, M., Soares, J., Vira, J., Kouznetsov, R., Jalkanen, J. P., and Corbett, J. J.: Cleaner fuels for ships provide public health benefits with climate tradeoffs, Nat. Commun., 9, 1–12, https://doi.org/10.1038/s41467-017-02774-9, 2018.
Stevenson, D. S., Young, P. J., Naik, V., Lamarque, J.-F., Shindell, D. T., Voulgarakis, A., Skeie, R. B., Dalsoren, S. B., Myhre, G., Berntsen, T. K., Folberth, G. A., Rumbold, S. T., Collins, W. J., MacKenzie, I. A., Doherty, R. M., Zeng, G., van Noije, T. P. C., Strunk, A., Bergmann, D., Cameron-Smith, P., Plummer, D. A., Strode, S. A., Horowitz, L., Lee, Y. H., Szopa, S., Sudo, K., Nagashima, T., Josse, B., Cionni, I., Righi, M., Eyring, V., Conley, A., Bowman, K. W., Wild, O., and Archibald, A.: Tropospheric ozone changes, radiative forcing and attribution to emissions in the Atmospheric Chemistry and Climate Model Intercomparison Project (ACCMIP), Atmos. Chem. Phys., 13, 3063–3085, https://doi.org/10.5194/acp-13-3063-2013, 2013.
Terrenoire, E., Hauglustaine, D. A., Gasser, T., and Penanhoat, O.: The contribution of carbon dioxide emissions from the aviation sector to future climate change, Environ. Res. Lett., 14, 084019, https://doi.org/10.1088/1748-9326/ab3086, 2019.
Unger, N., Bond, T. C., Wang, J. S., Koch, D. M., Menon, S., Shindell, D. T., and Bauer, S.: Attribution of climate forcing to economic sectors, P. Natl. Acad. Sci. USA, 107, 3382–3387, https://doi.org/10.1073/pnas.0906548107, 2010.
United Nations Framework Convention on Climate Change: Kyoto Protocol to the United Nations Framework Convention on Climate Change, adopted at: the Conference of the Parties 3, Kyoto, Japan, 1997.
Yim, S. H. L., Lee, G. L., Lee, I. H., Allroggen, F., Ashok, A., Caiazzo, F., Eastham, S. D., Malina, R., and Barrett, S. R. H.: Global, regional and local health impacts of civil aviation emissions, Environ. Res. Lett., 10, 1–12, https://doi.org/10.1088/1748-9326/10/3/034001, 2015.