the Creative Commons Attribution 4.0 License.
the Creative Commons Attribution 4.0 License.
 | 10 Dec 2019
OH chemistry of non-methane organic gases (NMOGs) emitted from laboratory and ambient biomass burning smoke: evaluating the influence of furans and oxygenated aromatics on ozone and secondary NMOG formation
Matthew M. Coggon
Christopher Y. Lim
Abigail R. Koss
Kanako Sekimoto
Jessica B. Gilman
David H. Hagan
Vanessa Selimovic
Kyle J. Zarzana
Steven S. Brown
James M. Roberts
Markus Müller
Robert Yokelson
Armin Wisthaler
Jordan E. Krechmer
Jose L. Jimenez
Christopher Cappa
Jesse H. Kroll
Joost de Gouw
Carsten Warneke
Chamber oxidation experiments conducted at the Fire Sciences Laboratory in 2016 are evaluated to identify important chemical processes contributing to the hydroxy radical (OH) chemistry of biomass burning non-methane organic gases (NMOGs). Based on the decay of primary carbon measured by proton transfer reaction time-of-flight mass spectrometry (PTR-ToF-MS), it is confirmed that furans and oxygenated aromatics are among the NMOGs emitted from western United States fuel types with the highest reactivities towards OH. The oxidation processes and formation of secondary NMOG masses measured by PTR-ToF-MS and iodide-clustering time-of-flight chemical ionization mass spectrometry (I-CIMS) is interpreted using a box model employing a modified version of the Master Chemical Mechanism (v. 3.3.1) that includes the OH oxidation of furan, 2-methylfuran, 2,5-dimethylfuran, furfural, 5-methylfurfural, and guaiacol. The model supports the assignment of major PTR-ToF-MS and I-CIMS signals to a series of anhydrides and hydroxy furanones formed primarily through furan chemistry. This mechanism is applied to a Lagrangian box model used previously to model a real biomass burning plume. The customized mechanism reproduces the decay of furans and oxygenated aromatics and the formation of secondary NMOGs, such as maleic anhydride. Based on model simulations conducted with and without furans, it is estimated that furans contributed up to 10 % of ozone and over 90 % of maleic anhydride formed within the first 4 h of oxidation. It is shown that maleic anhydride is present in a biomass burning plume transported over several days, which demonstrates the utility of anhydrides as markers for aged biomass burning plumes.
- Article
(4082 KB) - Full-text XML
-
Supplement
(4813 KB) - BibTeX
- EndNote


Biomass burning is a significant source of atmospheric non-methane organic gases (NMOGs). Once emitted, biomass burning NMOGs may undergo photochemical reactions to form ozone and secondary organic aerosol (SOA) (Hobbs et al., 2003; Yokelson et al., 2009; Akagi et al., 2013). Wildfire smoke is believed to significantly contribute to summertime ozone levels in fire-prone regions, such as the western United States (Jaffe et al., 2008, 2013, 2018). An assessment of historical ozone data from 1989 to 2004 has shown that daily mean ozone increases by 2 ppb for every 1 million acres of area burned (Jaffe et al., 2008). A warming, drier climate is likely to increase fire activity, which may lead to increased ozone and PM2.5 levels in susceptible regions (Westerling, 2006; Jaffe and Wigder, 2012; Brey and Fischer, 2016; Ford et al., 2018).
Despite its importance, the atmospheric chemistry of biomass burning smoke remains poorly understood due to the complexity of smoke processing. Field observations have shown that ozone enhancement ratios (ΔO3∕ΔCO) may increase (e.g., 0.7 ppb ppb−1, Andreae et al., 1988; Mauzerall et al., 1998), decrease (e.g., −0.07 ppb ppb−1, Alvarado et al., 2010), or remain unchanged downwind of wildfires (Jaffe and Wigder, 2012). The extent of ozone production depends on multiple factors, including NMOG∕NOx ratios, downwind meteorology, and incident solar radiation (Akagi et al., 2013; Jaffe et al., 2018). Ozone production may also be slowed through peroxyacetyl nitrate formation (PAN), which is affected, in part, by NMOG functionality and total NOx and NMOG emissions (Alvarado et al., 2010; Liu et al., 2016; Müller et al., 2016; Jaffe et al., 2018). Biomass burning emissions are produced by distillation and pyrolysis, as well as glowing and flaming combustion (Yokelson et al., 1996). Primary NMOG speciation is largely driven by pyrolysis temperatures and fuel composition (e.g., Sekimoto et al., 2018; Hatch et al., 2015), whereas NOx emissions generally increase with increased flaming combustion and greater fuel nitrogen content (Burling et al., 2010).
Secondary NMOGs may provide insights into the chemical processes that contribute to smoke oxidation. Several studies have identified important secondary NMOGs formed from aging of biomass burning emissions (Yokelson et al., 2003; Müller et al., 2016; Bruns et al., 2017; Hartikainen et al., 2018); however, the mechanisms that lead to secondary NMOG formation remain unclear. For example, maleic anhydride has been identified as a significant secondary NMOG formed in smoke within hours of oxidation (Müller et al., 2016; Bruns et al., 2017; Hartikainen et al., 2018). Maleic anhydride is a known product of aromatic oxidation, but it is also an end product of furan chemistry (Bierbach et al., 1995; Aschmann et al., 2011, 2014). Understanding the pathways leading to secondary NMOG formation may be useful in constraining smoke properties (e.g., plume age) or identifying significant ozone and SOA precursors.
Few studies have modeled the detailed chemical mechanisms leading to secondary NMOG formation (Mason et al., 2001; Alvarado et al., 2015; Müller et al., 2016; Liu et al., 2016). This work is challenging because a large fraction (22 %–56 %) of the identified reactive carbon is associated with compounds whose OH chemistry is unknown or has not been specified in atmospheric chemistry mechanisms (Hatch et al., 2017). These species could significantly contribute to ozone or SOA formation. For example, Alvarado et al. (2015) modeled the evolution of ozone and SOA formed downwind of a prescribed fire and found that O3 production was strongly sensitive to the inclusion of unknown NMOGs that have OH rate constants of . Müller et al. (2016) explicitly modeled the oxidation of 16 NMOGs emitted from a small understory fire using the Master Chemical Mechanism (MCM v. 3.3.1, Jenkin et al., 1997, 2003, 2015; Saunders et al., 2003). The model captured the loss of important reactive primary NMOGs and reproduced the formation of O3 and PAN. The formation of maleic anhydride could not be explained by the model, which reflects the need for additional mechanism development.
The studies described above demonstrate that highly reactive organic compounds play an important role in the OH oxidation of young biomass burning plumes. Laboratory studies evaluating the reactivity of biomass burning NMOGs have shown that furans, oxygenated aromatics, and aliphatic hydrocarbons (e.g., monoterpenes and cyclopentadiene) are major contributors to calculated or measured OH reactivity (Stockwell et al., 2015; Gilman et al., 2015; Hatch et al., 2015; Bruns et al., 2017; Hartikainen et al., 2018). Hartikainen et al. (2018), for example, found that furans and phenolic compounds were among the most reactive NMOGs emitted from logwood emissions. The detailed chemical mechanisms of these compounds have been studied in single-component systems (Bierbach et al., 1995; Alvarez et al., 2009; Aschmann et al., 2011, 2014; Zhao and Wang, 2017; Yee et al., 2013; Lauraguais et al., 2014; Finewax et al., 2018); however, these mechanisms have not been widely implemented into models of biomass burning smoke. Müller et al. (2016) included simple mechanisms for furan and furfural; however, other major furan species, such as 2-methylfuran, 2,5-dimethylfuran, and 5-methylfurfural, were omitted.
A few studies have evaluated biomass burning OH oxidation using proton-transfer-reaction time-of-flight mass spectrometry (PTR-ToF-MS). PTR-ToF-MS is capable of measuring 50 %–80 % of the primary NMOG mass emitted from biomass burning, including oxygenates, aromatics, and heterocyclic compounds (Hatch et al., 2017). The remaining mass includes compounds that are that are difficult to quantify by proton transfer, such as alkanes and small alkenes. The PTR-ToF-MS is effective in monitoring the evolution of some secondary NMOGs, such as maleic anhydride (Müller et al., 2016). Nonetheless, limitations on isomeric specificity (Hatch et al., 2017), fragmentation, and sensitivity may hinder the ability of the PTR-ToF-MS to measure other secondary oxygenates or multi-functionalized organics (Yuan et al., 2017). The iodide-clustering time-of-flight chemical ionization mass spectrometer (I−-ToF-CIMS, hereafter referred to as I-CIMS for brevity) is well-suited to measure oxygenated NMOGs. The I-CIMS is sensitive to acids and multifunctional oxygenates (Lee et al., 2014), which are likely to form as secondary NMOGs in biomass burning plumes. I-CIMS has been used to evaluate primary NMOG emissions (e.g., Priestley et al., 2018; Reyes-Villegas et al., 2018; Tomaz et al., 2018), biomass burning emissions aged by nocturnal processes (Ahern et al., 2018; Reyes-Villegas et al., 2018), and primary particle-phase components (Gaston et al., 2016). I-CIMS spectra of the NMOGs resulting from the OH oxidation of biomass burning smoke have yet to be reported.
Presented here are PTR-ToF-MS and I-CIMS measurements from chamber experiments performed during the 2016 laboratory component of the Fire Influence on Regional to Global Environments and Air Quality Experiment (FIREX-AQ) conducted at the Fires Sciences Laboratory in Missoula, MT, US. Based on this data, modifications are made to the MCM (v. 3.3.1) to include the reactions of highly reactive NMOGs, including furan, furfural, 2-methylfuran, 2,5-dimethylfuran, 5-methylfurfural, and guaiacol. This mechanism is applied to a box model to interpret observed increases in secondary NMOGs measured by the PTR-ToF-MS and I-CIMS. The chemical mechanism is also applied to a Lagrangian model previously used to evaluate the OH chemistry of an ambient biomass burning plume (Müller et al., 2016). The model output is compared to measured secondary NMOG and O3 production to evaluate the influence of furans and oxygenated aromatics on the chemistry of a real biomass burning plume.
2.1 Campaign description
The laboratory component of the FIREX-AQ intensive was conducted at the US Forest Service Fire Sciences Laboratory in Missoula, MT, US, during October–November 2016. The purpose of this study was to simulate the emissions and atmospheric oxidation of biomass burning smoke resulting from the combustion of western US fuels. A full description of the campaign, experimental setup, types of fuels burned, and resulting emissions of key NMOGs is provided elsewhere (Selimovic et al., 2018; Koss et al., 2018).
Burn experiments were conducted in a large, indoor combustion room, as described by Selimovic et al. (2018). Inside the room, fuels were assembled on a bed centered below a 20 m (L) × 1.6 m (ID) exhaust stack. The fuels were ignited by a heating plate, and the resulting smoke was vented through the stack at a constant velocity of ∼3 m s−1. Smoke was sampled by instrumentation on a platform located ∼17 m above of the fuel bed or directed to other areas of the laboratory through tubing and ductwork.
The fuels were chosen to represent ecosystems prone to wildfires in the western US and included components (i.e, leaves, stems, trunks, and duff) of the following species: ponderosa pine (Pinus ponderosa), lodgepole pine (Pinus contorta), Engelmann spruce (Picea engelmanii), Douglas fir (Pseudotsuga menziesii), subalpine fir (Abies lasiocarpa), manzanita (Arctostaphylos), and chamise (Adenostoma fasciculatum). The components of each fuel type were burned individually and in mixtures designed to mimic a real forested ecosystem. A full description of these fuels, including harvesting location, composition, and dry weight are provided elsewhere (Selimovic et al., 2018).
2.2 Chamber OH oxidation experiments
Oxidation experiments were performed using an OH-oxidation chamber. The apparatus, subsequently referred to as the “mini-chamber”, consists of a 150 L Teflon bag centrally located between two ultraviolet-C (UVC) lamps (narrow peak emission 254 nm, Ultra-Violet Products, Inc.). A full description of the instrumentation and operation of the mini-chamber is provided by Lim et al. (2019). OH is produced by the photolysis of ozone in the presence of water according to Reactions (R1)–(R2).
Other sources of OH, such as HONO and aldehydes, were also introduced into the chamber via injection of biomass burning smoke. The relative humidity and ozone mixing ratios in the mini-chamber were adjusted to maintain OH exposures equivalent to 1–5 d of atmospheric oxidation. The UVC lamps initiated photochemistry, and the photon flux at the center of the chamber was measured to be photons cm−2 s−1 using a photodiode sensor (Thorlabs S120VC). Previous studies using oxidation flow reactors have investigated the radical chemistry under 254 nm irradiation to quantify non-OH losses and RO2 pathways (Peng et al., 2016, 2019; Peng and Jimenez, 2017). For most primary NMOGs, losses were dominated by OH oxidation. For some species, photolysis played a significant role. Non-OH loss processes affecting important NMOGs are discussed in Sect. 3.2.3.
A suite of particle- and gas-phase instruments sampled from the bag through stainless steel and Teflon tubing, respectively. This study focuses on NMOG measurements (described in Sect. 2.3.1), but a complete description of aerosol measurements is provided by Lim et al. (2019). NOx and NOy were not measured from the mini-chamber. Initial NOx mixing ratios are estimated based on the integrated NOx∕acetonitrile ratios measured from the stack during mini-chamber filling. HONO, an important source of NOx and OH, is estimated similarly.
The mini-chamber was located in a room ∼30 m from the top of the stack. To quickly deliver smoke to the chamber, stack air was drawn through a aluminum duct that is 30 m in length and 20 cm in diameter. The residence time within the duct was < 2 s and particle losses were minor (Lim et al., 2019). Gas-phase species have a high affinity to metal surfaces and losses to the aluminum ductwork are possible (Deming et al., 2019). It is difficult to assess these losses quantitatively; however, the average NMOG ∕ acetonitrile ratio measured in the mini-chamber was ∼15 %–20 % lower than that measured from the stack (see the Supplement for more details). While these differences likely indicate that NMOGs were lost to ductwork, the relative distribution of NMOGs was not significantly different between the stack and mini-chamber.
Mini-chamber experiments were conducted in the following manner. (1) Prior to each burn, the bag was flushed with clean humidified air for ∼45 min. (2) Immediately following fuel ignition, smoke diluted with clean air was injected into the bag at a ratio. Injection proceeded until the burn finished or until particle concentrations maximized inside the mini-chamber. For most experiments, the distribution of NMOGs and particles represented an integrated sample of all phases of the burn. (3) 40 ppb of deuterated butanol (butanol-d9, added to monitor OH exposure) was injected into the chamber and the particle and gas mixture was allowed to mix for ∼5–10 min. (4) A stream of clean, humidified air (RH ∼30 %) doped with ∼70 ppb ozone was continuously added to the mini-chamber to match instrumentation sampling flows (∼6 L min−1) and maintain a high-OH environment. (5) Once aerosol- and gas-phase concentrations stabilized, the UVC lamps were turned on and photochemistry proceeded for ∼30–45 min. (6) At the end of the experiment, the bag was flushed with clean dilution air in preparation for subsequent experiments.
Gas- and particle-phase concentrations were corrected for dilution by monitoring the decay of acetonitrile, which is present at high concentrations in biomass burning smoke, slow to react with OH (lifetime ∼335 d at OH molec. cm−3), and not significantly lost to Teflon surfaces (Krechmer et al., 2016; Pagonis et al., 2017). CO was not used as a dilution tracer due to observed CO production following the initiation of photochemistry. The dilution rate estimated by acetonitrile decay agreed well with flow rate calculations (Lim et al., 2019). OH exposures in the mini-chamber were estimated based on the dilution-corrected loss of butanol-d9 ( cm3 molec.−1 s−1, Barmet et al., 2012).
2.3 Instrumentation
2.3.1 NMOG measurements
NMOG measurements were conducted using a high-resolution proton transfer reaction time-of-flight mass spectrometer (PTR-ToF-MS, Yuan et al., 2016) and an iodide-clustering time-of-flight chemical ionization mass spectrometer (I-CIMS, Aerodyne/Tofwerk, AG). The instruments were deployed to measure primary smoke emissions from the stack and room, as well as aged emissions from the mini-chamber. During a burn (and while the mini-chamber was filling with smoke), both instruments sampled from the stack to characterize primary NMOG emissions. At the end of a burn, the sampling lines were switched and the instruments sampled from the mini-chamber through a Teflon inlet that is 10 m in length and has an outer diameter of 3 mm at a total flow rate of ∼3 L min−1. A full description of the primary NMOG measurements is provided elsewhere, and only a brief description of these measurements is provided here (Koss et al., 2018).
The PTR-ToF-MS measured at 1 Hz to capture the decay of primary NMOGs and formation of secondary species, respectively. The drift tube was operated with an electric field to number density ratio (E∕N) of 120 Td, and the high-resolution mass spectrometer (max resolution ∼4500) scanned ions with m∕z 12–500 Th. The mass spectrometer resolves the molecular formulae of isobaric species but cannot distinguish isomers. This presents challenges in reacting systems as secondary NMOGs formed by OH oxidation could have the same molecular formula as primary NMOGs. Koss et al. (2018) identified the distribution of primary NMOGs during FIREX-AQ using gas chromatography pre-separation to measure isomer contributions. For most fuel types, over 90 % of the PTR-ToF-MS signal could be assigned. The primary groups detected by PTR-ToF-MS were small oxygenates (∼50 % v∕v, dominated by acetic acid, formaldehyde, methanol, and acetaldehyde), aromatics (∼10 %, dominated by catechol, phenol, methoxy phenols, benzene, and toluene), furans (∼10 %, dominated by 5-methylfurfural, 2-furfural, furanone, furan, and methylfurans + dimethylfurans), and a broad range of hydrocarbons (∼15 %, dominated by ethene, propene, butene, and 1,3-butadiene). The same NMOG assignments and sensitivities are applied here to masses observed to be enhanced prior to NMOG oxidation. The temporal profile of some larger primary oxygenates (C>5) were also influenced by the formation of secondary isomers or unidentified primary species (see Sect. 3.2.2). Calibration factors for primary species are calculated from measured or estimated proton transfer rate constants (uncertainty < 50 %, Sekimoto et al., 2017).
Masses detected after the initiation of photochemistry are assigned based on previous literature observations and modeling evidence (see Sect. 3.2.2). A number of laboratory and field studies employing PTR-ToF-MS and open-path Fourier transform infrared spectrometer (OP-FTIR) have observed formation of formic acid (, m∕z 47), acetic acid (, m∕z 61), maleic anhydride (, m/z 99), and phthalic anhydride (, m∕z 149) in aged smoke (Yokelson et al., 2003, 2009; Akagi et al., 2012; Müller et al., 2016; Bruns et al., 2017; Hartikainen et al., 2018). Calibration factors for these species are calculated from measured or estimated proton transfer rate constants. In this study, substantial increases in (m∕z 101) and (m∕z 89) are also observed. could be 5-hydroxy-2(5H)-furanone (or simply hydroxy furanone), its tautomer malealdehydic acid, or succinic anhydride, whereas is likely a C4 hydroxy carbonyl (see Sect. 3.1 and) Liu et al., 1999; Bierbach et al., 1994, 1995; Alvarez et al., 2009; Aschmann et al., 2011, 2014; Strollo and Ziemann, 2013; Zhao and Wang, 2017). Due to uncertainties in these assignments, calibration factors for these species are calculated using estimated proton transfer rate constants derived from molecular formula relationships (uncertainty to within a factor of 2, Sekimoto et al., 2017).
The I-CIMS utilizes a “soft” chemical ionization source that forms iodide clusters with polarizable analyte molecules (Huey et al., 1995; Lee et al., 2014). The instrument used here was operated in a similar configuration to that described in Krechmer et al. (2016). To generate reagent ions, 2 SLPM (standard liter per minute) of clean N2 from dewar blow-off was run over a methyl iodide permeation tube and ionized using a Polonium-210 ionizer and into an ion molecule reaction region (IMR). The I-CIMS measured gas-phase signals from the mini-chamber at 1 Hz time resolution. Smoke was diluted with 4 L min−1 of clean, humidified air at a 4:1 ratio to minimize reagent ion depletion. A constant flow of isotopically labeled formic acid was delivered to the instrument to measure consistency of response. Reported here are I-CIMS measurements normalized to 1×10⁶ counts per second of the reagent ion signal at m∕z 126.905 (normalized counts per second, ncps). Due to unavailability of standards, I-CIMS data are not reported in mixing ratios. Secondary NMOGs measured by I-CIMS are assigned identifications based on modeling results and previous literature.
2.3.2 NOx measurements
NO, NO2, and HONO were measured by an OP-FTIR, as described by Selimovic et al. (2018). The OP-FTIR was located on the platform and sampled smoke across the diameter of the stack. The OP-FTIR provides fast measurements and avoids potential sampling artifacts due to sample line losses. OP-FTIR measurements were used for most experiments. NO2 and HONO were also measured by the NOAA Airborne Cavity Enhanced Spectrometer (ACES), as described by Zarzana et al. (2018). ACES was located on the platform and sampled smoke through a 1 m Teflon inlet. These data were used when OP-FTIR data were unavailable, or when NOx emissions were below OP-FTIR detection limits. Supplementary NO measurements were provided by a custom-built chemiluminescence instrument located in a room on the burn chamber floor. A full description of that instrument is provided by Stockwell et al. (2018).
2.4 Box model implementation and evaluation
NMOG oxidation processes were simulated using the Framework for 0-D Atmospheric Modeling (F0AM v 3.1, https://sites.google.com/site/wolfegm/models, last access: 9 January 2018 Wolfe et al., 2016). A modified NMOG oxidation mechanism is applied based on the Master Chemical Mechanism (MCM v. 3.3.1, Jenkin et al., 1997, 2003, 2015; Saunders et al., 2003). As described here and in Sect. 3.2.1, the box model is used to evaluate NMOG formation in the mini-chamber, as well as for the daytime oxidation of an ambient biomass burning plume (Müller et al., 2016). Non-atmospheric photolysis played a role in the evolution of organics in the mini-chamber owing to the use of UVC lamps; consequently, interpretation of the mini-chamber measurements is limited to evaluating the link between OH oxidation of furan and oxygenated aromatics with the formation of several key secondary NMOGs measured by I-CIMS and PTR-ToF-MS. The ambient model is used to quantitatively evaluate the impact of furan and oxygenated aromatic chemistry on secondary NMOGs and ozone formation in real biomass burning plumes.
NMOG chemistry and dilution are assumed to follow the first-order differential equation described by Eq. (1).
where Ci is the concentration of species i, Pm is the stoichiometric coefficient of reaction m leading to the formation of species i, Rm is the stoichiometric coefficient of reaction m leading to the loss of species i, r is the elementary rate of reaction m, and ki is a first-order dilution rate constant. A constant dilution term is applied to all species based on the measured loss rate of acetonitrile. Vapor–wall interactions are not considered in this model, and these processes may impact the evolution of intermediate and semi-volatile gases. Lim et al. (2019) did not observe significant wall losses of primary VOCs during chamber experiments. Vapor–wall interactions have been shown to play a role in the SOA evolution of biomass burning smoke, and partitioning to the gas-phase is greater in diluting systems (Bian et al., 2015; Hodshire et al., 2019).
The MCM treats the photolysis of organic and inorganic species through parameterizations relevant to atmospheric wavelengths. To account for photolysis in the mini-chamber, MCM photolysis frequencies were calculated using literature cross sections and quantum yields of relevant organic and inorganic species (Atkinson et al., 2006; Burkholder et al., 2015; Keller-Rudek et al., 2013). Tables S1 and S2 in the Supplement summarize the reactions and databases used to estimate photolysis frequencies in the mini-chamber. For some primary species and NOx reservoirs (e.g., acetone, acetaldehyde, benzaldehyde, PAN), additional reactions were added to account for photolysis pathways at 254 nm (Table S2).
Photolysis frequencies are calculated as the product of the absorption cross section, quantum yield, and photon flux at 254 nm. The measured 254 nm photon flux (3×10¹⁵ photons cm−2 s−1) is scaled by a factor of 1.5 in order to reproduce the measured OH-loss of butanol-d9. No other changes are applied to the rate constants or reactions of MCM v. 3.3.1. To account for other reactive NMOGs, literature mechanisms for furan, 2-methylfuran, 2,5-dimethylfuran, furfural, 5-methylfurfural, and guaiacol are included. A full description of these modifications are provided in Sect. 3.2.1. Table S3 summarizes the photolysis frequencies and OH, O3, and NO3 rate constants for the primary NMOG species modeled here.
The mini-chamber model is evaluated against two fires – F26 (Engelmann spruce duff) and F38 (ponderosa pine litter). These two fires represent different extreme cases in NOx and NMOG composition and were chosen in order to assess the extent to which the variability of primary NMOGs influences secondary NMOG formation. Figure S2 in the Supplement illustrates how F38 and F26 compare to other fires measured in this study. F26 was a unique burn characterized by low-temperature smoldering combustion, which resulted in low NOx emissions (NOx∕NMOG ∼0.02 mol mol−1) and a NMOG profile with high contributions from oxygenated aromatics such as phenol, cresol, and guaiacol. F38 was representative of many of the burns presented here and was characterized by a mixture of high-temperature flaming combustion and low-temperature smoldering. NOx emissions were substantially higher than those of F26 (NOx/NMOG ∼0.32).
The mini-chamber model is initialized with the mixing ratio of 47 primary NMOG species measured by PTR-ToF-MS (Table S3). NO, NO2, and HONO were initialized based on stack measurements, as described in Sect. 2.3.2. Ozone measurements were conducted using a 2B Technologies ozone monitor (model 202), which exhibited significant interferences upon the addition of smoke or hexafluorobenzene (added as a supplemental dilution tracer). The monitor measures the absorption of O3 at wavelengths that are also absorbed by many primary NMOGs. Here, ozone measurements are only used to initialize the model with initial O3 mixing ratios. These initial conditions are based on the signal measured prior to smoke injection and ranged between 5 and 10 ppb.
Ozone is continuously added to the chamber over the course of an experiment. This input of ozone is included in the model by applying a constant ozone mixing ratio to the dilution term of Eq. (1). It is estimated that the dilution stream contained ∼70 ppb of ozone based on the expected output from the ozone generator (∼1 ppm) and the measured dilution rate. This input of ozone reproduces the ozone signal measured during dark control experiments to within 20 % (Fig. S1).
NO and NO2 are both emitted from fires. Once injected into the chamber, NO will react with O3 to generate NO2. In the atmosphere, NO and NO2 will rapidly cycle owing to NO2 photolysis. In the mini-chamber, NO2 photolysis is reduced since NO2 does not strongly absorb at 254 nm (the absorption cross section at 254 nm is a factor of 64 smaller than the peak absorption at 400 nm, Burkholder et al., 2015). Consequently, radical reactions (e.g., RO2 + NO) and NOx loss processes (e.g., PAN formation) are likely to be sensitive to the initial NO∕NO2 ratio. The initial NO∕NO2 ratio is estimated assuming that the NOx mixture measured from the stack reacts with a constant mixing ratio of ozone (10 ppb) for 10 min (the approximate mixing periods for F26 and F38). This analysis yields a NOx distribution that is ≥95 % NO2. This NOx distribution is applied to the mini-chamber model as an initial condition.
The ambient Lagrangian box model is the same used by Müller et al. (2016) to evaluate ozone and NMOG formation from aircraft measurements of a small biomass burning plume during the 2013 DISCOVER-AQ campaign. The mechanism employed by Müller et al. (2016) was based on MCM v. 3.3.1 and included a simplified scheme to represent furfural and furan chemistry. Only the decay of furfural was modeled, whereas furan oxidation was assumed to form butenedial. The same model used by Müller et al. (2016) is employed here, except that the mechanism includes the reactions of furan, 2-methylfuran, 2,5-dimethylfuran, furfural, 5-methylfurfural, and guaiacol (Sect. 3.2.1). The same initial conditions used by Müller et al. (2016) are applied here but with the inclusion of furan, 2-methylfuran, 2,5-dimethylfuran, furfural, 5-methylfurfural, and guaiacol, phenol, cresol, and catechol. Photolysis in the ambient box model is represented by MCM parameterizations, and dilution rates are calculated based on the observed decay of CO.
3.1 Oxidation product measurements
Figure S2 summarizes the initial NOx and NMOG concentrations, NOx∕NMOG ratio, and NMOG composition for all the mini-chamber experiments sampled by PTR-ToF-MS and I-CIMS. NMOG composition is reported as the fraction of NMOG signal attributed to high-temperature, low-temperature, and duff pyrolysis, as described by Sekimoto et al. (2018). High-temperature pyrolysis results in higher emissions of non-functionalized hydrocarbons, such as benzene, while low-temperature pyrolysis results in higher emissions of oxygenated species, such as methoxy phenols. Duff pyrolysis generates a NMOG distribution that is similar to the distribution from low-temperature pyrolysis, except that the unique composition of duff results in higher emissions of nitrogen-containing compounds.
The initial conditions for mini-chamber experiments varied drastically depending on chamber dilution, fuel type, and burn conditions (Fig. S2). The NOx∕NMOG ratio varied over several orders of magnitude (0.01–1.2) with NMOG loadings ranging from 90 to 900 ppb. Fires produced varying distributions of NMOGs owing to the extent of high- and low-temperature pyrolysis, while NOx mixing ratios varied depending on fuel nitrogen content (Burling et al., 2010) and the extent of flaming combustion (Sekimoto et al., 2018). For the remaining discussion, only experiments with NMOG loadings < 300 ppb (12 total) are analyzed in order to evaluate biomass burning chemistry at the lowest calculated primary OH reactivities (OHRs), since high OHR values can lead to significant OH suppression (Peng et al., 2016, 2019). The experiments reported here have estimated OHR between 18 and 70 s−1, which are within range of the OHR recommended by Peng et al. (2016) when using 254 nm lights (50–100 s−1).
Figure 1 shows the temporal evolution of select NMOGs measured by PTR-ToF-MS and I-CIMS during F38 (ponderosa pine). The left column shows the decay of primary NMOGs, while other columns show the temporal profiles of secondary NMOGs exhibiting significant enhancements in PTR-ToF-MS and I-CIMS spectra. Secondary NMOGs are classified based on temporal profile – those exhibiting a relatively fast increase in signal are classified as “fast-forming” products, while those formed more gradually over the course of an experiment are classified as “slow-forming” products. These designations are chosen based on the oxidation timescales that are likely to be observed in ambient biomass burning plumes. Here, OH exposures are estimated by the decay of butanol-d9 and then converted to atmospheric-equivalent timescales assuming an atmospheric OH concentration of 1.5×10⁶ molec. cm−3. Fast-forming products generally peaked within 10–20 h of atmospheric-equivalent oxidation, while slow-forming products exhibited no maxima.
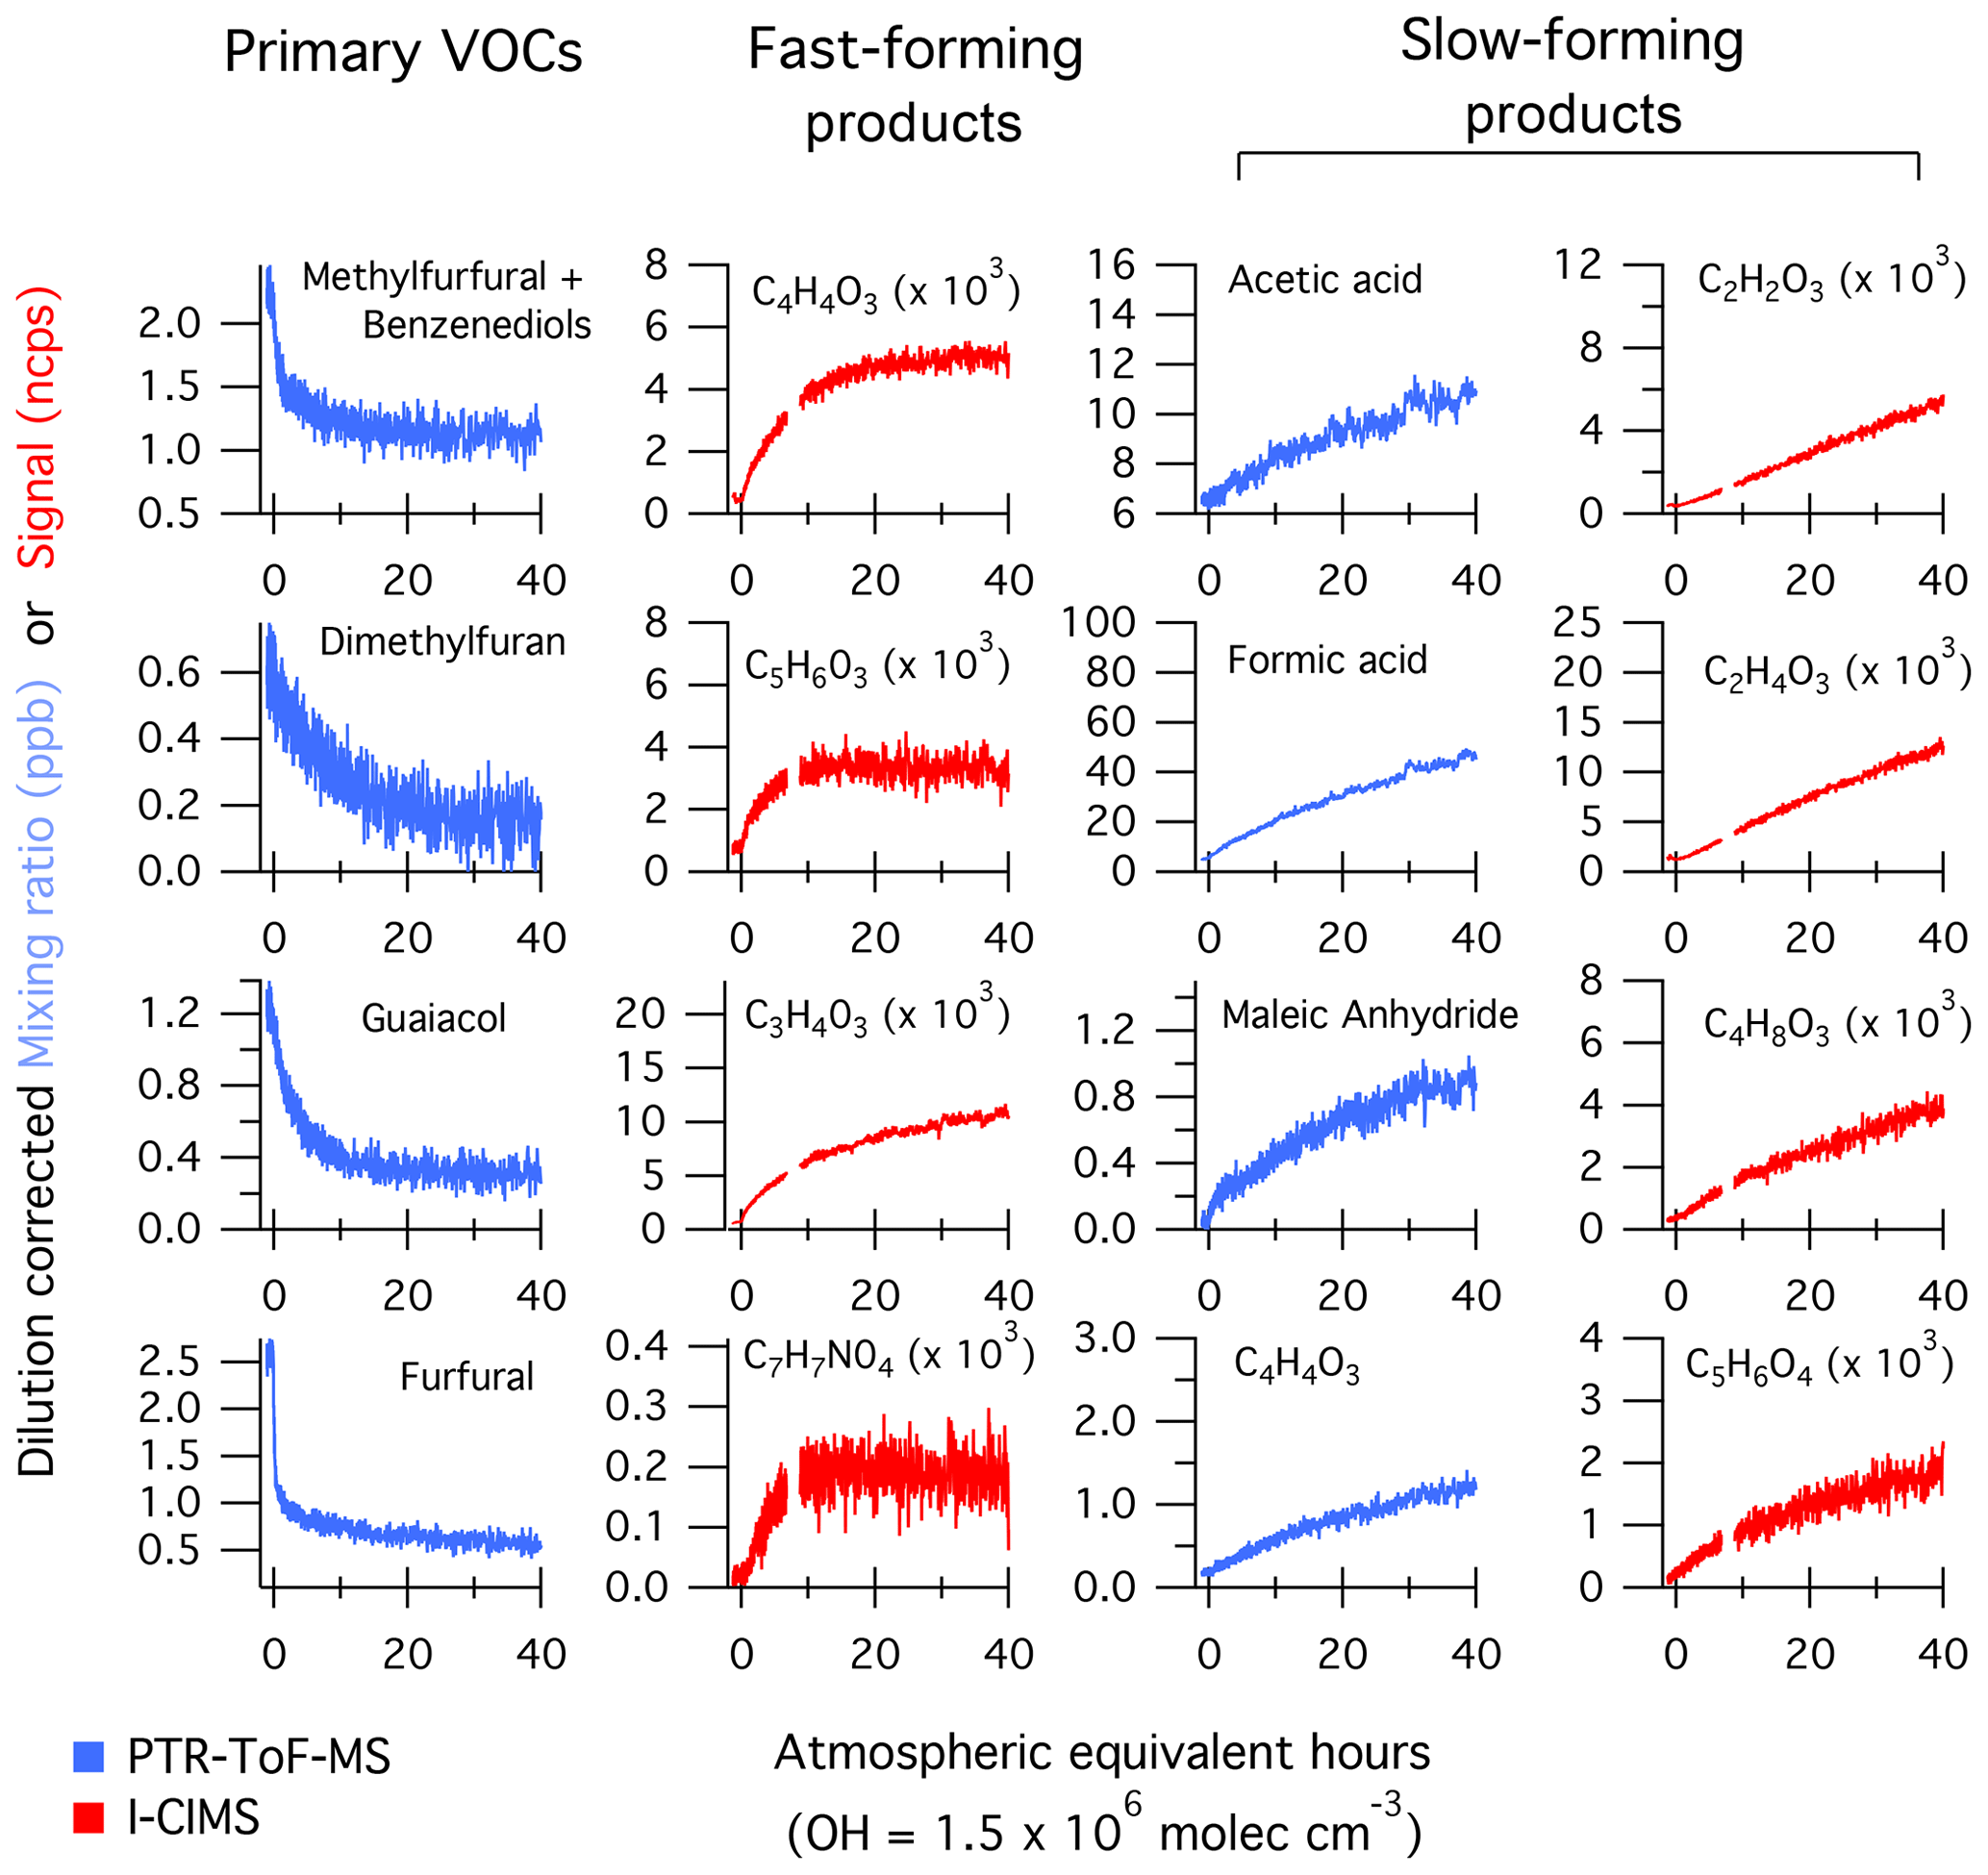
Figure 1Temporal evolution of select NMOGs from the OH oxidation of smoke resulting from Fire 38 (ponderosa pine). The data have been dilution-corrected based on the decay of acetonitrile. The time basis is calculated based on the decay of deuterated butanol. The first column shows primary NMOGs, the second column illustrates species formed within 20 h of atmospheric-equivalent oxidation (“fast-forming” products), while other columns show species formed over longer timescales (“slow-forming” products).
The loss of reactive primary species occurs quickly (< 20 h of atmospheric-equivalent oxidation). Most species (e.g., dimethylfuran and guaiacol) follow an exponential decay consistent with radical loss pathways; however, some species, such as furfural and 5-methylfurfural, show faster decay immediately following the initiation of lights. The lights employed in these experiments (Ultra-Violet Products, Inc.) emit a narrow band at 254 nm, which is capable of photolyzing furanaldehydes and other absorbing species (Hiraoka and Srinivasan, 1968; Gandini et al., 1976). The furfural photolysis frequency in the mini-chamber is estimated to be 0.13 s−1 (Table S2), which is orders of magnitude greater than the photolysis frequency expected under ambient, summertime conditions ( s−1, Colmenar et al., 2015). Furfural photolysis leads to the formation of other highly reactive furans (e.g., furan) at modest yield (< 0.3, Gandini et al., 1976), and these products may contribute to the OH reactivity early on during each experiment.
The majority of secondary NMOGs observed by the PTR-ToF-MS are classified as “slow-forming” products. Previous studies employing PTR-ToF-MS have identified acetic acid, formic acid, and maleic anhydride as major products (Müller et al., 2016; Bruns et al., 2017; Hartikainen et al., 2018). Formic and acetic acid are primary species but also form from OH oxidation of alkene and aromatic species (e.g., Jenkin et al., 1997, 2003, 2015; Saunders et al., 2003; Millet et al., 2015). Maleic anhydride is known to form from the oxidation of aromatics, but it has also been observed to form from the oxidation of furans (Bierbach et al., 1995). The formation of slow-forming products occurs over timescales > 20 h, which is significantly longer than the evolution of fast-forming products (e.g., C5H6O3, ∼4 h) and losses of the most reactive primary NMOGs (e.g., 2-methylfuran and guaiacol, ∼4–10 h). This may be an indication of multigenerational oxidation, or early generation formation via slowly reacting primary species.
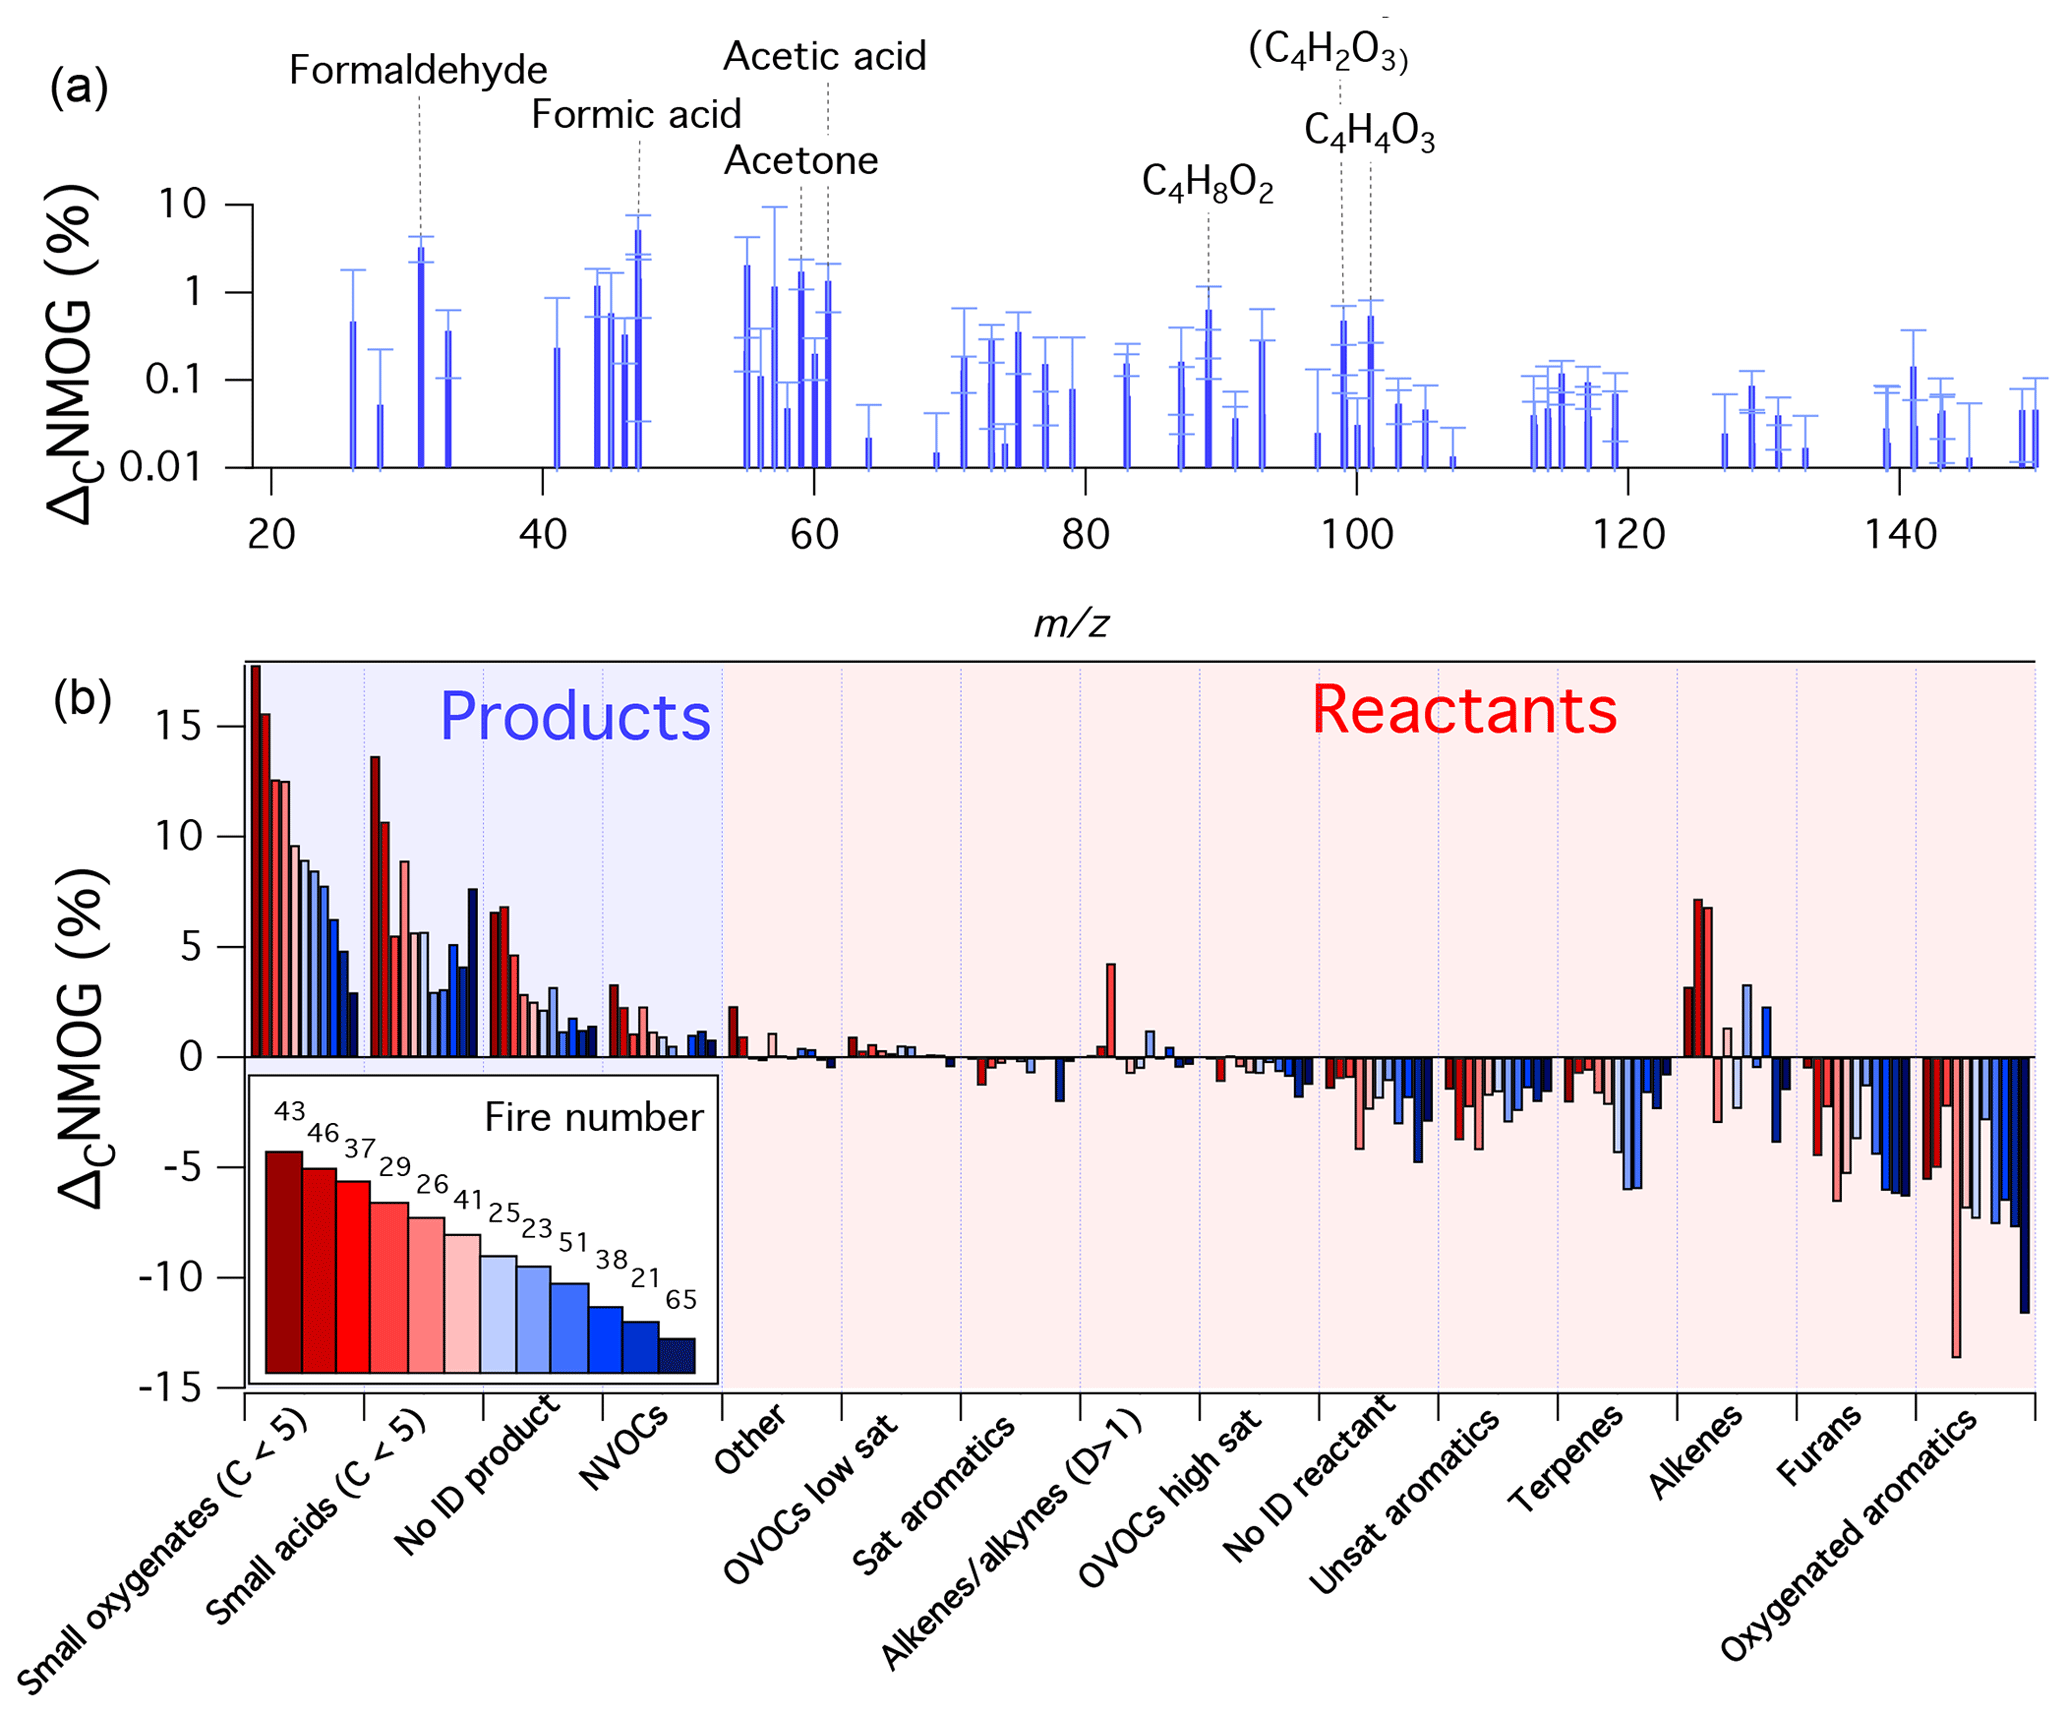
Figure 2Summary of PTR-ToF-MS measurements during 12 mini-chamber experiments. Shown is the amount of initial NMOG carbon (ΔCNMOG, %) that was consumed (reactant) or formed (product) for a given species after 12 h of atmospheric-equivalent oxidation (OH concentration of 1.5×10⁶ molec. cm−3). Panel (a) shows the average speciated distribution of products (error bars are standard deviations). Panel (b) shows ΔCNMOG for reactants and products as lumped categories. A species is classified as a product if the dilution-corrected signal measured by the PTR-ToF-MS increased after 12 h of simulated oxidation, and a reactant if the signal decreased. Categories labeled as “no ID” refer to species for which an assignment could not be confidently prescribed. The numbers in the legend refer to the fire number (composition and initial conditions can be found in Fig. S2). Experiments are ordered according to the fraction of primary carbon transformed to measurable secondary NMOGs (greatest to least).
Figure 2 shows the resulting changes in NMOG composition measured by the PTR-ToF-MS after ∼12 h of atmospheric-equivalent oxidation. Data are shown in terms of primary carbon changes (ΔCNMOG, %), which is the fraction of initial NMOG carbon measured by the PTR-ToF-MS that was consumed (reactant) or formed (product) for a given species or group of species. “Reactant” and “product” classifications were determined based on whether a detected mass exhibited an increase or decrease in dilution-corrected signal after 12 h of atmospheric-equivalent oxidation. The bars in Fig. 2b represent species-aggregate measurements for each of the 12 fires highlighted in Fig. S2. Figure 2a shows an average of all secondary NMOGs formed after 12 h of atmospheric-equivalent oxidation. Across most experiments, furans and oxygenated aromatics were the primary NMOGs with the greatest carbon losses. Decreases in oxygenated aromatics were mostly driven by losses of guaiacol, methyl guaiacol, and catechol. Losses of furans were primarily due to decreases in furan, 2-methylfuran, 2,5-dimethylfuran, furfural, and 5-methylfurfural. These observations are consistent with previous PTR-ToF-MS measurements of aged wood burning smoke (Bruns et al., 2017; Hartikainen et al., 2018). The contribution from biogenic species in this study was variable, and largely dependent on composition (Hatch et al., 2015, 2017) and the extent to which monoterpenes were emitted from the distillation phase of combustion (Koss et al., 2018; Sekimoto et al., 2018). The detected masses associated with the alkene category exhibited both apparent formation and consumption across various experiments. Alkenes are expected to react quickly with OH; thus, observed increases likely point to a species misassignment. It is likely that this increase in signal is the result of PTR-ToF-MS fragmentation of oxygenated NMOGs. For example, some alcohols, acids, and certain aldehydes may fragment in the PTR-ToF-MS to masses that are typically associated with alkenes (e.g., m∕z 69, Buhr et al., 2002; Pagonis et al., 2019). These species are likely formed from the oxidation of biomass burning precursors and potentially interfere with alkene detection.
Across most experiments, small oxygenates and acids (C<5) were the predominant secondary NMOGs detected by PTR-ToF-MS (Fig. 2b). As mentioned previously, formic acid, acetic acid, and maleic anhydride are several species with the largest relative increase at longer oxidation timescales (Fig. 2a); however, formaldehyde, acetaldehyde, acetone, and several C4OxHy species increased significantly. The formation of C4OxHy species follows a similar temporal pattern as maleic anhydride, which may point to similarities in species functionality or formation pathways.
In contrast to the PTR-ToF-MS measurements, the I-CIMS measured a mix of fast- and slow-forming products (Fig. 1). The I-CIMS measured a small fraction of the primary NMOGs, so only secondary NMOGs are discussed here. Fast-forming products included pyruvic acid (C3H4O3), CxO3Hy compounds, and masses likely corresponding to nitroaromatics. Previous studies have reported the formation of nitroaromatics from OH oxidation of catechol and guaiacol in the presence of NO2 (Lauraguais et al., 2014; Finewax et al., 2018). C7H7NO4 is consistent with the formation of nitroguaiacol, which has been observed in the gas and particle phase from guaiacol + OH (+NO2) chemistry (Lauraguais et al., 2014). Finewax et al. (2018) studied the OH oxidation of catechol and observed the formation of nitrocatechol with a molar yield of 0.3. Very little nitrocatechol was observed by the PTR-ToF-MS and I-CIMS, which is likely due to the high aerosol loadings in the chamber (> 50 µg m−3) and high affinity of nitrocatechol to partition to aerosols and surfaces (Finewax et al., 2018).
Figure 3 summarizes the changes in I-CIMS product spectra relative to the total signal measured prior to photochemistry. Shown are the product distributions for short (4 h), medium (12 h), and longer (24 h) atmospheric timescales. Because not all masses could be calibrated, normalized difference spectra (oxidized minus primary) are presented in order to illustrate the ions with the largest relative increases. In general, the secondary NMOGs measured by I-CIMS tend to be multifunctional. The smallest observed oxygenate is formic acid (CH2O2), while larger molecules tend to be C2−5HxO3 and C4−5HxO4 compounds. After 4 h of oxidation, the largest enhancements are due to fast-forming products such as C3H4O3, C4H4O3, and C5H6O3. The relative importance of these masses decreases at longer timescales, whereas the relative abundance of smaller oxygenates increases (e.g., CH2O2 and C2H4O3).

Figure 3Summary of secondary NMOGs measured by I-CIMS during 12 mini-chamber experiments. Shown are ion signals that increased after initiating photochemistry relative to the total integrated signal measured prior to photochemistry. Panels (a)–(c) show changes in signal after 4, 12, and 24 h of atmospheric-equivalent oxidation, respectively. Error bars represent standard deviations. Note that the masses are presented as I− adducts.
The signal intensity of the fast-forming products (specifically C4H4O3 and C5H6O3) suggests that these species result from the oxidation of abundant, fast-reacting NMOG precursors with a carbon number of ≥4. Modeling results presented in Sect. 3.2 support the assignment of these products as hydroxy furanone (C4H4O3) and methyl hydroxy furanone (C5H6O3). Based on the loss of primary NMOGs (Fig. 2), it is likely that these species are formed from the oxidation of furans, oxygenated aromatics, or other fast-reacting NMOGs with C≥4. Several studies have investigated the oxidation of furan species and shown that hydroxy furanone + tautomer (C4H4O3) and methyl hydroxy furanone + tautomer (C5H6O3) are major products formed from the oxidation of furfural, furan, 2-methylfuran, and 2,5-dimethylfuran (e.g., Bierbach et al., 1994, 1995; Alvarez et al., 2009; Aschmann et al., 2011, 2014; Strollo and Ziemann, 2013; Zhao and Wang, 2017). Secondary NMOGs measured from the OH chemistry of oxygenated aromatic species are largely carbon-retaining (C≥6), though C4H4O4 ring fragments have been measured in low-NOx catechol oxidation (Yee et al., 2013).
Notably, inspection of Figs. 2a and 3 shows that there is little overlap in the species measured by PTR-ToF-MS and I-CIMS. The only masses that exhibit significant enhancements in both spectra are formic acid (CH2O2) and C4H4O3. Moreover, there are significant differences in the temporal evolution of C4H4O3. As discussed above, C4H4O3 measured by I-CIMS most likely corresponds to hydroxy furanone, a fast-forming product (Fig. 1). In contrast, C4H4O3 as measured by the PTR-ToF-MS exhibits a temporal profile resembling that of a slow-forming product. This mass is likely succinic anhydride, which is structurally similar to maleic anhydride and could be formed from multigeneration chemistry. The differences in these profiles suggests that the there are at least two different C4H4O3 species present, that PTR-ToF-MS and I-CIMS are sensitive to different biomass burning oxidation products, and that both instruments are needed in order to measure important secondary NMOGs.
Previous studies and the mass spectra in Figs. 2 and 3 show that furan chemistry plays a significant role in the OH chemistry of biomass burning plumes (Bruns et al., 2017; Hartikainen et al., 2018; Gilman et al., 2015; Hatch et al., 2015). In Sect. 3.2, furan chemistry is incorporated into a box model to help interpret the observed small-chamber measurements and previously measured ambient biomass burning plumes.
3.2 NMOG box modeling
3.2.1 Mechanism incorporation
The box model described in Sect. 2.4 employs NMOG chemistry based on the Master Chemical Mechanism (MCM v. 3.3.1, Jenkin et al., 1997, 2003, 2015; Saunders et al., 2003). The MCM explicitly represents the chemistry of biogenic, alkyl, aromatic, and oxygenated aromatic species. The laboratory measurements described in Sect. 3.1 demonstrate that heterocyclic hydrocarbons, such as the furans, could significantly contribute to secondary NMOG formation. The following discussion motivates and describes mechanism development aimed at expanding the MCM representation of biomass burning OH chemistry.
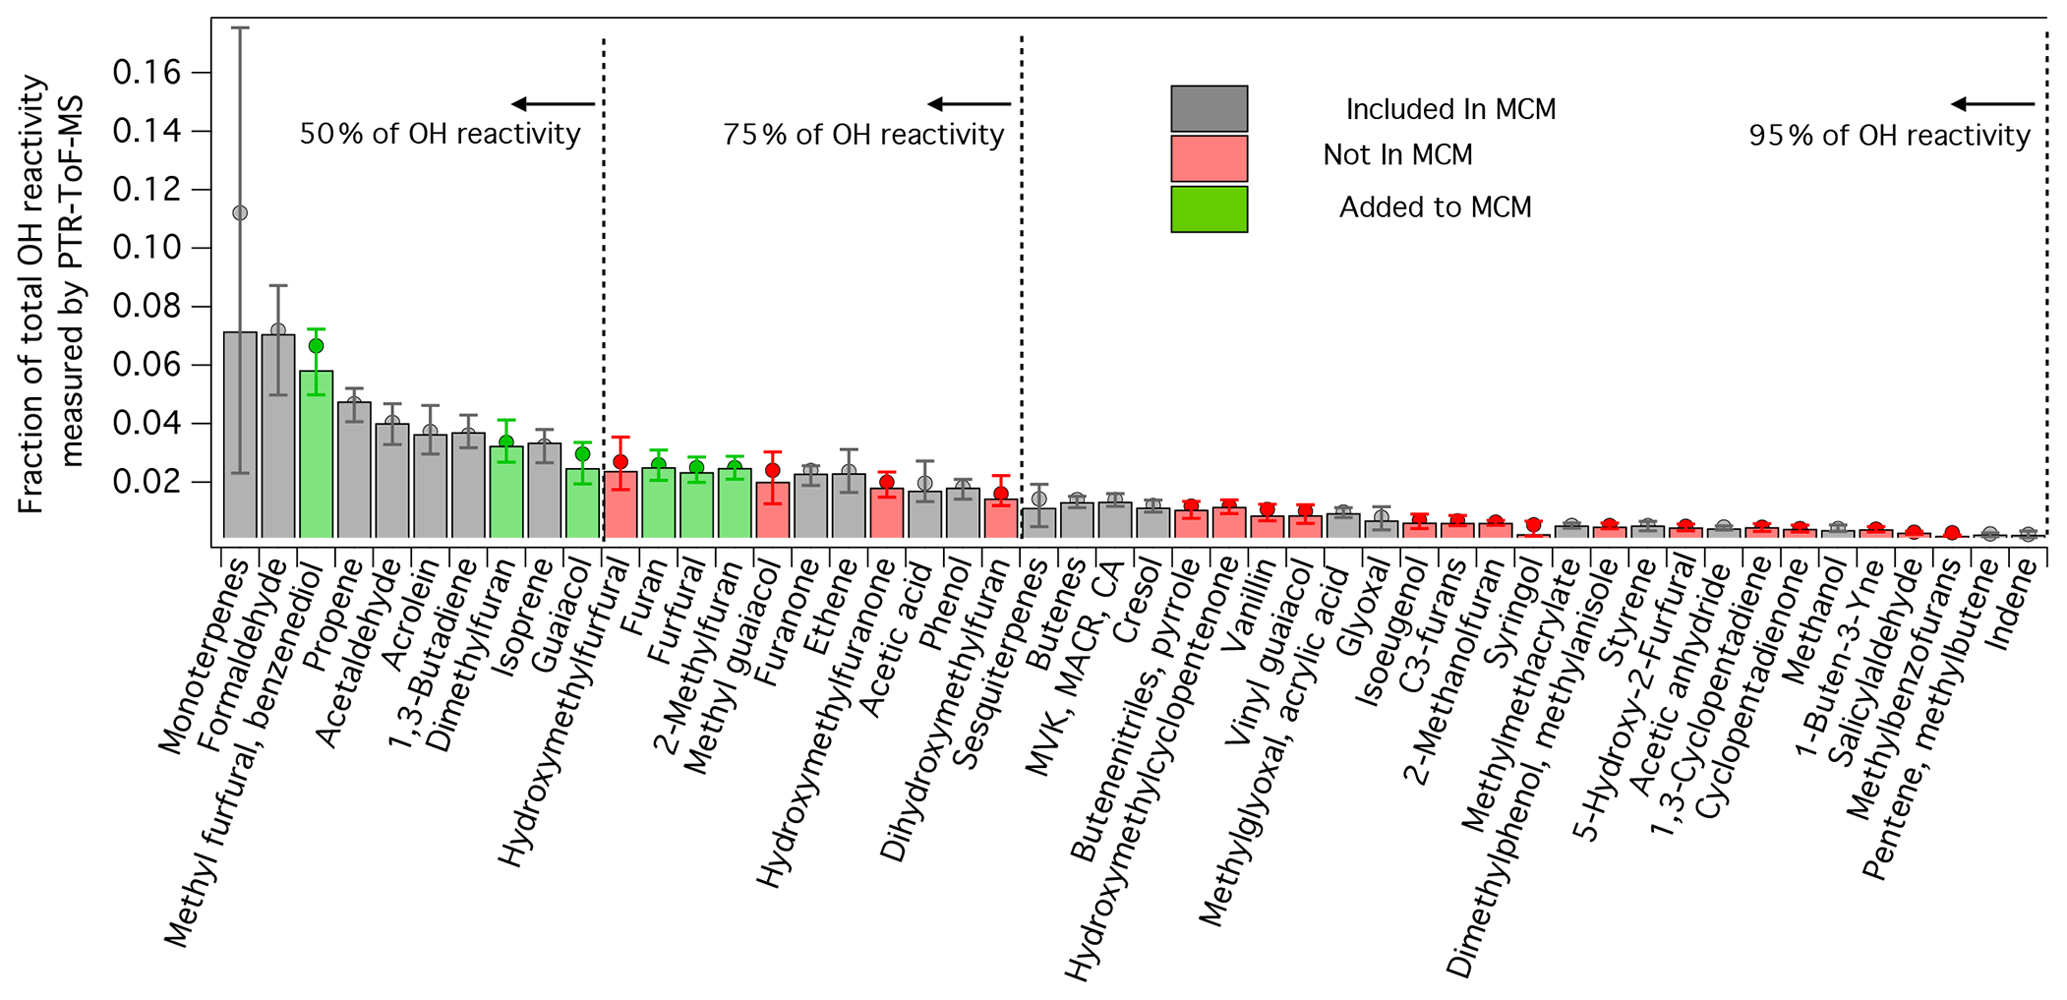
Figure 4Contribution of individual species to the total primary OH reactivity estimated from PTR-ToF-MS measurements following Eq. (2). Bar intensity is median for all burns measured by PTR-ToF-MS, whereas circle markers are averages. Error bars indicate 25th and 75th percentiles. Bar colors indicate if a species is included (grey) or not included (red) in the MCM v. 3.3.1. Green bars indicate OH oxidation mechanisms that were added to the MCM (sub-mechanisms for each species can be found in Figs. S4–S9). The concentrations of each species were calculated following the methods described by Koss et al. (2018). Only species that were positively identified are included in these calculations. The assumed OH rate constant for each species is given by Koss et al. (2018).
Figure 4 shows the breakdown in OH reactivity of the primary NMOGs measured by PTR-ToF-MS during the Firelab study (Koss et al., 2018). Each bar represents a fraction of the total calculated OH reactivity, as represented by Eq. (2).
where i is the species of interest, n is the number of species measured by the PTR-ToF-MS, k is the OH rate constant, and C is the average concentration measured during a burn. Shown are the median, average, 25th, and 75th percentiles for all the burns reported by Koss et al. (2018). The color of each bar indicates if a compound is included or missing from the MCM. Species identifications, and the isomer contributions to each detected mass, were determined by Koss et al. (2018) for four fuel types (Douglas fir, Engelmann spruce duff, subalpine fir, and sage) using gas chromatography pre-separation (GC-PTR-ToF-MS). Additional evidence for species identification was provided by other measurement techniques (e.g., I-CIMS, gas chromatography electron-impact mass spectrometry, and OP-FTIR). On average, the isomer contribution to a given mass measured by PTR-ToF-MS varied by only 11 %. To be consistent with Koss et al. (2018), it is assumed that the NMOG contribution to each mass detected by PTR-ToF-MS follows the average distribution measured by GC-PTR-ToF-MS.
For most NMOGs measured by PTR-ToF-MS, the contribution to total primary OH reactivity varied by only 25 %. Notably, the contribution from the sum of monoterpenes varied by a factor > 2. Monoterpenes, as well as isoprene and sesquiterpenes, were primarily emitted at the beginning of an experiment, prior to combustion, due to distillation processes associated with fuel heating (Sekimoto et al., 2018). This “distillation phase” was most pronounced in fires containing greater amounts of canopy material, or fuel types known to be strong monoterpene emitters (e.g., pines). Other NMOGs were primarily emitted due to pyrolysis processes. For example, Sekimoto et al. (2018) found that the proportions of NMOGs emitted during low- and high-temperature pyrolysis did not strongly vary by fuel type. In ambient fires, the contribution of monoterpenes to the total OH reactivity will likely differ from the contributions reported here, owing to the different burning process by which monoterpenes and other NMOGs are emitted. In this study, the primary monoterpene isomers measured by GC-PTR-ToF-MS for Engelmann spruce, Douglas fir, and subalpine fir were camphene, α-pinene, β-pinene, 3-carene, and limonene, followed by smaller amounts of tricyclene and α-terpinene (Fig. S3). No other NMOGs detected by the GC-PTR-ToF-MS produced signals at m∕z 137, which is the primary ion used to quantify monoterpene emissions (Fig. S3 and Koss et al., 2018).
The monoterpene distribution for Engelmann spruce (F26) was explicitly measured by GC-PTR-ToF-MS, but this was not the case for ponderosa pine (F38). To account for differences in monoterpene reactivity, the sum of monoterpenes for F26 is speciated using the distribution reported in Fig. S3a. For F38, monoterpenes are speciated using the ponderosa pine distribution reported by Hatch et al. (2015) . Engelmann spruce smoke measured by GC-PTR-ToF-MS had a monoterpene distribution that was 25 % α-pinene, 21 % β-pinene, 25 % 3-carene, 15 % α-terpinene, and ∼5 % each of limonene and camphene. Hatch et al. (2015) reports that the monoterpenes from ponderosa pine smoke are 10 % α-pinene and 20 % each for β-pinene, 3-carene, myrcene, and limonene. The MCM represents the chemistry of α-pinene, β-pinene, and limonene but does not explicitly describe other important monoterpenes (e.g., 3-carene or camphene). For the mini-chamber model, the fraction attributed to α-pinene, β-pinene, and limonene are explicitly prescribed. The fraction of 3-carene, α-terpinene, and smaller monoterpenes are lumped to α-pinene (endocyclic double bond) and the fractions associated with myrcene + camphene are lumped to β-pinene (exocyclic double bond).
On average, the MCM v. 3.3.1 captures only ∼60 % of the primary OH reactivity measured by the PTR-ToF-MS. The MCM generally lacks information about furan species and substituted aromatics, such as guaiacol and methyl guaiacol. Previous work has shown that furans constitute a significant fraction of the total primary OH reactivity (e.g., Gilman et al., 2015; Hatch et al., 2015, 2017; Koss et al., 2018); however, no studies have included the known mechanisms of these species when modeling biomass burning smoke chemistry. In this study, 5-methylfurfural and 2,5-dimethylfuran represent the two largest contributors to this “missing reactivity” and account for nearly 10 % of the calculated total reactivity. Up to 75 % of the calculated primary OH reactivity can be accounted for by including the chemistry of furan, 2-methylfuran, 2,5-dimethylfuran, furfural, 5-methylfurfural, and guaiacol, along with the known species represented in the MCM. Much of the remaining reactivity is tied into species whose chemistry has not been extensively studied, including less abundant furans and oxygenated aromatics.
The mechanisms of select furan and oxygenated species are incorporated to the MCM based on previous work summarized in Figs. S4–S10 (Bierbach et al., 1995; Alvarez et al., 2009; Aschmann et al., 2011, 2014; Strollo and Ziemann, 2013; Zhao and Wang, 2017). In total, 65 reactions are added. The products resulting from the OH oxidation of furan and 2-methylfuran were first investigated by Bierbach et al. (1995) and later generalized to 3-methylfuran, 2,3-dimethylfuran, and 2,5-dimethylfuran by Aschmann et al. (2014) and Strollo and Ziemann (2013). Figure 5 shows the generalized furan oxidation scheme. Furan oxidation is initiated by an OH addition to the 2, 5, or 3 position. Addition to the 2 or 5 position is most favorable and results in pathways where substituents are either retained or lost (henceforth referred to as the loss and retention pathways). The retention pathway (path a in Fig. 5) leads to reactive unsaturated 1,4-dicarbonyls (e.g., 1,4-butenedial from furan oxidation), whereas the loss pathway (paths b1 and b2 in Fig. 5) results in the formation of hydroxy furanones and unsaturated carbonyl acids (Aschmann et al., 2014; Strollo and Ziemann, 2013). The loss pathway becomes more dominant with higher number of substituted methyl groups.This study assumes branching ratios of [0.7 (a), 0.3 (b1)] for furan, [0.31 (a), 0.39 (b1), 0.31 (b2)] for 2-methylfuran, and [0.27 (a), 0.73 (b1)] for 2,5-dimethylfuran (Aschmann et al., 2014).
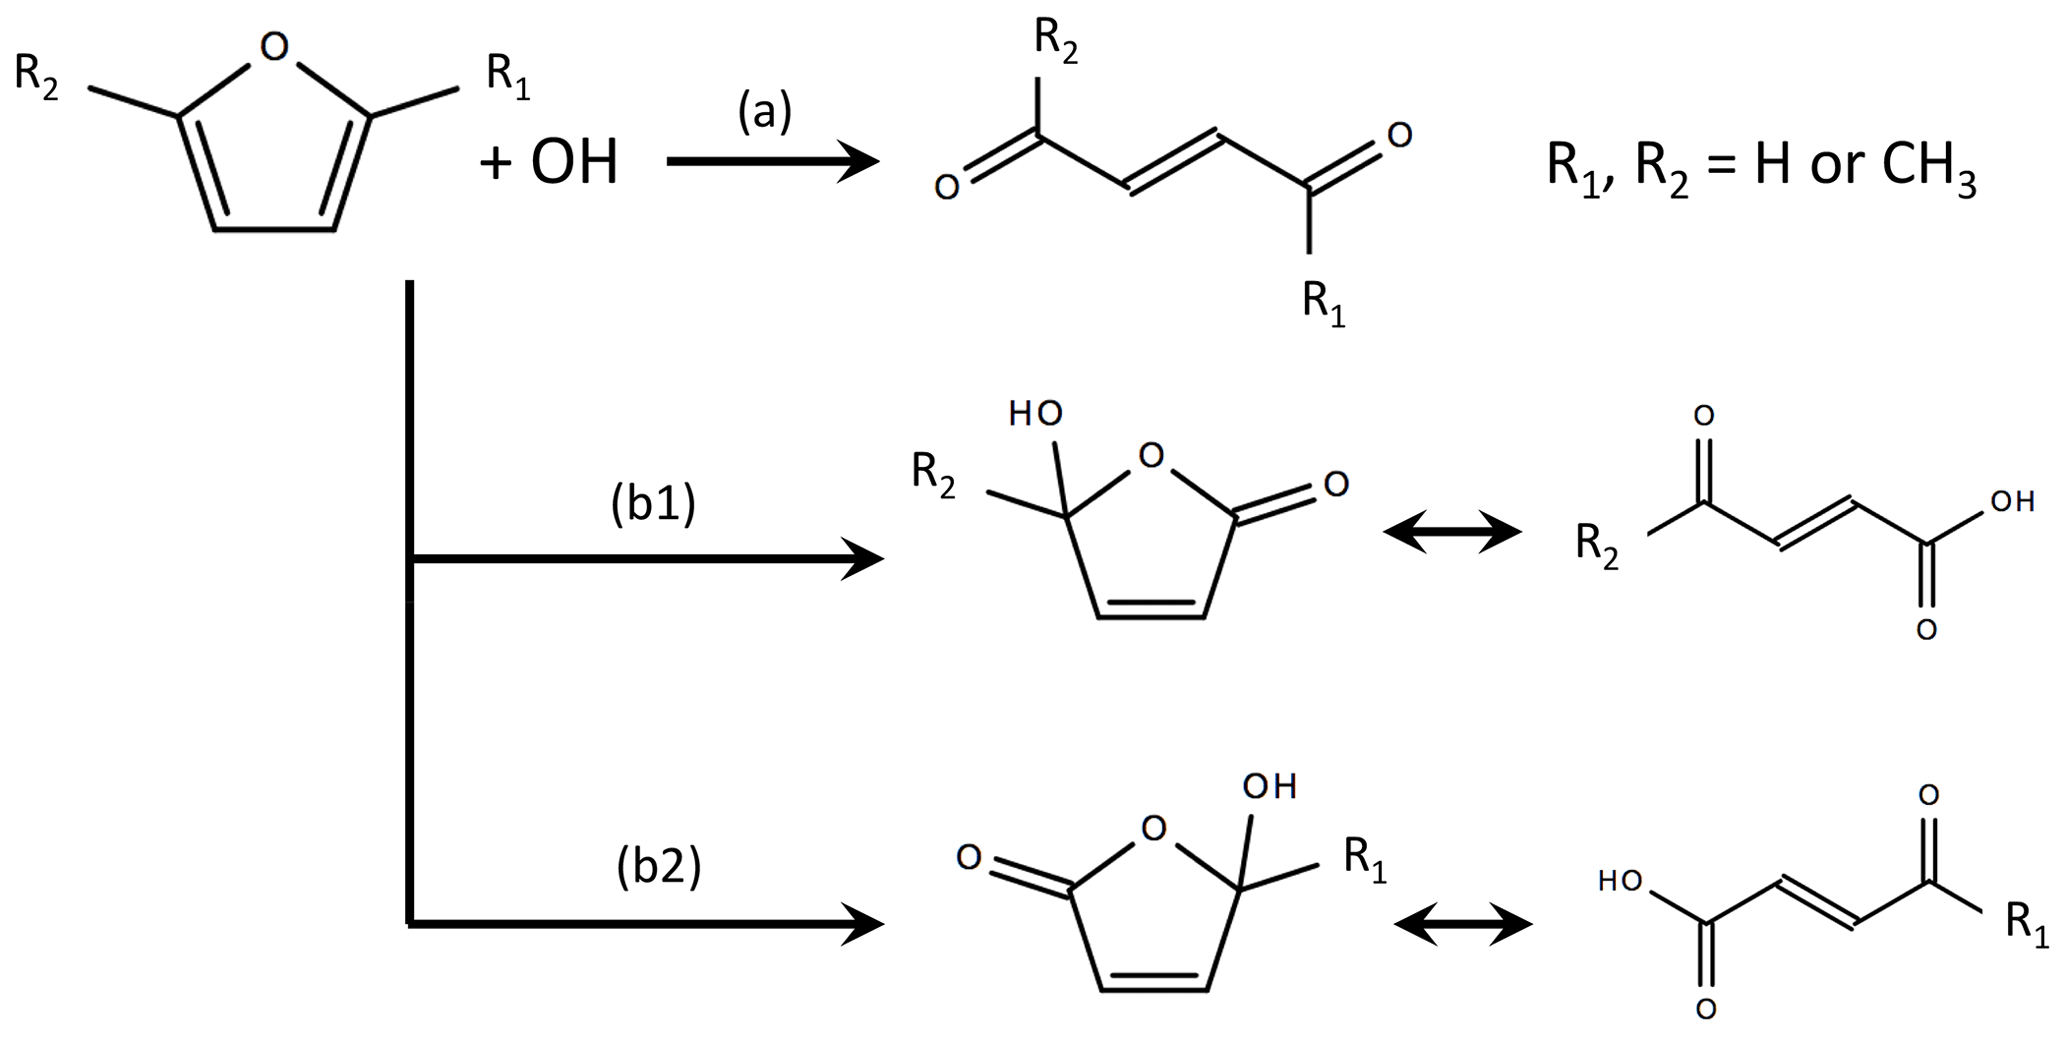
Figure 5Summary of OH oxidation pathways and final products for furan, 2-methylfuran, and 2,5-dimethylfuran, where branch (a) is the substituent-retention pathway, and branches (b1) and (b2) are substituent-loss pathways (adapted from Aschmann et al., 2014). In this study, the branching ratios are assumed to be [0.7 a, 0.3 b1] for furan, [0.31 a, 0.39 b1, 0.31 b2] for 2-methylfuran, and [0.27 a, 0.73 b1] for 2,5-dimethylfuran. Details of the assumed RO2 reaction schemes are provided in Figs. S4–S6.
RO2 reactions leading to the formation of carbonyls are implemented based on the mechanisms proposed by Aschmann et al. (2014) and Bierbach et al. (1994) (Figs. S4–S6). It is assumed that RO2 species undergo reactions with HO2, NO, and other RO2 radicals. Other pathways, such as RO2+NO2 and RO2+NO3, are not included; however, these reactions could be important for acyl RO2 species (Orlando and Tyndall, 2012; Peng et al., 2019). For RO2+NO reactions, it is assumed that the alkoxy radical quickly decays (either by thermal degradation or reaction with O2) to form carbonyls. Aschmann et al. (2014) did not report species consistent with alkoxy isomerization; thus, these reactions are ignored. Similarly, RO2+RO2 reactions are assumed to only form alkoxy radicals, which may subsequently degrade to form carbonyls. Peroxides are assumed to be the only products of RO2+HO2 reactions. These species are assumed to undergo photolysis to form carbonyls. Peroxides may also react with OH, and the resulting products differ depending on structure. For structures with an alpha hydrogen, it is assumed that OH abstracts at the alpha position, and that the resulting radical quickly decomposes to form a carbonyl + OH (e.g., HYDFURANOOH, Fig. S4). For other structures, it is assumed that the hydrogen of the peroxide group is abstracted to regenerate the RO2 radical.
The generic MCM rate constants are applied for RO2+HO2 and RO2+NO reactions ( cm3 molec.−1 s−1, cm3 molec. −1 s−1). The RO2+HO2 rate constant is adjusted for the RO2 carbon number, n, as recommended by Saunders et al. (2003). Photolysis frequencies for peroxides are assumed to be the same as for methyl hydroperoxide (J41 in the MCM), and peroxide + OH reactions are assumed to have a rate constant of cm3 molec.−1 s−1. The assumed rate constants for RO2+RO2 reactions are chosen based on those of structurally similar RO2 radicals reported in the MCM. RO2 H-shift isomerization (autoxidation) is not broadly represented in MCM v. 3.3.1, aside for isoprene oxidation (Jenkin et al., 2015). RO2 isomerization becomes competitive when the bimolecular lifetime of RO2 is on the order of 10 s (Crounse et al., 2013; Praske et al., 2018). Based on the modeled concentrations of HO2, NO, and RO2, the bimolecular lifetime of RO2 radicals from furan oxidation is estimated to be ∼10 s; consequently, RO2 isomerization could play a role for certain species.
Following RO2 reaction, it is assumed that the second-generation products continue through the chemistry prescribed by MCM v. 3.3.1. Unsaturated dicarbonyls, such as 1,4-butenedial, and the tautomers of hydroxy furanones are represented in the MCM (Figs. S4–S6). Here, it is assumed that hydroxy furanones undergo the same reactions as the corresponding tautomer, which ultimately leads to anhydride formation. Maleic anhydride is a multigenerational product in the OH oxidation of furan (Bierbach et al., 1995) and is considered to be a significant product of hydroxy furanone oxidation (Bierbach et al., 1994).
No experimental studies have evaluated the OH oxidation mechanism of furfural or 5-methylfurfural. Zhao and Wang (2017) found via theoretical quantum chemistry calculations that OH likely adds to the 2 or 5 position or abstracts a hydrogen from the aldehyde. The resulting reactions follow loss and retention pathways similar to the general mechanism for methyl-substituted furans (Fig. 6). When OH adds to the 2 position, the ring most likely opens to form an unsaturated tri-carbonyl (retention, path a). When OH adds to the 5 position, the resulting peroxy radical may react with HO2, NO, or other RO2 species to form a hydroxy furanone ∕ carbonyl acid mixture (loss, path b). Hydrogen abstraction from the aldehyde group is believed to ultimately result in the formation of maleic anhydride (loss, path c). Zhao and Wang (2017) estimate furfural + OH branching ratios of 0.37 for channel (a), 0.6 for channel (b), and 0.03 for channel (c). The same branching ratios are applied here, but a discussion of secondary NMOG sensitivity to the assumed furfural mechanism is provided in the Supplement. The 5-methylfurfural + OH mechanism has not been studied and is assumed to have branching ratios similar to furfural. RO2 reactions are implemented based on the mechanisms proposed by Zhao and Wang (2017) (see Figs. S7–S9).
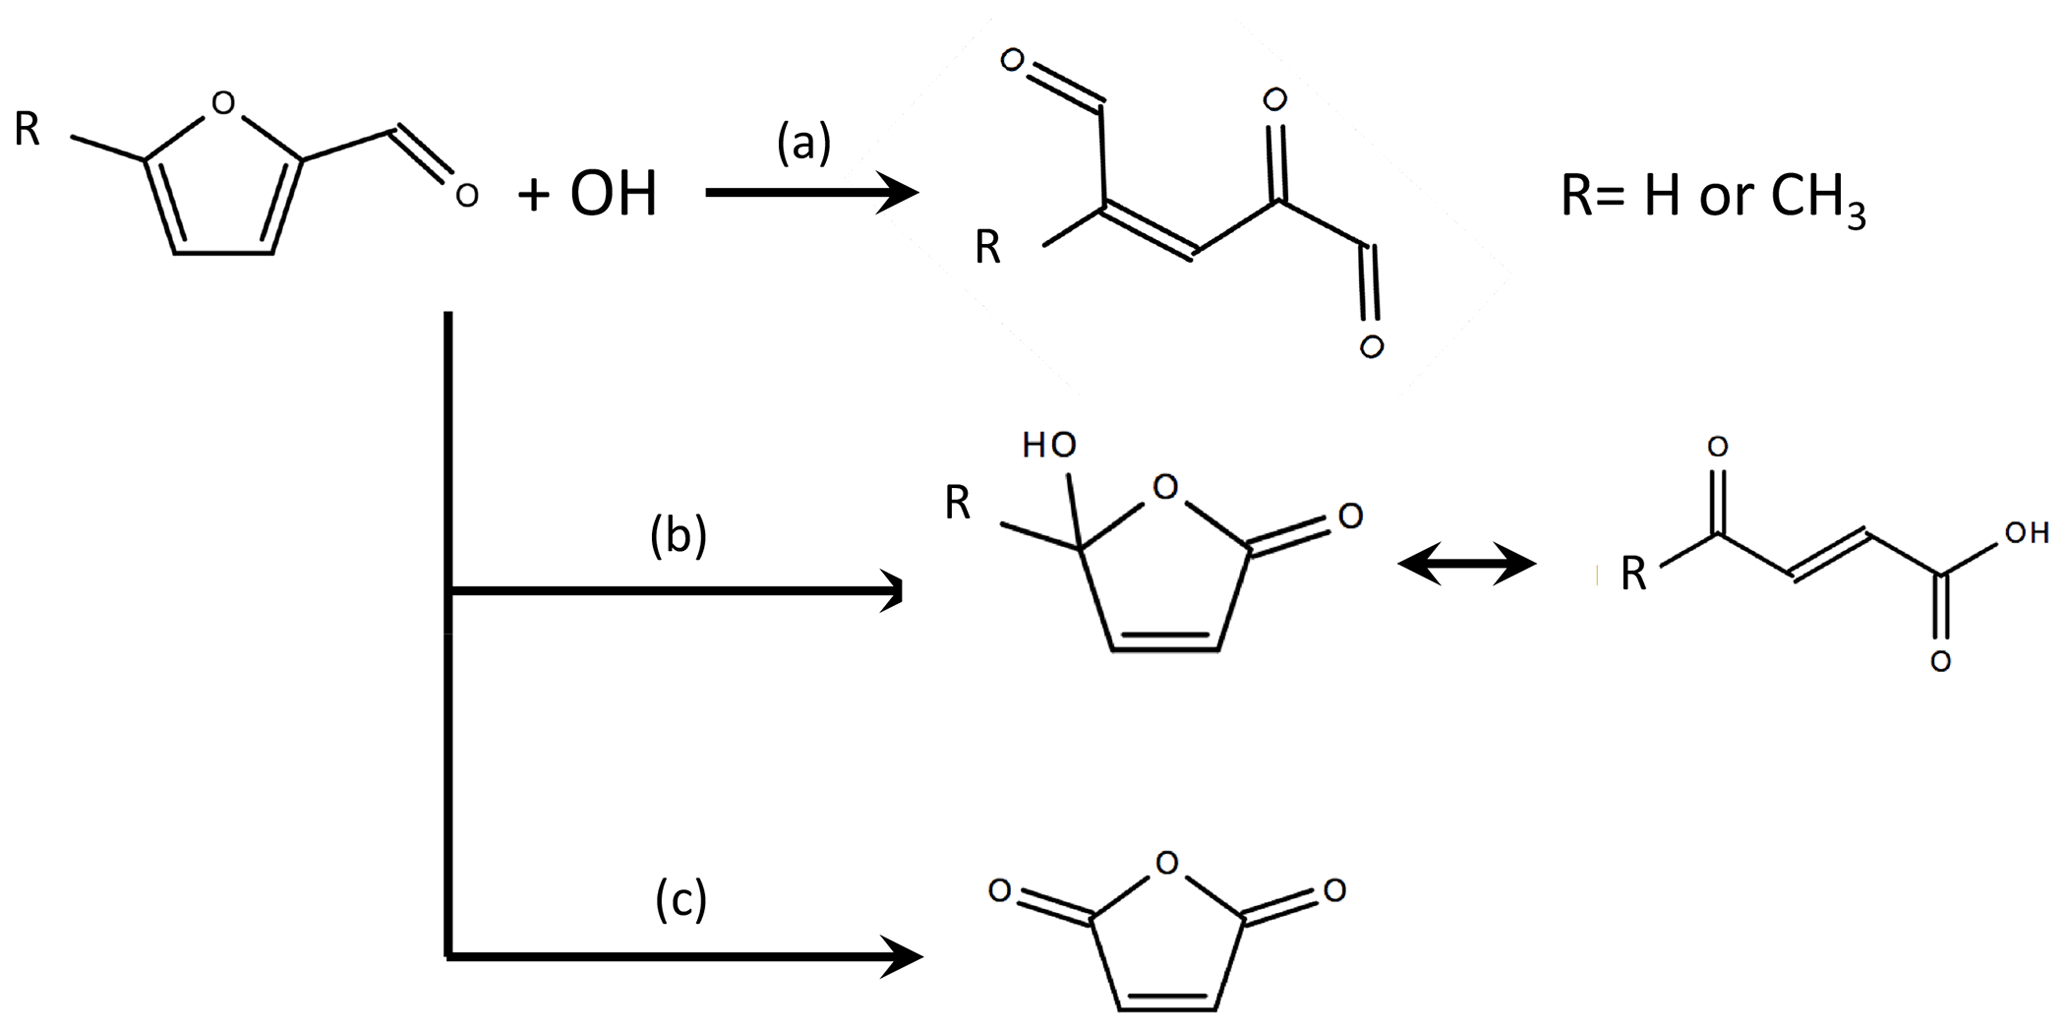
Figure 6Summary of OH oxidation pathways and final products for furfural and 5-methylfurfural, where branch (a) is the substituent-retention pathway, and branches (b) and (c) are substituent-loss pathways (adapted from Zhao and Wang, 2017). The branching ratios estimated by Zhao and Wang (2017) are 0.37 for channel (a), 0.6 for channel (b), and 0.03 for channel (c). Details of the assumed RO2 reaction schemes are provided in Figs. S7–S9.
Furfural strongly absorbs at 185 and 254 nm (Gandini et al., 1976; Hiraoka and Srinivasan, 1968; Ferreira da Silva et al., 2015). Smaller amounts may be lost by photolysis at wavelengths > 300 nm (Colmenar et al., 2015). Approximately 15 % of furfural photolysis leads to the formation of furan and CO, while the remaining percentage results in the formation of propyne, CO, and other C3 compounds (Gandini et al., 1976). The photolysis frequency is calculated based on the cross sections reported by Ferreira da Silva et al. (2015) and quantum yield of 0.6 (Vassilis Papadimitriou, personal communication, 2018).
Few studies have evaluated the OH oxidation mechanism of guaiacol. Yee et al. (2013) identified products from low-NOx guaiacol oxidation but did not calculate product yields. Lauraguais et al. (2014) studied guaiacol oxidation in the presence of NOx and observed substantial SOA formation. The only reported gas-phase species were a suite of nitroguaiacols composed primarily of 3- and 6-nitroguaiacol (6 % yield) and 4-nitroguaiacol (10 % yield). The mechanism proposed by Lauraguais et al. (2014) is applied here assuming a 16 % yield of nitroguaiacol species (Fig. S10).
The OH loss of butanol-d9 is also included in the model to validate OH concentrations in the chamber. The OH oxidation of butanol-d9 is assumed to form a single, nonreactive species. The entire mechanism used to model the mini-chamber and ambient biomass burning plume is provided in the Supplement.
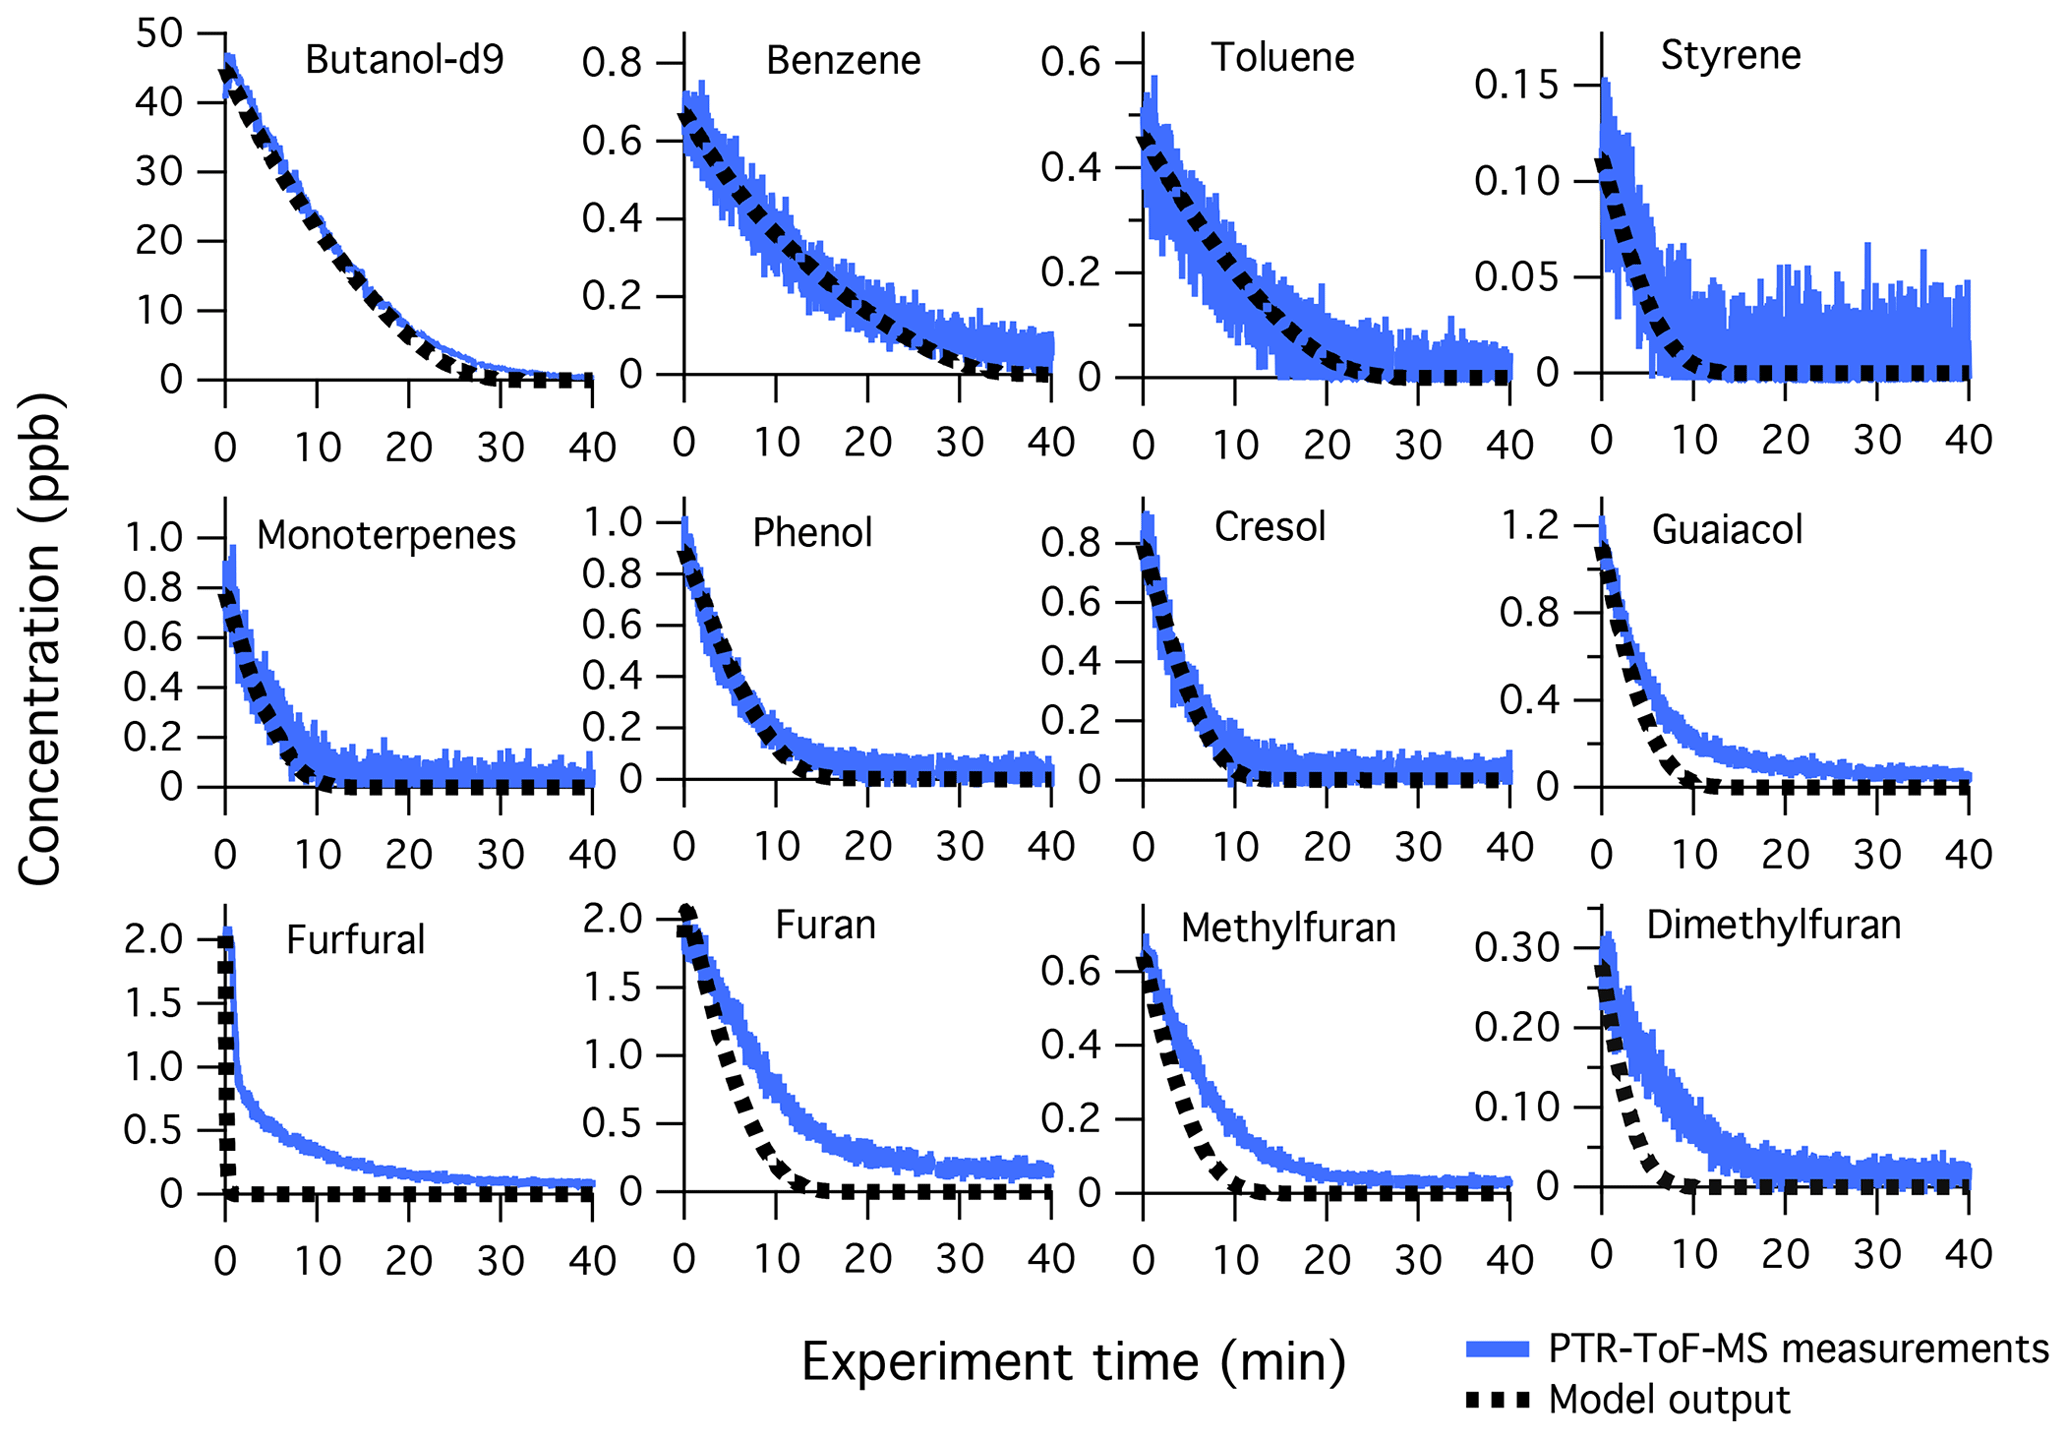
Figure 7Primary NMOG measurements (blue lines) compared to modeled output (dotted black lines) for Fire 38. The decay of butanol-d9 is shown to demonstrate model performance in reproducing OH exposures, which was achieved by adjusting the measured photon flux by a factor of 1.5. The fuel is ponderosa pine litter, NOx/NMOG = 0.3, with a mixture of high- and low-temperature pyrolysis products.
3.2.2 Model and measurement evaluation
Figure 7 shows the model comparison with PTR-ToF-MS measurements of butanol-d9 and select primary NMOGs for F38. Overall, there is good agreement between the measurements and model output for most NMOGs (exceptions include some primary species and small secondary oxygenates, discussed below). The excellent agreement between the measured and modeled loss of butanol-d9 demonstrates that OH concentrations in the chamber are well-represented by the model. Similar agreement is observed for F26, which had an initial NOx∕NMOG ratio that was an order of magnitude lower than that of F38 (Fig. S11). Figure 8 shows the model output compared to the observed profiles of secondary NMOGs measured during F38. The equivalent for F26 is presented in Fig. S12. Figure 8a shows measurements of C4H2O3 (maleic anhydride) as measured by PTR-ToF-MS, whereas Fig. 8b and c show I-CIMS measurements of C5H6O3 and C4H4O3, respectively. The measured secondary NMOGs are compared to model outputs of total C4H2O3 (i.e., the sum of all species with molecular formula C4H2O3), total C5H6O3, total C4H4O3, and individual NMOGs. Figure 8 also show model runs with the initial conditions of furan, 2-methylfuran, 2,5-dimethylfuran, furfural, 5-methylfurfural, and furanone set to zero. The PTR-ToF-MS measurements of C4H2O3 are reported in units of ppb and can therefore be quantitatively compared to model output. I-CIMS measurements are reported as ncps; consequently, only qualitative comparisons are drawn based on similarities in model and measurement temporal profiles.
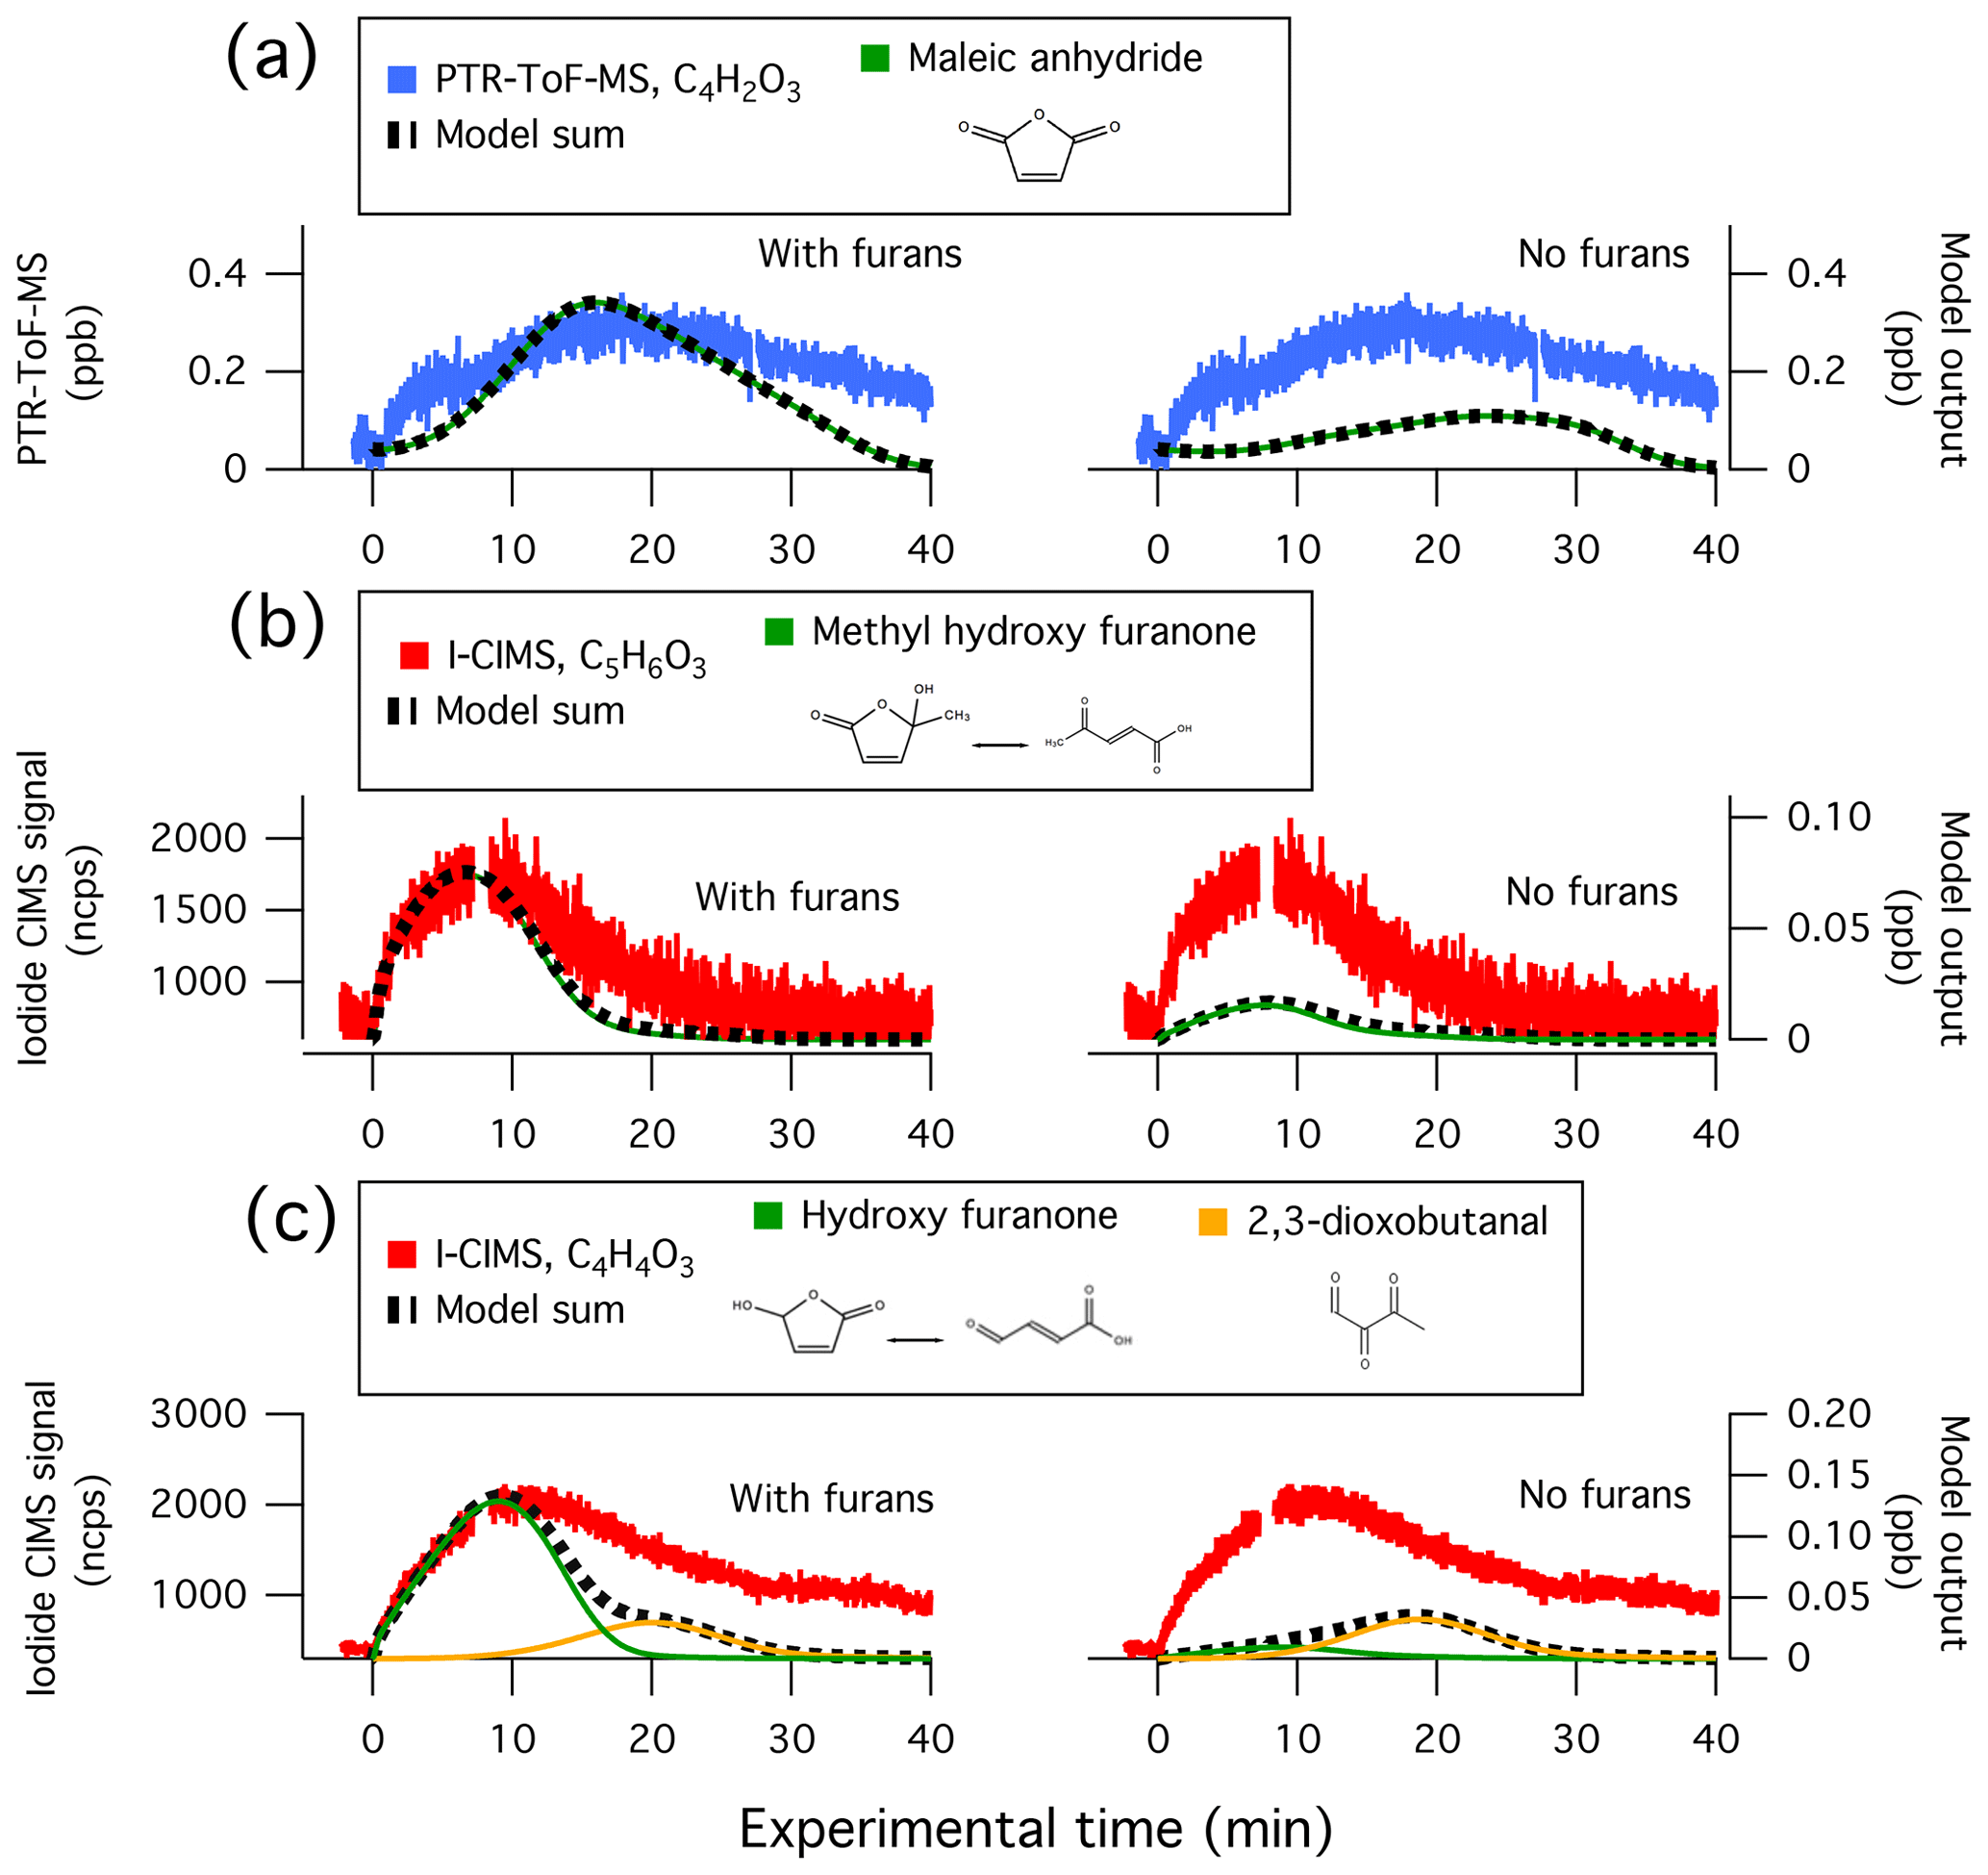
Figure 8Secondary NMOG measurements compared to modeled output for Fire 38. Row (a) shows PTR-ToF-MS measurements of C4H2O3 compared to model output of maleic anhydride. Row (b) shows I−-ToF-CIMS measurements of C5H6O3 compared to model output of methyl hydroxy furanone and its tautomer: β-acetylacrylic acid. Row (c) shows I−-ToF-CIMS measurements of C4H4O3 compared to model output of hydroxy furanone, its tautomer malealdehydic acid, and 2,3-dioxobutanal. All graphs to the left show full model runs, while graphs to the right show model runs when the initial conditions of furan, 2-methylfuran, 2,5-dimethylfuran, furfural, 5-methylfurfural, and furanone are set to zero.
C4H2O3, C5H6O3, and C4H4O3 were shown in Sect. 3.1 to constitute some of the most abundant photochemical products observed by PTR-ToF-MS and I-CIMS. The model runs in Figs. 8 and S12 demonstrate that furan chemistry significantly contributes to the modeled formation of these secondary NMOGs. The model also supports the inference that these masses correspond to measurements of maleic anhydride, methyl hydroxy furanone, and hydroxy furanone, respectively. This is most evident by comparing the shape of the temporal profiles between the measurements and modeled output. Maleic anhydride is the only species in the MCM with chemical formula C4H4O3, and the model generally captures the peak C4H4O3 signal after ∼20 min of oxidation to within the uncertainty of the measurement (∼50 %). Several species with chemical formula C5H6O3 are represented in the MCM. Here, the modeling output is dominated by methyl hydroxy furanone and its tautomer, β-acetylacrylic acid. Finally, I-CIMS measurements of C4H4O3 are best captured by the model output of hydroxy furanone and its tautomer, malealdehydic acid.
The temporal profile of C7H7NO4 is also well-described by model output of nitroguaiacol (Fig. S13). Nitroaromatics are formed by the reaction of NO2 with the o-semiquinone radical resulting from OH abstraction of the phenolic hydrogen (Finewax et al., 2018). NO2 was abundant at the beginning of mini-chamber experiments initialized with NMOGs resulting from flaming emissions (Fig. S2); thus, nitroaromatics are expected to be present in many burns studied here. Note that only the results from F38 are shown. Very little formation of nitroguaiacol was observed in F26, owing to the relatively low amount of NOx emitted from the smoldering combustion of Engelmann spruce duff.
The model provides insights into the formation pathways of important secondary NMOGs, which could be used to place constraints on plume properties. For example, measurements of maleic anhydride, hydroxy furanone, and methyl hydroxy furanone could be used as proxies to estimate plume age since the furanones will likely be enhanced in younger plumes, whereas maleic anhydride will likely be enhanced in aged plumes. In plumes containing high proportions of furans, it could be feasible to evaluate furan chemistry to derive important modeling constraints, such as OH exposures.
Despite the success of the model in reproducing a number of observations, several differences exist, as described below. First, the model output exhibits a faster decay of furans than what is observed by PTR-ToF-MS (Fig. 7). This likely reflects the uncertainty associated with the mass assignment of furan species. Using GC-PTR-ToF-MS, Koss et al. (2018) showed that nearly 50 % of the primary signal at C5H6O-H+ (mass of 2-methylfuran) and C6H8O-H+ (mass of 2,5-dimethylfuran) is associated with unidentified oxygenates. These unidentified species likely have different reactivities towards OH which may lead to model and observation disagreement. Likewise, secondary NMOG isomers could also form at these masses, further confounding model predictions of furans.
The decay of furfural is distinct from other furans because several processes contribute to temporal profile of . Notably, there appears to be a fast decay of , followed by a slower decay after 10s of oxidation. The model generally captures the fast decay of , which is almost entirely due to photolysis of furfural. This degree of photolysis is different from the real atmosphere and results from furfural's exceptionally large cross section at 254 nm (> cm2, Ferreira da Silva et al., 2015). The slower decay appears to result from an interference of another NMOG. This is supported by the I-CIMS, which measured the formation of a mass with formula . The I-CIMS is not sensitive to primary furan species, therefore this species is likely to be a secondary NMOG that is isomeric with furfural. This may explain why PTR-ToF-MS measurements of do not quickly decay to zero, as suggested by the model. It is notable that the formation of this secondary species is significant (∼50 % of the signal of primary furfural), which indicates that this is likely a secondary product formed from an abundant primary NMOG.
Despite the complications imposed by furfural photolysis, other furans and oxygenated aromatics do not exhibit strong absorption and are expected to be lost mostly by reaction with OH. Other absorbing species, such as methyl ethyl ketone and benzaldehyde, exhibit modeled photolysis losses on the order of 30 %, which is likely a more typical fraction for other photo-active species. More details comparing the chamber results to chemistry of ambient biomass burning plumes are provided in Sect. 3.2.3.
At the beginning of each experiment, PTR-ToF-MS measurements show a sharp increase in C4H2O3 that is not readily captured by the model (Fig. 8). This increase could result from fast formation of maleic anhydride, or is possibly another species with molecular formula C4H2O3. The model underpredicts maleic anhydride mixing ratios towards the end of the experiment, which likely points to additional sources of maleic anhydride that are not included in the model. The model reproduces peak maleic anhydride mixing ratios in F38 (Fig. 8a) but overpredicts peak maleic anhydride mixing ratios by a factor of 1.6 in F26 (Fig. S12a).
After ∼30 min of oxidation, the model sum of C4H4O3 approaches zero, yet the I-CIMS signal remains elevated (Fig. 8c). This may indicate that a slow-forming product is detected by I-CIMS, or that the OH rate constant of hydroxy furanone is overestimated. As discussed in Sect. 3.1, the PTR-ToF-MS detects a slow-forming product that likely corresponds to succinic anhydride (Fig. 1). The I-CIMS is sensitive to anhydrides; thus, it is possible that the elevated signal at longer oxidation timescales corresponds to the measurement of succinic anhydride. Succinic anhydride is not represented in the customized mechanism; consequently, no model output is available for comparison.
Figure 2 shows that small oxygenates are also abundant secondary NMOGs (i.e., acetaldehyde and formaldehyde); however, these species are underpredicted by the model by a factor of 10 or more (Fig. S13). This likely reflects additional chemical precursors or chemical pathways that are unaccounted for within the mini-chamber model. Furthermore, heterogeneous reactions, such as those on aerosol particles or Teflon surfaces (e.g., Zádor et al., 2006; Chapleski et al., 2016) or photolysis at 254 nm may contribute to the formation of these small oxygenates.
It is noted that without calibrated I-CIMS data it is difficult to assess whether the budget of these secondary NMOGs is fully represented by the model. Although it is expected that furans will be a primary precursor of C4H4O3 and C5H6O3 in real biomass burning plumes, the model indicates that other highly reactive species may also contribute to these masses. In F38, furans account for ∼80 % of the modeled production of C4H4O3 and ∼90 % of the modeled production of C5H6O3. In contrast, furans account for ∼60 % of the modeled production of C5H6O3 and ∼85 % of the modeled production of C4H4O3 during F26. The remaining production in the model is attributed to the OH oxidation of oxygenated aromatics – specifically, phenol and cresol. These oxygenated aromatics are more abundant during F26 due to the higher degree of smoldering combustion. These differences highlight the variability of secondary NMOG production and also imply that there could be remaining precursors of C4H4O3 and C5H6O3. These precursors would have to be highly reactive molecules with a carbon number of ≥4. There are a number of furans and oxygenated aromatics that could possibly contribute to the formation of these secondary NMOGs (e.g., hydroxymethylfurfural, Fig. 4) but whose chemical mechanism remains unknown.
3.2.3 Comparison of chamber chemistry to atmospheric conditions
The high-OH environment in the mini-chamber is similar to those produced in oxidation flow reactors. Peng et al. (2016, 2019) showed that oxidation flow reactors can be operated under conditions that approximate the chemistry of the atmosphere; however, the use of 254 nm light can lead to non-atmospheric reactions. For example, furfural photolysis is unlikely to play a significant role in the chemistry of real smoke, and NOx cycling is faster under ambient photolysis. Furthermore, high-OH environments may lead to RO2 fates that differ from ambient systems. In the atmosphere, the predominant fate of RO2 is reaction with NO or HO2. In wildfires, RO2 reactions with NO2 are also important in forming PAN and other peroxy nitrates (Alvarado et al., 2010). In low-NOx environments, RO2+RO2 and RO2 isomerization may also play a role (Crounse et al., 2013; Praske et al., 2018). RO2 isomerization was not included in the mechanism described here. The following discussion compares the modeled chemistry in the chamber to that expected for an ambient biomass burning plume.
In the atmosphere, primary NMOGs are mostly consumed by reaction with OH or via photolysis during the daytime, and reaction with O3 or NO3 at night. Table S4 shows the estimated contribution of each process to the primary NMOGs measured during F26 and F38. Also shown are the NMOG losses calculated from simulations of the ambient biomass burning plume described by Müller et al. (2016); see Sect. 3.2.4 for details of this modeling. For most species, the predominant loss pathway is reaction with OH. Ozonolysis is negligible, except for a small fraction of the monoterpenes (∼1 %). On the other hand, significant NMOG losses occur by photolysis, and to a lesser extent, reaction by NO3. Aside from furfural, loss by photolysis was dominant for acetone and 2,3-butanedione (> 50 %), significant for methyl ethyl ketone and benzaldehyde (∼30 %), and moderate for hydroxyacetone, glyoxal, methyl glyoxal, formaldehyde, and acetaldehyde (< 10 %). In general, photolysis losses were dependent on the relative ratio between the OH rate constant and photolysis frequency at 254 nm (Table S3). Photolysis losses were greatest for conjugated aldehydes and species with low OH rate constants and high-absorption cross sections. (e.g., acetone, Table S3). Conjugated aldehydes such as furfural are highly reactive towards OH; consequently, losses due to photolysis are notable since these processes represent unintended sinks of potentially important SOA and ozone precursors. In contrast, photolysis losses of other species, such as acetone, are likely less important since these species are less reactive towards OH. It is noted that other species reported here are likely to photolyze, but their absorption cross sections at 254 nm have not been measured (e.g., 5-methylfurfural, Colmenar et al., 2015).
Because numerous species absorb across a wide wavelength spectrum (e.g., acetaldehyde and hydroxyacetone Burkholder et al., 2015), there is some agreement between the photolysis losses estimated in the mini-chamber with those expected under ambient conditions. For hydroxyacetone, 2,3-butanedione, and acetaldehyde, reaction by photolysis was comparable to what was estimated for the ambient biomass burning plume described by Müller et al. (2016). In contrast, conjugated aldehydes, such as furfural and benzaldehyde, are characterized with absorption cross sections that favor shorter wavelengths; consequently, photolysis losses in the mini-chamber greatly exceed those expected in ambient plumes. These results highlight the challenges associated with studying multiday oxidation of biomass burning smoke in environmental chambers. Biomass burning emissions contain a myriad of functionalized NMOGs that readily photolyze at wavelengths required to generate high-OH environments. Experimental setups employing UVC lights must weigh the options of operating at high OH exposures (and thus progressing through chemistry quickly) or operating at gradual OH exposures that allow for longer sampling but higher exposures to UVC light. Similar considerations are made for oxidation flow reactors, although nearly all experiments are conducted at high-OH exposures since sampling is conducted at pseudo-steady-state (Peng et al., 2016). To avoid high photolysis exposures, future experiments employing 254 nm light may consider operating with higher ozone mixing ratios to increase the losses due to reaction by OH. Alternatively, chamber experiments operated at high relative humidity may employ 185 nm light to generate high-OH environments (Peng et al., 2016). In both cases, the chemistry will progress quickly, which may be undesirable for chamber experiments using low time resolution instrumentation. Another approach may be to use UVB or UVA lights and photolyze HONO to generate OH. This approach will reduce photolysis exposures but may only access 1–2 d of atmospheric-equivalent oxidation.
Unlike primary emissions that are dependent on the balance between photolysis and oxidant concentrations, the formation of secondary NMOGs largely depends on the fate of the RO2 radical. Figure 9a and b show a breakdown of the modeled RO2 pathways that contributed to the chemistry of the mini-chamber. The bars show the fraction RO2 radicals, separated by carbon number, that reacted through RO2+NO, RO2+HO2, RO2+NO2, and RO2+RO2 pathways. Figure 9c shows the breakdown of RO2 pathways for simulations of the ambient biomass burning plume.
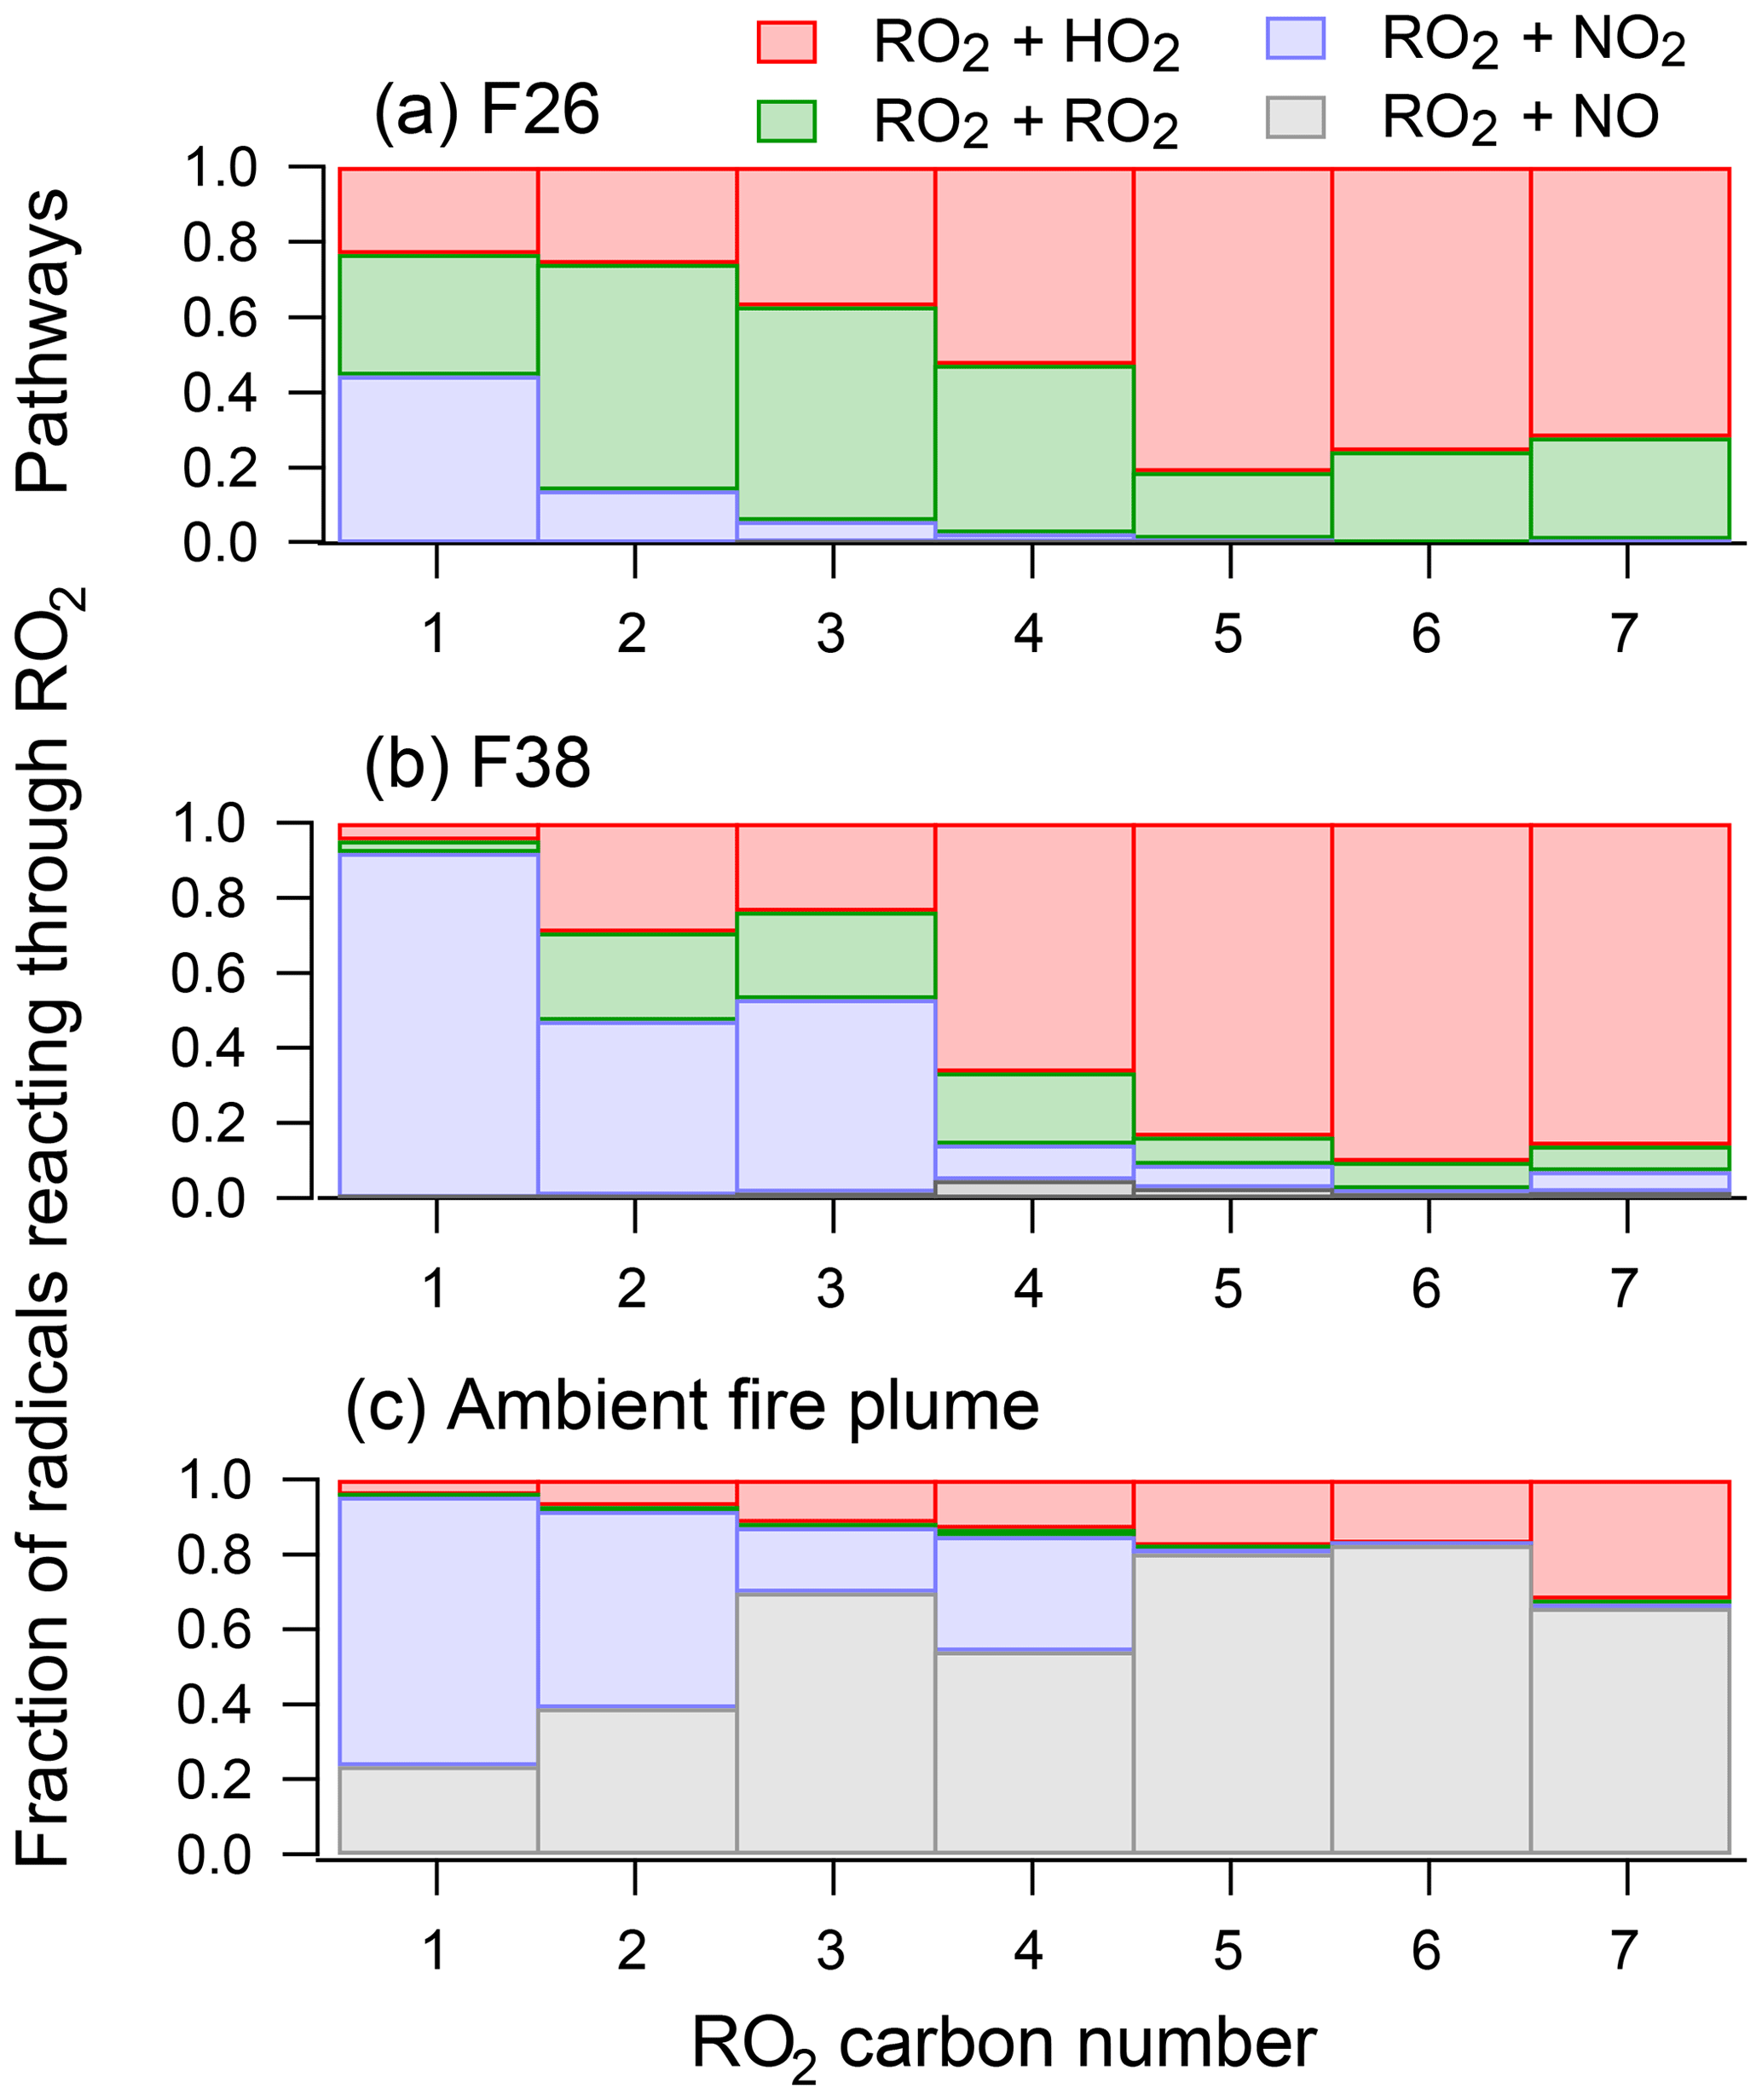
Figure 9The fate of RO2 species for (a) F26, (b) F38, and (c) the ambient biomass burning plume described by Müller et al. (2016). RO2 species are grouped by carbon number, and the color of each bar shows the fraction of RO2 species reacted by RO2+HO2, RO2+RO2, RO2+NO2, and RO2+NO pathways.
RO2 radicals in F38 largely reacted through two pathways: RO2+HO2 and RO2+NO2. The RO2+NO2 pathway primarily influenced the fate of smaller RO2 radicals (C≤3), leading to the formation of peroxy nitrates (specifically, PAN). For larger RO2 radicals (C≥4), the dominant pathway was RO2+HO2. On the other hand, the model suggests that the RO2+RO2 pathway played a significant role in the chemistry of F26. This results, in part, from the higher initial NMOG loading for F26 (∼280 ppb) compared to that of F38 (∼180 ppb), which enhanced the rate of RO2 production. The model suggests that the relative contribution of RO2 cross-reactions was lower for higher-carbon species; however, it is possible that these reactions produced accretion products unlikely to be found under ambient conditions. As discussed in Sect. 2.3.2 and shown in Fig. S2, F26 was not representative of most fires studied here. For the majority of fires presented in Figs. 2 and 3, the secondary NMOGs were likely formed through the pathways consistent with F38.
In general, most of the higher-carbon species in F38 followed atmospherically relevant pathways. For some species, RO2+RO2 reactions were also observed. While initial NMOG loadings may explain part of the enhanced RO2+RO2 rate, some fraction may also be attributed to the limited degree of NOx cycling in the mini-chamber. Under ambient conditions, NO2 is photolyzed to NO, which then reacts with RO2 (and HO2) radicals. Consequently, the RO2 + NO pathway may act to lower the fraction of radicals that follow the RO2+RO2 pathway. This is evidenced by the biomass burning plume described by Müller et al. (2016), which shows that the RO2+NO pathway is the dominant fate for most RO2 species under ambient photolysis. In the mini-chamber, NO2 does not strongly absorb at 254 nm and is quickly lost to PAN or HNO3; consequently, NOx does not play a significant role in the chemistry of higher-carbon RO2 radicals.
The primary focus of this study is to understand the formation of major secondary NMOGs measured by I-CIMS; thus, it is instructive to identify the modeled radical pathways that contribute to these formation rates. Figure S14 shows the pathways for the radicals that lead to the formation of hydroxy furanone and methyl hydroxy furanone. For both experiments, the hydroxy furanone radicals predominantly react through RO2+HO2 pathways. For F26, ∼15 % of the RO2 radicals react through the RO2+RO2 pathways, whereas ∼8 % follow this pathway for F38. These results suggest that the RO2+RO2 pathway played some role in both experiments but that the formation of hydroxy furanones in F38 predominantly followed atmospherically relevant pathways. It is noted that, as with other RO2 radicals, these species are expected to mostly react with NO under ambient conditions (Fig. S14). Despite this difference, the RO2+HO2 pathway and the RO2+NO pathway are both expected to lead to hydroxy furanone formation (Figs. S4 and S5).
3.2.4 Observations and box modeling of secondary NMOGs in real biomass burning plumes
Section 3.2.3 shows that the radical pathways in the mini-chamber exhibited similarities, as well as differences, to those expected under atmospheric photolysis. In order to evaluate the impact of furan chemistry under ambient conditions, this work builds upon the model described by Müller et al. (2016) to evaluate the customized MCM mechanism with measurements from a real biomass burning plume.
During the 2013 DISCOVER-AQ aircraft campaign, the NASA P-3B conducted several plume intercepts downwind of a controlled burn conducted in a mixed-forested ecosystem. NMOGs were monitored by a PTR-ToF-MS, meteorological parameters (temperature, pressure, and relative humidity) were monitored by a suite of aircraft instrumentation, and NOx and O3 were monitored by chemiluminescence. Müller et al. (2016) modeled the chemical evolution of NMOGs using a semi-Lagrangian box model with a modified MCM mechanism that included a basic oxidation scheme for furan and furfural. The authors successfully modeled the loss of primary NMOGs, including furan and furfural, and captured trends in ozone, NOx, and peroxyacetyl nitrate (PAN). Downwind of the fire, the authors observed the formation of NMOGs, such as maleic anhydride, which could not be explained by the model.
The authors initialized the chemistry with measurements of NMOGs, NOx, and O3 sampled in close proximity of the fire. Plume dilution was constrained based on the temporal evolution of CO. Background NMOGs, NOx, and O3 concentrations were prescribed based on aircraft measurements conducted outside of the plume. The plume was simulated for 1 h, and meteorological parameters were constrained based on measurements conducted at each plume crossing. Photolysis was prescribed based on observed NO2 photolysis frequencies.
The analysis described Müller et al. (2016) is recreated here but with the full mechanisms of furan, furfural, 2,-methylfuran, 2,5-dimethylfuran, and 5-methylfurfural incorporated into the MCM. Other mechanisms that were not previously analyzed by Müller et al. (2016) are also considered, including phenol, cresol, and catechol. These species have important contributions to the primary OH reactivity of biomass burning smoke and are explicitly represented in MCM v. 3.3.1 (Fig. 4). The initial conditions of furan and furfural are prescribed based on the observed mixing ratios reported by Müller et al. (2016). The mixing ratios of 2-methylfuran, phenol, and cresol are constrained based on the signals measured at m∕z 83.05 (C5H6O-H+), m∕z 95.045 (C6H6O-H+), and m∕z 109.066 (C7H8O-H+), respectively. The signal attributable to 2,5-dimethylfuran is isobaric with furfural and was not fully resolved by PTR-ToF-MS due to the overwhelming signal of furfural (∼10 times greater than the signal of other furan species). The mixing ratio of 2,5-dimethylfuran is expected to significantly contribute to total NMOG mixing ratios and OH reactivity (Fig. 4); therefore, the initial mixing ratio of 2,5-dimethylfuran is constrained based on the dimethylfuran ∕ methylfuran ratio reported elsewhere (∼0.5, Koss et al., 2018). Finally, methylfurfural and catechol are included based on the signal at m∕z 111.049 (C6H6O2-H+), and it is assumed that 50 % of the signal can be attributed to each compound as recommended by Koss et al. (2018). The initial mixing ratios of methylfurfural + catechol and cresol are adjusted to best match the decay of C6H6O2-H+ and C7H8O-H+, respectively.
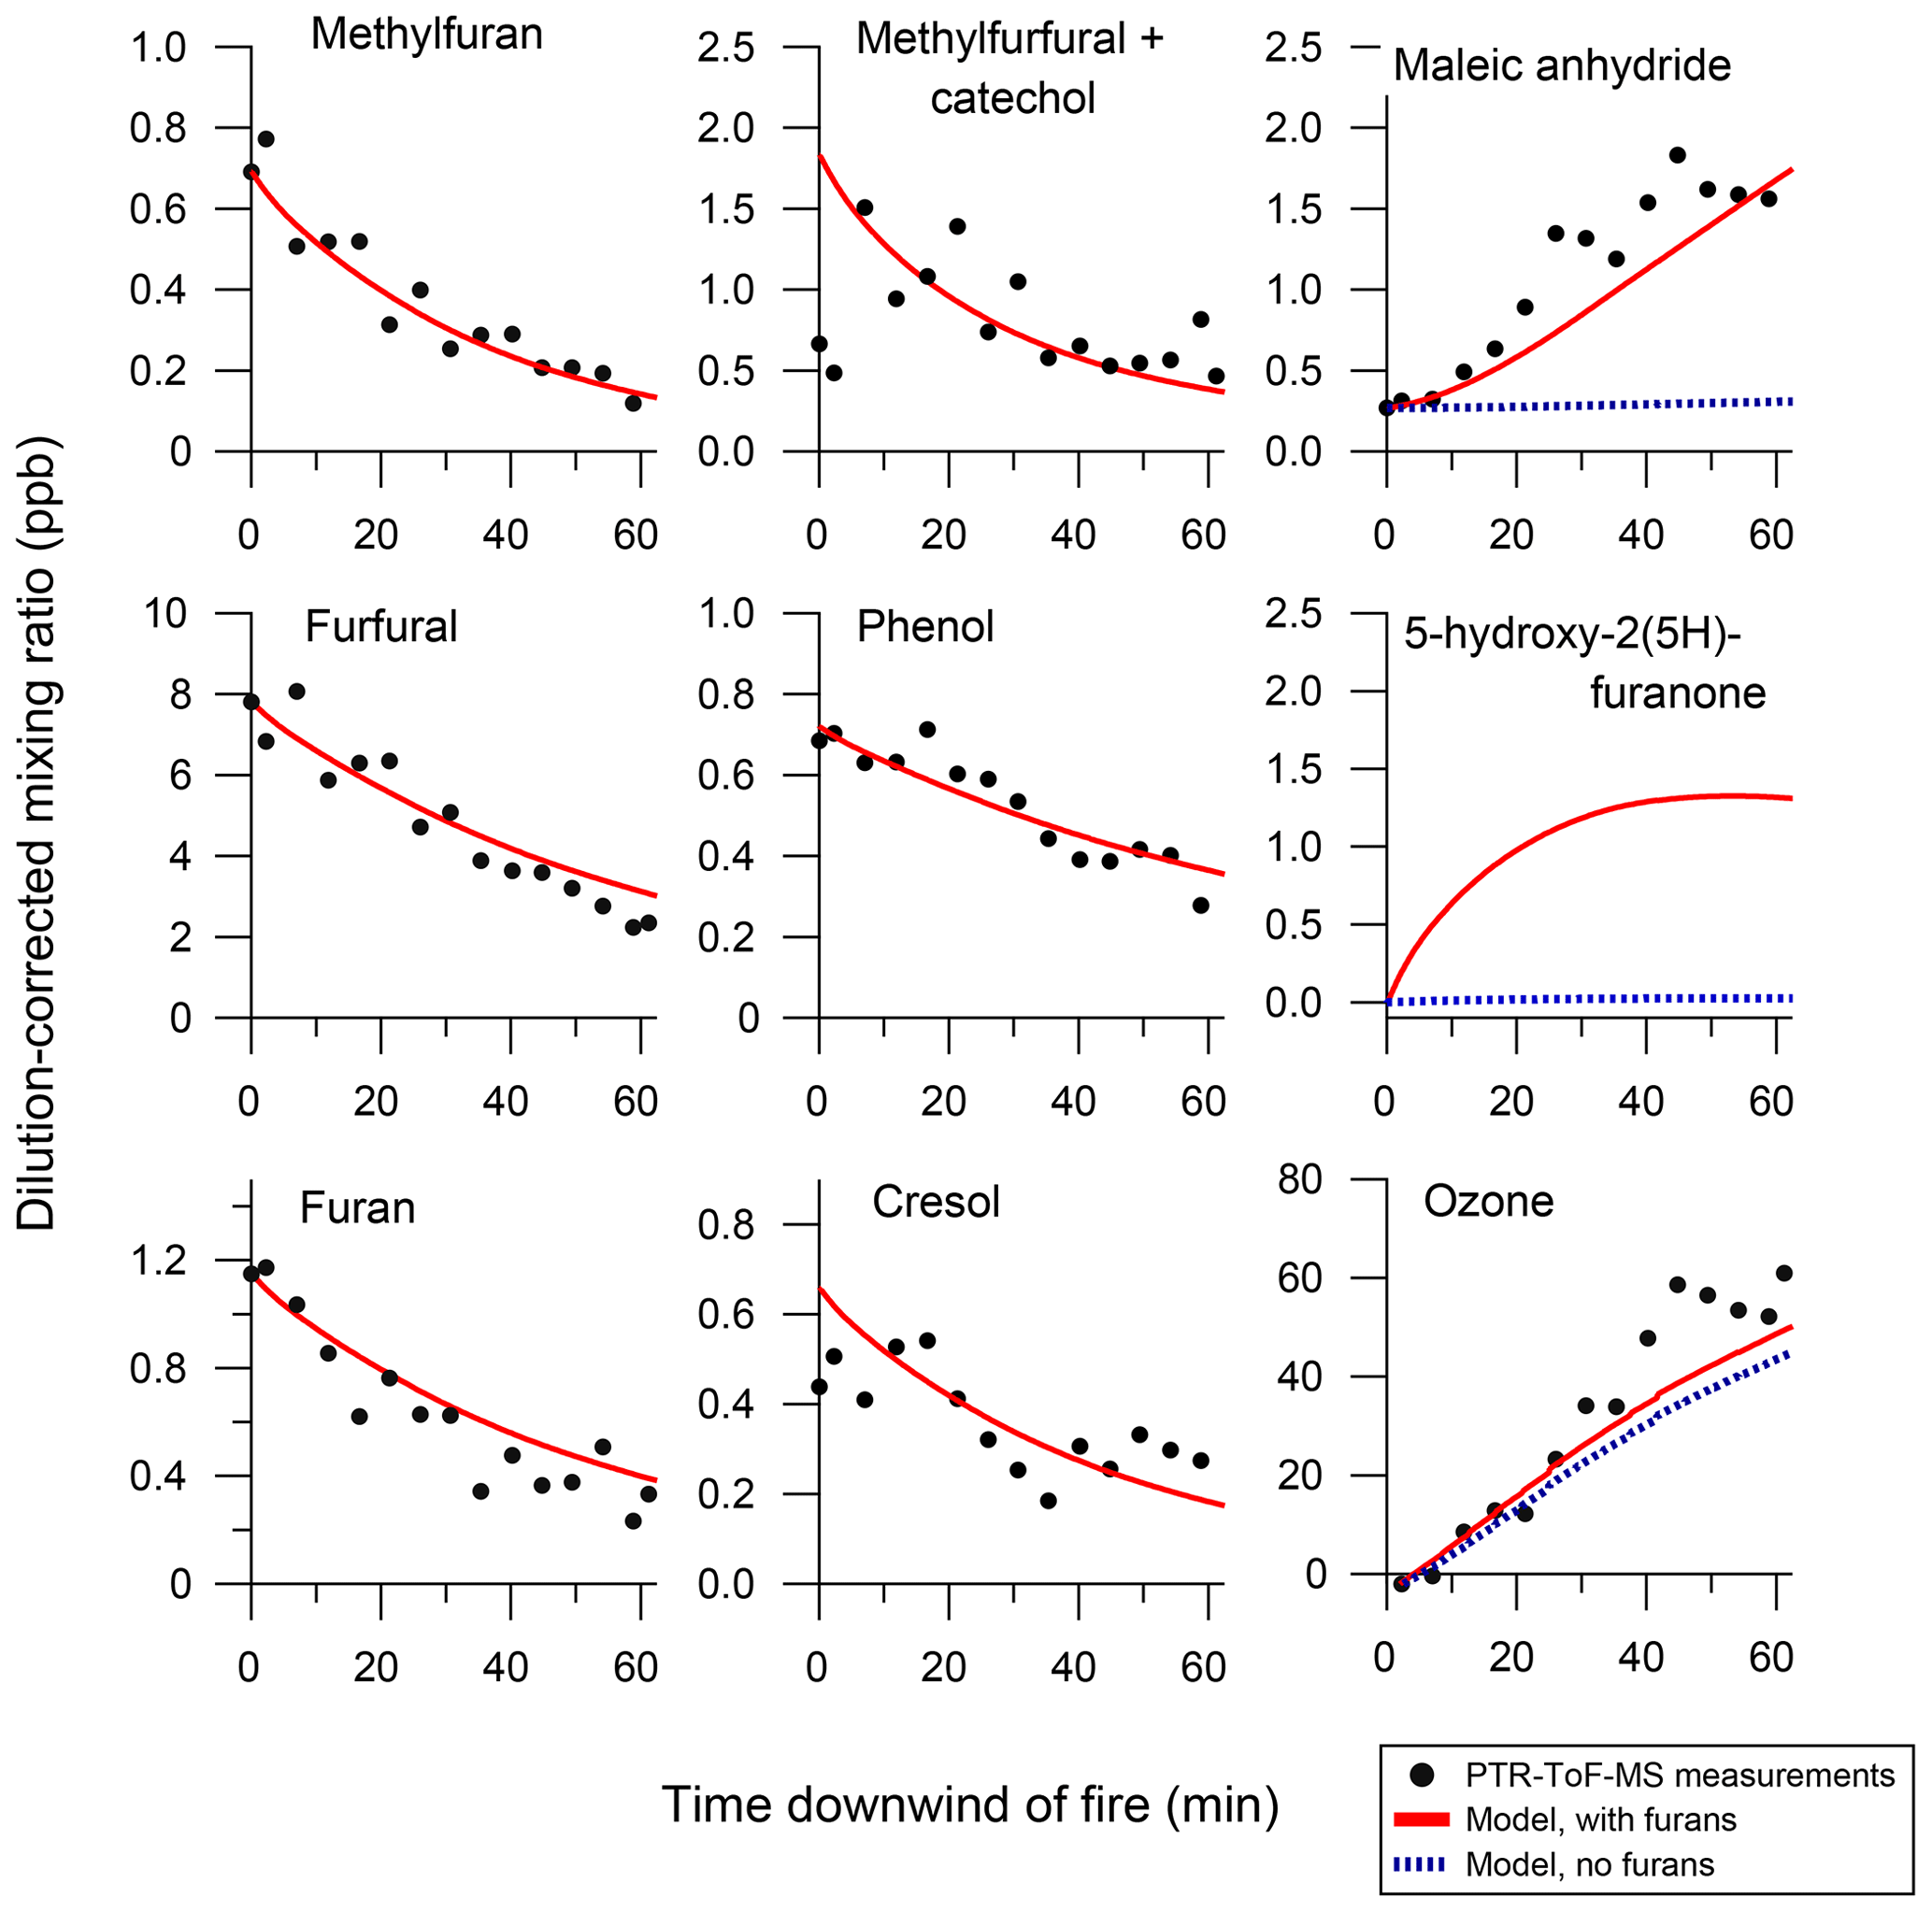
Figure 10Summary of model results for the understory fire described by Müller et al. (2016). Data are presented as mixing ratios corrected for dilution (calculated based on the decay of CO). The initial conditions for methylfurfural + catechol and cresol were adjusted to best match the observed decay. Results with furans excluded from the model are shown as dotted lines. Maleic anhydride and ozone are shown to illustrate the impact of furans on secondary product formation.
Figure 10 compares the model output to the dilution-corrected mixing ratios of furans, oxygenated aromatics, maleic anhydride, and ozone. The model output of hydroxy furanone is also shown but not compared to measurements since an I-CIMS was not onboard the P-3B. Red lines show the model output with furan chemistry included in the model. Dotted blue lines show model output with initial furan mixing ratios set to zero.
The model satisfactorily reproduces the temporal profiles of furans, oxygenated aromatic species, maleic anhydride, and ozone. The model also predicts significant formation of hydroxy furanone. Similar to the mini-chamber observations (Fig. 1), maleic anhydride exhibits a temporal profile that is consistent with a slow-forming product. The model output of hydroxy furanone exhibits a fast-forming temporal profile as expected from the mini-chamber experiments (Fig. 1).
The production of maleic anhydride and hydroxy furanone is negligible when the initial concentrations of furan species are set to zero. For both species, furfural oxidation accounts for more than 50 % of the total production. As discussed in Sect. 3.2.1, the furfural mechanism is based on theoretical calculations and the exact branching ratios may differ from those estimated by Zhao and Wang (2017). The assumed branching ratios weakly impact the formation of maleic anhydride, whereas hydroxy furanone is most impacted by the assumed branching ratio of the ring-retaining pathway (channel b, Fig. S16). I-CIMS measurements of hydroxy furanone may provide better constraints on the relative importance of each pathway.
Good agreement between ozone measurements and model output was also observed by Müller et al. (2016). Most of the ozone production results from reactions involving HO2 (formed primarily from OH + formaldehyde, CO, and furfural reactions), CH3O2 radicals (formed primarily from reactions involving acetaldehyde, 2,3-butanedione, and methylglyoxal), and NO. When furans are removed from the model, predicted ozone mixing ratios decrease by 12 %. It is estimated that ∼5 ppb of ozone was produced from furan chemistry after 60 min of oxidation. Notably, ozone formation was not sensitive to the assumed furfural branching ratios (Fig. S16). It is noted that the contribution of ozone from furan chemistry will vary depending on NOx conditions and that this estimate is not equivalent to a generalized ozone formation potential.
The products of furan chemistry are also reactive (e.g., hydroxy furanone, 1,4-butenedial, methyl hydroxy furanone, Figs. S4–S9), and 1 h of oxidation is too short to capture the total potential ozone produced from the oxidation of furan precursors. Figure 11 extrapolates the model forward to evaluate multigenerational oxidation processes of ozone formation. The model is extrapolated assuming that the dilution rate continues to follow an exponential decay (calculated based on the measured CO loss). The solar zenith angle and are calculated based on time of day. Relative humidity, temperature, and pressure are assumed to remain constant following the last measured plume intercept.
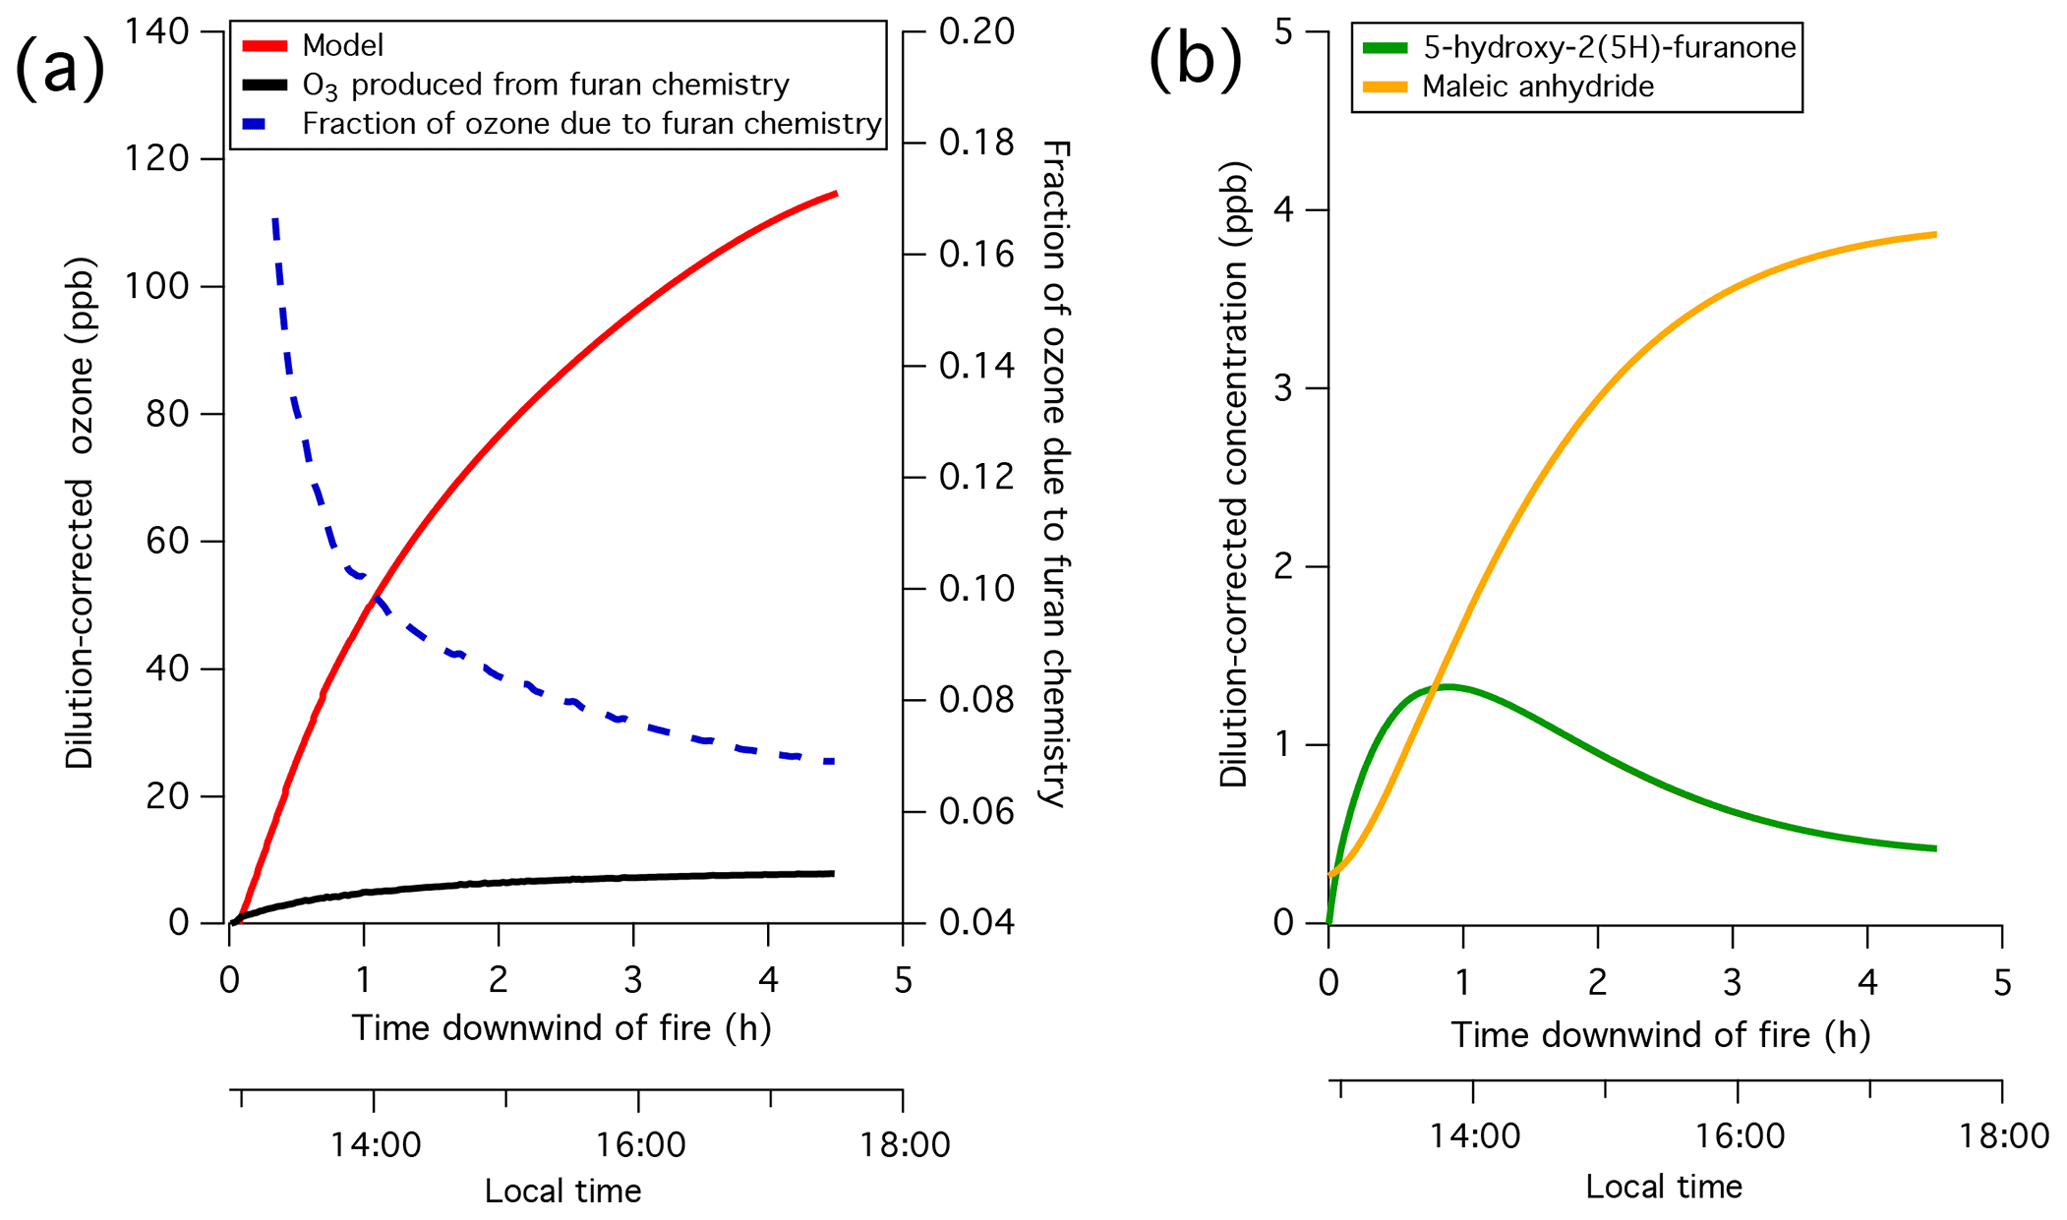
Figure 11(a) Total ozone, estimated ozone produced by furan chemistry, and fraction of total ozone associated with furan chemistry for the modeled biomass burning plume measured by Müller et al. (2016). (b) Model predictions of 5-hydroxy-2(5H)-furanone and maleic anhydride production. Shown is an extrapolation of the 1 h model described in Sect. 3.2.4. After 10 min of oxidation, furan chemistry is responsible for > 15 % of total ozone production in the model. The predicted contribution from furan chemistry decreases as furans are consumed and other, slower-reacting primary NMOGs begin to oxidize. Furan chemistry contributes ∼8 ppb of ozone after 4.5 h of oxidation.
Figure 11 shows the extrapolated modeling results of ozone, hydroxy furanone, and maleic anhydride until 17:30 local time when the solar zenith angle approaches 70∘ (∼1.5 h before sunset). Hydroxy furanone production maximizes after 1 h of oxidation, and subsequently decays due to OH oxidation. In contrast, maleic anhydride continues to increase. Figure 11a shows the estimated ozone produced from furan chemistry (calculated as the difference between model runs initialized with and without furan species). Ozone production from furan oxidation continues to rise after 1 h of aging, in part because of the oxidation of reactive secondary NMOGs such as hydroxy furanone. After 4.5 h of oxidation, the total ozone produced from furan chemistry is ∼8 ppb.
Figure 11 demonstrates that furan chemistry contributed to the evolution of ozone within 4 h of emission. After 2 h of aging, most furans have reacted (< 20 % remain), and their contribution to ozone production via reactions of secondary NMOGs diminishes. It is important to note that ozone production will vary depending on NOx availability, NOx∕NMOG ratios, the chemical composition of the NMOG mixture, and meteorological conditions. Despite these factors, furan chemistry will likely play a role in ozone production for many biomass burning plumes due to the ubiquitous presence of furans in smoke (Stockwell et al., 2014, 2015; Gilman et al., 2015; Hatch et al., 2015; Bruns et al., 2017; Hartikainen et al., 2018; Koss et al., 2018; Sekimoto et al., 2018).
The plume described above is relatively young; however, observations from the mini-chamber (Fig. 1) and the continued formation of maleic anhydride in the extrapolated model suggests that this compound could be present in highly aged plumes. During the NOAA Shale Oil and Natural Gas Nexus (SONGNEX https://www.esrl.noaa.gov/csd/projects/songnex/, last access: 4 January 2018) field campaign, the NOAA WP-3D aircraft intercepted a large biomass burning plume in the free troposphere above MT, US, on 21 April 2015 (Baylon et al., 2017). The plume had been transported at least 4 d from wildfires in Siberia and affected large portions of the western US. The PTR-ToF-MS described in this study was also deployed on the WP-3B and the resulting measurements are presented in Fig. 12. The aged plume (indicated by elevated mixing ratios of acetonitrile and acetic acid) exhibited clear enhancements in maleic anhydride and C4H4O3, which is attributed to succinic anhydride. In contrast, furan mixing ratios did not increase above background levels, indicating that these species completely reacted before sampling by the P-3.
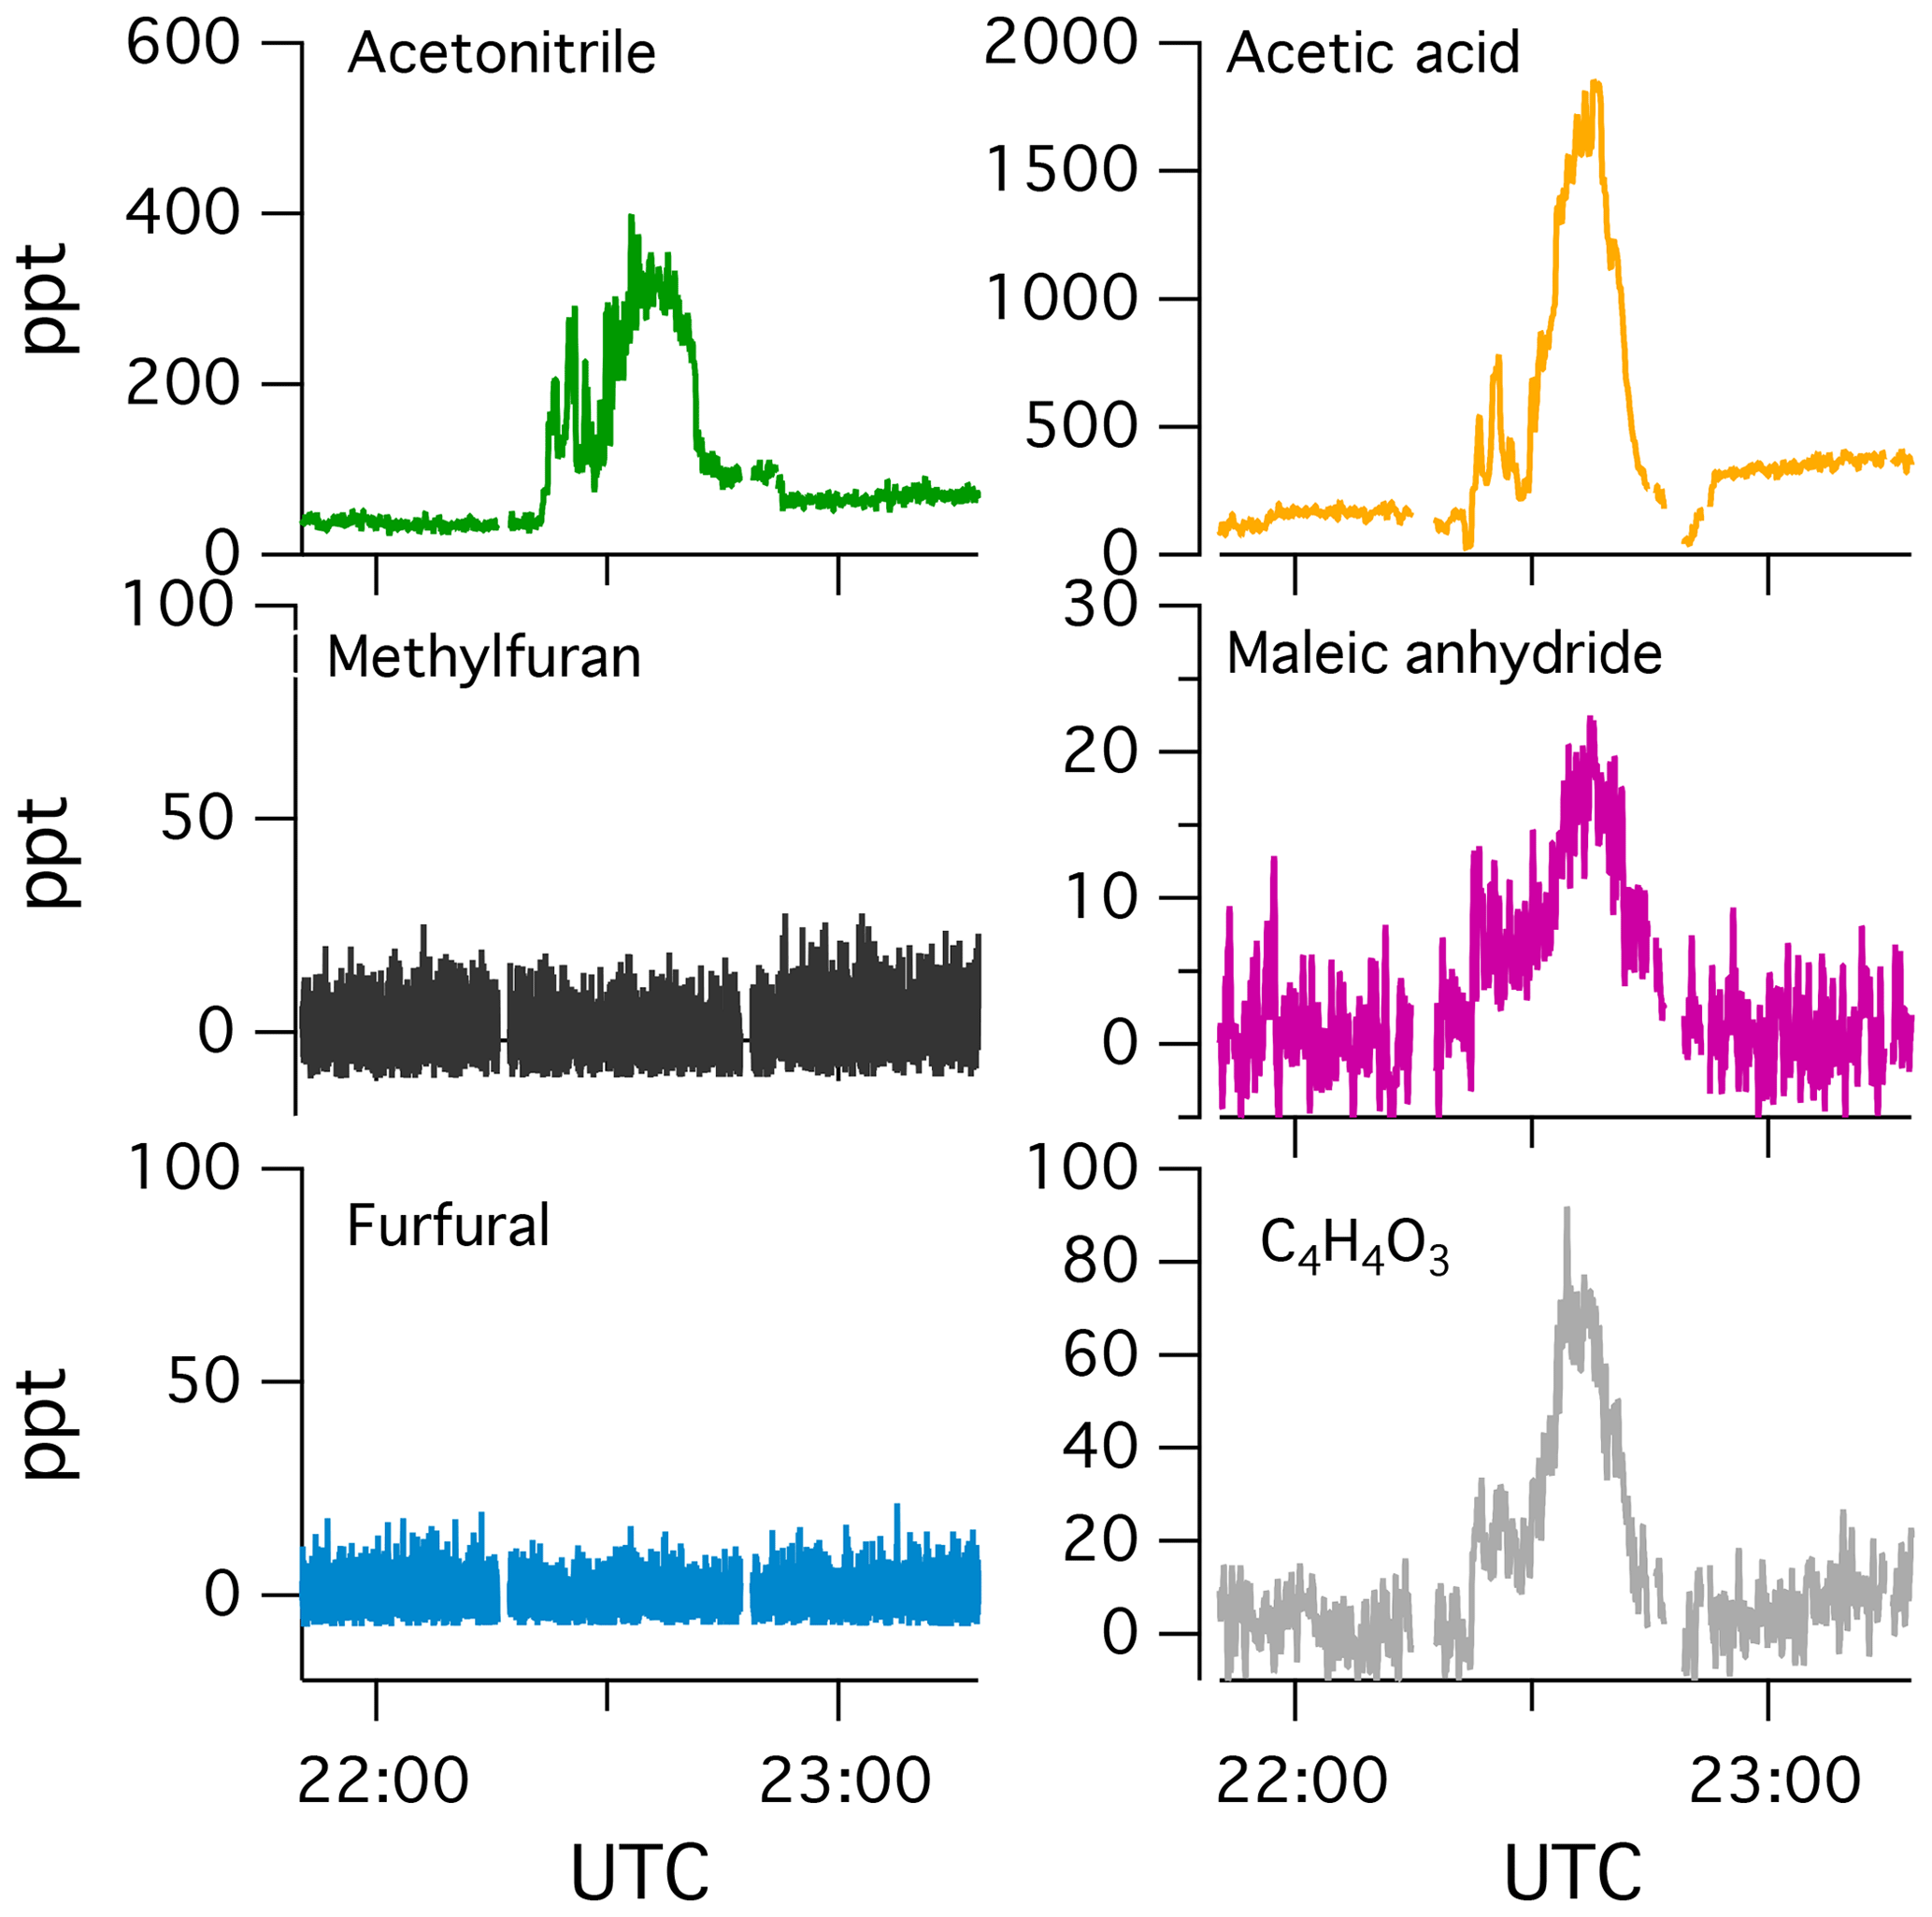
Figure 12PTR-ToF-MS measurements of a wild fire plume transported to the US from southern Siberia. The plume was intercepted 21 April 2015 during the SONGNEX field campaign and is described in detail by Baylon et al. (2017).
The lifetimes of maleic and succinic anhydride are long (> 5 d at OH concentrations of 1.5×10⁶ molec. cm−3); consequently, these species may have formed from the OH oxidation of furans and oxygenated aromatics shortly downwind of the fire and survived transport to the western US. These species may have also formed during transit from the oxidation of slow-reacting aromatics, such as benzene. The detection of anhydrides in highly aged plumes is consistent with the behavior of the mini-chamber (Fig. 1) and demonstrates the relevance of furans and aromatic oxidation on plume chemistry far downwind of fire sources.
This study evaluates the influence of understudied NMOG chemistry on the chemical evolution of laboratory and ambient biomass burning smoke. Smoke reacted with OH radicals exhibits fast decay of highly reactive organic species, such as furans and oxygenated aromatics, and significant formation of C4 and C5 oxygenates. A model incorporating furan chemistry into the MCM (v. 3.3.1) indicates that furan and oxygenated aromatic species are significant precursors of the secondary NMOGs measured by PTR-ToF-MS and I-CIMS. Similar results are observed from modeling of a small understory fire (Müller et al., 2016), which demonstrates the importance of furan chemistry in real biomass burning plumes.
Maleic anhydride (C4H2O3) and succinic anhydride (C4H4O3) are identified as important secondary NMOGs measured by PTR-ToF-MS. Those measured by I-CIMS are identified as methyl hydroxy furanone (C5H6O3) and a mixture of hydroxy furanone and succinic anhydride (C4H4O3). The link between these species and furan precursors may be useful in constraining OH exposures for biomass burning plumes measured in the ambient.
Previous studies have suggested that furan chemistry could play a significant role in ozone or SOA formation (Bruns et al., 2017; Hartikainen et al., 2018; Gilman et al., 2015; Hatch et al., 2015). For the biomass burning plume described by Müller et al. (2016), furan species likely contributed up to ∼10 % of total ozone production. The extent to which furans contribute to ozone formation will vary depending on burn conditions, and models should include these species in order to improve ozone predictions, especially for young biomass burning plumes.
The mechanism used to model the mini-chamber and ambient biomass burning plume is provided in the Supplement. Data from mini-chamber experiments and the SONGNEX flight from 21 April 2015 are available online (SONGNEX: https://www.esrl.noaa.gov/csd/projects/songnex/ and Fire Lab: https://www.esrl.noaa.gov/csd/projects/firex/firelab/.
The supplement related to this article is available online at: https://doi.org/10.5194/acp-19-14875-2019-supplement.
Firelab data were measured and processed by the following people: PTR-ToF-MS (MMC, ARK, KS, JdG, and CW); ACES (KJZ, SSB); I-CIMS (BY, JEK, and JLJ); OP-FTIR (VS, RY); GC/PTR-ToF-MS (ARK, JBG); NO (JMR). JHK and CC designed the mini-chamber experiments. CYL and DHH operated the mini-chamber. Ambient VOC measurements from the 2013 DISCOVER-AQ campaign were provided by MM and AW. MMC customized the MCM and conducted the model runs. MMC prepared the manuscript with contributions from all co-authors.
The authors declare that they have no conflict of interest.
The authors thank all those who helped organize and participated in the 2016 Fire Lab experiments, particularly Edward O'Donnell and Maegan Dills for lighting the fires; Ted Christian, Roger Ottmar, David Weise, Mark Cochrane, Kevin Ryan, and Robert Keane for assistance with the fuels; and Shawn Urbanski and Thomas Dzomba for logistical support. The authors also thank Denise D. Montzka, David J. Knapp, and Andrew J. Weinheimer for giving us permission to use NOx and O3 measurements from the WP-3D, and John D. Barrick for giving us permission to use jNO2 measurements.
This research has been was supported by the National Oceanic and Atmospheric Administration Atmospheric Chemistry, Carbon Cycle and Climate Program (award nos. NA16OAR4310111 and NA16OAR4310112). Christopher Y. Lim and Abigail R. Koss were additionally supported by the National Science Foundation Graduate Research Fellowship Program.
This paper was edited by Andreas Hofzumahaus and reviewed by William Stockwell and two anonymous referees.
Ahern, A. T., Goldberger, L., Jahl, L., Thornton, J., and Sullivan, R. C.: Production of N2O5 and ClNO2 through Nocturnal Processing of Biomass-Burning Aerosol, Environ. Sci. Technol., 52, 550–559, https://doi.org/10.1021/acs.est.7b04386, 2018. a
Akagi, S. K., Craven, J. S., Taylor, J. W., McMeeking, G. R., Yokelson, R. J., Burling, I. R., Urbanski, S. P., Wold, C. E., Seinfeld, J. H., Coe, H., Alvarado, M. J., and Weise, D. R.: Evolution of trace gases and particles emitted by a chaparral fire in California, Atmos. Chem. Phys., 12, 1397–1421, https://doi.org/10.5194/acp-12-1397-2012, 2012. a
Akagi, S. K., Yokelson, R. J., Burling, I. R., Meinardi, S., Simpson, I., Blake, D. R., McMeeking, G. R., Sullivan, A., Lee, T., Kreidenweis, S., Urbanski, S., Reardon, J., Griffith, D. W. T., Johnson, T. J., and Weise, D. R.: Measurements of reactive trace gases and variable O3 formation rates in some South Carolina biomass burning plumes, Atmos. Chem. Phys., 13, 1141–1165, https://doi.org/10.5194/acp-13-1141-2013, 2013. a, b
Alvarado, M. J., Logan, J. A., Mao, J., Apel, E., Riemer, D., Blake, D., Cohen, R. C., Min, K.-E., Perring, A. E., Browne, E. C., Wooldridge, P. J., Diskin, G. S., Sachse, G. W., Fuelberg, H., Sessions, W. R., Harrigan, D. L., Huey, G., Liao, J., Case-Hanks, A., Jimenez, J. L., Cubison, M. J., Vay, S. A., Weinheimer, A. J., Knapp, D. J., Montzka, D. D., Flocke, F. M., Pollack, I. B., Wennberg, P. O., Kurten, A., Crounse, J., Clair, J. M. St., Wisthaler, A., Mikoviny, T., Yantosca, R. M., Carouge, C. C., and Le Sager, P.: Nitrogen oxides and PAN in plumes from boreal fires during ARCTAS-B and their impact on ozone: an integrated analysis of aircraft and satellite observations, Atmos. Chem. Phys., 10, 9739–9760, https://doi.org/10.5194/acp-10-9739-2010, 2010. a, b, c
Alvarado, M. J., Lonsdale, C. R., Yokelson, R. J., Akagi, S. K., Coe, H., Craven, J. S., Fischer, E. V., McMeeking, G. R., Seinfeld, J. H., Soni, T., Taylor, J. W., Weise, D. R., and Wold, C. E.: Investigating the links between ozone and organic aerosol chemistry in a biomass burning plume from a prescribed fire in California chaparral, Atmos. Chem. Phys., 15, 6667–6688, https://doi.org/10.5194/acp-15-6667-2015, 2015. a, b
Alvarez, E. G., BorrAs, E., Viidanoja, J., and Hjorth, J.: Unsaturated dicarbonyl products from the OH-initiated photo-oxidation of furan, 2-methylfuran and 3-methylfuran, Atmos. Environ., 43, 1603–1612, 2009. a, b, c, d
Andreae, M. O., Browell, E. V., Garstang, M., Gregory, G. L., Harriss, R. C., Hill, G. F., Jacob, D. J., Pereira, M. C., Sachse, G. W., Setzer, A. W., Dias, P. L. S., Talbot, R. W., Torres, A. L., and Wofsy, S. C.: Biomass-burning emissions and associated haze layers over Amazonia, J. Geophys. Res.-Atmos., 93, 1509–1527, https://doi.org/10.1029/JD093iD02p01509, 1988. a
Aschmann, S. M., Nishino, N., Arey, J., and Atkinson, R.: Kinetics of the Reactions of OH Radicals with 2- and 3-Methylfuran, 2,3- and 2,5-Dimethylfuran, and E- and Z-3-Hexene-2,5-dione, and Products of OH + 2,5-Dimethylfuran, Environ. Sci. Technol., 45, 1859–1865, 2011. a, b, c, d, e
Aschmann, S. M., Nishino, N., Arey, J., and Atkinson, R.: Products of the OH Radical-Initiated Reactions of Furan, 2- and 3-Methylfuran, and 2,3- and 2,5-Dimethylfuran in the Presence of NO, J. Phys. Chem. A., 118, 457–466, 2014. a, b, c, d, e, f, g, h, i, j, k
Atkinson, R., Baulch, D. L., Cox, R. A., Crowley, J. N., Hampson, R. F., Hynes, R. G., Jenkin, M. E., Rossi, M. J., Troe, J., and Subcommittee, I.: Evaluated kinetic and photochemical data for atmospheric chemistry: Volume II – gas phase reactions of organic species, Atmos. Chem. and Phys., 6, 3625–4055, https://doi.org/10.5194/acp-6-3625-2006, 2006. a
Barmet, P., Dommen, J., DeCarlo, P. F., Tritscher, T., Praplan, A. P., Platt, S. M., Prévôt, A. S. H., Donahue, N. M., and Baltensperger, U.: OH clock determination by proton transfer reaction mass spectrometry at an environmental chamber, Atmos. Meas. Tech., 5, 647–656, https://doi.org/10.5194/amt-5-647-2012, 2012. a
Baylon, P., Jaffe, D. A., de Gouw, J., and Warneke, C.: Influence of Long-Range Transport of Siberian Biomass Burning at the Mt. Bachelor Observatory during the Spring of 2015, Aerosol Air Qual. Res., 17, 2751–2761, 2017. a, b
Bian, Q., May, A. A., Kreidenweis, S. M., and Pierce, J. R.: Investigation of particle and vapor wall-loss effects on controlled wood-smoke smog-chamber experiments, Atmos. Chem. Phys., 15, 11027–11045, https://doi.org/10.5194/acp-15-11027-2015, 2015. a
Bierbach, A., Barnes, I., and Becker, K. H.: Atmospheric chemistry of unsaturated carbonyls: Butenedial, 4-oxo-2-pentenal, 3-hexene-2, 5-dione, maleic anhydride, 3H-furan-2-one, and 5-methyl-3H-furan-2-one, Environ. Sci. Technol., 28, 715–729, 1994. a, b, c, d
Bierbach, A., Barnes, I., and Becker, K. H.: Product and kinetic study of the OH-initiated gas-phase oxidation of furan, 2-methylfuran and furanaldehydes at ≈300 K, Atmos. Environ., 29, 2651–2660, 1995. a, b, c, d, e, f, g, h
Brey, S. J. and Fischer, E. V.: Smoke in the City: How Often and Where Does Smoke Impact Summertime Ozone in the United States?, Environ. Sci. Technol., 50, 1288–1294, 2016. a
Bruns, E. A., Slowik, J. G., El Haddad, I., Kilic, D., Klein, F., Dommen, J., Temime-Roussel, B., Marchand, N., Baltensperger, U., and Prévôt, A. S. H.: Characterization of gas-phase organics using proton transfer reaction time-of-flight mass spectrometry: fresh and aged residential wood combustion emissions, Atmos. Chem. Phys., 17, 705–720, https://doi.org/10.5194/acp-17-705-2017, 2017. a, b, c, d, e, f, g, h, i
Buhr, K., van Ruth, S., and Delahunty, C.: Analysis of volatile flavour compounds by Proton Transfer Reaction-Mass Spectrometry: fragmentation patterns and discrimination between isobaric and isomeric compounds, Int. J. Mass Spectrom., 221, 1–7, 2002. a
Burkholder, J., Sander, S., Abbatt, J., Barker, J., Huie, R., Kolb, C., Kurylo, M., Orkin, V., Wilmouth, D., and Wine, P.: Chemical Kinetics and Photochemical Data for Use in Atmospheric Studies, Evaluation No. 18, JPL Publication 15-10, Jet Propulsion Laboratory, Pasadena, http://jpldataeval.jpl.nasa.gov (last access: 4 December 2019), 2015. a, b, c
Burling, I. R., Yokelson, R. J., Griffith, D. W. T., Johnson, T. J., Veres, P., Roberts, J. M., Warneke, C., Urbanski, S. P., Reardon, J., Weise, D. R., Hao, W. M., and de Gouw, J.: Laboratory measurements of trace gas emissions from biomass burning of fuel types from the southeastern and southwestern United States, Atmos. Chem. Phys., 10, 11115–11130, https://doi.org/10.5194/acp-10-11115-2010, 2010. a, b
Chapleski, R. C., Zhang, Y., Troya, D., and Morris, J. R.: Heterogeneous chemistry and reaction dynamics of the atmospheric oxidants, O3, NO3, and OH, on organic surfaces, Chem. Soc. Rev., 45, 3731–3746, https://doi.org/10.1039/C5CS00375J, 2016. a
Colmenar, I., González, S., Jiménez, E., Martín, P., Salgado, S., Cabañas, B., and Albaladejo, J.: UV absorption cross sections between 290 and 380 nm of a series of furanaldehydes: Estimation of their photolysis lifetimes, Atmos. Environ., 103, 1–6, 2015. a, b, c
Crounse, J. D., Nielsen, L. B., Jørgensen, S., Kjaergaard, H. G., and Wennberg, P. O.: Autoxidation of Organic Compounds in the Atmosphere, J. Phys. Chem. Lett., 4, 3513–3520, https://doi.org/10.1021/jz4019207, 2013. a, b
Deming, B. L., Pagonis, D., Liu, X., Day, D. A., Talukdar, R., Krechmer, J. E., de Gouw, J. A., Jimenez, J. L., and Ziemann, P. J.: Measurements of delays of gas-phase compounds in a wide variety of tubing materials due to gas-wall interactions, Atmos. Meas. Tech., 12, 3453–3461, https://doi.org/10.5194/amt-12-3453-2019, 2019. a
Ferreira da Silva, F., Lange, E., Limão-Vieira, P., Jones, N. C., Hoffmann, S. V., Hubin-Franskin, M. J., Delwiche, J., Brunger, M. J., Neves, R. F. C., Lopes, M. C. A., de Oliveira, E. M., da Costa, R. F., Varella, M. T. d. N., Bettega, M. H. F., Blanco, F., García, G., Lima, M. A. P., and Jones, D. B.: Electronic excitation of furfural as probed by high-resolution vacuum ultraviolet spectroscopy, electron energy loss spectroscopy, and ab initiocalculations, J. Chem. Phys., 143, 144308–144314, 2015. a, b, c
Finewax, Z., de Gouw, J. A., and Ziemann, P. J.: Identification and Quantification of 4-Nitrocatechol Formed from OH and NO3 Radical-Initiated Reactions of Catechol in Air in the Presence of NOx: Implications for Secondary Organic Aerosol Formation from Biomass Burning, Environ. Sci. Technol., 52, 1981–1989, 2018. a, b, c, d, e
Ford, B., Val Martin, M., Zelasky, S. E., Fischer, E. V., Anenberg, S. C., Heald, C. L., and Pierce, J. R.: Future Fire Impacts on Smoke Concentrations, Visibility, and Health in the Contiguous United States, GeoHealth, 2, 229–247, 2018. a
Gandini, A., Parsons, J. M., and Back, R. A.: The photochemistry of 2-furaldehyde vapour. II. Photodecomposition: direct photolysis at 253.7 and 313 nm and Hg(3P1)-sensitized decomposition, Can. J. Chem., 54, 3095–3101, 1976. a, b, c, d
Gaston, C. J., Lopez-Hilfiker, F. D., Whybrew, L. E., Hadley, O., McNair, F., Gao, H., Jaffe, D. A., and Thornton, J. A.: Online molecular characterization of fine particulate matter in Port Angeles, WA: Evidence for a major impact from residential wood smoke, Atmos. Envrion., 138, 99–107, https://doi.org/10.1016/j.atmosenv.2016.05.013, 2016. a
Gilman, J. B., Lerner, B. M., Kuster, W. C., Goldan, P. D., Warneke, C., Veres, P. R., Roberts, J. M., de Gouw, J. A., Burling, I. R., and Yokelson, R. J.: Biomass burning emissions and potential air quality impacts of volatile organic compounds and other trace gases from fuels common in the US, Atmos. Chem. Phys., 15, 13915–13938, https://doi.org/10.5194/acp-15-13915-2015, 2015. a, b, c, d, e
Hartikainen, A., Yli-Pirilä, P., Tiitta, P., Leskinen, A., Kortelainen, M., Orasche, J., Schnelle-Kreis, J., Lehtinen, K. E. J., Zimmermann, R., Jokiniemi, J., and Sippula, O.: Volatile Organic Compounds from Logwood Combustion: Emissions and Transformation under Dark and Photochemical Aging Conditions in a Smog Chamber, Environ. Sci. Technol., 52, 4979–4988, 2018. a, b, c, d, e, f, g, h, i, j
Hatch, L. E., Luo, W., Pankow, J. F., Yokelson, R. J., Stockwell, C. E., and Barsanti, K. C.: Identification and quantification of gaseous organic compounds emitted from biomass burning using two-dimensional gas chromatography–time-of-flight mass spectrometry, Atmos. Chem. Phys., 15, 1865–1899, https://doi.org/10.5194/acp-15-1865-2015, 2015. a, b, c, d, e, f, g, h, i
Hatch, L. E., Yokelson, R. J., Stockwell, C. E., Veres, P. R., Simpson, I. J., Blake, D. R., Orlando, J. J., and Barsanti, K. C.: Multi-instrument comparison and compilation of non-methane organic gas emissions from biomass burning and implications for smoke-derived secondary organic aerosol precursors, Atmos. Chem. Phys., 17, 1471–1489, https://doi.org/10.5194/acp-17-1471-2017, 2017. a, b, c, d, e
Hiraoka, H. and Srinivasan, R.: Vapor-Phase Photochemistry of Furfural, The J. Chem. Phys., 48, 2185–2189, 1968. a, b
Hobbs, P. V., Sinha, P., Yokelson, R. J., Christian, T. J., Blake, D. R., Gao, S., Kirchstetter, T. W., Novakov, T., and Pilewskie, P.: Evolution of gases and particles from a savanna fire in South Africa, J. Geophys. Res., 108, 8485, https://doi.org/10.1029/2002JD002352, 2003. a
Hodshire, A. L., Bian, Q., Ramnarine, E., Lonsdale, C. R., Alvarado, M. J., Kreidenweis, S. M., Jathar, S. H., and Pierce, J. R.: More Than Emissions and Chemistry: Fire Size, Dilution, and Background Aerosol Also Greatly Influence Near-Field Biomass Burning Aerosol Aging, J. Geophys. Res.-Atmos., 124, 5589–5611, https://doi.org/10.1029/2018JD029674, 2019. a
Huey, L. G., Hanson, D. R., and Howard, C. J.: Reactions of SF6- and I- with Atmospheric Trace Gases, J. Phys. Chem., 99, 5001–5008, https://doi.org/10.1021/j100014a021, 1995. a
Jaffe, D., Chand, D., Hafner, W., Westerling, A., and Spracklen, D.: Influence of Fires on O3 Concentrations in the Western US, Environ. Sci. Technol., 42, 5885–5891, 2008. a, b
Jaffe, D. A. and Wigder, N. L.: Ozone production from wildfires: A critical review, Atmos. Environ., 51, 1–10, 2012. a, b
Jaffe, D. A., Wigder, N., Downey, N., Pfister, G., Boynard, A., and Reid, S. B.: Impact of Wildfires on Ozone Exceptional Events in the Western US, Environ. Sci. Technol., 47, 11065–11072, 2013. a
Jaffe, D. A., Cooper, O. R., Fiore, A. M., Henderson, B. H., Tonneson, G. S., Russell, A. G., Henze, D. K., Langford, A. O., Lin, M., and Moore, T.: Scientific assessment of background ozone over the US: Implications for air quality management, Elem. Sci. Anth., 6, 30 pp., 2018. a, b, c
Jenkin, M. E., Saunders, S. M., and Pilling, M. J.: The tropospheric degradation of volatile organic compounds: a protocol for mechanism development, Atmos. Environ., 31, 81–104, 1997. a, b, c, d
Jenkin, M. E., Saunders, S. M., Wagner, V., and Pilling, M. J.: Protocol for the development of the Master Chemical Mechanism, MCM v3 (Part B): tropospheric degradation of aromatic volatile organic compounds, Atmos. Chem. Phys., 3, 181–193, https://doi.org/10.5194/acp-3-181-2003, 2003. a, b, c, d
Jenkin, M. E., Young, J. C., and Rickard, A. R.: The MCM v3.3.1 degradation scheme for isoprene, Atmos. Chem. Phys., 15, 11433–11459, https://doi.org/10.5194/acp-15-11433-2015, 2015. a, b, c, d, e
Keller-Rudek, H., Moortgat, G. K., Sander, R., and Sörensen, R.: The MPI-Mainz UV/VIS Spectral Atlas of Gaseous Molecules of Atmospheric Interest, Earth Syst. Sci. Data, 5, 365–373, https://doi.org/10.5194/essd-5-365-2013, 2013. a
Koss, A. R., Sekimoto, K., Gilman, J. B., Selimovic, V., Coggon, M. M., Zarzana, K. J., Yuan, B., Lerner, B. M., Brown, S. S., Jimenez, J. L., Krechmer, J., Roberts, J. M., Warneke, C., Yokelson, R. J., and de Gouw, J.: Non-methane organic gas emissions from biomass burning: identification, quantification, and emission factors from PTR-ToF during the FIREX 2016 laboratory experiment, Atmos. Chem. Phys., 18, 3299–3319, https://doi.org/10.5194/acp-18-3299-2018, 2018. a, b, c, d, e, f, g, h, i, j, k, l, m, n, o, p
Krechmer, J. E., Pagonis, D., Ziemann, P. J., and Jimenez, J. L.: Quantification of Gas-Wall Partitioning in Teflon Environmental Chambers Using Rapid Bursts of Low-Volatility Oxidized Species Generated in Situ, Environ. Sci. Technol., 50, 5757–5765, https://doi.org/10.1021/acs.est.6b00606, 2016. a, b
Lauraguais, A., Coeur-Tourneur, C., Cassez, A., Deboudt, K., Fourmentin, M., and Choël, M.: Atmospheric reactivity of hydroxyl radicals with guaiacol (2-methoxyphenol), a biomass burning emitted compound: Secondary organic aerosol formation and gas-phase oxidation products, Atmos. Environ., 86, 155–163, 2014. a, b, c, d, e
Lee, B. H., Lopez-Hilfiker, F. D., Mohr, C., Kurtén, T., Worsnop, D. R., and Thornton, J. A.: An Iodide-Adduct High-Resolution Time-of-Flight Chemical-Ionization Mass Spectrometer: Application to Atmospheric Inorganic and Organic Compounds, Enviro. Sci. Technol., 48, 6309–6317, 2014. a, b
Lim, C. Y., Hagan, D. H., Coggon, M. M., Koss, A. R., Sekimoto, K., de Gouw, J., Warneke, C., Cappa, C. D., and Kroll, J. H.: Secondary organic aerosol formation from the laboratory oxidation of biomass burning emissions, Atmos. Chem. Phys., 19, 12797–12809, https://doi.org/10.5194/acp-19-12797-2019, 2019. a, b, c, d, e
Liu, X., Jeffries, H. E., and Sexton, K. G.: Atmospheric Photochemical Degradation of 1,4-Unsaturated Dicarbonyls, Environ. Sci. Technol., 33, 4212–4220, 1999. a
Liu, X., Zhang, Y., Huey, L. G., Yokelson, R. J., Wang, Y., Jimenez, J. L., Campuzano-Jost, P., Beyersdorf, A. J., Blake, D. R., Choi, Y., St. Clair, J. M., Crounse, J. D., Day, D. A., Diskin, G. S., Fried, A., Hall, S. R., Hanisco, T. F., King, L. E., Meinardi, S., Mikoviny, T., Palm, B. B., Peischl, J., Perring, A. E., Pollack, I. B., Ryerson, T. B., Sachse, G., Schwarz, J. P., Simpson, I. J., Tanner, D. J., Thornhill, K. L., Ullmann, K., Weber, R. J., Wennberg, P. O., Wisthaler, A., Wolfe, G. M., and Ziemba, L. D.: Agricultural fires in the southeastern US during SEAC4RS: Emissions of trace gases and particles and evolution of ozone, reactive nitrogen, and organic aerosol, J. Geophys. Res.-Atmos., 121, 7383–7414, https://doi.org/10.1002/2016JD025040, 2016. a, b
Mason, S. A., Field, R. J., Yokelson, R. J., Kochivar, M. A., Tinsley, M. R., Ward, D. E., and Hao, W. M.: Complex effects arising in smoke plume simulations due to inclusion of direct emissions of oxygenated organic species from biomass combustion, J. Geophys. Res.-Atmos., 106, 12527–12539, https://doi.org/10.1029/2001JD900003, 2001. a
Mauzerall, D. L., Logan, J. A., Jacob, D. J., Anderson, B. E., Blake, D. R., Bradshaw, J. D., Heikes, B., Sachse, G. W., Singh, H., and Talbot, B.: Photochemistry in biomass burning plumes and implications for tropospheric ozone over the tropical South Atlantic, Geophys. Res., 103, 8401–8423, 1998. a
Millet, D. B., Baasandorj, M., Farmer, D. K., Thornton, J. A., Baumann, K., Brophy, P., Chaliyakunnel, S., de Gouw, J. A., Graus, M., Hu, L., Koss, A., Lee, B. H., Lopez-Hilfiker, F. D., Neuman, J. A., Paulot, F., Peischl, J., Pollack, I. B., Ryerson, T. B., Warneke, C., Williams, B. J., and Xu, J.: A large and ubiquitous source of atmospheric formic acid, Atmos. Chem. Phys., 15, 6283–6304, https://doi.org/10.5194/acp-15-6283-2015, 2015. a
Müller, M., Anderson, B. E., Beyersdorf, A. J., Crawford, J. H., Diskin, G. S., Eichler, P., Fried, A., Keutsch, F. N., Mikoviny, T., Thornhill, K. L., Walega, J. G., Weinheimer, A. J., Yang, M., Yokelson, R. J., and Wisthaler, A.: In situ measurements and modeling of reactive trace gases in a small biomass burning plume, Atmos. Chem. Phys., 16, 3813–3824, https://doi.org/10.5194/acp-16-3813-2016, 2016. a, b, c, d, e, f, g, h, i, j, k, l, m, n, o, p, q, r, s, t, u, v, w, x, y, z, aa, ab, ac
Orlando, J. J. and Tyndall, G. S.: Laboratory studies of organic peroxy radical chemistry: an overview with emphasis on recent issues of atmospheric significance, Chem. Soc. Rev., 41, 6294–6317, https://doi.org/10.1039/c2cs35166h, 2012. a
Pagonis, D., Krechmer, J. E., de Gouw, J., Jimenez, J. L., and Ziemann, P. J.: Effects of gas-wall partitioning in Teflon tubing and instrumentation on time-resolved measurements of gas-phase organic compounds, Atmos. Meas. Tech., 10, 4687–4696, https://doi.org/10.5194/amt-10-4687-2017, 2017. a
Pagonis, D., Sekimoto, K., and de Gouw, J.: A library of proton-transfer reactions of H3O+ ions used for trace gas detection, J. Am. Soc. Mass Spectrom., 30, 1330–1335, 2019. a
Peng, Z. and Jimenez, J. L.: Modeling of the chemistry in oxidation flow reactors with high initial NO, Atmos. Chem. Phys., 17, 11991–12010, https://doi.org/10.5194/acp-17-11991-2017, 2017. a
Peng, Z., Day, D. A., Ortega, A. M., Palm, B. B., Hu, W., Stark, H., Li, R., Tsigaridis, K., Brune, W. H., and Jimenez, J. L.: Non-OH chemistry in oxidation flow reactors for the study of atmospheric chemistry systematically examined by modeling, Atmos. Chem. Phys., 16, 4283–4305, https://doi.org/10.5194/acp-16-4283-2016, 2016. a, b, c, d, e, f
Peng, Z., Lee-Taylor, J., Orlando, J. J., Tyndall, G. S., and Jimenez, J. L.: Organic peroxy radical chemistry in oxidation flow reactors and environmental chambers and their atmospheric relevance, Atmos. Chem. Phys., 19, 813–834, https://doi.org/10.5194/acp-19-813-2019, 2019. a, b, c, d
Praske, E., Otkjær, R. V., Crounse, J. D., Hethcox, J. C., Stoltz, B. M., Kjaergaard, H. G., and Wennberg, P. O.: Atmospheric autoxidation is increasingly important in urban and suburban North America, P. Natl. Acad. Sci. USA, 115, 64–69, https://doi.org/10.1073/pnas.1715540115, 2018. a, b
Priestley, M., Le Breton, M., Bannan, T. J., Leather, K. E., Bacak, A., Reyes-Villegas, E., De Vocht, F., Shallcross, B. M. A., Brazier, T., Anwar Khan, M., Allan, J., Shallcross, D. E., Coe, H., and Percival, C. J.: Observations of Isocyanate, Amide, Nitrate, and Nitro Compounds From an Anthropogenic Biomass Burning Event Using a ToF-CIMS, J. Geophys. Res.-Atmos., 123, 7687–7704, https://doi.org/10.1002/2017JD027316, 2018. a
Reyes-Villegas, E., Priestley, M., Ting, Y.-C., Haslett, S., Bannan, T., Le Breton, M., Williams, P. I., Bacak, A., Flynn, M. J., Coe, H., Percival, C., and Allan, J. D.: Simultaneous aerosol mass spectrometry and chemical ionisation mass spectrometry measurements during a biomass burning event in the UK: insights into nitrate chemistry, Atmos. Chem. Phys., 18, 4093–4111, https://doi.org/10.5194/acp-18-4093-2018, 2018. a, b
Saunders, S. M., Jenkin, M. E., Derwent, R. G., and Pilling, M. J.: Protocol for the development of the Master Chemical Mechanism, MCM v3 (Part A): tropospheric degradation of non-aromatic volatile organic compounds, Atmos. Chem. Phys., 3, 161–180, https://doi.org/10.5194/acp-3-161-2003, 2003. a, b, c, d, e
Sekimoto, K., Li, S.-M., Yuan, B., Koss, A., Coggon, M., Warneke, C., and de Gouw, J.: Calculation of the sensitivity of proton-transfer-reaction mass spectrometry (PTR-MS) for organic trace gases using molecular properties, Int. J. Mass Spectrom., 421, 71–94, 2017. a, b
Sekimoto, K., Koss, A. R., Gilman, J. B., Selimovic, V., Coggon, M. M., Zarzana, K. J., Yuan, B., Lerner, B. M., Brown, S. S., Warneke, C., Yokelson, R. J., Roberts, J. M., and de Gouw, J.: High- and low-temperature pyrolysis profiles describe volatile organic compound emissions from western US wildfire fuels, Atmos. Chem. Phys., 18, 9263–9281, https://doi.org/10.5194/acp-18-9263-2018, 2018. a, b, c, d, e, f, g
Selimovic, V., Yokelson, R. J., Warneke, C., Roberts, J. M., de Gouw, J., Reardon, J., and Griffith, D. W. T.: Aerosol optical properties and trace gas emissions by PAX and OP-FTIR for laboratory-simulated western US wildfires during FIREX, Atmos. Chem. Phys., 18, 2929–2948, https://doi.org/10.5194/acp-18-2929-2018, 2018. a, b, c, d
Stockwell, C. E., Yokelson, R. J., Kreidenweis, S. M., Robinson, A. L., DeMott, P. J., Sullivan, R. C., Reardon, J., Ryan, K. C., Griffith, D. W. T., and Stevens, L.: Trace gas emissions from combustion of peat, crop residue, domestic biofuels, grasses, and other fuels: configuration and Fourier transform infrared (FTIR) component of the fourth Fire Lab at Missoula Experiment (FLAME-4), Atmos. Chem. Phys., 14, 9727–9754, https://doi.org/10.5194/acp-14-9727-2014, 2014. a
Stockwell, C. E., Veres, P. R., Williams, J., and Yokelson, R. J.: Characterization of biomass burning emissions from cooking fires, peat, crop residue, and other fuels with high-resolution proton-transfer-reaction time-of-flight mass spectrometry, Atmos. Chem. Phys., 15, 845–865, https://doi.org/10.5194/acp-15-845-2015, 2015. a, b
Stockwell, C. E., Kupc, A., Witkowski, B., Talukdar, R. K., Liu, Y., Selimovic, V., Zarzana, K. J., Sekimoto, K., Warneke, C., Washenfelder, R. A., Yokelson, R. J., Middlebrook, A. M., and Roberts, J. M.: Characterization of a catalyst-based conversion technique to measure total particulate nitrogen and organic carbon and comparison to a particle mass measurement instrument, Atmos. Meas. Tech., 11, 2749–2768, https://doi.org/10.5194/amt-11-2749-2018, 2018. a
Strollo, C. M. and Ziemann, P. J.: Products and mechanism of secondary organic aerosol formation from the reaction of 3-methylfuran with OH radicals in the presence of NOx, Atmos. Environ., 77, 534–543, 2013. a, b, c, d, e
Tomaz, S., Cui, T., Chen, Y., Sexton, K. G., Roberts, J. M., Warneke, C., Yokelson, R. J., Surratt, J. D., and Turpin, B. J.: Photochemical Cloud Processing of Primary Wildfire Emissions as a Potential Source of Secondary Organic Aerosol, Environ. Sci. Technol., 52, 11027–11037, https://doi.org/10.1021/acs.est.8b03293, 2018. a
Westerling, A. L.: Warming and Earlier Spring Increase Western US Forest Wildfire Activity, Science, 313, 940–943, 2006. a
Wolfe, G. M., Marvin, M. R., Roberts, S. J., Travis, K. R., and Liao, J.: The Framework for 0-D Atmospheric Modeling (F0AM) v3.1, Geosci. Model Dev., 9, 3309–3319, https://doi.org/10.5194/gmd-9-3309-2016, 2016. a
Yee, L. D., Kautzman, K. E., Loza, C. L., Schilling, K. A., Coggon, M. M., Chhabra, P. S., Chan, M. N., Chan, A. W. H., Hersey, S. P., Crounse, J. D., Wennberg, P. O., Flagan, R. C., and Seinfeld, J. H.: Secondary organic aerosol formation from biomass burning intermediates: phenol and methoxyphenols, Atmos. Chem. Phys., 13, 8019–8043, https://doi.org/10.5194/acp-13-8019-2013, 2013. a, b, c
Yokelson, R. J., Griffith, D. W. T., and Ward, D. E.: Open-path Fourier transform infrared studies of large-scale laboratory biomass fires, J. Geophys. Res.-Atmos., 101, 21067–21080, https://doi.org/10.1029/96JD01800, 1996. a
Yokelson, R. J., Bertschi, I. T., Christian, T. J., Hobbs, P. V., Ward, D. E., and Hao, W. M.: Trace gas measurements in nascent, aged, and cloud-processed smoke from African savanna fires by airborne Fourier transform infrared spectroscopy (AFTIR), J. Geophys. Res., 108, 8478, https://doi.org/10.1029/2002JD002322, 2003. a, b
Yokelson, R. J., Crounse, J. D., DeCarlo, P. F., Karl, T., Urbanski, S., Atlas, E., Campos, T., Shinozuka, Y., Kapustin, V., Clarke, A. D., Weinheimer, A., Knapp, D. J., Montzka, D. D., Holloway, J., Weibring, P., Flocke, F., Zheng, W., Toohey, D., Wennberg, P. O., Wiedinmyer, C., Mauldin, L., Fried, A., Richter, D., Walega, J., Jimenez, J. L., Adachi, K., Buseck, P. R., Hall, S. R., and Shetter, R.: Emissions from biomass burning in the Yucatan, Atmos. Chem. Phys., 9, 5785–5812, https://doi.org/10.5194/acp-9-5785-2009, 2009. a, b
Yuan, B., Koss, A., Warneke, C., Gilman, J. B., Lerner, B. M., Stark, H., and de Gouw, J. A.: A high-resolution time-of-flight chemical ionization mass spectrometer utilizing hydronium ions (H3O+ ToF-CIMS) for measurements of volatile organic compounds in the atmosphere, Atmos. Meas. Tech., 9, 2735–2752, https://doi.org/10.5194/amt-9-2735-2016, 2016. a
Yuan, B., Koss, A. R., Warneke, C., Coggon, M., Sekimoto, K., and de Gouw, J. A.: Proton-Transfer-Reaction Mass Spectrometry: Applications in Atmospheric Sciences, Chem. Rev., 117, 13187–13229, 2017. a
Zádor, J., Turányi, T., Wirtz, K., and Pilling, M. J.: Measurement and investigation of chamber radical sources in the European Photoreactor (EUPHORE), J. Atmos. Chem., 55, 147–166, https://doi.org/10.1007/s10874-006-9033-y, 2006. a
Zarzana, K. J., Selimovic, V., Koss, A. R., Sekimoto, K., Coggon, M. M., Yuan, B., Dubé, W. P., Yokelson, R. J., Warneke, C., de Gouw, J. A., Roberts, J. M., and Brown, S. S.: Primary emissions of glyoxal and methylglyoxal from laboratory measurements of open biomass burning, Atmos. Chem. Phys., 18, 15451–15470, https://doi.org/10.5194/acp-18-15451-2018, 2018. a
Zhao, X. and Wang, L.: Atmospheric Oxidation Mechanism of Furfural Initiated by Hydroxyl Radicals, J. Phys. Chem. A., 121, 3247–3253, 2017. a, b, c, d, e, f, g, h, i, j