the Creative Commons Attribution 4.0 License.
the Creative Commons Attribution 4.0 License.
 | 02 Dec 2019
Sun photometer retrievals of Saharan dust properties over Barbados during SALTRACE
Benjamín Torres
Cristian Velasco-Merino
Dietrich Althausen
Silke Groß
Matthias Wiegner
Bernadett Weinzierl
Josef Gasteiger
Albert Ansmann
Ramiro González
David Mateos
David Farrel
Thomas Müller
Moritz Haarig
Victoria E. Cachorro
The Saharan Aerosol Long-Range Transport and Aerosol–Cloud-Interaction Experiment (SALTRACE) was devoted to the investigation of Saharan dust properties over the Caribbean. The campaign took place in June–July 2013. A wide set of ground-based and airborne aerosol instrumentation was deployed at the island of Barbados for a comprehensive experiment. Several sun photometers performed measurements during this campaign: two AERONET (Aerosol Robotic Network) Cimel sun photometers and the Sun and Sky Automatic Radiometer (SSARA). The sun photometers were co-located with the ground-based multi-wavelength lidars BERTHA (Backscatter Extinction lidar Ratio Temperature Humidity profiling Apparatus) and POLIS (Portable Lidar System). Aerosol properties derived from direct sun and sky radiance observations are analyzed, and a comparison with the co-located lidar and in situ data is provided. The time series of aerosol optical depth (AOD) allows identifying successive dust events with short periods in between in which the marine background conditions were observed. The moderate aerosol optical depth in the range of 0.3 to 0.6 was found during the dust periods. The sun photometer infrared channel at the 1640 nm wavelength was used in the retrieval to investigate possible improvements to aerosol size retrievals, and it was expected to have a larger sensitivity to coarse particles. The comparison between column (aerosol optical depth) and surface (dust concentration) data demonstrates the connection between the Saharan Air Layer and the boundary layer in the Caribbean region, as is shown by the synchronized detection of the successive dust events in both datasets. However the differences of size distributions derived from sun photometer data and in situ observations reveal the difficulties in carrying out a column closure study.


Mineral dust is a major contributor to natural aerosol particles. The Sahara is the main source of natural dust in the Northern Hemisphere (Goudie and Middleton, 2001). Mineral dust has important effects on climate due to its interaction with solar radiation (Liao and Seinfeld, 1998) and its contribution to modifying cloud properties and processes (Tang et al., 2016). It is widely known that dust originating in the Sahara is transported across the Atlantic Ocean to the Caribbean (Prospero and Carlson, 1972; Prospero, 1999). Thus, Saharan dust affects vast areas although the modification of properties and effects along this transport over the Atlantic Ocean are still not well understood.
Understanding all the complex phenomena taking place in the Saharan Air Layer (Carlson and Prospero, 1972) can only be achieved with a combination of long-term observations of key variables using ground-based, airborne and satellite techniques and comprehensive field experiments that include state-of-the-art instrumentation and a synergistic analysis including the necessary link to the modeling efforts (Tegen, 2003; Heinold et al., 2011; Gasteiger et al., 2017). A list of field experiments undertaken in the last decade aiming at the characterization of mineral dust is provided by Weinzierl et al. (2017).
Sun photometer observations within the Aerosol Robotic Network (AERONET; Holben et al., 1998) provide long-term observation of atmospheric aerosol at a global scale. In the Caribbean, AERONET observations have been carried out since 1996 in Barbados. A number of sites have been incorporated into the program in the last decade. A list of sites and available measurements is provided by Velasco-Merino et al. (2018) as well as on the AERONET website. Furthermore, ground-based in situ observations of Saharan dust have been carried out in Barbados over the last 50 years. The Barbados dust record (Prospero et al., 2014) started in 1965 and is the longest-running record of ground-based dust measurements. Both AERONET data and ground-based dust concentrations allow us to evaluate the SALTRACE (Saharan Aerosol Long-Range Transport and Aerosol–Cloud-Interaction Experiment) data in a long-term context. These data indicate that dust conditions during the SALTRACE observation period in summer 2013 were “typical” (Weinzierl et al., 2017).
SALTRACE (Weinzierl et al., 2017) took place in Barbados in 2013–2014. The first observation period of SALTRACE was conducted in the Caribbean region in June–July 2013. Two other observation periods were carried out in spring and summer 2014. The aim of this experiment was to collect a wide range of ground-based and airborne-based measurements of long-range transported Saharan dust in order to provide a unique dataset comprising in situ and remote-sensing-derived aerosol and cloud variables. These data will allow for an analysis determining to what extent aged mineral dust changes its properties during transport and what role these particles play in cloud processes in the Caribbean area.
This experiment is closely connected with the Saharan Mineral Dust Experiment (SAMUM; Heintzenberg, 2009; Ansmann et al., 2011) that was carried out in the vicinity of the Sahara and at the beginning of the long-range transport over the Atlantic, in the Cabo Verde islands. In fact most of the instrumentation (ground-based and airborne) was consecutively deployed in Morocco (SAMUM-1), Cabo Verde (SAMUM-2) and finally Barbados (SALTRACE). During this time, instruments and retrievals have been continuously improved in order to reduce experimental uncertainties and provide the best possible data. Some examples of these efforts in the field of remote sensing are the use of complex shapes in the modeling of particles and inversion of lidar data (Gasteiger et al., 2011) or the improvements in polarization measurements from lidar, with the development of enhanced calibration schemes (Freudenthaler et al., 2009; Freudenthaler, 2016), enhanced instrumentation and extended spectral range (Gasteiger and Freudenthaler, 2014; Groß et al., 2015; Haarig et al., 2017). The AERONET Version 3 processing algorithm (Giles et al., 2019) is another example as it provides enhanced retrieval of basic properties, like the aerosol optical depth (AOD) as well as advanced characterization of aerosol optical properties. At the same time, it improves the cloud screening and quality control algorithms.
The aim of this paper is to analyze the sun photometer observations carried out during SALTRACE and relate them to the co-located aerosol measurements. Section 2 describes the measurement sites and instrumentation involved in this study. Then the methodology is briefly described in Sect. 3, and the results are presented in Sect. 4, including aerosol optical depth, inversion products and a comparison with in situ observations.
The measurements presented in this paper were collected at two sites, both located in Barbados. The first one was set at the headquarters of the Caribbean Institute for Meteorology and Hydrology (CIMH), in the western part of Barbados (13∘8′55′′ N, 59∘37′29′′ W; 110 m a.s.l.). The AERONET measurements in this location can be found under the site name “Barbados SALTRACE”. The CIMH was a supersite for SALTRACE. This site contains several remote-sensing instruments such as two AERONET sun photometers, the SSARA (Sun and Sky Automatic Radiometer) sun–sky radiometer (Toledano et al., 2009), and the lidar systems POLIS (Portable Lidar System) (Groß et al., 2015, 2016) and BERTHA (Backscatter Extinction lidar Ratio Temperature Humidity profiling Apparatus) (Haarig et al., 2017), together with ancillary data from meteorological radiosondes and a handheld Microtops for ozone measurements. CIMH is located on a small hill, 1.5 km away from the coast, in the vicinity of the city of Bridgetown, with about 100 thousand inhabitants.
The second site was located in Ragged Point (13∘9′54′′ N, 59∘25′56′′ W; 40 m a.s.l.), on the eastern coast of Barbados and 25 km away from CIMH. At Ragged Point in situ instrumentation was deployed in a measurement tower, including samplers and optical instrumentation for the derivation of dust optical, chemical and micro-physical properties at ground level (Kristensen et al., 2016; Kandler et al., 2018). This is the regular measurement site of the 50-year Barbados dust record mentioned above. Given the privileged location of Barbados as the easternmost island of the Caribbean, it makes it possible to measure undisturbed African dust after its long-range transport over the Atlantic. An AERONET sun photometer is also operated on a continuous basis at Ragged Point. A comprehensive list of instruments at the CIMH and Ragged Point sites during SALTRACE can be found in the supplemental material of Weinzierl et al. (2017).
Table 1Sun photometer instruments deployed at the CIMH and Ragged Point sites during SALTRACE. The instrument type, location, spectral range, observation period, owner and sampling interval of different measurement types are indicated. The abbreviations of the owners of these instruments refer to the University of Valladolid (UVa), the Leibniz Institute for Tropospheric Research (TROPOS), Ludwig-Maximilians-Universität München (LMU) and the University of Miami (U. Miami).
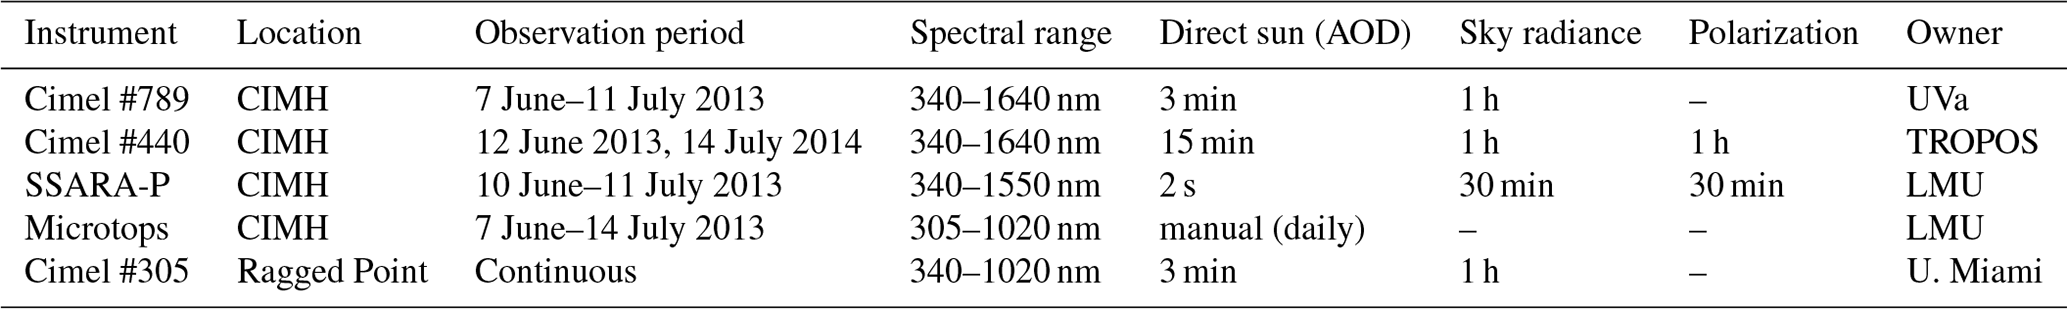
The sun photometers had different features and were operated at different configurations in order to cover as many aspects as possible. Two AERONET Cimel sun photometers (Holben et al., 1998) were operated at CIMH during SALTRACE. Table 1 summarizes the spectral ranges, measurement types and frequencies performed by each sun photometer. These instruments perform direct sun observations at nine spectral channels in the range 340–1640 nm plus sky radiance in six channels (440, 500, 675, 870, 1020 and 1640 nm) in the principal plane and almucantar geometries. In order to optimize the observations, one of the Cimel sun photometers was set to make high-frequency (3 min sampling) measurements for aerosol optical depth observations; and the other one, equipped with polarization capabilities, was focused on the measurement of sky radiances, especially sky polarization in the principal plane geometry.
The SSARA sun–sky radiometer performs continuous direct sun observations at 12 spectral channels ranging from 340 to 1550 nm. Sky radiances in the solar almucantar and principal plane geometries are measured every 30 min at 440, 780 and 1020 nm. For this campaign new polarization capabilities were added to SSARA (therefore renamed “SSARA-P”) in order to derive the degree of linear polarization (DOLP) of the sky light at the 500 nm wavelength.
The ground-based in situ aerosol measurements included in the present study were carried out at the Ragged Point site. The ambient aerosol was sampled through a PM10 inlet located at the top of a 17 m high tower, ca. 50 m a.s.l. The particle number size distributions were measured every 14 min with an Aerodynamic Particle Sizer (APS-3321, TSI) covering the size range 0.5–10 µm, and a mobility particle size spectrometer (MPSS, TROPOS-REF-3) measuring the size range 0.01–0.8 µm was used (Kristensen et al., 2016). As for the lidar instrumentation, POLIS is a six-channel lidar system measuring Raman (387 and 607 nm) and elastic (355 and 532 nm, cross- and parallel-polarized) backscattered signals for aerosol property profiling (Groß et al., 2015). BERTHA is a multi-wavelength polarization and Raman lidar upgraded for this campaign with new channels to allow for the observations of dust linear depolarization ratios at 355, 532 and 1064 nm (Haarig et al., 2017). For further information concerning the lidar and in situ data used in this study, we refer the reader to the corresponding publications in the special issue (Groß et al., 2015, 2016; Kristensen et al., 2016; Haarig et al., 2017, ; see a complete list at https://www.atmos-chem-phys.net/special_issue382.html) as well as previous studies using this instrumentation (Wiegner et al., 2011; Tesche et al., 2011; Müller et al., 2011; Schladitz et al., 2011).
All sun photometer observations were made following the AERONET protocols, i.e., high-frequency (see Table 1) direct sun observations to derive spectral aerosol optical depth and sky radiance measurements every hour in the almucantar and principal plane geometries.
All Cimel instruments involved in the campaign were calibrated following AERONET procedures (Holben et al., 1998); therefore the AOD absolute uncertainty is 0.01–0.02 (larger for shorter wavelengths), and the sky radiance uncertainty is 5 %. Similar uncertainty is found for SSARA-P (Toledano et al., 2011). Its direct sun channels for AOD were calibrated with the Langley plot method at the Environmental Research Station Schneefernerhaus (2650 m a.s.l. at the Zugspitze, Germany); radiance and polarization channels were calibrated at the University of Lille (accessed thanks to the ACTRIS-2 project; Aerosol, Clouds and Trace Gases Research Infrastructure) using the AERONET-Europe reference integrating sphere and polarization box (Li et al., 2018).
The data processing is also standardized. For aerosol optical depth we have used cloud-screened and quality-assured (level 2.0) data from AERONET Version 2 database. However the differences in AOD with the newer Version 3 (Giles et al., 2019) are minor (below 0.003 in all wavelength channels for any measurement). The use of the Version 2 AOD is chosen for a better comparison with the previous sun photometer results of the SAMUM campaigns (Toledano et al., 2009, 2011).
For the inversion of the sky radiances, we have self applied the inversion code by Dubovik et al. (2006) to both the almucantar and principal plane geometries using the four spectral channels that are used in the operational AERONET processing, i.e., 440, 675, 870 and 1020 nm wavelengths. We also performed alternative processing by adding the observations at the 500 and 1640 nm wavelengths, therefore enlarging the observation spectral range in the shortwave infrared. The differences provided by this enhanced retrieval will be shown in Sect. 4.2. Neither the principal plane retrievals nor the six-wavelength retrievals are available in the AERONET database.
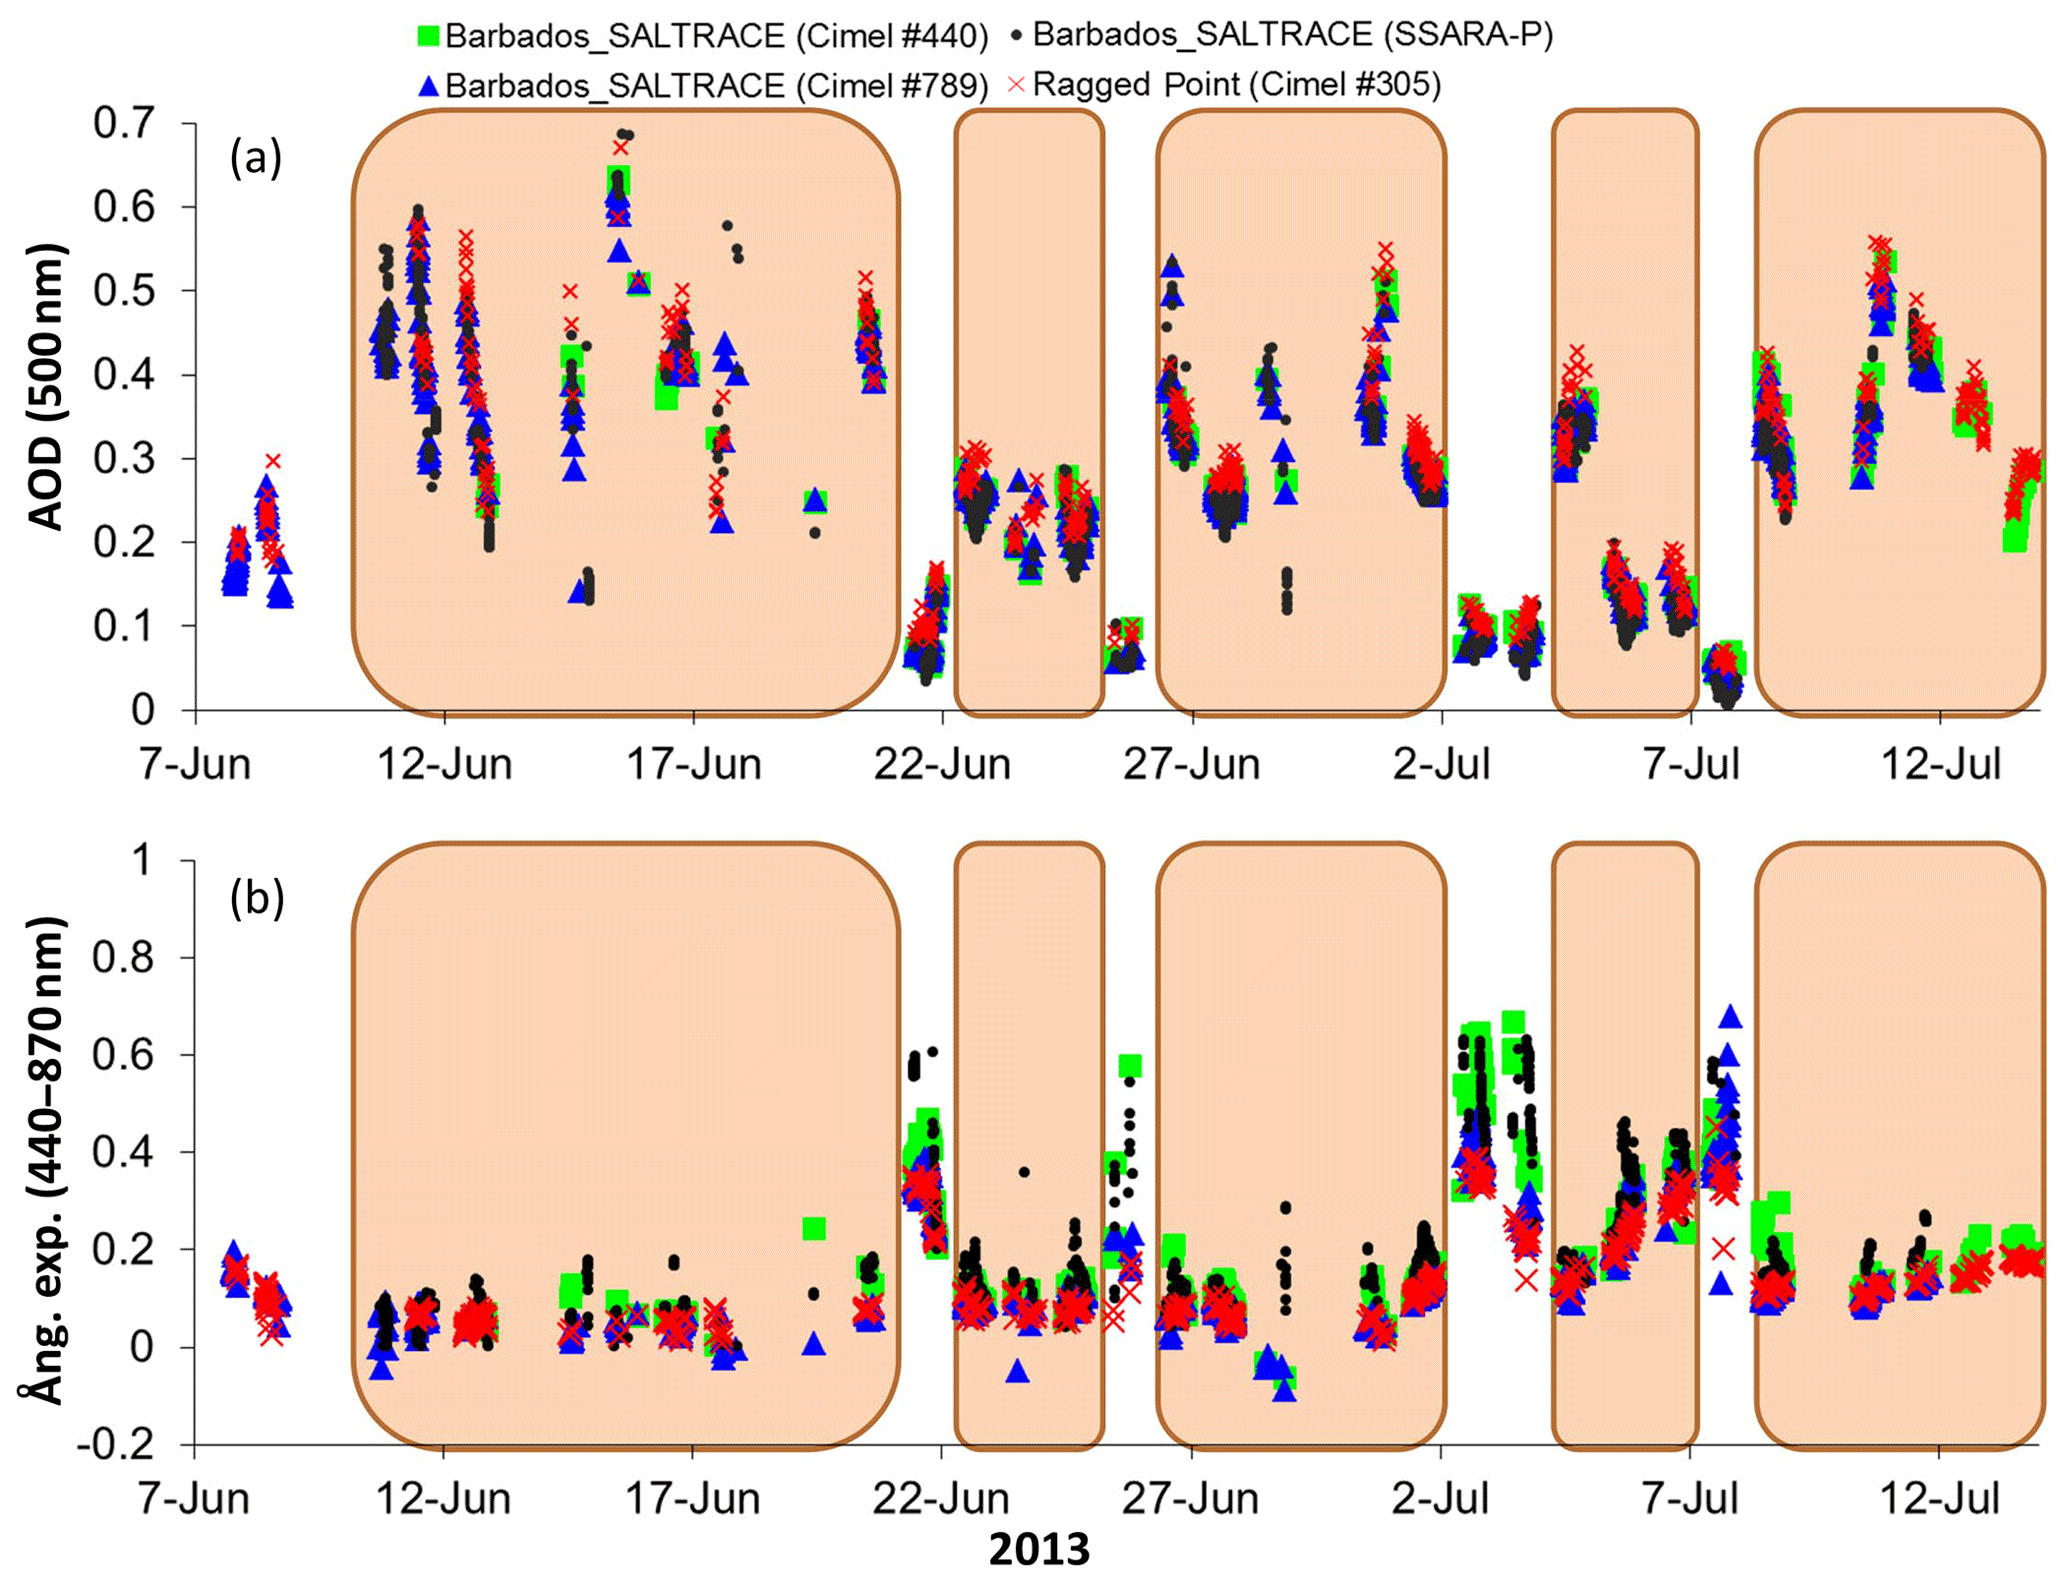
Figure 1Aerosol optical depth (a) and Ångström exponent (b) observations during the SALTRACE campaign with all available sun photometers: Cimel #789, Cimel #440 and SSARA-P at the CIMH site and Cimel #389 at the Ragged Point site. See the text and Table 1 for details.
In the AERONET operational products, only retrievals with an AOD (440 nm) of >0.4 can be considered “quality assured”. In our case, we have applied a set of quality criteria to ensure the reliability of our inversion data, which basically are the same conditions of AERONET level 2.0 inversions except for the AOD threshold, i.e., a solar zenith angle of >50∘, a minimum number of symmetrical angles and a retrieval error between 5 % and 8 % depending on the AOD. We also impose an AOD (440 nm) of >0.2 for the single-scattering albedo and complex refractive index (Dubovik et al., 2006; Mallet et al., 2013; Mateos et al., 2014; Burgos et al., 2016; Velasco-Merino et al., 2018). This threshold of AOD (440 nm)>0.2 results in an estimated uncertainty of 0.03 for the single-scattering albedo, 0.04 for the real part of the refractive index, 50 % for the imaginary part and 35 % for the volume size distributions (Dubovik et al., 2000).
Due to the frequent presence of cumulus clouds in this area, the cloud screening procedure and the inversion of sky radiances have been carefully checked. Besides the AERONET cloud screening (Smirnov et al., 2000a; Giles et al., 2019), we added manual inspection to the dataset to avoid any cloud contamination. The principal plane radiances cannot be easily screened out for clouds due to the lack of symmetry between branches (as is the case for the almucantar). Therefore they were manually inspected after a selection of cases in which both the nearby AOD and almucantar observations were cloud free.
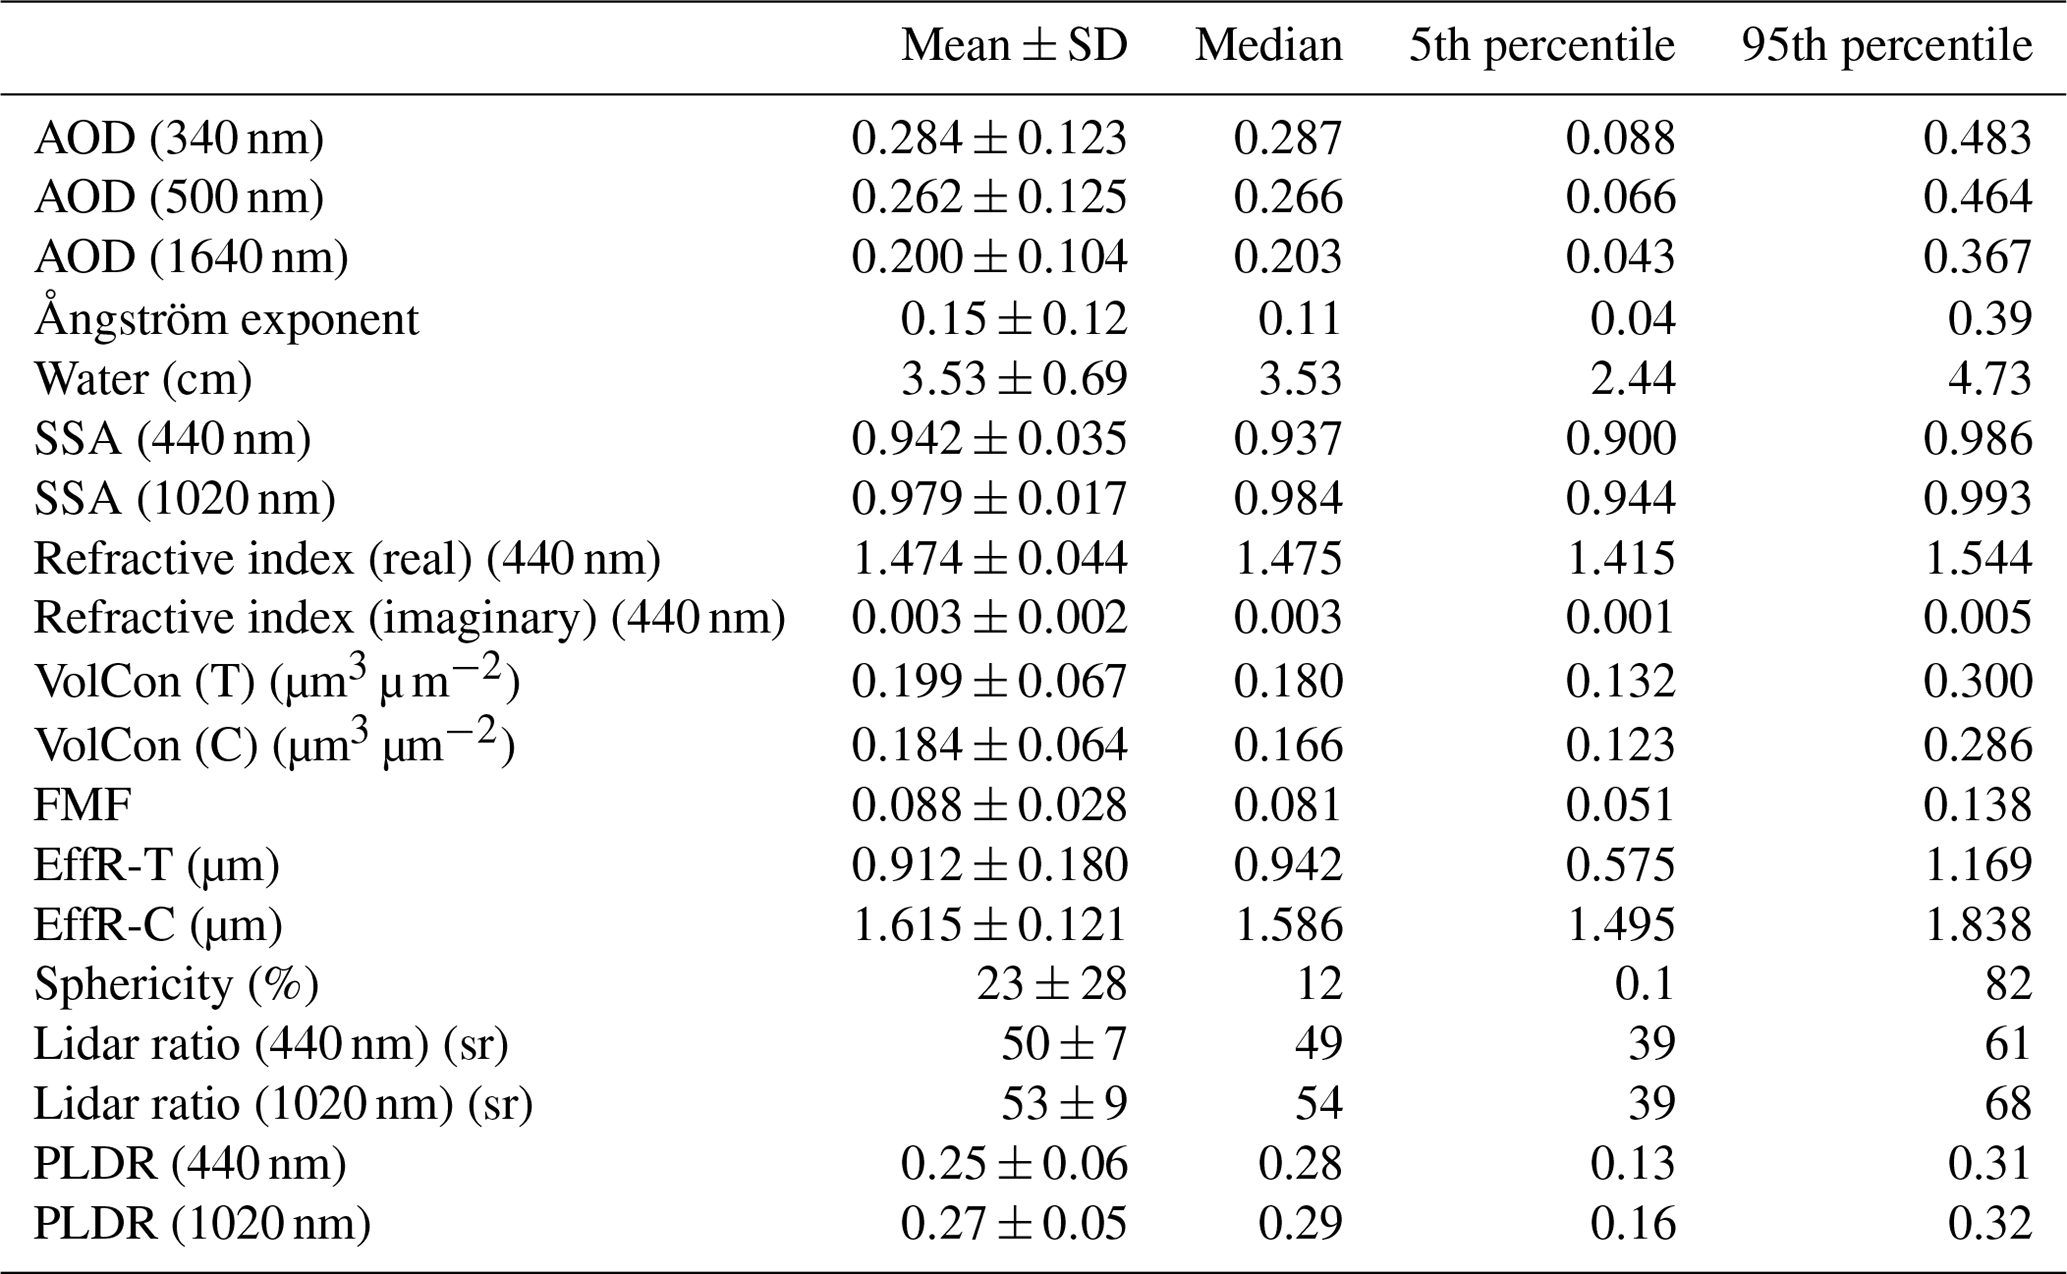
Table 2Statistics of sun photometer observations during the SALTRACE campaign during the dust episodes: aerosol optical depth (AOD), the Ångström exponent (AE), precipitable water, single-scattering albedo (SSA), the real and imaginary parts of the refractive index, volume concentrations (VolCon) of the total size distribution (T) and the coarse mode (C), fine-mode fraction (FMF) of the size distribution, the effective radius (EffR) of the total size distribution and the coarse mode, the fraction of spherical particles, the lidar ratio, and the particle linear depolarization ratio (PLDR).
4.1 Aerosol optical depth
The aerosol optical depth during the campaign period is shown in Fig. 1a. The number of measurement days was 30, with a total number of 940 cloud-free direct sun observations. The AOD measurements monitor the aerosol content in the atmospheric column. The shaded areas in the figure indicate the five successive dust events that were detected during the SALTRACE experiment in Barbados, with a moderate AOD (500 nm) up to 0.6. The mean AOD values for the events ranged between 0.22 and 0.42. Dramatic changes can be observed depending on the dust advection (e.g., 12 June). There were also short interruptions in which the marine background aerosol was measured. This general sequence of aerosol events was also identified with atmospheric profiling techniques (Groß et al., 2015; Haarig et al., 2017) as well as the in situ dust concentration at the ground (Weinzierl et al., 2017; Kandler et al., 2018). No significant differences are found between the “Barbados_Saltrace” and “Ragged_Point” sites, which is an important result for all comparisons that can be made among in situ and remote-sensing instruments located in these two sites. Moreover, all instruments co-located at CIMH agree within the nominal AOD uncertainty level (0.02) for simultaneous measurements. Some minor differences between SSARA and the AERONET Cimel instruments are to be expected on cloudy days (e.g., 17 and 28 June). This is due to the different data sampling of the instruments (“triplets” or three measurements within 1 min for the Cimel instruments; 2 s sampling for the SSARA) that may produce non-simultaneous data as well as different results in the cloud-screening process.
The Ångström exponent (AE) depicted in Fig. 1b shows low values during the dust-dominated days in the range 0–0.2, as can be expected for the coarse-dominated mineral aerosol. Even slightly negative AE is observed in some cases. Somewhat higher AE values are observed during the clean (marine-dominated) days. It is also clear from the plot that the agreement among instruments is worse in these pristine days, but this result is to be expected because the uncertainty in AE dramatically increases when the AOD is low (Cachorro et al., 2008).
In order to provide the properties of Saharan dust after the transit over the Atlantic, we need to identify the dust-dominated days from the observation period. Given that the Ångström exponent remains low, we simply selected AOD (500 nm) of >0.15 to separate dust and marine aerosol observations, following the criterion provided by Smirnov et al. (2002) to identify pure marine aerosol. The uppermost rows of Table 2 show the statistics for the AOD and AE during the dust-dominated days of the campaign.
The long deployment of Cimel #440 for more than 1 year at CIMH (Barbados_Saltrace) allows for the establishing of marine aerosol background for each month. For its determination, we used the 1st percentile of the AOD within each month (instead of the minimum value). For June and July this is 0.04 for the AOD (500 nm). Outside these months, the background was even lower, about 0.02–0.03 for AOD (500 nm). This is the kind of atmospheric situation that we observed for very short periods during SALTRACE, as shown in Fig. 1a. This background marine aerosol always contributes to the aerosol optical depth observed in the atmospheric column.
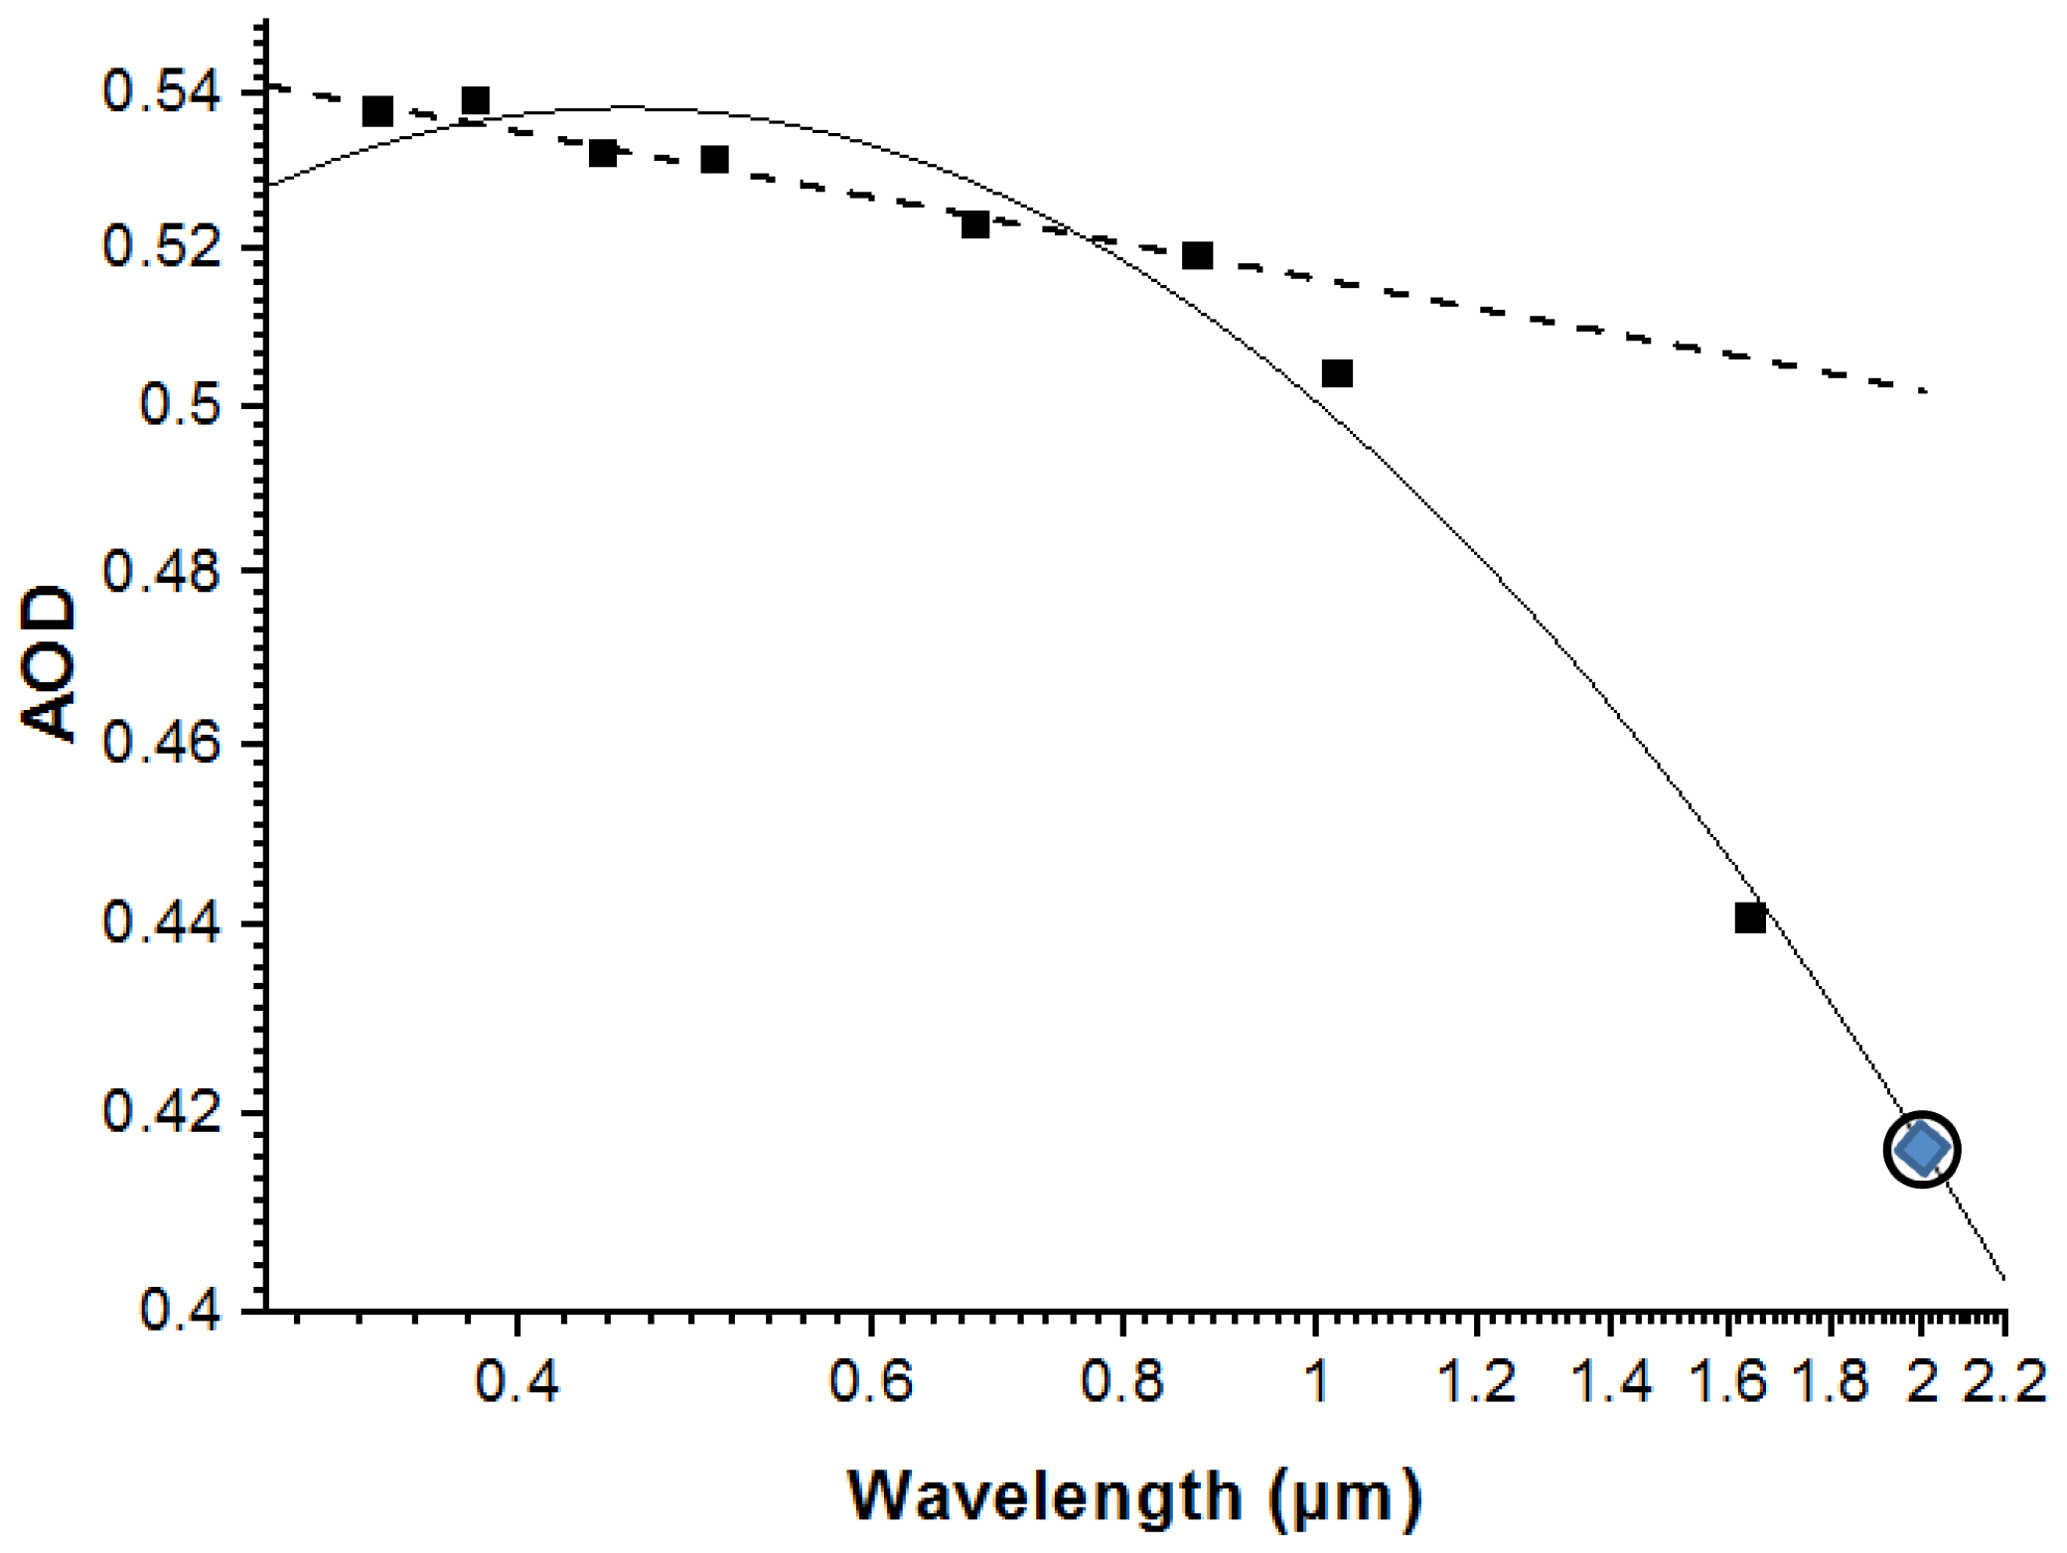
Figure 2Aerosol optical depth as a function of wavelength in a log–log scale for 11 June 2013 at 11:12 UTC. Solid line indicates the 2nd-order fit over the rage 340–1640 nm, whereas the dashed line indicates the 1st-order fit over the range 440–870 nm, corresponding to the Ångström formula (Ångström, 1961). The extrapolated value of AOD at the 2 µm wavelength using the 2nd-order fit is indicated with a circle.
In previous works it was shown that the wavelength dependence of the aerosol optical depth does not follow the Ångström power law, especially in the shortwave infrared for mineral dust aerosol (Toledano et al., 2011). An example of this feature for SALTRACE data is provided in Fig. 2. As can be seen in the plot, the classical fit of spectral AOD to the Ångström formula (Ångström, 1961) over the visible range (440–870 nm) would largely overestimate the observed AOD at the 1640 nm wavelength. A 2nd-order fit in logarithmic space is needed to properly capture the spectral variation of AOD in the shortwave infrared. This approach has been applied to the AOD data in order to provide the AOD at the 2 µm wavelength. This extrapolated AOD (2.022 µm) was needed for the calibration of the wind lidar operated during SALTRACE on board the Falcon research aircraft. Thanks to this correction and the co-located POLIS, it was possible to provide aerosol backscatter profiles from the wind lidar (Chouza et al., 2015). Moreover, the consistency between the AOD from the sun photometer and the POLIS extinction profiles was demonstrated by Groß et al. (2015).
For the aerosol type identification, we have used the scatter plot of the Ångström exponent vs. aerosol optical depth (500 nm), shown in Fig. 3. The increasing AOD and decreasing AE pattern for mineral dust is confirmed by SALTRACE data, in a similar way to the SAMUM campaigns also shown in the plot. We also indicate the threshold (AOD =0.15) for separation between marine and dust aerosol predominance for SALTRACE data. The plot indicates that only marine and dust aerosols were present during SALTRACE, with no significant contribution of fine particles, as it was the case during SAMUM-2 in the winter season, resulting in a larger AE for fine- and coarse-particle mixtures. The AE of dust seems to be lower in SAMUM-2 (Cabo Verde) and SALTRACE (Barbados) than it was very near the sources in SAMUM-1 (Morocco), which is an unexpected result. The reason could be the different background aerosol. High AE values above 1.0 for a low AOD during SAMUM-1 could indicate the presence of fine particles (continental background or anthropogenic pollution) that would result in a higher AE than expected for pure dust. Conversely the background aerosol in the island sites is mainly composed of coarse marine particles with an associated low AE.

Figure 3Scatter plot of the Ångström exponent vs. aerosol optical depth (500 nm) for SALTRACE as well as the SAMUM-1 and SAMUM-2 campaigns.
4.2 Inversion of sky radiances
The inversion of multi-angle and multi-wavelength diffuse sky radiances, together with spectral AOD, provides the volume particle size distribution, complex refractive index (spectral) and fraction of spherical particles (Dubovik and King, 2000; Dubovik et al., 2006). From these basic properties, a set of optical and micro-physical properties of the aerosol particles are obtained: the fine-mode fraction, effective radius, single-scattering albedo, absorption AOD, phase function and asymmetry parameter. In fact, the inversion code can provide column-integrated values for other interesting properties, like the lidar ratio, particle linear depolarization ratio, radiation fluxes or radiative forcing. During the SALTRACE observation period (30 d) a total number of 54 successful inversions were obtained. The number of data is low compared to the amount of AOD data both because of the lower measurement frequency and the difficulty in meeting the required number of cloud-free observation angles between the frequent cumulus clouds. Therefore the inversion data are extremely valuable pieces of data that provide advanced information about aerosol properties that are key for the evaluation of the aerosol radiative effect. The statistics for some of these parameters are presented in Table 2. It must be noted, however, that a certain contribution of the marine aerosol to the column aerosol properties is always present; therefore values in Table 2 correspond to a mixture of dust (pre-dominant) with some marine aerosol.
One of the above-mentioned key properties is the single-scattering albedo (SSA) and its spectral dependence. The increase of the single-scattering albedo with wavelength is a clear signature for dust (Dubovik et al., 2002). The values observed during SALTRACE are very close to those reported for pure Saharan dust near the sources (Dubovik et al., 2002; Toledano et al., 2009, 2011) and indicate that mineral dust was the predominant aerosol type. The SSA during SALTRACE and its comparison with the SAMUM campaigns is provided in Fig. 4. The average was found to be between 0.94 at 440 nm and 0.98 at 1020 nm for the SAMUM-2 and SALTRACE campaigns. The variability is also quite similar. Lower SSA values were observed for SAMUM-1, especially at 440 nm. The use of the 1640 nm wavelength in the retrieval for SALTRACE data shows a decrease in the SSA at this wavelength as compared to 1020 nm, in agreement with Müller et al. (2010b).
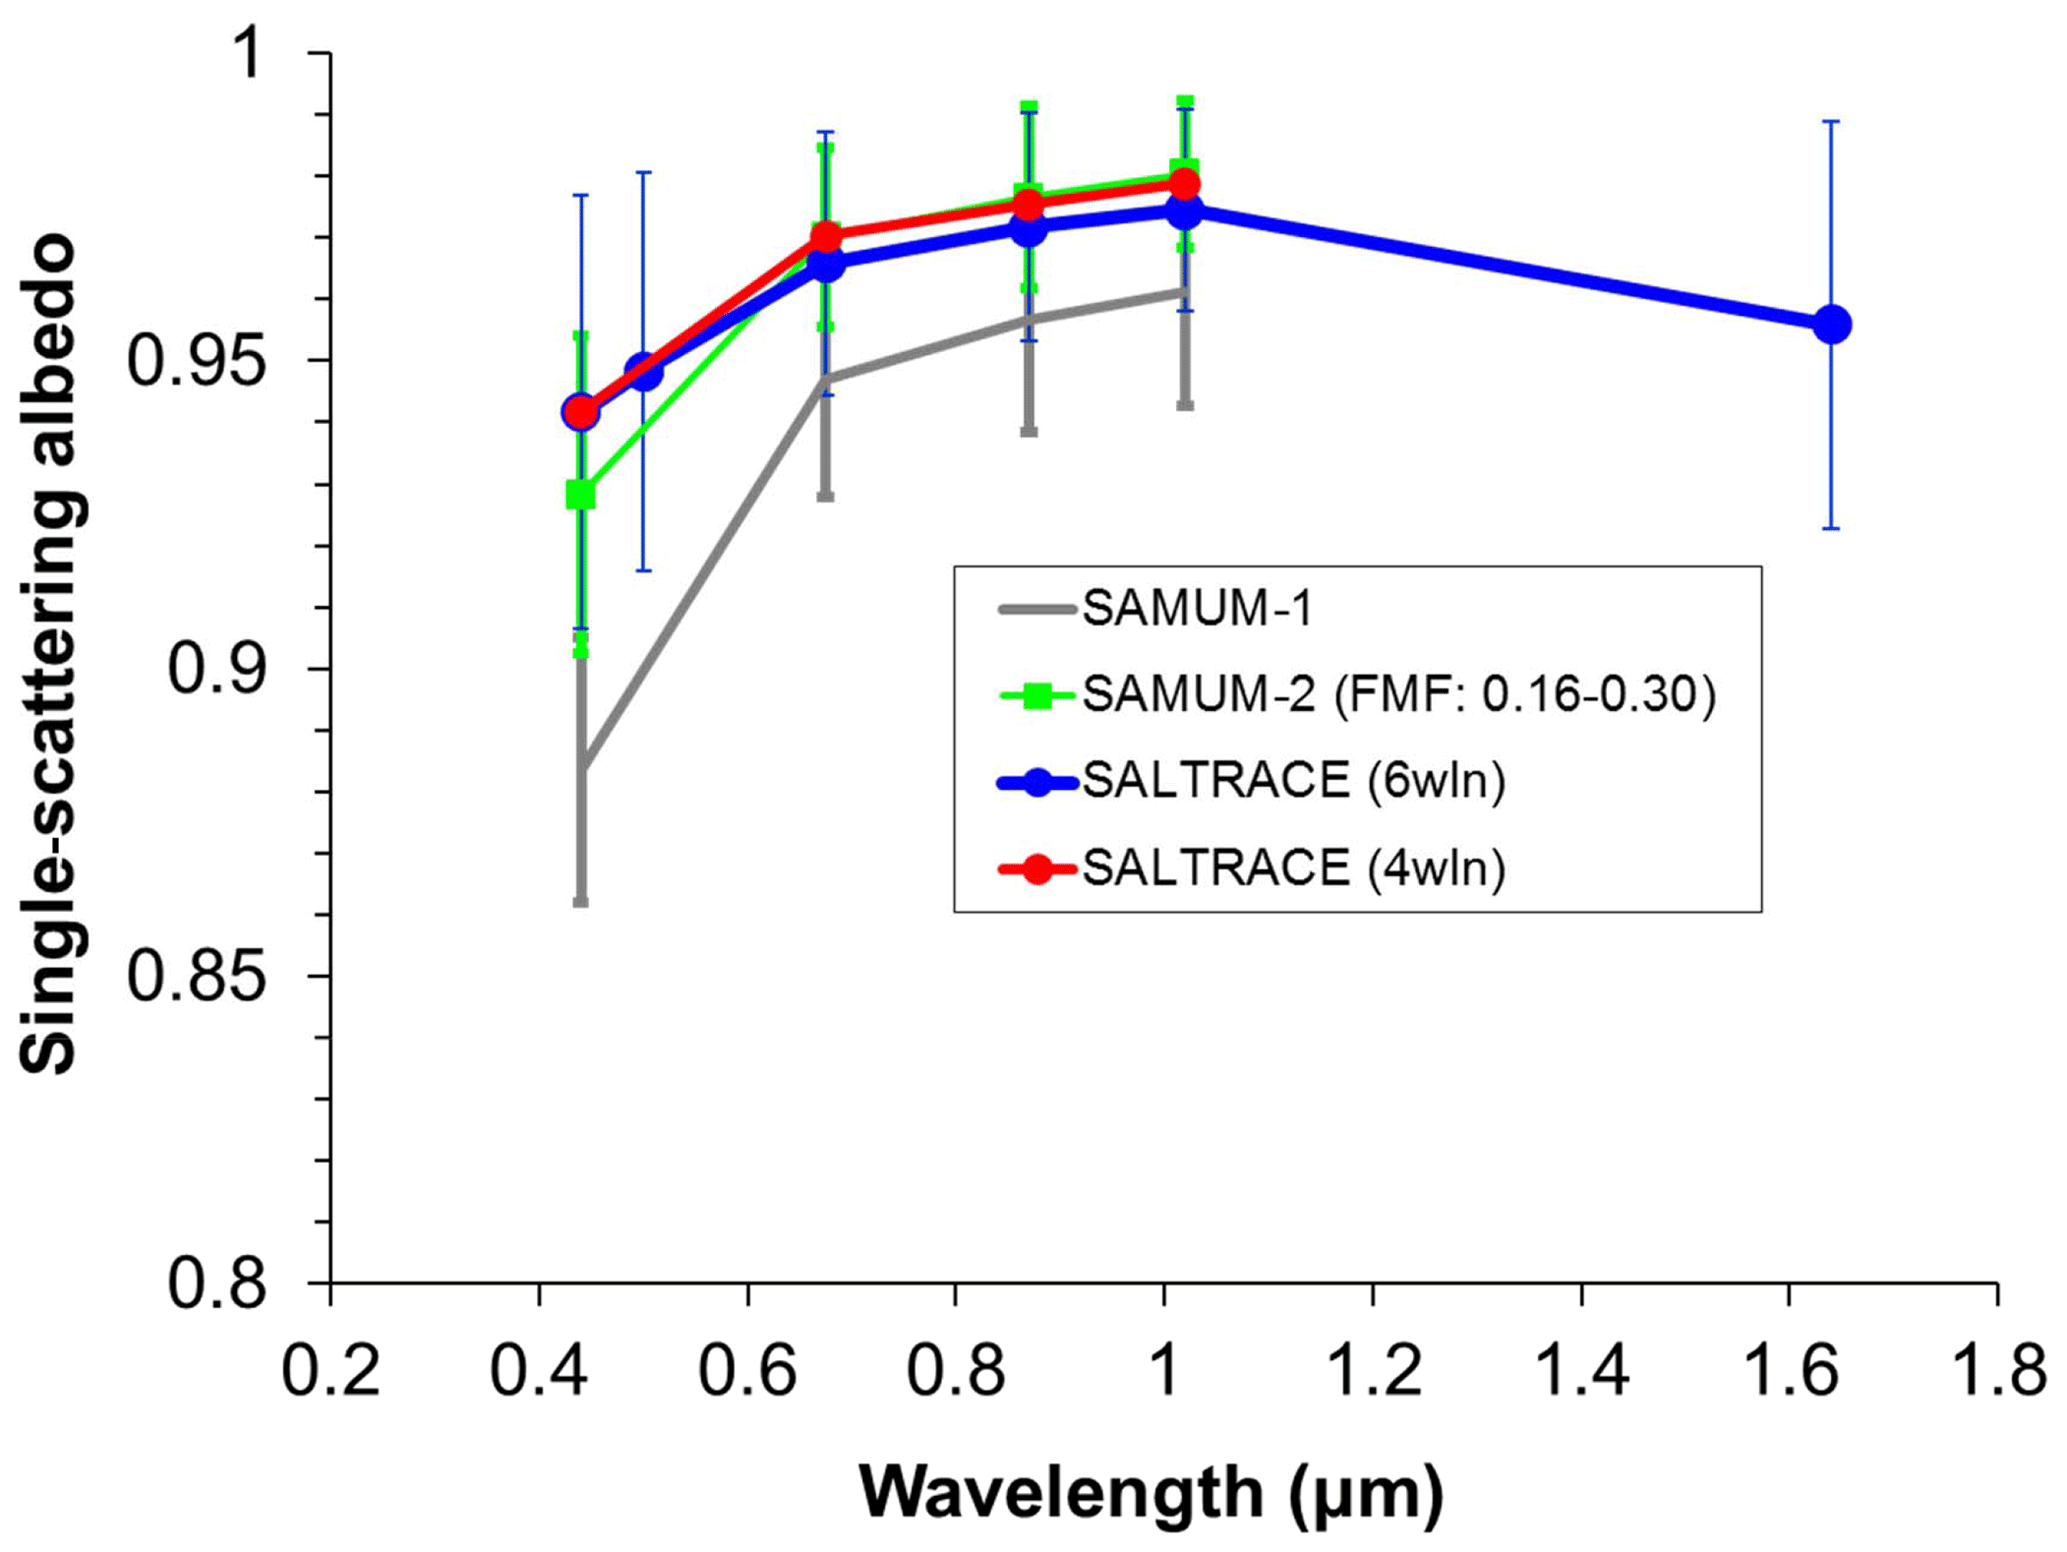
Figure 4Single-scattering albedo as a function of wavelength for SALTRACE as well as the SAMUM campaigns. Average values for dust cases in each campaign are provided. Bars indicate ±1 standard deviation. For SAMUM-2, only cases with low fine-mode fractions (FMF) between 0.16 and 0.30 are considered. For SALTRACE data, retrievals using six wavelength (6wln) and four wavelength (4wln) channels are shown.
The volume particle size distributions (dV∕dlnR) depicted in Fig. 5 provide the comparison between the SALTRACE and SAMUM campaigns for data with dust predominance. The mean size distribution for SALTRACE (dust cases) has a volume concentration of 0.2 µm3 µm−2 and a clear coarse-mode predominance: the fine-mode fraction of the volume concentrations is 0.09. The effective radii of the fine and coarse mode are 0.15 and 1.62 µm respectively. For comparison, the pure dust cases in SAMUM-2 presented the effective radii of 0.17 and 1.73 µm in the fine and coarse modes, with even more pronounced coarse-mode predominance indicated by the lower fine-mode fraction (0.06). Similarly as described by Velasco-Merino et al. (2018), the long-range transport over the Atlantic produces a decrease in volume concentrations (and AOD), but the change in the effective radii of the fine and coarse mode is within uncertainties and therefore not significant. This is in agreement with results by Gasteiger et al. (2017), who showed that the fraction of large dust particles does not change much during trans-Atlantic transport. The fraction of spherical particles was 0.11 in dust cases of SAMUM-2 and 0.12 for SALTRACE (median values). In the short periods of the marine background the size distributions of the marine aerosol were retrieved. The average value is given in Fig. 5 (dashed line). The volume concentration is clearly lower than for the dust cases. However the coarse-mode effective radius is larger for the marine particles (1.87 µm) than it is for dust. This result was also found in other coastal regions (Prats et al., 2011). In the marine cases, the total volume concentration is 0.05 µm3 µm−2, and the fraction of spherical particles is 0.90.
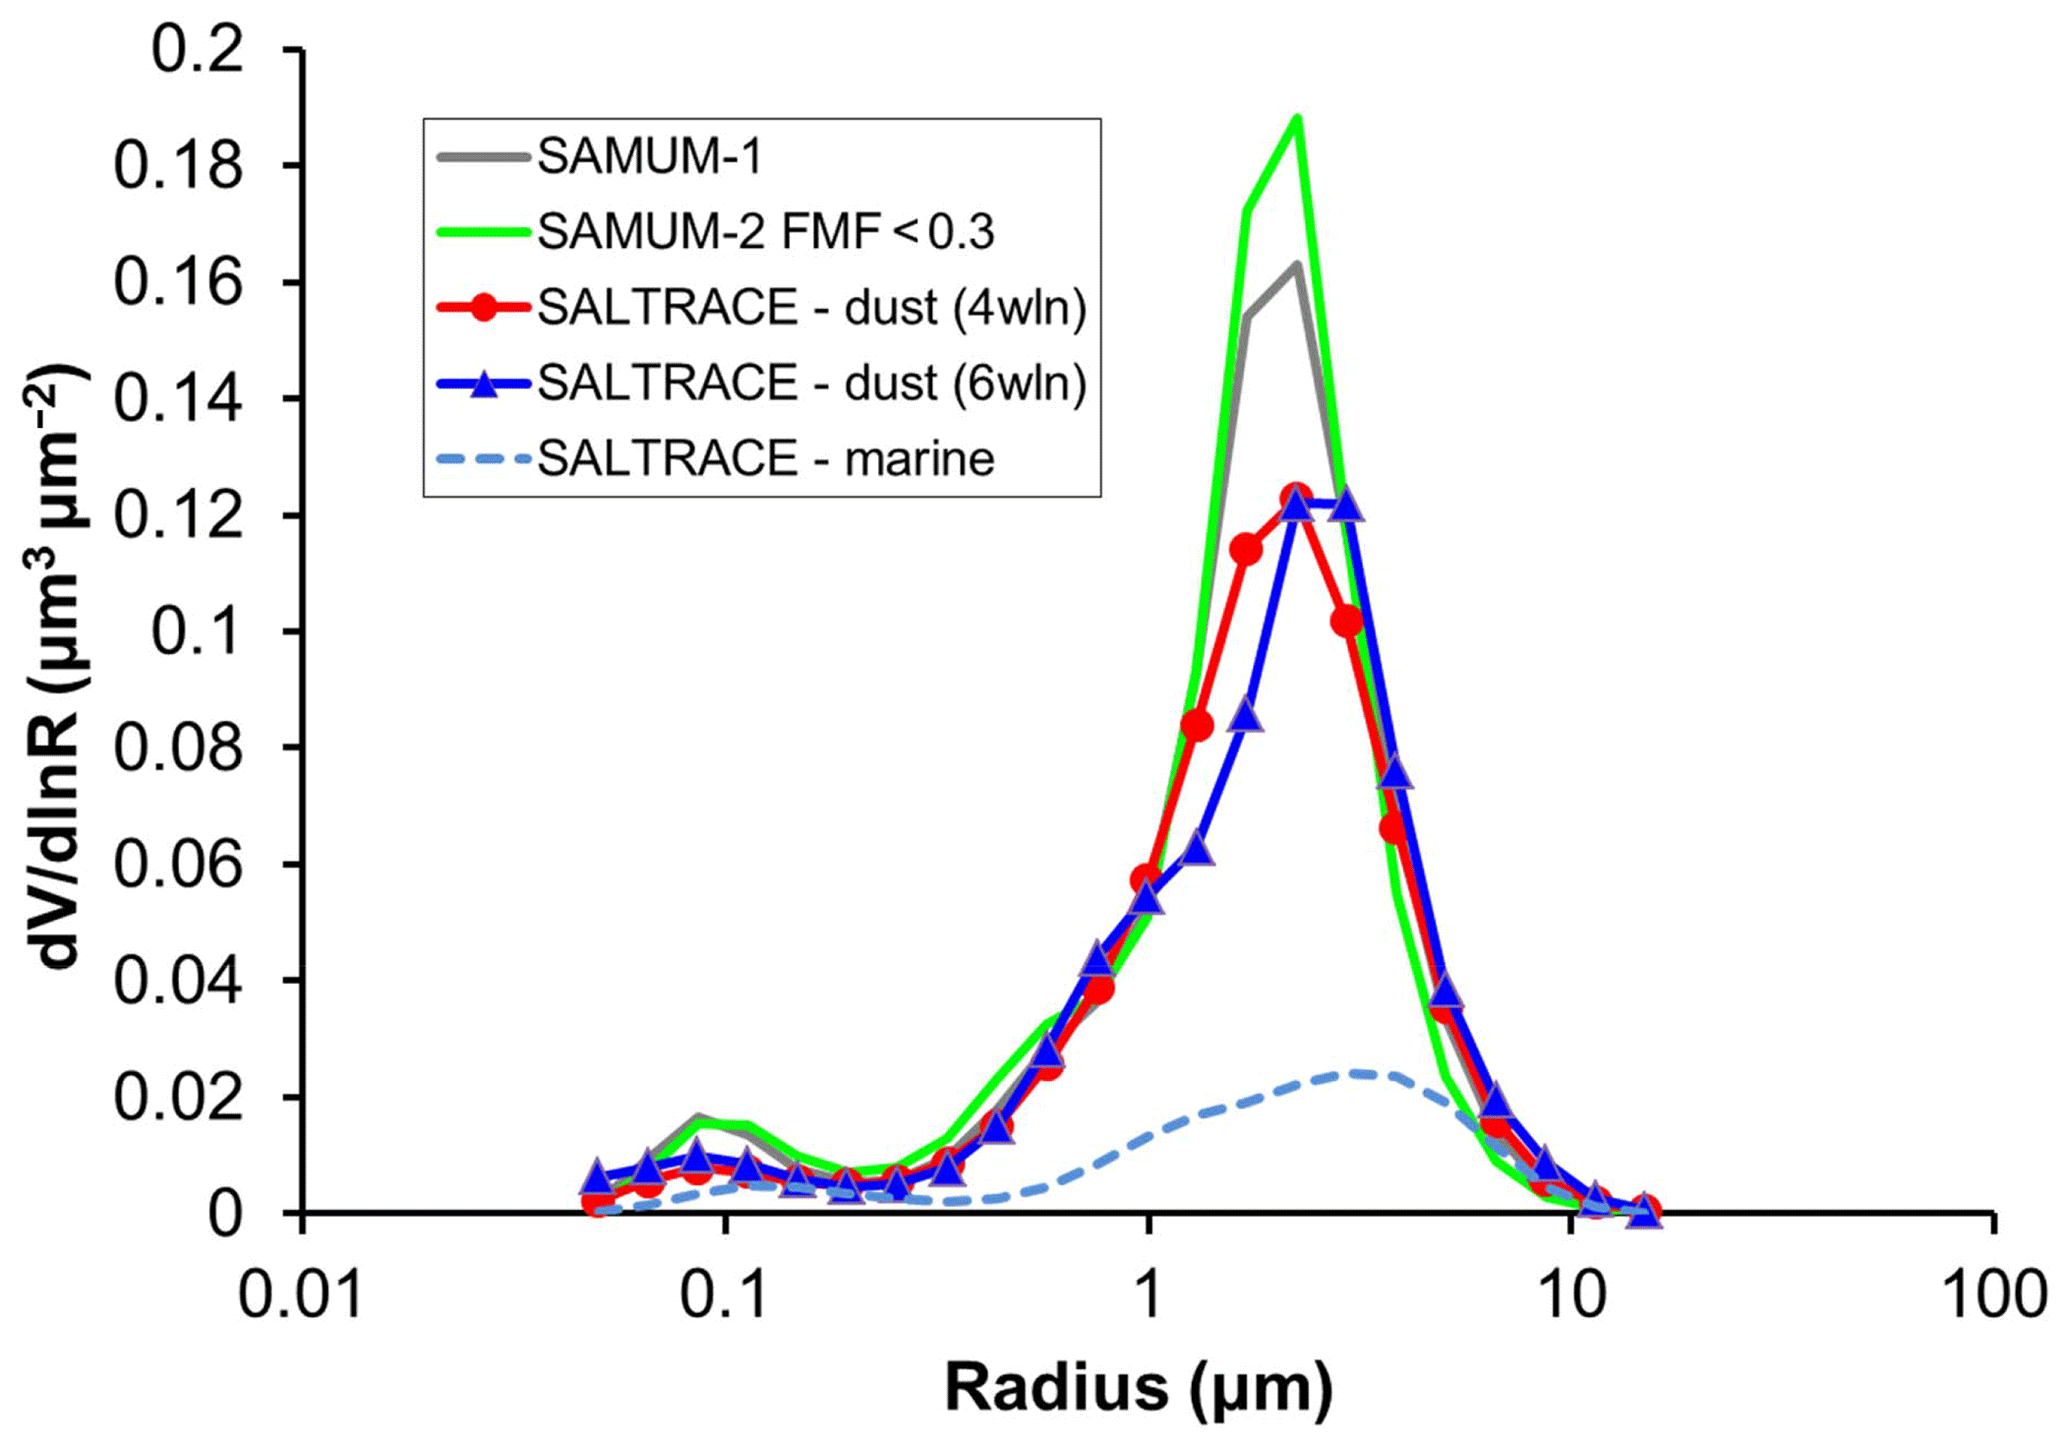
Figure 5Volume particle size distributions (dV∕dlnR) for SALTRACE as well as the SAMUM campaigns. Average values for dust cases in each campaign are provided, based on the inversion of Cimel sun photometer data. For SAMUM-2, only cases with low fine-mode fractions (FMF) between 0.16 and 0.30 are considered.
As shown in previous figures, we have also compared the inversion products using different wavelength ranges. The four-wavelength cases include 440, 675, 870 and 1020 nm wavelength measurements of the AOD and sky radiances. The six-wavelength cases include the previous four channels plus 500 and 1640 nm, therefore extending the spectral range considerably1. The single-scattering albedo (Fig. 6a), the real part of the refractive index (Fig. 6b) and the fine-mode effective radius (Fig. 6c) experience limited change if the long wavelength is added. However the coarse-mode effective radius (Fig. 6d) increases considerably if the 1640 nm is used in the inversion. This suggests larger sensitivity to coarse particles that are otherwise not considered by the inversion code. This fact is also noticeable in Fig. 5, in which the coarse mode of the six-wavelength retrieval is shifted to larger radii as compared to the four-wavelength retrieval. This is not the case for the fine mode.
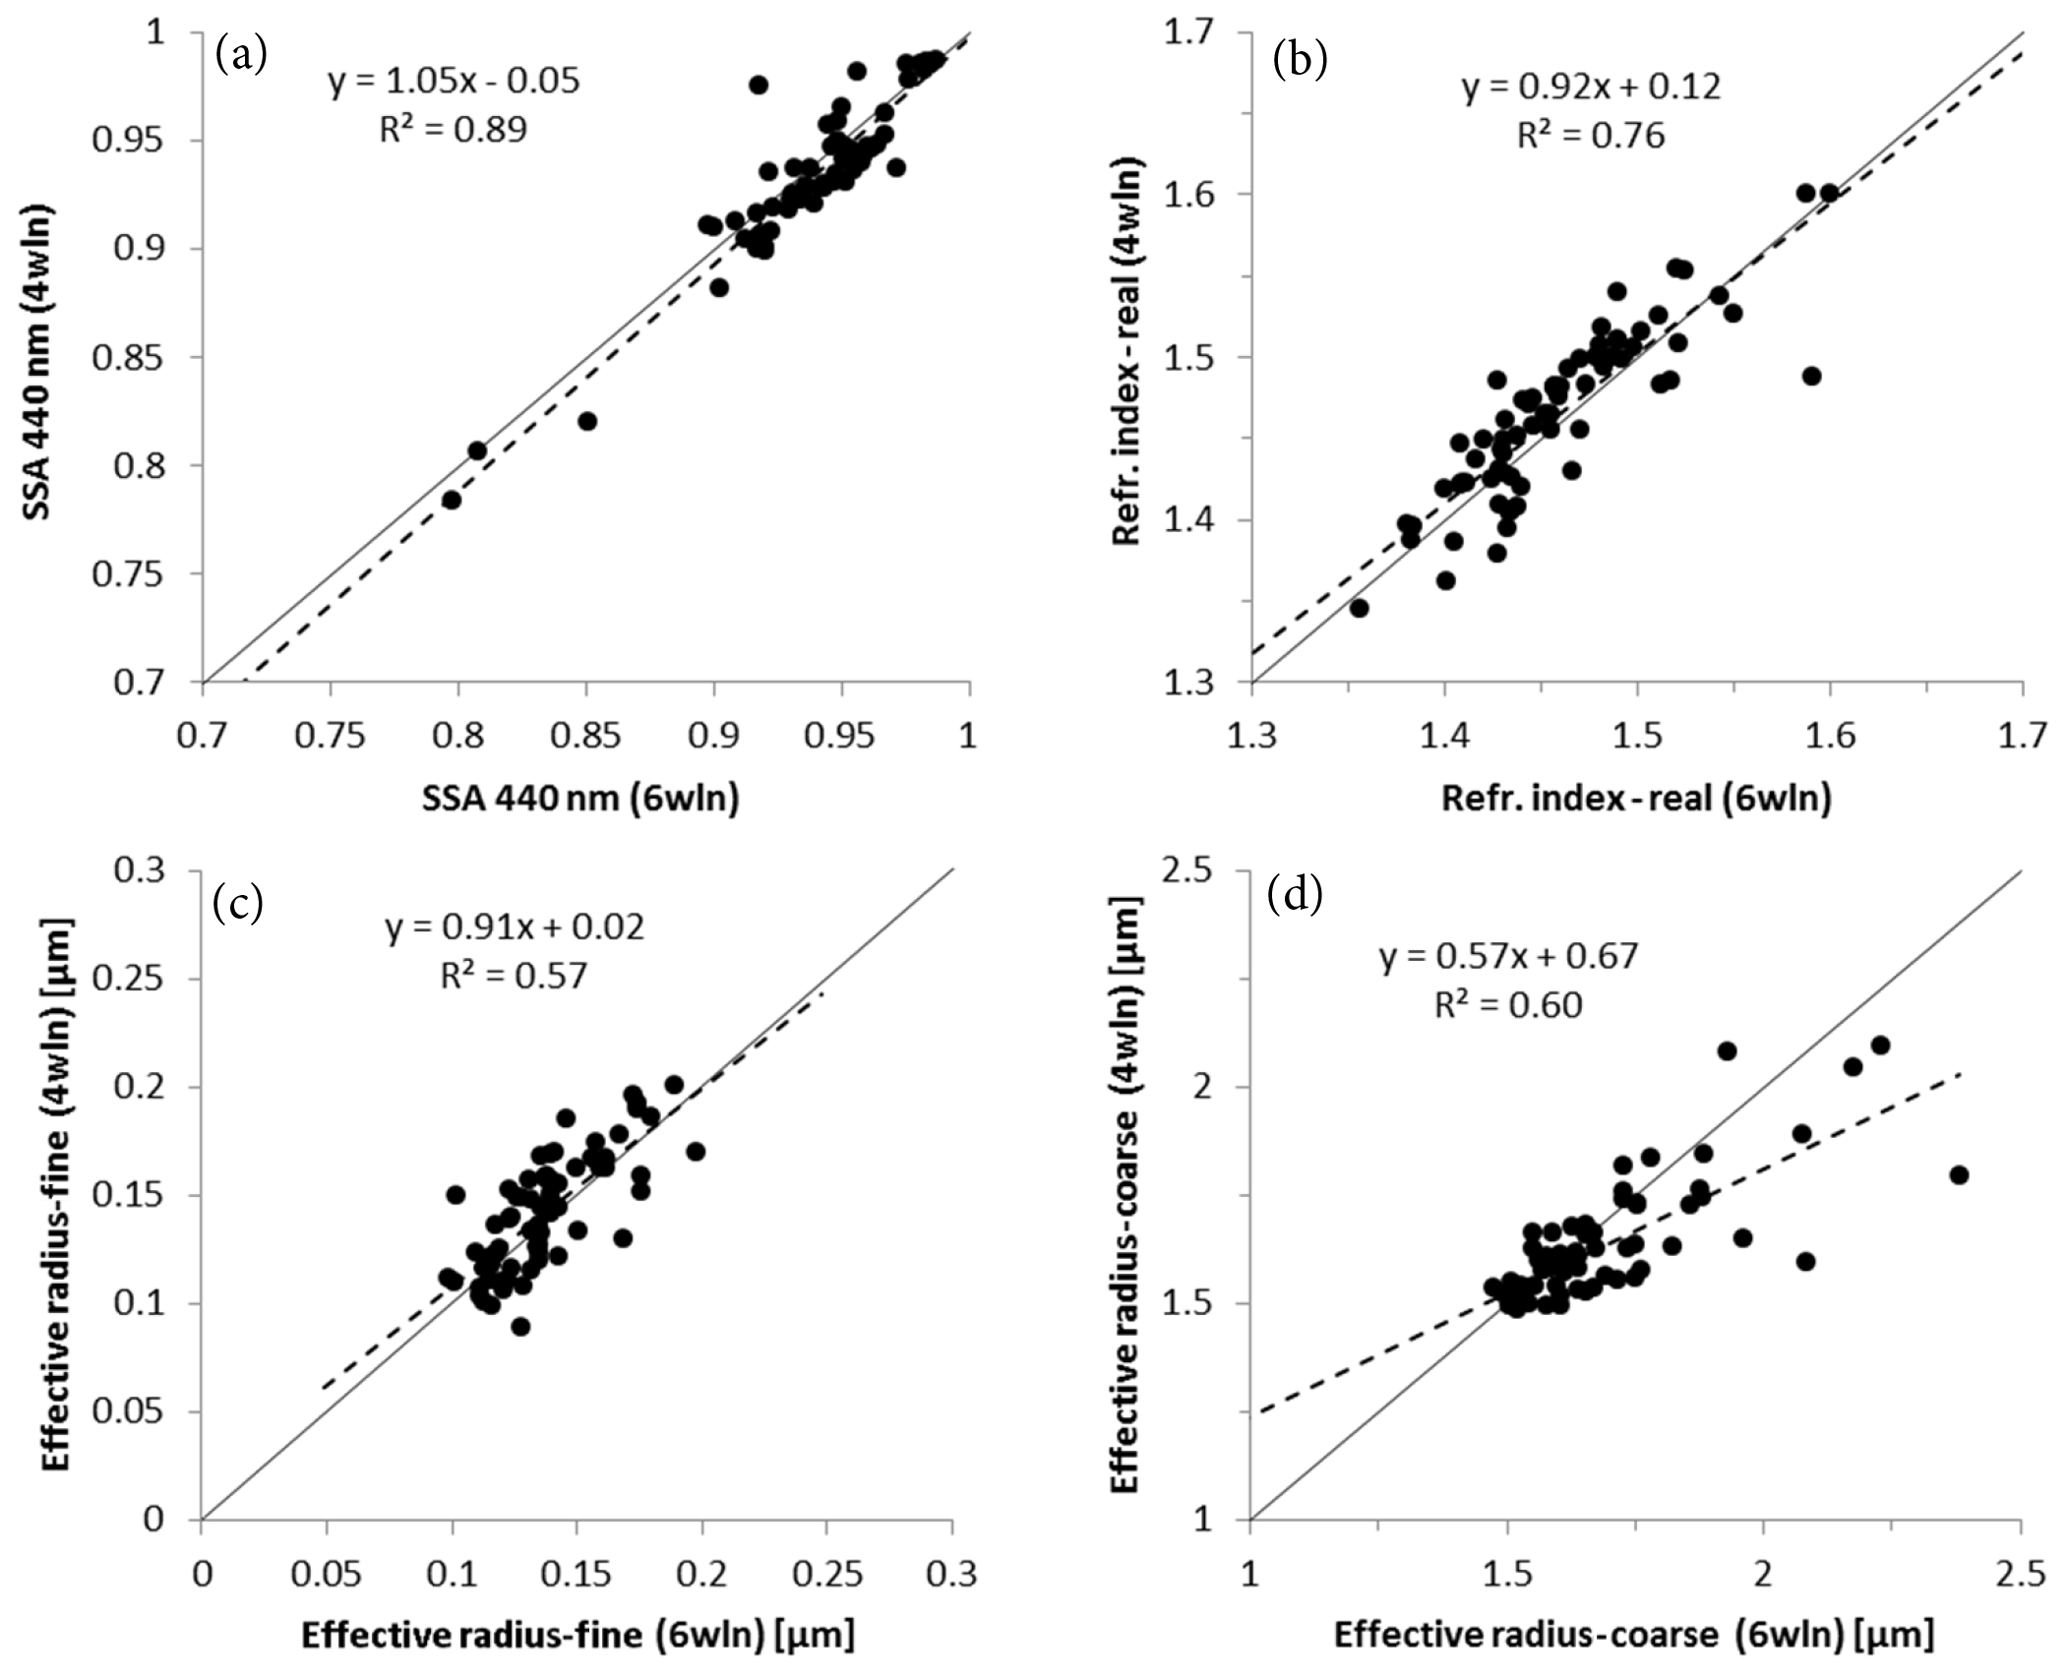
Figure 6Comparison of inversion retrievals using four spectral channels (440, 675, 870 and 1020 nm) or six channels (440, 500, 675, 870, 1020 and 1640 nm) in the diffuse sky radiance: (a) single-scattering albedo (440 nm); (b) the real part of the refractive index, (c) the effective radius of the fine mode, and (d) the effective radius of the coarse mode. Data from Cimel #789 at Barbados_Saltrace using almucantar and principal plane observations. Solid lines indicate the 1:1 line. Dashed lines indicate the linear fit to the displayed data, for which the line equation and correlation coefficient are also provided.
Finally we have analyzed two key lidar properties: the lidar (extinction-to-backscatter) ratio and the particle linear depolarization ratio. As mentioned above, the inversion of sun photometer data can provide column-integrated values for these properties, given that the inversion code computes the full scattering matrix. Therefore the aerosol spheroid model can be used to model lidar observations that are known to be sensitive to the non-sphericity of desert dust particles. Figure 7 summarizes the results. For the sun photometer we used the two retrievals (four and six spectral channels), based on inversions of Cimel #789 measurements. The lidar data were obtained with POLIS at 355 and 532 nm (Groß et al., 2015) as well as BERTHA at 355, 532 and 1064 nm (Haarig et al., 2017) and correspond to dust layers.

Figure 7Wavelength dependence of the (a) lidar ratio (LR) and (b) particle linear depolarization ratio (PLDR), for dust cases during SALTRACE. Data from POLIS (Groß et al., 2015) and BERTHA (Haarig et al., 2017) are compared to the four-wavelength and six-wavelength sun photometer retrievals. Vertical bars in the lidar data indicate uncertainty due to systematic errors.
Figure 7a shows the lidar ratios (LR), which were about 55 sr in POLIS (similar for BERTHA, not shown). Lidar ratios derived from sun photometer are lower, about 50 sr. This behavior is opposite to what was found in previous comparisons using SAMUM data (Müller et al., 2010a, 2012), in which the LR values derived from sun photometer inversion were higher than the values provided by the lidars, especially in the shorter wavelengths. The analysis also shows a large increase for LR at 1640 nm observed during SALTRACE; unfortunately lidar data do not provide information that would help to verify the sun photometer retrieval in that spectral region.
Concerning the particle linear depolarization ratio (PLDR), the results are depicted in Fig. 7b. This parameter is sensitive to the particle shape, therefore strongly dependent on the spheroid model used for the inversion of sun photometer data. The average values retrieved from the sun photometer are 0.25 to 0.27 (440 to 1020 nm) with the four-wavelength retrieval. The six-wavelength retrieval provides values which are a bit higher in the shorter wavelengths (0.28 at 440 nm) and very similar at 1020 nm. More importantly, the wavelength dependence of the PLDR shown by BERTHA is captured by the AERONET six-wavelength retrieval, and not the four-wavelength one, even though the PLDR at 1020–1064 nm derived from the sun photometer is in any case higher than indicated by the lidar uncertainty estimates. The excellent agreement (well within the uncertainty estimates) of POLIS, BERTHA and the sun photometer depolarization ratios in the 500–532 nm wavelength range is also remarkable, in particular as this was not the case for the SAMUM data reported by Müller et al. (2010a). Overall, the spheroid model and the Dubovik inversion seems to provide better results (closer to the lidar measurements) for SALTRACE than was reported for the SAMUM campaigns.
4.3 Comparison with in situ observations at Ragged Point
The comparison between remote-sensing and in situ aerosol measurements is a difficult task due to multiple factors. The atmospheric volume that is observed is normally different: it is at ground level for routine ground-based monitoring with in situ instrumentation; a profile for lidar typically starts some hundreds of meters above the ground due to overlap issues; or the entire atmospheric column for sun photometer retrievals is measured. Only in very well-mixed atmospheres with a single predominant aerosol type is it possible to tackle this kind of comparison. Another possibility is to compare lofted layers observed with lidar and aircraft in situ observations. Other obvious limitations are the presence of inlets, drying elements, etc. needed to introduce the sampled air into the in situ instruments, as compared to the ambient aerosol measured with remote-sensing techniques. Changes in pressure are to be considered in aircraft measurements too. On the other hand, remote-sensing data need to be introduced in inversion algorithms that impose mathematical and physical constraints. Overall, both intensive and extensive aerosol properties need to be compared with extreme caution, and it is still an open question as to what extent a closure approach is feasible and in situ and remote-sensing observations can be reconciled. Several works already showed these difficulties and reported contradictory results in some cases (Reid et al., 2003; Ryder et al., 2015, and references therein).
Valuable efforts have also been attempted in the context of the SAMUM campaigns (Müller et al., 2010a, b, 2012), in which very special atmospheric conditions were measured with multiple state-of-the-art instruments. The agreements and discrepancies found in those works still remain for much of the SALTRACE data. For instance, the mean real part of the refractive index (440 nm) during SALTRACE retrieved with sun photometer data is 1.47 for mineral dust (Table 2), which is much lower than the value reported from in situ observations, about 1.55–1.61 (Kandler et al., 2011). The problems encountered to retrieve the correct dust refractive index using a spheroid model were also highlighted by Kemppinen et al. (2015). Conversely, the single-scattering albedo and its spectral dependence (Table 2) are very similar for dust using sun photometer and in situ optical instruments.
The difficulties to compare in situ and column (sun photometer) size distributions (e.g., Toledano et al., 2011; Ryder et al., 2015) are still present in SALTRACE data. As an example, we have plotted in Fig. 8 the volume size distributions derived from in situ and sun photometer data for a dust and a no-dust case. We have converted the column size distribution from the sun photometer (originally in µm3 µm−2) to concentrations in µm3 cm−3 assuming that the dust layer is distributed evenly in a layer and using a layer height of 4 km for the dust case and 1.5 km for the marine case (data from the co-located POLIS lidar; Groß et al., 2015, Fig. 1). About the shape of the size distributions, the coarse-mode discrepancy is strongly produced by the inlet efficiency in the in situ data (PM10 inlet). However even the fine mode does not present a similar shape, in this case likely produced by the difficulties of the sun photometer inversion to correctly reproduce the fine mode in the presence of a strongly predominant coarse mode (Torres et al., 2017). In the marine (no-dust) case, the fine mode has a similar shape and effective radius, although a strong shift is found in the coarse mode. For the dust case, the effective radius is a factor of 1.8 larger for the sun photometer size distribution.
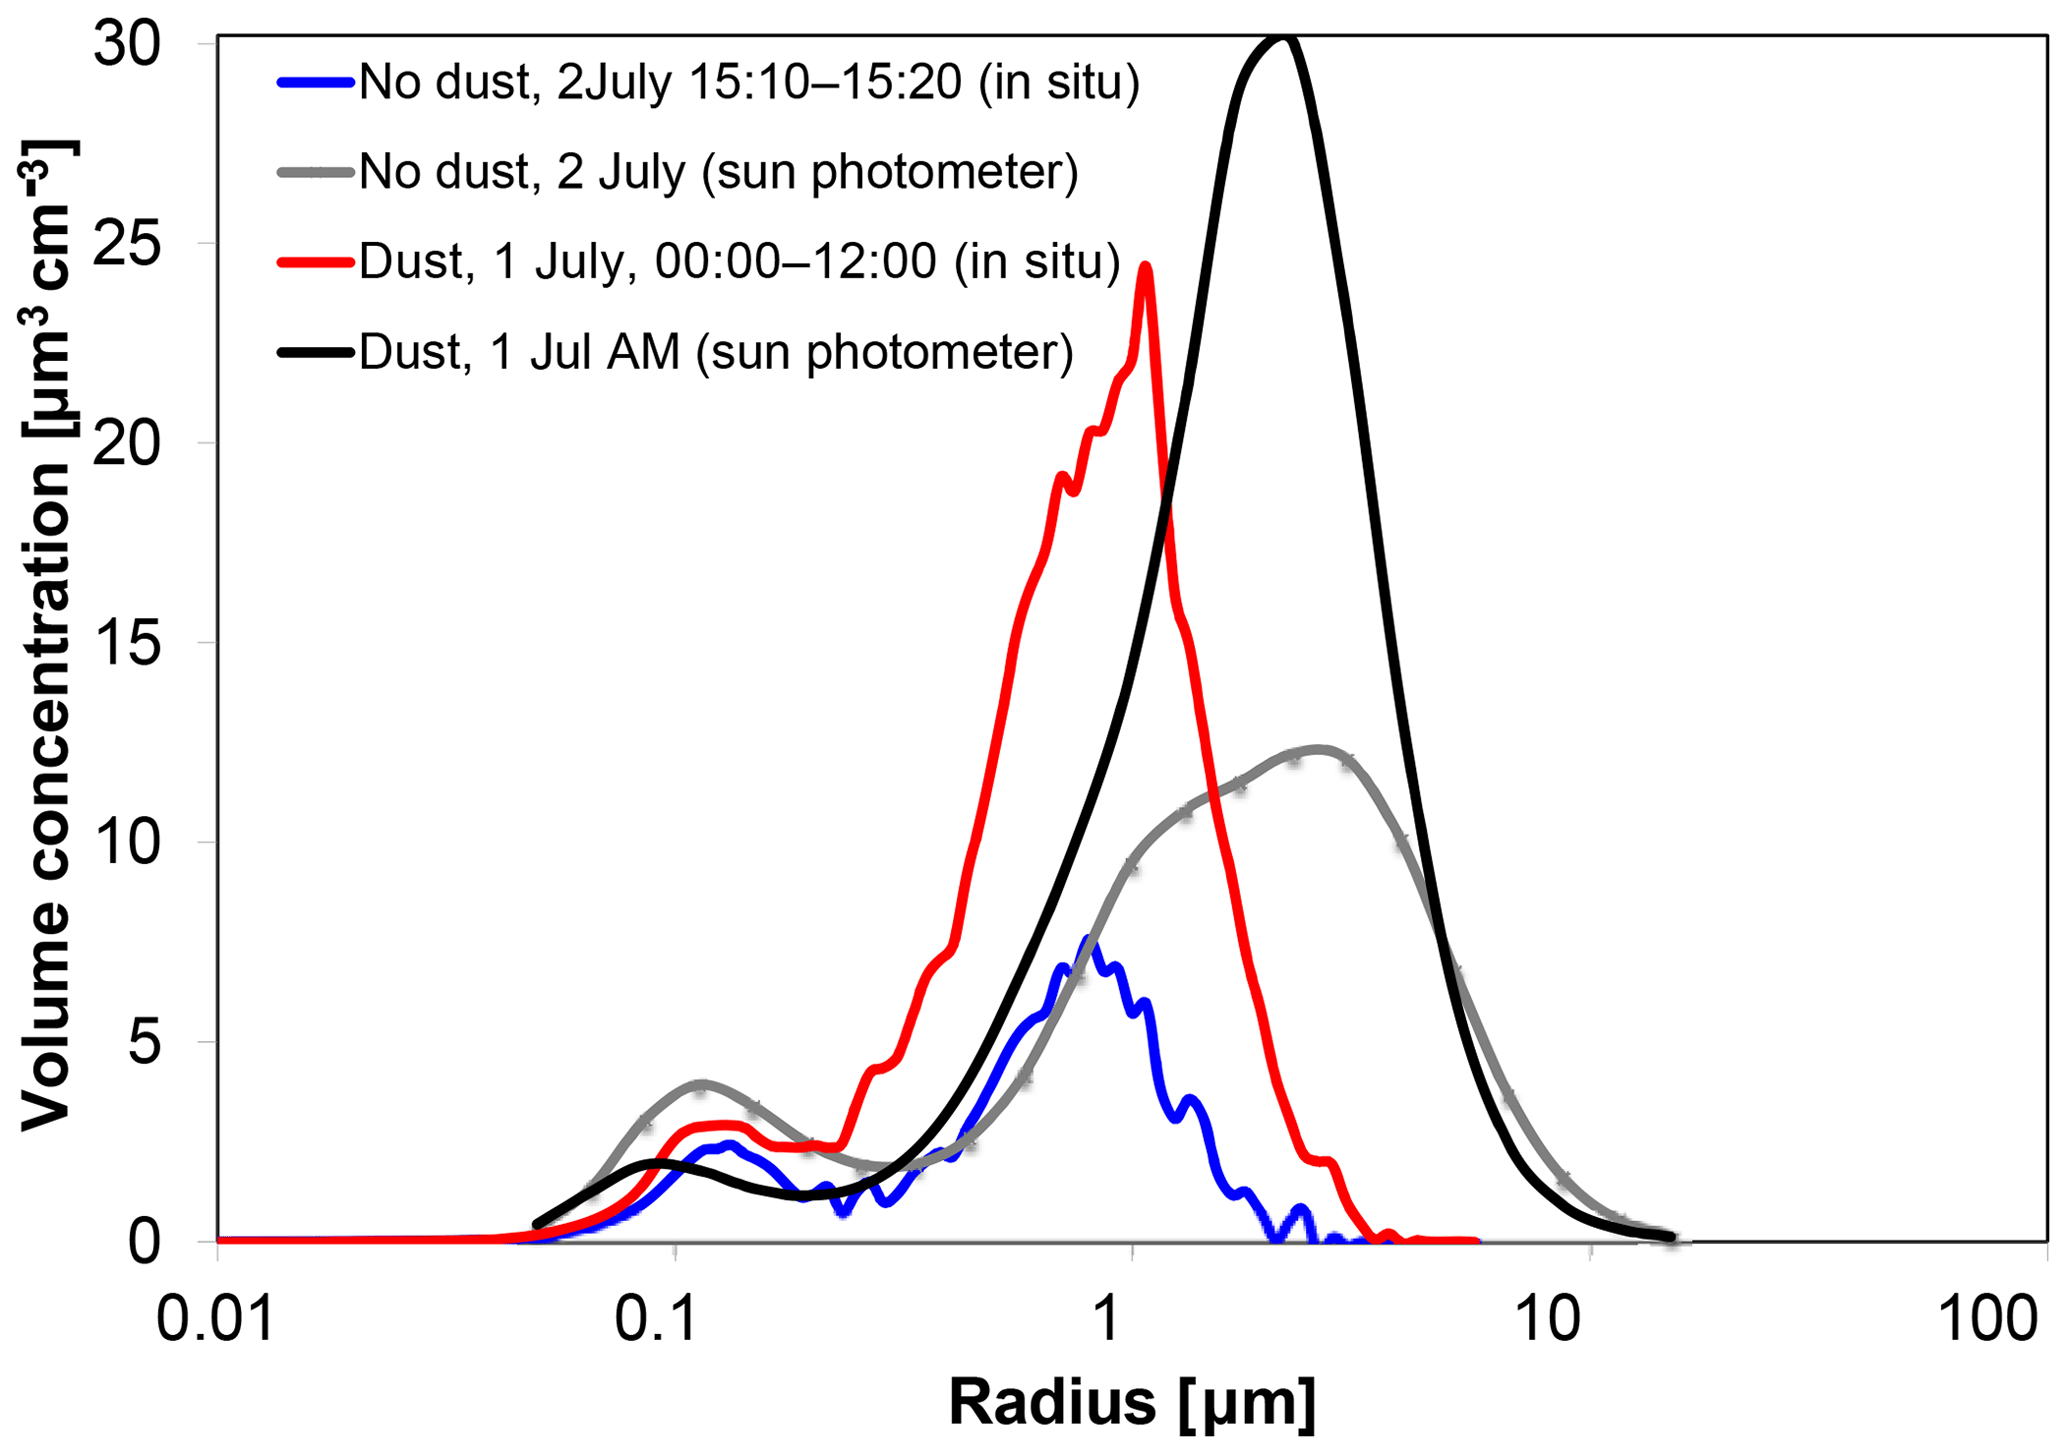
Figure 8Volume particle size distributions for 1 July 2013 (dust case) and 2 July 2013 (no-dust case) measured in situ and by the inversion of the sun photometer data. The latter have been converted to the concentration using a layer height derived from the co-located lidar observations (see details in the text).
Nevertheless, some in situ and column parameters show better correlation, as is the case for the ground-based dust concentration and the aerosol optical depth. This was already highlighted for SALTRACE (Weinzierl et al., 2017, see Fig. 4) as well as for long-term monthly means at the site in Barbados (Smirnov et al., 2000b). The good correlation and absence of time lag between in situ and column data indicates that dust transported in lofted layers is, at the same time, mixed down into the boundary layer over Barbados.
The analysis of the aerosol optical depth revealed a continuous succession of dust events during SALTRACE, only interrupted during short periods in which the marine aerosol background was observed. This is as low as 0.04 for AOD (500 nm) during the summer months. In contrast, dust layers resulted in a mean AOD (500 nm) of 0.26. The aerosol classification analysis indicates that marine and dust were the only aerosol types observed during the experiment. The wavelength dependence of the aerosol optical depth was investigated in order to provide an estimated value at the 2 µm wavelength, needed for the wind lidar data analysis (Chouza et al., 2015). A 2nd-order fit was needed to capture the appropriate spectral variation in the shortwave infrared.
The sky radiance data were inverted using the Dubovik code for both almucantar and principal plane observation geometries, as well as using two different spectral ranges (440–1020 and 440–1640 nm). Only the coarse-mode retrieval (size distribution and corresponding effective radius) changes significantly by enhancing the spectral range, showing a shift toward larger radii. As compared to the retrieved size distributions during SAMUM, the change in the effective radii of the fine and coarse modes is within the uncertainties and therefore not significant. The fine-mode fraction of the size distribution is on average 0.09, thus indicating a clear coarse-mode predominance. During marine (no-dust) cases, the coarse-mode effective radius is larger than it is for dust.
Column-integrated values were also investigated for two lidar-relevant properties: the lidar ratio and particle linear depolarization ratio. The sun photometer inversion retrieval of these parameters seems to improve with respect to previous comparisons carried out with SAMUM data. However, robust uncertainty estimates for the sun photometer inversion products are needed to corroborate this agreement.
The comparison of sun photometer retrievals with in situ aerosol properties is still a subject of investigation. Even if a very good correlation was found between the dust concentration at ground level and aerosol optical depth, the comparison of other variables like the particle size distributions requires considerable experimental efforts (e.g., additional aircraft measurements) and is thus still challenging. The analysis of SALTRACE data will continue to aim at a closure approach, i.e., the characterization of the same aerosol parameters with various independent methods.
AERONET aerosol data are available at https://aeronet.gsfc.nasa.gov (NASA Goddard Space Flight Center, 2019, Barbados_SALTRACE and Ragged_Point sites). SSARA minute-based AODs are available upon request.
CT and CV led the analysis and the writing of the paper. BT performed the sun photometer inversions using Dubovik code. TM provided data and the analysis of in situ measurements. AA, MH and SG contributed with lidar data and their interpretation. All authors contributed to the scientific analysis and the preparation and revision of the paper.
The authors declare that they have no conflict of interest.
This article is part of the special issue “The Saharan Aerosol Long‐range Transport and Aerosol‐Cloud‐interaction Experiment (SALTRACE) (ACP/AMT inter-journal SI)”. It is not associated with a conference.
The authors gratefully acknowledge the effort of AERONET and the University of Miami to maintain the Ragged Point site. We thank Volker Freudenthaler and Meinhard Seefeldner from LMU for all their work in relation to SALTRACE, especially the contribution to the development of the SSARA-P photometer.
This research has received funding from the European Union's Framework Programme for Research and Innovation, Horizon 2020 (grant agreement no. 654109; ACTRIS-2). Bernadett Weinzierl and Josef Gasteiger have received funding from the European Research Council (ERC) under the European Union's Framework Programme for Research and Innovation, Horizon 2020 (grant agreement no. 640458; A-LIFE) and from the Helmholtz Association (grant no. VH-NG-606; Helmholtz-Hochschul-Nachwuchsforschergruppe AerCARE). The funding by MINECO (grant no. RTI2018-097864-B-I00) and Junta de Castilla y León (grant no. VA100P17) is also acknowledged.
This paper was edited by Claire Ryder and reviewed by two anonymous referees.
Ångström, A.: Techniques of determining the turbidity of the atmosphere, Tellus, 13, 214–223, 1961. a, b
Ansmann, A., Petzold, A., Kandler, K., Tegen, I., Wendisch, M., Müller, D., Weinzierl, B., Müller, T., and Heintzenberg, J.: Saharan Mineral Dust Experiments SAMUM–1 and SAMUM–2: What have we learned?, Tellus B, 63, 403–429, 2011. a
Burgos, M., Mateos, D., Cachorro, V., Toledano, C., and de Frutos, A.: Aerosol properties of mineral dust and its mixtures in a regional background of north-central Iberian Peninsula, Sci. Total Environ., 572, 1005–1019, https://doi.org/10.1016/j.scitotenv.2016.08.001, 2016. a
Cachorro, V. E., Toledano, C., Sorribas, M., Berjon, A., de Frutos A. M., and Laulainen, N.: An “in situ” calibration-correction procedure (KCICLO) based on AOD diurnal cycle: Comparative results between AERONET and reprocessed (KCICLO method) AOD-alpha data series at El Arenosillo, Spain, J. Geophys. Res., 113, D02207, https://doi.org/10.1029/2007JD009001, 2008. a
Carlson, T. N. and Prospero, J. M.: The Large-Scale Movement of Saharan Air Outbreaks over the Northern Equatorial Atlantic, J. Appl. Meteorol., 11, 283–297, https://doi.org/10.1175/1520-0450(1972)011<0283:TLSMOS>2.0.CO;2, 1972. a
Chouza, F., Reitebuch, O., Groß, S., Rahm, S., Freudenthaler, V., Toledano, C., and Weinzierl, B.: Retrieval of aerosol backscatter and extinction from airborne coherent Doppler wind lidar measurements, Atmos. Meas. Tech., 8, 2909–2926, https://doi.org/10.5194/amt-8-2909-2015, 2015. a, b
Dubovik, O. and King, M.: A Flexible Inversion Algorithm for Retrieval of Aerosol Optical Properties from Sun and Sky Radiance Measurements., J. Geophys. Res., 105, 20673–20696, 2000. a
Dubovik, O., Smirnov, A., Holben, B. N., King, M. D., Kaufman, Y. J., Eck, T. F., and Slutsker, I.: Accuracy assessments of aerosol optical properties retrieved from Aerosol Robotic Network (AERONET) Sun and sky radiance measurements, J. Geophys. Res., 105, 9791–9806, 2000. a
Dubovik, O., Holben, B., Eck, T., Smirnov, A., Kaufman, Y., King, M. D., Tanre, D., and Slutsker, I.: Variability of Absorption and Optical Properties of Key Aerosol Types Observed in Worldwide Locations, J. Atmos. Sci., 59, 590–608, 2002. a, b
Dubovik, O., Sinyuk, A., Lapyonok, T., Holben, B. N., Mishchenko, M., Yang, P., Eck, T. F., Volten, H., Muñoz, O., Veihelmann, B., van der Zande, W. J., Léon, J.-F., Sorokin, M., and Slutsker, I.: Application of spheroid models to account for aerosol particle nonsphericity in remote sensing of desert dust, J. Geophys. Res., 111, D11208, https://doi.org/10.1029/2005JD006619, 2006. a, b, c
Freudenthaler, V.: About the effects of polarising optics on lidar signals and the Δ90 calibration, Atmos. Meas. Tech., 9, 4181–4255, https://doi.org/10.5194/amt-9-4181-2016, 2016. a
Freudenthaler, V., Esselborn, M., Wiegner, M., Heese, B., Tesche, M., Ansmann, A., Müller, D., Althausen, D., Wirth, M., Fix, A., Ehret, G., Toledano, C., Garhammer, M., and Seefeldner, M.: Depolarization ratio profiling at several wavelengths in pure Saharan dust during SAMUM 2006, Tellus B, 61, 165–179, 2009. a
Gasteiger, J. and Freudenthaler, V.: Benefit of depolarization ratio at λ=1064 nm for the retrieval of the aerosol microphysics from lidar measurements, Atmos. Meas. Tech., 7, 3773–3781, https://doi.org/10.5194/amt-7-3773-2014, 2014. a
Gasteiger, J., Wiegner, M., Gross, S., Freudenthaler, V., Toledano, C., Tesche, M., and Kandler, K.: Modeling lidar-relevant optical properties of complex mineral dust aerosols, Tellus B, 63, 725–741, https://doi.org/10.1111/j.1600-0889.2011.00559.x, 2011. a
Gasteiger, J., Groß, S., Sauer, D., Haarig, M., Ansmann, A., and Weinzierl, B.: Particle settling and vertical mixing in the Saharan Air Layer as seen from an integrated model, lidar, and in situ perspective, Atmos. Chem. Phys., 17, 297–311, https://doi.org/10.5194/acp-17-297-2017, 2017. a, b
Giles, D. M., Sinyuk, A., Sorokin, M. G., Schafer, J. S., Smirnov, A., Slutsker, I., Eck, T. F., Holben, B. N., Lewis, J. R., Campbell, J. R., Welton, E. J., Korkin, S. V., and Lyapustin, A. I.: Advancements in the Aerosol Robotic Network (AERONET) Version 3 database – automated near-real-time quality control algorithm with improved cloud screening for Sun photometer aerosol optical depth (AOD) measurements, Atmos. Meas. Tech., 12, 169–209, https://doi.org/10.5194/amt-12-169-2019, 2019. a, b, c
Goudie, A. and Middleton, N.: Saharan dust storms: nature and consequences., Earth-Sci. Rev., 56, 179–204, 2001. a
Groß, S., Freudenthaler, V., Schepanski, K., Toledano, C., Schäfler, A., Ansmann, A., and Weinzierl, B.: Optical properties of long-range transported Saharan dust over Barbados as measured by dual-wavelength depolarization Raman lidar measurements, Atmos. Chem. Phys., 15, 11067–11080, https://doi.org/10.5194/acp-15-11067-2015, 2015. a, b, c, d, e, f, g, h, i
Groß, S., Gasteiger, J., Freudenthaler, V., Müller, T., Sauer, D., Toledano, C., and Ansmann, A.: Saharan dust contribution to the Caribbean summertime boundary layer – a lidar study during SALTRACE, Atmos. Chem. Phys., 16, 11535–11546, https://doi.org/10.5194/acp-16-11535-2016, 2016. a, b
Haarig, M., Ansmann, A., Althausen, D., Klepel, A., Groß, S., Freudenthaler, V., Toledano, C., Mamouri, R.-E., Farrell, D. A., Prescod, D. A., Marinou, E., Burton, S. P., Gasteiger, J., Engelmann, R., and Baars, H.: Triple-wavelength depolarization-ratio profiling of Saharan dust over Barbados during SALTRACE in 2013 and 2014, Atmos. Chem. Phys., 17, 10767–10794, https://doi.org/10.5194/acp-17-10767-2017, 2017. a, b, c, d, e, f, g
Heinold, B., Tegen, I., Schepanski, K., Tesche, M., Esselborn, M., Freudenthaler, V., Gross, S., Kandler, K., Knippertz, P., Mueller, D., Schladitz, A., Toledano, C., Weinzierl, B., Ansmann, A., Althausen, D., Mueller, T., Petzold, A., and Wiedensohler, A.: Regional modelling of Saharan dust and biomass-burning smoke Part I: Model description and evaluation, Tellus B, 63, 781–799, https://doi.org/10.1111/j.1600-0889.2011.00570.x, 2011. a
Heintzenberg, J.: The SAMUM-1 experiment over Southern Morocco: overview and introduction, Tellus B, 61, 2–11, 2009. a
Holben, B. N., Eck, T. F., Slutsker, I., Tanré, D., Buis, J. P., Setzer, A., Vermote, E., Reagan, J. A., Kaufman, Y. J., Nakajima, T., Lavenu, F., Jankowiak, I., and Smirnov, A.: AERONET – a federated instrument network and data archive for aerosol characterization, Remote Sens. Environ., 66, 1–16, 1998. a, b, c
Kandler, K., Lieke, K., Benker, N., Emmel, C., Küpper, M., Müller-Ebert, D., Ebert, M., Scheuvens, D., Schladitz, A., Schütz, L., and Weinbruch, S.: Electron microscopy of particles collected at Praia, Cape Verde, during the Saharan Mineral dust experiment: particle chemistry, shape, mixing state and complex refractive index, Tellus B, 63, 475–496, 2011. a
Kandler, K., Schneiders, K., Ebert, M., Hartmann, M., Weinbruch, S., Prass, M., and Pöhlker, C.: Composition and mixing state of atmospheric aerosols determined by electron microscopy: method development and application to aged Saharan dust deposition in the Caribbean boundary layer, Atmos. Chem. Phys., 18, 13429–13455, https://doi.org/10.5194/acp-18-13429-2018, 2018. a, b
Kemppinen, O., Nousiainen, T., Merikallio, S., and Räisänen, P.: Retrieving microphysical properties of dust-like particles using ellipsoids: the case of refractive index, Atmos. Chem. Phys., 15, 11117–11132, https://doi.org/10.5194/acp-15-11117-2015, 2015. a
Kristensen, T. B., Müller, T., Kandler, K., Benker, N., Hartmann, M., Prospero, J. M., Wiedensohler, A., and Stratmann, F.: Properties of cloud condensation nuclei (CCN) in the trade wind marine boundary layer of the western North Atlantic, Atmos. Chem. Phys., 16, 2675–2688, https://doi.org/10.5194/acp-16-2675-2016, 2016. a, b, c
Li, Z., Li, K., Li, L., Xu, H., Xie, Y., Ma, Y., Li, D., Goloub, P., Yuan, Y., and Zheng, X.: Calibration of the degree of linear polarization measurements of the polarized Sun-sky radiometer based on the POLBOX system, Appl. Opt., 57, 1011–1018, https://doi.org/10.1364/AO.57.001011, 2018. a
Liao, H. and Seinfeld, J. H.: Radiative forcing by mineral dust aerosols: Sensitivity to key variables, J. Geophys. Res.-Atmos., 103, 31637–31645, https://doi.org/10.1029/1998JD200036, 1998. a
Mallet, M., Dubovik, O., Nabat, P., Dulac, F., Kahn, R., Sciare, J., Paronis, D., and Léon, J. F.: Absorption properties of Mediterranean aerosols obtained from multi-year ground-based remote sensing observations, Atmos. Chem. Phys., 13, 9195–9210, https://doi.org/10.5194/acp-13-9195-2013, 2013. a
Mateos, D., Antón, M., Toledano, C., Cachorro, V. E., Alados-Arboledas, L., Sorribas, M., Costa, M. J., and Baldasano, J. M.: Aerosol radiative effects in the ultraviolet, visible, and near-infrared spectral ranges using long-term aerosol data series over the Iberian Peninsula, Atmos. Chem. Phys., 14, 13497–13514, https://doi.org/10.5194/acp-14-13497-2014, 2014. a
Müller, D., Ansmann, A., Freudenthaler, V., Kandler, K., Toledano, C., Hiebsch, A., Gasteiger, J., Esselborn, M., Tesche, M., Heese, B., Althausen, D., Weinzierl, B., Petzold, A., and von Hoyningen-Huene, W.: Mineral dust observed with AERONET Sun photometer, Raman lidar, and in situ instruments during SAMUM 2006: Shape-dependent particle properties, J. Geophys. Res., 115, D11207, https://doi.org/10.1029/2009JD012523, 2010a. a, b, c
Müller, D., Weinzierl, B., Petzold, A., Kandler, K., Ansmann, A., Müller, T., Tesche, M., Freudenthaler, V., Esselborn, M., Heese, B., Althausen, D., Schladitz, A., Otto, S., and Knippertz, P.: Mineral dust observed with AERONET Sun photometer, Raman lidar, and in situ instruments during SAMUM 2006: Shape-independent particle properties, J. Geophys. Res., 115, D07202, https://doi.org/10.1029/2009JD012520, 2010b. a, b
Müller, D., Lee, K.-H., Gasteiger, J., Tesche, M., Weinzierl, B., Kandler, K., Müller, T., Toledano, C., Otto, S., Althausen, D., and Ansmann, A.: Comparison of Optical and Microphysical Properties of Pure Saharan Mineral Dust Observed With AERONET Sun Photometer, Raman Lidar, and In-Situ Instruments During SAMUM 2006, J. Geophys. Res., 117, D07211, https://doi.org/10.1029/2011JD016825, 2012. a, b
Müller, T., Schladitz, A., and Wiedensohler, A.: Spectral particle absorption coefficients, single scattering albedos, and imaginary parts of refractive indices from ground based in-situ measurements at Cape Verde Island during SAMUM-2, Tellus B, 63, 573–588, https://doi.org/10.1111/j.1600-0889.2011.00572.x, 2011. a
NASA Goddard Space Flight Center: AEROSOL ROBOTIC NETWORK (AERONET), available at: https://aeronet.gsfc.nasa.gov/, last access: 28 November 2019. a
Prats, N., Cachorro, V. E., Berjón, A., Toledano, C., and De Frutos, A. M.: Column-integrated aerosol microphysical properties from AERONET Sun photometer over southwestern Spain, Atmos. Chem. Phys., 11, 12535–12547, https://doi.org/10.5194/acp-11-12535-2011, 2011. a
Prospero, J.: Long range transport of mineral dust in the global atmosphere: impact of African dust on the environment of the south-eastern United States., P. Natl. Acad. Sci. USA, 96, 3396–3403, 1999. a
Prospero, J. M. and Carlson, T. N.: Vertical and areal distribution of Saharan dust over the western equatorial north Atlantic Ocean, J. Geophys. Res., 77, 5255–5265, https://doi.org/10.1029/JC077i027p05255, 1972. a
Prospero, J. M., Collard, F.-X., Molinié, J., and Jeannot, A.: Characterizing the annual cycle of African dust transport to the Caribbean Basin and South America and its impact on the environment and air quality, Global Biogeochem. Cy., 28, 757–773, https://doi.org/10.1002/2013GB004802, 2014. a
Reid, J. S., Kinney, J. E., Westphal, D. L., Holben, B. N., Welton, E. J., Tsay, S., Eleuterio, D. P., Campbell, J. R., Christopher, S. A., Colarco, P. R., Jonsson, H. H., Livingston, J. M., Maring, H. B., Meier, M. L., Pilewskie, P., Prospero, J. M., Reid, E. A., Remer, L. A., Russel, P. B., Savoie, D. L., Smirnov, A., and Tanre, D.: Analysis of measurements of Saharan dust by airborne and ground-based remote sensing methods during the Puerto Rico Dust Experiment (PRIDE), J. Geophys. Res., 108, 8586, https://doi.org/10.1029/2002JD002493, 2003. a
Ryder, C. L., McQuaid, J. B., Flamant, C., Rosenberg, P. D., Washington, R., Brindley, H. E., Highwood, E. J., Marsham, J. H., Parker, D. J., Todd, M. C., Banks, J. R., Brooke, J. K., Engelstaedter, S., Estelles, V., Formenti, P., Garcia-Carreras, L., Kocha, C., Marenco, F., Sodemann, H., Allen, C. J. T., Bourdon, A., Bart, M., Cavazos-Guerra, C., Chevaillier, S., Crosier, J., Darbyshire, E., Dean, A. R., Dorsey, J. R., Kent, J., O'Sullivan, D., Schepanski, K., Szpek, K., Trembath, J., and Woolley, A.: Advances in understanding mineral dust and boundary layer processes over the Sahara from Fennec aircraft observations, Atmos. Chem. Phys., 15, 8479–8520, https://doi.org/10.5194/acp-15-8479-2015, 2015. a, b
Schladitz, A., Müller, T., Nowak, A., Kandler, K., Lieke, K., Massling, A., and Wiedensohler, A.: In–situ aerosol characterization at Cape Verde. Part 1: Particle number size distributions, hygroscopic growth and state of mixing of the marine and Saharan dust aerosol, Tellus B, 63, 531–548, https://doi.org/10.1111/j.1600-0889.2011.00569.x, 2011. a
Smirnov, A., Holben, B. N., Eck, T. F., Dubovik, O., and Slutsker, I.: Cloud-Screening and Quality Control Algorithms for the AERONET Database, Remote Sens. Environ., 73, 337–349, 2000a. a
Smirnov, A., Holben, B. N., Savoie, D., Prospero, J. M., Kaufman, Y. J., Tanre, D., Eck, T. F., and Slutsker, I.: Relationship between column aerosol optical thickness and in situ ground based dust concentrations over Barbados, Geophys. Res. Lett., 27, 1643–1646, https://doi.org/10.1029/1999GL011336, 2000b. a
Smirnov, A., Holben, B., Kaufman, Y., Dubovik, O., Eck, T., Slutsker, I., Pietras, C., and Halthore, R.: Optical Properties of Atmospheric Aerosol in Maritime Environments, J. Atmos. Sci., 59, 501–523, 2002. a
Tang, M., Cziczo, D. J., and Grassian, V. H.: Interactions of Water with Mineral Dust Aerosol: Water Adsorption, Hygroscopicity, Cloud Condensation, and Ice Nucleation, Chem. Rev., 116, 4205–4259, https://doi.org/10.1021/acs.chemrev.5b00529, 2016. a
Tegen, I.: Modeling the mineral dust aerosol cycle in the climate system, Quaternary Sci. Rev., 22, 1821–1834, https://doi.org/10.1016/S0277-3791(03)00163-X, 2003. a
Tesche, M., Gross, S., Ansmann, A., Müller, D., Althausen, D., Freudenthaler, V., and Esselborn, M.: Profiling of Saharan dust and biomass-burning smoke with multiwavelength polarization Raman lidar at Cape Verde, Tellus B, 63, 649–676, https://doi.org/10.1111/j.1600-0889.2011.00548.x, 2011. a
Toledano, C., Wiegner, M., Garhammer, M., Seefeldner, M., Gasteiger, J., Müller, D., and Koepke, P.: Spectral aerosol optical depth characterization of desert dust during SAMUM 2006, Tellus B, 61, 216–228, 2009. a, b, c
Toledano, C., Wiegner, M., Gross, S., Freudenthaler, V., Gasteiger, J., Müller, D., Müller, T., Schladitz, A., Weinzierl, B., Torres, B., and O'Neill, N. T.: Optical properties of aerosol mixtures derived from sun-sky radiometry during SAMUM-2, Tellus B, 63, 635–648, https://doi.org/10.1111/j.1600-0889.2011.00573.x, 2011. a, b, c, d, e
Torres, B., Dubovik, O., Fuertes, D., Schuster, G., Cachorro, V. E., Lapyonok, T., Goloub, P., Blarel, L., Barreto, A., Mallet, M., Toledano, C., and Tanré, D.: Advanced characterisation of aerosol size properties from measurements of spectral optical depth using the GRASP algorithm, Atmos. Meas. Tech., 10, 3743–3781, https://doi.org/10.5194/amt-10-3743-2017, 2017. a
Velasco-Merino, C., Mateos, D., Toledano, C., Prospero, J. M., Molinie, J., Euphrasie-Clotilde, L., González, R., Cachorro, V. E., Calle, A., and de Frutos, A. M.: Impact of long-range transport over the Atlantic Ocean on Saharan dust optical and microphysical properties based on AERONET data, Atmos. Chem. Phys., 18, 9411-9424, https://doi.org/10.5194/acp-18-9411-2018, 2018. a, b, c
Weinzierl, B., Ansmann, A., Prospero, J. M., Althausen, D., Benker, N., Chouza, F., Dollner, M., Farrell, D., Fomba, W. K., Freudenthaler, V., Gasteiger, J., ß, S. G., Haarig, M., Heinold, B., Kandler, K., Kristensen, T. B., Mayol-Bracero, O. L., Müller, T., Reitebuch, O., Sauer, D., Schäfler, A., Schepanski, K., Spanu, A., Tegen, I., Toledano, C., and Walser, A.: The Saharan Aerosol Long-range Transport and Aerosol-Cloud Interaction Experiment (SALTRACE): overview and selected highlights, B. Am. Meteorol. Soc., 98, 1427–1451, https://doi.org/10.1175/BAMS-D-15-00142.1, 2017. a, b, c, d, e, f
Wiegner, M., Groß, S., Freudenthaler, V., Schnell, F., and Gasteiger, J.: The May/June 2008 Saharan dust event over Munich: Intensive aerosol parameters from lidar measurements, J. Geophys. Res.-Atmos., 116, D23213, https://doi.org/10.1029/2011JD016619, 2011. a
The key additional channel is 1640 nm; the 500 nm channel may increase the robustness of the results but would not produce the observed changes in the coarse-mode retrieval.