the Creative Commons Attribution 4.0 License.
the Creative Commons Attribution 4.0 License.
 | 22 Nov 2019
Occurrence and source apportionment of perfluoroalkyl acids (PFAAs) in the atmosphere in China
Deming Han
Yingge Ma
Cheng Huang
Xufeng Zhang
Hao Xu
Yong Zhou
Shan Liang
Xiaojia Chen
Xiqian Huang
Haoxiang Liao
Shuang Fu
Xue Hu
Jinping Cheng
Perfluoroalkyl acids (PFAAs) are a form of toxic pollutant that can be transported across the globe and accumulated in the bodies of wildlife and humans. A nationwide geographical investigation considering atmospheric PFAAs via a passive air sampler (PAS) based on XAD (a styrene–divinylbenzene copolymer) was conducted in 23 different provinces/municipalities/autonomous regions in China, which provides an excellent chance to investigate their occurrences, spatial trends, and potential sources. The total atmospheric concentrations of 13 PFAAs (n=268) were 6.19–292.57 pg m−3, with an average value of 39.84±28.08 pg m−3, which were higher than other urban levels but lower than point source measurements. Perfluorooctanoic acid (PFOA) was the dominant PFAA (20.6 %), followed by perfluorohexanoic acid (PFHxA), perfluorooctane sulfonate (PFOS), and perfluoroheptanoic acid (PFPeA). An increasing seasonal trend of PFAA concentrations was shown as summer < autumn < spring < winter, which may be initiated by stagnant meteorological conditions. Spatially, the content of PFAAs displayed a declining gradient trend of central China > northern China > eastern China > north-eastern China > south-western China > north-western China > southern China, and Henan contributed the largest proportion of PFAAs. Four sources of PFAAs were identified using a positive matrix factorization (PMF) model, including PFOS-based products (26.1 %), products based on PFOA and perfluorononanoic acid (PFNA; 36.6 %), degradation products of fluorotelomer-based products (15.5 %), and an unknown source (21.8 %).
- Article
(3024 KB) -
Supplement
(1934 KB) - BibTeX
- EndNote


Perfluoroalkyl acids (PFAAs) are one class of ionic polyfluoroalkyl substances (PFASs), which have excellent characteristics in terms of chemical and thermal stability, high surface activity, and water and oil repulsion (Lindstrom et al., 2011; Wang et al., 2014). They are applied to a wide variety of domestic and industrial products such as textiles, oil and liquid repellents, firefighting foam, pesticides, and food packaging materials (Xie et al., 2013; Wang et al., 2014). PFAAs can be released into the surrounding environment during manufacturing and use of PFAA-containing products, which are ubiquitous in the environment (e.g., in the atmosphere, water, or snow; Dreyer et al., 2009; Wang et al., 2017; Hu et al., 2016), in wildlife (Sedlak et al., 2017), and even in the human body (Cardenas et al., 2017; Tian et al., 2018a). PFAAs can change adult thyroid hormone levels, reduce newborn birth weight, and biomagnify up the food chain, which can be extremely toxic to animals and humans (Hu et al., 2016; Jian et al., 2017; Baard Ingegerdsson et al., 2010). Of the PFAAs, the long-chain (C ≥ 8) perfluoroalkyl carboxylic acids (PFCAs) and (C ≥ 7) perfluoroalkyl sulfonic acids (PFSAs) are more toxic and bio-accumulative than their short-chain analogues (Buck et al., 2011). This especially applies to perfluorooctanoic acid (PFOA), perfluorooctane sulfonate (PFOS), and perfluorohexane sulfonate (PFHxS), in which PFOS and PFOA have been added to Annex B and Annex A of the Stockholm Convention in 2009 and 2019, respectively, while PFHxS was under review by the Persistent Organic Pollutants Review Committee (Johansson et al., 2008; UNEP Stockholm Convention, 2019).
PFAAs can originate from direct sources of products' emissions as well as indirect sources of incomplete degradation of their precursors. It is estimated that the global historical emission quantities of C4–C14 PFCAs were 2610–21 400 t in the period of 1951–2015, of which products based on PFOA and perfluorononanoic acid (PFNA) contributed the most (Wang et al., 2014). A trend of geographical distribution of major fluorochemical manufacturing sites has shifted from Western Europe, USA, and Japan to the emerging economies in the Asia Pacific area over the past decades. This is especially true for China, which was the world's largest industrial contributor of PFOAs (50–80 t) and PFOS-related compounds (∼1800 t) in 2009 (Xie et al., 2013). PFOA- and PFOS-based products were added to the Catalogue for the Guidance of Industrial Structure Adjustment in China in 2011, and restricted elimination of PFOA/PFOS substances production were conducted. With a large quantity of PFAAs and their products manufacturing and consumption, China has become an emerging global contamination hotspot. In spite of several studies on atmospheric PFAAs levels having been conducted in a few cities (Liu et al., 2015) and point sources (Yao et al., 2016a; Tian et al., 2018b) in China, due to the imbalanced urbanization and industrialization levels, there is still a lack of systemic research on atmospheric PFAAs quantification and trends in China.
Additionally, long-range or mesoscale transport has also been suggested to contribute to PFAAs in the air (Dreyer et al., 2009; Cai et al., 2012a). In general, three pathways/hypotheses for the transport of PFAAs have been suggested: transport associated with particles, degradation from precursors, and sea salts from current bursting in coastal areas. The PFAAs precursors such as fluorotelomer alcohols (FTOHs), which can form the corresponding PFAAs through oxidation reactions initiated by hydroxyl radicals (OH•) in the atmosphere (Thackray and Selin, 2017), are more volatile than PFAAs and can reach remote areas via long-range transport (Martin et al., 2006; Wang et al., 2018). Due to the lower acid dissociation coefficient (pKA), 0–3.8 for PFCAs and −3.3 for PFSAs, PFAAs are expected to be mainly associated with aerosols in the non-volatile anionic form (Lai et al., 2018; Karásková et al., 2018). However, recent field studies have confirmed their occurrence in gaseous phase (Rauert et al., 2018; Ahrens et al., 2013); e.g., Fang et al. (2018) found the total concentrations of C2 and C4–C10 PFCAs and C6 and C8 PFSAs in the gas phase to be 0.076–4.0 pg m−3 in the air above the Bohai and Yellow seas, China. Investigating the transport pathways of PFAAs nationwide via an active air sampler (AAS) is challenging, due to its electric power supply requirement and high cost. Fortunately, a number of reports have shown that a sorbent-based passive air sampler (SIP–PAS) impregnated with XAD (a styrene–divinylbenzene copolymer), and XAD-based PAS (XAD–PAS) make an ideal alternative sampling tool for monitoring PFAAs in a wide region. Despite several publications suggested XAD–PAS collects primarily gaseous PFAAs in the environment (Melymuk et al., 2014; Lai et al., 2018), current findings are not consistent. Due to the unimpeded movements of particles into the sampler, XAD–PAS was indicated to collect a representative sample of both gas and particle phases (Ahrens et al., 2013; Okeme et al., 2016; Karásková et al., 2018). Moreover, the dominant sorbent for fluorinated compounds was reported as XAD resin in the XAD-impregnated SIP–PAS, instead of polyurethane foam (PUF) themselves (Krogseth et al., 2013). XAD–PAS give PFASs profiles that more closely resemble those from AAS in comparison with PUF–PAS, having sufficient uptake rates for the PFCAs and PFSAs to be deployed for a short duration (Lai et al., 2018).
Given the factors mentioned above, we conducted a nationwide survey of PFAAs in China at a provincial level using a XAD–PAS from January to December in 2017. The objective of this research was (1) to examine the spatiotemporal variations of PFAAs, and (2) to identify their potential affecting factors and evaluate the affecting pathways. To the best of our knowledge, this is the first research paper analyzing both a long-term and nationwide atmospheric PFAAs data set complemented by a comprehensive investigation in China.
2.1 Chemicals and reagents
The PFAAs standards used were Wellington Laboratories (Guelph, ON, Canada) PFAC–MXB standard materials, including C5–C14 PFCAs analogues (perfluoropentanoic acid, PFPeA; perfluorohexanoic acid, PFHxA; perfluoroheptanoic acid, PFHpA; PFOA; perfluorononanoic acid, PFNA; perfluorodecanoic acid, PFDA; perfluoroundecanoic acid, PFUdA; perfluorododecanoic acid, PFDoA; perfluorotridecanoic acid, PFTrDA; and perfluorotetradecanoic acid, PFTeDA), as well as C4, C6, and C8 PFSAs analogues (perfluorobutane sulfonic acid, PFBS; PFHxS; and PFOS). The mass-labeled 1,2–13C2–PFHxA, 1,2,3,4–13C4–PFOA, 1,2,3,4,5–13C5–PFNA, 1,2–13C2–PFDA, 1,2–13C2–PFUdA, 1,2–13C2–PFDoA, 18O2–PFHxS, and 1,2,3,4–13C4–PFOS were used as internal standards (ISs, MPFAC–MXA, Wellington Laboratories Inc.) in high-performance liquid chromatography (HPLC) coupled with a tandem mass spectrometer (MS/MS). HPLC-grade reagents that were used include methanol, ethyl acetate, ammonia acetate, acetone, methylene dichloride, n-hexane, and Milli-Q water. Detailed sources of the target PFAAs and their ISs are listed in Table S1 in the Supplement.
2.2 Sample collection
Sampling campaigns were carried out at 23 different provinces/municipalities/autonomous regions in China simultaneously from January to December 2017, of which 20 were urban sites and 3 were rural sites (Zhejiang, Shanxi, and Liaoning). Urban samples typically came from urban residential areas, and the rural samples were obtained from villages. These sampling sites were divided into seven administrative divisions: northern China (NC, n=3 sites), southern China (SC, n=2), central China (CC, n=3), eastern China (EC, n=7), north-western China (NW, n=3), north-eastern China (NE, n=2), and south-western China (SW, n=3). A geographical map of the sampling sites is displayed in Fig. S1 in the Supplement, and the detailed information on sampling sites such as elevation, meteorological parameters, local resident population, and gross domestic product were listed in Table S2 and Fig. S1.
Samples were collected with Amberlite XAD–2 resin using XAD–PAS, which have been successfully monitored PFCAs (C4–C16) and PFSAs (C4–C10) in the atmosphere (Krogseth et al., 2013; Armitage et al., 2013). Briefly, the mesh cylinder (length of 10 cm, internal diameter of 2 cm) was prebaked at 450 ∘C for 3 h, filled with ∼10 g XAD–2 resin, and capped with an aluminum cap. The particle size of XAD-2 is ∼ 20–60 mesh, with water content of 20–45 %, specific surface area of ≥430 m2 g−1, and reference adsorption capacity of ≥35 mg g−1. We should keep in mind that the unimpeded movement of particle-bound PFAAs would be captured during sampling using XAD–PAS, which cannot differentiate PFAAs between gas and particle phases. Despite some research suggest the sampling efficiency of gas- and particle-phase PFAAs were similar (Karásková et al., 2018). In the present study, the reported PFAAs sampled by XAD–PAS represent a combination of gaseous and particulate PFAA concentrations. The sampling program for each sample lasted approximately a month (30 d), and the error of the sampling time was controlled within 3 d. At the end of each deployment period, the atmosphere samples were retrieved, resealed in their original solvent-cleaned aluminum tins at the sampling location, and transported by express post to Shanghai Jiao Tong University. On receipt, they were stored and frozen (−20 ∘C) until extraction.
The sampling rate of XAD–PAS is a crucial factor to derive the chemical concentrations accumulated in the XAD resin. Ahrens et al. (2013) found that sampling rate of PFCAs and PFASs ranged from 1.80 to 5.50 m3 d−1 with XAD-impregnated sorbent, and the sampling rate increased as the carbon chain adding, while Karásková et al. (2018) suggested that the sampling rate of XAD–PAS of 0.21–15.00 m3 d−1 for PFAAs. The loss of depuration compounds could be used to calculate the sampling rate, assessing the impacts from meteorological factors like temperature and wind speed. According to Ahrens et al. (2013) the 1,2,3,4–13C4–PFOA was used to calculate the sampling rates of PFAAs at Shanghai sampling site (Shanghai Jiao Tong University) in the present study, by assessing 1,2,3,4–13C4–PFOA abundance loss. The specific description of the sampling rate calculation in this study is shown in Sect. S1 in the Supplement.
2.3 Sample preparation and instrument analysis
The sample preparation and analysis were according to the method described by previous research (Liu et al., 2015; Tian et al., 2018b). The MPFAC–MXA ISs mixture surrogates (10 ng) were added to each spiked sample prior to extraction. This was done to account for the loss of substances from the samples associated with instrument instability caused by the changes in laboratory environmental conditions. The XAD resin samples were Soxhlet-extracted for 24 h using a Soxhlet extraction system, with n-hexane: acetone (1 : 1, V : V) as a solvent in a 300 mL polypropylene (PP) bottle, following extracted with methanol for 4 h. These two extracts were combined and reduced to ∼5 mL via a rotary evaporator (RE–52AA, Yarong Biochemical Instrument Inc., Shanghai, China) at a temperature below 35 ∘C, and then transferred to a 10 mL PP tube for centrifugation (10 min, 8000 rpm). The supernatant was transferred to another PP tube, filtered three times through a 0.22 µm nylon filter, with an addition of 1 mL methanol each time. The extracts were further condensed under a gentle stream of nitrogen (99.999 %, Shanghai Liquid Gas Cor.) at 35 ∘C to a final 200 µL for instrument analysis.
The separation and detection of PFAAs were performed using a HPLC system (Thermo Ultra 3000+, Thermo Scientific, USA) coupled with a triple quadrupole negative electrospray ionization MS/MS (Thermo API 3000, Thermo Scientific, USA). An Agilent Eclipse XDB C18 (3.5 µm, 2.1 mm, 150 mm) was used to separate the desorbed substances. The column temperature was set to 40 ∘C, and the flow rate was 0.30 mL min−1. The injection volume was 20 µL. The gradient elution program of the mobile-phase A (5 mmol L−1 aqueous ammonium acetate) and B (methanol) was 80 % A + 20 % B at the start, 5 % A + 95 % B at 8 min, 100 % A at 13 min, 80 % A + 20 % B at 14 min, and was maintained for 6 min. The MS/MS was operated in a negative ion scan and multiple reaction monitoring (MRM) mode, and the electrospray voltage was set to 4500 V. The ion source temperature was 450 ∘C. The flow rates of the atomization gas and air curtain gas was 10 and 9 L min−1, respectively. Species identification was achieved by comparing the mass spectra and retention time of the chromatographic peaks with the corresponding authentic standards.
2.4 Quality assurance and quality control
To avoid exogenous contamination, the XAD–2 resin was precleaned using a Soxhlet extraction system with acetone and petroleum ether at extraction times of 24 and 4 h, respectively. The extracted XAD resin was dried under a vacuum desiccator, wrapped in an aluminum foil and ziplock bags, and stored at −20 ∘C to avoid contamination. All laboratory vessels were PP, and these vessels were washed with ultrapure water and methanol three times, respectively.
For quantification, six-point calibration curves of PFAAs were constructed by adopting different calibration solutions with values of 1, 3, 6, 15, 30, and 60 ng mL−1. The same concentration for the internal calibration (10 ng mL−1) was used for each level of the calibration solution. Recovery standards were added to each of the samples to monitor procedural performance, and the mean spiked PFAAs recoveries ranged from 81 ±25 % to 108 ± 22 %. All the analyzed PFAAs were normalized against the recovery of the corresponding mass-labeled ISs. Field blanks were prepared at all sampling sites, transported, and analyzed in the same way as the samples. Laboratory blanks were obtained by taking amounts of solvent via extraction, cleanup, and analysis. A total of 8 field blanks and 26 laboratory blanks were analyzed, with individual blank values of BDL (below detection limit) to 1.12 pg m−3 and BDL to 1.29 pg m−3, respectively. All the results were corrected according to the blank and recovery results. The method detection limit (MDL) was derived from 3 times standard deviation of the field blank values. The limit of detection (LOD) and the limit of quantification (LOQ) were determined as a signal-to-noise ratio of 3:1 and 10:1, respectively (Rauert et al., 2018; Liu et al., 2015). To convert MDLs, LODs and LOQs values to pg m−3, the mean volume of sampling air (m3) was applied. For the analytes that were not detected or were below the LOQs in field blanks, MDLs were derived directly from 3 times the corresponding LODs. More-detailed information on the individual compounds of PFASs on MDL, LOD, LOQ, the recovery values, and blank values are listed in Table S3.
2.5 Statistical and geostatistical analysis
Statistical analyses were carried out by SPSS Statistics 22 (IBM Inc. USA), and the values of 1∕2 MDL were used to replace these measured results of BDL. The statistics figures were depicted using technical software of SigmaPlot 14.0 (Systat Software, USA), and the geographical variations of atmospheric PFAAs were analyzed with ArcGIS 10.4 (ESRI, USA). The Hybrid Single-Particle Lagrangian Integrated Trajectory (Hysplit) back trajectory model (NOAA, USA) was used to study the long-range transport of air masses in the sampling locations (Zhen et al., 2014). Positive matrix factorization (PMF) is considered an advanced algorithm among various receptor models, which has been successfully applied for source identification of environmental pollutants (Han et al., 2018, 2019). PMF (5.0, US EPA) was adopted to cluster the PFAAs with similar behaviors to identify potential sources, and a more-detailed description of PMF can be seen in Sect. S2.
3.1 Abundances and compositions
The descriptive statistics of all targeted atmosphere PFAAs (n=268) are presented in Tables 1 and S4. The total concentrations of Σ13 PFAAs analogues varied between 6.19 and 292.57 pg m−3, with an average value of 39.84±28.08 pg m−3. The commonly concerned PFCAs analogues (C5–C14) occupied 79.6 % of the total PFAAs, at a level of 4.50–247.23 pg m−3, whereas the PFSAs concentrations were 1.04–42.61 pg m−3. The long-chain PFCAs concentrations were 17.96±13.71 pg m−3, which were significantly higher than the short-chain concentrations (13.74±12.19 pg m−3; p<0.05). Similarly, a recent PFAAs measurement conducted in a landfill environment in Tianjin, China (Tian et al., 2018b), found the long-chain PFCAs were much higher than the short species. Specifically, PFOA was the dominant PFAA (accounting 20.6 %), and was detected in all atmospheric samples with an average value of 8.19±8.03 pg m−3. This phenomenon could occur since PFOA is widely used in the manufacturing of polytetrafluoroethylene (PTFE), perfluorinated ethylene propolymer (FEP), and perfluoroalkoxy polymers (PFA; Wang et al., 2014). The domestic demand for and the industrial production of PFOA-based products have been increasing in China since the late 1990s (Wang et al., 2014), and direct emissions of perfluorooctane sulfonamide (FOSA)-based products may contribute to the relative high level of PFOA. Meanwhile, one major variation of a PFOA precursor, 8:2 FTOH, was reported to rank as the highest concentration among neural PFASs in the air of China (De Silva, 2004; Martin et al., 2006). Along the PFAA composition profile, it was followed by PFHxA, PFOS, and PFPeA, with mean concentrations of 5.36, 5.20, and 4.95 pg m−3, respectively. The detection frequencies of PFCAs decreased gradually as the carbon chain length increased; for instance, the PFPeA and PFTrDA were detected in 84.8 % and 37.3 %, respectively.
Compared with other gaseous PFAAs measurements, Liu et al. (2015) reported that PFAAs in the urban atmosphere sampled with XAD-containing sorbent in Shenzhen in China was 15±8.8 pg m−3, which contributed to nearly half of this study. Wong et al. (2018) found much lower PFAAs levels in the remote Arctic area than those found in this study, with a mean value of 1.95 pg m−3. This study found generally higher PFAAs abundances compared to measurements in Canada (Gewurtz et al., 2013), which may be attributed to the relative high abundance of industrial and domestic emissions in China. However, the PFAA concentrations in urban/rural areas in this study were far lower than the measurements at point sources, for example, a landfill environment (Tian et al., 2018b; 360–820 pg m−3) and fluorochemical manufacturing facility (Chen et al., 2018; 4900±4200 pg m−3), suggesting that PFAAs were susceptible to being affected by local source emissions. Although there existed inherent differences of PFAAs levels between regions, the impacts from differences in sampling techniques and sorbents between XAD–PAS and SIP–PAS could not be neglected. As indicated by previous research, XAD has much higher sorptive capacity of PFASs than PUF, and wind speed and temperature displayed different degrees of impact on their sampling capacity among different regions. Additionally, UV radiation has the potential to degrade PFAAs due to O3, OH•, and other atmospheric oxidants during sampling.
Table 1Comparison of PFAAs levels in the present research with measurements in other areas (pg m−3).
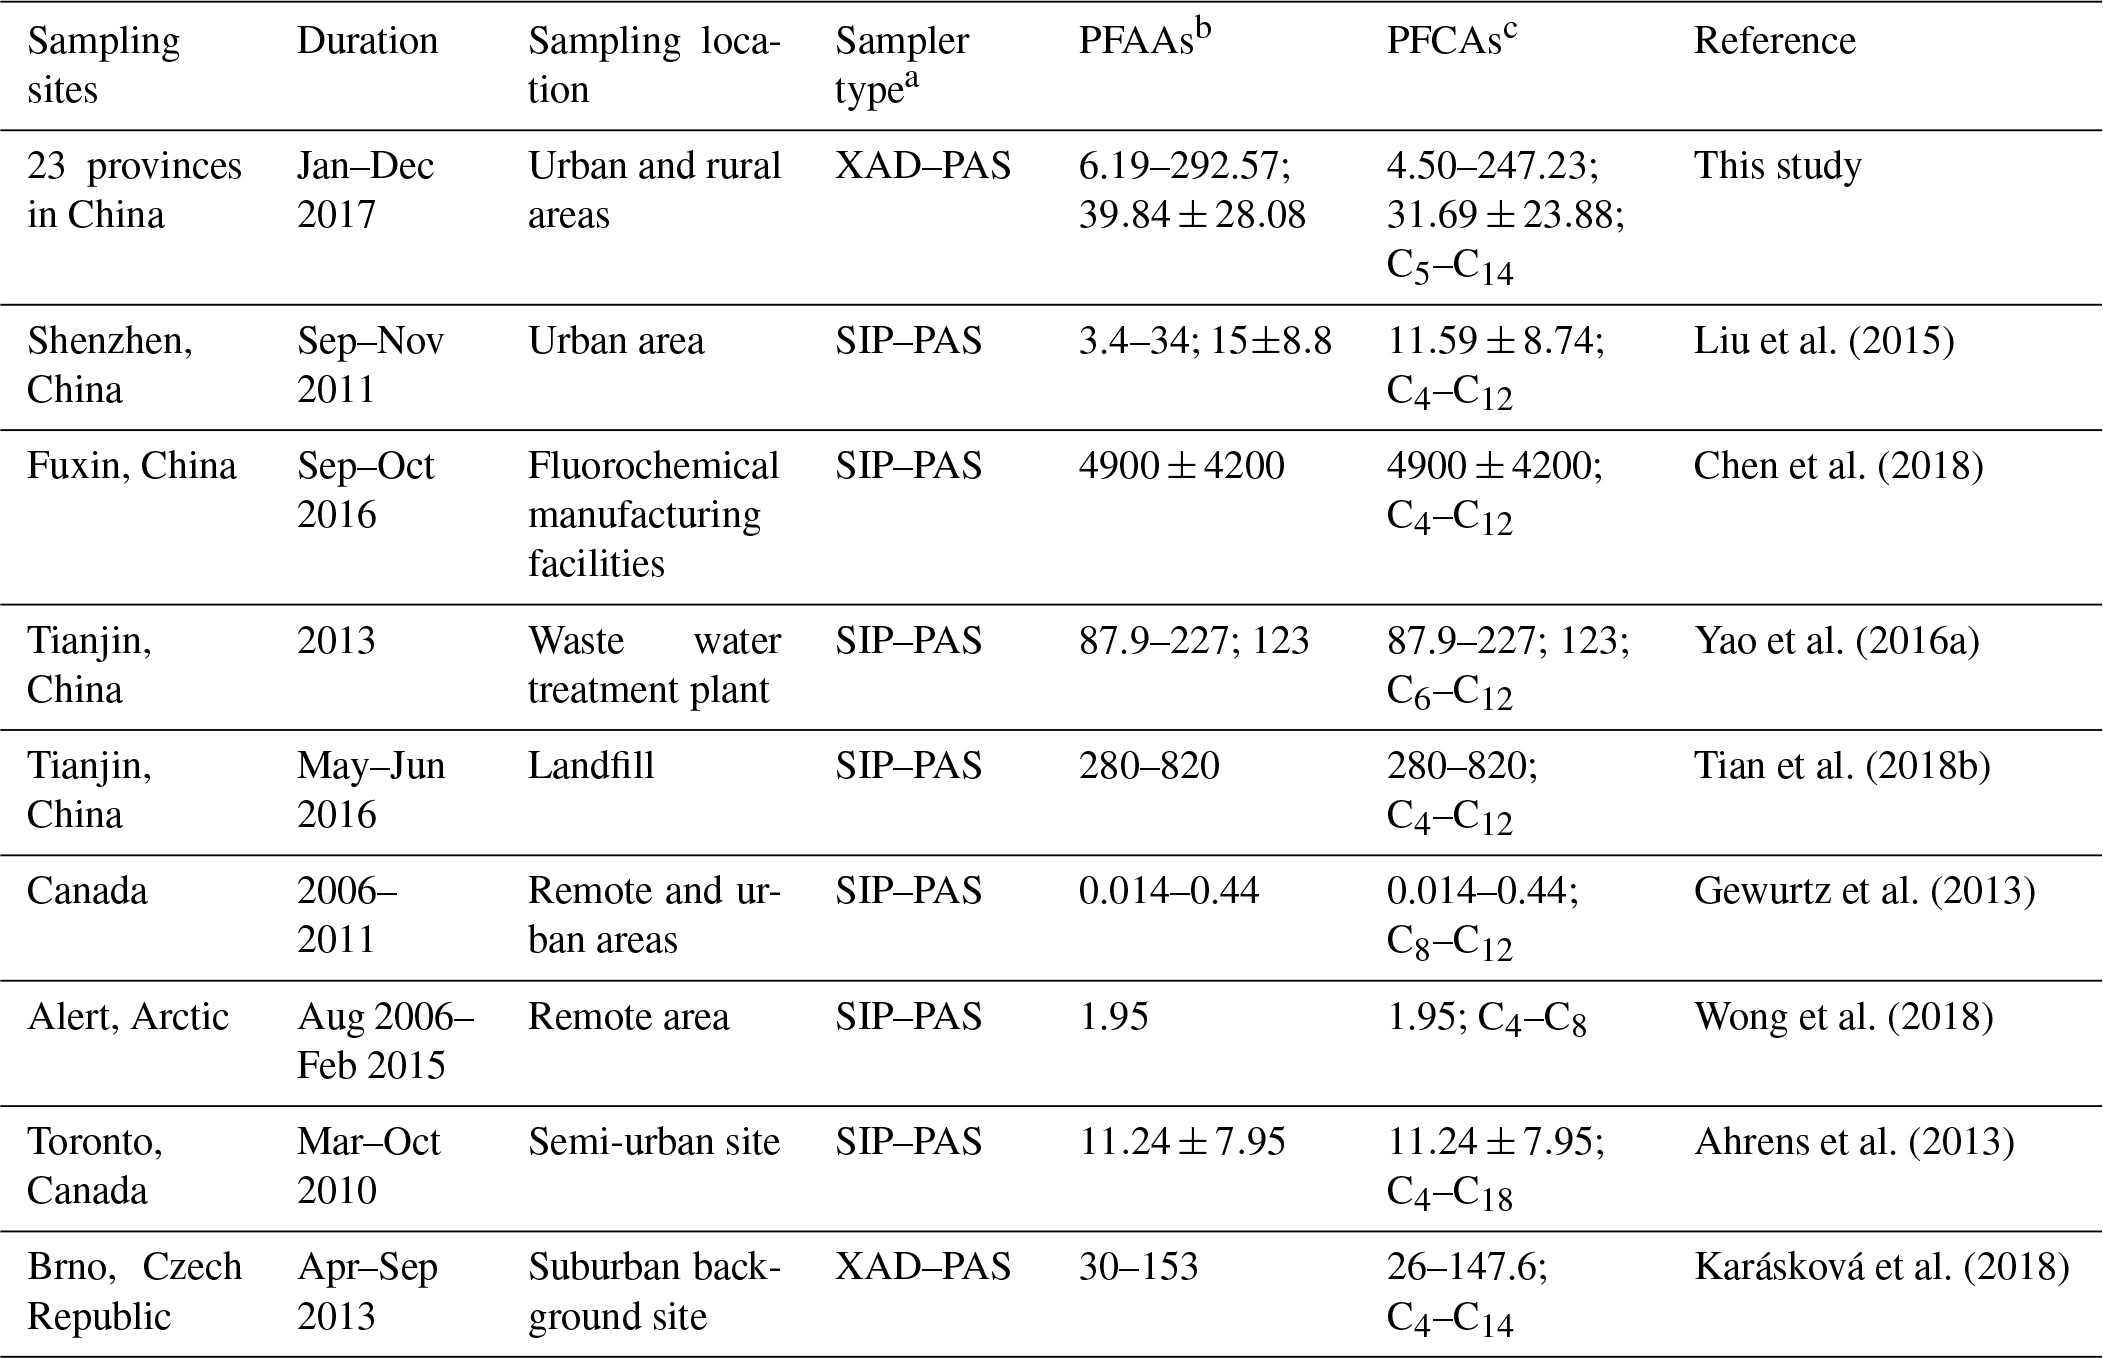
a SIP–PAS represent XAD-impregnated PUF sorbent-based PAS, which is composed of PUF, mashed XAD-4, and PUF; b represent the total concentration ranges of PFCAs and PFSAs; mean concentrations of the total PFCAs and PFSAs; c represent concentration range; mean value; carbon length of PFCAs.
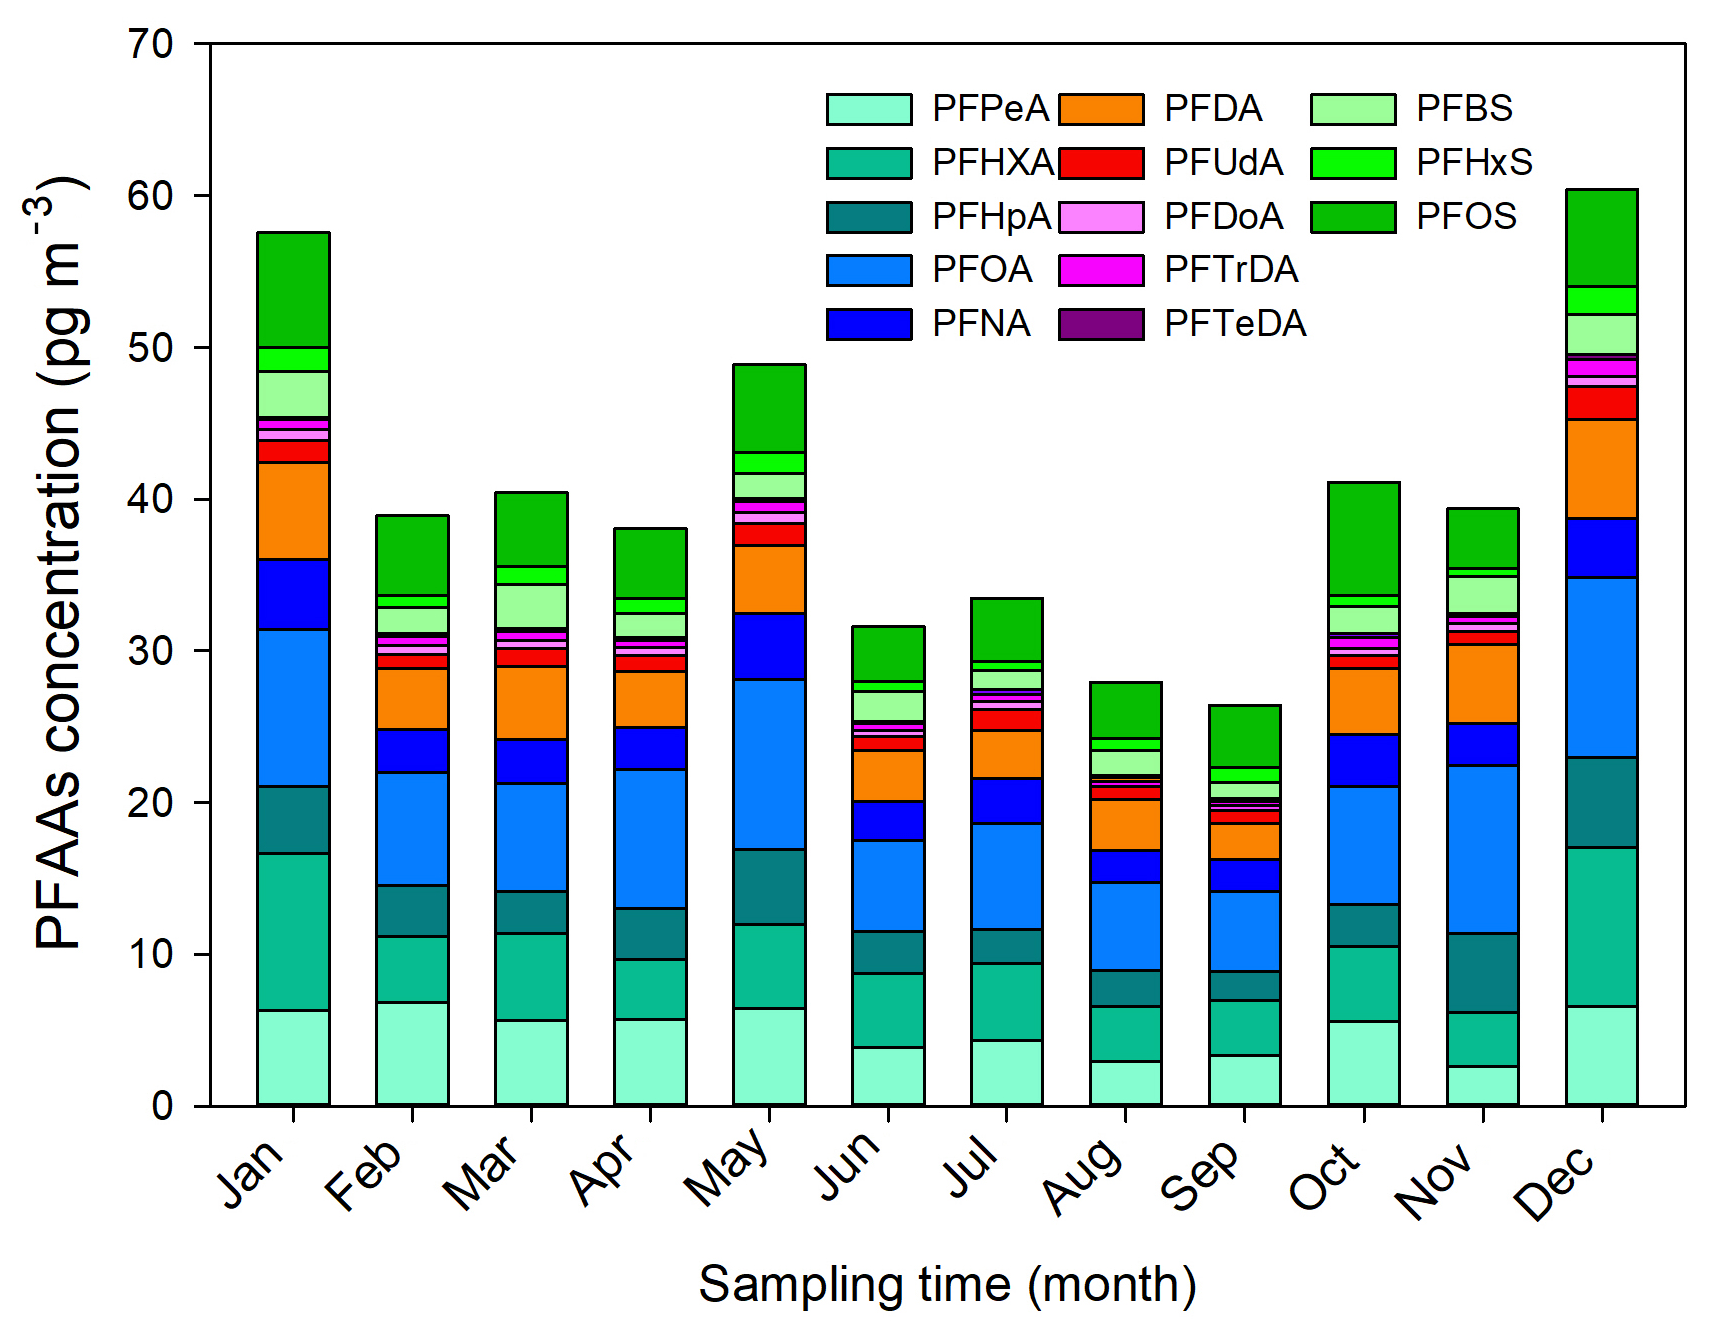
3.2 Temporal variations
Monthly and seasonal variations of the mean PFAA concentrations are depicted in Fig. 1. In general, an increasing seasonal mean of PFAA concentrations from 23 sampling sites existed for summer (31.35 pg m−3) < autumn (35.63 pg m−3) < spring (42.40 pg m−3) < winter (52.83 pg m−3). The winter maxima abundance of PFAAs could be attributed to the stagnant atmospheric conditions, in which atmospheric contaminants were trapped in the air with a weak diluting effect. XAD–PAS showed similar efficiency of capturing gas- and particle-phase PFASs, while the unimpeded particle gathering efficiency is challenging to quantify. In addition, despite the increase in atmospheric oxidation of precursors in summer possibly leading to a rise in PFCAs (Li et al., 2011; Yao et al., 2016a), the abundant rainfall enhanced their scavenging activities (Table S5), ultimately leading to relatively low concentrations of PFAAs in the summer. Specifically, the PFAAs showed much higher concentrations in spring than other seasons in Shanghai, which was different from Tianjin and Xinjiang (Fig. S2). An extremely high level of PFAAs of 135.51 pg m−3 occurred in November in Beijing, which was 2–4.5 times higher than in other months, indicating the potential point source of PFAAs contamination in this site. In fact, numerous fluoride-related products manufacturers were distributed in EC, NC (including Beijing), and CC areas; see detail in Fig. S3. As gaseous PFAAs measurements were majorly reported at a relative short time (several weeks to several months), it is somewhat difficult to compare their temporal trends.
Interestingly, the evolution of PFAAs showed dramatic monthly variation, and the monthly mean levels varied from 25.92 to 60.57 pg m−3, with the lowest and the highest abundances being present in September and December, respectively. For the specific composition profile of PFAAs, the average concentrations of PFOA, PFHxA, PFPeA, and PFOS were 10.36, 8.42, 6.55, and 6.44 pg m−3 in winter, respectively, which were nearly 2 times higher than in the summer. The seasonal variation trend of PFOS was summer < spring ≈ autumn < winter, while PFNA appeared to show winter maxima with concentrations 4 and 3 times higher than in the summer and spring, respectively. However, Wong et al. (2018) reported that PFBS showed the maximal value in winter but found no consistent seasonality for PFOS in the Arctic area. The differences may be explained as the PFAAs in the air of the remote Arctic area originating from long-range transport and volatilization from snow or sea, but they were not affected by local direct anthropogenic emissions.
3.3 Geographical distributions
Due to the stark differences in topography and socioeconomic development of Chinese provinces, municipalities, and autonomous regions, as well as the enormous differences in industrialization and emissions, PFAAs showed significantly different distribution patterns in China (Fig. 2). Overall, the predominant declining gradient of PFAAs' contents was CC > NC > EC > NE > SW > NW > SC areas in China, which was similar to previous research that the outdoor dust-bounded PFAAs were relatively enriched in the eastern part of mainland China (Yao et al., 2016b). This trend was not surprising since numerous PFAA-related photoelectric, chemical, and mechanical industries are dispersed across the CC, EC, and NC areas, e.g., Shanghai, Zhejiang, Fujian, Henan, and Jiangsu. As expected, the western mountain and highland areas, e.g., Xinjiang and Yunnan (20.88 pg m−3), with relatively low population densities and high latitudes, displayed significantly lower PFAA concentrations. It was reported that high orographic conditions have a cold trapping effect on atmospheric PFASs, and the transport of PFAAs involving particles (or not) should be dramatically reduced (Konstantinos et al., 2010; Yao et al., 2016a). Given that altitudes increase gradually from several meters in EC, NC and SC coastal areas to nearly 2000 m in SW and NW highland regions in China, the high-altitude blocking effect on atmospheric PFAAs transport should not be neglected.
The annual average concentrations of PFAAs at the provincial level ranged from 12.38 pg m−3 in Xinjiang to 90.88 pg m−3 in Henan, and the composition patterns varied widely. Henan contributed the largest proportion of PFAAs in China, and showed the highest PFOA level (19.07 pg m−3), which is a typical, heavily industrialized province characterized by textile treatments, metal plating, and firefighting foam manufacturing, and a large amount of PFAAs emulsifier fluoropolymers have been used in industrial production. Special attention should be paid to Zhejiang, the level of which (61.68 pg m−3) ranked second in PFAAs abundances in spite of its sampling site being located in a village. As well as this, several painting–packaging plants, mechanical plants, and electrical equipment manufacturers were dispersed around this sampling site (see Fig. S4), which would contribute to the PFAAs variations in this site. In fact, the GDP of Zhejiang ranked fourth in China, specializing in mechanical manufacture, textiles, and the chemical industry. Moreover, the top six sites with abundant of PFAAs were located in the most economically developed and populated areas (the Yangtze River delta area, the “Circum-Bohai Sea region”), and in rapidly developing regions (Henan, Sichuan) in China. In line with this result, a sampling campaign conducted in Asia, including 18 sites in China, found very high levels of PFAAs precursors (8:2 FTOH, 10:2 FTOH) existing in Beijing, Tianjin, and Zhejiang (Li et al., 2011). But meanwhile we should keep in mind that the production of PFCAs in the atmosphere from gaseous precursors degradation may be impaired in urban areas, due to the high abundance of NOx compete for OH• radicals.
Furthermore, PFOA concentrations were apparently high in Henan, Zhejiang, Beijing, Tianjin, and Hubei, where mean values ranged from 11.65 to 19.14 pg m−3 compared with in other provinces (2.93 to 8.54 pg m−3). PFOA and PFOA-related products have not been banned for use in various industrial and domestic applications (Konstantinos et al., 2010; Wang et al., 2014), which were manufactured and used extensively in EC and NC areas. However, the highest concentration of PFOS was found in Zhejiang (14.13 pg m−3), which may be affected by local manufacturing of PFOS-based products, e.g., leather, paper, and metal plating. It was followed by Beijing (8.98 pg m−3) and Fujian (9.09 pg m−3), while Xinjiang and Yunnan shared the lowest levels (1.20–3.57 pg m−3). These spatial variation patterns of PFOS in the present study matched well with a previous national survey that found most facilities producing PFOS and its derivatives in China are situated in the EC, CC, and NC areas, with emission densities ranging from 1 to 500 g (km2 a)−1 (Konstantinos et al., 2010; Wang et al., 2014).
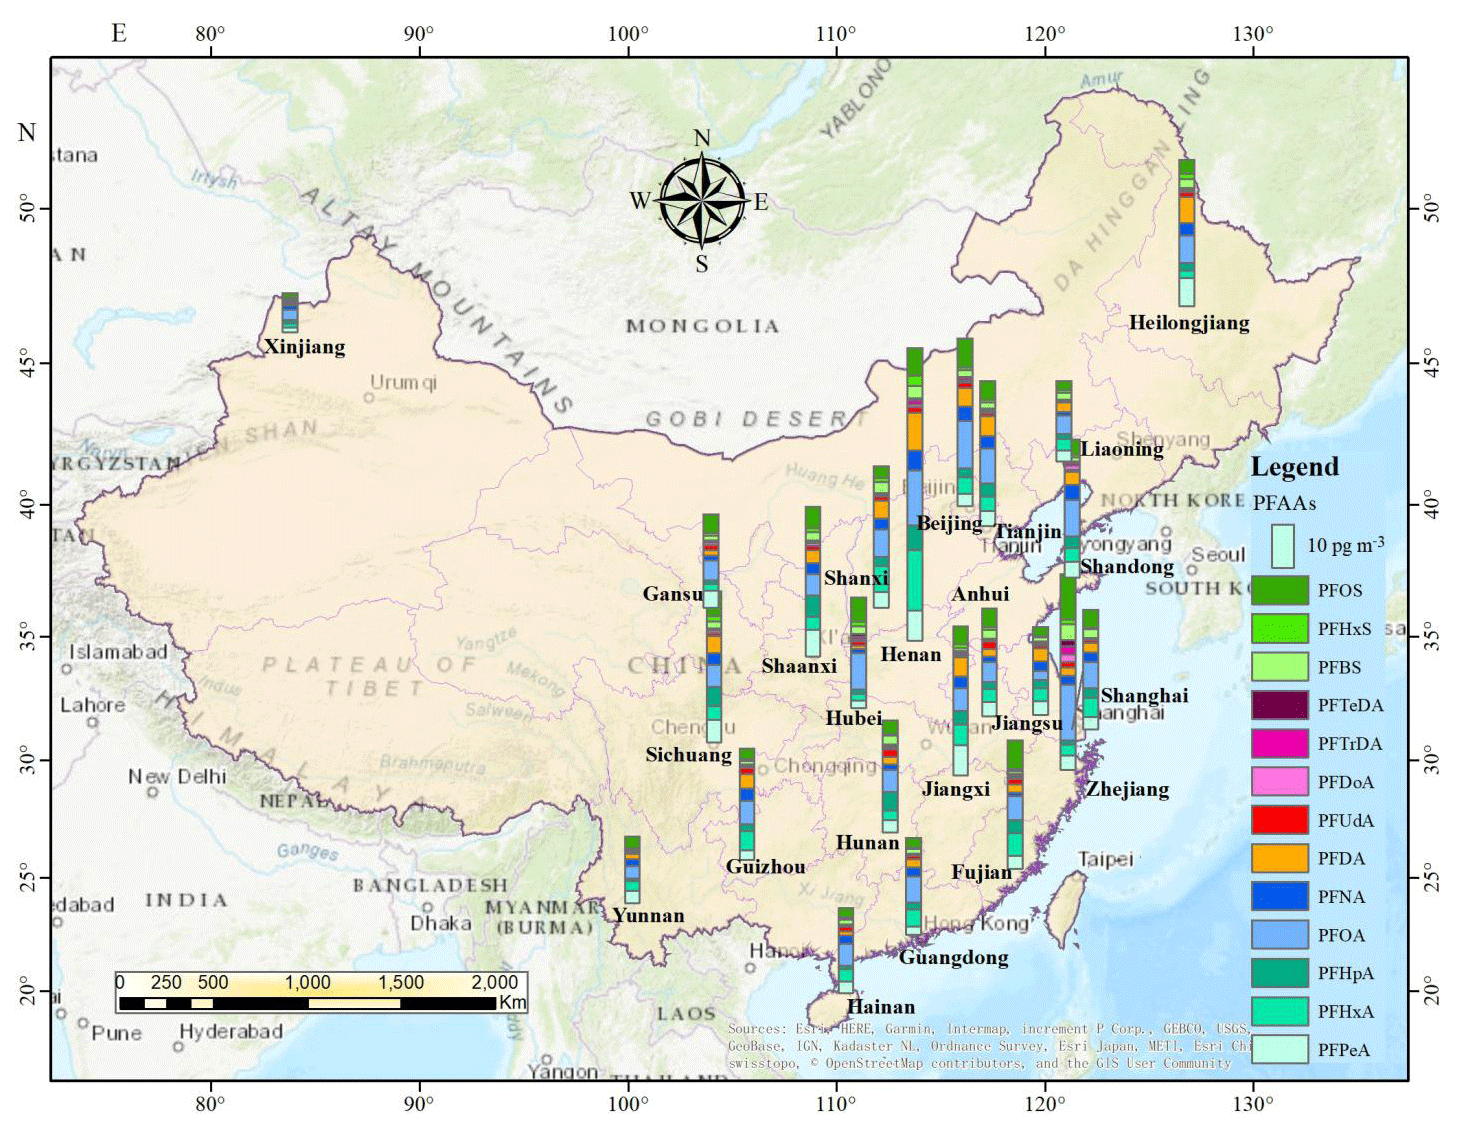
Figure 2The spatial distributions of PFAAs in the study area (annual average of PFAAs, created by ArcGIS 10.4). © OpenStreetMap contributors 2019. Distributed under a Creative Commons BY-SA License.
3.4 Geographical distribution of transport pathways
The PFAAs variations in the atmosphere depended on their local source emissions as well as regional atmosphere transport. In order to give readers a direct impression of factors affecting the geographical variations of PFAAs in China, here we analyzed PFAAs variations along three pathway transects and one coastal line to determine how PFAAs distribute spatially.
As shown in Fig. 3a, PFAA concentrations were enriched in south-eastern areas (40.58–47.17 pg m−3) at low altitudes (2–30 m), but relatively low abundances (12.31–29.44 pg m−3) existed in north-western China (397–1517 m in altitude). As discussed above, the EC areas (e.g., Fujian) were the most intensively industrialized regions, and direct emissions from PFAAs manufacturing processes could have enhanced their atmospheric abundances. However, the high altitudes existing in NW areas could have a blocking effect on the transport of PFAAs from eastern polluted areas.
In terms of the SW–NE transect (Fig. 3b), Yunnan and Liaoning showed much lower PFAA concentrations (20.88 and 24.99 pg m−3) than other areas (44.76–52.58 pg m−3). Notably, a steady increasing trend of PFAA concentrations existed across the W–E transect (Fig. 3c), which escalated from 20.88 pg m−3 in Yunnan to 61.68 pg m−3 in Zhejiang. The composition profiles of PFAAs along this transect differed from each other; for instance, PFOA occupied 28.5 % of the total PFAAs in Zhejiang, while it only accounted for 15.6–21.8 % in other areas. Note that PFAAs released from point sources would be eliminated by deposition, degradation, or dilution during transport in the atmosphere; e.g., PFOA decreased by ∼90 % within 5 km of its point source (Chen et al., 2018). However, the long-range transport of PFAAs bounded with particles also have been explored in previous research (Pickard et al., 2018). As illustrated in Fig. S5, the 48 h back trajectories were generally associated with air masses originating from the surrounding areas of the sampling locations, and these trajectories overlapped with urban areas in Zhejiang, Jiangxi, and Shanghai, which confirmed that the air mass origins were a driving factor in PFAAs variation.
Interestingly, with the exclusion of the site directly affected by surrounding sources in Zhejiang, PFAAs were rather uniformly distributed among the coastal areas, with concentrations ranging from 24.92 to 45.76 pg m−3 (Fig. 3d). Excluding industrial and domestic emissions, as well as secondary formation, PFAA-containing sea spray aerosols could contribute to the variations of PFAAs in the coastal atmosphere (Cai et al., 2012b; Pickard et al., 2018).
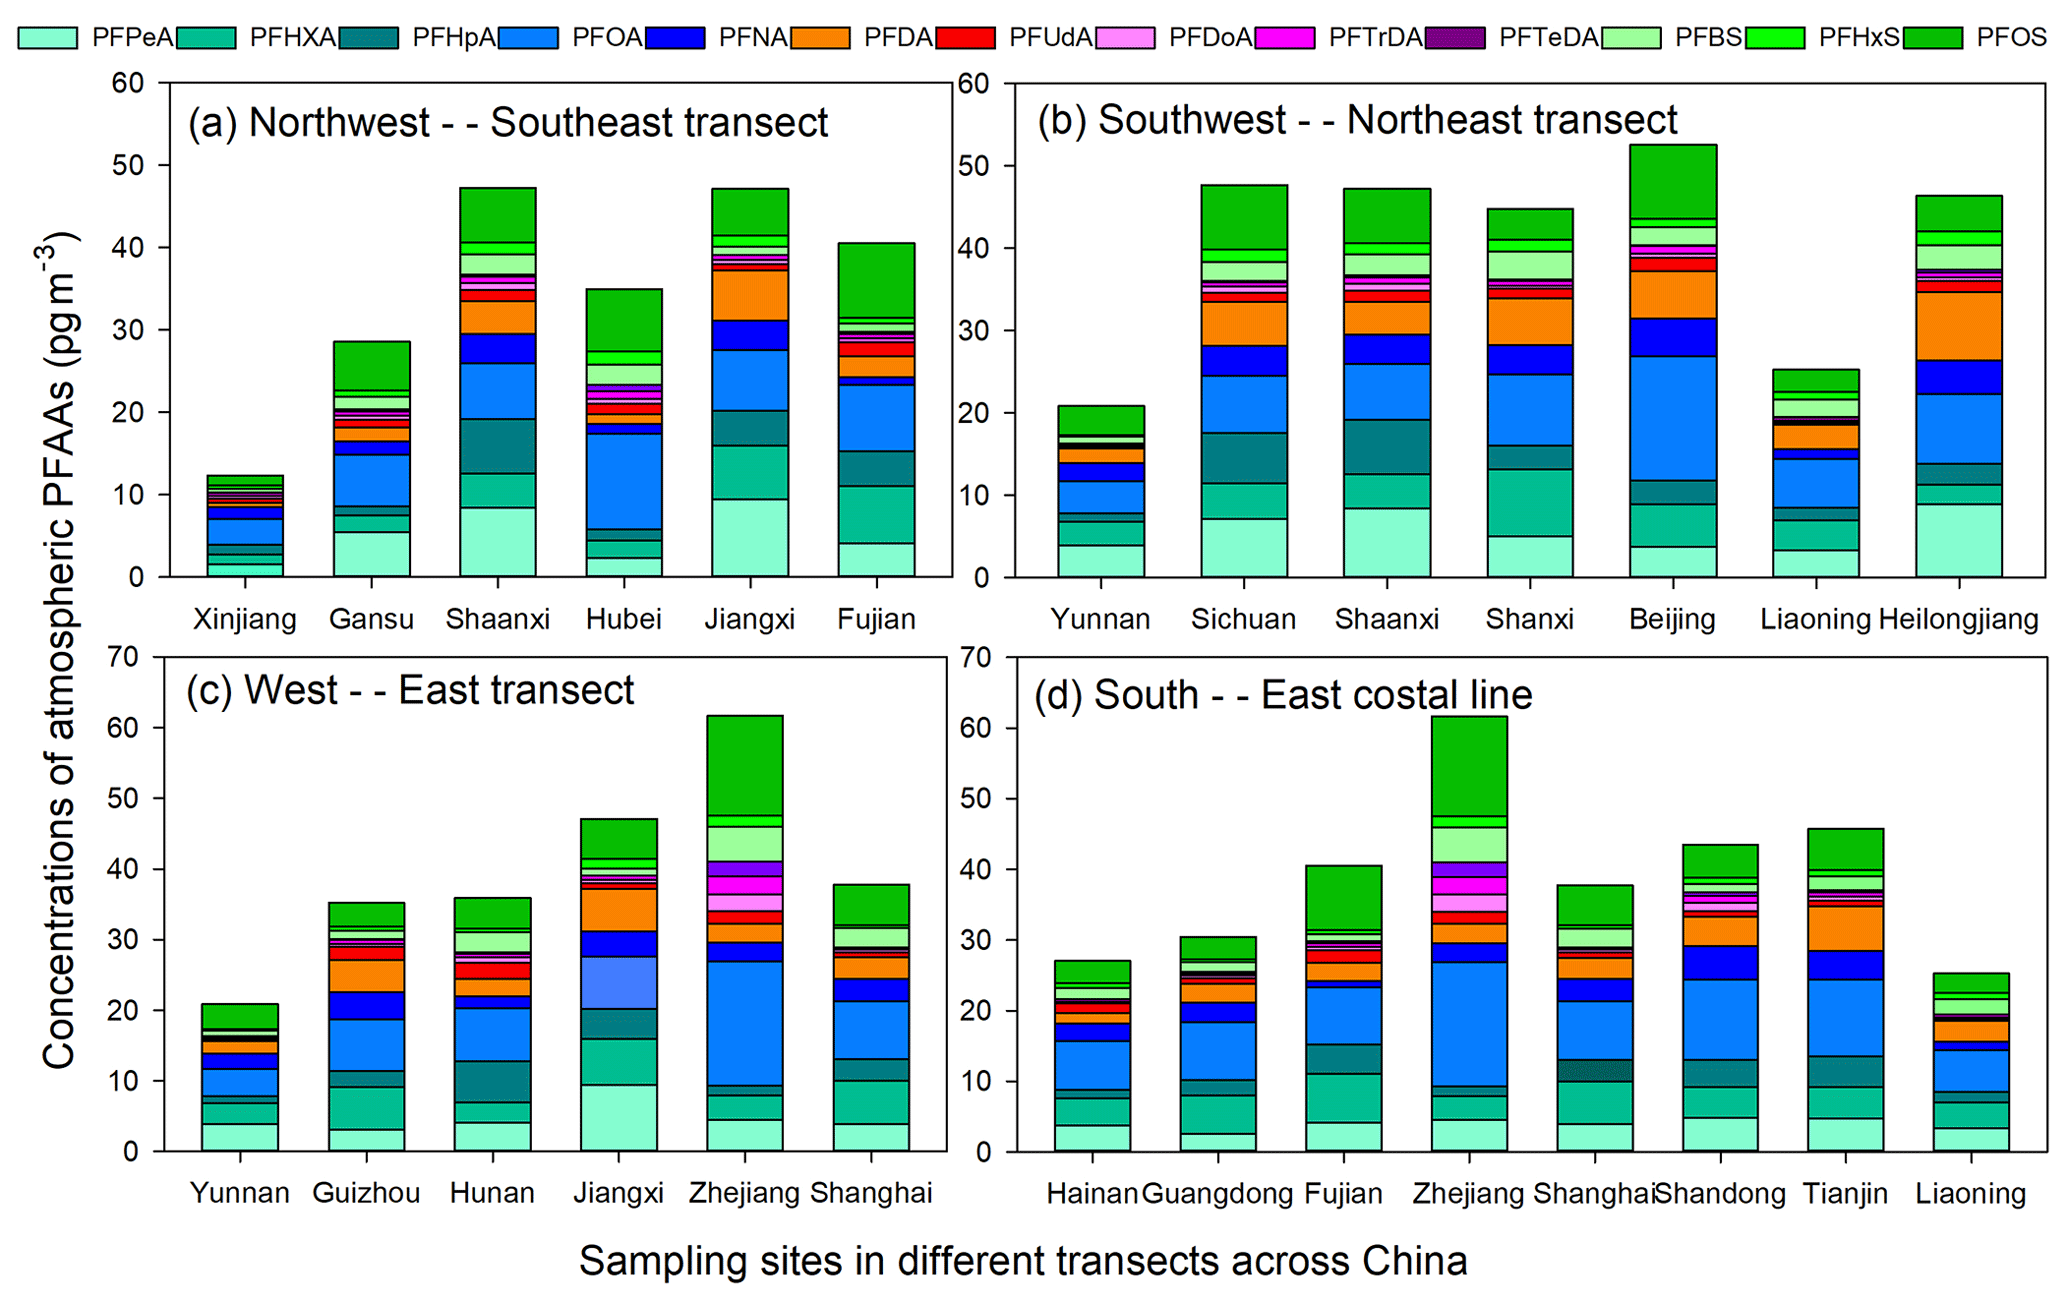
Figure 3Transects of PFAA concentrations across three different directions and one coastal line.
3.5 Source identification
Understanding the sources of PFAAs and their corresponding importance would enable elucidation of the levels of PFAAs in the environment. As discussed above, the observations from spatiotemporal variations of PFAAs suggest that several factors may have a combined effect on the variations of PFAAs. Hence, a PMF model was adopted to extract the potential factors affecting PFAAs variations, and four sources were extracted in this study (see Fig. 4).
High percentages (∼90.0 %) of PFPeA and PFBS were found in factor 1, and were moderately loaded with PFOS (62.6 %). Three major types of PFOS-related chemicals, namely PFOS salts, substances, and polymers, are used in industrial products in China (Xie et al., 2013). PFOS salts are usually used in metal plating, firefighting foams, and pesticides, while PFOS substances are adopted in paper treatment and the semiconductor industry. PFOS polymers are employed for textiles and leather treatment. These PFOS-related products would lead to direct emissions of PFOS during their industrial and domestic use. PFPeA and PFBS are the main substitutes for long-chain PFAAs in China, which can be released as impurities or by-products when manufacturing PFOS-based products (Liu et al., 2017). Hence, this factor was regarded as the direct source of PFOS-based products. This was consistent with the spatial observations that high PFOS concentrations were shown in Zhejiang, Fujian, Guangdong, and Shanghai, where manufacturing facilities are distributed.
Factor 2 was characterized by PFHxA, PFOA, PFNA, and PFDA, each representing over 60.0 % of their explained variations. Their rather strong positive correlations (r = 0.54–0.84, p<0.01) suggested that they may have originated from a similar source (Table S6). PFOA was considered as the marker for the emulsification of plastics, rubber products, flame retardants for textiles, paper surface treatments, firefighting foams, and PTFE emulsifiers (Liu et al., 2015; Konstantinos et al., 2010). It has been reported that there was an increase in PFCAs emissions at the manufacturing sites of PFOA-based products in China between 2002 and 2012 due to a rapid increase in domestic demand and production of PFOA-related products (Wang et al., 2014). PFNA and its derivatives have similar physicochemical properties to PFOA and its derivatives, and both can be emitted through exhaust gases. The PFNA-based production was found to be related to polyvinylidene fluoride (PVDF) production, and it has been suggested that PVDF production increased in China after 2008 (Wang et al., 2014). Therefore, factor 2 represents direct sources of PFOA- and PFNA-based products.
The composition of factor 3 was characterized by a high loading of PFHpA and PFHxS, with loading factor values of 84.9 % and 81.7 %, respectively. The historical production and uses of PFHpA and its derivatives remain unidentified. Factor with PFHxS alone did not indicate a specific source, so this factor may be classified as an unknown source, which may be affected by atmosphere air mass transport, sea aerosol bursting and/or other origins.
The final factor was dominated by PFUdA, PFDoA, PFTrDA, and PFTeDA, with loading factor values larger than 80 %. These long-chain PFAAs (C11–C14) analogues have been interpreted as degradation products of fluorotelomer-based products in previous research (Liu et al., 2017; Wang et al., 2014; Thackray and Selin, 2017). Based on life-cycle usage and release from fluorotelomer and other fluorinated products, the global cumulative estimation of PFUdA, PFDoA, PFTrDA, and PFTeDA from quantified sources was estimated to be 9–230 t in the period of 2003–2015, and projected to be between 0–84 t between 2016–2030 (Wang et al., 2014). It was reported that the manufacturing of fluorotelomer-based substances would increase in China. In addition, these four analogues showed apparent positive correlations to each other (r = 0.59–0.79, p<0.01). Thus, this factor was explained as the degradation products of fluorotelomer-based products, which could be proven by their higher abundances caused by an enhanced atmospheric oxidation ability in the summer than other seasons.
Direct emission sources, including PFOS-, PFOA-, and PFNA-based products, were estimated to represent 62.7 % of the total PFAAs sources. Indirect sources of degradation products of fluorotelomer-based products played a minor role, contributing 15.5 %, and there are 21.8 % of variance that could still not be explained and requires further detailed investigation. This source apportionment result was similar to one recent piece of research that found that industrial PFOA emissions were the major sources of atmospheric PFAAs in Shenzhen, China (Liu et al., 2015), and the long-distance transport of pollutants also made a contribution.

In the present study, PFAAs were ubiquitously detected in the atmosphere across China over the length of a year. Results indicated that the measured PFAAs in the present study were several times to several magnitudes higher than the levels conducted in most other urban locations, while far lower than the measurements implemented at point sources. Therein, the C5–C14 PFCAs analogues represented 79.6 % of the total PFAAs variations, and PFOA, PFHxA and PFOS ranked in the top three species. Additionally, much higher abundances of PFAAs existed in winter compared with in summer. In terms of spatial distribution, the PFAA concentrations were higher in central and eastern China, where dense residential and industrial manufacturing facilities were distributed. The combination of a correlation analysis, Hysplit back trajectories, and a PMF receptor model suggest that the direct sources of PFOS-, PFOA-, and PFNA-based products made a predominant contribution to variations in PFAAs, while indirect degradation played a minor role.
All data are available from the authors upon request by contacting Jinping Cheng (jpcheng@sjtu.edu.cn).
The supplement related to this article is available online at: https://doi.org/10.5194/acp-19-14107-2019-supplement.
DH, YM, and JC conceived the study and wrote the paper, DH, YZ, SL, XZ, and SF performed the measurements and collected data. All authors contributed to the data analysis and review of the paper.
The authors declare that they have no conflict of interest.
We thank Lei Ye (Xi'an University of Architecture and Technology), Fengxia Wang (Hainan University), Linrui Jia (Beijing Normal University), Songfeng Chu (Tongji University), and 18 other volunteers, for coordinating the sampling process and for their valuable contribution to field measurement. We appreciate senior engineer Xiaofang Hu (Instrumental Analysis Center, SESE, Shanghai Jiao Tong University) for her assistance in experimental analysis.
This research has been supported by the National Natural Science Foundation of China (grant nos. 21577090 and 21777094), the Post-Doctoral Innovative Talent Support Project of China (grant no. BX20190169), and the National Key Research & Development Plan (grant no. 2016YFC0200104).
This paper was edited by Ralf Ebinghaus and reviewed by two anonymous referees.
Ahrens, L., Harner, T., Shoeib, M., Koblizkova, M., and Reiner, E. J.: Characterization of Two Passive Air Samplers for Per- and Polyfluoroalkyl Substances, Environ. Sci. Technol., 47, 14024–14033, https://doi.org/10.1021/es4048945, 2013.
Armitage, J. M., Hayward, S. J., and Frank, W.: Modeling the Uptake of Neutral Organic Chemicals on XAD Passive Air Samplers under Variable Temperatures, External Wind Speeds and Ambient Air Concentrations (PAS-SIM), Environ. Sci. Technol., 47, 13546–13554, https://doi.org/10.1021/es402978a, 2013.
Baard Ingegerdsson, F., Line Sm. Stuen, H., Raymond, O., Hanne Line, D., Merete, H., Cathrine, T., Syvert, T., Georg, B., Paal, M., and Ellingsen, D. G.: Occupational exposure to airborne perfluorinated compounds during professional ski waxing, Environ. Sci. Technol., 44, 7723–7728, https://doi.org/10.1021/es102033k, 2010.
Buck, R. C., Franklin, J., Berger, U., Conder, J. M., Cousins, I. T., and Voogt, P. D.: Perfluoroalkyl and polyfluoroalkyl substances in the environment: terminology, classification, and origins, Int. Environ. Assess. Manag., 7, 513–541, https://doi.org/10.1002/ieam.258, 2011.
Cai, M., Xie, Z., Moeller, A., Yin, Z., Huang, P., Cai, M., Yang, H., Sturm, R., and He, J.: Polyfluorinated compounds in the atmosphere along a cruise pathway from the Japan Sea to the Arctic Ocean, Chemosphere, 87, 989–997, https://doi.org/10.1016/j.chemosphere.2011.11.010, 2012a.
Cai, M., Zheo, Z., Yin, Z., Ahrens, L., Huang, P., Cai, M., Yang, H., He, J., Sturm, R., Ebinghaus, R., and Xie, Z.: Occurrence of perfluoroalkyl compounds in surface waters from the North Pacific to the Arctic Ocean, Environ. Sci. Technol., 46, 661–668, https://doi.org/10.1021/es2026278, 2012b.
Cardenas, A., Gold, D. R., Hauser, R., Kleinman, K. P., Hivert, M. F., Calafat, A. M., Ye, X., Webster, T. F., Horton, E. S., and Oken, E.: Plasma Concentrations of Per- and Polyfluoroalkyl Substances at Baseline and Associations with Glycemic Indicators and Diabetes Incidence among High-Risk Adults in the Diabetes Prevention Program Trial, Environ. Health Persp., 125, 107001, https://doi.org/10.1289/EHP1612, 2017.
Chen, H., Yao, Y., Zhao, Z., Wang, Y., Wang, Q., Ren, C., Wang, B., Sun, H., Alder, A. C., and Kannan, K.: Multimedia Distribution and Transfer of Per- and Polyfluoroalkyl Substances (PFASs) Surrounding Two Fluorochemical Manufacturing Facilities in Fuxin, China, Environ. Sci. Technol., 52, 8263–8271, https://doi.org/10.1021/acs.est.8b00544, 2018.
De Silva, A. O.: Degradation of fluorotelomer alcohols: a likely atmospheric source of perfluorinated carboxylic acids, Environ. Sci. Technol., 38, 3316–33121, https://doi.org/10.1021/es049860w, 2004.
Dreyer, A., Weinberg, I., Temme, C., and Ebinghaus, R.: Polyfluorinated Compounds in the Atmosphere of the Atlantic and Southern Oceans: Evidence for a Global Distribution, Environ. Sci. Technol., 43, 6507–6514, https://doi.org/10.1021/es9010465, 2009.
Fang, X., Wang, Q., Zhao, Z., Tang, J., Tian, C., Yao, Y., Yu, J., and Sun, H.: Distribution and dry deposition of alternative and legacy perfluoroalkyl and polyfluoroalkyl substances in the air above the Bohai and Yellow Seas, China, Atmos. Environ., 192, 128–135, https://doi.org/10.1016/j.atmosenv.2018.08.052, 2018.
Gewurtz, S. B., Backus, S. M., Silva, A. O., De, Lutz, A., Alain, A., Marlene, E., Susan, F., Melissa, G., Paula, G., and Tom, H.: Perfluoroalkyl acids in the Canadian environment: multi-media assessment of current status and trends, Environ. Int., 59, 183–200, https://doi.org/10.1016/j.envint.2013.05.008, 2013.
Han, D., Fu, Q., Gao, S., Li, L., Ma, Y., Qiao, L., Xu, H., Liang, S., Cheng, P., Chen, X., Zhou, Y., Yu, J. Z., and Cheng, J.: Non-polar organic compounds in autumn and winter aerosols in a typical city of eastern China: size distribution and impact of gas-particle partitioning on PM2.5 source apportionment, Atmos. Chem. Phys., 18, 9375–9391, https://doi.org/10.5194/acp-18-9375-2018, 2018.
Han, D., Fu, Q., Gao, S., Zhang, X., Feng, J., Chen, X., Huang, X., Liao, H., Cheng, J., and Wang, W.: Investigate the impact of local iron–steel industrial emission on atmospheric mercury concentration in Yangtze River Delta, China, Environ. Sci. Pollut. R., 26, 5862–5872, https://doi.org/10.1007/s11356-018-3978-7, 2019.
Hu, X. C., Andrews, D. Q., and Lindstrom, A. B.: Detection of Poly- and Perfluoroalkyl Substances (PFASs)in U.S. Drinking Water Linked to Industrial Sites, Military Fire TrainingAreas, and Wastewater Treatment Plants, Environ. Sci. Tech. Let., 3, 344–350, https://doi.org/10.1021/acs.estlett.6b00260, 2016.
Jian, J. M., Guo, Y., Zeng, L., Liu, L. Y., Lu, X., Wang, F., and Zeng, E. Y.: Global distribution of perfluorochemicals (PFCs) in potential human exposure source – A review, Environ. Int., 108, 51–62, 2017.
Johansson, N., Fredriksson, A., and Eriksson, P.: Neonatal exposure to perfluorooctane sulfonate (PFOS) and perfluorooctanoic acid (PFOA) causes neurobehavioural defects in adult mice, Neurotoxicology, 29, 160–169, https://doi.org/10.1016/j.neuro.2007.10.008, 2008.
Karásková, P., Codling, G., Melymuk, L., and Klánová, J.: A critical assessment of passive air samplers for per- and polyfluoroalkyl substances, Atmos. Environ., 185, 186–195, https://doi.org/10.1016/j.atmosenv.2018.05.030, 2018.
Konstantinos, P., Cousins, I. T., Buck, R. C., and Korzeniowski, S. H.: Sources, fate and transport of perfluorocarboxylates, Environ. Sci. Technol., 40, 32–44, https://doi.org/10.1002/chin.200611255, 2010.
Krogseth, I. S., Xianming, Z., Ying, D., Lei, Frank, W., and Knut, B.: Calibration and application of a passive air sampler (XAD-PAS) for volatile methyl siloxanes, Environ. Sci. Technol., 47, 4463–4470, https://doi.org/10.1021/es400427h, 2013.
Lai, F. Y., Rauert, C., Gobelius, L., and Ahrens, L.: A critical review on passive sampling in air and water for per- and polyfluoroalkyl substances (PFASs), TrAC Trends Anal. Chem., https://doi.org/10.1016/j.trac.2018.11.009, online first, 2018.
Li, J., Vento, S. D., Schuster, J., Gan, Z., Chakraborty, P., Kobara, Y., and Jones, K. C.: Perfluorinated Compounds in the Asian Atmosphere, Environ. Sci. Technol., 45, 7241–7428, https://doi.org/10.1021/es201739t, 2011.
Lindstrom, A. B., Strynar, M. J., and Libelo, E. L.: Polyfluorinated Compounds: Past, Present, and Future, Environ. Sci. Technol., 45, 7954–7961, https://doi.org/10.1021/es2011622, 2011.
Liu, B., Zhang, H., Yao, D., Li, J., Xie, L., Wang, X., Wang, Y., Liu, G., and Yang, B.: Perfluorinated compounds (PFCs) in the atmosphere of Shenzhen, China: Spatial distribution, sources and health risk assessment, Chemosphere, 138, 511–518, https://doi.org/10.1016/j.chemosphere.2015.07.012, 2015.
Liu, Z., Lu, Y., Wang, P., Wang, T., Liu, S., Johnson, A. C., Sweetman, A. J., and Baninla, Y.: Pollution pathways and release estimation of perfluorooctane sulfonate (PFOS) and perfluorooctanoic acid (PFOA) in central and eastern China, Sci. Total Environ., 580, 1247–1256, https://doi.org/10.1016/j.scitotenv.2016.12.085, 2017.
Martin, J. W., Ellis, D. A., Mabury, S. A., Hurley, M. D., and Wallington, T. J.: Atmospheric chemistry of perfluoroalkanesulfonamides: kinetic and product studies of the OH radical and Cl atom initiated oxidation of N-ethyl perfluorobutanesulfonamide, Environ. Sci. Technol., 40, 864–872, https://doi.org/10.1021/es051362f, 2006.
Melymuk, L., Bohlin, P., Sáňka, O., Pozo, K., and Klánová, J.: Current challenges in air sampling of semivolatile organic contaminants: sampling artifacts and their influence on data comparability, Environ. Sci. Technol., 48, 14077–14091, https://doi.org/10.1021/es502164r, 2014.
Okeme, J. O., Saini, A., Yang, C., Zhu, J., Smedes, F., and Klànovà, J.: Calibration of polydimethylsiloxane and XAD-pocket passive air samplers (PAS) for measuring gas- and particle-phase SVOCs, Atmos. Environ., 143, 202–208, https://doi.org/10.1016/j.atmosenv.2016.08.023, 2016.
Pickard, H. M., Criscitiello, A. S., Spencer, C., Sharp, M. J., Muir, D. C. G., De Silva, A. O., and Young, C. J.: Continuous non-marine inputs of per- and polyfluoroalkyl substances to the High Arctic: a multi-decadal temporal record, Atmos. Chem. Phys., 18, 5045–5058, https://doi.org/10.5194/acp-18-5045-2018, 2018.
Rauert, C., Harner, T., Schuster, J. K., Eng, A., Fillmann, G., Castillo, L. E., Fentanes, O., Villa, M. I., Miglioranza, K., and Moreno, I. R.: Atmospheric Concentrations of New Persistent Organic Pollutants and Emerging Chemicals of Concern in the Group of Latin America and Caribbean (GRULAC) Region, Environ. Sci. Technol., 52, 7240–7249, https://doi.org/10.1021/acs.est.8b00995, 2018.
Sedlak, M. D., Benskin, J. P., Wong, A., Grace, R., and Greig, D. J.: Per- and polyfluoroalkyl substances (PFASs) in San Francisco Bay wildlife: Temporal trends, exposure pathways, and notable presence of precursor compounds, Chemosphere, 185, 1217–1226, https://doi.org/10.1016/j.chemosphere.2017.04.096, 2017.
Thackray, C. P. and Selin, N. E.: Uncertainty and variability in atmospheric formation of PFCAs from fluorotelomer precursors, Atmos. Chem. Phys., 17, 4585–4597, https://doi.org/10.5194/acp-17-4585-2017, 2017.
Tian, Y., Zhou, Y., Miao, M., Wang, Z., Yuan, W., Liu, X., Wang, X., Wang, Z., Wen, S., and Liang, H.: Determinants of plasma concentrations of perfluoroalkyl and polyfluoroalkyl substances in pregnant women from a birth cohort in Shanghai, China, Environ. Int., 119, 165–173, https://doi.org/10.1016/j.envint.2018.06.015, 2018a.
Tian, Y., Yao, Y., Chang, S., Zhao, Z., Zhao, Y., Yuan, X., Wu, F., and Sun, H.: Occurrence and Phase Distribution of Neutral and Ionizable Per- and Polyfluoroalkyl Substances (PFASs) in the Atmosphere and Plant Leaves around Landfills: A Case Study in Tianjin,China, Environ. Sci. Technol., 52, 1301–1310, https://doi.org/10.1021/acs.est.7b05385, 2018b.
UNEP Stockholm Convention: The new POPs under the Stockholm Convention, available at: http://www.pops.int/TheConvention/ ThePOPs/TheNewPOPs/, last access: 8 October 2019.
Wang, Q. W., Yang, G. P., Zhang, Z. M., and Jian, S.: Perfluoroalkyl acids in surface sediments of the East China Sea, Environ. Pollut., 231, 59–67, https://doi.org/10.1016/j.envpol.2017.07.078, 2017.
Wang, X., Schuster, J., Jones, K. C., and Gong, P.: Occurrence and spatial distribution of neutral perfluoroalkyl substances and cyclic volatile methylsiloxanes in the atmosphere of the Tibetan Plateau, Atmos. Chem. Phys., 18, 8745–8755, https://doi.org/10.5194/acp-18-8745-2018, 2018.
Wang, Z., Cousins, I. T., Scheringer, M., Buck, R. C., and Hungerbühler, K.: Global emission inventories for C4–C14 perfluoroalkyl carboxylic acid (PFCA) homologues from 1951 to 2030, Part I: production and emissions from quantifiable sources, Environ. Int., 70, 62–75, https://doi.org/10.1016/j.envint.2014.04.013, 2014.
Wong, F., Shoeib, M., Katsoyiannis, A., Eckhardt, S., Stohl, A., Bohlinnizzetto, P., Li, H., Fellin, P., Su, Y., and Hung, H.: Assessing temporal trends and source regions of per- and polyfluoroalkyl substances (PFASs) in air under the Arctic Monitoring and Assessment Programme (AMAP), Atmos. Environ., 172, 65–73, https://doi.org/10.1016/j.atmosenv.2017.10.028, 2018.
Xie, S., Wang, T., Liu, S., Jones, K. C., Sweetman, A. J., and Lu, Y.: Industrial source identification and emission estimation of perfluorooctane sulfonate in China, Environ. Int., 52, 1–8, https://doi.org/10.1016/j.envint.2012.11.004, 2013.
Yao, Y., Chang, S., Sun, H., Gan, Z., Hu, H., Zhao, Y., and Zhang, Y.: Neutral and ionic per- and polyfluoroalkyl substances (PFASs) in atmospheric and dry deposition samples over a source region (Tianjin, China), Environ. Pollut., 212, 449–456, https://doi.org/10.1016/j.envpol.2016.02.023, 2016a.
Yao, Y., Sun, H., Gan, Z., Hu, H., Zhao, Y., Chang, S., and Zhou, Q. X.: A Nationwide Distribution of Per- and Polyfluoroalkyl Substances (PFASs) in Outdoor Dust in Mainland China From Eastern to Western Areas, Environ. Sci. Technol., 50, 3676–3685, https://doi.org/10.1021/acs.est.6b00649, 2016b.
Zhen, W., Xie, Z., Möller, A., Mi, W., Wolschke, H., and Ebinghaus, R.: Atmospheric concentrations and gas/particle partitioning of neutral poly- and perfluoroalkyl substances in northern german coast, Atmos. Environ., 95, 207–213, https://doi.org/10.1016/j.atmosenv.2014.06.036, 2014.