the Creative Commons Attribution 4.0 License.
the Creative Commons Attribution 4.0 License.
 | 21 Nov 2019
Organic tracers of fine aerosol particles in central Alaska: summertime composition and sources
Dhananjay Kumar Deshmukh
M. Mozammel Haque
Yongwon Kim
Kimitaka Kawamura
PM2.5 aerosols were collected at Fairbanks (64.51∘ N and 147.51∘ W) in central Alaska during the summer of 2009 and analyzed for organic tracer compounds using a gas chromatograph–mass spectrometer. The organic compounds were grouped into 14 classes based on their functional groups and sources. Concentrations of the total organics measured ranged from 113 to 1664 ng m−3 (avg 535 ng m−3). Anhydrosugars (avg 186 ng m−3) and n-alkanoic acids (avg 185 ng m−3) were 2 major classes among the 14 compound classes. The similar temporal trends and strong positive correlations among anhydrosugars and n-alkanoic acids demonstrated that biomass burning (BB) is the major source of organic aerosols (OAs) in central Alaska. The dominance of higher molecular weight n-alkanoic acids over lower molecular weight homologs and their carbon preference index (5.6–9.8) confirmed that they were mostly emitted from plant waxes during BB in central Alaska. The mass concentration ratios of levoglucosan to mannosan denoted that softwood is the main biomass burned. The rainfall event distinctly enhanced the levels of mannitol and arabitol due to the growth of fungi and active discharge of fungal spores in the subarctic region. Molecular compositions of biogenic secondary organic aerosol (BSOA) tracers inferred that isoprene is a crucial precursor of BSOA over central Alaska. Our results suggest forest fires and plant emissions to be the crucial factors controlling the levels and molecular composition of OAs in central Alaska. We propose that PM2.5 laden with OAs derived in central Alaska may significantly impact the air quality and climate in the Arctic via long-range atmospheric transport.
- Article
(8730 KB) -
Supplement
(216 KB) - BibTeX
- EndNote


Atmospheric aerosols can absorb and scatter solar radiation and alter the radiative forcing of the atmosphere (Seinfeld and Pandis, 1998; Wilkening et al., 2000). Fine aerosol particles have a diameter size close to the wavelengths of visible lights and thus are expected to have a stronger climatic impact than coarse particles (Kanakidou et al., 2005). They can also be transported far away from the source regions, and thus their climatic and environmental effects are delocalized compared to the emission areas. Aerosol particles that are hydrophilic can act as cloud condensation nuclei (CCN) and have an indirect climatic effect through modification of cloud properties (Novakov and Penner, 1993; Novakov and Corrigan, 1996).
Organic aerosols (OAs) that are comprised of thousands of organic compounds contribute about 20 % to 50 % of the total mass of fine particles in the continental mid-latitudinal atmosphere (Saxena and Hildemann, 1996), whereas it is around 90 % in tropical forest areas (Crutzen and Andreae, 1990; Andreae and Rosenfeld, 2008). They are derived from anthropogenic and natural sources. They can alter the physical and chemical properties of atmospheric particles depending on the meteorological conditions. OAs are highlighted for the past decade because they are related to the changes in global and regional climate and chemical composition of the atmosphere as well as public health. Primary organic aerosols (POA) are directly emitted as particulate forms, whereas secondary organic aerosols (SOA) refer to particulate organic matters that are transformed to the aerosol phase via gas-phase oxidation of organic precursors. Emissions of POA particles and SOA precursors can be released from numerous sources near the ground surface and subsequently mixed in the boundary layer and to a lesser extent in the free troposphere. The dry depositional removal of OAs mainly depends on the sizes of the aerosol particles.
The molecular composition of OAs can be used as a tracer to better understand the sources and formation pathways. Advances were made during the last decade to better understand the formation of OAs and their precursors in the atmosphere. On a global scale, the emission of biogenic volatile organic compounds (VOCs) is 1 order of magnitude higher than that of anthropogenic VOCs (Seinfeld and Pandis, 1998). It is notable that biogenic VOCs are comprised of unsaturated hydrocarbons with double bonds and are more reactive towards the atmospheric oxidants such as hydroxyl (OH) radicals and ozone (O3) than anthropogenic VOCs that are largely comprised of aromatic hydrocarbons. This specific feature of biogenic VOCs further enhances their significance as a conceivable supplier to the global burden of OAs in the atmosphere. Laboratory and chamber experiments have also documented that biogenic VOCs are the potential precursor for SOA formation in the atmosphere (Kavouras et al., 1998; Jaoui et al., 2007).
Although early Arctic explorers had noticed atmospheric haze (Nordenskiold, 1883), the remote Arctic atmosphere was believed to be extremely clean. Pilots flying over the North American Arctic in the 1950s observed widespread haze that could be seen every winter and early spring (Mitchell, 1957). It took until the 1970s for scientists to realize that the haze was air pollution transported from the middle latitudes (Barrie, 1986). Over the past 3 decades there has been much research on the climate consequences of this pollution that is also present in summer. Surface air temperature has increased more than the global average over the past few decades and is predicted to warm by about 5 ∘C over a large part of the Arctic by the end of the 21st century (IPCC, 2001). The Arctic atmosphere is considered a unique natural laboratory for photochemical reactions and transformations during the polar sunrise (Kawamura et al., 1996). Arctic atmosphere is influenced by marine-derived OAs from the Arctic Ocean as well as continentally derived OAs and their precursors from mid-latitudes in Eurasia or North America (Stohl et al., 2006; Law and Stohl, 2007).
Previous analyses have reported a substantial contribution of summertime boreal forest fires to the chemical composition of aerosol over the Arctic (Iziomon et al., 2006; Kaplan and New, 2006; Stohl et al., 2006). French et al. (2003) proposed that wildfire contributed a substantial amount of carbon-based gas from 1950 to 1999 in the atmosphere of the boreal region of Alaska. Based on the modeling and in situ observations of black carbon (BC) and soot during the FROSTFIRE campaign, Kim et al. (2005) revealed that BC and soot particles of 0.4 to 10 µm in radius can be transported to the Arctic and the whole area of Alaska in a very short time. The results of Kaplan and New (2006) delivered strong evidence that high-latitude ecosystems are sensitive to climate change due to the increase in concentrations of greenhouse gases. Iziomon et al. (2006) examined summertime aerosols based on column-integrated and surface aerosol measurements at Borrow in the North Slope of Alaska between 1998 and 2003. They noticed high loadings of aerosols at least 8 d each summer and demonstrated that the pollution events with the highest aerosol loadings were associated with smoke from wildfires in northwestern Canada. Stohl et al. (2006) explored the impact of boreal forest fire emissions on the light-absorbing aerosol levels at the Barrow Arctic station. They proposed that boreal forest fires could result in elevated concentrations of light-absorbing aerosols throughout the entire Arctic with an impact on the radiation transmission of the Arctic atmosphere.
The results of Hegg et al. (2009) and Warneke et al. (2009) confirm that biomass burning (BB) causes a more efficient transport and deposition of BC aerosol in Arctic snow, causing a strong climate forcing at high latitudes. Based on in situ measurements in the Arctic and a transport model of carbon monoxide (CO), Warneke et al. (2010) proposed that BB plumes transported to the Arctic in spring in 2008 more than doubled the Arctic atmospheric burden in other seasons. The results of Ward et al. (2012) based on chemical mass balance modeling revealed that wood smoke was the major source of PM2.5 particles, mainly during the winter months at several locations in Fairbanks. Ward et al. (2012) and Wang and Hopke (2014) demonstrate that Arctic air pollution could be so severe that the city of Fairbanks has been labeled a serious non-attainment area by the United States Environmental Protection Agency. Biogenic emissions from boreal forest largely increase during the summertime growing season. The year-round measurements conducted at Fairbanks by Haque et al. (2016) have shown that SOA derived from biogenic VOC emissions dominated the organic chemical composition of total suspended particles during summer in central Alaska. They found higher contributions of isoprene oxidation products than monoterpene and sesquiterpene oxidation products to SOA formation in summer due to the higher isoprene emissions and high levels of oxidants. They estimated isoprene-derived secondary organic carbon (SOC) approximately 5 times higher than SOA derived from monoterpene and nearly 2 times higher than sesquiterpene-derived SOA in central Alaska. Because climate change is generally proceeding fastest at the high latitudes (Serreze et al., 2000; Hinzman et al., 2005), there is an increasing demand for better understanding of the chemical compositions and sources of OAs in the Arctic atmosphere.
We collected PM2.5 samples during the summer of 2009 at Fairbanks in central Alaska. The samples were analyzed for several organic tracer compounds to characterize OAs in the North American subarctic region. This paper discusses the molecular compositions of various organic compound classes and the factors controlling temporal changes in their concentrations in central Alaska. We also discuss the sources of organic compounds detected and the secondary formation processes as well as atmospheric implications for the burden of OAs in the Arctic and subarctic atmosphere.
2.1 Description of the sampling area
Alaska is located in a subarctic zone. Fairbanks is the largest city in central Alaska. It is situated in the central Tanana Valley connecting the Chena River near the Tanana River. The location of the sampling site in Fairbanks (64.51∘ N and 147.51∘ W) and its surroundings are shown in Fig. 1. The altitude of the sampling location is 136 m above sea level. The total area of Fairbanks is nearly 85 km2, with a population of 31 500. The sampling site is located at the downside of Fairbanks, where a forest is very close to the campus of the University of Alaska Fairbanks. The highest levels of atmospheric aerosol burden in the United States have been recorded in Fairbanks (Ward et al., 2012). The National Emission Inventory database pointed out that forest fires and combustion of fossil fuels are the two critical sources of air pollution in Fairbanks (Shakya and Peltier, 2013; Ware et al., 2013).
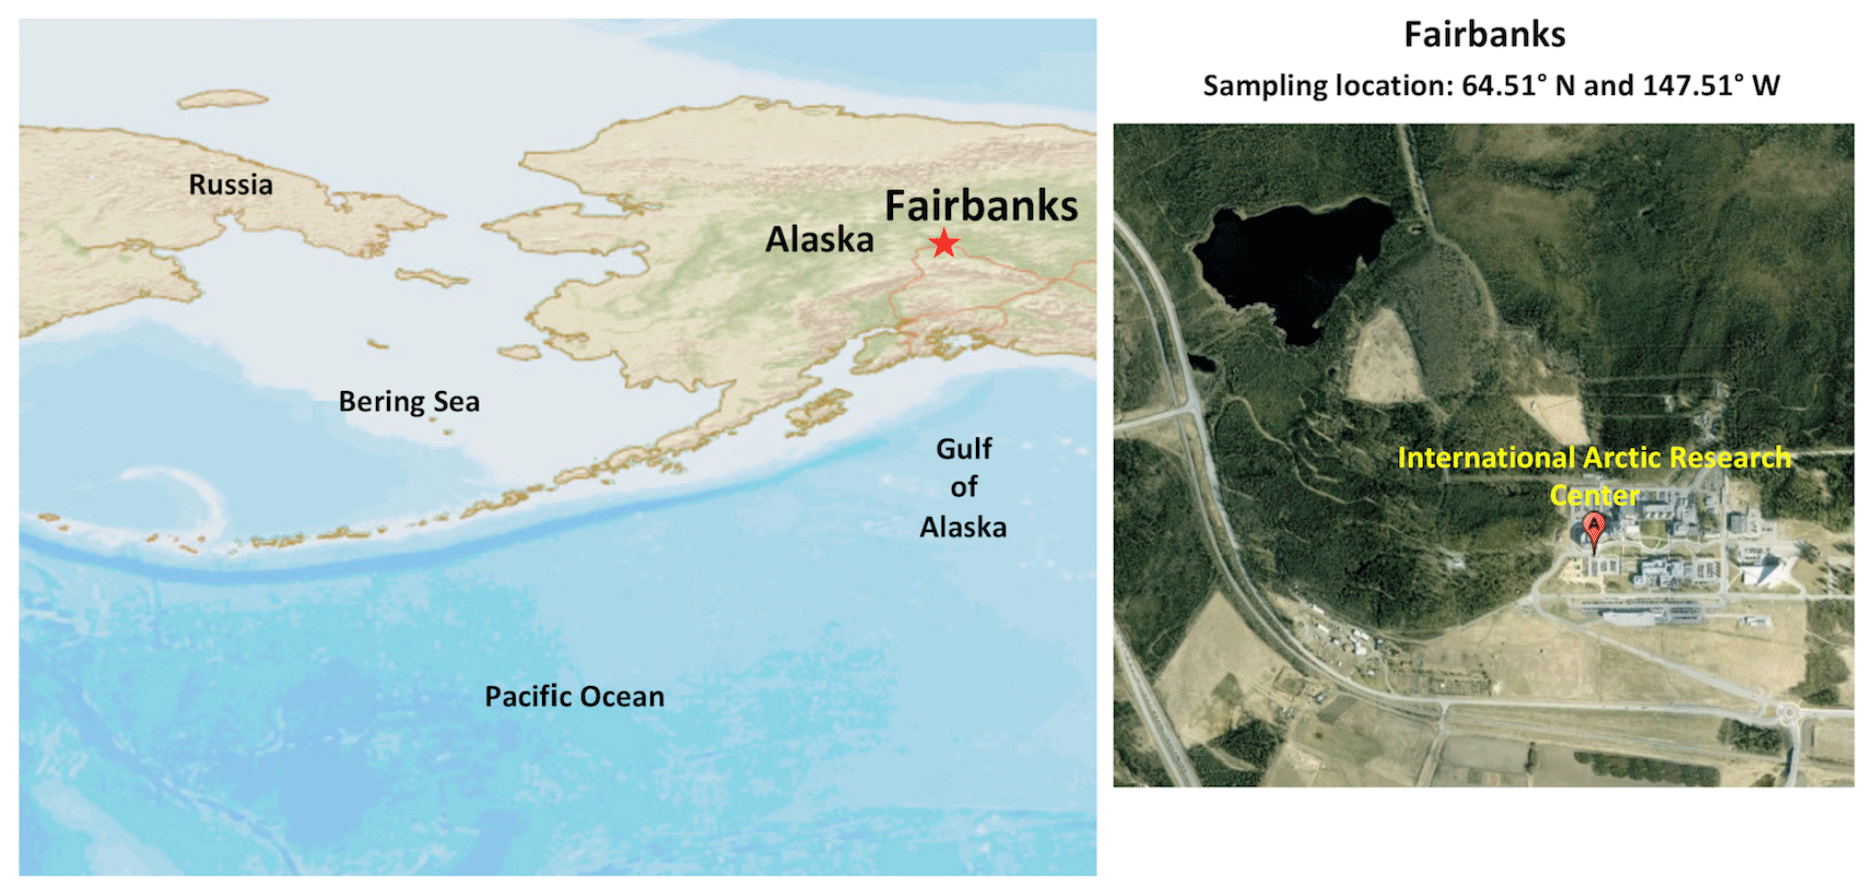
Figure 1The location of the sampling site at Fairbanks in central Alaska (64.51∘ N and 147.51∘ W) and its surrounding regions. The map was downloaded from Map data © 2018 Google.
2.2 Sample collection
Atmospheric particle samples of sizes less than 2.5 µm in diameter (PM2.5) were collected on the rooftop of the International Arctic Research Center building of the University of Alaska Fairbanks during the summer season from 5 June to 21 September in 2009 when a forest fire was active in the region. The collection of samples was performed using a low-volume air sampler model, URG-2000-39EH (USA), with a flow rate of 16.7 L min−1. PM2.5 particles were retained on a quartz fiber filter of 47 mm in diameter that was pre-combusted at 450 ∘C for 6 h. The sampler was operated for 3 to several days to get enough aerosol particles on the filter to detect trace organic species with very low concentrations. We collected 13 samples (Alaska 01 to 13) and three field blanks during the campaign. The samples and field blank filters were individually placed in a pre-heated glass vial with a Teflon-lined screw cap. We stored the aerosol samples in a dark room at −20 ∘C to prevent the samples from microbial degradation and loss of semivolatile organic compounds.
2.3 Analysis of organic tracers
We analyzed the samples for organic compounds using a gas chromatograph–mass spectrometer (GC–MS) system: a Hewlett-Packard (HP) model 6890 GC coupled to an HP model 5973 mass-selective detector. A 5.0 cm2 filter area of each aerosol sample was extracted with a 10 mL dichloromethane (CH2Cl2) and methanol (CH3OH) mixture (2:1) through ultrasonication (10 min ×3). The solvent extracts were filtered through a Pasteur pipet packed with pre-combusted (450 ∘C for 6 h) quartz wool to remove particles and filter debris. The extracts were concentrated by a rotary evaporator and then dried under a stream of pure nitrogen gas. The hydroxyl (OH) and carboxyl (COOH) groups of organic compounds in the extracts were derivatized to trimethylsilyl ethers and esters, respectively, by the reaction with 50 µL N,O-bis(trimethylsilyl)trifluoroacetamide including 1 % trimethylsilyl chloride and 10 µL pyridine at 70 ∘C for 3 h (Schauer et al., 1996; Simoneit et al., 2004a). n-Hexane containing 1.43 ng µL−1 of a C13 n-alkane internal standard (40 µL) was added into the derivatives before injection of the sample into a GC–MS.
The separation of compounds was performed on a 30 m long DB-5MS fused silica capillary column (0.25 mm inner diameter and 0.25 µm film thickness). Helium was used as a carrier gas at a flow rate of 1.0 mL min−1. The GC oven temperature was programmed from 50 ∘C for 2 min to 120 ∘C at 30 ∘C min−1 and then 300 ∘C at 6 ∘C min−1 with a final isotherm held at 300 ∘C for 16 min. The sample was injected on a splitless mode with an injector temperature of 280 ∘C. The mass detection was conducted at 70 eV on an electron ionization mode with a scan range of 50 to 650 Dalton. The organic compounds were determined by the comparison of the GC retention times and mass fragmentation patterns of a sample with those of authentic standards and National Institute of Standards and Technology library data. The mass spectral data were acquired and processed using HP Chemstation software. The GC–MS relative response factor of each compound was calculated using authentic standards or surrogate compounds. The recoveries of authentic standards or surrogates were above 80 % for target compounds. The data reported here were not corrected for recoveries. The relative standard deviation of the measurements based on duplicate analyses was within 10 %. The field blank filters were analyzed by the procedure described above. The target compounds were not detected in the blank filters.
2.4 Meteorology and air mass trajectories
Figure 2 shows temporal changes in daily average meteorological parameters at the campaign site. The daily mean temperature was in a range of 2.0 to 33 ∘C with an average of 13.9 ∘C, whereas the daily average relative humidity ranged from 19 % to 99 % with a mean of 63 %. The mean wind speed was 5.2 km h−1 and the total rainfall was 122 mm during the sampling period. The 5 d air mass backward trajectories at the height of 500 m above the ground level were computed from the Hybrid Single Particle Lagrangian Integrated Trajectory model (Draxler and Rolph, 2013). The air mass backward trajectories arriving over the observation site during the collection of aerosol samples is presented in Fig. 3.
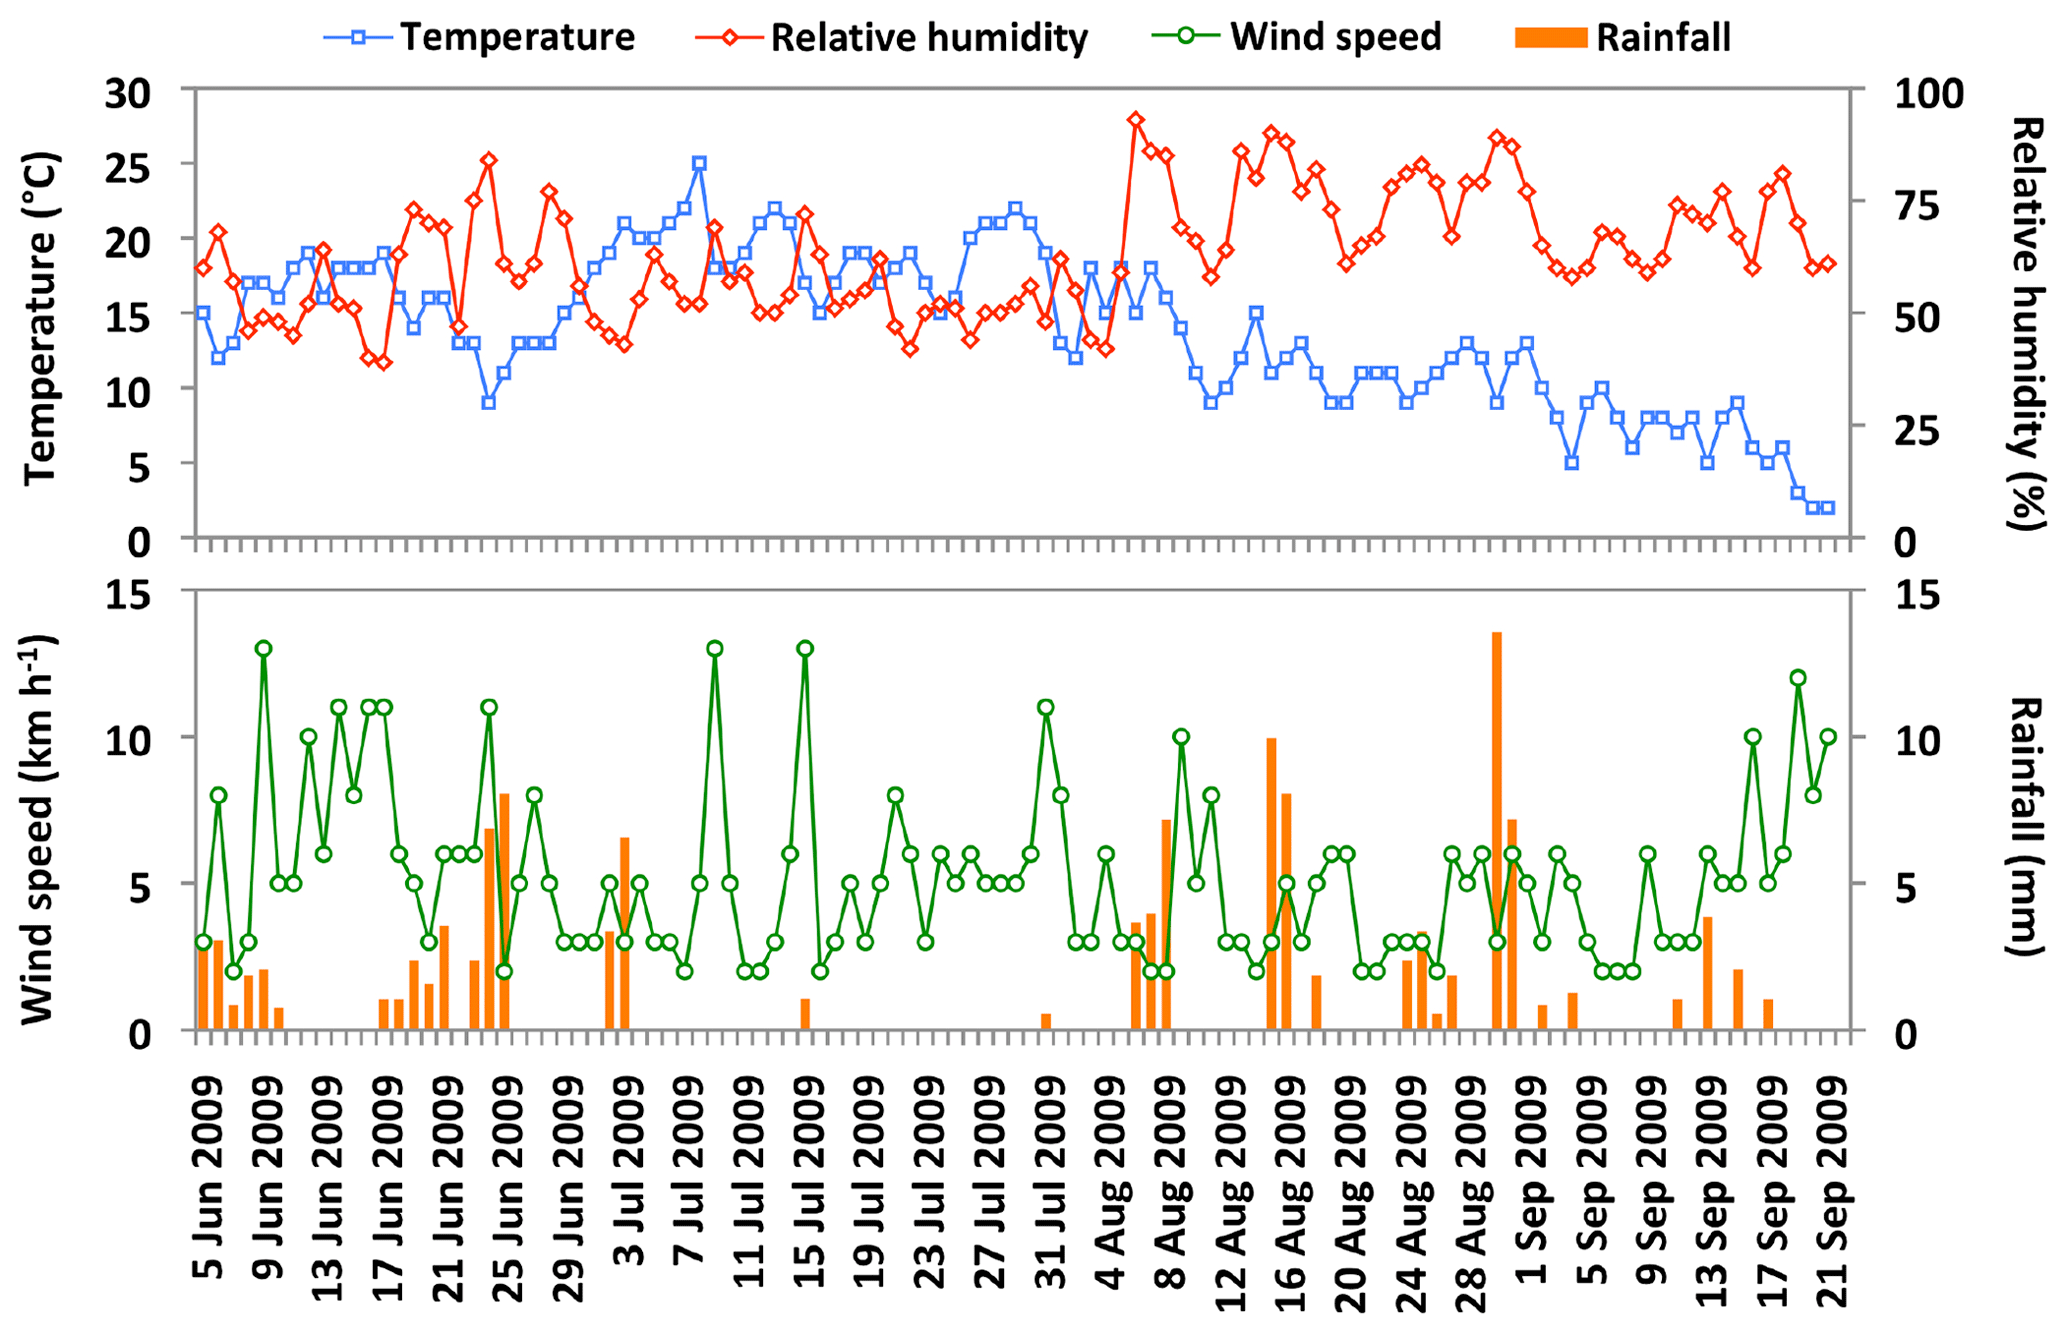
Figure 2The daily average variations of meteorological parameters from 5 June to 21 September 2009 at the observation site in central Alaska.
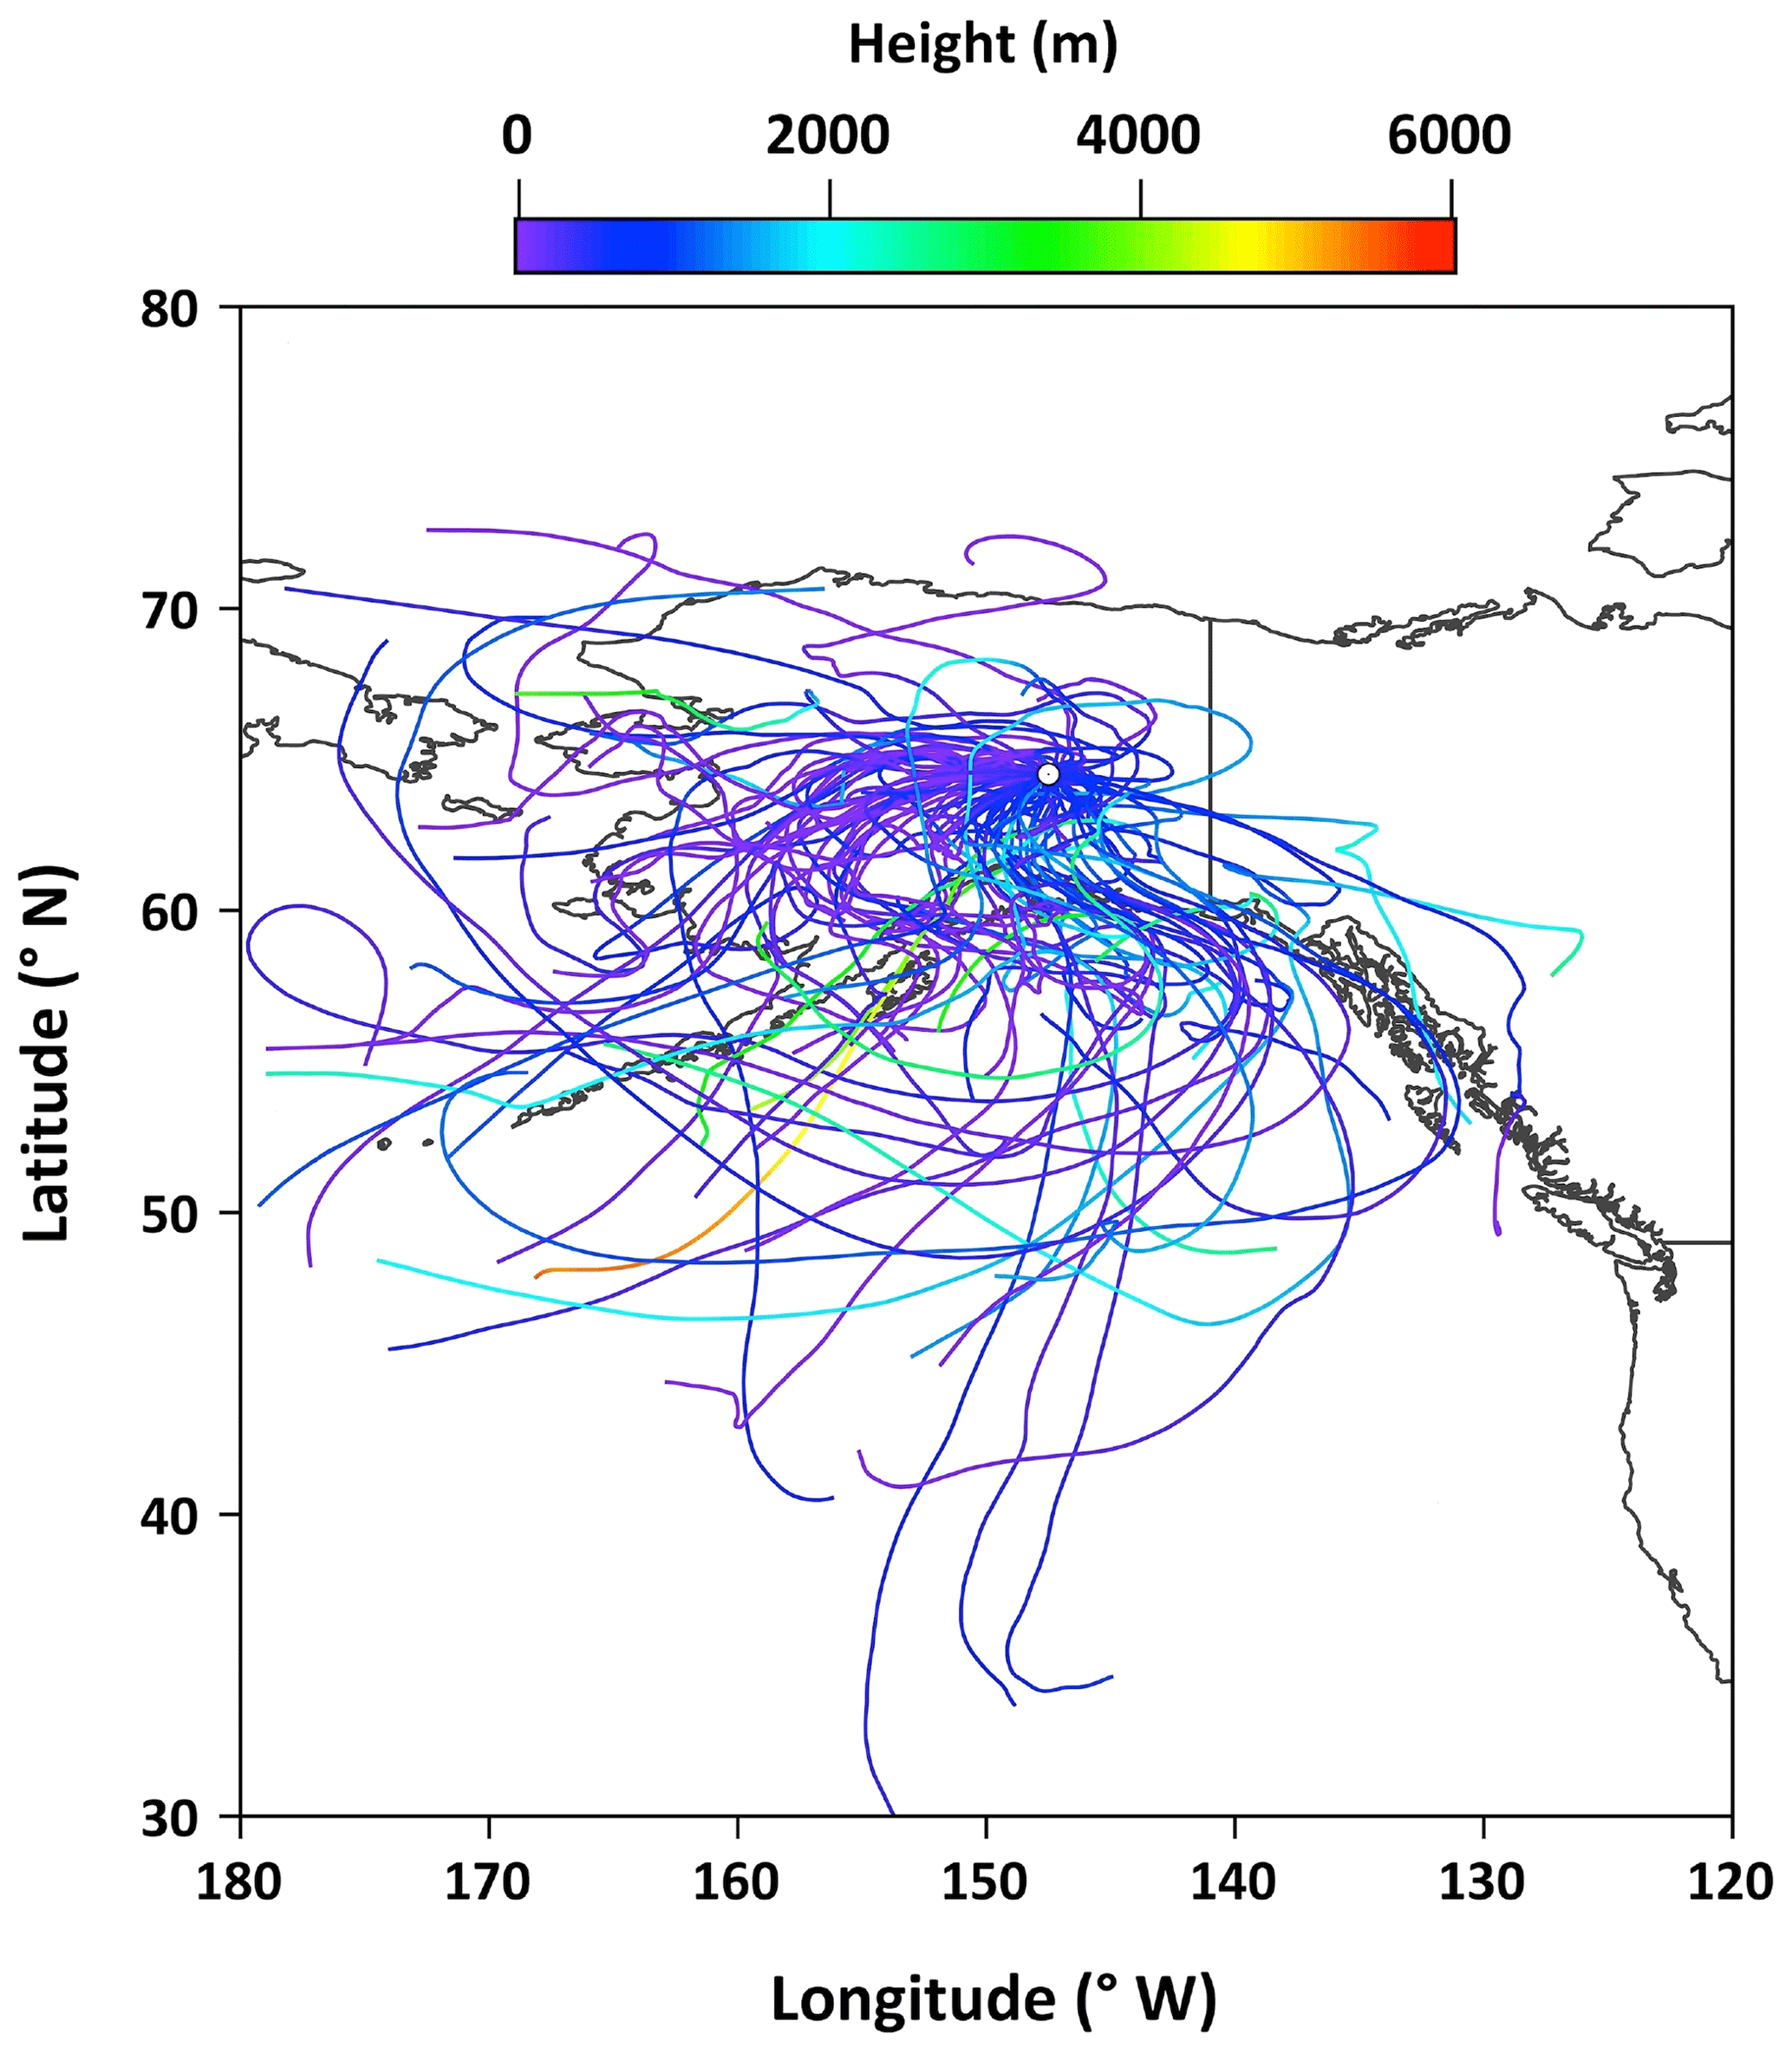
Figure 3The air mass backward trajectories over the observation site during the collection of aerosol samples. The color scale shows the height of the air parcel.
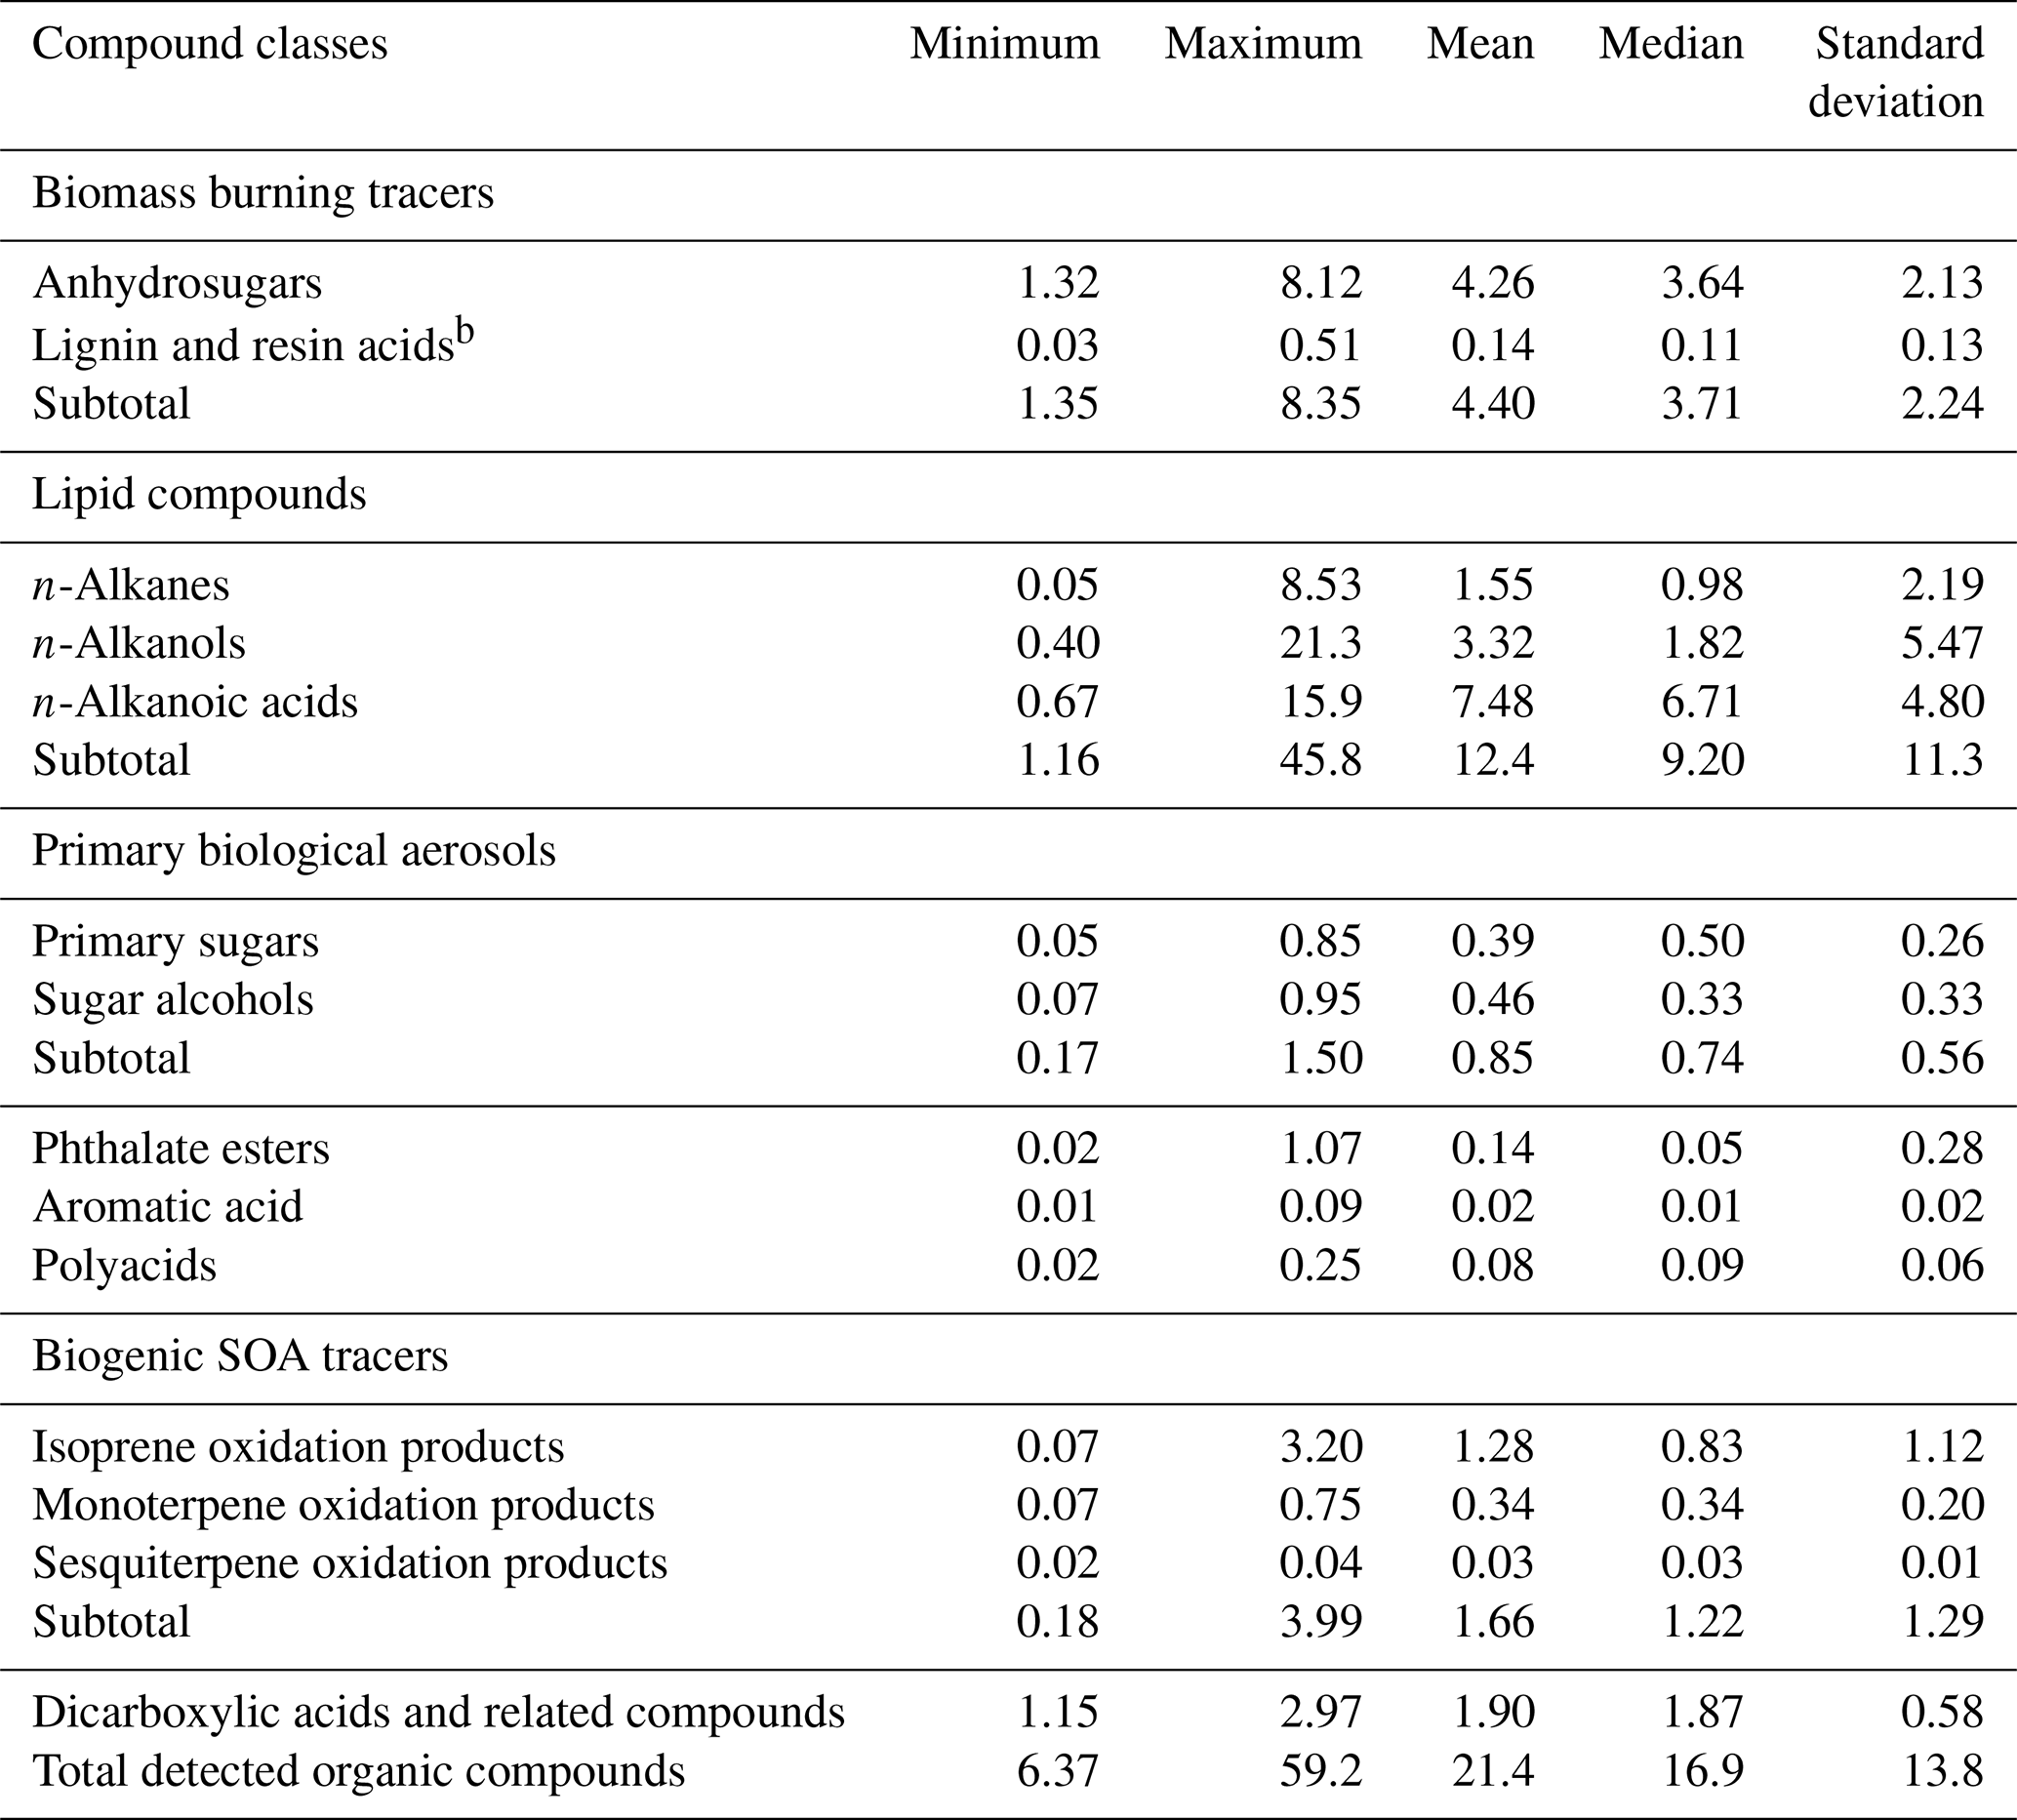
3.1 Overview of the molecular composition of organic aerosols
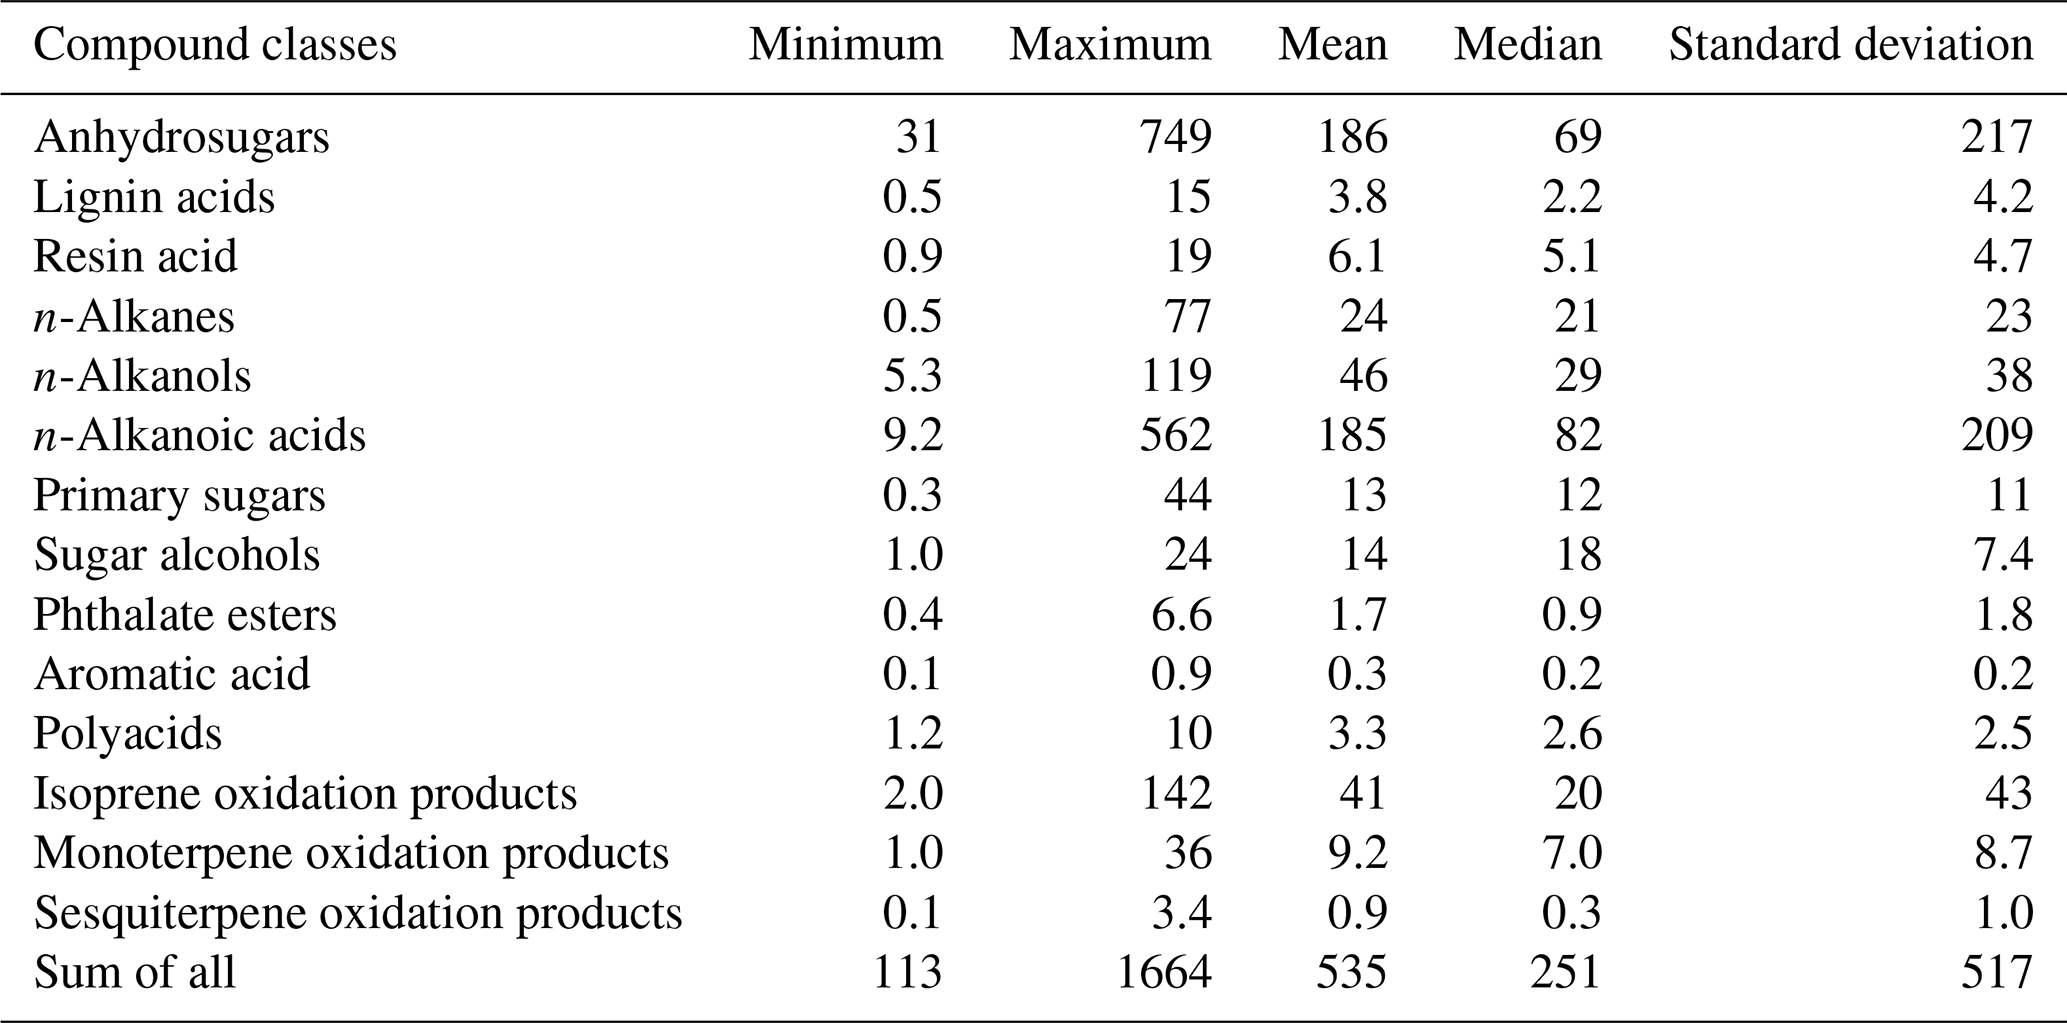
A total of 96 organic compounds were detected in PM2.5 samples collected at Fairbanks during the sampling period. We grouped them into 14 compound classes as listed in Table 1 together with the mean concentrations and ranges. Figure 4 shows the chemical compositions of OAs in individual samples (Alaska 01 to 13). The levels of all the quantified organic compounds in Alaskan samples ranged from 113 to 1664 ng m−3 (avg 535 ng m−3) with the predominance of anhydrosugars (avg 186 ng m−3) and n-alkanoic acids (avg 185 ng m−3). Anhydrosugars are produced by pyrolysis of cellulose and hemicellulose, followed by the subsequent emission into the atmosphere, and are widely used as specific tracers of BB (Simoneit et al., 1999; Sang et al., 2013). n-Alkanoic acids are derived directly from the surface of plant leaves and marine phytoplankton as well as BB and meat cooking (Kawamura and Gagosian, 1987; Rogge et al., 1993; Fine et al., 2001). Sugar alcohols were detected in ample amounts in three samples collected during the end of the campaign. We also detected a substantial amount of isoprene-derived SOA tracers and n-alkanols in Alaskan samples, while the concentrations of other compound classes are relatively low.

Figure 4Chemical compositions of organic compounds in PM2.5 aerosols from central Alaska. The sample collection periods are 5–12 June (Alaska 01), 12–25 June (Alaska 02), 25 June–4 July (Alaska 03), 4–6 July (Alaska 04), 6–14 July (Alaska 05), 14–23 July (Alaska 06), 23–30 July (Alaska 07), 30 July–4 August (Alaska 08), 4–8 August (Alaska 09), 8–25 August (Alaska 10), 25–31 August (Alaska 11), 31 August–10 September (Alaska 12) and 10–21 September (Alaska 13) in 2009.
Table 1Concentrations (ng m−3) of organic tracer compound classes detected in PM2.5 aerosols from central Alaska.
3.2 Anhydrosugars and lignin and resin products: tracers of biomass burning
The combustion of biopolymers including cellulose and hemicellulose as well as lignin and suberin produces several organic molecules that have been recognized as important source tracers of OAs. Anhydrosugars and lignin and resin acids are specific tracers of BB among the pyrolysis products of biopolymers (Simoneit et al., 1999). The pyrolysis of cellulose and hemicellulose produces anhydrosugars such as levoglucosan and its isomers mannosan and galactosan (Simoneit et al., 1999; Engling et al., 2009). Figure 5a presents molecular distributions of anhydrosugars in Alaskan PM2.5 samples. Levoglucosan is the dominant anhydrosugar, followed by mannosan and galactosan in Alaskan samples. Their concentrations ranged from 23 to 463 ng m−3 (avg 125 ng m−3), 4.1 to 180 ng m−3 (avg 36 ng m−3) and 3.5 to 106 ng m−3 (avg 26 ng m−3), respectively.
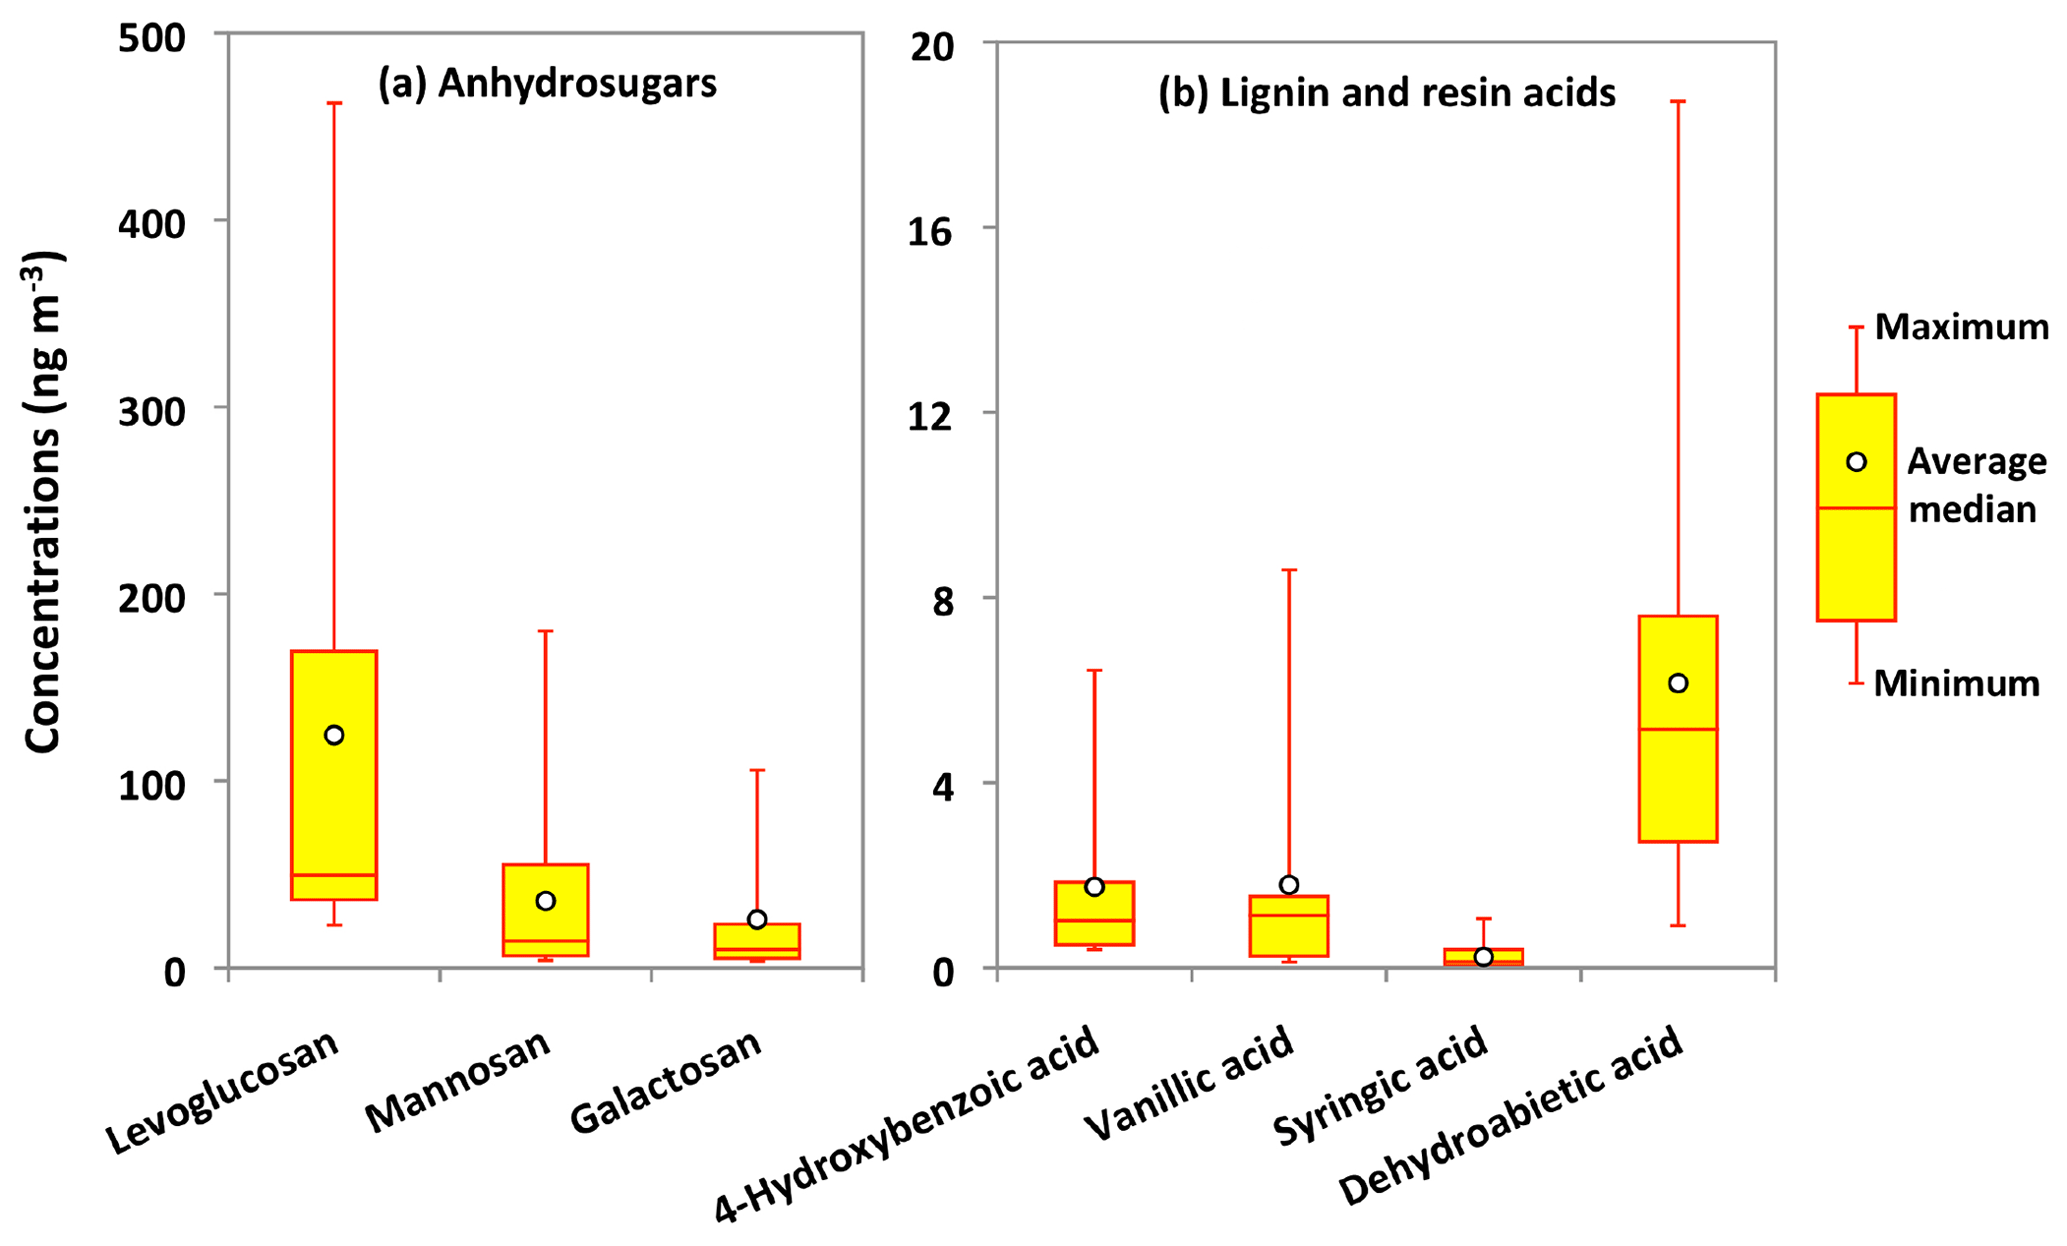
Figure 5Molecular distributions of anhydrosugars and lignin and resin acids in PM2.5 aerosols collected in central Alaska.
Because 90 % of levoglucosan exists in the atmospheric particles with an aerodynamic diameter less than 2 µm (Giannoni et al., 2012), it is reasonable to compare the levoglucosan concentrations of Alaskan PM2.5 samples with those reported in PM10 and TSP during summer or the BB season. We found that the concentration levels of levoglucosan in central Alaska are substantially higher than those from the Bering Sea (10 ng m−3) and Arctic Ocean (5.2 ng m−3) (Hu et al., 2013), Chichijima (0.24 ng m−3) and Okinawa (0.57 ng m−3) islands in the western North Pacific (Verma et al., 2015; Zhu et al., 2015), northern Japan (7.8 ng m−3) (Agarwal et al., 2010), and Mt. Everest (47.2 ng m−3) (Cong et al., 2015). They are comparable to those reported at the urban site of Chennai in India (avg 111 ng m−3) (Fu et al., 2010) but lower than those reported at the rural site of Lumbini in Nepal (avg 771 ng m−3) (Wan et al., 2017), the forest site of Rondônia in Brazil (avg 1180 ng m−3) (Graham et al., 2002), and Chiang Mai in Thailand (avg 1222 ng m−3) (Thepnuan et al., 2019).
The emission strength of BB products and their long-range atmospheric transport influence the atmospheric levels of anhydrosugars. The backward trajectories reveal that air masses mostly came from the ocean during the campaign (Fig. 3). This result shows that anhydrosugars present in the Alaskan aerosols were mainly associated with the local and regional BB during the campaign. The higher level of levoglucosan in Fairbanks than other sites in the Arctic implies a possible effect of BB on the air quality and climate in the Arctic region. Stocks et al. (2000) and Grell et al. (2011) proposed that the frequency of boreal forest fires recently increased in summer due to global warming. Figure 6a–c show the temporal trends of anhydrosugars in the Alaskan aerosols. The levels of anhydrosugars expressively alter during the campaign period. The lower levoglucosan levels were found at the beginning of the campaign, whereas they became very high (241 to 463 ng m−3) on 4–23 July (Fig. 6a). Another peak of levoglucosan was found on 30 July to 4 August (169 ng m−3). The concentrations of levoglucosan decreased towards the end of the campaign (23 to 50 ng m−3). Forest fire smokes were seen during 4–23 July and 30 July to 4 August over central Alaska. This observation demonstrates that levoglucosan levels became high due to the local forest fire in central Alaska. Mannosan and galactosan presented similar temporal variations to levoglucosan (Fig. 6b and c). The chemical reaction of anhydrosugars with OH radicals could also influence their concentrations in the atmosphere. Although previous studies have reported that levoglucosan can remain stable in the atmosphere for around 10 d with no substantial degradation (Fraser and Lakshmanan, 2000; Schkolnik and Rudich, 2006), recent findings (Hoffmann et al., 2009; Hennigan et al., 2010; Gensch et al., 2018) reported significant chemical reactivity of levoglucosan and have raised a question over the stability of levoglucosan in the atmosphere. Hennigan et al. (2010) carried out a smog chamber experiment and reported the lifetime of atmospheric levoglucosan to be 0.7 to 2.2 d when exposed to 1×10⁶ molecules of OH cm−3. This lifetime is within the range of 0.5 to 3.4 d predicted by Hoffmann et al. (2009) using the Spectral Aerosol Cloud Chemistry Interaction Model. Lai et al. (2014) found that the atmospheric lifetime of levoglucosan ranged from 1.2 to 3.9 d by the control experiment integrating OH in a flow reactor under different environmental conditions and different mixing states. Nevertheless, Bai et al. (2013) reported an atmospheric lifetime of levoglucosan to be 26 d when exposed to an OH level of 2×10⁶ molecules cm−3 that is much longer than other predictions.
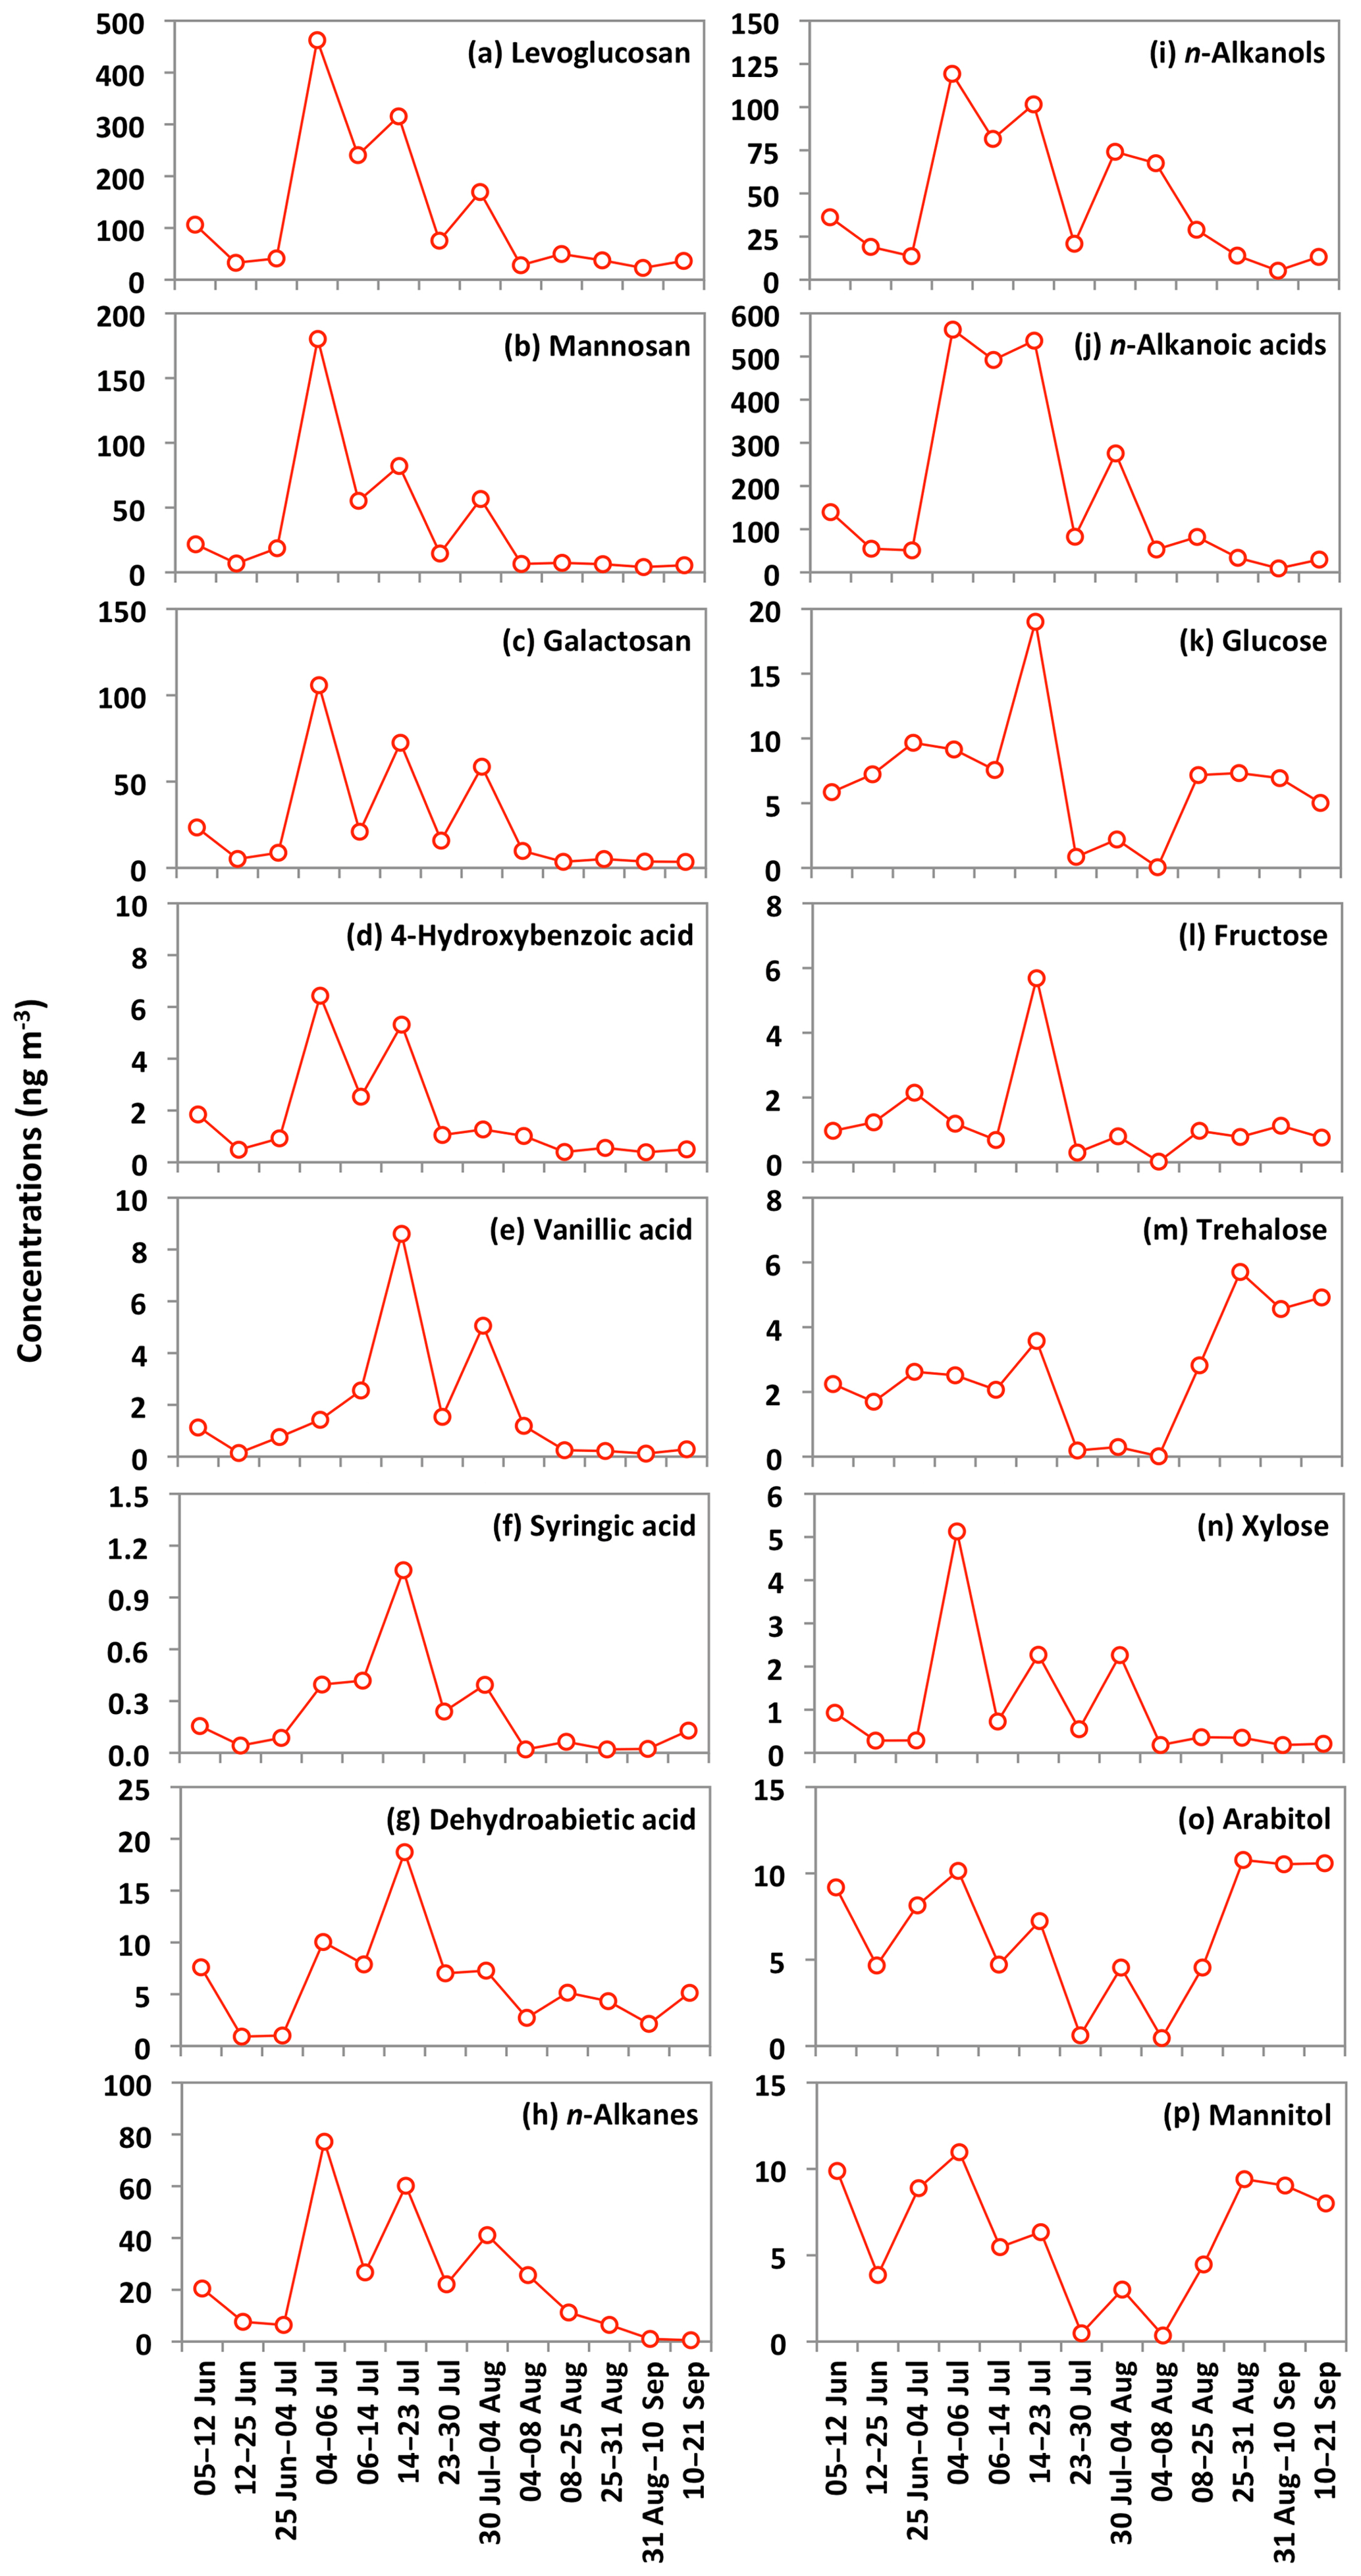
Figure 6Temporal changes in the concentrations of biomass burning tracers and other organic compounds in the Alaskan aerosols.
It is notable from the above discussion that the degradation of levoglucosan is mostly induced by photochemical aging via oxidation by OH radicals during long-range transport. Therefore, the degradation of levoglucosan could be insignificant if the receptor site is close to the source region. As discussed previously, anhydrosugars detected in Alaskan aerosols during the campaign originated from local and regional BB, and we consider that the degradation of anhydrosugars may not be important for explaining the low levels of BB tracers in the samples collected at the beginning and end of the campaign. The low concentrations of anhydrosugars during the beginning and end of the campaign might be caused by the decreased emission rate of BB tracers due to lower BB activities in the source region. Wet deposition may be another reason to lower the level of anhydrosugars in aerosol samples collected at the beginning and end of the campaign because we observed rainfall especially on 5 June to 3 July and 6 August to 17 September in Fairbanks (Fig. 2). Although the concentrations of both mannosan and galactosan are much lower than levoglucosan (Fig. 5a), we observed strong positive correlations (r=0.94–0.97) among these tracers (Table 2). This result indicates that they might have originated from similar types of biomass via the burning in central Alaska.
Table 2Statistical summary of correlations among the organic tracers in PM2.5 aerosols from central Alaska.
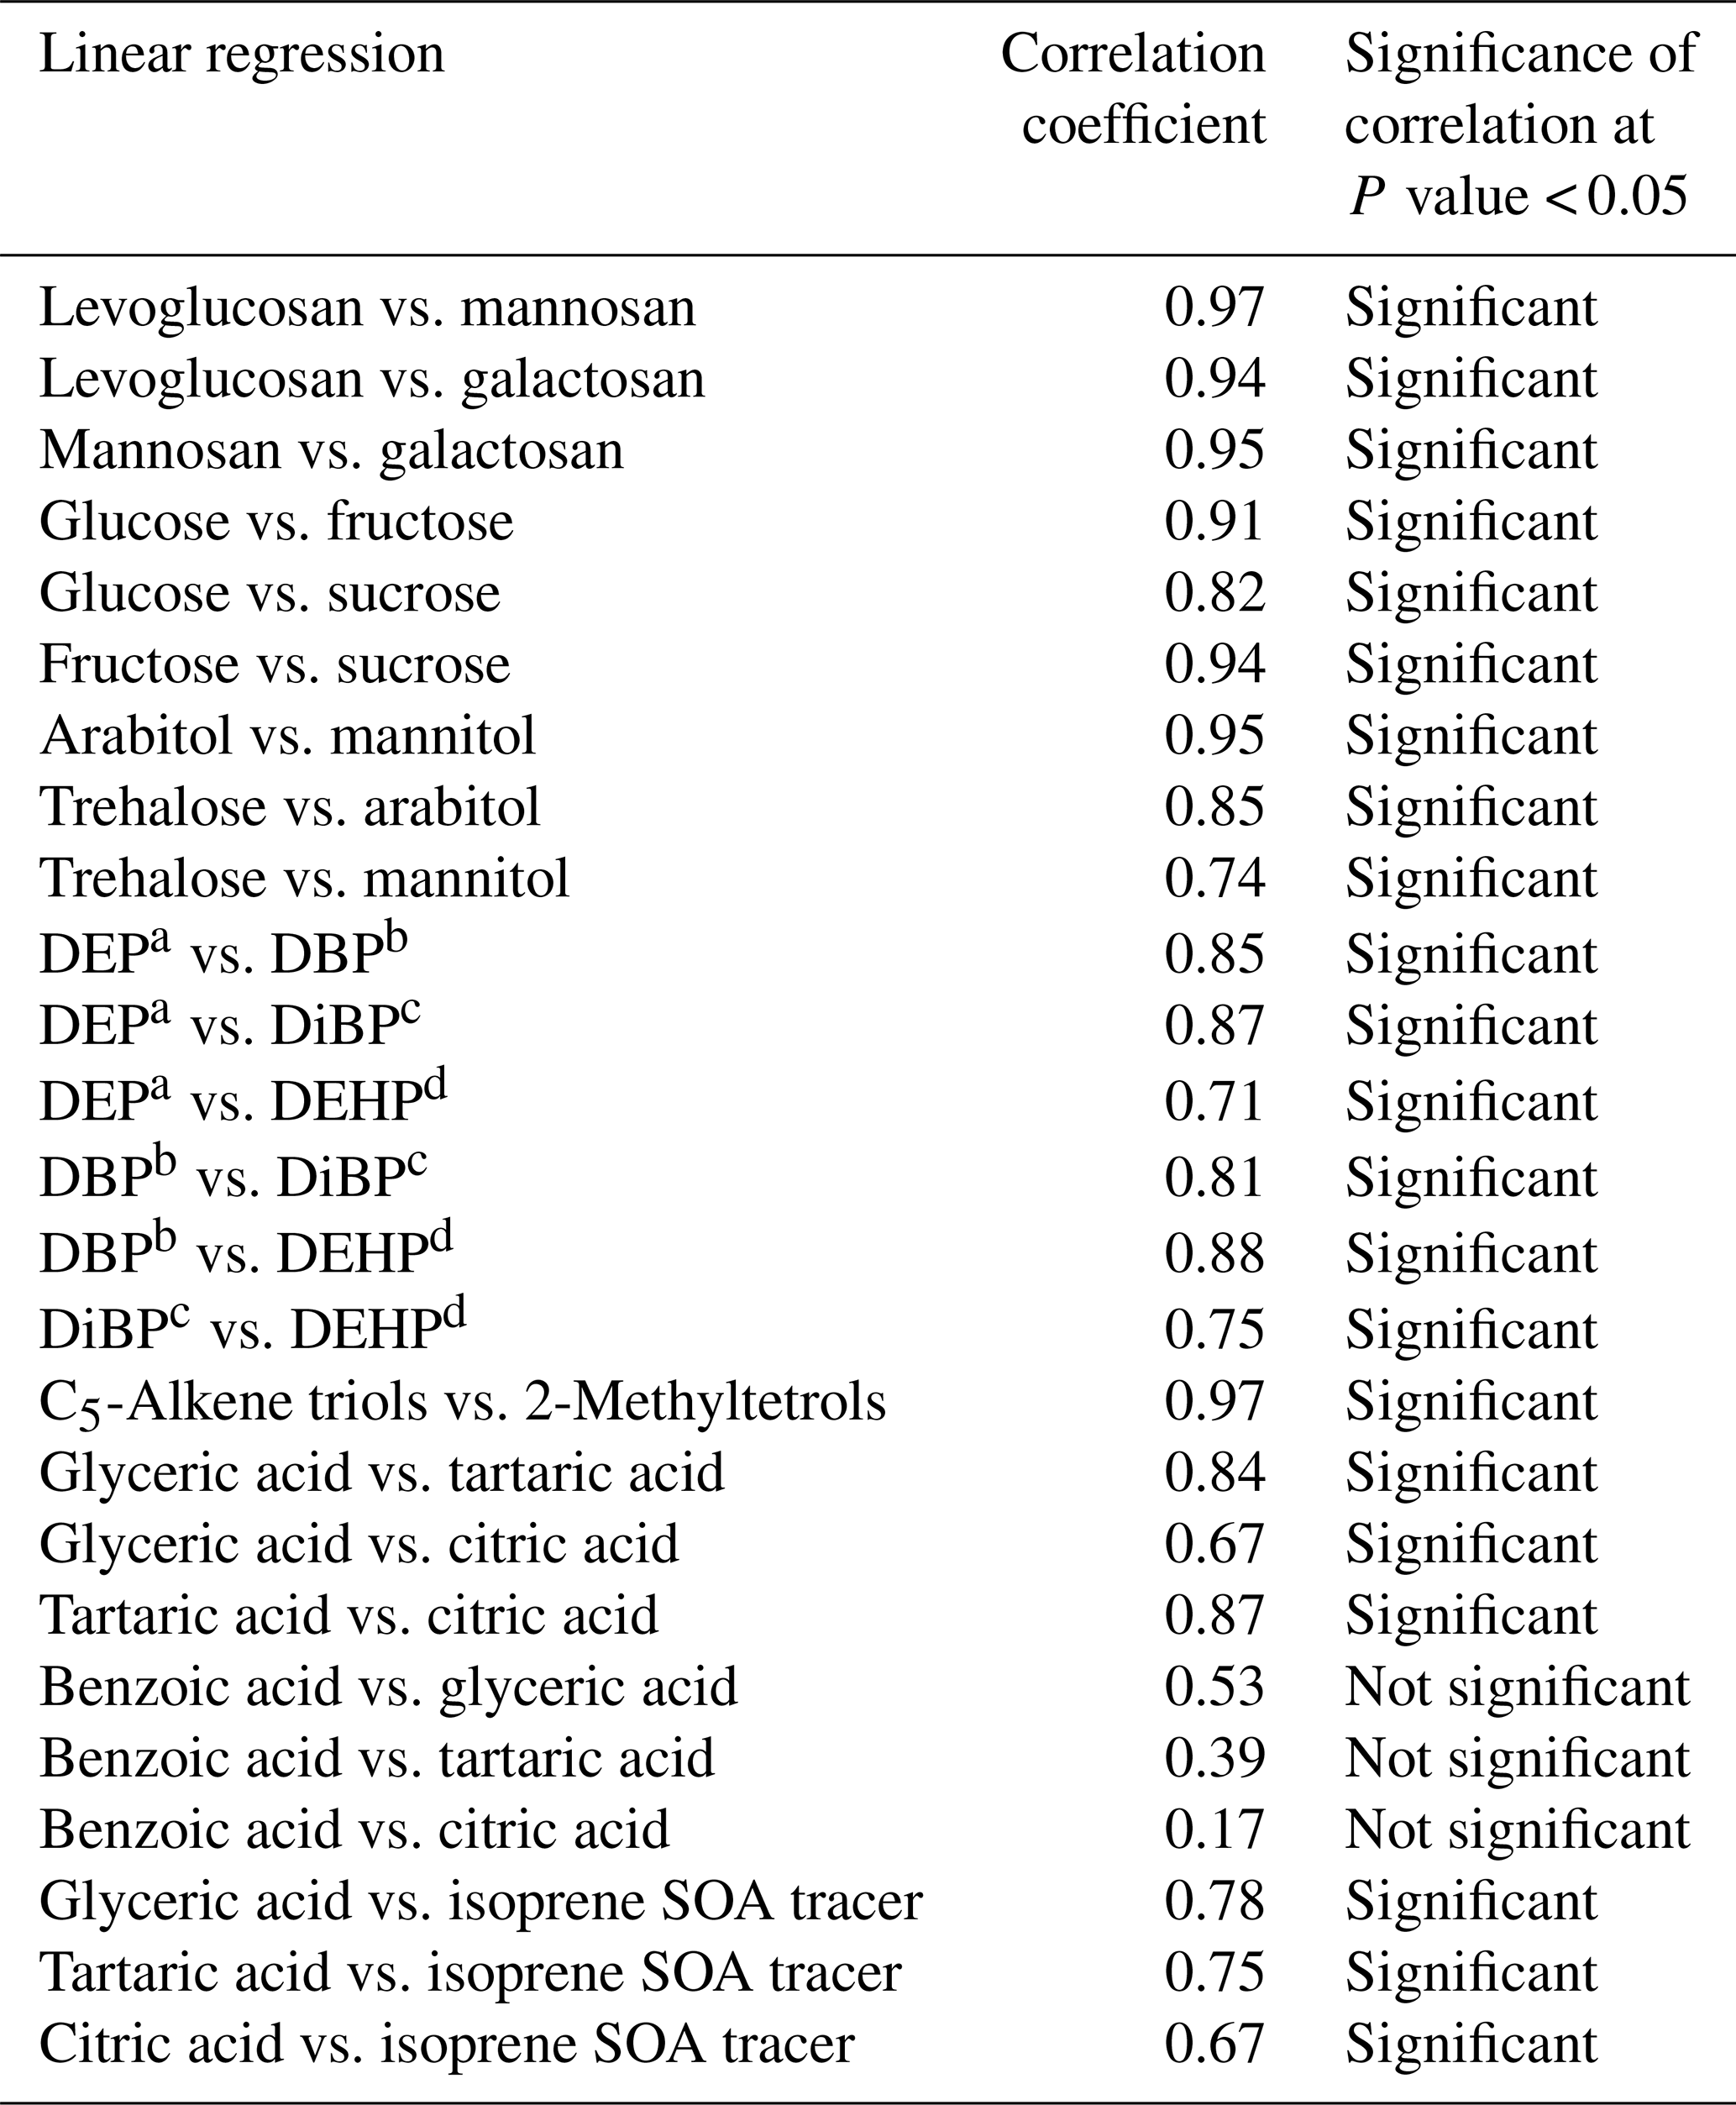
a Diethyl phthalate. b Dibutyl phthalate. c Diisobutyl phthalate. d Diethylhexyl phthalate.
Levoglucosan (L) is largely produced by thermal decomposition of cellulose, while mannosan (M) is mainly a pyrolysis product of hemicellulose (Simoneit et al., 1999). Klemm et al. (2005) found that hardwood contains almost 55 % to 65 % of cellulose and 20 % to 30 % of hemicellulose. Accordingly, in a laboratory chamber analysis, Schmidl et al. (2008) found L ∕ M ratios of nearly 2.5 to 3.9 for softwood burning and around 14 to 15 for hardwood burning. It is worth using the L ∕ M ratio to identify the relative contribution of biomass types: hardwood vs. softwood in central Alaska. The L ∕ M ratios in Alaskan samples ranged from 2.2 to 6.8 (avg 4.6), which are much lower than the ratios found in smoke samples derived from the burning of hardwoods but almost similar to the ratios found in samples derived from the burning of softwoods. The L ∕ M ratios found in Alaskan aerosol samples are also much lower than the ratios reported for the samples derived from burning of rice straw (12.3 to 55.0) (Sheesley et al., 2003; Sullivan et al., 2008; Engling et al., 2009), cereal straw (55.7) (Zhang et al., 2007), wheat straw (12.7) and corn straw (19.5) (Cheng et al., 2013).
Fine et al. (2001, 2002, 2004) presented the concentrations of BB tracers in fine particles derived from the burning of several wood species collected from the United States. Based on their data, we calculated the L ∕ M ratios to be 3.4 to 6.7 for softwood burning and 10.7 to 83.4 for hardwood burning. Our values from the Alaskan aerosol (2.2 to 6.8) are well within the range of L ∕ M ratios for softwood burning from the United States. The ratios in Alaskan aerosol samples are comparable to those for marine aerosols collected from the Arctic Ocean (avg 3.5) (Fu et al., 2013), South China Sea (6.4) and western North Pacific (avg 4.6) (Fu et al., 2011). Our values are also similar to those found in aerosol samples collected at Montana in the USA (4.6) (Ward et al., 2006), the Vienna (4.1 to 6.4) and Salzburg (5.4 to 5.7) sites in Austria (Caseiro et al., 2009) and Moitinhos in Portugal (avg 3.5) (Pio et al., 2008), where BB was dominated by burning of softwoods but was lower than the ratios estimated in aerosol samples collected at Chennai in India (avg 11.2) (Fu et al., 2010), Karachi in Pakistan (avg 17.5) (Shahid et al., 2016), Lumbini in Nepal (avg 15.1) (Wan et al., 2017), Morogoro in Tanzania (9 to 13) (Mkoma et al., 2013), Chiang Mai in Thailand (14.1 to 14.9) (Tsai et al., 2013) and Rondônia in Brazil (avg 14.2) (Claeys et al., 2010), where hardwoods and crop residues were the major sources of biomass burning. Our results and the above comparison imply that softwood is most likely biomass burned in central Alaska during the campaign.
Burning of lignin produces phenolic compounds such as 4-hydroxybenzoic (4-HBA), vanillic and syringic acids, whereas dehydroabietic acid (DHAA) is a specific pyrolysis product of resin present in the bark surface and needle leaves and woody tissues of conifers (Simoneit et al., 1993). We detected 4-HBA and DHAA in the Alaskan aerosols, although their concentrations were much lower than BB tracers produced from cellulose and hemicellulose burning (Fig. 5b). The concentrations of 4-HBA and vanillic acid ranged from 0.4 to 6.4 ng m−3 (avg 1.7 ng m−3) and from 0.1 to 8.6 ng m−3 (avg 1.8 ng m−3), respectively, whereas those of syringic acid ranged from 0.02 to 1.1 ng m−3 (avg 0.2 ng m−3). Shakya et al. (2011) and Myers-Pigg et al. (2016) reported that syringic to vanillic acid ratios for the burning of woody and non-woody angiosperm range from 0.1 to 2.4, whereas the ratios of softwood are 0.01 to 0.24. The concentration ratio of syringic to vanillic acid can therefore be used as a marker to distinguish the type of vegetation burned. We found that syringic to vanillic acid ratios in Fairbanks aerosols ranged from 0.02 to 0.5 (avg 0.2), suggesting that softwood is the more important biomass burned in central Alaska during the campaign. This conclusion is consistent with the observation on the L ∕ M ratios as discussed above. The temporal variation of 4-HBA is very similar to that of anhydrosugars, whereas vanillic and syringic acids presented rather similar temporal trends to DHAA in Alaskan aerosols (Fig. 6d–g). Simoneit et al. (1993) proposed that the emission of DHAA is different than those of lignin and cellulose burning products, and therefore it is a more specific molecular marker of the burning of conifer trees. The concentrations of DHAA ranged between 0.9 and 19 ng m−3 (avg 6.1 ng m−3), which are higher than those of lignin pyrolysis products (Fig. 5b). This result suggests that the burning of conifer is a common source of OAs in central Alaska.
3.3 Lipids: tracers of leaf waxes and marine sources
Series of lipid class compounds, including n-alkanes (C21 to C33), n-alkanols (C8 to C30), and n-alkanoic acids (C12 to C32), were detected in Alaskan aerosols. n-Alkanoic acids are the major lipid class compounds in Alaskan aerosols (avg 185 ng m−3), which is several times higher than those of n-alkanols (avg 46 ng m−3) and n-alkanes (avg 24 ng m−3) (Table 1). Figure 7a–c show the average molecular distributions of lipid compounds in Alaskan aerosols. The molecular distribution of n-alkanes is characterized by an odd-carbon-number predominance with maxima at heptacosane (C27: avg 6.8 ng m−3). Low molecular weight (LMW) n-alkanes are dominant in particles derived from fossil fuel combustion, whereas those derived from leaf waxes are enriched with high molecular weight (HMW) n-alkanes (Rogge et al., 1993; Hays et al., 2005; Wang et al., 2009). A remarkable feature in the molecular signature of n-alkanes is the presence of only the HMW species (C21 to C33) in Alaskan aerosols. This molecular signature in the PM2.5 samples suggests that leaf waxes are the major source of n-alkanes in central Alaska, with no significant contribution from fossil fuel combustion. This feature is different from the result of marine aerosols collected over the Arctic Ocean (Fu et al., 2013), in which n-alkanes were mostly of fossil fuel origin. We conclude that fossil fuel combustion is not an important source of OAs over central Alaska during the summer campaign. This remark is consistent with the fact that the fossil fuel biomarkers such as hopanes and steranes (Ding et al., 2009; Wang et al., 2009) were not detected in the Alaskan samples. These results demonstrate that biogenic n-alkanes emitted from boreal forest fires largely overwhelmed fossil fuel combustion-derived n-alkanes in central Alaska.
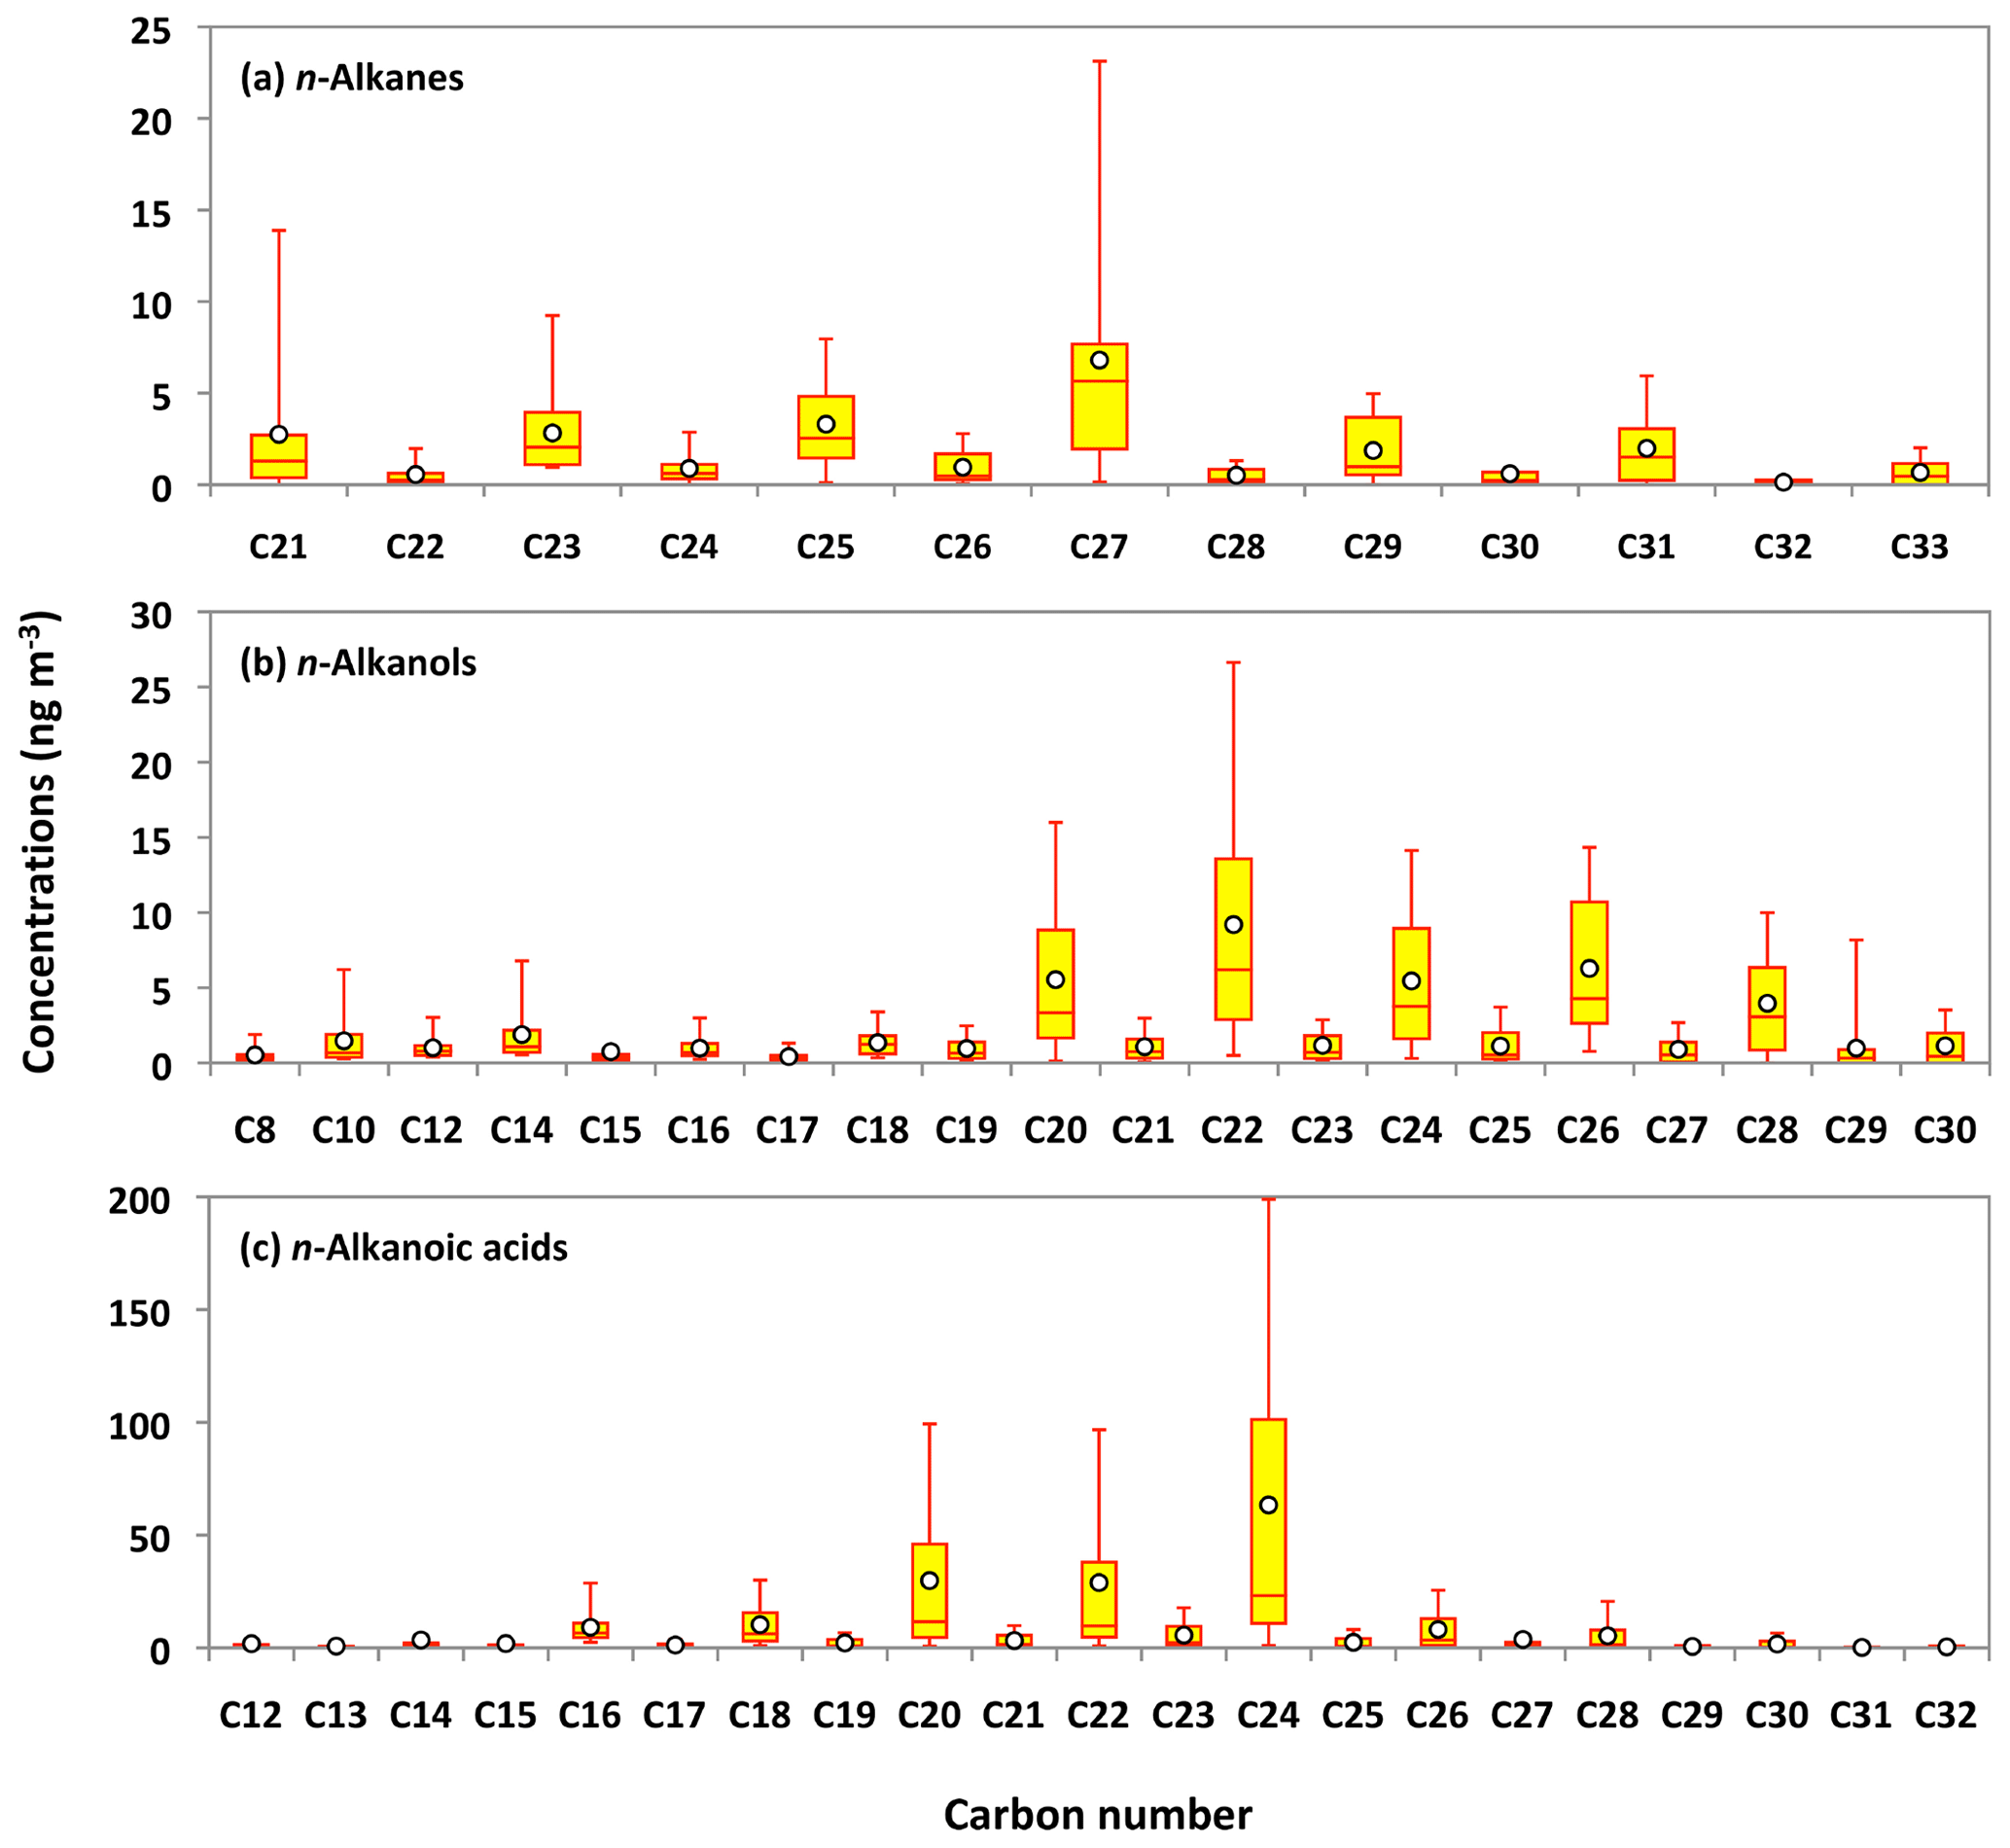
Figure 7Molecular distributions of lipid compounds in PM2.5 aerosols collected in central Alaska. See Fig. 5 for the description of the box-and-whisker diagram.
The carbon preference index (CPI) is a powerful tool to characterize the anthropogenic vs. biogenic sources of lipid compounds (Simoneit et al., 1991; Kawamura et al., 2003). The CPI value of n-alkanes in fossil fuel emission is usually close to 1, while it is more than 5 for leaf waxes (Peltzer and Gagosian, 1989). The calculated CPI values of n-alkanes in the Alaskan aerosols are in the range of 5.2 to 9.9, with an average of 6.6. These values are significantly higher than those reported in urban aerosols from megacities in China (0.9 to 1.8) (Wang et al., 2006), India (1.2 to 2.3) (Fu et al., 2010) and Japan (1.1 to 2.8) (Kawamura et al., 1994), where aerosol particles were seriously affected by fossil fuel combustion. The broader range of CPI values was found in aerosol particle samples collected over Mt. Tai (1.1 to 8.0) (Fu et al., 2008) and the western North Pacific (1.8 to 15) (Kawamura et al., 2003), where the input of plant waxes overwhelms the contribution of fossil fuel combustion. Together with these assessments our results strongly infer that n-alkanes over the Alaskan atmosphere mainly originated from plant leaf waxes. The wax covering the external surface of a plant leaf is composed of a mixture of long-chain aliphatic compounds. Kolattukudy (1976) found that odd-carbon-number n-alkanes (C25 to C33) are one of the most abundant compound classes in the leaf wax. Simoneit et al. (1991) considered the excess of odd homologs minus the neighboring even homologs to be the abundance of plant-derived n-alkanes in atmospheric samples. The contribution of estimated plant-derived n-alkanes to the total n-alkanes ranged from 53 % to 70 % (avg 61 %), implying that leaf wax is a major source of n-alkanes in the Alaskan aerosols.
The average molecular characteristics of n-alkanols and n-alkanoic acids displayed even-carbon-number predominance (Fig. 7b and c). n-Alkanols presented maxima at docosanol (C22: avg 9.2 ng m−3), whereas n-alkanoic acids demonstrated a peak at tetracosanoic acid (C24: avg 63 ng m−3). Microbes and marine phytoplankton are the sources of LMW n-alkanols and n-alkanoic acids, while their HMW homologs are specifically derived from higher plant waxes (Kawamura et al., 2003; Wang and Kawamura, 2005). Simoneit (2002) has proposed that BB also emits a large extent of n-alkanols and n-alkanoic acids into the atmosphere. The average concentrations of HMWn-alkanols (C21 to C30: 31 ng m−3) and HMW n-alkanoic acids (C21 to C32: 122 ng m−3) are twice as high as those of LMW n-alkanols (C8 to C20: 15 ng m−3) and LMW n-alkanoic acids (C12 to C20: 58 ng m−3) in the Alaskan aerosols. This result shows that locally derived plant waxes might be the source of HMW n-alkanols and n-alkanoic acids in central Alaska. The CPI values of n-alkanols and n-alkanoic acids are in the range of 3.0 to 10 (avg 6.2) and 5.6 to 9.8 (avg 7.9), respectively, suggesting a large contribution of plant waxes to lipid class compounds in central Alaskan aerosols.
The concentrations of n-alkanes and n-alkanols slightly decreased from the 5–12 June to late June samples (25 June to 4 July) and then dramatically increased in the 4–6 July sample (Fig. 6h and i). The concentration peaks of n-alkanes and n-alkanols were also observed in the sample of 14–23 July, whereas their concentrations constantly decreased from 30 July to the end of the campaign. The levels of n-alkanoic acids were low at the beginning of the campaign and then increased drastically in the 4–6 July sample and remained high in the two samples collected on 6–23 July (Fig. 6j). Concentrations of n-alkanoic acids decreased from 30 July to 21 September. Fascinatingly, the temporal variations of lipid class compounds were similar to those of anhydrosugars (Fig. 6a–c and h–j). Figure 8a–c show the linear regression analysis of lipid compounds with levoglucosan. We found strong correlations (r=0.90–0.96) of lipid compounds with levoglucosan in Alaskan aerosols. These results suggest that forest fires significantly control the atmospheric levels of lipids in central Alaska via the evaporative ablation of leaf waxes of terrestrial plants.
We also detected unsaturated n-alkanoic acids in Alaskan aerosol samples. Oleic (C18:1) and linoleic (C18:2) acids are major constituents of the cell membranes in terrestrial plants. They are released into the atmosphere directly from the leaf surface by wind action (Yokouchi and Ambe, 1986; Noureddini and Kanabur, 1999). Fine et al. (2001) and Hays et al. (2005) proposed that BB also emits significant amounts of C18:1 and C18:2 into the atmosphere. They are subjected to photochemical oxidation in the atmosphere. C18:1 and C18:2 are more reactive due to a double bond than C18:0 in the atmosphere with oxidants such as OH radicals and O3. The ratio of to octadecanoic acid (C18:0) is thus used as an indicator of photochemical processing of OAs (Kawamura and Gagosian, 1987). The ratios ranged from 0.03 to 0.3, with an average of 0.2 in Alaskan aerosols. Because average concentrations of C18:1 (0.9 ng m−3) and C18:2 (0.5 ng m−3) in Alaskan samples are significantly lower than that of C18:0 (10 ng m−3), C18:1 and C18:2 may be rapidly degraded in the atmosphere by photochemical oxidations.
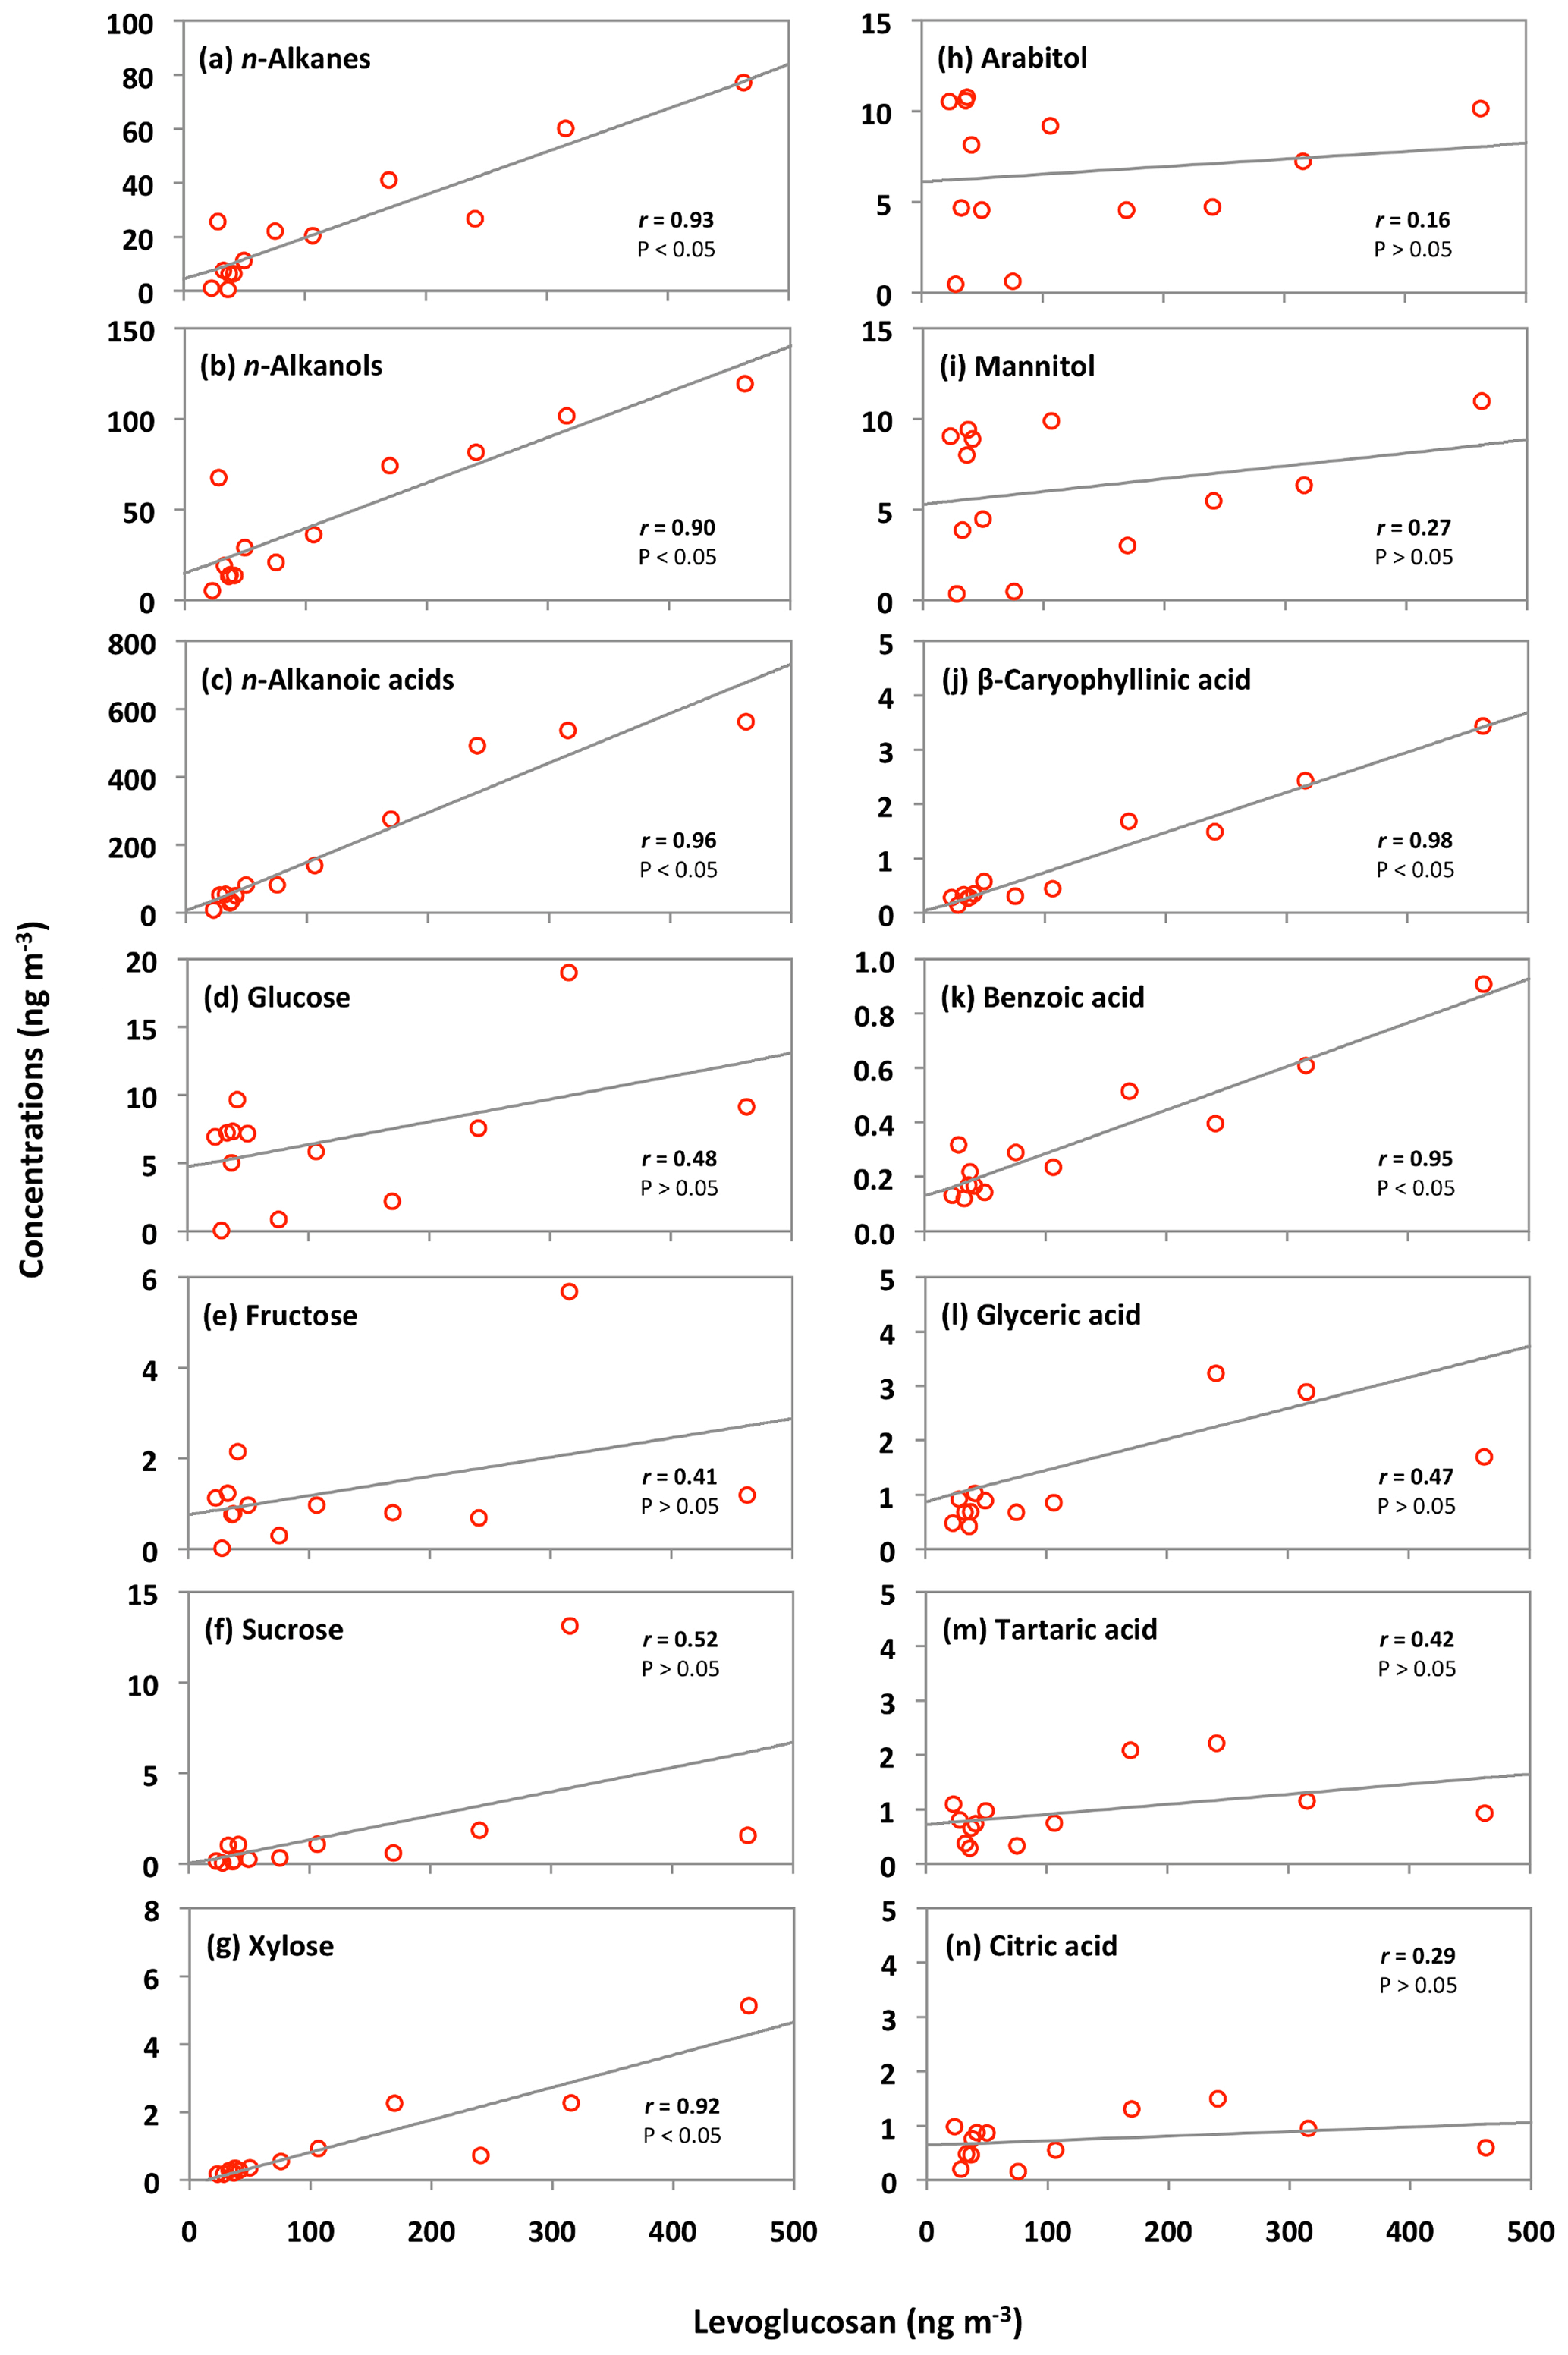
Figure 8Correlations of organic compounds with the biomass burning tracer levoglucosan in the Alaskan aerosol samples.
3.4 Sugar compounds: tracers of primary biological particles
Nine sugar compounds were detected in Alaskan aerosol samples, with five primary sugars and four sugar alcohols (Fig. 9). The concentrations of primary sugars were in the range of 0.3 to 44 ng m−3 (avg 13 ng m−3), whereas those of sugar alcohols ranged from 1.0 to 24 ng m−3 (avg 14 ng m−3). The concentrations of total sugar compounds ranged from 1.3 to 62 ng m−3 (27 ng m−3), in which sugar alcohols contributed more to the total sugars (avg 54.2 %) than primary sugars (avg 45.8 %) in Alaskan aerosols. Primary sugars are abundantly present in vascular plants. They are produced during the photosynthetic process in leaves and then accumulated in growing plants (Medeiros et al., 2006). Figure 9a presents the average molecular distributions of primary sugars in Alaskan aerosols. Primary sugars are characterized by the predominance of glucose in Alaskan samples, with a concentration range of 0.1 to 19 ng m−3 (avg 6.8 ng m−3), followed by trehalose (avg 2.6 ng m−3). Although sucrose (avg 1.6 ng m−3) and fructose (avg 1.3 ng m−3) are not abundant (Fig. 9a), glucose showed strong positive correlations with fructose (r=0.91) and sucrose (r=0.82) (Table 2). Fructose also presented a strong correlation with sucrose (r=0.94) (Table 2). These correlations indicate their similar source and origin in the atmosphere of central Alaska.
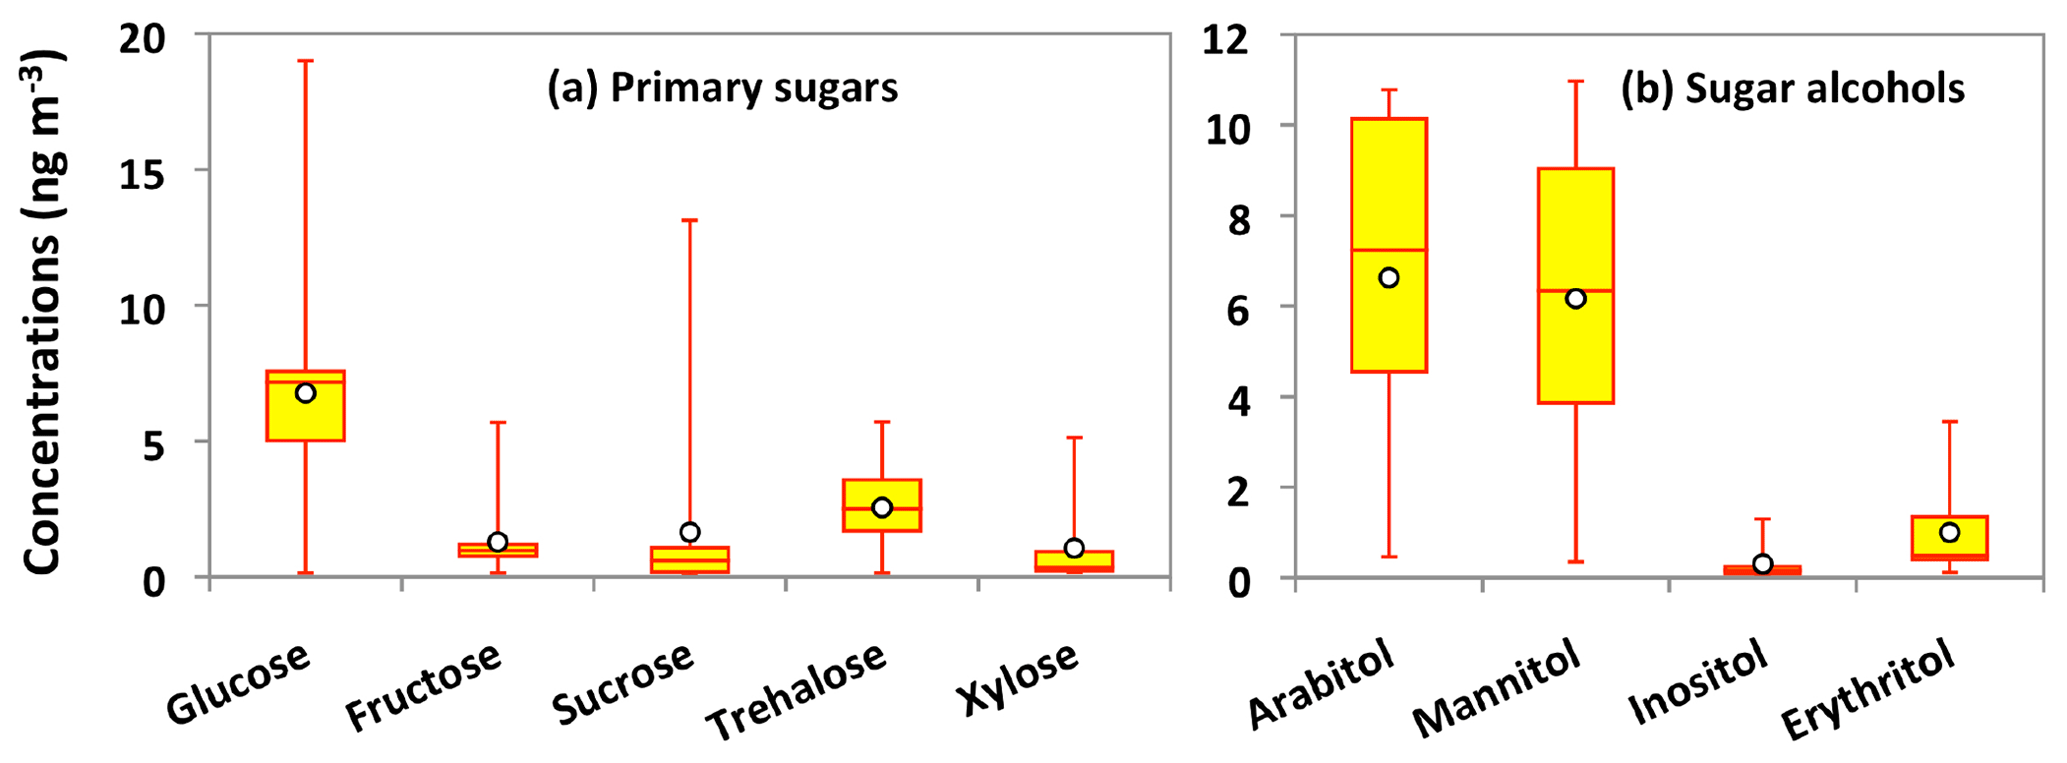
Figure 9Molecular distributions of primary sugars and sugar alcohols in PM2.5 aerosols collected in central Alaska. See Fig. 5 for the description of the box-and-whisker diagram.
Glucose and fructose are carbohydrates enriched in tree barks as well as branches and leaves (Medeiros et al., 2006; Li et al., 2016). They are present in plant nectars and fruits as well as pollen and fern spores (Baker et al., 1998; Graham et al., 2002). Dust and BB-derived particles have also been reported as major sources of glucose and fructose in the atmosphere (Nolte et al., 2001; Rogge et al., 2007). Sucrose is produced in plant leaves and distributed to several portions of the plant body (Jia et al., 2010). Sucrose has also been reported in airborne pollen grains produced from blooming plants (Pacini, 2000), surface soil and associated microbiota (Simoneit et al., 2004b) and dehydrated plant materials (Ma et al., 2009). We found that glucose shows moderate correlation (r= 0.48) with levoglucosan (Fig. 8d). Shafizadeh and Fu (1973) documented that glucose is a minor product of cellulose pyrolysis. The predominance of glucose among primary sugars together with a moderate correlation with levoglucosan suggests that pyrolysis of cellulose and hemicellulose is not the source of glucose in central Alaska. Pullman and Buchanan (2008) found that soluble carbohydrates such as glucose are a major component of conifers, where it can be stored in a large amount as deposited or dissolved free molecules. The temporal trend of glucose showed a peak in the sample collected during 14–23 July (Fig. 6k). Interestingly, the same sample showed a high loading of DHAA that is a unique tracer of the burning of conifer trees (Fig. 6g). This result suggests that the burning of conifer plants is the source of glucose in central Alaska.
Trehalose is a well-known constituent of microbes and fungal spores as well as plant species and suspended soil particles (Graham et al., 2003; Medeiros et al., 2006). The levels of trehalose stayed constant from 5 June to 14 July, dramatically decreased on 23 July to 8 August and then increased towards the end of the campaign when rainfall occurred in central Alaska (Figs. 2 and 6m). This result shows that the major source of trehalose might be the fungi in the surface soil of central Alaska that were emitted after the rainfall event. Terrestrial plants and marine phytoplankton as well as soil dust particles and associated microorganisms release xylose into the atmosphere (Cowie and Hedges, 1984). Although xylose is a minor primary sugar in Alaskan aerosols (avg 1.1 ng m−3), its temporal trend is very similar to that of anhydrosugars (Fig. 6a–c and n). This result together with a strong positive correlation of xylose with levoglucosan (r=0.92) implies its BB origin in central Alaska (Fig. 8g). This finding is similar to that of Sullivan et al. (2011), who documented that atmospheric levels of xylose in the Midwestern United States were attributed to BB emission.
Sugar alcohols presented the predominance of arabitol (avg 6.6 ng m−3) and mannitol (avg 6.2 ng m−3) (Fig. 9b). The concentration levels of erythritol (avg 1.0 ng m−3) and inositol (avg 0.3 ng m−3) are much lower than those of arabitol and mannitol in Alaskan aerosols. Arabitol and mannitol concentrations were higher during the beginning and end of the campaign than those during the middle of the campaign (Fig. 6o and p). We found that arabitol and mannitol are strongly correlated (r=0.95), implying their similar source in the Alaskan aerosols (Table 2). The major sources of arabitol and mannitol are airborne fungal spores (Pashynska et al., 2002; Bauer et al., 2008). Debris from mature leaves has also been proposed as a source of arabitol and mannitol in the forest areas (Pashynska et al., 2002; Zhang et al., 2010). Guasco et al. (2013) and Prather et al. (2013) proposed that bubble bursting of seawater contributes bacteria and dissolves organic species along with sea salts to aerosol particles. Although air masses mostly originated from the ocean (Fig. 3), the altitude of most of the air masses dropped at several places and went on to Fairbanks by maintaining low height. Therefore, we presume a negligible input of marine sources to sugar alcohols in Alaskan fine aerosol samples. Arabitol and mannitol were also detected in aerosol particles derived from BB (Fu et al., 2012; Yang et al., 2012; Nirmalkar et al., 2015). We found insignificant correlations of arabitol (r=0.16) and mannitol (r=0.27) with levoglucosan (Fig. 8h and i). This result suggests that BB is not an important source of arabitol and mannitol in the Alaskan aerosols.
The source of arabitol and mannitol might be fungi in the surface soil of Fairbanks whose activities were high during the campaign. Elbert et al. (2007) suggested that the active ejection of fungal spores demands water from the nearby atmosphere and release through osmotic pressure and surface tension effects. As shown in Figs. 2 and 6o and p, arabitol and mannitol concentrations in Alaskan samples are well connected with the rainfall event. We found that the levels of arabitol and mannitol are high during and after the rainfall. The rainfall increases the moisture contents in surface soil, and thus fungal and microbial activities are enhanced in central Alaska. This study implies that the precipitation stimulates the release of fungal spores to increase the arabitol and mannitol levels in Alaskan samples. Gottwald et al. (1997) and Burch and Levetin (2002) reported that passive discharge of spores is enhanced under windy conditions. This consideration further implies that fungal spores are actively ejected into the atmosphere of central Alaska. Our finding is consistent with the result of Elbert et al. (2007) from the Amazonia rainforest, where the ambient fungal spores were controlled by the active discharge. It is noteworthy that primary sugar trehalose presented significant positive correlations with arabitol (r= 0.85) and mannitol (r=0.74) (Table 2), showing that trehalose is also produced from surface soil under wet conditions in central Alaska.
3.5 Phthalate esters: tracers of plastic burning
Phthalates are widely used as a plasticizer in synthetic polymers and as a softener in polyvinylchloride (Thuren and Larsson, 1990; Wang et al., 2006). They can be emitted into the atmosphere by evaporation from polymers because they are not chemically bonded (Staples et al., 1997). The compositions of phthalate esters are the subject of scientific discussion and public concern due to their potential carcinogenic and endocrine-disrupting properties (Sidhu et al., 2005; Swan et al., 2005). We detected four phthalate esters in Alaskan aerosols, including diethyl phthalate (DEP), dibutyl phthalate (DBP), diisobutyl phthalate (DiBP) and diethylhexyl phthalate (DEHP).
The ambient concentrations of total phthalate esters ranged from 0.4 to 6.6 ng m−3 (avg 1.7 ng m−3), which are slightly higher than those from the North Sea to the high Arctic (0.4 to 1.0 ng m−3) (Xie et al., 2007), comparable to or slightly lower than those observed in the North Pacific (0.72 to 4.48 ng m−3) (Atlas and Giam, 1981), Great Lakes (0.1 to 10 ng m−3) (Eisenreich et al., 1981), and Canadian High Arctic (0.28 to 11 ng m−3) (Fu et al., 2009), but much lower than those reported in Sweden (0.5 to 127 ng m−3) (Thuren and Larsson, 1990), mountainous aerosols (9.6 to 985 ng m−3) (Fu et al., 2008) and urban aerosols from megacities in India and China (62 to 2200 ng m−3) (Wang et al., 2006; Fu et al., 2010). Figure 10 shows the average molecular distributions of phthalate esters in Alaskan aerosols. We found DEP (avg 0.8 ng m−3) to be a dominant phthalate, followed by DBP and DEHP (avg 0.4 ng m−3), whereas DiBP was less abundant (avg 0.2 ng m−3). The predominance of DEP among phthalate esters in Alaskan aerosol is different than those found in marine aerosol from the Arctic Ocean (Xie et al., 2007; Fu et al., 2013) and urban aerosols from India and China (Wang et al., 2006; Fu et al., 2010), where DEHP was the dominant species. We found similar temporal variations with significant positive correlations among detected phthalate esters (r=0.71–0.88) (Fig. 11a–d and Table 2), suggesting that they have similar sources in central Alaska.
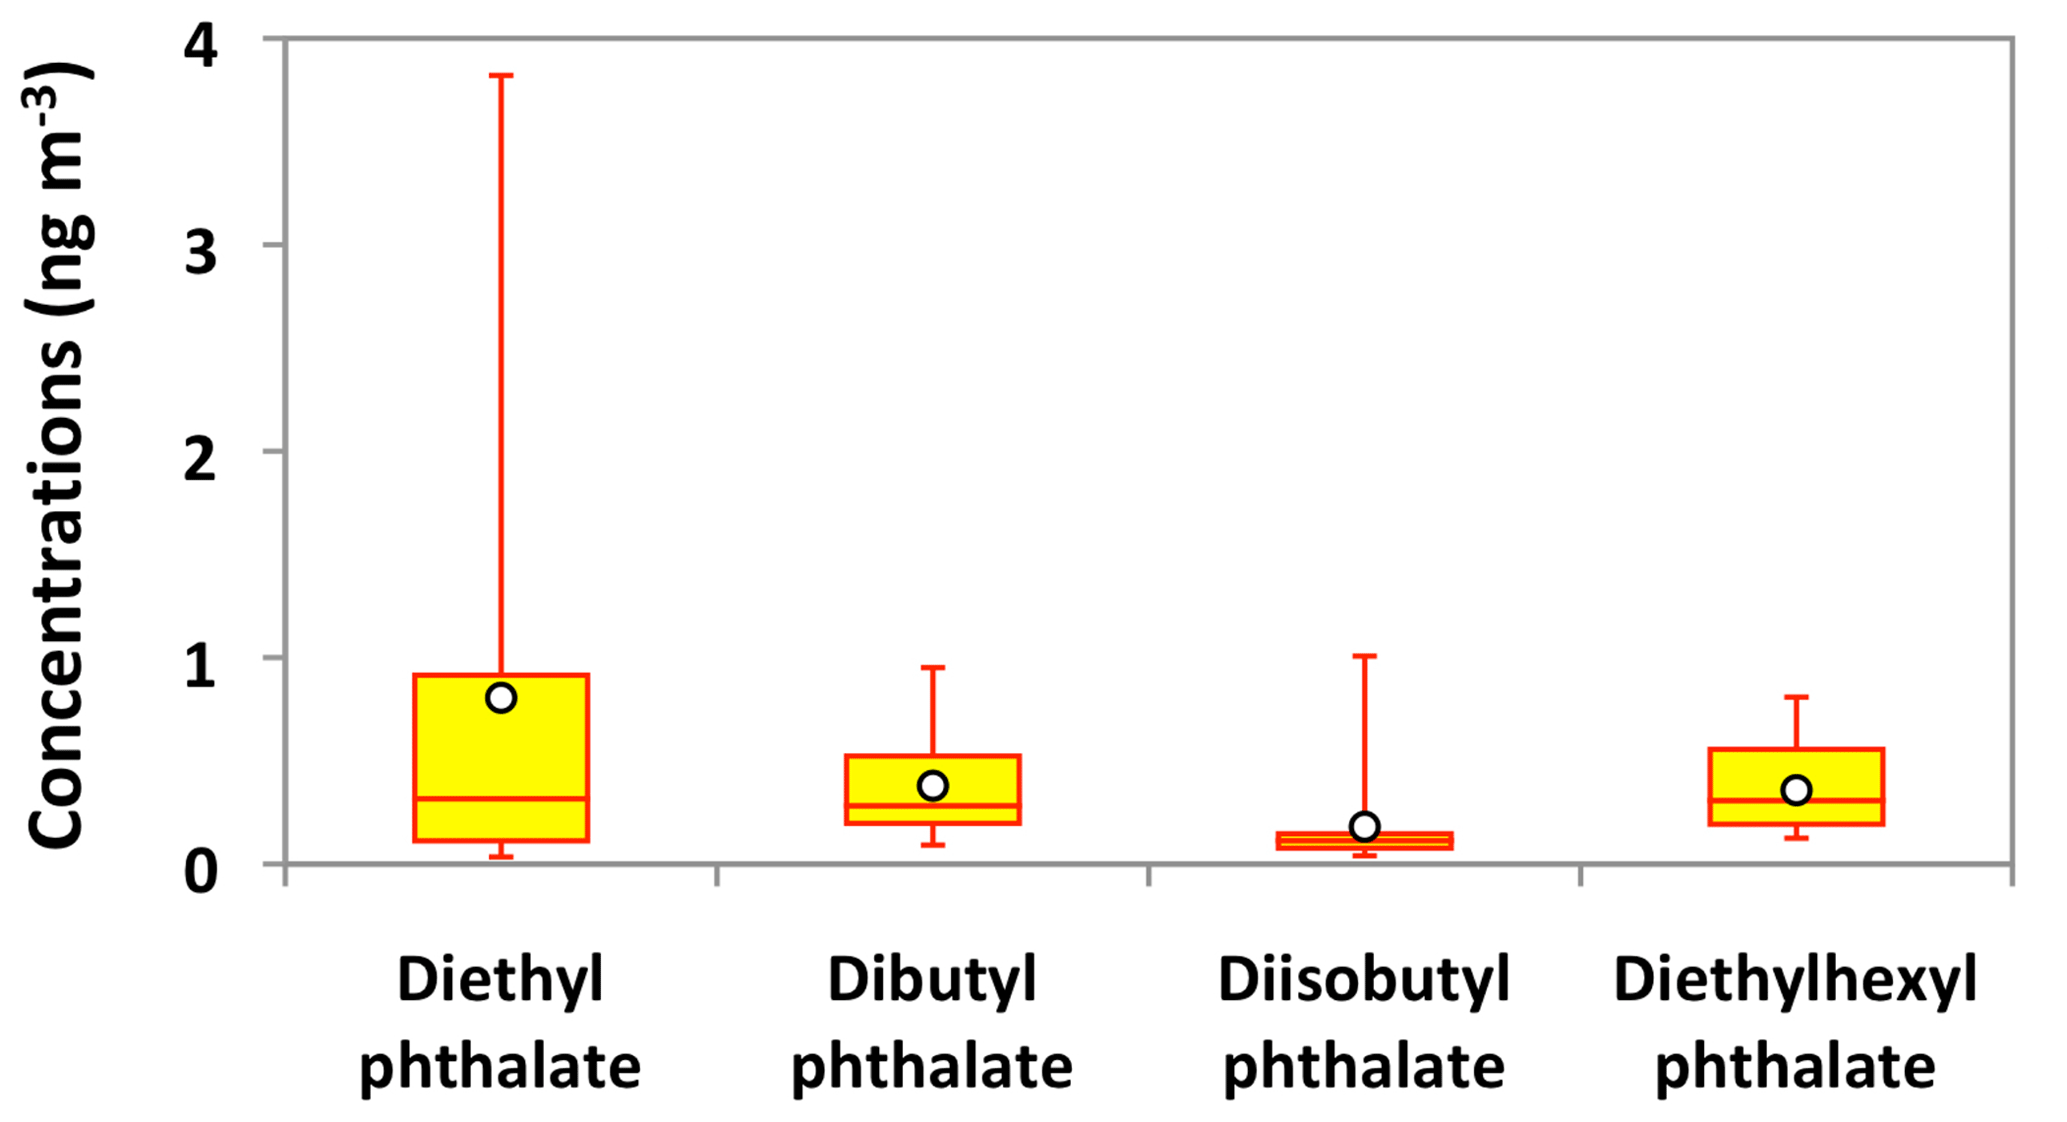
Figure 10Molecular distributions of phthalate esters in PM2.5 aerosols collected in central Alaska. See Fig. 5 for the description of the box-and-whisker diagram.
3.6 Tracers of biogenic SOA
Significant progress has been made in the last decade to better understand SOA formation from BVOCs such as isoprene, monoterpenes and sesquiterpenes (Carlton et al., 2009; Ding et al., 2014; Jathar et al., 2014; Sarkar et al., 2017). SOA is a crucial component of the atmosphere that has an impact on the radiation budget directly by scattering sunlight and indirectly by acting as CCN (Kanakidou et al., 2005; Carlton et al., 2009). Isoprene has conjugated double bonds, and thus it is more reactive towards oxidants such as O3 and NOx, resulting in various intermediates and stable products via a series of oxidative reactions in the atmosphere. We detected six organic compounds, including 2-methylglyceric acid (2-MGA), three C5-alkene triols and two 2-methyltetrols (2-MTLs), as isoprene-SOA tracers in the Alaskan aerosols. Their total concentrations ranged from 2.0 to 142 ng m−3 (avg 41 ng m−3), which are significantly higher than those reported over the North Pacific (0.11 to 0.48 ng m−3) (Fu et al., 2011), Canadian High Arctic (avg 0.30 ng m−3) (Fu et al., 2009), North Pacific to Arctic (avg 0.62 ng m−3) (Ding et al., 2013), western North Pacific (0.05 to 7.22 ng m−3) (Zhu et al., 2016), a forest site in western Germany (avg 20.5 ng m−3) (Kourtchev et al., 2008a), and Mumbai in India (avg 1.1 ng m−3) (Fu et al., 2016), but lower than those in Mt. Changbai (22 to 280 ng m−3) (Wang et al., 2008) and Mt. Fuji (avg 69 ng m−3) (Fu et al., 2014), Research Triangle Park in the USA (19.9 to 384 ng m−3) (Lewandowski et al., 2007) and several sites in China (8.65 to 554 ng m−3) (Ding et al., 2014).
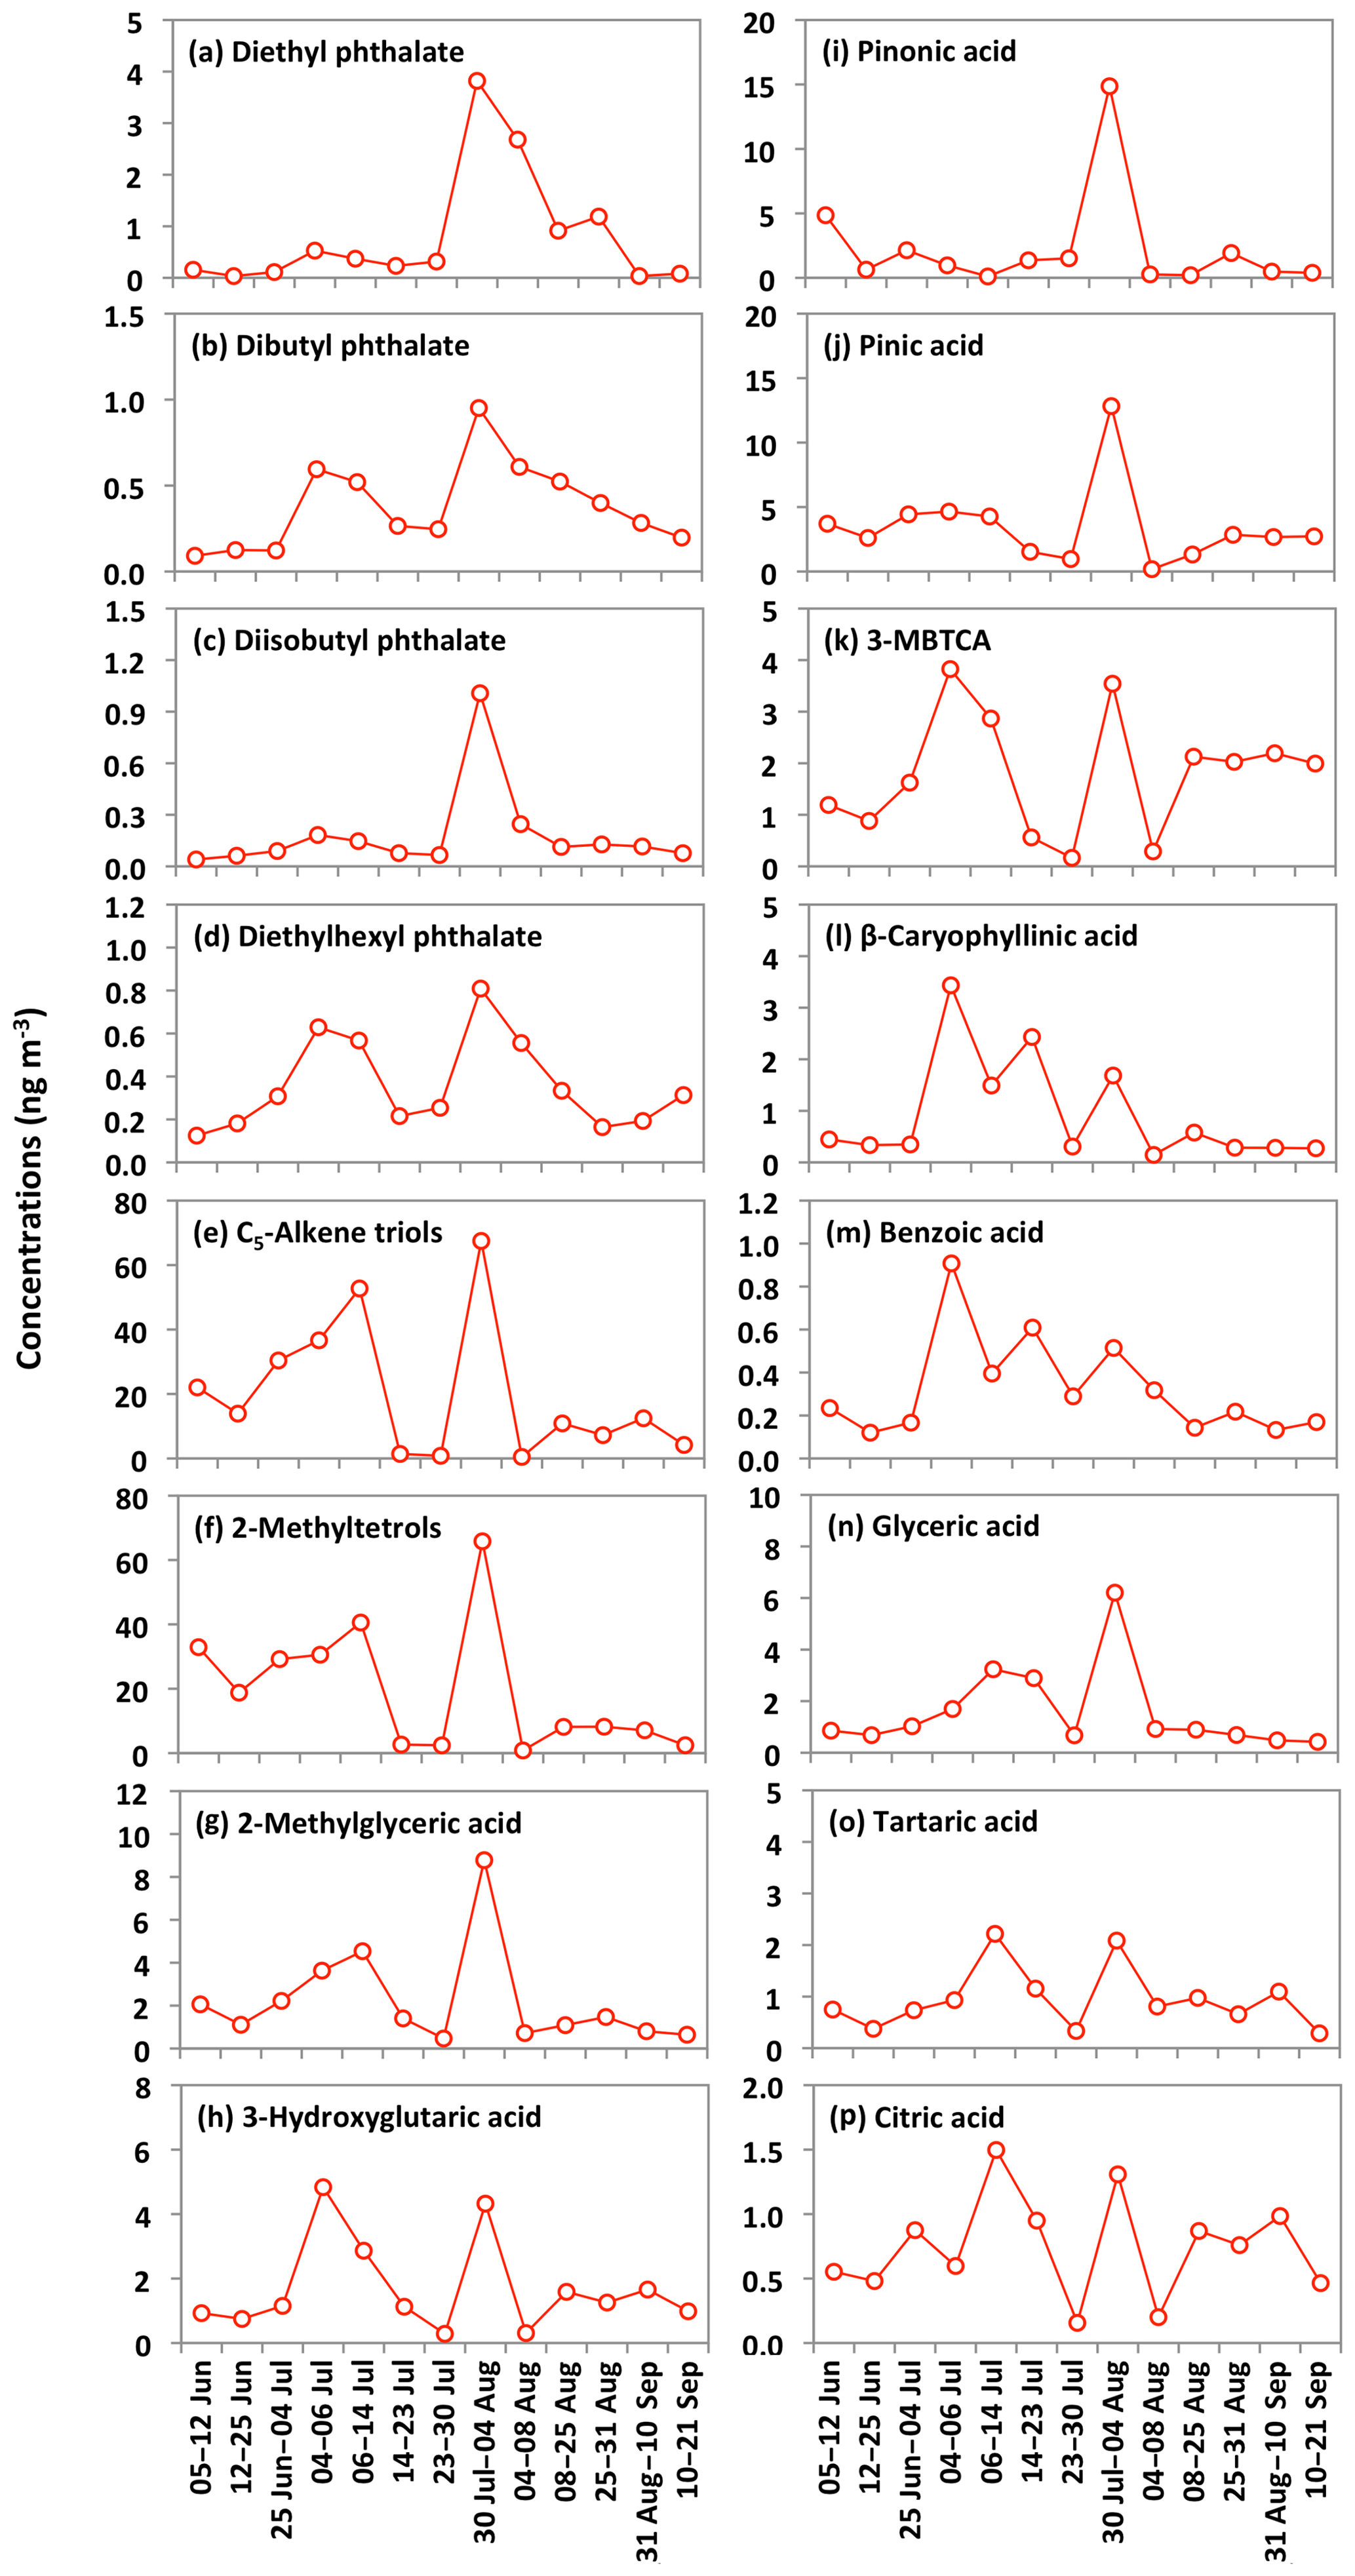
Figure 11Temporal changes in the concentrations of phthalate esters and other organic compounds in the Alaskan aerosols.
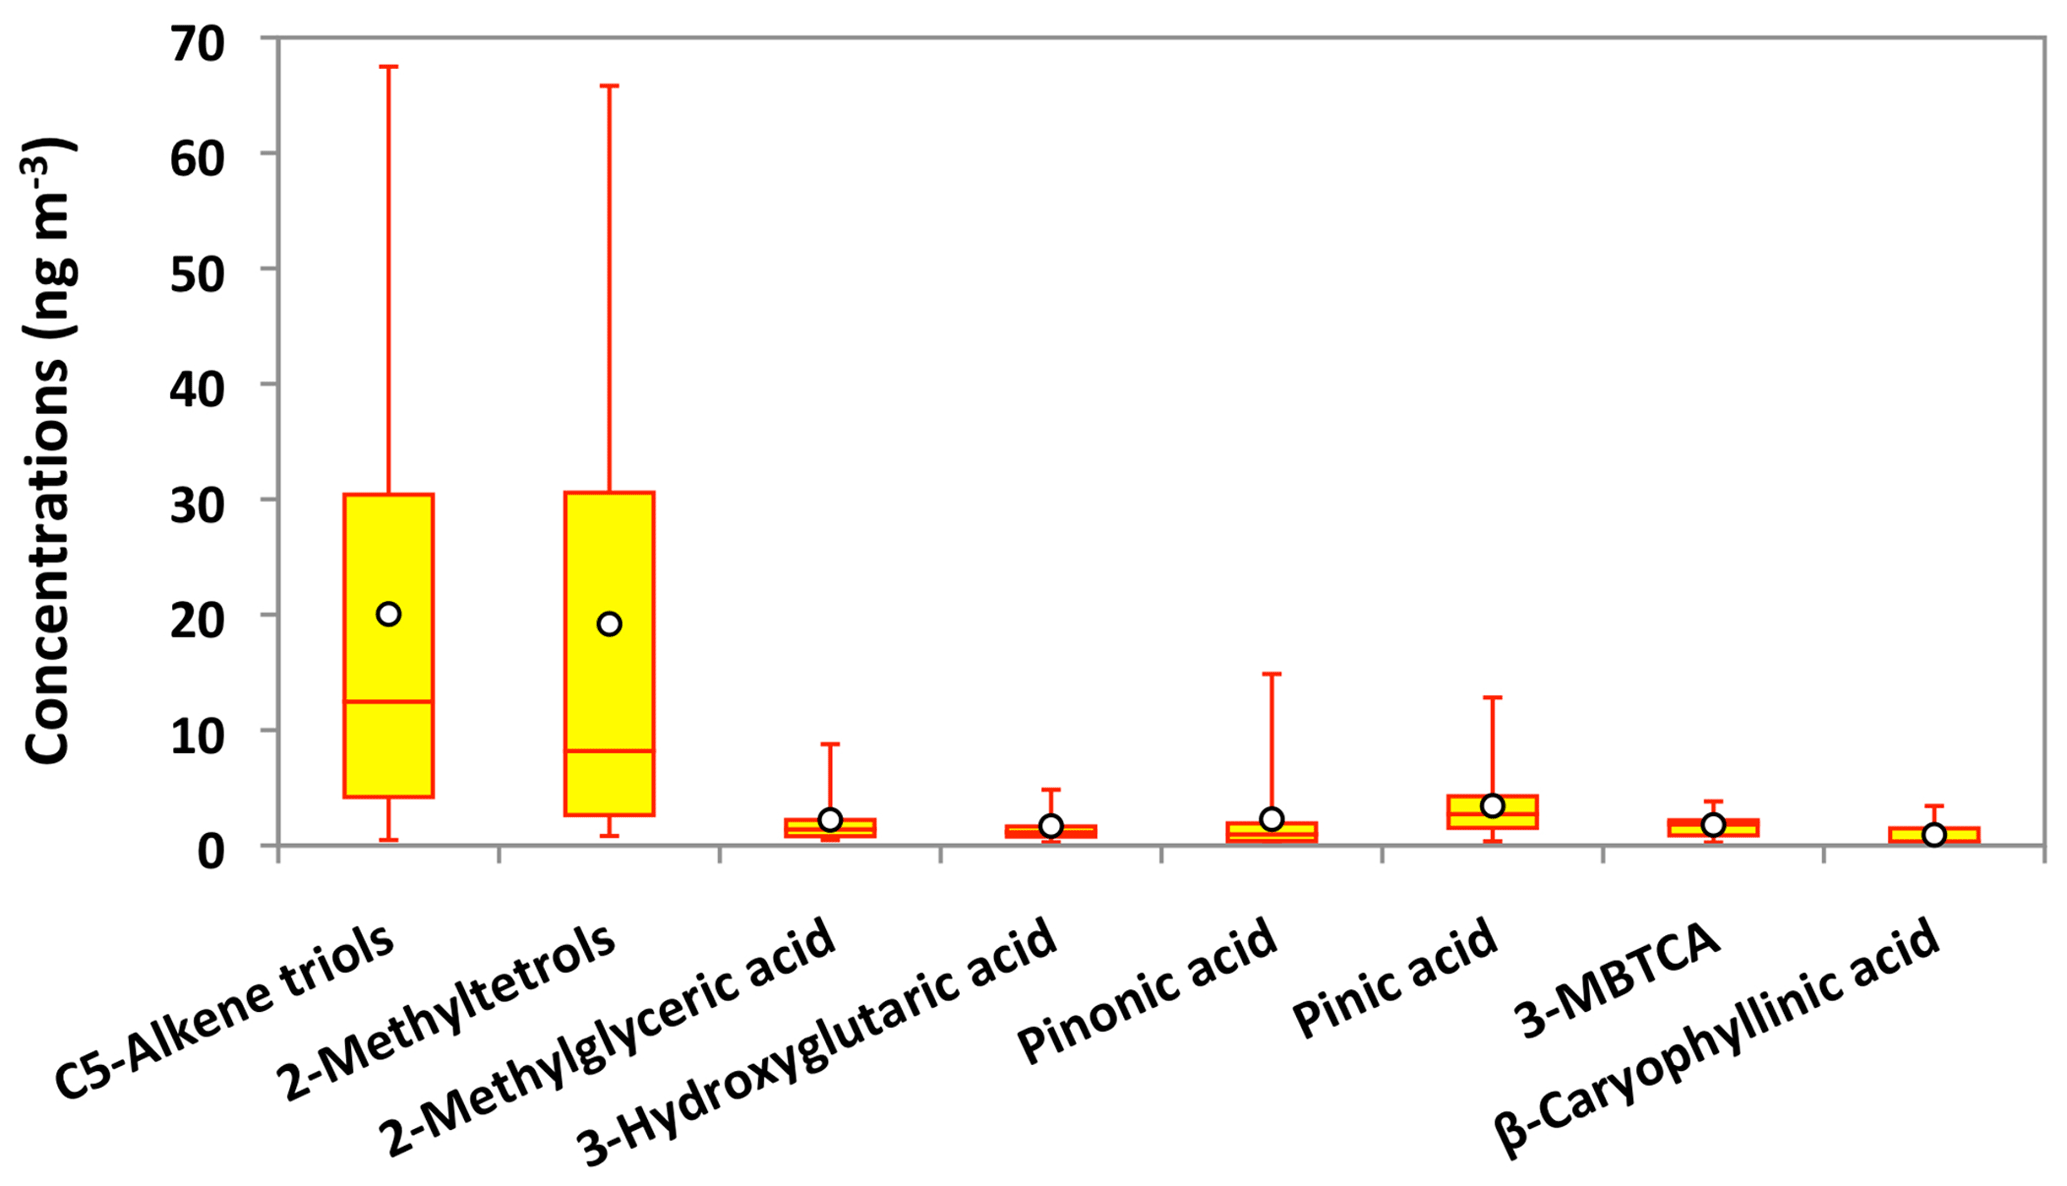
Figure 12Molecular distributions of biogenic secondary organic aerosol tracers in PM2.5 aerosols collected in central Alaska. See Fig. 5 for the description of the box-and-whisker diagram.
Molecular compositions of isoprene-SOA tracers are characterized by the predominance of C5-alkene triols (avg 20 ng m−3) and 2-MTLs (avg 19 ng m−3) in Alaskan aerosols (Fig. 12). Surratt et al. (2010) proposed that C5-alkene triols and 2-MTLs are higher-generation products from the photooxidation of epoxydiols of isoprene under low-NOx conditions. C5-Alkene triols were strongly corrected with 2-MTLs (r=0.97) in the Alaskan aerosols (Table 2). The abundant co-presence of C5-alkene triols and 2-MTLs suggests their similar sources and formation pathways in central Alaska. 2-Methylerythritol (avg 13 ng m−3) is twice as abundant as 2-methylthreitol (avg 5.9 ng m−3), similar to previous studies (Ion et al., 2005; Cahill et al., 2006). The concentration of 2-MGA is significantly lower (avg 2.2 ng m−3) than C5-alkene triols and 2-MTLs (Fig. 12). Surratt et al. (2006) suggested that 2-MGA is produced by the oxidation of methacrolein and methacrylic acid and has been detected as an important gas-phase intermediate in the SOA formation from isoprene under high-NOx conditions. Temporal variations of isoprene-SOA tracers were very similar to each other in Alaskan aerosols (Fig. 11e–g). Their concentrations increased in the sample of 12–25 June to 6–14 July and decreased in the sample of 14–23 July and 23–30 July. They increased significantly in the 30 July to 4 August sample, quickly decreased in the 4–8 August sample, and then remained comparable at the end of the campaign.
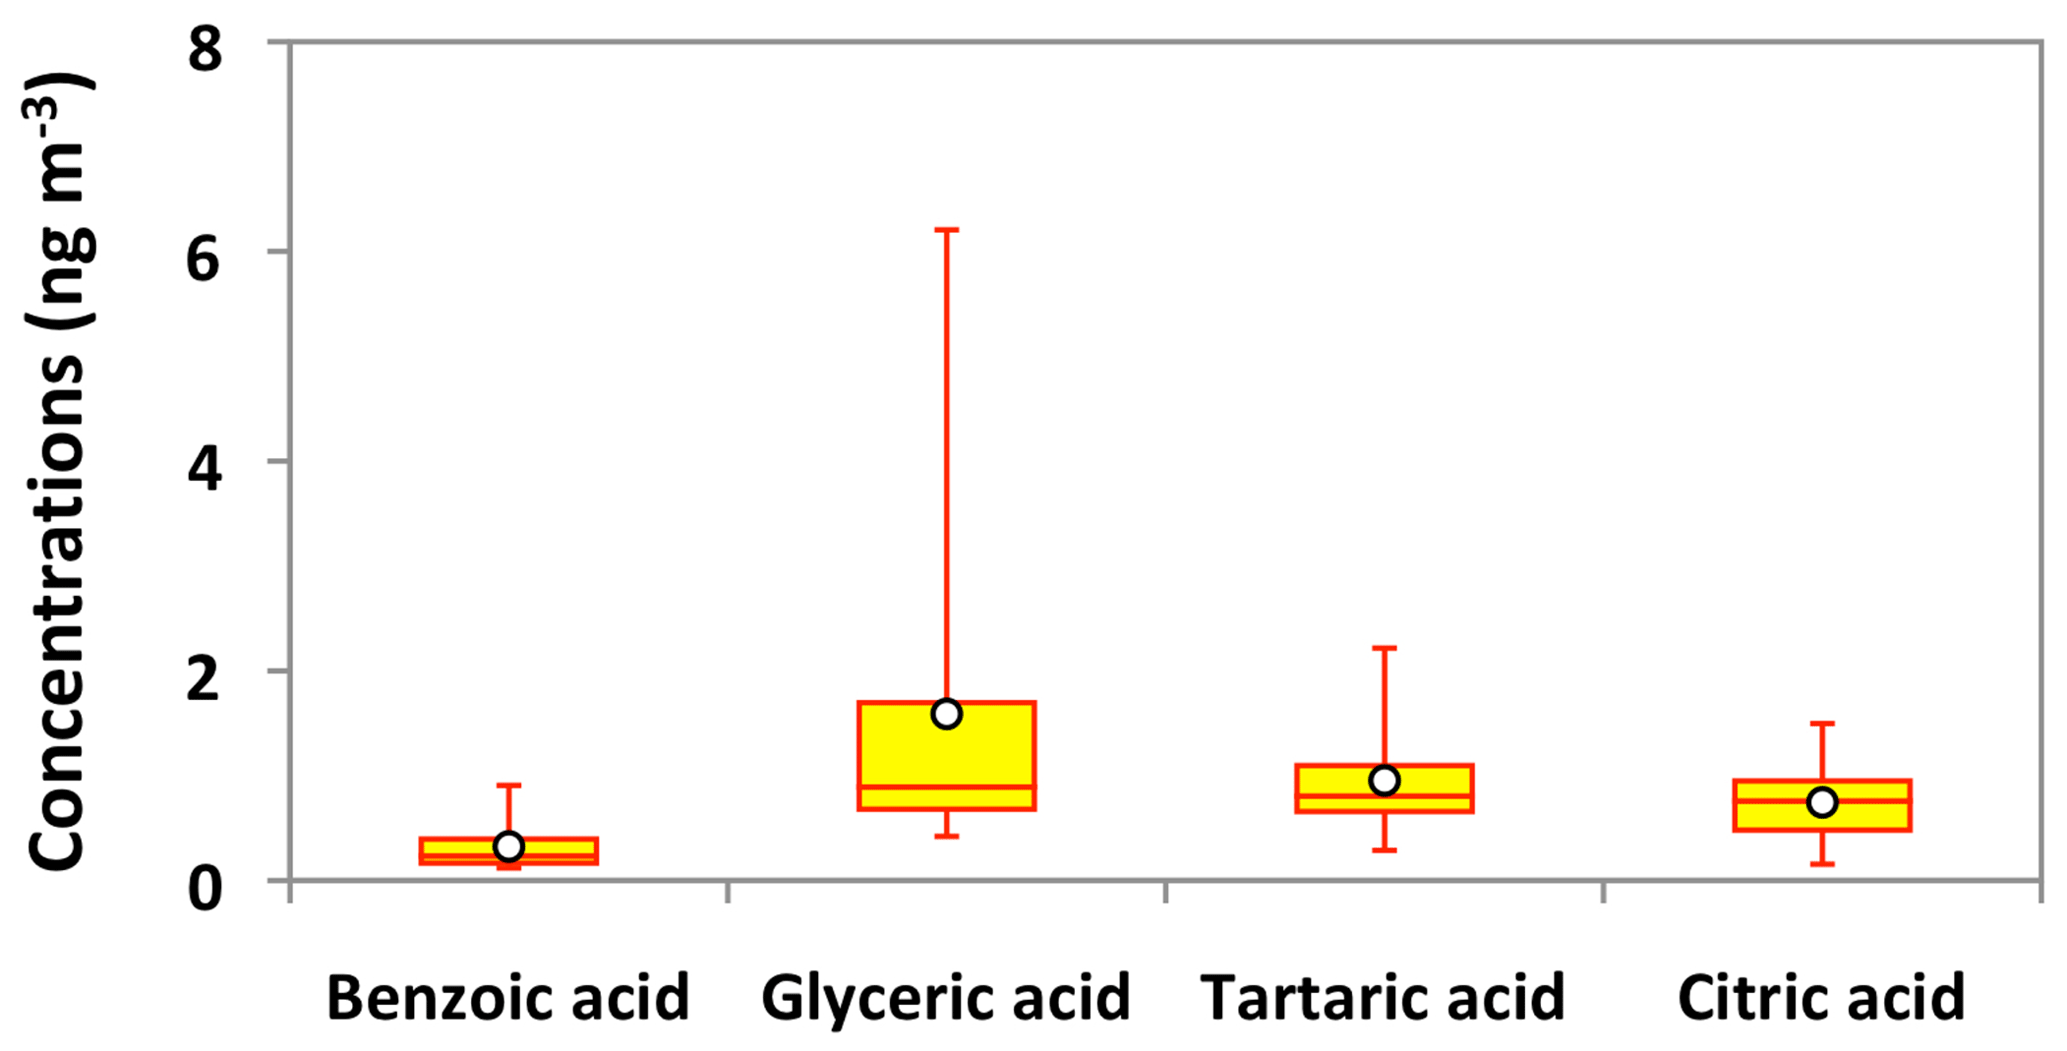
Figure 13Molecular distributions of aromatic acids and polyacids in PM2.5 aerosols collected in central Alaska. See Fig. 5 for the description of the box-and-whisker diagram.
Four organic acids were identified as monoterpene-SOA tracers in Alaskan aerosols. They include 3-hydroxyglutaric acid (3-HGA), pinonic acid (PNA), pinic acid (PA) and 3-methyl-1,2,3-butanetricarboxylic acid (3-MBTCA). Hallquist et al. (2009) suggested that these acids are produced by the oxidation of pinenes through reactions with OH radicals and O3. Their total concentrations ranged from 1.0 to 36 ng m−3 (avg 9.2 ng m−3), which are higher than those reported in the North Pacific (0.02 to 0.22 ng m−3) (Fu et al., 2011), Canadian High Arctic (avg 1.6 ng m−3) (Fu et al., 2009), North Pacific to Arctic (avg 0.05 ng m−3) (Ding et al., 2013), and western North Pacific (0.04 to 10.8 ng m−3) (Zhu et al., 2016), and comparable to those reported at several sites in China (3.09 to 33.8 ng m−3) (Ding et al., 2014) but lower than those reported at Mt. Fuji in Japan (avg 39 ng m−3) (Fu et al., 2014), a forest site in Germany (avg 25.6 ng m−3) (Kourtchev et al., 2008a) and Finland (11.1 to 217 ng m−3) (Kourtchev et al., 2008b). PA is most abundant (avg 3.4 ng m−3) among monoterpene-SOA tracers, followed by PNA (avg 2.3 ng m−3) (Fig. 12). The dominance of PA over PNA in summertime can be explained by the much lower vapor pressure of PA than that of PNA. However, this pattern is different from those found in summertime aerosols at the summit of Mt. Tai in China (Fu et al., 2008) and other sites in Europe (Kavouras and Stephanou, 2002) and North America (Cahill et al., 2006), in which PNA is more abundant than PA.
PA and PNA are the initial photooxidation products of monoterpenes that can be further photooxidized to 3-MBTCA in the atmosphere (Gómez-González et al., 2012). The concentration ratio (3-MBTCA to PA+PNA) can therefore be used to differentiate the fresh and photochemically processed monoterpene-SOA tracers in the atmosphere. We found the ratios to be 0.1 to 1.4 (avg 0.5), demonstrating that monoterpene-SOA are mostly fresh in central Alaska. The ratios of 3-HGA to 3-MBTCA are mostly lower when they are produced from α-pinene as compared to β-pinene. Lewandowski et al. (2013) documented a greater contribution of α-pinene to monoterpene-SOA tracers based on the 3-HGA ∕ 3-MBTCA ratio of about 1 in the southeastern United States than those observed in California (1.8 to 3.8). Ding et al. (2014) also suggested α-pinene as the major precursor in China based on the low ratios in Hefei (1.16) and Qianyanzhou (0.75). We found the ratios ranged from 0.5 to 2.0 in Alaskan aerosols (avg 1.0), indicating that α-pinene mainly contributes to monoterpene-SOA tracers. 3-HGA and 3-MBTCA displayed somewhat similar temporal variations, although the patterns are different from PA and PNA (Fig. 11h–k), which showed very similar variations in Alaskan aerosols.
Sesquiterpenes are BVOCs with high reactivity and relatively low vapor pressure (Duhl et al., 2008). β-Caryophyllene is the dominant sesquiterpene. The ozonolysis or photooxidation of β-caryophyllene produces β-caryophyllinic acid in the atmosphere (Jaoui et al., 2007). Concentrations of β-caryophyllinic acid in Alaskan aerosols ranged from 0.1 to 3.4 ng m−3 (avg 0.9 ng m−3), which are higher than those from the Canadian High Arctic (avg 0.12 ng m−3) and Arctic Ocean (avg 0.017 ng m−3) (Fu et al., 2009, 2013) but lower than those reported at several sites in China (0.17 to 17.4 ng m−3) (Ding et al., 2014) and Research Triangle Park in the USA (5.9 to 25 ng m−3) (Lewandowski et al., 2007). The temporal variation of β-caryophyllinic acid is very different from those of isoprene and monoterpene-SOA tracers detected in Alaskan aerosols (Fig. 11l). Akagi et al. (2011) reported that biogenic VOCs could also be emitted from biomass burning. Our result showed a high level of β-caryophyllinic acid in the samples that were affected by BB in central Alaska. Ciccioli et al. (2014) proposed that sesquiterpenes could be accumulated in leaves and wood because of low volatility and then abundantly emitted upon heating. The temporal trend variation of β-caryophyllinic acid is similar to those of anhydrosugars (Figs. 6a–c and 11l). Interestingly, we found a strong correlation (r=0.98) of β-caryophyllinic acid with levoglucosan (Fig. 8j), again indicating that forest fire largely contributes to the formation of β-caryophyllinic acid in central Alaska.
3.7 Aromatic acids and polyacids: tracers of SOA
We detected benzoic acid in the Alaskan aerosol with the concentration range of 0.1 to 0.9 ng m−3 (avg 0.3 ng m−3). Benzoic acid is produced from several anthropogenic sources. It is a primary pollutant in the automobile emission and smokes derived from burning of biomass and biofuels (Rogge et al., 1993; Kawamura et al., 2002). It is also a secondary product of photochemical degradation of toluene emitted from anthropogenic sources (Suh et al., 2003). It can play an important role in enhancing the new particle formation in the atmosphere (Zhang et al., 2004). The temporal variation of benzoic acid is similar to anhydrosugars detected in Alaskan samples (Figs. 6a–c and 11m). We also found a strong positive correlation (r=0.95) of benzoic acid with levoglucosan (Fig. 8k), demonstrating that BB is the source of benzoic acid in central Alaska.
Table 3Contributions ( %) of individual organic compound classes to organic carbon (OC) in PM2.5 aerosols from central Alaskaa.
a All the organic compounds quantified were converted to carbon contents and then divided by OC. See Deshmukh et al. (2018) for OC and dicarboxylic acids and related compounds. b The results of lignin and resin acids were combined due to the very low contribution of resin acid to OC.
Polyacids are also the secondary photooxidation products of atmospheric organic precursors (Wang et al., 2007; Fu et al., 2012). Concentrations of total polyacids ranged from 1.2 to 10 ng m−3 (avg 3.3 ng m−3), among which glyceric acid (avg 1.6 ng m−3) was dominant (Fig. 13). Significant positive correlations were found among all polyacids (r=0.67–0.87) in Alaskan aerosols (Table 2). These results imply that polyacids may have similar sources or formation pathways in central Alaska. We found that polyacids showed no significant correlations with benzoic acid (r=0.17–0.53), which is mostly of BB origin in Alaskan samples, as discussed above (Table 2). These correlations and different temporal trends of benzoic acid and polyacids suggest that forest fires are not the main source of polyacids in the Alaskan samples (Fig. 11m–p). This remark is further supported by the insignificant correlations of polyacids with levoglucosan (r=0.29–0.47) (Fig. 8l–n). Claeys et al. (2004) suggested that SOA tracers such as tartaric acid are produced by the photochemical oxidation of isoprene. Interestingly, significant positive correlations (r=0.67–0.78) of polyacids were found with total isoprene-SOA tracers detected in Alaskan samples (Table 2), suggesting that they may be produced by photooxidation of isoprene in the Alaskan atmosphere.
3.8 Contributions of different compound classes to aerosol organic carbon
The contributions of each compound class to organic carbon (OC) in the Alaskan aerosols are given in Table 3. BB tracers accounted for 1.35 % to 8.35 % (avg 4.40 %) of OC. The contribution of anhydrosugars to OC was substantially higher (avg 4.26 %) than that of lignin and resin acids (avg 0.14 %). This value from Fairbanks is notably higher than those reported in aerosol samples collected from a round-the-world cruise (avg 0.15 %) (Fu et al., 2011), Gosan, Jeju Island in Korea (avg 0.29 %), Sapporo (avg 0.44 %) and Chichijima (avg 0.06 %) in Japan (Simoneit et al., 2004a), and Chennai in India (avg 0.59 %) (Fu et al., 2010). The lipid compound classes in Fairbanks samples accounted for 1.16 to 45.8 % (avg 12.4 %) of OC. n-Alkanoic acids contributed on average 7.48 % (0.67 to 15.9 %), which is much higher than those estimated in samples of the round-the-world cruise (avg 0.82 %), Sapporo (avg 0.62 %) and Chichijima (avg 0.78 %) (Simoneit et al., 2004a; Fu et al., 2011). The tracers of primary biological aerosol particles accounted for on average 0.85 % (0.17 % to 1.50 %), among which comparable contributions of primary sugars (avg 0.39 %) and sugar alcohols (avg 0.46 %) to OC were found in Alaskan aerosols. Plastic burning tracers accounted for 0.02 to 1.07 % of OC (avg 0.14 %), which is lower than those from the Sapporo (avg 1.1 %) and Chichijima samples (avg 1.2 %) (Simoneit et al., 2004a) and tropical samples from India (avg 4.50 %) (Fu et al., 2010). Biogenic SOA tracers contributed 0.18 to 3.99 % of OC (avg 1.66 %), among which the contribution of isoprene-derived SOA tracers was high (avg 1.28 %), followed by monoterpene (avg 0.34 %) and sesquiterpene (avg 0.03 %) SOA tracers. Other SOA tracers with minor contribution to OC include polyacids (avg 0.08 %) and aromatic acids (avg 0.02 %).
With the consideration of water-soluble dicarboxylic acids and related polar compounds measured in the same sample sets as reported in Deshmukh et al. (2018), the total organic compounds identified in the Alaskan aerosols accounted for 6.37 % to 59.2 % with a mean of 21.4 % of OC. This result indicates that a substantial fraction of OAs studied in the Alaskan site can be identified at a molecular level.
We identified 96 organic compounds in PM2.5 samples collected at Fairbanks in central Alaska during the summer campaign in 2009. Concentrations of total organic compounds ranged from 113 to 1664 ng m−3 (avg 535 ng m−3). The most abundant compound classes in the Alaskan aerosol are anhydrosugars (avg 186 ng m−3) and n-alkanoic acids (avg 185 ng m−3). The temporal variations of anhydrosugars dramatically changed during the campaign, showing peaks during BB events. The similar temporal trends of lipids and strong correlations with levoglucosan demonstrated that local forest fires likely control the atmospheric levels of OAs in central Alaska. The concentration ratios of levoglucosan to mannosan (2.2 to 6.8) and syringic to vanillic acid (0.02 to 0.5) suggest that burning of softwood is a common source of OAs. The higher levels of HMW n-alkanoic acids and n-alkanols than their LMW homologs together with high CPI values of n-alkanes (5.2 to 9.9), n-alkanols (3.0 to 10) and n-alkanoic acids (5.6 to 9.8) further suggest that they were emitted by the thermal ablation of plant waxes during forest fires in central Alaska. The temporal patterns of mannitol and arabitol suggested that the rainfall played an important role in enhancing their levels in central Alaska. The molecular compositions of phthalate esters showed that diethyl phthalate is a commonly used plasticizer in central Alaska. The molecular composition of biogenic SOA tracers with a predominance of isoprene-SOA tracers (avg 41 ng m−3) suggested that isoprene is a crucial precursor of SOA over central Alaska. Our results provide valuable information to better understand the compositions of OAs and their sources and formation pathways in the subarctic atmosphere.
The Arctic is a critical region on the Earth, with a significant warming and high sensitivity to climate forcing due to a strong effect on an albedo–sea ice feedback system. Our results confirmed that forest fires and plant emissions are important factors controlling the organic chemical composition of fine aerosol particles in central Alaska. It is worthwhile therefore to note from the above discussion that Fairbanks exemplifies many of the problems of pollution in the Arctic regions. The local and regional BB episodes in the warmer season enhanced the atmospheric levels of OAs in central Alaska. Because the residence time of fine particles is relatively long in the atmosphere, we propose that OAs of PM2.5 at Fairbanks can be subjected to long-range transport to the Arctic causing a significant influence on the air quality and climate in the Arctic region. Although we studied the aerosol samples collected in 2009, further research is needed to characterize the seasonal and interannual trends of OAs using more recent aerosol samples to better evaluate their current impact in the Arctic atmosphere.
The data set of this paper is given in Table S1 in the Supplement.
The supplement related to this article is available online at: https://doi.org/10.5194/acp-19-14009-2019-supplement.
KK designed the research. YK collected the aerosol samples. DKD and MMH analyzed the samples for organic tracer compounds. DKD evaluated the data and wrote the paper under the supervision of KK. All the authors contributed to discussing results and commenting on the paper.
The authors declare that they have no conflict of interest.
We acknowledge financial support from the Japan Society for the Promotion of Science (JSPS). This work was partially conducted under the Japan Agency for Marine-Earth Science and Technology – International Arctic Research Center (JAMSTEC-IARC) collaboration project with funding from JAMSTEC. We appreciate the financial support from a JSPS fellowship to Dhananjay Kumar Deshmukh (PU17907) and the Special Grant Program for International Students (SGPIS) of Hokkaido University, Sapporo, Japan, for the financial support to M. Mozammel Haque. We thank Bang-Yong Lee for his support during the sample collection.
This research has been supported by the Japan Society for the Promotion of Science (grant no. 24221001) and National Research Foundation of Korea (grant nos. NRF-2016M1A5A1901769 and KOPRI-PN-19081).
This paper was edited by Maria Kanakidou and reviewed by three anonymous referees.
Agarwal, S., Aggarwal, S. G., Okuzawa, K., and Kawamura, K.: Size distributions of dicarboxylic acids, ketoacids, α-dicarbonyls, sugars, WSOC, OC, EC and inorganic ions in atmospheric particles over Northern Japan: implication for long-range transport of Siberian biomass burning and East Asian polluted aerosols, Atmos. Chem. Phys., 10, 5839–5858, https://doi.org/10.5194/acp-10-5839-2010, 2010.
Akagi, S. K., Yokelson, R. J., Wiedinmyer, C., Alvarado, M. J., Reid, J. S., Karl, T., Crounse, J. D., and Wennberg, P. O.: Emission factors for open and domestic biomass burning for use in atmospheric models, Atmos. Chem. Phys., 11, 4039–4072, https://doi.org/10.5194/acp-11-4039-2011, 2011.
Andreae, M. O. and Rosenfeld, D.: Aerosol-cloud-precipitations Part 1: the nature and sources of cloud-active aerosols, Earth-Sci. Rev., 89, 13–41, 2008.
Atlas, E. and Giam, C. S.: Global transport of organic ambient concentrations in remote marine atmosphere, Science, 211, 163–165, 1981.
Bai, J., Sun, X., Zhang, C., Xu, Y., and Qi, C.: The OH-initiated atmospheric reaction mechanism and kinetics for levoglucosan emitted in biomass burning, Chemosphere, 93, 2004–2010, 2013.
Baker, H. G., Baker, I., and Hodges, S. A.: Sugar composition of nectars and fruits consumed by birds and bats in the tropics and subtropics, Biotropica, 30, 559–586, 1998.
Barrie, L. A.: Arctic air pollution: an overview of current knowledge, Atmos. Environ., 20, 643–663, 1986.
Bauer, H., Claeys, M., Vermeylen, R., Schueller, E., Weinke, G., Berger, A., and Puxbaum, H.: Arabitol and mannitol as tracers for the quantification of airborne fungal spores, Atmos. Environ., 42, 588–593, 2008.
Burch, M. and Levetin, E.: Effects of meteorological conditions on spore plumes, Int. J. Biometeorol., 46, 107–117, 2002.
Cahill, T. M., Seaman, V. Y., Charles, M. J., Holzinger, R., and Goldstein, A. H.: Secondary organic aerosols formed from oxidation of biogenic volatile organic compounds in the Sierra Nevada Mountains of California, J. Geophys. Res., 111, D16312, https://doi.org/10.1029/2006JD007178, 2006.
Carlton, A. G., Wiedinmyer, C., and Kroll, J. H.: A review of Secondary Organic Aerosol (SOA) formation from isoprene, Atmos. Chem. Phys., 9, 4987–5005, https://doi.org/10.5194/acp-9-4987-2009, 2009.
Caseiro, A., Bauer, H., Schmidl, C., Pio, C. A., and Puxbaum, H.: Wood burning impact on PM10 in three Austrian regions, Atmos. Environ., 43, 2186–2195, 2009.
Ciccioli, P., Centritto, M., and Loreto, F.: Biogenic volatile organic compound emissions from vegetation fires, Plant Cell Environ., 37, 1810–1825, 2014.
Cheng, Y., Engling, G., He, K.-B., Duan, F.-K., Ma, Y.-L., Du, Z.-Y., Liu, J.-M., Zheng, M., and Weber, R. J.: Biomass burning contribution to Beijing aerosol, Atmos. Chem. Phys., 13, 7765–7781, https://doi.org/10.5194/acp-13-7765-2013, 2013.
Cong, Z., Kawamura, K., Kang, S., and Fu, P.: Penetration of biomass-burning emissions from South-Asia through the Himalayas: new insights from atmospheric organic acids, Sci. Rep.-UK, 5, 9580, https://doi.org/10.1038/srep09580, 2015.
Cowie, G. L. and Hedges, J. I.: Carbohydrate sources in a coastal marine-environment, Geochim. Cosmochim. Ac., 48, 2075–2087, 1984.
Crutzen, P. J. and Andreae, M. O.: Biomass burning in the tropics: impact on atmospheric chemistry and biogeochemical cycles, Science, 250, 1669–1678, 1990.
Claeys, M., Graham, B., Vas, G., Wang, W., Vermeylen, R., Pashynska, V., Cafmeyer, J., Guyon, P., Andreae, M O., Artaxo, P., and Maenhaut, W.: Formation of secondary organic aerosols through photooxidation of isoprene, Science, 303, 1173–1176, 2004.
Claeys, M., Kourtchev, I., Pashynska, V., Vas, G., Vermeylen, R., Wang, W., Cafmeyer, J., Chi, X., Artaxo, P., Andreae, M. O., and Maenhaut, W.: Polar organic marker compounds in atmospheric aerosols during the LBA-SMOCC 2002 biomass burning experiment in Rondônia, Brazil: sources and source processes, time series, diel variations and size distributions, Atmos. Chem. Phys., 10, 9319–9331, https://doi.org/10.5194/acp-10-9319-2010, 2010.
Deshmukh, D. K., Haque, M. M., Kawamura, K., and Kim, Y.: Dicarboxylic acids, oxocarboxylic acids and α-dicarbonyls in fine aerosols over central Alaska: implications for sources and atmospheric processes, Atmos. Res., 202, 128–139, 2018.
Ding, L. C., Fu, K., Wang, D. K. W., Dann, T., and Austin, C. C.: A new direct thermal desorption-GC/MS method: organic speciation of ambient particulate matter collected in Golden, BC, Atmos. Environ., 43, 4894–4902, 2009.
Ding, X., Wang, X. M., Xie, Z. Q., Zhang, Z., and Sun, L. G.: Impacts of Siberian biomass burning on organic aerosols over the North Pacific Ocean and the Arctic: primary and secondary organic tracers, Environ. Sci. Technol., 47, 3149–3157, 2013.
Ding, X., He, Q. F., Shen, R. Q., Yu, Q. Q., and Wang, X. M.: Spatial distributions of secondary organic aerosols from isoprene, monoterpenes, β-caryophyllene, and aromatics over China during summer, J. Geophys. Res., 119, 11877–11891, 2014.
Draxler, R. R. and Rolph, G. D.: Hybrid Single-Particle Lagrangian Integrated Trajectory Model, available at: https://www.ready.noaa.gov/HYSPLIT.php (last access: 20 October 2018), 2013.
Duhl, T. R., Helmig, D., and Guenther, A.: Sesquiterpene emissions from vegetation: a review, Biogeosciences, 5, 761–777, https://doi.org/10.5194/bg-5-761-2008, 2008.
Eisenreich, S. J., Looney, B. B., and David, J. B.: Airborne organic contaminants in the Great Lakes ecosystem, Environ. Sci. Technol., 15, 30–38, 1981.
Elbert, W., Taylor, P. E., Andreae, M. O., and Pöschl, U.: Contribution of fungi to primary biogenic aerosols in the atmosphere: wet and dry discharged spores, carbohydrates, and inorganic ions, Atmos. Chem. Phys., 7, 4569–4588, https://doi.org/10.5194/acp-7-4569-2007, 2007.
Engling, G., Lee, J. J., Tsai, Y. W., Lung, S. C. C., Chou, C. C. K., and Chan, C. Y.: Size-resolved anhydrosugar composition in smoke aerosol from controlled field burning of rice straw, Aerosol Sci. Tech., 43, 662–672, 2009.
Fine, P. M., Cass, G. R., and Simoneit, B. R. T.: Chemical characterization of fine particle emissions from fireplace combustion of wood grown in the northeastern United States, Environ. Sci. Technol., 35, 2665–2675, 2001.
Fine, P. M., Cass, G. R., and Simoneit, B. R. T.: Chemical characterization of fine particle emissions from the fireplace combustion of woods grown in the Southern United States, Environ. Sci. Technol., 36, 1442–1451, 2002.
Fine, P. M., Cass, G. R., and Simoneit, B. R. T.: Chemical characterization of fine particle emissions from the fireplace combustion of woods types grown in the Midwestern and Western United States, Environ. Eng. Sci., 21, 387–409, 2004.
French, N. H. F., Kasischke, E. S., and Williams, D. G.: Variability in the emission of carbon-based trace gases from wildfire in the Alaskan boreal forest, J. Geophys. Res., 108, 8151, https://doi.org/10.1029/2001JD000480, 2003.
Fraser, M. P. and Lakshmanan, K.: Using levoglucosan as a molecular marker for the long-range transport of biomass combustion aerosols, Environ. Sci. Technol., 34, 4560–4564, 2000.
Fu, P., Kawamura, K., Okuzawa, K., Aggarwal, S. G., Wang, G., Kanaya, Y., and Wang, Z.: Organic molecular compositions and temporal variations of summertime mountain aerosols over Mt. Tai, North China Plain, J. Geophys. Res., 113, D19107, https://doi.org/10.1029/2008JD009900, 2008.
Fu, P., Aggarwal, S. G., Chen, J., Li, J., Sun, Y., Wang, Z., Chen, H., Liao, H., Ding, A., Umarji, G. S., Patil, R. S., Chen, Q., and Kawamura, K.: Molecular markers of secondary organic aerosol in Mumbai, India, Environ. Sci. Technol., 50, 4659–4667, 2016.
Fu, P. Q., Kawamura, K., and Barrie, L. A.: Photochemical and other sources of organic compounds in the Canadian high Arctic aerosol pollution during winter-spring, Environ. Sci. Technol., 43, 286–292, 2009.
Fu, P. Q., Kawamura, K., Chen, J., Li, J., Sun, Y. L., Liu, Y., Tachibana, E., Aggarwal, S. G., Okuzawa, K., Tanimoto, H., Kanaya, Y., and Wang, Z. F.: Diurnal variations of organic molecular tracers and stable carbon isotopic composition in atmospheric aerosols over Mt. Tai in the North China Plain: an influence of biomass burning, Atmos. Chem. Phys., 12, 8359–8375, https://doi.org/10.5194/acp-12-8359-2012, 2012.
Fu, P. Q., Kawamura, K., Chen, J., Charrière, B., and Sempéré, R.: Organic molecular composition of marine aerosols over the Arctic Ocean in summer: contributions of primary emission and secondary aerosol formation, Biogeosciences, 10, 653–667, https://doi.org/10.5194/bg-10-653-2013, 2013.
Fu, P. Q., Kawamura, K., Chen, J., and Miyazaki, Y.: Secondary production of organic aerosols from biogenic VOCs over Mt. Fuji, Japan, Environ. Sci. Technol., 48, 8491–8497, 2014.
Fu, P. Q., Kawamura, K., Pavuluri, C. M., Swaminathan, T., and Chen, J.: Molecular characterization of urban organic aerosol in tropical India: contributions of primary emissions and secondary photooxidation, Atmos. Chem. Phys., 10, 2663–2689, https://doi.org/10.5194/acp-10-2663-2010, 2010.
Fu, P. Q., Kawamura, K., and Miura, K.: Molecular characterization of marine organic aerosols collected during a round-the-world cruise, J. Geophys. Res., 116, D13302, https://doi.org/10.1029/2011JD015604, 2011.
Gensch, I., Sang-Arlt, X. F., Laumer, W., Chan, C. Y., Engling, G., Rudolph, J., and Kiendler-Scharr, A.: Using δ13C of levoglucosan as a chemical clock, Environ. Sci. Technol., 52, 11094–11101, 2018.
Giannoni, M., Martellini, T., Bubba, M. D., Gambaro, A., Zangrando, R., Chiari, M., Lepri, L., and Cincinelli, A.: The use of levoglucosan for tracing biomass burning in PM2.5 samples in Tuscany (Italy), Environ. Pollut., 167, 7–15, 2012.
Gómez-González, Y., Wang, W., Vermeylen, R., Chi, X., Neirynck, J., Janssens, I. A., Maenhaut, W., and Claeys, M.: Chemical characterisation of atmospheric aerosols during a 2007 summer field campaign at Brasschaat, Belgium: sources and source processes of biogenic secondary organic aerosol, Atmos. Chem. Phys., 12, 125–138, https://doi.org/10.5194/acp-12-125-2012, 2012.
Gottwald, T. R., Trocine, T. M., and Timmer, L. W.: A computer controlled environmental chamber for the study of aerial fungal spore release, Phytopathology, 87, 1078–1084, 1997.
Graham, B., Mayol-Bracero, O. L., Guyon, P., Roberts, G. C., Decesari, S., Facchini, M. C., Artaxo, P., Maenhaut, W., Koll, P., and Andreae, M. O.: Water-soluble organic compounds in biomass burning aerosols over Amazonia 1: characterization by NMR and GC-MS., J. Geophys. Res., 107, 8047, https://doi.org/10.1029/2001JD000336, 2002.
Graham, B., Guyon, P., Taylor, P. E., Artaxo, P., Maenhaut, W., Glovsky, M. M., Flagan, R. C., and Andreae, M. O.: Organic compounds present in the natural Amazonian aerosol: characterization by gas chromatography-mass spectrometry, J. Geophys. Res., 108, 4766, https://doi.org/10.1029/2003JD003990, 2003.
Grell, G., Freitas, S. R., Stuefer, M., and Fast, J.: Inclusion of biomass burning in WRF-Chem: impact of wildfires on weather forecasts, Atmos. Chem. Phys., 11, 5289–5303, https://doi.org/10.5194/acp-11-5289-2011, 2011.
Guasco, T. L., Cuadra-Rodriguez, L. A., Pedler, B. E., Ault, A. P., Collins, D. B., Zhao, D., Kim, M. J., Ruppel, M. J., Wilson, S. C., Pomeroy, R. S., Grassian, V. H., Azam, F., Bertram, T. H., and Prather, K. A.: Transition metal associations with primary biological particles in sea spray aerosol generated in a wave channel, Environ. Sci. Technol., 48, 1324–1333, 2013.
Hallquist, M., Wenger, J. C., Baltensperger, U., Rudich, Y., Simpson, D., Claeys, M., Dommen, J., Donahue, N. M., George, C., Goldstein, A. H., Hamilton, J. F., Herrmann, H., Hoffmann, T., Iinuma, Y., Jang, M., Jenkin, M. E., Jimenez, J. L., Kiendler-Scharr, A., Maenhaut, W., McFiggans, G., Mentel, Th. F., Monod, A., Prévôt, A. S. H., Seinfeld, J. H., Surratt, J. D., Szmigielski, R., and Wildt, J.: The formation, properties and impact of secondary organic aerosol: current and emerging issues, Atmos. Chem. Phys., 9, 5155–5236, https://doi.org/10.5194/acp-9-5155-2009, 2009.
Haque, M. M., Kawamura, K., and Kim, Y.: Seasonal variations of biogenic secondary organic aerosol tracers in ambient aerosols from Alaska, Atmos. Environ., 130, 95–104, 2016.
Hays, M. D., Fine, P. M., Geron, C. D., Kleeman, M. J., and Gullett, B. K.: Open burning of agricultural biomass: physical and chemical properties of particle-phase emissions, Atmos. Environ., 39, 6747–6764, 2005.
Hegg, D. A., Warren, S. G., Grenfell, T. C., Doherty, S. J., Larson, T. V., and Clarke, A. D.: Source attribution of black carbon in Arctic snow, Environ. Sci. Technol., 43, 4016–4021, 2009.
Hennigan, C. J., Sullivan, A. P., Collett, J. L., and Robinson, A. L.: Levoglucosan stability in biomass burning particles exposed to hydroxyl radicals, Geophys. Res. Lett., 37, L09806, https://doi.org/10.1029/2010GL043088, 2010.
Hinzman, L. D., Bettez, N. D., Bolton, W. R., Chapin, F. S., Dyurgerov, M. B., Fastie, C. L., Griffith, B., Hollister, R. D., Hope, A., Huntington, H. P., Jensen, A. M., Jia, G. J., Jorgenson, T., Kane, D. L., Klein, D. R., Kofinas, G., Lynch, A. H., Lloyd, A. H., McGuire, A. D., Nelson, F. E., Oechel, W. C., Osterkamp, T. E., Racine, C. H., Romanovsky, V. E., Stone, R. S., Stow, D. A., Sturm, M., Tweedie, C. E., Vourlitis, G. L., Walker, M. D., Walker, D. A., Webber, P. J., Welker, J. M., Winker, K. S., and Yoshikawa, K.: Evidence and implications of recent climate change in northern Alaska and other arctic regions, Climate Change, 72, 251–298, 2005.
Hoffmann, D., Tilgner, A., Iinuma, Y., and Hermann, H.: Atmospheric stability of levoglucosan: a detailed laboratory and modeling study, Environ. Sci. Technol., 44, 694–699, 2009.
Hu, Q. H., Xie, Z. Q., Wang, X. M., Kang, H., and Zhang, P. F.: Levoglucosan indicates high levels of biomass burning aerosols over oceans from the Arctic to Antarctic, Sci. Rep.-UK, 3, 3119, https://doi.org/10.1038/Srep03119, 2013.
Ion, A. C., Vermeylen, R., Kourtchev, I., Cafmeyer, J., Chi, X., Gelencsér, A., Maenhaut, W., and Claeys, M.: Polar organic compounds in rural PM2.5 aerosols from K-puszta, Hungary, during a 2003 summer field campaign: Sources and diel variations, Atmos. Chem. Phys., 5, 1805–1814, https://doi.org/10.5194/acp-5-1805-2005, 2005.
IPCC: Climate change 2001: the scientific basis. Contribution of Working Group I to the third assessment report of the Intergovernmental Panel on Climate Change, Cambridge University Press, Cambridge, 2001.
Iziomon, M. G., Lohmann, U., and Quinn, P. K.: Summertime pollution events in the Arctic and potential implications, J. Geophys. Res., 111, D12206, https://doi.org/10.1029/2005JD006223, 2006.
Jathar, S. H., Gordon, T. D., Hennigan, C. J., Pye, H. O. T., Pouliot, G., Adams, P. J., Donahue, N. M., and Robinson, A. L.: Unspeciated organic emissions from combustion sources and their influence on the secondary organic aerosol budget in the United States, P. Natl. Acad. Sci. USA, 111, 10473–10478, 2014.
Jaoui, M., Lewandowski, M., Kleindienst, T. E., Offenberg, J. H., and Edney, E. O.: β-Caryophyllinic acid: an atmospheric tracer for β-caryophyllene secondary organic aerosol, Geophys. Res. Lett., 34, L05816, https://doi.org/10.1029/2006GL028827, 2007.
Jia, Y. L., Clements, A. L., and Fraser, M. P.: Saccharide composition in atmospheric particulate matter in the southwest US and estimates of source contributions, J. Aerosol Sci., 41, 62–73, 2010.
Kanakidou, M., Seinfeld, J. H., Pandis, S. N., Barnes, I., Dentener, F. J., Facchini, M. C., Van Dingenen, R., Ervens, B., Nenes, A., Nielsen, C. J., Swietlicki, E., Putaud, J. P., Balkanski, Y., Fuzzi, S., Horth, J., Moortgat, G. K., Winterhalter, R., Myhre, C. E. L., Tsigaridis, K., Vignati, E., Stephanou, E. G., and Wilson, J.: Organic aerosol and global climate modelling: a review, Atmos. Chem. Phys., 5, 1053–1123, https://doi.org/10.5194/acp-5-1053-2005, 2005.
Kaplan, J. O. and New, M.: Arctic climate change with a 2 ∘C global warming: timing, climate patterns and vegetation change, Climate Change, 79, 213–241, 2006.
Kavouras, I. G. and Stephanou, E. G.: Particle size distribution of organic primary and secondary aerosol constituents in urban, background marine, and forest atmosphere, J. Geophys. Res., 107, 4069, https://doi.org/10.1029/2000JD000278, 2002.
Kavouras, I. G., Mihalopoulos, N., and Stephanou, E. G.: Formation of atmospheric particles from organic acids produced by forests, Nature, 395, 683–686, 1998.
Kawamura, K. and Gagosian, R.: Implications of ω-oxocarboxylic acids in the remote marine atmosphere for photooxidation of unsaturated fatty acids, Nature, 325, 330–332, 1987.
Kawamura, K., Kosaka, M., and Sempere, R.: Distributions and seasonal changes of hydrocarbons in urban aerosols and rainwaters, Chikyukagaku (Geochemistry), 28, 1–15, 1994.
Kawamura, K., Kasukabe, H., and Barrie, L. A.: Sources and reaction pathways of dicarboxylic acids, ketoacids and dicarbonyls in Arctic aerosols: one year of observations, Atmos. Environ., 30, 1709–1722, 1996.
Kawamura, K., Steinberg, S., and Kaplan, I. R.: Homologous series of C1-C10 monocarboxylic acids and C1-C6 carbonyls in Los Angeles air and motor vehicle exhausts, Atmos. Environ., 34, 4175–4191, 2002.
Kawamura, K., Ishimura, Y., and Yamazaki, K.: Four years observations of terrestrial lipid class compounds in marine aerosols from the western North Pacific, Global Biogeochem. Cy., 17, 1003, https://doi.org/10.1029/2001GB001810, 2003.
Kim, Y., Hatsushika, H., Muskett, R. R., and Yamazaki, K.: Possible effect of boreal wildfire soot on Arctic sea ice and Alaska glaciers, Atmos. Environ., 39, 3513–3520, 2005.
Klemm, D., Heublein, B., Fink, H. P., and Bohn, A.: Cellulose: fascinating biopolymer and sustainable raw material, Angew. Chem. Int. Edit., 44, 3358–3393, 2005.
Kolattukudy, P. E.: Chemistry and biochemistry of natural waxes, Elsevier, New York, 1976.
Kourtchev, I., Warnke, J., Maenhaut, W., Hoffmann, T., and Claeys, M.: Polar organic marker compounds in PM2.5 aerosol from a mixed forest site in western Germany, Chemosphere, 73, 1308–1314, 2008a.
Kourtchev, I., Ruuskanen, T. M., Keronen, P., Sogacheva, L., Dal Maso, M., Reissell, A., Chi, X., Vermeylen, R., Kulmala, M., Maenhaut, W., and Claeys, M.: Determination of isoprene and α-/β-pinene oxidation products in boreal forest aerosols from Hyytiälä, Finland: diel variations and possible link with particle formation events, Plant Biol., 10, 138–149, 2008b.
Lai, C., Liu, Y., Ma, J., Ma, Q., and He, H.: Degradation kinetics of levoglucosan initiated by hydroxyl radical under different environmental conditions, Atmos. Environ., 91, 32–39, 2014.
Law, K. S. and Stohl, A.: Arctic air pollution: origins and impacts, Science, 315, 1537–1540, 2007.
Lewandowski, M., Jaoui, M., Kleindienst, T. E., Offenberg, J. H., and Edney, E. O.: Composition of PM2.5 during the summer of 2003 in Research Triangle Park, North Carolina, Atmos. Environ., 41, 4073–4083, 2007.
Lewandowski, M., Piletic, I. R., Kleindienst, T. E., Offenberg, J. H., Beaver, M. R., Jaoui, M., Docherty, K. S., and Edney, E. O.: Secondary organic aerosol characterisation at field sites across the United States during the spring-summer period, Int. J. Environ. An. Chem., 93, 1084–1103, 2013.
Li, X., Jiang, L., Hoa, L. P., Lyu, Y., Xu, T., Yang, X., Iinuma, Y., Chen, J., and Herrmann, H.: Size distribution of particle-phase sugar and nitrophenol tracers during severe urban haze episodes in Shanghai, Atmos. Environ., 145, 115–127, 2016.
Ma, S. X., Wang, Z. Z., Bi, X. H., Sheng, G. Y., and Fu, J. M.: Composition and source of saccharides in aerosols in Guangzhou, China, Chinese Sci. Bull., 54, 4500–4506, 2009.
Medeiros, P. M., Conte, M. H., Weber, J. C., and Simoneit, B. R. T.: Sugars as source indicators of biogenic organic carbon in aerosols collected above the Howland Experimental Forest, Maine, Atmos. Environ., 40, 1694–1705, 2006.
Mitchell, J. M.: Visual range in the polar regions with special reference to the Alaskan Arctic, J. Atmos. Terr. Phys., 195–211, 1957.
Mkoma, S. L., Kawamura, K., and Fu, P. Q.: Contributions of biomass/biofuel burning to organic aerosols and particulate matter in Tanzania, East Africa, based on analyses of ionic species, organic and elemental carbon, levoglucosan and mannosan, Atmos. Chem. Phys., 13, 10325–10338, https://doi.org/10.5194/acp-13-10325-2013, 2013.
Myers-Pigg, A. N., Griffin, R. J., Louchouarn, P., Norwood, M. J., Sterne, A., and Cevik, B. K.: Signatures of biomass burning aerosols in the plume of a saltmarsh wildfire in South Texas, Environ. Sci. Technol., 50, 9308–9314, 2016.
Nirmalkar, J., Deshmukh, D. K., Deb, M. K., Tsai, Y. I., and Sopajaree, K.: Mass loading and episodic variation of molecular markers in PM2.5 aerosols over a rural area in eastern central India, Atmos. Environ., 117, 41–50, 2015.
Nordenskiold, A. E.: Nordenskiold on the inland ice of Greenland, Science, 44, 732–738, 1883.
Nolte, C. G., Schauer, J. J., Cass, G. R., and Simoneit, B. R. T.: Highly polar organic compounds present in wood smoke and in the ambient atmosphere, Environ. Sci. Technol., 35, 1912–1919, 2001.
Noureddini, H. and Kanabur, M.: Liquid-phase catalytic oxidation of unsaturated fatty acids, J. Am. Oil Chem. Soc., 73, 305–312, 1999.
Novakov, T. and Corrigan, C. E.: Cloud condensation nucleus activity of the organic component of biomass smoke particles, Geophys. Res. Lett., 23, 2141–2144, 1996.
Novakov, T. and Penner, J. E.: Large contribution of organic aerosol to cloud-condensation-nuclei concentrations, Nature, 365, 823–826, 1993.
Pacini, E.: From anther and pollen ripening to pollen presentation, Plant Syst. Evol., 222, 19–43, 2000.
Pashynska, V., Vermeylen, R., Vas, G., Maenhaut, W., and Claeys, M.: Development of a gas chromatographic/ion trap mass spectrometric method for the determination of levoglucosan and saccharidic compounds in atmospheric aerosols: application to urban aerosols, J. Mass Spectrom., 37, 1249–1257, 2002.
Peltzer, E. T. and Gagosian, R. B.: Organic geochemistry of aerosols over the Pacific Ocean, Chemical Oceanography, Academic Press, London, Vol. 10, 281–338, 1989.
Pio, C. A., Legrand, M., Alves, C. A., Oliveira, T., Afonso, J., Caseiro, A., Puxbaum, H., Sanchez-Ochoa, A., and Gelencser, A.: Chemical composition of atmospheric aerosols during the 2003 summer intense forest fire period, Atmos. Environ., 42, 7530–7543, 2008.
Prather, K. A., Bertram, T. H., Grassian, V. H., Deane, G. B., Stokes, M. D., DeMott, P. J., Aluwihare, L. I., Palenik, B. P., Azam, F., Seinfeld, J. H., Moffet, R. C., Molina, M. J., Cappa, C. D., Geiger, F. M., Roberts, G. C., Russell, L. M., Ault, A. P., Baltrusaitis, J., Collins, D. B., Corrigan, C. E., Cuadra-Rodriguez, L. A., Ebben, C. J., Forestieri, S. D., Guasco, T. L., Hersey, S. P., Kim, M. J., Lambert, W. F., Modini, R. L., Mui, W., Pedler, B. E., Ruppel, M. J., Ryder, O. S., Schoepp, N. G., Sullivan, R. C., and Zhao, D.: Bringing the ocean into the laboratory to probe the chemical complexity of sea spray aerosol, P. Natl. Acad. Sci. USA, 110, 7550–7555, 2013.
Pullman, G. S. and Buchanan, M.: Identification and quantitative analysis of stage-specific carbohydrates in loblolly pine (Pinus taeda) zygotic embryo and female gametophyte tissues, Tree Physiol., 28, 985–996, 2008.
Rogge, W. F., Hildemann, L. M., Mazurek, M. A., Cass, G. R., and Simoneit, B. R. T.: Sources of fine organic aerosol 4: particulate abrasion products from leaf surfaces of urban plants, Environ. Sci. Technol., 27, 2700–2711, 1993.
Rogge, W. F., Medeiros, P. M., and Simoneit, B. R. T.: Organic marker compounds in surface soils of crop fields from the San Joaquin Valley fugitive dust characterization study, Atmos. Environ., 41, 8183–8204, 2007.
Shahid, I., Kistler, M., Mukhtar, A., Ghauri, B. M., Cruz, C. R., Bauer, H., and Puxbaum, H.: Chemical characterization and mass closure of PM10 and PM2.5 at an urban sites in Karachi – Pakistan, Atmos. Environ., 128, 114–123, 2016.
Sang, X., Zhang, Z., Chan, C., and Engling, G.: Source categories and contribution of biomass smoke to organic aerosol over the southeastern Tibetan Plateau, Atmos. Environ., 78, 113–123, 2013.
Sarkar, C., Sinha, V., Sinha, B., Panday, A. K., Rupakheti, M., and Lawrence, M. G.: Source apportionment of NMVOCs in the Kathmandu Valley during the SusKat-ABC international field campaign using positive matrix factorization, Atmos. Chem. Phys., 17, 8129–8156, https://doi.org/10.5194/acp-17-8129-2017, 2017.
Saxena, P. and Hildemann, L. M.: Water-soluble organics in atmospheric particles: a critical review of the literature and application of thermodynamics to identify candidate compounds, J. Atmos. Chem., 24, 57–109, 1996.
Schauer, J. J., Rogge, W. F., Hildemann, L. M., Mazurek, M. A., Cass, G. R., and Simoneit, B. R. T.: Source apportionment of airborne particulate matter using organic compounds as tracers, Atmos. Environ., 30, 3837–3855, 1996.
Schkolnik, G. and Rudich, Y.: Detection and quantification of levoglucosan in atmospheric aerosols: a review, Anal. Bioanal. Chem., 385, 26–33, 2006.
Schmidl, C., Marr, I. L., Caseiro, A., Kotianova, P., Berner, A., Bauer, H., Kasper-Giebl, A., and Puxbaum, H.: Chemical characterisation of fine particle emissions from wood stove combustion of common woods growing in mid-European Alpine regions, Atmos. Environ., 42, 126–141, 2008.
Serreze, M. C., Walsh, J. E., Chapin, F. S., Osterkamp, T., Dyurgerov, M., Romanovsky, V., Oechel, W. C., Morison, J., Zhang, T., and Barry, R. G.: Observational evidence of recent change in the northern high latitude environment, Climatic Change, 46, 159–207, 2000.
Shakya, K. M. and Peltier, R. E.: Investigating missing sources of sulfur at Fairbanks, Alaska, Environ. Sci. Technol., 47, 9332–9338, 2013.
Seinfeld, J. H. and Pandis, S. N.: Atmospheric Chemistry and Physics, John Wiley & Sons, New York, 1998.
Shafizadeh, F. and Fu, Y.: Pyrolysis of cellulose, Carbohyd. Res., 29, 113–122, 1973.
Shakya, K. M., Louchouarn, P., and Griffin, R. J.: Lignin derived phenols in Houston aerosols: implications for natural background sources, Environ. Sci. Technol., 45, 8268–8275, 2011.
Sheesley, R. J., Schauer, J. J., Chowdhury, Z., Cass, G. R., and Simoneit, B. R. T.: Characterization of organic aerosols emitted from the combustion of biomass indigenous to South Asia, J. Geophys. Res., 108, 4285, https://doi.org/10.1029/2002JD002981, 2003.
Sidhu, S., Gullett, B., Striebich, R., Klosterman, J., Contreras, J., and DeVito, M.: Endocrine disrupting chemical emissions from combustion sources: diesel particulate emissions and domestic waste open burn emissions, Atmos. Environ., 39, 801–811, 2005.
Simoneit, B. R. T.: Biomass burning – a review of organic tracers for smoke from incomplete combustion, Appl. Geochem., 17, 129–162, 2002.
Simoneit, B. R. T., Sheng, G. Y., Chen, X. J., Fu, J. M., Zhang, J., and Xu, Y. P.: Molecular marker study of extractable organic-matter in aerosols from urban areas of China, Atmos. Environ., 25, 2111–2129, 1991.
Simoneit, B. R. T., Rogge, W. F., Mazurek, M. A., Standley, L. J., Hildemann, L. M., and Cass, G. R.: Lignin pyrolysis products, lignans and resin acids as specific tracers of plant classes in emissions from biomass combustion, Environ. Sci. Technol., 27, 2533–2541, 1993.
Simoneit, B. R. T., Schauer, J. J., Nolte, C. G., Oros, D. R., Elias, V. O., Fraser, M. P., Rogge, W. F., and Cass, G. R.: Levoglucosan, a tracer for cellulose in biomass burning and atmospheric particles, Atmos. Environ., 33, 173–182, 1999.
Simoneit, B. R. T., Kobayashi, M., Mochida, M., Kawamura, K., Lee, M., Lim, H. J., Turpin, B. J., and Komazaki, Y.: Composition and major source of organic compounds of aerosol particulate matter sampled during the ACE-Asia campaign, J. Geophys. Res., 109, D19S10, https://doi.org/10.1029/2004JD004598, 2004a.
Simoneit, B. R. T., Elias, V. O., Kobayashi, M., Kawamura, K., Rushdi, A. I., Medeiros, P. M., Rogge, W. F., and Didyk, B. M.: Sugars-dominant water-soluble organic compounds in soils and characterization as tracers in atmospheric particulate matter, Environ. Sci. Technol., 38, 5939–5949, 2004b.
Staples, C. A., Peterson, D. R., Parkerton, T. F., and Adams, W. J.: The environmental fate of phthalate esters: a literature review, Chemosphere, 35, 667–749, 1997.
Stocks, B. J., Fosberg, M. A., Wotton, B. M., Lynham, T. J., and Ryan, K. C.: Climate change and forest fire activity in North American boreal forests, Ecol. Stud., 138, 368–376, 2000.
Stohl, A., Andrews, E., Burkhart, J. F., Forster, C., Herber, A., Hoch, S. W., Kowal, D., Lunder, C., Mefford, T., Ogren, J. A., Sharma, S., Spichtinger, N., Stebel, K., Stone, R., Strom, J., Torseth, K., Wehrli, C., and Yttri, K. E.: Pan-Arctic enhancements of light absorbing aerosol concentrations due to North American boreal forest fires during summer 2004, J. Geophys. Res., 111, D22214, https://doi.org/10.1029/2006JD007216, 2006.
Suh, I., Zhang, R., Molina, L. T., and Molina, M. J.: Oxidation mechanism of aromatic peroxy and bicyclic radicals from OH-toluene reactions, J. Am. Chem. Soc., 125, 12655–12665, 2003.
Sullivan, A. P., Holden, A. S., Patterson, L. A., McMeeking, G. R., Kreidenweis, S. M., Malm, W. C., Hao, W. M., Wold, C. E., and Collet, J. L.: A method for smoke maker measurements and its potential application for determining the contribution of biomass burning from wildfires and prescribed fires to ambient PM2.5 organic carbon, J. Geophys. Res., 113, D22302, https://doi.org/10.1029/2008JD010216, 2008.
Sullivan, A. P., Frank, N., Kenski, D. M., and Collett, J. L.: Application of high-performance anion-exchange chromatography-pulsed amperometric detection for measuring carbohydrates in routine daily filter samples collected by a national network 2: examination of sugar alcohols/polyols, sugars, and anhydro-sugars in the upper Midwest, J. Geophys. Res., 116, D08303, https://doi.org/10.1029/2010JD014169, 2011.
Surratt, J. D., Murphy, S. M., Kroll, J. H., Ng, N. L., Hildebrandt, L., Sorooshian, A., Szmigielski, R., Vermeylen, R., Maenhaut, W., Claeys, M., Flagan, R. C., and Seinfeld, J. H.: Chemical composition of secondary organic aerosol formed from the photooxidation of isoprene, J. Phys. Chem. A, 110, 9665–9690, 2006.
Surratt, J. D., Chan, A. W. H., Eddingsaas, N. C., Chan, M. N., Loza, C. L., Kwan, A. J., Hersey, S. P., Flagan, R. C., Wennberg, P. O., and Seinfeld, J. H.: Reactive intermediates revealed in secondary organic aerosol formation from isoprene, P. Natl. Acad. Sci. USA, 107, 6640–6645, 2010.
Swan, S. H., Main, K. M., Liu, F., Stewart, S. L., Kruse, R. L., Calafat, A. M., Mao, C. S., Redmon, J. B., Ternand, C. L., Sullivan, S., and Teague, J. L.: Decrease in anogenital distance among male infants with prenatal phthalate exposure, Environ. Health Persp., 113, 1056–1061, 2005.
Thepnuan, D., Chantara, S., Lee, C. T., Lin, N. H., and Tsai, Y. I.: Molecular markers for biomass burning associated with the characterization of PM2.5 and component sources during dry season haze episodes in Upper South East Asia, Sci. Total Environ., 658, 708–722, 2019.
Thuren, A. and Larsson, P.: Phthalate esters in the Swedish atmosphere, Environ. Sci. Technol., 24, 554–559, 1990.
Tsai, Y. I., Sopajaree, K., Chotruska, A., Wu, H. C., and Kuo, S. C., Source indicators of biomass burning associated with inorganic salts and carboxylates in dry season ambient aerosol in Chiang Mai Basin, Thailand, Atmos. Environ., 78, 93–104, 2013.
Verma, S. K., Kawamura, K., Chen, J., Fu, P., and Zhu, C.: Thirteen years of observations on biomass burning organic tracers over Chichijima Island in the western North Pacific: an outflow region of Asian aerosols, J. Geophys. Res., 120, 4155–4168, 2015.
Wan, X., Kang, S., Li, Q., Rupakheti, D., Zhang, Q., Guo, J., Chen, P., Tripathee, L., Rupakheti, M., Panday, A. K., Wang, W., Kawamura, K., Gao, S., Wu, G., and Cong, Z.: Organic molecular tracers in the atmospheric aerosols from Lumbini, Nepal, in the northern Indo-Gangetic Plain: influence of biomass burning, Atmos. Chem. Phys., 17, 8867–8885, https://doi.org/10.5194/acp-17-8867-2017, 2017.
Wang, G. and Kawamura, K.: Molecular characteristics of urban organic aerosols from Nanjing: a case study of a mega-city in China, Environ. Sci. Technol., 39, 7430–7438, 2005.
Wang, G., Kawamura, K., Lee, S., Ho, K. F., and Cao, J. J.: Molecular, seasonal, and spatial distributions of organic aerosols from fourteen Chinese cities, Environ. Sci. Technol., 40, 4619–4625, 2006.
Wang, G. H., Kawamura, K., Zhao, X., Li, Q. G., Dai, Z. X., and Niu, H. Y.: Identification, abundance and seasonal variation of anthropogenic organic aerosols from a mega-city in China, Atmos. Environ., 41, 407–416, 2007.
Wang, G., Kawamura, K., Xie, M., Hu, S., Gao, S., Cao, J., An, Z., and Wang, Z.: Size-distributions of n-alkanes, PAHs and hopanes and their sources in the urban, mountain and marine atmospheres over East Asia, Atmos. Chem. Phys., 9, 8869–8882, https://doi.org/10.5194/acp-9-8869-2009, 2009.
Wang, W., Wu, M. H., Li, L., Zhang, T., Liu, X. D., Feng, J. L., Li, H. J., Wang, Y. J., Sheng, G. Y., Claeys, M., and Fu, J. M.: Polar organic tracers in PM2.5 aerosols from forests in eastern China, Atmos. Chem. Phys., 8, 7507–7518, https://doi.org/10.5194/acp-8-7507-2008, 2008.
Wang, Y. and Hopke, P. K.: Is Alaska truly the great escape from air pollution? Long term source apportionment of fine particulate matter in Fairbanks, Alaska, Aerosol Air Qual. Res., 14, 1875–1882, 2014.
Ward, T. J., Hamilton, R. F., Dixon, R. W., Paulsen, M., and Simpson, C. D.: Characterization and evaluation of smoke tracers in PM: results from the 2003 Montana wildfire season, Atmos. Environ., 40, 7005–7017, 2006.
Ward, T., Trost, B., Conner, J., Flanagan, J., and Jayanty, R. K. M.: Source apportionment of PM2.5 in a subarctic airshed – Fairbanks, Alaska, Aerosol Air Qual. Res., 12, 536–543, 2012.
Ware, D., Lewis, J., Hopkins, S., Boyer, B., Noonan, C., and Ward, T.: Sources and perceptions of indoor and ambient air pollution in rural Alaska, J. Commun. Health, 38, 773–780, 2013.
Warneke, C., Bahreini, R., Brioude, J., Brock, C. A., de Gouw, J. A., Fahey, D. W., Froyd, K. D., Holloway, J. S., Middlebrook, A., Miller, L., Montzka, S., Murphy, D. M., Peischl, J., Ryerson, T. B., Schwarz, J. P., Spackman, J. R., and Veres, P.: Biomass burning in Siberia and Kazakhstan as an important source for haze over the Alaskan Arctic in April 2008, Geophys. Res. Lett., 36, L02813, https://doi.org/10.1029/2008GL036194, 2009.
Warneke, C., Froyd, K. D., Brioude, J., Bahreini, R., Brock, C. A., Cozic, J., de Gouw, J. A., Fahey, D. W., Ferrare, R., Holloway, J. S., Middlebrook, A. M., Miller, L., Montzka, S., Schwarz, J. P., Sodemann, H., Spackman, J. R., and Stohl, A.: An important contribution to springtime Arctic aerosol from biomass burning in Russia, Geophys. Res. Lett., 37, L01801, https://doi.org/10.1029/2009GL041816, 2010.
Wilkening, K. E., Barrie, L. A., and Engle, M.: Atmospheric science: trans-Pacific air pollution, Science, 290, 65–67, 2000.
Xie, Z., Ebinghaus, R., Temme, C., Lohmann, R., Caba, A., and Ruck, W.: Occurrence and air-sea exchange of phthalates in the Arctic, Environ. Sci. Technol., 41, 4555–4560, 2007.
Yang, Y., Chan, C. Y., Tao, J., Lin, M., Engling, G., Zhang, Z., Zhang, T., and Su, L.: Observation of elevated fungal tracers due to biomass burning in the Sichuan Basin at Chengdu City, China, Sci. Total Environ., 431, 68–77, 2012.
Yokouchi, Y. and Ambe, Y.: Characterization of polar organics in airborne particulate matter, Atmos. Environ., 20, 1727–1734, 1986.
Zhang, R. Y., Suh, I., Zhao, J., Zhang, D., Fortner, E. C., Tie, X. X., Molina, L. T., and Molina, M. J.: Atmospheric new particle formation enhanced by organic acids, Science, 304, 1487–1490, 2004.
Zhang, T., Engling, G., Chan, C. Y., Zhang, Y. N., Zhang, Z. S., Lin, M., Sang, X. F., Li, Y. D., and Li, Y. S.: Contribution of fungal spores to particulate matter in a tropical rainforest, Environ. Res. Lett., 5, 024010, https://doi.org/10.1088/1748-9326/5/2/024010, 2010.
Zhang, Y. X., Shao, M., Zhang, Y. H., Zeng, L. M., He, L. Y., Zhu, B., Wei, Y. J., and Zhu, X. L.: Source profiles of particulate organic matters emitted from cereal straw burnings, J. Environ. Sci., 19, 167–175, 2007.
Zhu, C., Kawamura, K., and Kunwar, B.: Effect of biomass burning over the western North Pacific Rim: wintertime maxima of anhydrosugars in ambient aerosols from Okinawa, Atmos. Chem. Phys., 15, 1959–1973, https://doi.org/10.5194/acp-15-1959-2015, 2015.
Zhu, C., Kawamura, K., and Fu, P.: Seasonal variations of biogenic secondary organic aerosol tracers in Cape Hedo, Okinawa, Atmos. Environ., 130, 113–119, 2016.