the Creative Commons Attribution 4.0 License.
the Creative Commons Attribution 4.0 License.
 | 11 Nov 2019
Surveillance of SO2 and NO2 from ship emissions by MAX-DOAS measurements and the implications regarding fuel sulfur content compliance
Yuli Cheng
Shanshan Wang
Jian Zhu
Yanlin Guo
Ruifeng Zhang
Yiming Liu
Yan Zhang
Qi Yu
Weichun Ma
Bin Zhou
Due to increased concerns regarding air pollutants emitted from shipping, feasible technology for the surveillance of these pollutants is in high demand. Here, we present shore-based multi-axis differential optical absorption spectroscopy (MAX-DOAS) measurements of SO2 and NO2 emitted from ships under different traffic conditions in China's ship emission control areas (ECAs) in Shanghai and Shenzhen, China. Three typical measurement sites were selected in these two regions to represent the following emission scenarios: ships docked at berth, ships navigating in an inland waterway and inbound/outbound ships in a deep-water port. Using 2-D scanning, the observations show that SO2 and NO2 hot spots can be quickly and easily located from multiple berths. Although MAX-DOAS measurements can not distinguish plumes from specific ships in the busy shipping lanes of the inland waterway area, they certify that variations in the SO2 and NO2 levels are mainly impacted by the ship traffic density and the atmospheric dispersion conditions. In the open water area, which has a lower vessel density, MAX-DOAS measurements can capture the pulse signal of ship-emitted SO2 and NO2 very well; they can also characterize the peak's altitude and the insistent duration of the individual ship plumes. Combined with the ship activity data, information on the rated power of the engine and the fuel sulfur content, it was found that the SO2∕NO2 ratio in a single plume is usually low (< 1.5) for inbound vessels due to the usage of the auxiliary engine, which has less power and uses “clean” fuel with a low sulfur content. Thus, an unexpectedly high SO2∕NO2 ratio implies the use of fuel with a sulfur content exceeding the regulation limits. Therefore, the observed SO2∕NO2 ratio in the plume of a single ship can be used as an index to indicate compliance (or noncompliance) with respect to the fuel sulfur content, and the suspicious ship can then be flagged for further enforcement. Combining the ship emissions estimated by actual operation parameters and the logical sulfur content, shore-based MAX-DOAS measurements will provide a fast and more accurate way to surveil ship emissions.


Sulfur dioxide (SO2) and nitrogen dioxide (NO2) are important air pollutants, and are also recognized as non-negligible components of ship emissions (Corbett et al., 1999; Endresen et al., 2003; Eyring et al., 2010; Matthias et al., 2010). Both of these species can engage in atmospheric chemical reactions to produce aerosols and acid rain, and also have negative effects on air quality, the climate system and human health, as well as contributing to the acidification of terrestrial and marine ecosystems (Berglen et al., 2004; Seinfeld and Pandis, 2006; Singh, 1987). Moreover, NO2 is also the key substance involved in the formation of photochemical smog (Dimitriades, 1972).
With the rapid growth of marine transportation, air pollution has become the most challenging environmental issue in the shipping industry, specifically regarding the emission of CO2, SO2, NOx, particulate matter and greenhouse gases. CO2 and NO are the main pollutants emitted by ships, and NO is rapidly converted to NO2 by reaction with O3 (Eyring et al., 2005; Becagli et al., 2012; Coggon et al., 2012; Diesch et al., 2013; Lauer et al., 2007; Seyler et al., 2017). Eyring et al. (2010) reported that ships contribute 15 % of global NOx emissions and 4 %–9 % of SO2 emissions.
Regarding the spatial distribution of these pollutants, global hot spots with high SO2 and NO2 emissions have been identified in the Eastern China Sea and the Southern China Sea, in marine areas in southeastern and southern Asia, in the Red Sea, in the Mediterranean, in the North Atlantic near the European coast, and along the western coast of North America, among others (Johansson et al., 2017).
In China, ship-emitted pollutants play important roles regarding the air quality, human health and climate (Lai et al., 2013; Liu et al., 2016; Yang et al., 2007). They not only affect the air quality in coastal areas, but even influence inland areas hundreds of kilometers from emission sources (Lv et al., 2018). Port cities are most affected by ship pollution, followed by cities along rivers. For example, ship-emitted SO2 and NOx were shown to contribute 12.4 % and 11.6 % of the total emissions of the whole city of Shanghai in 2012, respectively, while up to 64 % of primary PM2.5 has been attributed to ships at Shanghai Port; this pollution can then also be transported to inland regions (Fan et al., 2016; Zhao et al., 2013).
In order to reduce the negative impacts of ship emissions, the EU and the US have implemented regulations in an effort to decrease ship emissions (Kattner et al., 2015); among these regulations, fuel quality regulation has proven to be the most effective measure for addressing the issue of sulfur oxide (SOx) and particulate matter (PM) emission in many countries. In addition, the International Maritime Organization (IMO, 2009) has also set up multiple emission control areas (ECAs) worldwide. By 2020, the maximum fuel sulfur content (FSC) is set to be 0.50 % S m/m worldwide; it is worth noting that the current maximum FSC in ECAs on the US coast and in Europe is 0.10 % S m/m, whereas in China's ECAs it is 0.50 % S m/m. The regulations also set limits regarding pollutant emissions, such as NOx and CO2, in exhaust gas. Thus, an exhaust gas treatment system could be another option to reduce the emissions of these species. Since 1 January 2017, ships berthed at the core ports of three designated domestic emission control areas (DECAs) in the Pearl River Delta (PRD), the Yangtze River Delta (YRD) and the Bohai Rim (Beijing–Tianjin–Hebei area) in China have been restricted to fuels with a sulfur content of less than or equal to 0.50 % S m/m (MOT, 2015). However, as of 1 January 2019 ships entering the ECAs are restricted to fuels with a sulfur content of no more than 0.50 % S m/m, regardless of whether they are sailing or docking. Currently, scrubbers are also an alternative method of reducing ship emissions in China. As a consequence, it is obvious that a reliable and practical monitoring system is urgently required for the implementation of ECA regulations.
The most commonly used options for monitoring ship emissions can be classified into two categories: estimates based on activity data or written documentation, and measurements of fuel samples and exhaust gas made onboard the ship. Basically, the continuous online monitoring of fuel and exhaust gas onboard is the most effective and accurate means of supervision, but is much less feasible in practice. With respect to the regulatory party, fuel sampling and document inspection are currently the most commonly used supervision measures, and the sulfur content in the fuel is usually quickly detected after a ship has docked (in roughly 10 min). Other technical methods have also been developed to determine both SO2 and NOx emissions, including a new type of ship exhaust gas detection technology that mounts a portable sniffer instrument to a ship or helicopter (Beecken et al., 2015; Berg et al., 2012; Murphy et al., 2009; Villa et al., 2016). Alternatively, shore-based remote sensing is another effective way of measuring ship plumes and estimating the sulfur content in these plumes as ships pass in shipping lanes or dock at berth (Kattner et al., 2015; Seyler et al., 2017).
Remote sensing techniques have the advantages of fast detection, easy operation and high automation. In addition to the passive “sniffing” method using in situ instrumentation, optical remote sensing techniques, such as differential optical absorption spectroscopy (DOAS), light detection and ranging (LIDAR) and the ultraviolet camera (UV-CAM) technique, can detect the variation of light properties after interaction with the exhaust plume and, thus, the corresponding SO2 and NO2 emission levels in the plume (Balzani Lööv et al., 2014; Seyler et al., 2017). LIDAR systems can be used to retrieve a 2-D concentration distribution by scanning through the ship plume and by combing the wind and concentration profiles to obtain the ship emissions. McLaren et al. (2012) employed an active long-path DOAS technique to measure the SO2∕NO2 ratios in ship plumes and speculated on their relationship with the sulfur content of fuels. A UV camera has also been successfully applied to measure the SO2 concentrations and emission rates of moving and stationary ship plumes (Prata, 2014).
The DOAS technique allows for the identification and quantification of the absorption of a variety of species that show characteristic absorption features in the measured wavelength range (Platt and Stutz, 2008). It has been widely used for trace gas measurements over several decades, especially for very mature NO2 and SO2 (Edner et al., 1993; Mellqvist and Rosén, 1996; Platt et al., 1979). As an expanded apparatus, multi-axis differential optical absorption spectroscopy (MAX-DOAS) measurements are highly sensitive to aerosols and trace gases in the lower troposphere, as the instrument observes scattered sunlight at different viewing angles close to the horizontal and zenith directions (Hönninger et al., 2004; Ma et al., 2013; Sinreich et al., 2005; Wang et al., 2014). Due to its portability, the MAX-DOAS instrument can be carried onto ships to observe the vertical column densities (VCDs) of NO2 and SO2 during the cruise, as high levels of pollutants have been found close to busy ports and dense shipping lanes (Hong et al., 2018; Schreier et al., 2015; Takashima et al., 2012; Tan et al., 2018). In addition, MAX-DOAS has been successfully employed for the direct monitoring of shipping emissions. Premuda et al. (2011) used ground-based MAX-DOAS measurements to evaluate the NO2 and SO2 levels in ship plumes discharged from individual ships in the Giudecca Strait of the Venetian Lagoon. Seyler et al. (2017) utilized MAX-DOAS to perform long-term measurements of NO2 and SO2 from shipping emissions in the German Bight, and evaluated the reduction in SO2 levels after the implementation of stricter fuel sulfur limits.
In this study, shore-based MAX-DOAS measurements were employed to measure the NO2 and SO2 in ship plumes in different ship traffic environments in Shanghai and Shenzhen, China. Combined with photographs taken by the instrument's camera and AIS (Automatic Identification System) information, it was verified that the emissions of ships at berth, those from ships passing through an inland waterway and those from ships in open-sea areas can be successfully detected. The measurements can also provide fuel sulfur content information for individual ships by comparing the NO2 and SO2 emitted in the plume (considering the effects of plume age) with fuel sample analysis and the ship activity data. This suggests that the shore-based MAX-DOAS method is a feasible and reliable method for surveilling ship-emitted SO2 and NO2 and, further, enables compliance or noncompliance to be established with respect to fuel sulfur content regulations.
2.1 Instrument setup and sites
In this study, the MAX-DOAS instrument was designed and assembled by the authors (Zhang et al., 2018). It mainly consists of a receiving telescope, a spectrometer (Ocean Optics, QE65 Pro) and a computer to control the measurements. Driven by a 2-D stepper motor system, the telescope can collect scattered sunlight from different elevation angles in the vertical direction and different azimuth angles in the horizontal direction. The lens then converges the scattered light onto the fiber bundle connected to the spectrometer. Following this, the sunlight received is dispersed by a grating, detected by a CCD detector and recorded by the spectrometer covering the wavelength range from 300 to 480 nm with a resolution about 0.5 nm full width at half maximum (FWHM). As a new design feature, a camera has been configured on the MAX-DOAS apparatus that moves coaxially with the receiving telescope and can record the scene and sky conditions viewed by the telescope. The scanning of the telescope can be set in a sequence of several elevation angles that begins close to horizontal and at 90∘ and then moves to next azimuth angle for another vertical scanning sequence. Due to the different ship traffic conditions, the types of ship passing in inland waterways and at seaside ports are different with respect to size and tonnage. Therefore, the configuration of the observing geometric angles was adjusted depending on the ship conditions (see Table 1).
The MAX-DOAS measurements of ship emissions were performed in two typical port cities – Shanghai and Shenzhen – in China. As shown in Fig. 1a, sea areas surrounding Shanghai and Shenzhen are located in the Yangtze River Delta and Pearl River Delta ECAs, respectively. In Shanghai, two different ship traffic scenarios were considered: ships at berth in the Waigaoqiao container port area (31.36∘ N, 121.58∘ E; Fig. 1b), and ships passing through the inland waterway in the downstream region of Huangpu River around Wusong (31.37∘ N, 121.50∘ E; Fig. 1c). In Shenzhen, the measurements were carried out in the deep-water port of Yantian (114.29∘ E, 22.56∘ N; Fig. 1d). More details about the environments and operational configurations with respect to the measurements are given in Table 1.
Table 1Measurement details and the operational configurations of the MAX-DOAS.
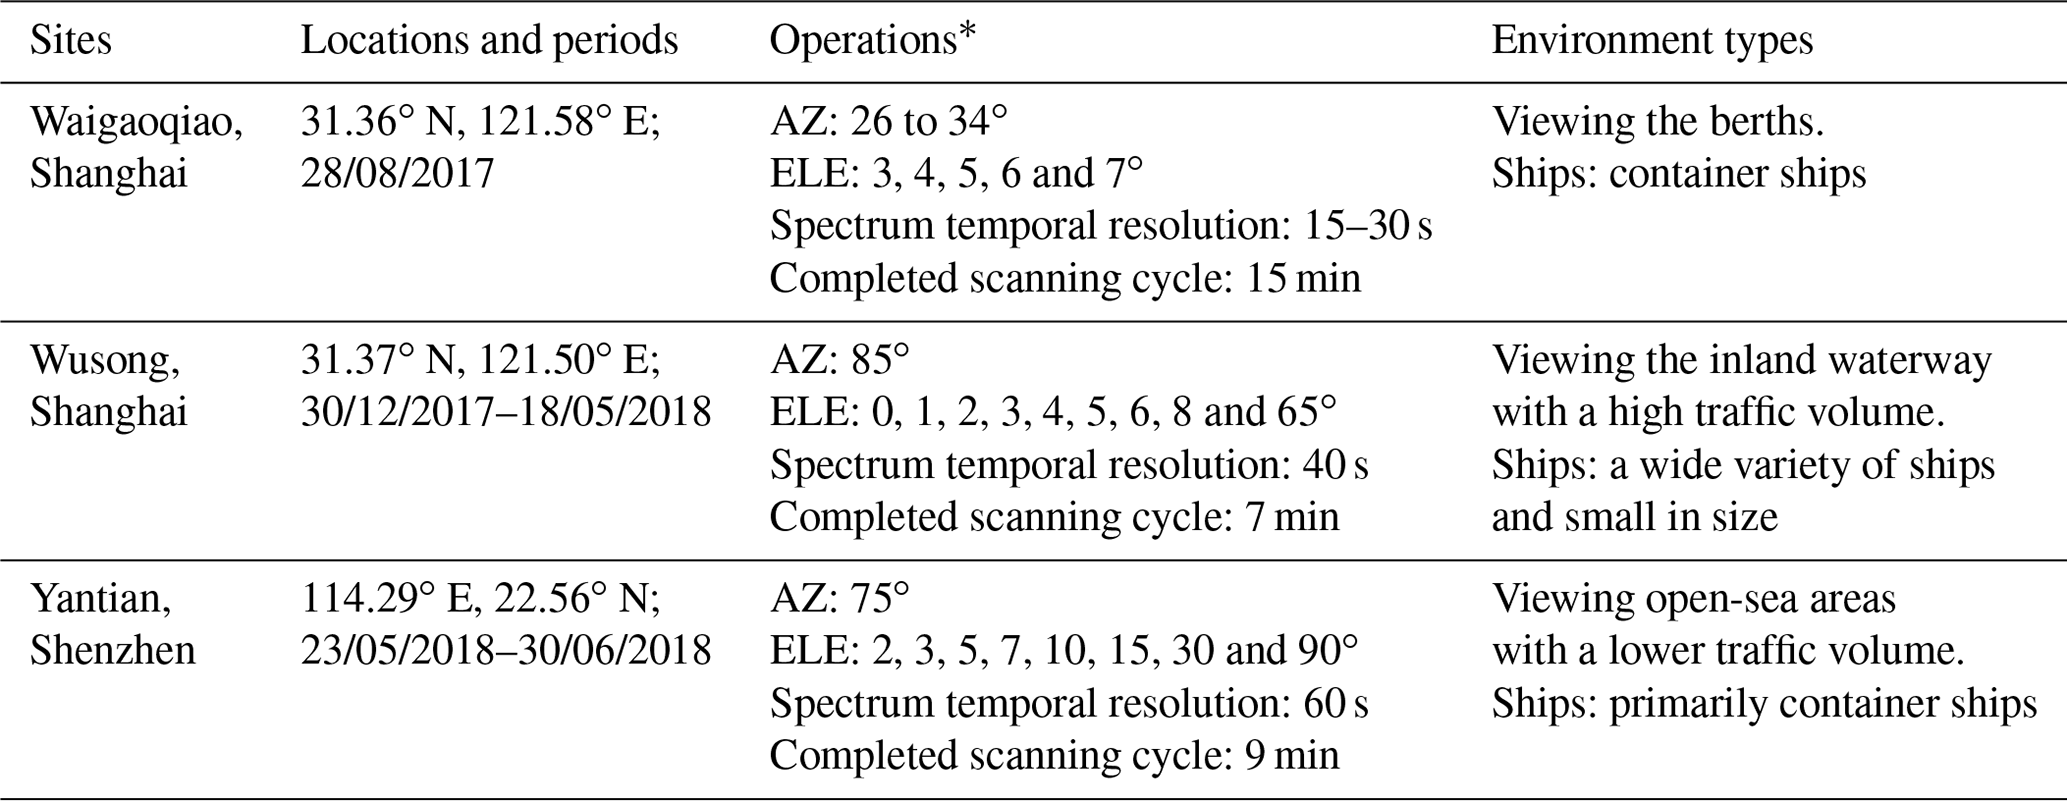
* AZ denotes the azimuth angle in the horizontal direction; ELE denotes the elevation angle in the vertical direction.
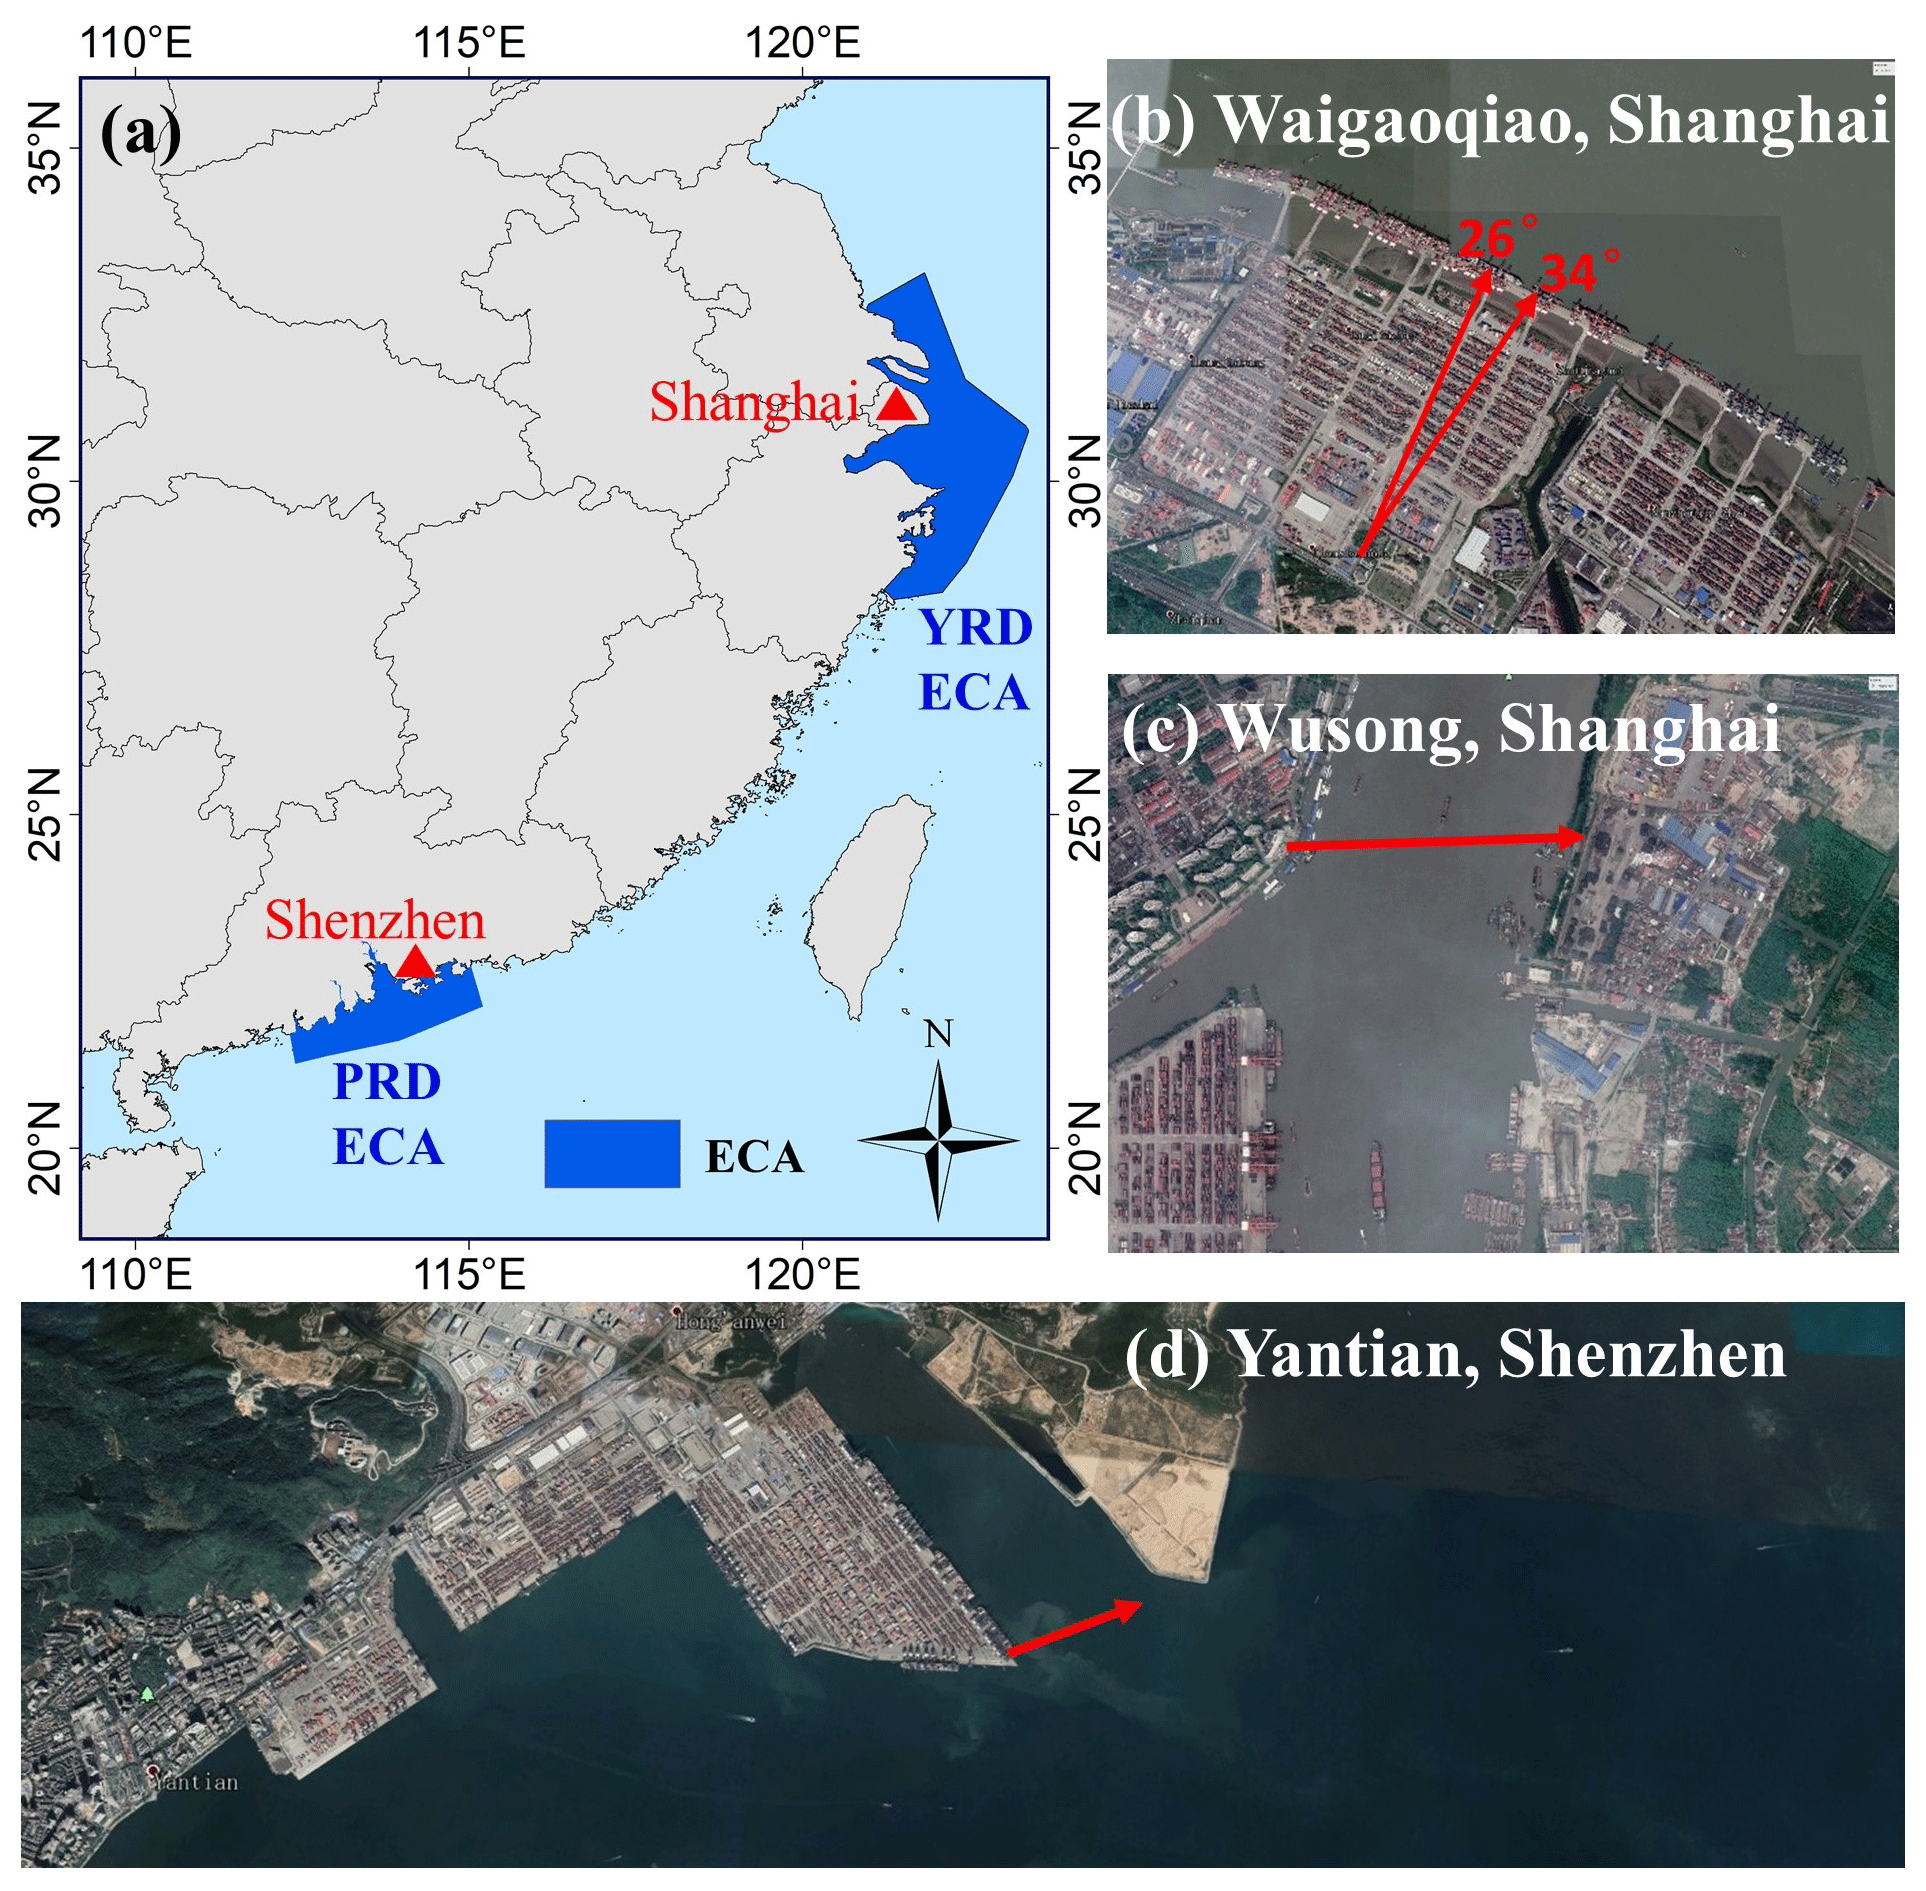
Figure 1The YRD and PRD domestic emission control areas (DECAs) in China, and the locations of the MAX-DOAS measurements in the coastal cities of Shanghai and Shenzhen: Waigaoqiao Port and Wusong Wharf in Shanghai, and Yantian Port in Shenzhen. The viewing direction of instrument azimuth angle is indicated using a red arrow. Panels (b) to (d) are sourced from ©Google Earth.
2.2 DOAS spectral analysis
The DOAS algorithm is basically based on the Beer–Lambert law, which describes the extinction of radiation through the atmosphere (Platt and Stutz, 2008). The MAX-DOAS instrument observes scattered sunlight from various viewing directions and records the spectrum (e.g., Hönninger et al., 2004; Sinreich et al., 2005). The spectral analysis generates the measured SCD (slant column density), defined as the integral of the trace gas concentration along the entire optical path including the SCDs in the troposphere and the stratosphere (e.g., Platt and Stutz, 2008; Wagner et al., 2010). The stratospheric absorption is assumed to be at the same level in all spectra taken within one scan cycle; therefore, we generally choose the spectrum with the lowest less trace gas absorption as the reference (such as the spectrum measured in zenith direction). The slant column concentration of the trace gas measured at each lower elevation angle (α) is represented by the DSCD (differential SCD), which is the gas information of the measured slant column densities minus background densities in the reference spectrum:
Based on the DOAS principle, the measured scattered sunlight spectra are analyzed using the QDOAS spectral fitting software, which was developed by the Royal Belgian Institute for Space Aeronomy (BIRA-IASB) (http://uv-vis.aeronomie.be/software/QDOAS/, last access: 1 November 2019). The strong absorption band of SO2 is below 325 nm, where NO2 absorption are relatively weak. Therefore, the fitting wavelength intervals for SO2 and NO2 are 307.5–320 nm and 338–370 nm, respectively. Although the DSCDs generated are related to the wavelength of the fitting interval, the usage of the SO2∕NO2 ratios of DSCDs retrieved at different spectral ranges will not be impacted by the effect of wavelength dependency. Trace gases with absorptions in the relevant fitting windows and ring spectrum were included. The details of the spectral fitting configuration are listed in Table 2. Wavelength calibration was performed using a high-resolution solar reference spectrum (Chance and Kurucz, 2010). The offset and the signal of the dark current were measured every night and were automatically extracted from the measured spectra before spectral analysis. Consequently, the DSCDs of SO2 and NO2 were acquired by taking the measured spectrum at 90∘ as the Fraunhofer reference spectrum.

Figure 2 shows the typical spectral fitting of measured spectra with and without ship plume contamination. The obvious absorbing structures of SO2 and NO2 as well as fairly low residuals can be observed in both clean (collected at elevation angle of 5∘ at 10:39 LT on 22 June 2018) and polluted spectrum (collected at elevation angle of 5∘ at 09:53 LT on 22 June 2018). By contrast, the retrieved SO2 and NO2 DSCDs of 8.11×10¹⁶ and 3.08×10¹⁶ molec cm−2 in the polluted case are significantly higher than those of 2.24×10¹⁶ and 1.61×10¹⁶ molec cm−2 under clean conditions. This demonstrates the high sensitivity of the measurements to ship plumes and the good performance of the spectral fitting. In this study, a threshold of the residual of < was used to screen out any cases of unsatisfactory spectral fitting; following this screening process 94.57 % of the NO2 DSCDs and 76.26 % of SO2 fitting results remained for further discussion. The uncertainties in the spectral analysis of SO2 were higher due to the weak scatter intensity of sunlight and lower signal-to-noise ratio at shorter wavelengths.
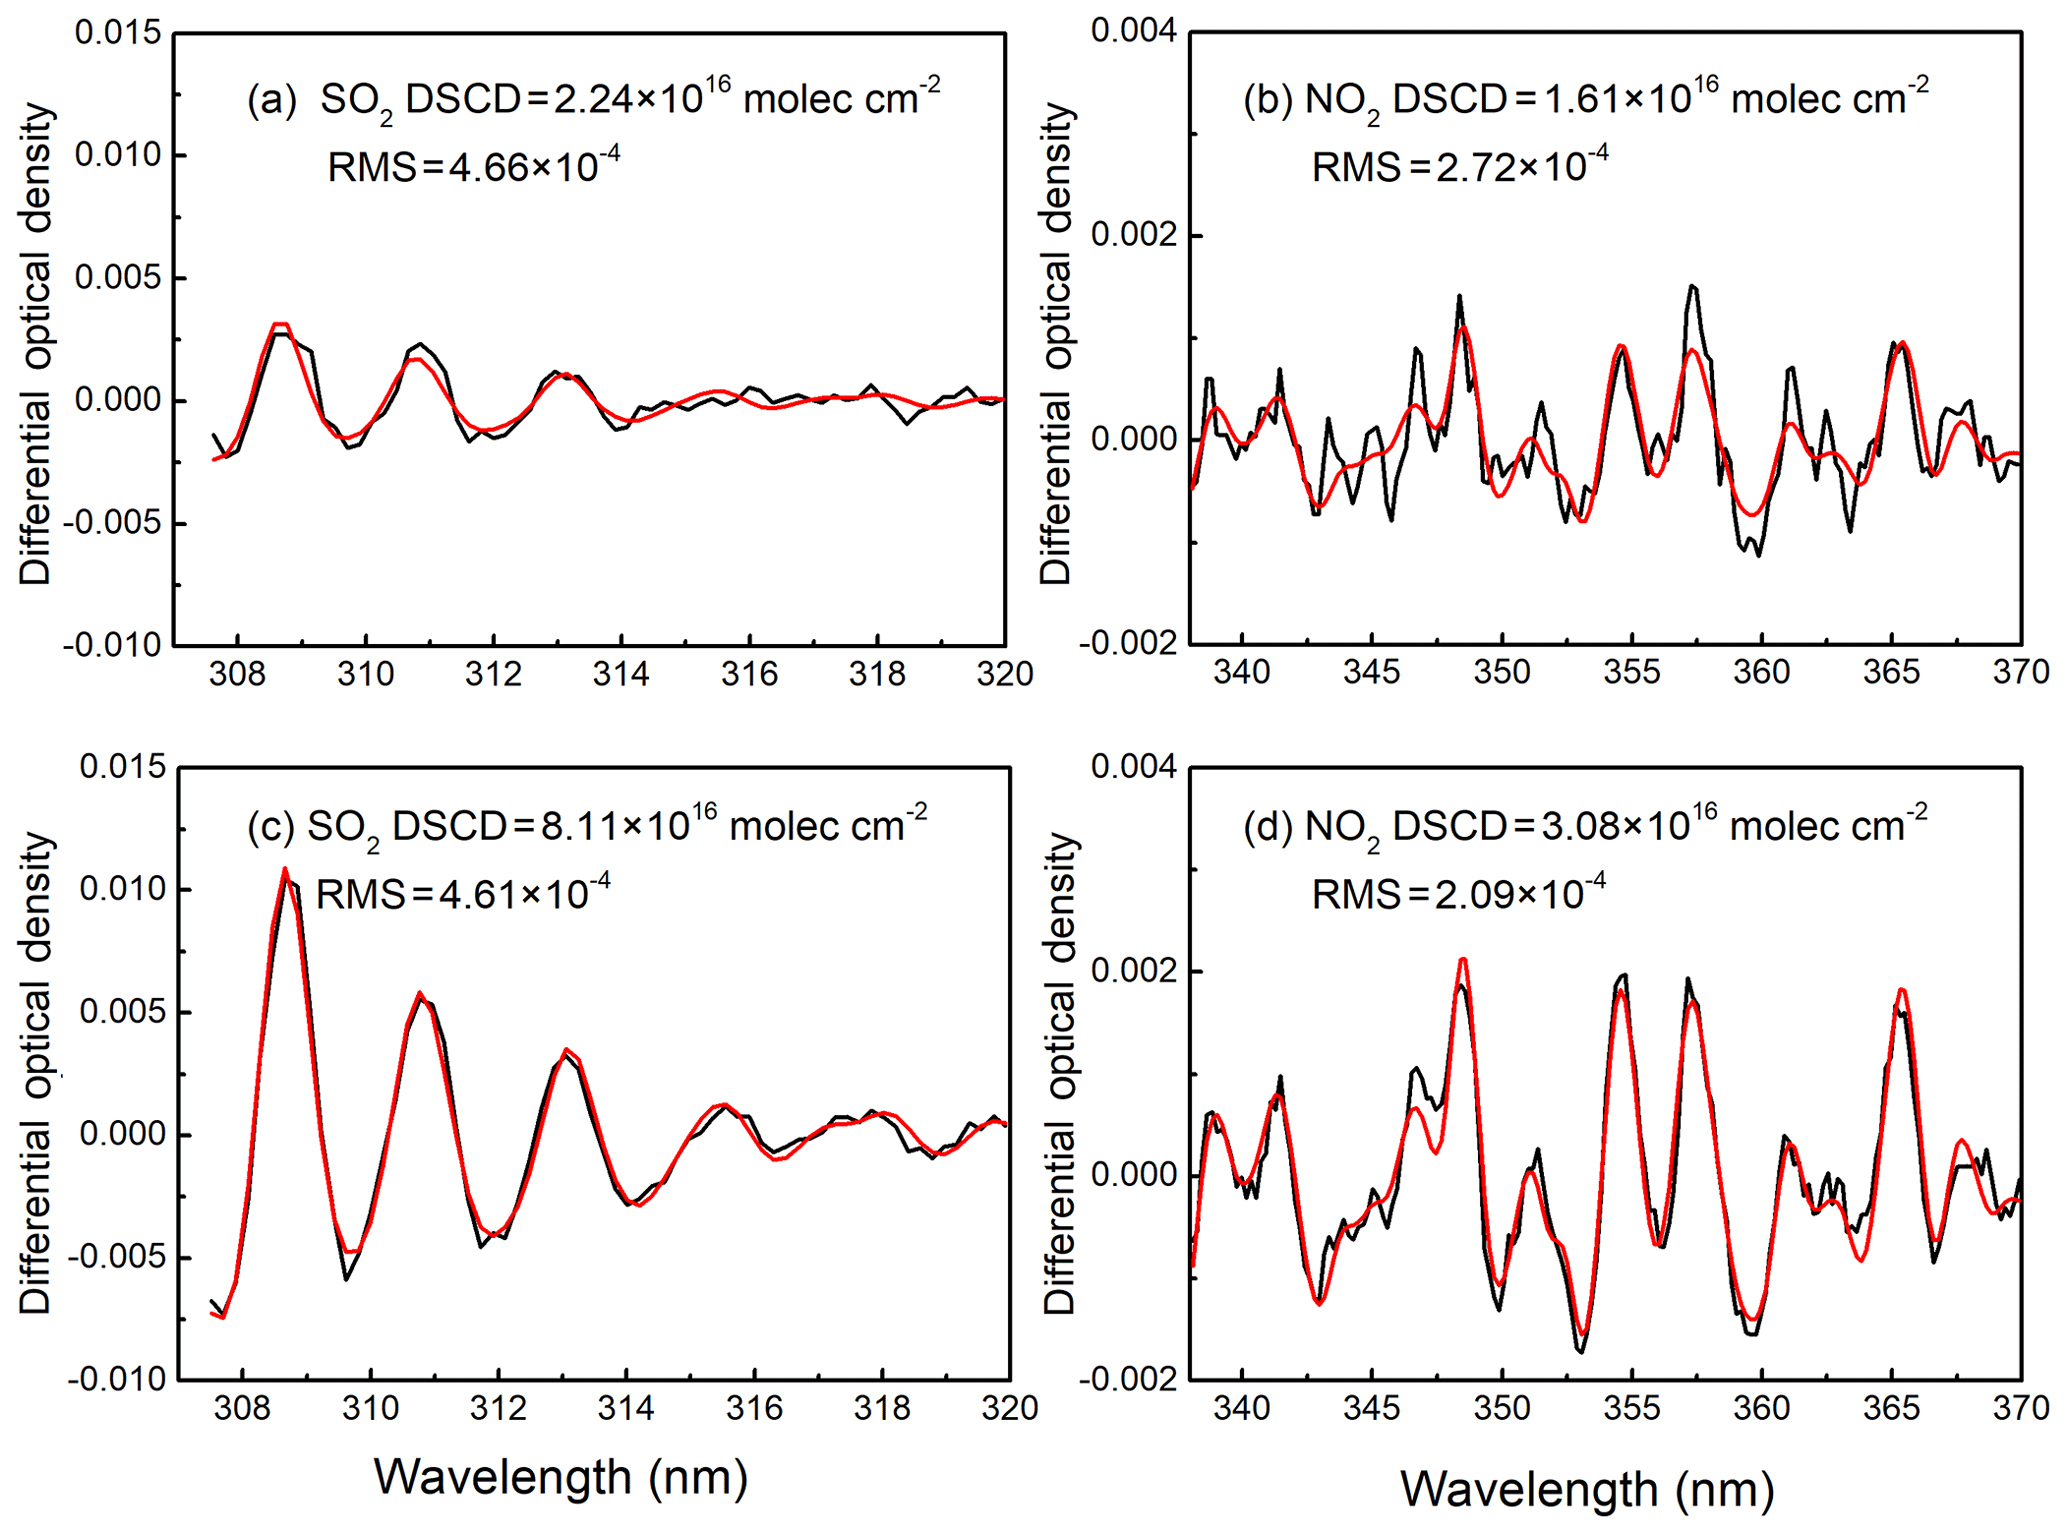
Figure 2Typical DOAS spectral fitting for SO2 and NO2. Panels (a) and (b) show spectrum collected at an elevation angle of 5∘ at 10:39 LT on 22 June 2018 under clean conditions, whereas panels (c) and (d) are spectrum measured at an elevation angle of 5∘ at 09:53 LT on 22 June 2018 under the influence of ship plume pollution. Black lines show the measured atmospheric spectrum, and the red line shows the reference absorption cross section.
2.3 MAX-DOAS measurements for ship emissions
For ship emission measurements, the DSCDs of pollutants at low elevation angles should express the change in the integrated concentrations along the light path after contamination by the exhaust plume, which collects scattered sunlight passing through ship plumes. Figure 3a depicts a schematic diagram of ground-based MAX-DOAS measurements of ship emissions. The telescope is pointed towards the shipping lanes or in the direction of a ship that is passing through. Consequently, the spectra measured at a low elevation angle will be impacted by the plumes of ship emissions.
In order to better demonstrate the background concentration of NO2 and SO2, several typical observation cycles from 29 June were selected as examples. Figure 3b and c show the vertical distributions of NO2 and SO2 DSCDs with elevation angle when there is a ship passing through and when no ship is present, respectively. It can be observed that the DSCDs of NO2 and SO2 decreased slowly with increasing angle under clean conditions, during which the maximum values of the NO2 and SO2 DSCDs are 5.03×10¹⁶ molec cm−2 at an elevation of 3∘ and 1.78×10¹⁶ molec cm−2 at an elevation of 2∘, respectively. In contrast, the NO2 and SO2 DSCDs increased significantly when ships passed through, showing maximum NO2 and SO2 DSCD values of 7.36×10¹⁶ molec cm−2 and 4.15×10¹⁶ molec cm−2 at an elevation of 5∘, respectively; the highest value of SO2 generally appeared between an elevation angle of 5 and 10∘.
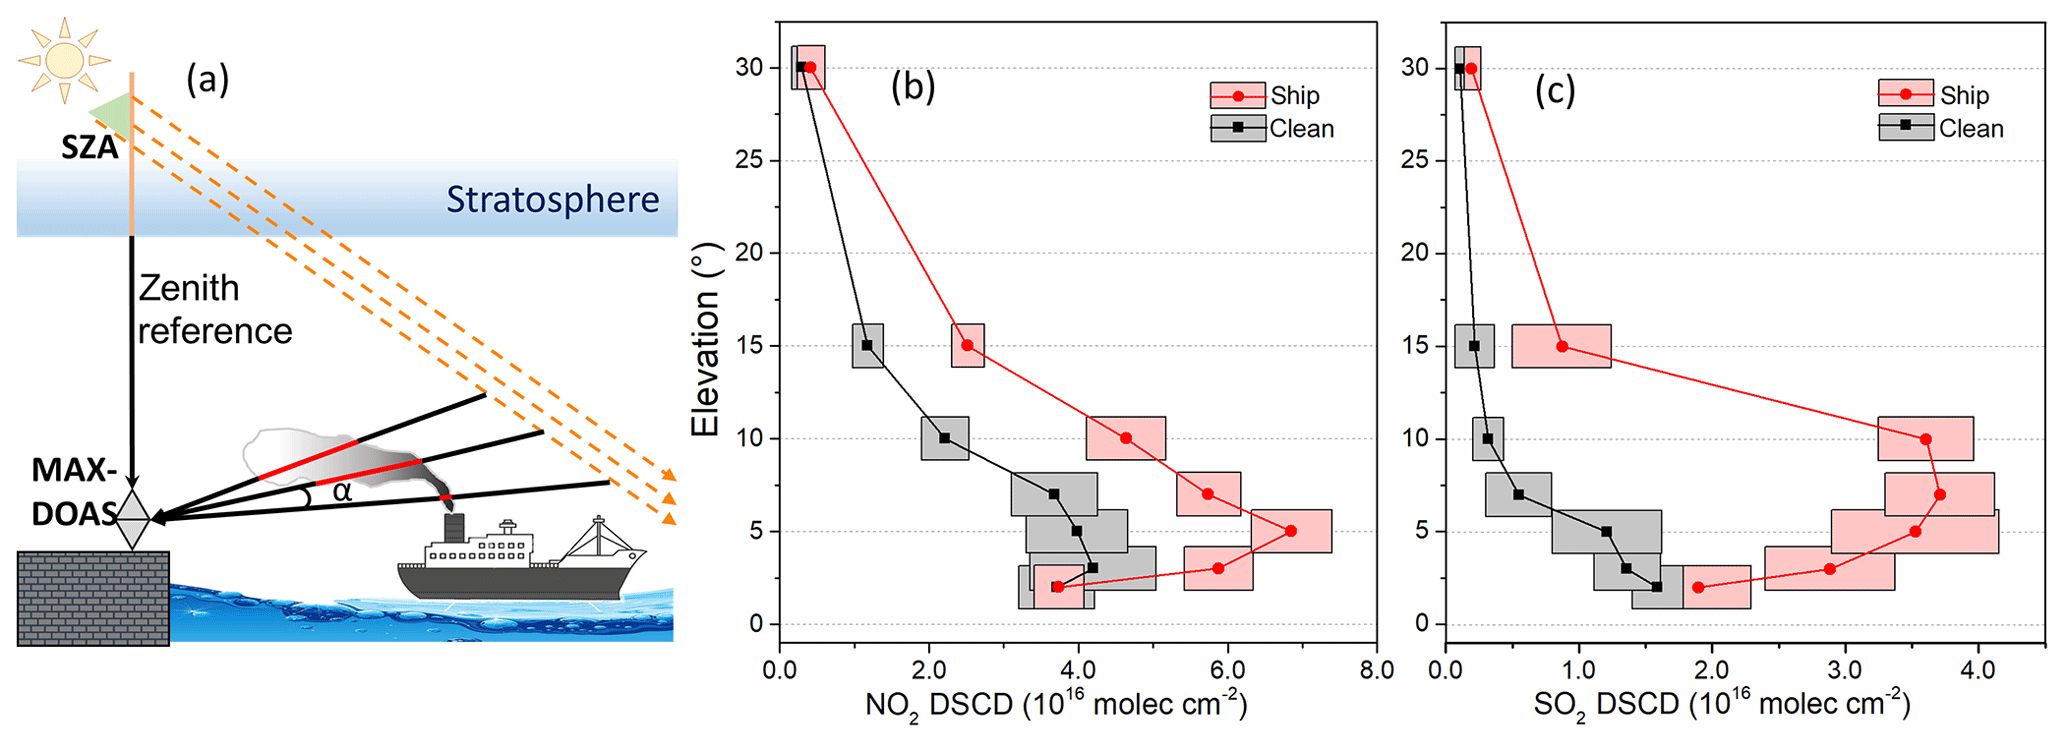
Figure 3(a) A schematic diagram of the MAX-DOAS measurement geometry for monitoring ship emissions, and the distributions of (b) NO2 and (c) SO2 DSCDs with elevation angle on 29 June 2018.
3.1 Identifying ship emissions at berth
The measurement site at the Waigaoqiao container terminal is located on the southern bank of the Yangtze River, close to the confluence of the Yangtze and Huangpu rivers. The terminal has a total quay length of more than 1 km, and its three container berths are able to accommodate fifth- and sixth-generation container ships. The terminal's location means that it is an important traffic route for ships entering or leaving the Yangtze River, the Shanghai Port and the Waigaoqiao Wharf. Ship emission are also the only obvious source of SO2 or NO2 in this area.
In order to detect the emissions of ship at berths, the MAX-DOAS instrument is placed on a fifth floor of the Pudong MSB (Maritime Safety Bureau) building. The distance between the instrument and the berths is about 1.4 km. As the view from the building is not obscured, multiple berths are in the MAX-DOAS instrument's direct field of view. Considering the size and chimney height of berthed ships, the MAX-DOAS telescope was set to scan vertically in sequence at 3, 4, 5, 6 and 7∘ (indicated by angle α in Fig. 4). In the horizontal direction, the telescope ranged from 26 to 34∘ (the viewing angle from north in the clockwise direction) and yielded a range of angle β. After completing one full scanning sequence in both the vertical and horizontal, a 2-D distribution of DSCDs in the instrument's field of view can be generated. To avoid interference from pollutants' absorptions in the reference spectrum, the spectrum measured at azimuth angle of 10∘ was considered as the reference background spectrum (no direct pollution from ship emissions).
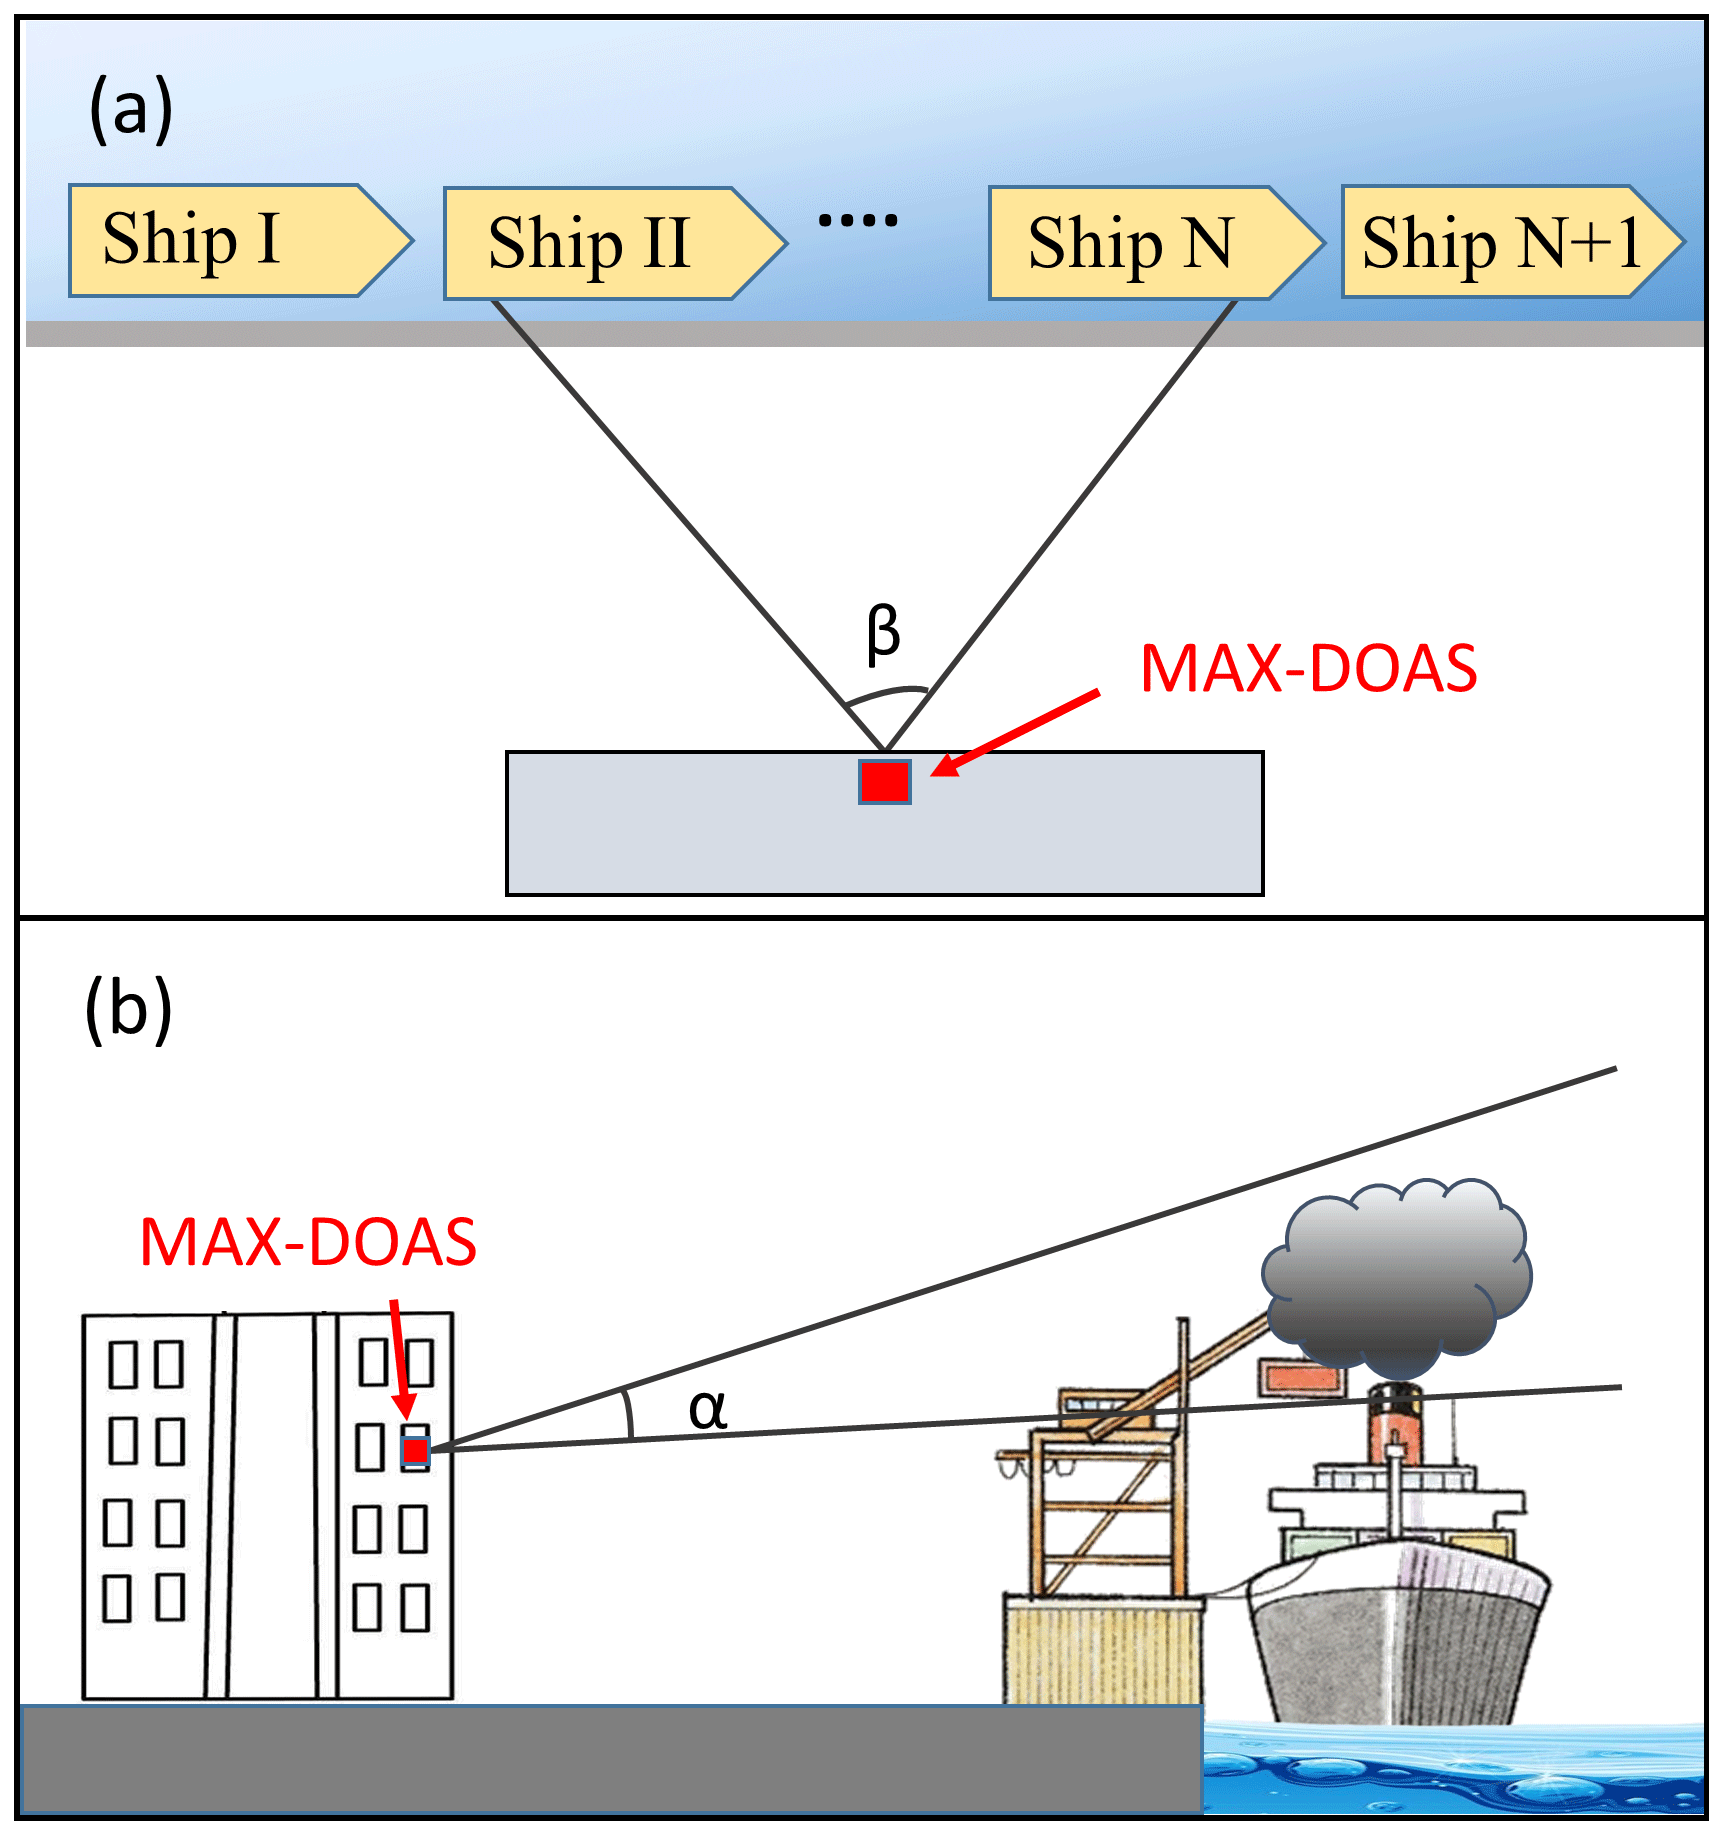
Figure 4The observational geometry of the MAX-DOAS for identifying the emissions of ships at berth in the Waigaoqiao port, Shanghai: (a) top view and (b) side view.
Figure 5a and b show the respective spatial distributions of the SO2 and NO2 DSCDs in the horizontal and vertical directions during a complete scanning sequence. Large spatial gradients can be observed for both SO2 and NO2 levels, and the pollutant concentrations are generally higher at lower elevation angles and decline with an increase in height. The highest SO2 levels, i.e., DSCDs up to 2.5×10¹⁶ molec cm−2, appeared at a horizontal azimuth of 31∘ and an elevation of 3∘ and attenuated toward the upper left (see Fig. 5a). Similarly, hot spots of NO2 with DSCDs of 7.0–8.0×10¹⁶ molec cm−2 were centered between 31∘ and 33∘ in the horizontal at an elevation of 3∘, and decreased in the periphery. It should be noted that the hot spots of the SO2 and NO2 distributions are shifted to the left accordingly, whereas the height is raised. This implies that plumes containing SO2 and NO2 emitted at the bottom of the observational field of view, disperse and dilute in an upper-left direction, during which the wind at this test site mainly came from the south. Combined with the real scene, shown in Fig. 5c, the dashed rectangle indicates the range of the MAX-DOAS telescope scanning sequence. It can be seen that there are smoke clusters discharged by a ship in the right-hand section of the picture, which corresponds to the azimuth angle between 31 and 33∘; under the action of the wind, the plume then spreads to the left of the observational view.
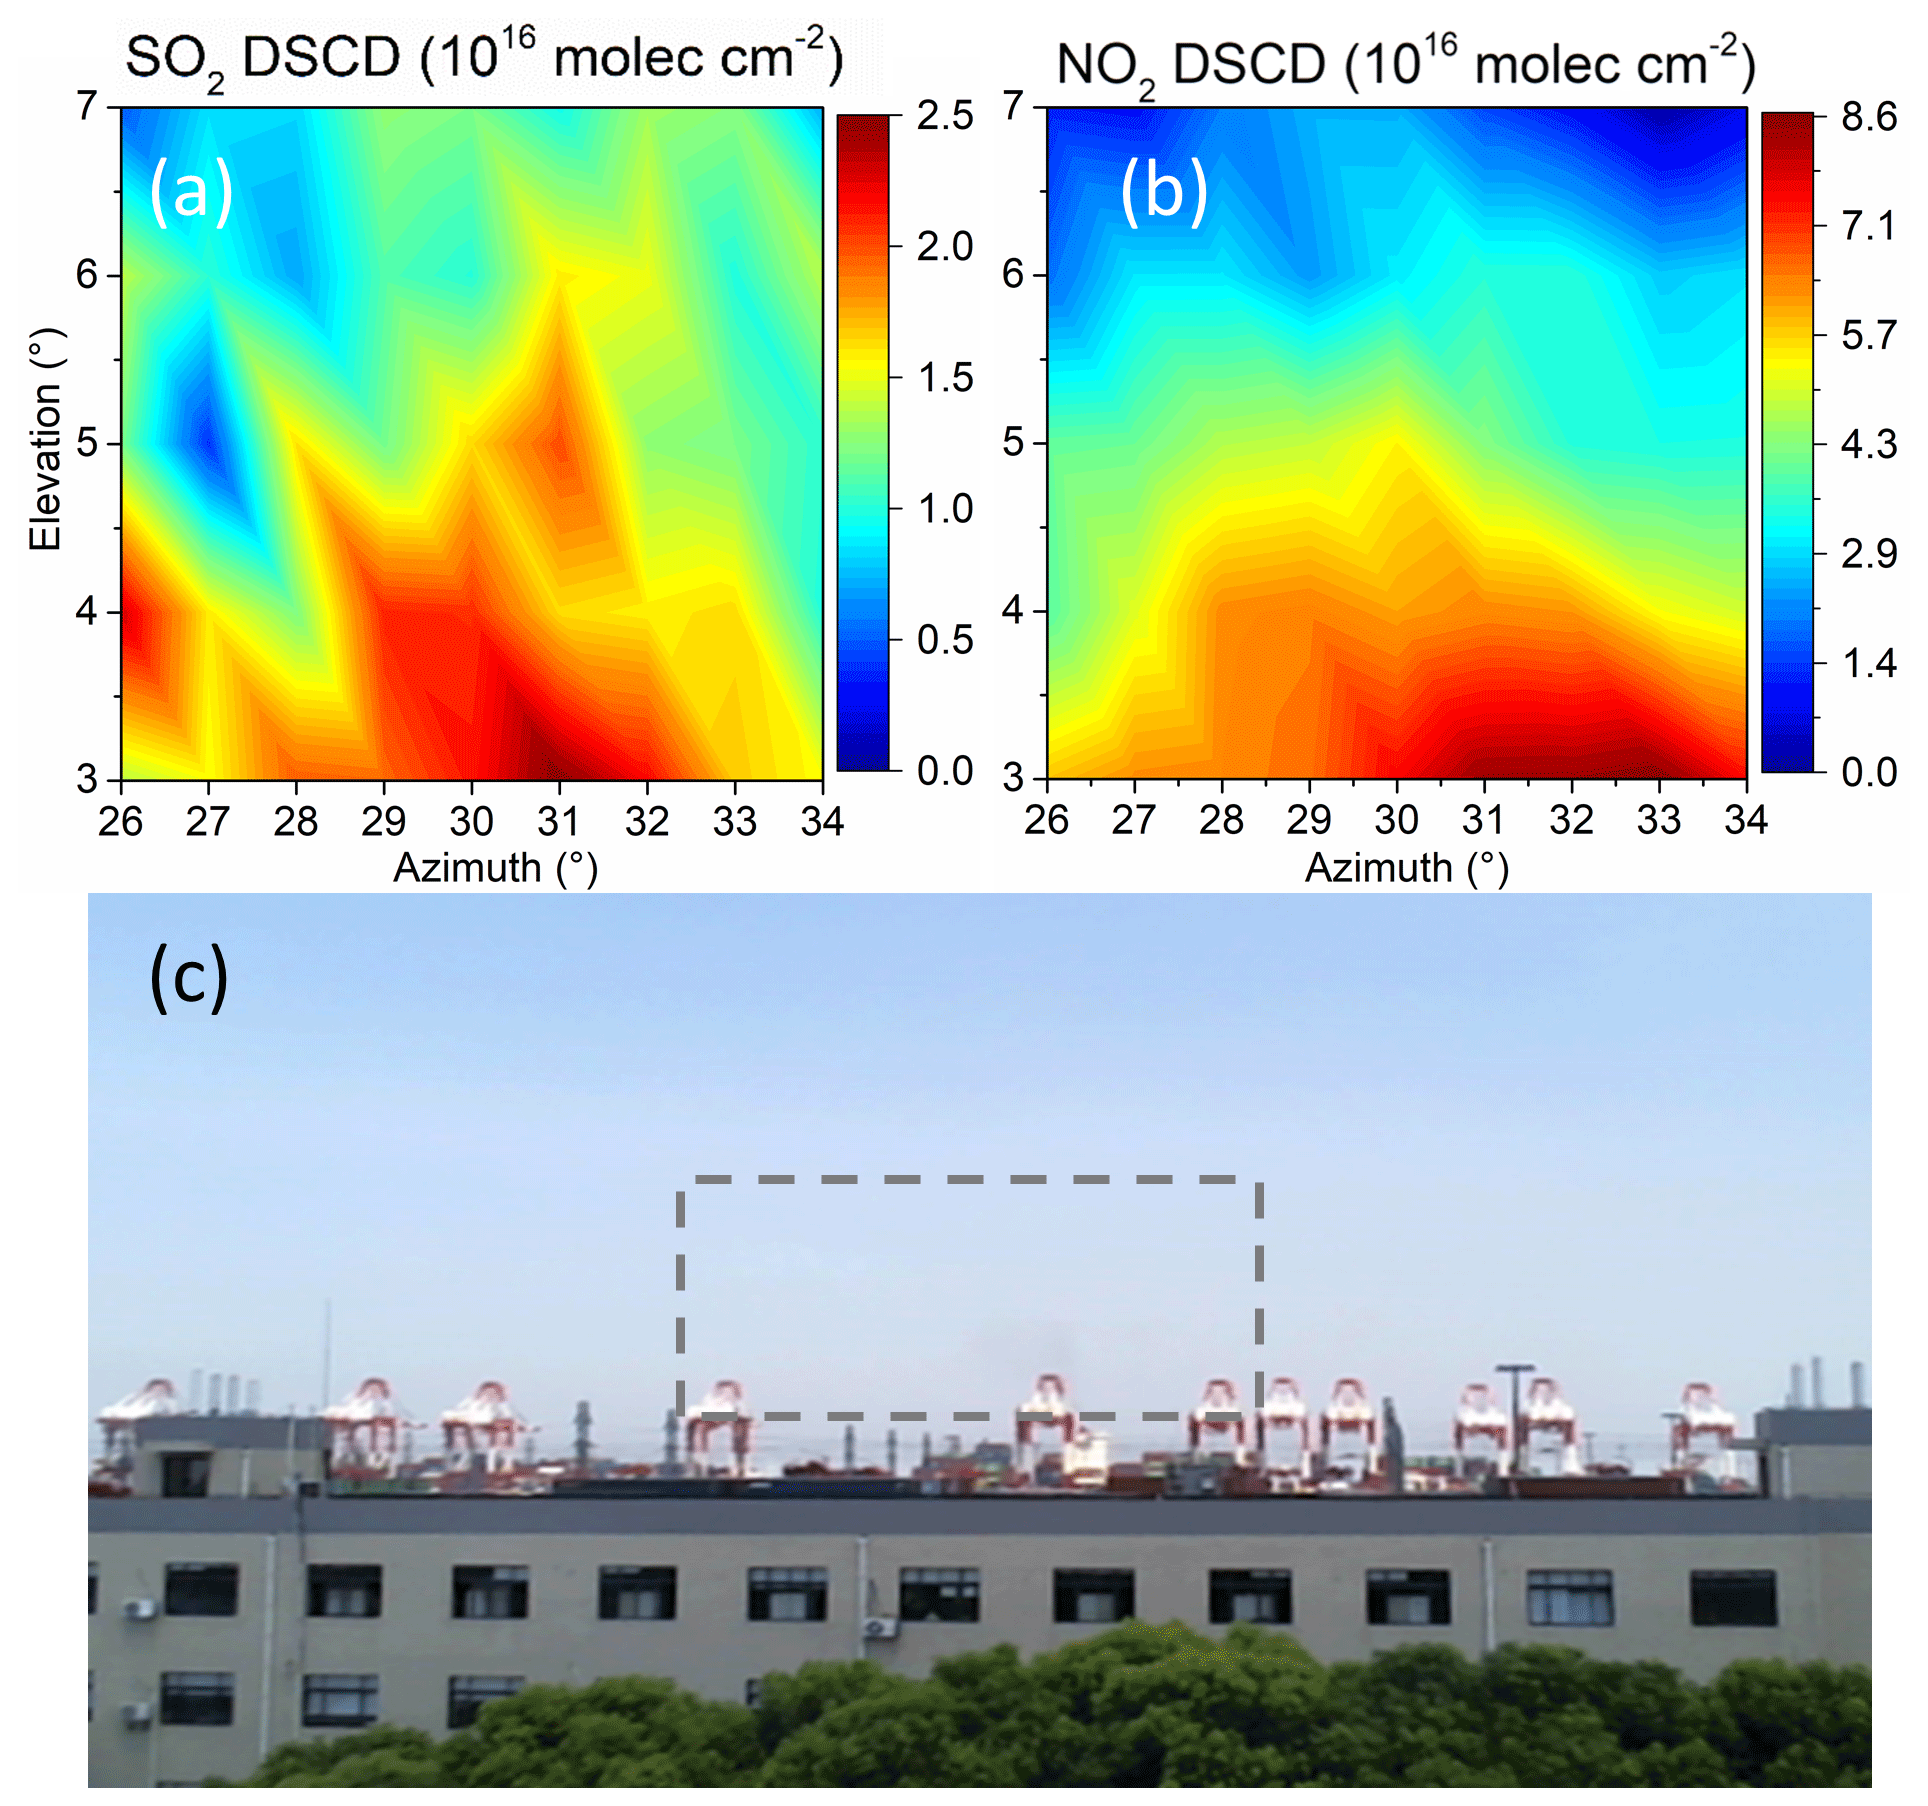
Figure 5Distributions of the measured DSCDs of (a) SO2 and (b) NO2 from emissions of a ship at berth from 12:04 to 12:20 on 28 August 2017, and (c) a live photo captured by the MAX-DOAS instrument's camera. The dashed rectangle indicates the observational view of the MAX-DOAS.
As a full 2-D scanning sequence in the horizontal and vertical directions took about 15 min, more than 10 cycles could be performed in total during an afternoon. In view of the previously identified emission source position, and considering that the NO2 and SO2 hot spots in each 2-D distribution are related to the azimuth of the berth where the ship is docked and the corresponding ship's operation status, the DSCDs of NO2 and SO2 observed at an elevation of 4∘ and an azimuth angle of between 31 and 33∘ were selected to display the temporal pattern of emissions at berth without averaging. In general, the level of the NO2 DSCDs was much higher than that of SO2; this is due to the fact that there were considerable NOx emissions from port trucks between the berth and the instrument, whereas there were no other obvious emission sources of SO2 in the area. In order to show the variations in the DSCDs with less interference due to changes in the light path, we used a mathematical method to remove the steady change from the trend lines of the NO2 and SO2 DSCDs, and kept the residual after background subtraction (see Fig. 6). The baseline is modeled as a low-pass signal, whereas the series of peaks is modeled sparsely with sparse derivatives. Moreover, to account for the positivity of peaks, both asymmetric and symmetric penalty functions were utilized (Ning et al., 2014). Following this process, four significant increases in the SO2 levels can be observed during the afternoon, accompanied by NO2 enhancements at approximately the same moments, which can be verified by the real scene photographs that evidently show the plumes emitted from the expected exhaust position.
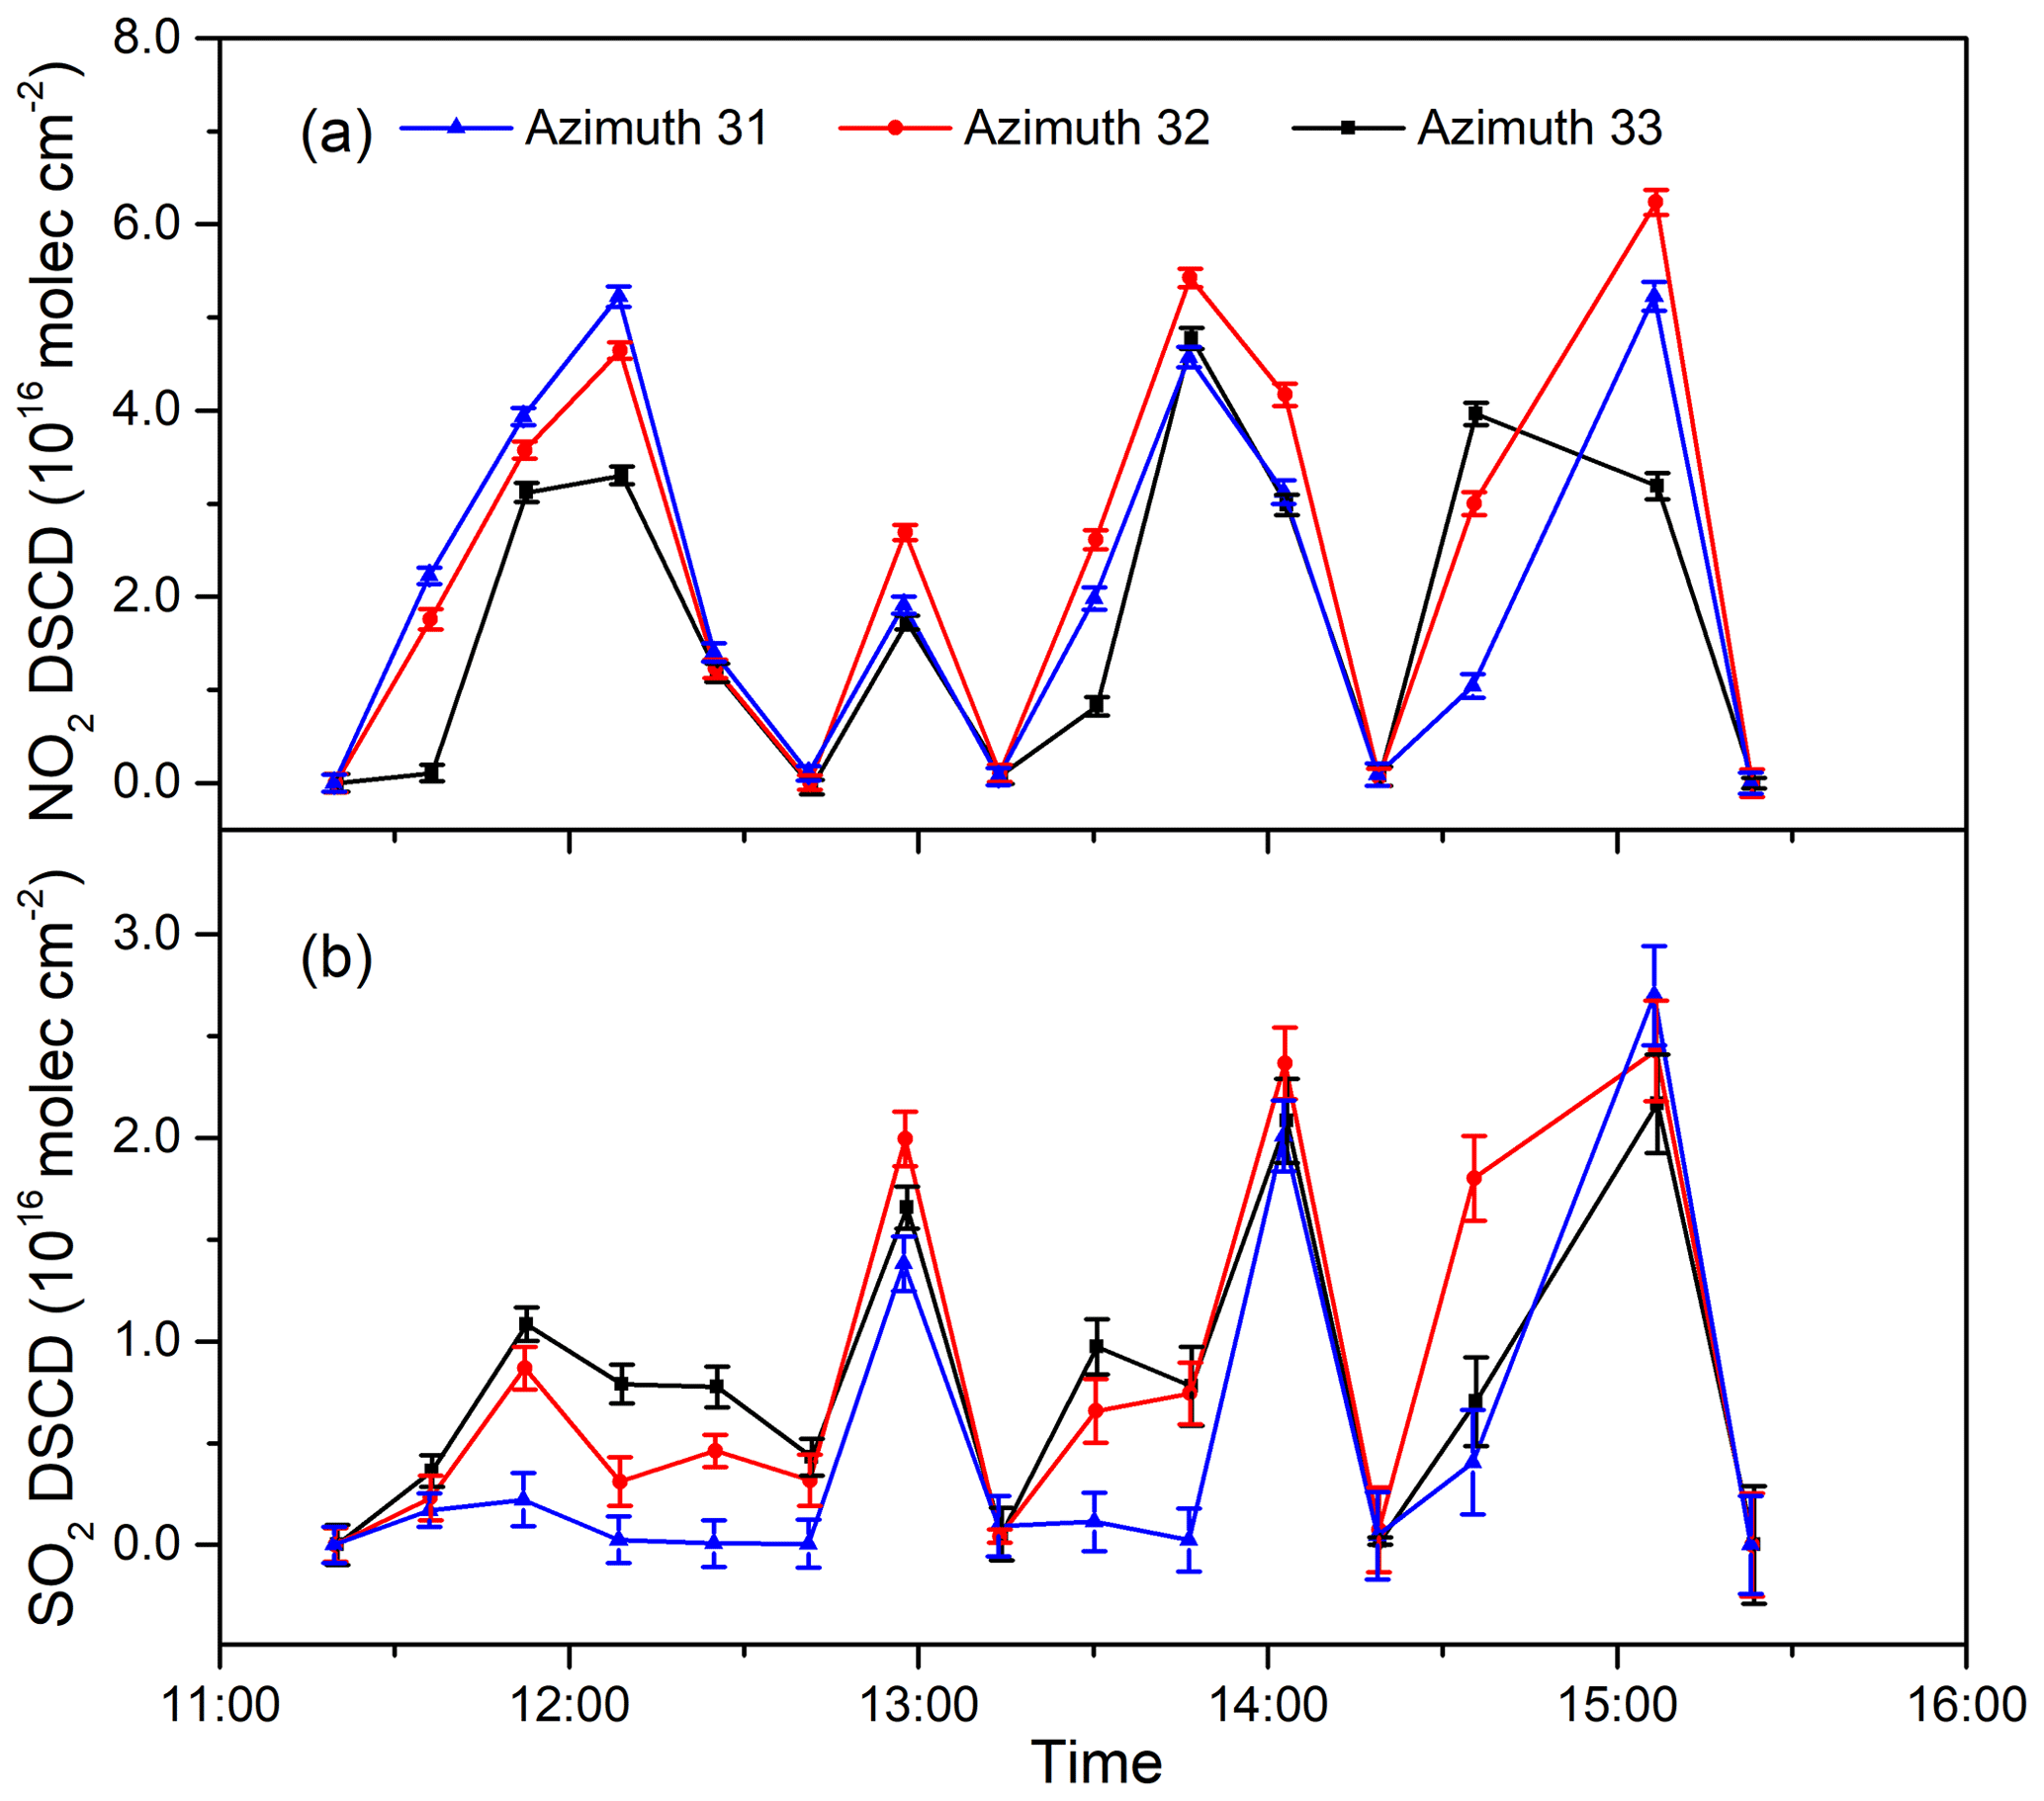
Figure 6Time series of DSCDs of (a) NO2 and (b) SO2 measured at a 4∘ elevation angle at three azimuths on 28 August 2017.
Therefore, it can be concluded that the concentration of NO2 and SO2 gases contained in the plumes emitted by the container ships and the corresponding discharge position at berth were identified and monitored remotely by the 2-D MAX-DOAS observations. This application of 2-D MAX-DOAS is similar to the imaging differential optical absorption spectroscopy (IDOAS) technique, which is also used to map the 2-D spatial distribution of polluted gases, such as the distribution of SO2 in plumes from industrial point sources (General et al., 2014; Pikelnaya et al., 2013). This suggests that the 2-D DOAS technique has the potential to measure the polluted gases mapping from the ships.
3.2 Ship emissions in an inland waterway
In addition to ocean-going ships, vessels in inland waterways also significantly contribute to the amount of ship emissions present in a region (Kurtenbach et al., 2016; Pillot et al., 2016; Zhang et al., 2017). In order to consider emissions from an inland waterway, the MAX-DOAS instrument was installed on the external windowsill on the third floor of the Wusong MSB building (121∘29′ E, 31∘22′ N) from 30 December 2017 to 18 May 2018. The measurement site is located in the downstream region of the Huangpu River, close to its confluence with the Yangtze River. It is the only channel with access to the upstream region of the Huangpu River. There are some non-container terminals near the measurement site, which mainly handle goods related to domestic trading. As a consequence, a large number of ships enter and leave the wharf area every day, and the shipping lanes in the downstream region of Huangpu River suffer from dense ship traffic. By checking the synchronized photographs taken by the camera attached to the instrument, it was found that the types of vessels passing through were diverse, including medium and small container ships, passenger vessels, bulkers and cargo ships. In addition, the traffic volume in the area is quite high, even as high as hundreds of ships per hour. As shown in Fig. 1c, the viewing direction of the MAX-DOAS instrument in the Wusong area was perpendicular to the river's shipping lane. Thus, the pollutant signals observed mainly came from the emissions of ships navigating the shipping channel. Nevertheless, a small dock and a station for transport containers are located opposite the river, and may slightly influence the measurements. The elevation angles were set in a scanning sequence of 0, 1, 2, 3, 4, 5, 6 and 8∘. The spectrum measured at 65∘ was utilized as the reference, as the zenith direction was blocked to some extent by the MSB building.
In order to illustrate the impact of the volume of ship traffic and the meteorological conditions, the 30 min averaged wind speed data, the observed NO2 and SO2 DSCDs on 2 representative days (1 January, and 9 March 2018), and the corresponding number of passing ships are shown in Fig. 7. It can be seen from Fig. 7a that 1 January and 9 March were selected to represent days with stabile and unstable atmospheric conditions, respectively. On 1 January, the average SO2 DSCDs changed from 1.8×10¹⁶ to 3.0×10¹⁶ molec cm−2, whereas the average NO2 DSCDs varied between 4.0×10¹⁶ and 1.1×10¹⁷ molec cm−2. On 9 March, the SO2 and NO2 average DSCDs ranged from 1.0×10¹⁶ to 2.7×10¹⁶ molec cm−2 and from 2.5×10¹⁶ to 1.0×10¹⁷ molec cm−2, respectively. According to the ship traffic density shown in Fig. 7b, the diurnal variations of the SO2 and NO2 DSCDs were obviously closely related to the flow of ships (quantitative information). Although the averaged SO2 and NO2 DSCD levels are comparable during these 2 days, the ship traffic flow on 9 March was 50 % higher overall than on 1 January, which may imply the important role of the meteorological conditions. Considering the dense shipping lanes, the ship-emitted pollutants are easily accumulated under unfavorable conditions with lower wind speeds (less than 2 m s−1) on 1 January. On the contrary, the ship emissions along the lanes can be spread and more effectively diffused when the averaged wind speed is around 5 m s−1 on 9 March.
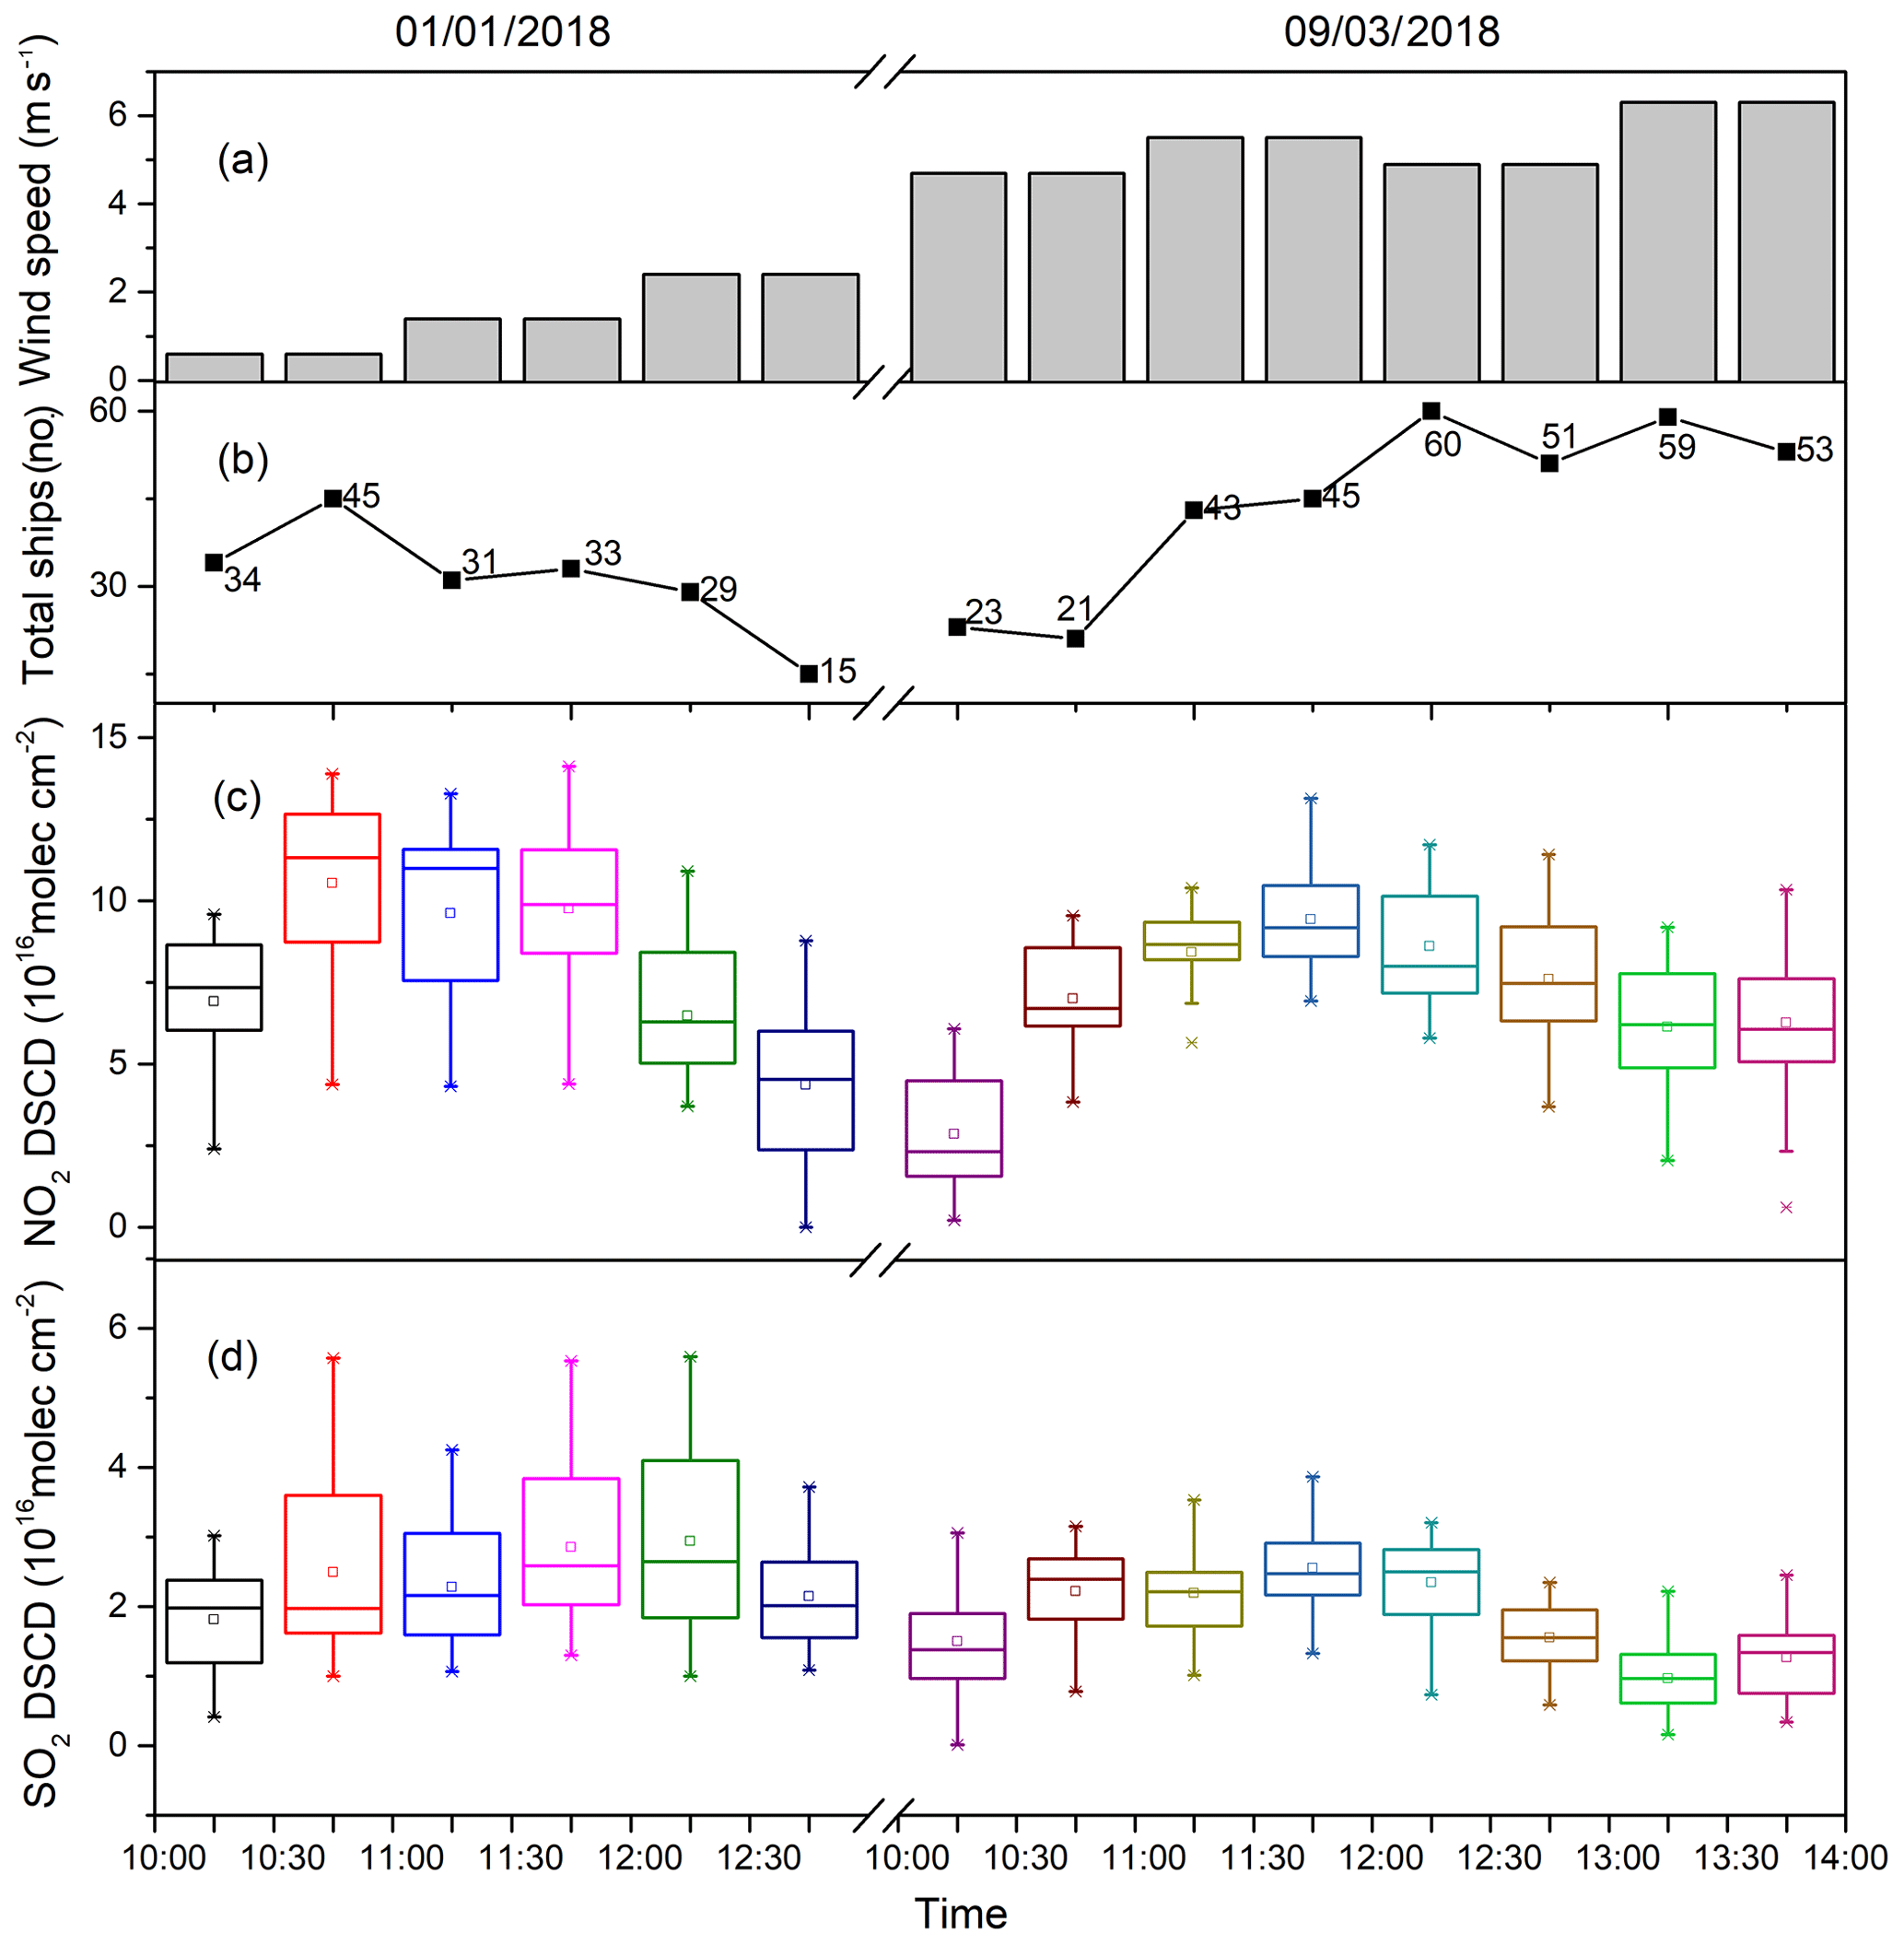
Figure 7The 30 min averaged wind speed, ship traffic volume, observed NO2 and SO2 DSCDs from 10:00 to 13:00 LT on 1 January and 10:00 to 14:00 LT on 9 March at the Wusong Wharf measurement site. The hollow squares in the middle of the boxes represent the mean values, and the solid lines in the middle of the boxes represent the medians. The whiskers extend from each end of the box to the internal and external limits. “–” represents the maximum and minimum, and the “×” symbols are the 1 % and 99 % quantiles. The upper and lower edges of the boxes are the 25 % and 75 % quantiles, respectively.
In order to investigate the impacts of wind on the observed DSCDs, the wind rose diagrams of NO2 and SO2 DSCDs at an elevation of 5∘ from January to March 2018 are shown in Fig. 8a and b, respectively. It can be seen that the wind mainly comes from north-northwest during the observation period. The average of the NO2 DSCDs is low under northerly wind conditions. When the wind direction is parallel to the observation direction (i.e., easterly and westerly, as the viewing direction of the telescope is pointing to the east), the average of the NO2 DSCDs is significantly higher. Similarly, the averaged SO2 DSCDs are higher under easterly and westerly wind conditions than under southerly and northerly conditions. This suggests that the optical length inside the polluted air and, therefore, the response signal is probably increased when the wind transports the polluted air parallel to the DOAS viewing direction. In Fig. 8c and d, the perpendicular direction for north and south is considered to be wind from 0∘ ± 15∘ to 180∘ ± 15∘, and the parallel direction for east and west is considered to be wind from 90∘ ± 15∘ to 270∘ ± 15∘. It can be seen that the NO2 and SO2 DSCDs are quite different under these two types of wind conditions. When the wind is parallel to the observation direction (east and west), 34 % of NO2 DSCDs and 31 % of SO2 DSCDs are greater than 3.00×10¹⁶ and 1.50×10¹⁶ molec cm−2, respectively. However, under perpendicular direction conditions (north and south), the occurrence of high DSCDs of NO2 and SO2 significantly decreased compared with the parallel direction.
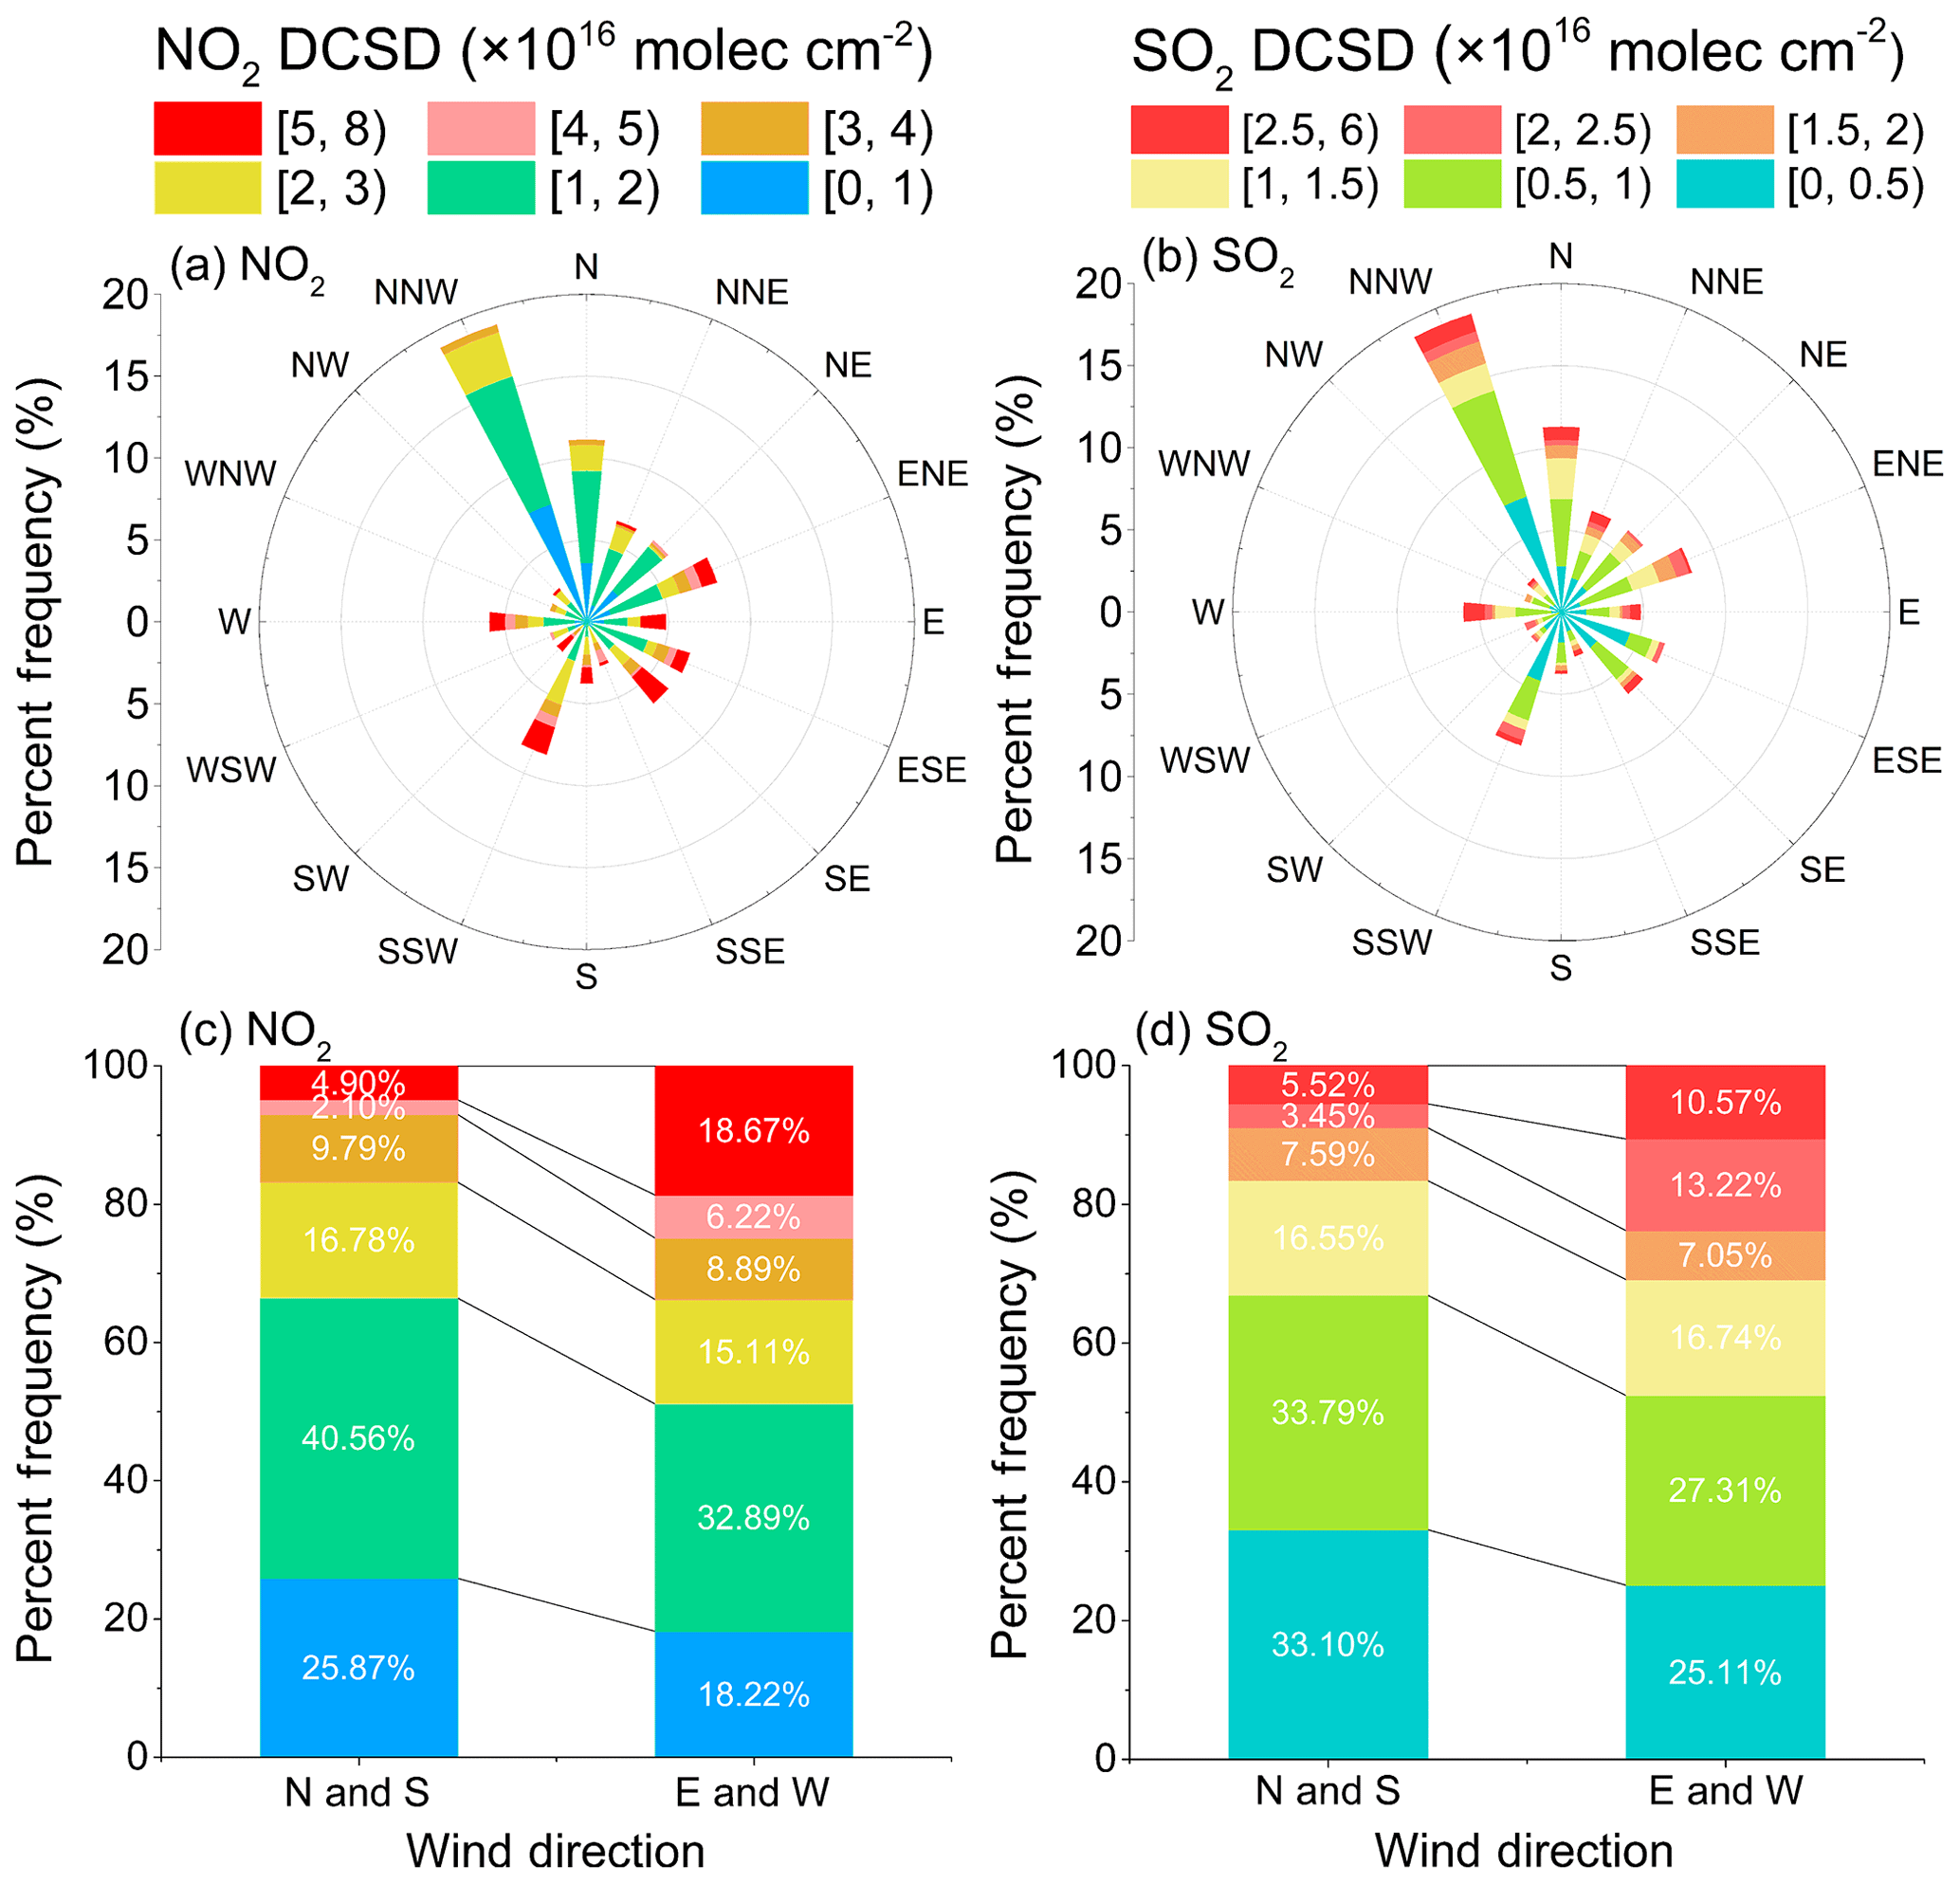
Figure 8The dependence of NO2 (a, c) and SO2 (b, d) DSCDs at an elevation of 5∘ on wind directions from January to March 2018.
Based on the real-time photographs taken by the instrument, we manually counted the ship density in order to discuss its relationship to the observed DSCDs of NO2 and SO2 at an elevation of 5∘, as shown in Fig. 9. It is obvious that the hourly means of the NO2 and SO2 DSCDs show an upward trend as the ship density increases. As the fuels used by ships are inconsistent, and the wind speed and direction also affect the DSCDs, it is difficult to find a clear linear relationship between the hourly data of ship density and the DSCDs in this busy inland waterway environment. From a statistical prospective, the averaged NO2 and SO2 DSCDs of the binned ship density group (the hollow squares in the middle of the boxes in Fig. 9) show a strong positive correlation with the ship density, with a correlation coefficient (R) of 0.86 and 0.97, respectively. The relatively higher R of SO2 suggests that the main impacts of SO2 stem from ship emission sources; however, the R value of NO2 suggests that there may be a more complex NO2 source nearby.
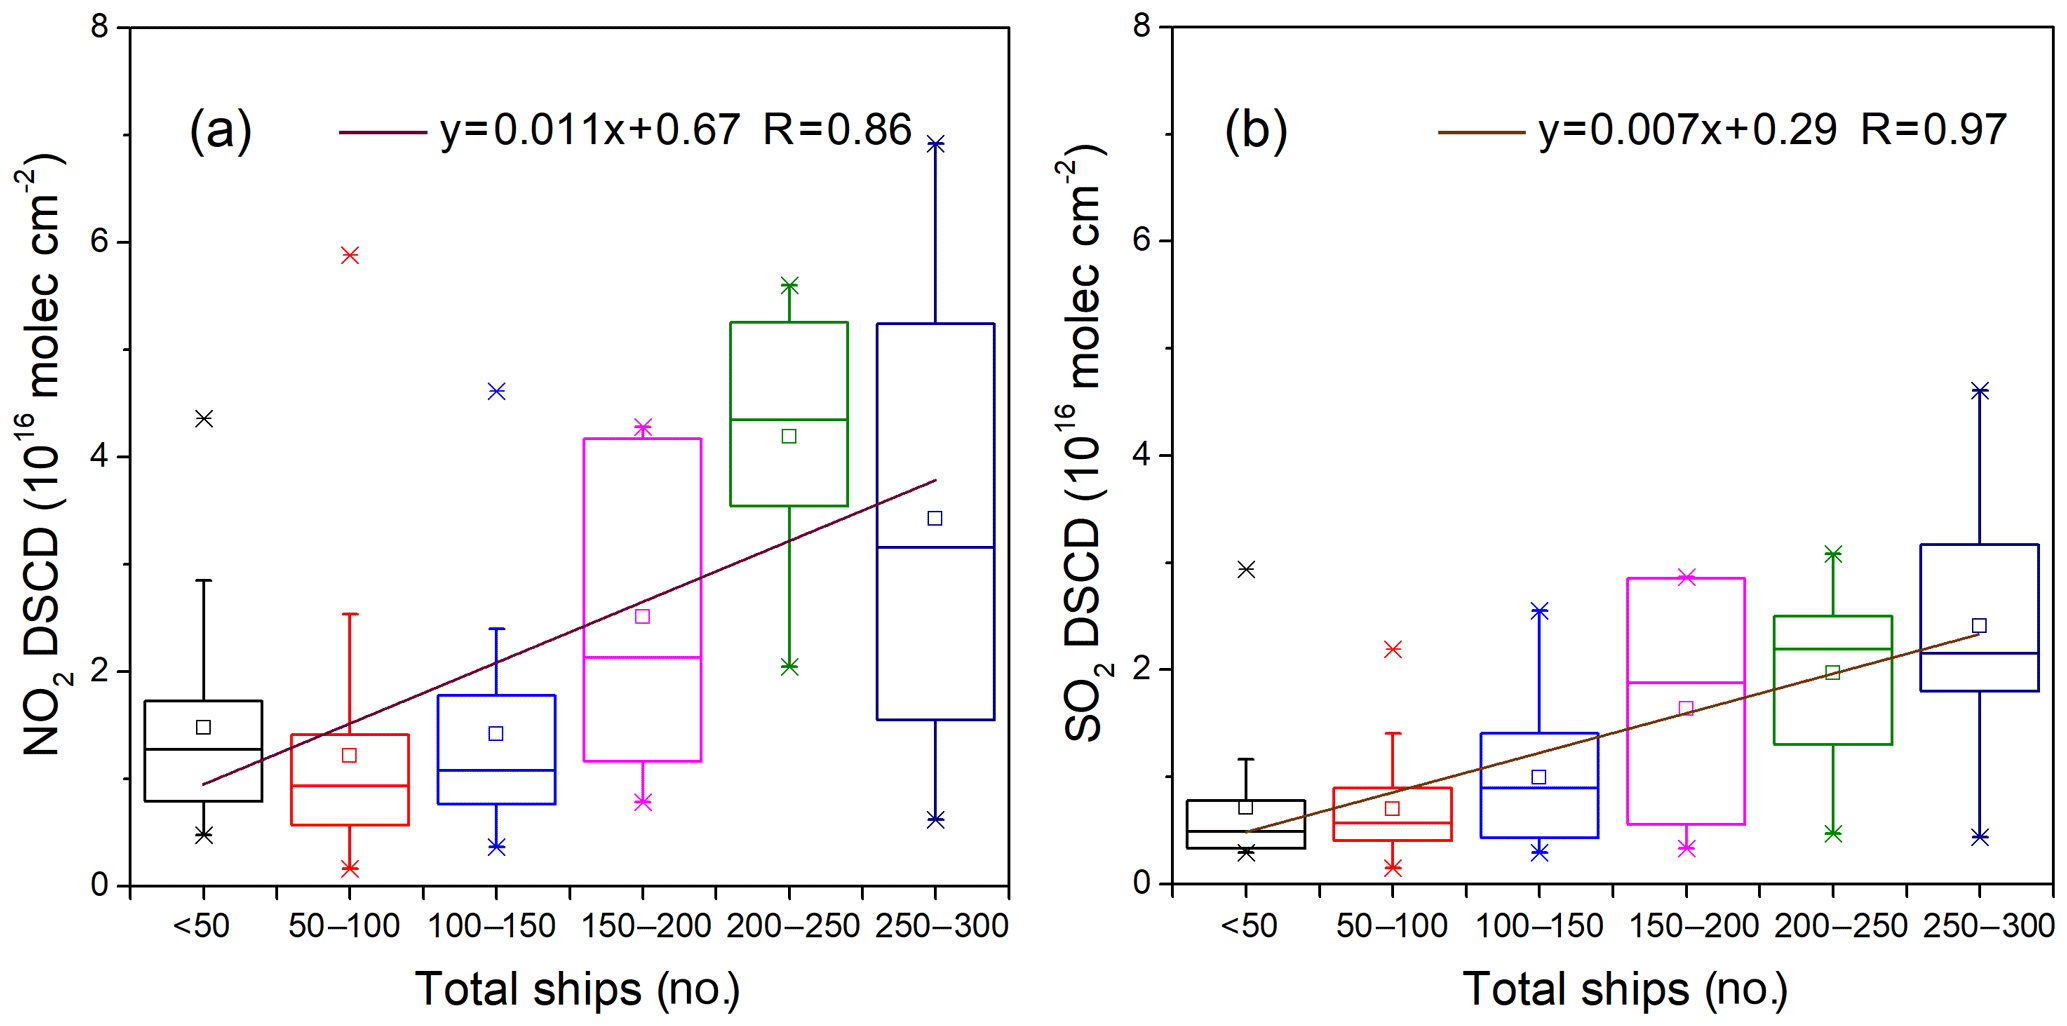
Figure 9Relationship between the DSCDs of (a) NO2 and (b) SO2 at an elevation of 5∘ and ship density. The hollow squares in the middle of the boxes represent the mean values, and the solid lines in the middle of the boxes represent the medians. Whiskers extend from each end of the boxes to the internal and external limits. “–” represents the maximum and minimum, and the “×” symbols are the 1 % and 99 % quantiles. The upper and lower edges of the boxes are the 25 % and 75 % quantiles, respectively.
In general, it can be concluded from the several months of continuous measurements at the Wusong MSB site that the ship density and meteorological conditions are the two major factors influencing the observed NO2 and SO2 levels in this typical inland waterway environment. For similar diffusion situations, the MAX-DOAS instrument can accurately detect elevated pollutants concentrations with an increased number of ships. However, due to the busy shipping lanes in front of the instrument, the MAX-DOAS instrument usually observes pollutant signals in plumes from multiple ships concurrently, and the navigation speed of the ships is relatively faster than the period of a completed scan sequence. Therefore, it is very hard to distinguish a single plume from the mixture. Another shortcoming of this measurement method is that the MAX-DOAS measured NO2 levels are considerably impacted by emission sources in the surrounding area, such as nearby main roads and highways, which make non-negligible contributions to the amount of ambient NO2. As it is not practical for regulatory authorities to undertake fuel detection for each ship in this busy inland waterway environment, MAX-DOAS measurements present a more pragmatic opportunity to surveil ship emissions. Based on the legally permitted sulfur content and ship activity data, the theoretical NO2 an SO2 concentrations of a plume exhausted from a chimney can be calculated. By combining this calculation with the diffusion model of the plume, the theoretical concentration of SO2 on the light path of the MAX-DOAS observations can be obtained. Following this, suspicious ships thought to be using fuel with an excess sulfur content can be identified.
3.3 Ocean-going ship emissions
Another shipping traffic scenario was also considered with respect to the MAX-DOAS measurements at Yantian Port (114∘29′ E, 22∘56′ N), which is located on the east side of Shenzhen in the Pearl River Delta emission control zone (see Fig. 1). Yantian Port is one of the largest container ports in China and even in the world, and has 20 large deep-water berths with a quay length of 8212 m and a water depth alongside the quay of 17.4 m, which is beneficial for docking ocean-going vessels with a length of more than 300 m. Unlike the measurement sites discussed above, a distinct feature of shipping traffic in the Yantian Port is the huge size of inbound and outbound vessels and the much lower traffic density. The MAX-DOAS instrument was installed on the shore in the central operation zone of the Yantian Port from 23 May 2018 to 30 June 2018. As can be seen in Fig. 1d, the viewing direction of the MAX-DOAS was pointed toward the shipping lanes in the eastward sea area. Due to the lack of other emission sources in the instrument's field of view, the MAX-DOAS observations could easily capture the pollutants in a single plume from individual inbound and outbound ships (as shown in Fig. 10).
Figure 10a and b present the altitude dependence of the observed SO2 and NO2 DSCDs around noontime on 26 May 2018. During the observational period, there were three apparent peaks in the SO2 and NO2 DSCDs, i.e., 13:00, 13:30 and 14:10 LT. The increases of both pollutant levels occurred simultaneously. For the first pulse around 13:00 LT, the higher SO2 DSCD levels are distributed above a 10∘ elevation, whereas the strong signals of NO2 are concentrated below an elevation angle of 5∘. This can be explained by the fact that ocean-going container vessels and tugboats behave differently with respect to emissions and operations. Figure 10c shows that a large container ship is outbound at 12:55 LT with the assistance of two tugboats. It is obvious that the exhaust outlet height is very high for large container ships, but quite low for tugboats. As tugboats are usually operated within the port area, their fuel usage is always in accordance with ECA regulations and is of high quality. Thus, the stronger SO2 signals that appeared at a higher altitude were attributed to container ship emissions, whereas NO2 hot spots close to the sea surface were contributed by tugboat emissions. During the period around 13:30 LT, the DSCDs of both SO2 and NO2 were slightly increased and were located below an elevation of 7∘. According to the live photo in Fig. 10d, there was only a small container ship passing through at a distance of about 1 km (in the front view) from the instrument during this time. Considering the distance between the ship and instrument, the height of the exhaust outlet should be related to a lower elevation angle, where the corresponding strong signals of the emitted pollutants are expected to be observed. Additionally, obvious SO2 and NO2 signals were found at around 14:10 LT, during which high SO2 levels were distributed from an elevation angle of 10 to 15∘, but strong signals of SO2 and NO2 were both found near the sea surface; however, no ship was captured in the live photographs. It can be inferred from the AIS information that the signal observed was a dispersed plume from a ship in another shipping lane, and was not from the front view of the instrument. In addition, the AIS information also confirmed that there were no other ship emission disturbances for the two earlier measurements.
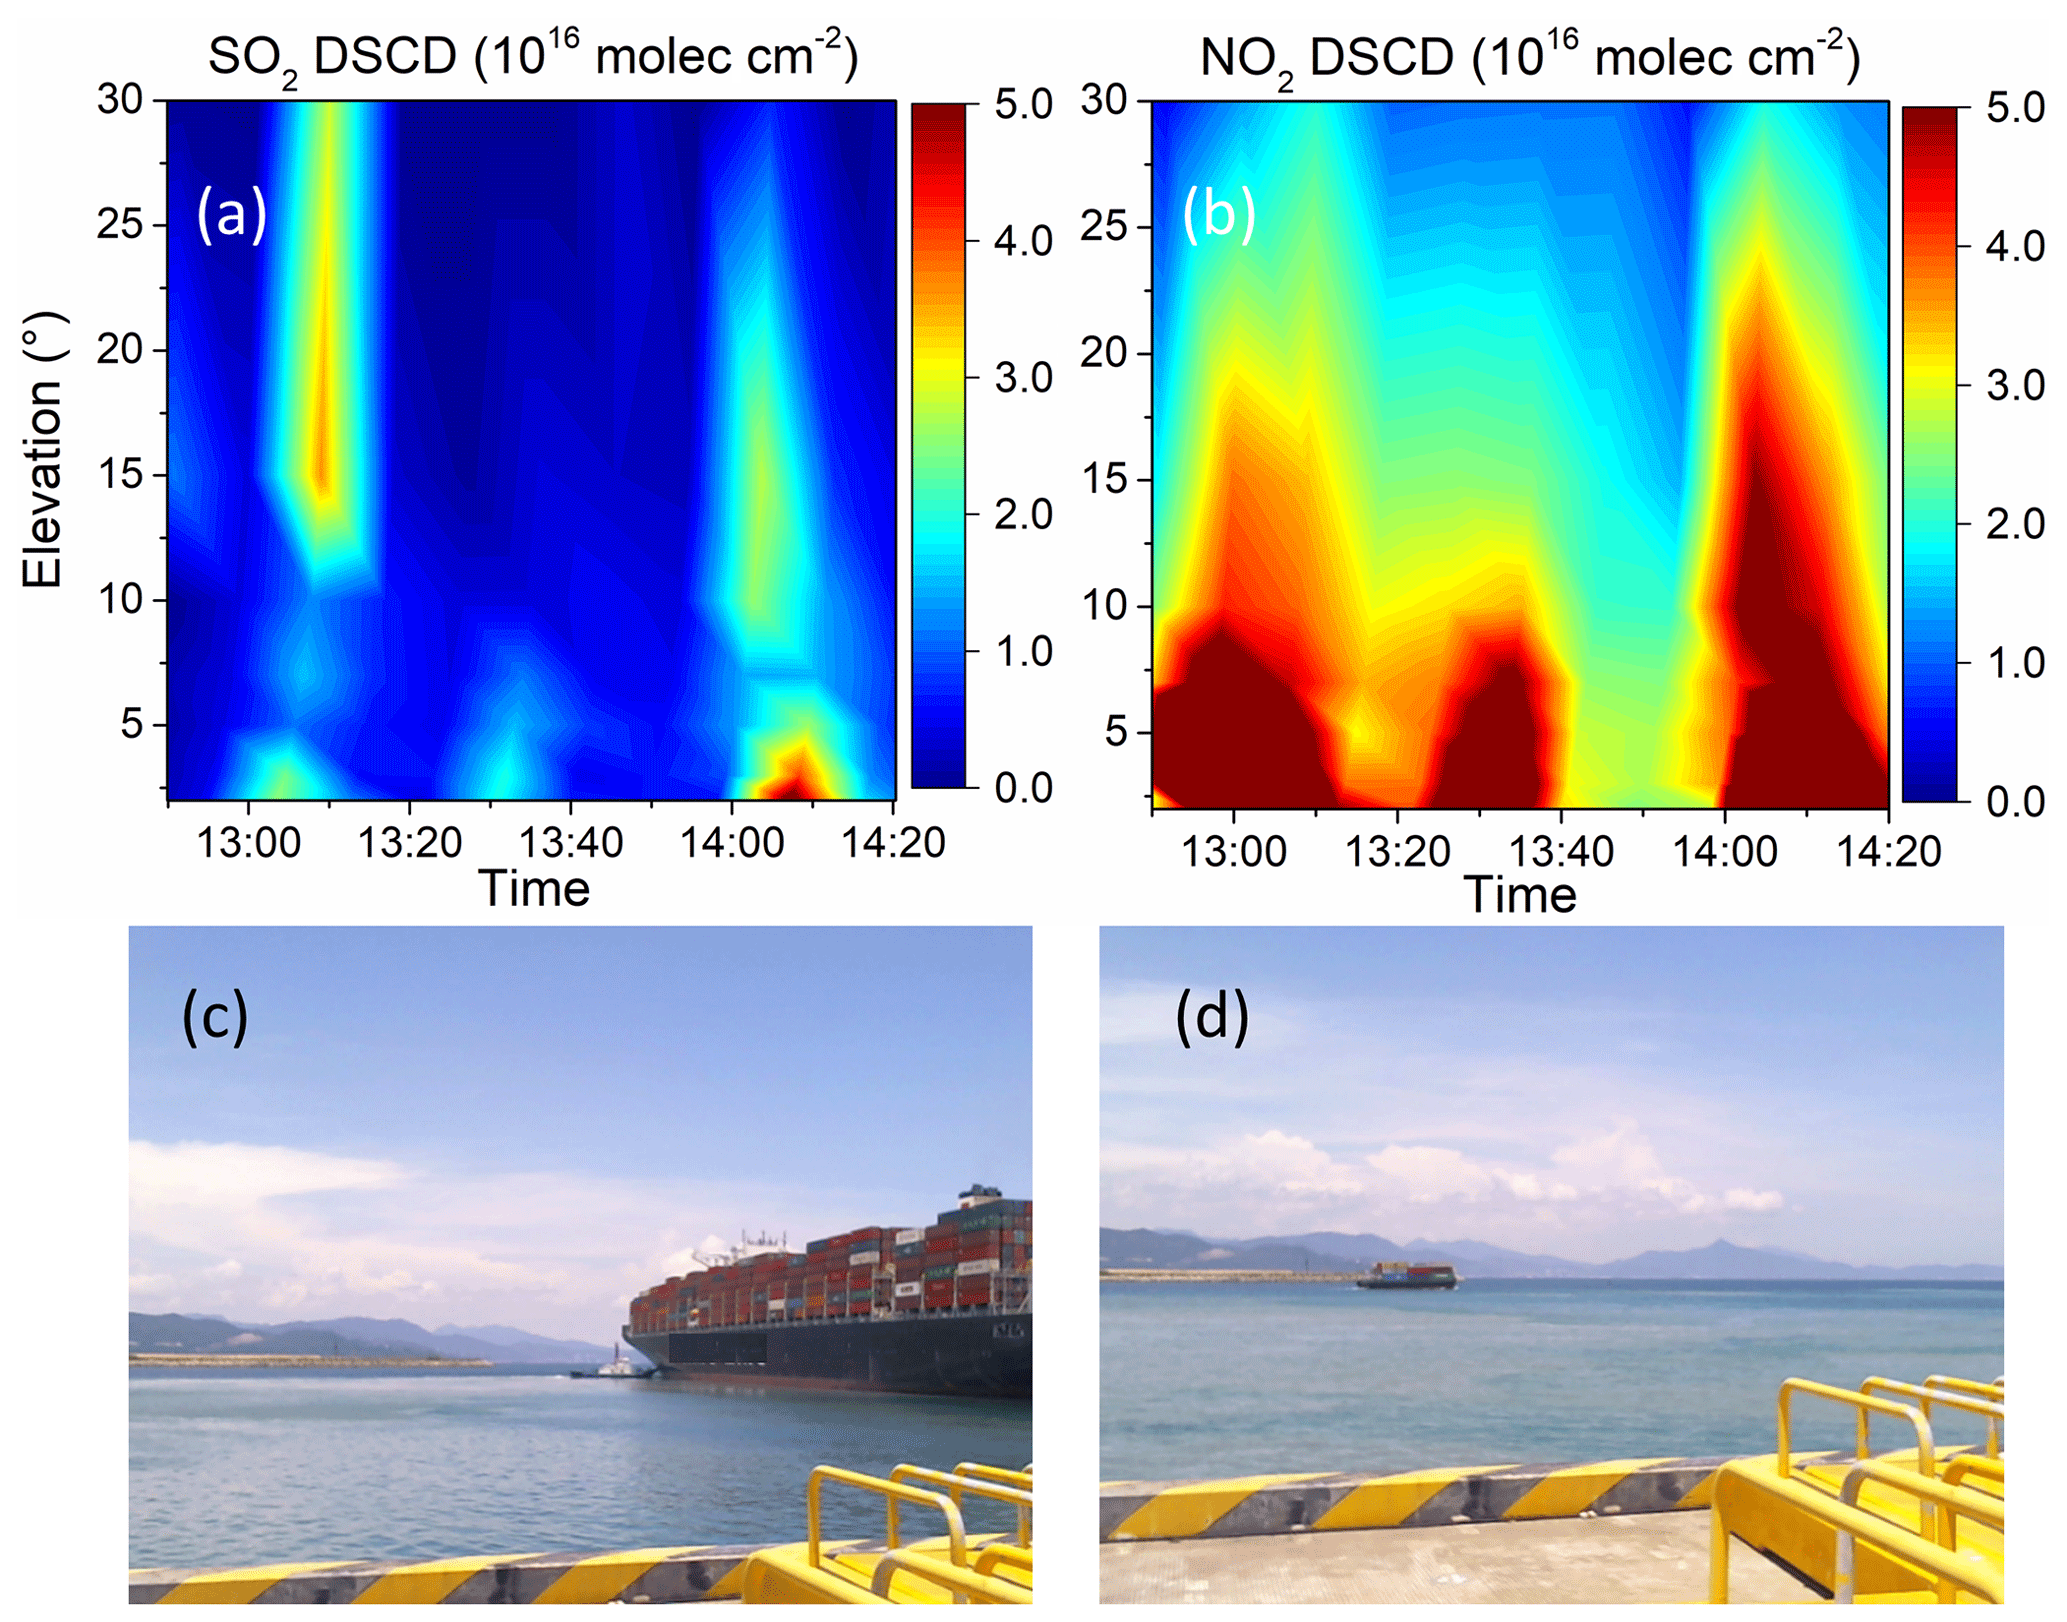
Figure 10Measured DSCDs of (a) SO2 and (b) NO2 from 12:55 to 14:20 LT, and live photographs taken by the camera at (c) 12:56 and (d) 13:22 LT on 26 May 2018.
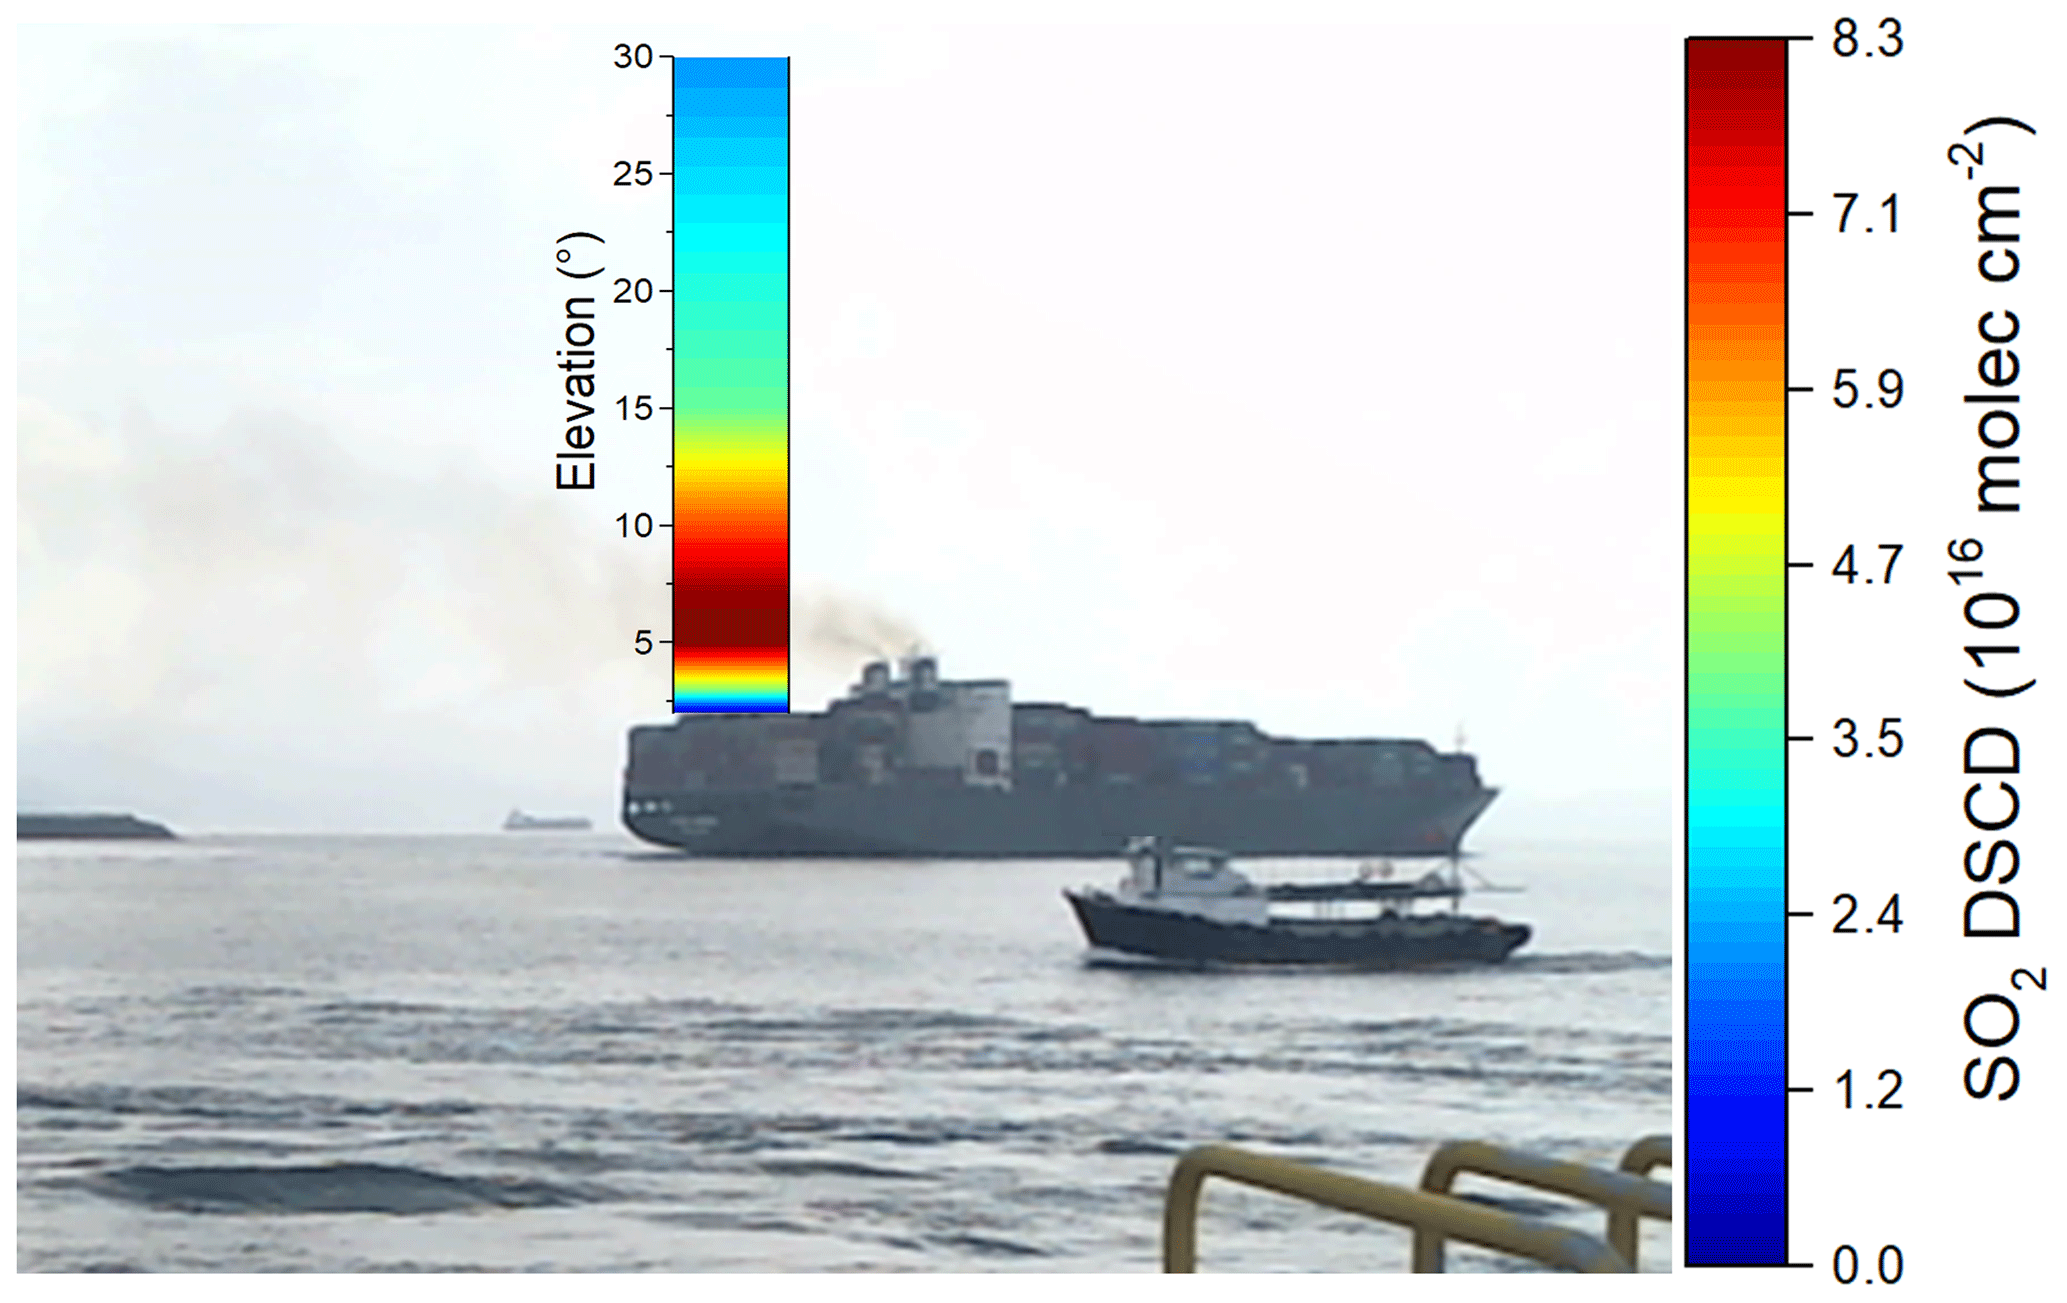
In general, the characteristics of the observed SO2 and NO2 DSCD distributions with respect to height are to some extent related to the ship size, its distance from the instrument and operational status, as well as the atmospheric stability. Based on the example discussed above, the MAX-DOAS measurements at Yantian Port can detect pollutants in a single plume from an individual ship and can provide information regarding the vertical distribution of the pollutants under low ship traffic volume conditions. Considering the large discrepancies of SO2 signals with altitude, we try to analyze the plumes detected in more detail and obtain a representative observation elevation. According to the live photographs, a large container ship entered the field of view at 09:51 LT on 22 June 2018 and moved very slowly, emitting a distinct black smoke plume. Figure 11 shows the distribution of the SO2 DSCDs in plumes at different elevation angles. The SO2 DSCDs peaked at 8.17×10¹⁶ molec cm−2 between an elevation angle of 5 and 7∘, and decreased with height. It was found that the DSCDs observed at an elevation angle of 7∘ are suitable to represent the peak concentrations in the plumes considering the chimney height of ship and its horizontal distance from the MAX-DOAS instrument.
Rather than scanning the full range of elevations, it is possible to individually resolve the plume signal of passing ships using high temporal resolution measurements (60 s) at a single (7∘) elevation. Thus, the diurnal profiles of the SO2 and NO2 DSCDs at a 7∘ elevation for 26 June 2018 were further investigated, and are presented in Fig. 12. The multiple peaks of SO2 and NO2, with the highest DSCDs of SO2 and NO2 exceeding 6.00×10¹⁶ molec cm−2, occurred due to the emissions of the occasional passing ship. By applying a mathematical method, a baseline (the blue dotted line in Fig. 12) can be extracted from the DSCD trend lines (the black solid line in Fig. 12). The baseline represents the diurnal variations in the DSCDs, mostly due to the change in the light path caused by the solar zenith angle and the background emissions. Finally, it can be seen that seven synchronous peaks of SO2 and NO2 levels higher than 2.00×10¹⁶ molec cm−2 are present in the trend line (the red solid line in Fig. 12). Validated by the live photographs from the instrument and the AIS information, these sharp pollutant concentration peaks originated from the ship plumes of passing ships. This emphasizes the high sensitivity of MAX-DOAS measurements to the change in SO2 and NO2 levels in the atmosphere. The increases in the pollutant levels lasted from 10 min to 30 min, which is related to the duration of the ship movement in the instrument's field of view.
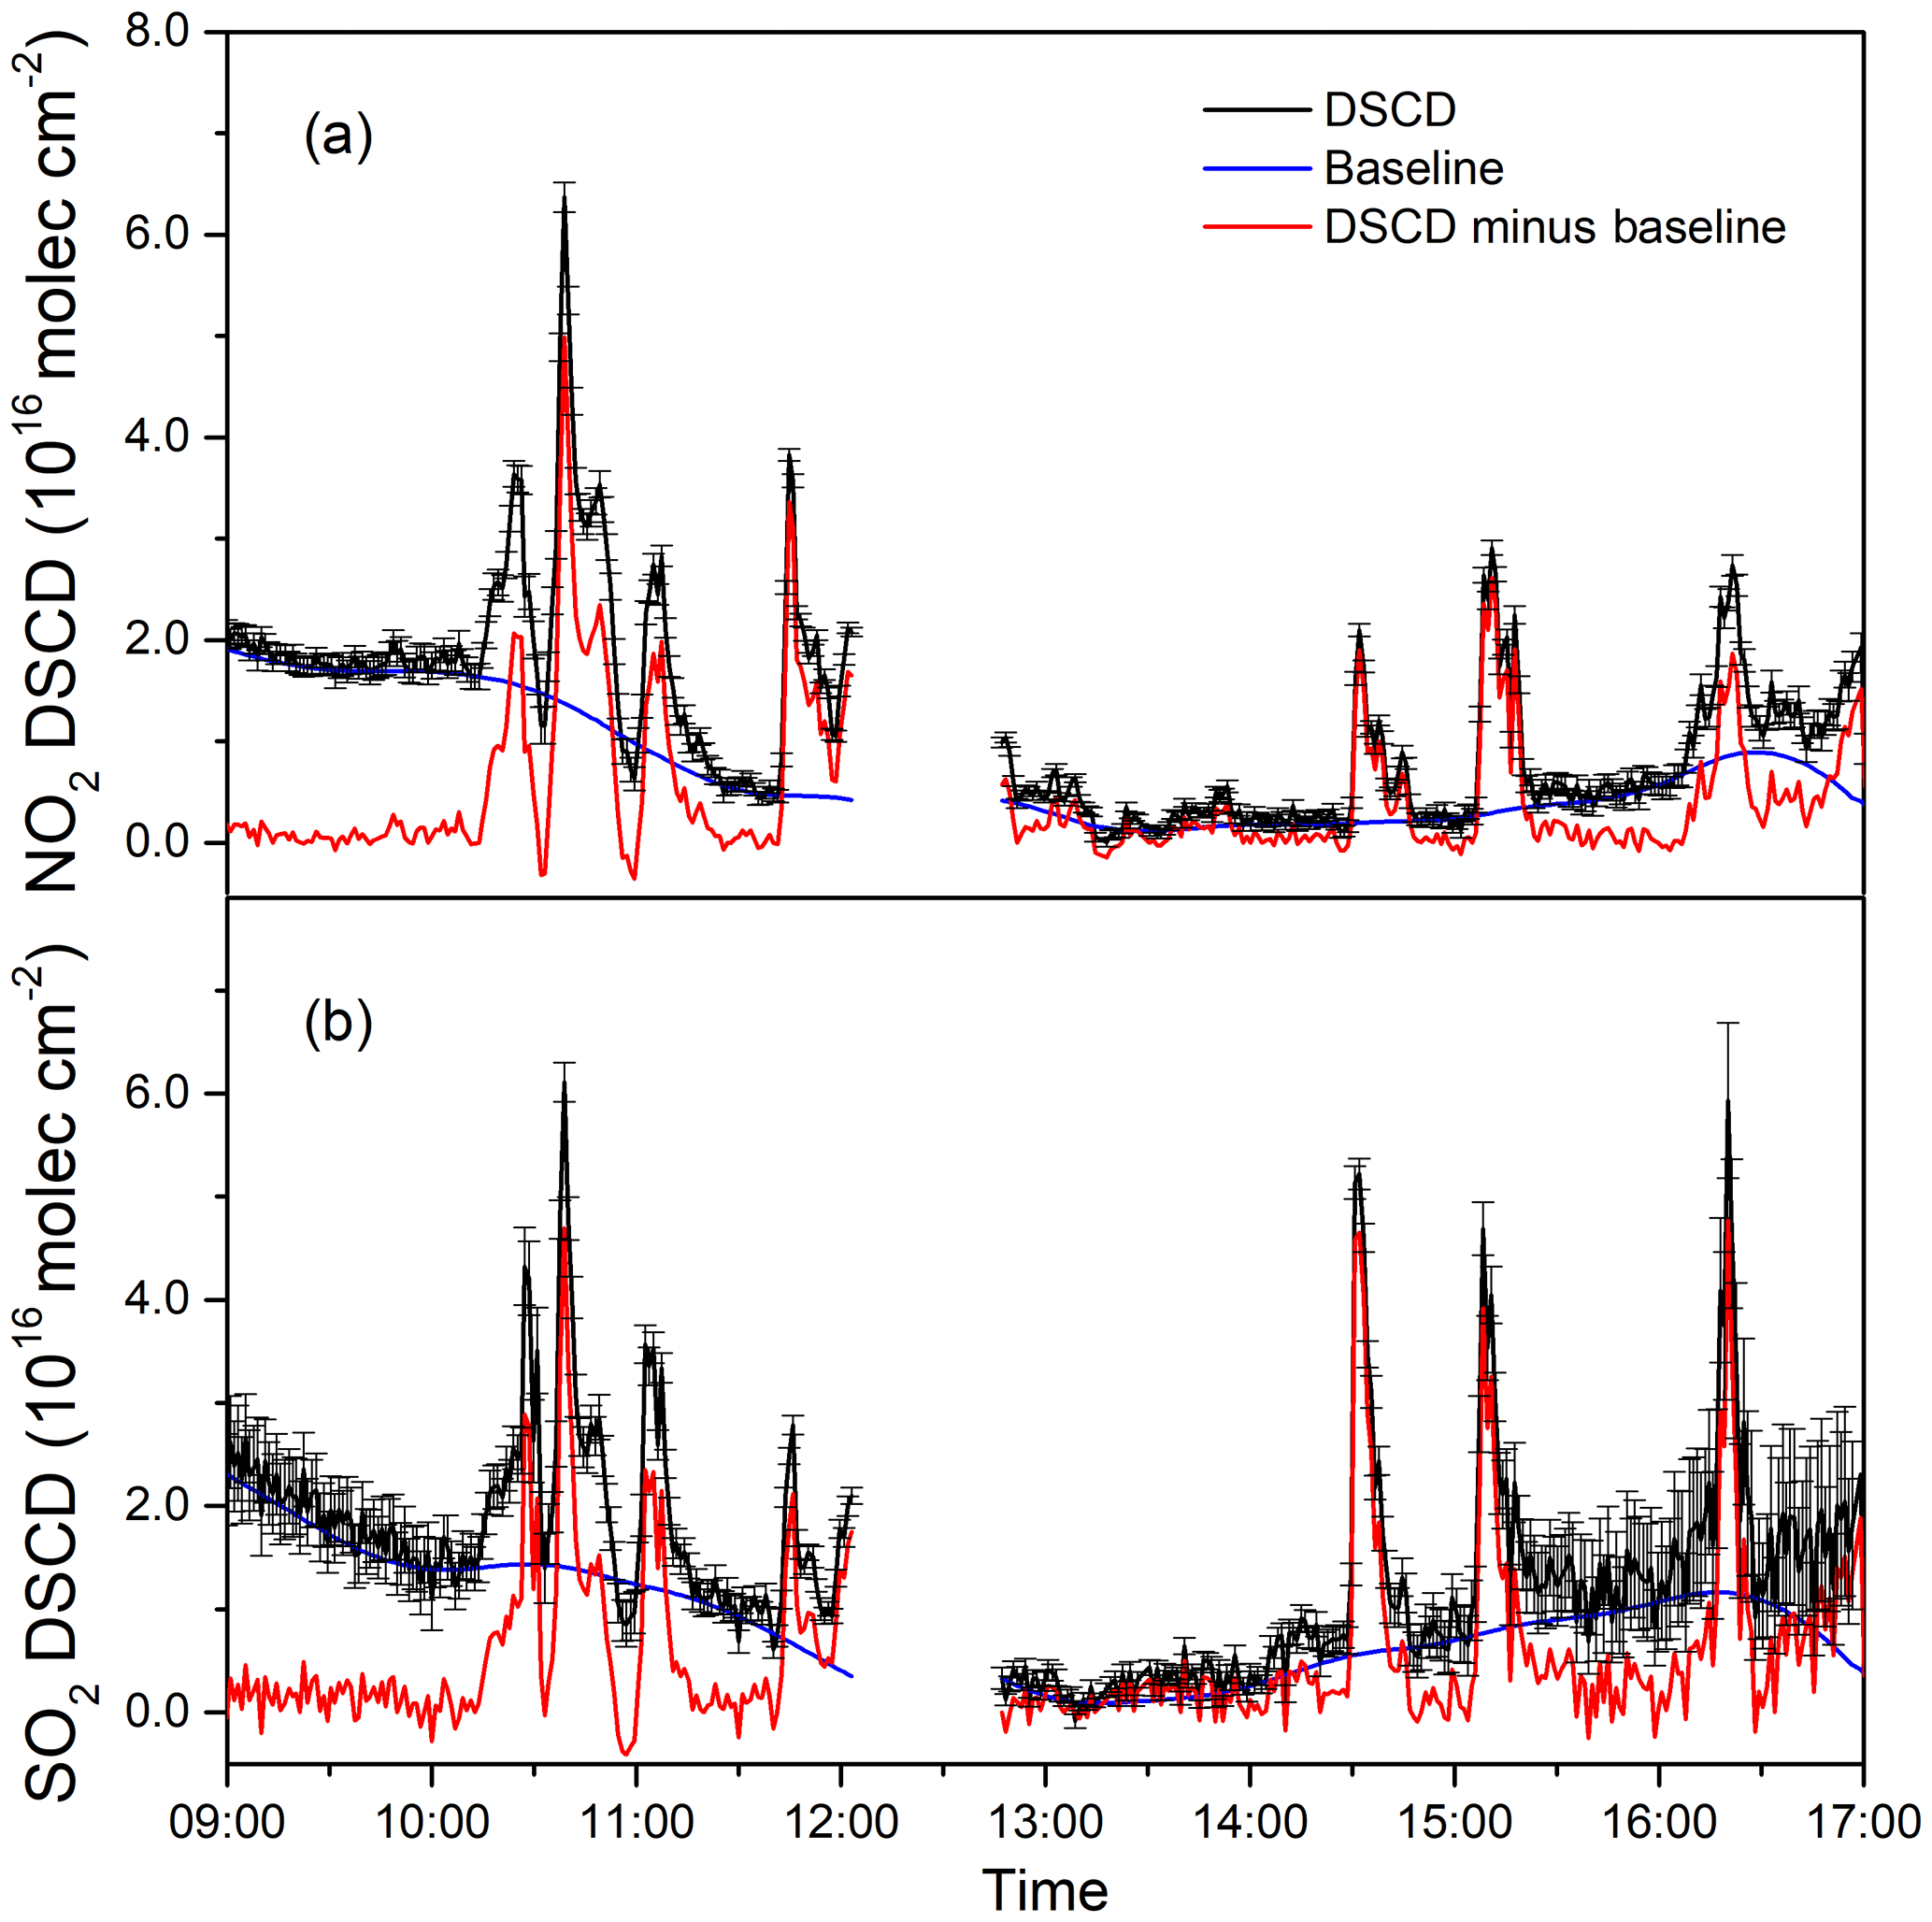
Figure 12Diurnal variations of (a) NO2 and (b) SO2 DSCDs measured at a 7∘ elevation angle on 26 June 2018.
Moreover, it should be noted that the amplitude of each peak varied differently, which implies that the DSCDs' SO2∕NO2 ratio for each peak may reveal emission information regarding the fuel sulfur content of individual vessels (Seyler et al., 2017; Mellqvist et al., 2017; Van Roy and Scheldeman, 2016). However, it is important to note that NO2 is formed by the reaction of NO and O3 in the plume; thus, the SO2∕NO2 ratio depends to a certain extent on the age of the plume. The ambient O3 between 08:00 and 17:00 LT averaged at 63.7 ppb in Yantian during the campaign. Considering the abundance of ozone, the NO emitted by the ship would have rapidly (within a few minutes or even faster) reacted with O3 to form NO2 (Seyler et al., 2017). In addition, the conversion between NO and NO2 is very fast and maintains a dynamic balance with sunlight during the daytime considering the photolysis of NO2 (Singh et al., 1987). Therefore, the SO2∕NO2 ratio in an observed plume would be less impacted by the freshly emitted NO. Thus, a linear regression analysis between the SO2 and NO2 DSCDs was performed to infer the fuel sulfur content.
Figure 13 presents the analysis results for 24 different vessels. The strong correlation between the SO2 and NO2 DSCDs is obvious evidence of the significant homologies of emission sources between SO2 and NO2. Nevertheless, the slope of different vessels varied greatly from 0.28 to 2.90, indicating the diversity of the SO2 emission intensity in the ship plumes. In general, SO2 emissions are directly related to the fuel sulfur content and engine operation status of the ships, according to the emission model estimation, e.g., the power, activity time and the speed of ship (Fan et al., 2016; Zhang et al., 2019). Outbound vessels usually leave the shore slowly with the help of tugboats, and then speed up when sailing into the sea. During the latter process, the main engine is utilized to power navigation, and the fuel used by the main engine has a higher sulfur content than that utilized by the auxiliary engine. In contrast, the main engine of a vessel is usually shutdown during the inbound process. Therefore, the ratio of SO2∕NO2 in the DSCDs in plumes emitted by outbound vessels could be higher than that those in the plumes of inbound ships.
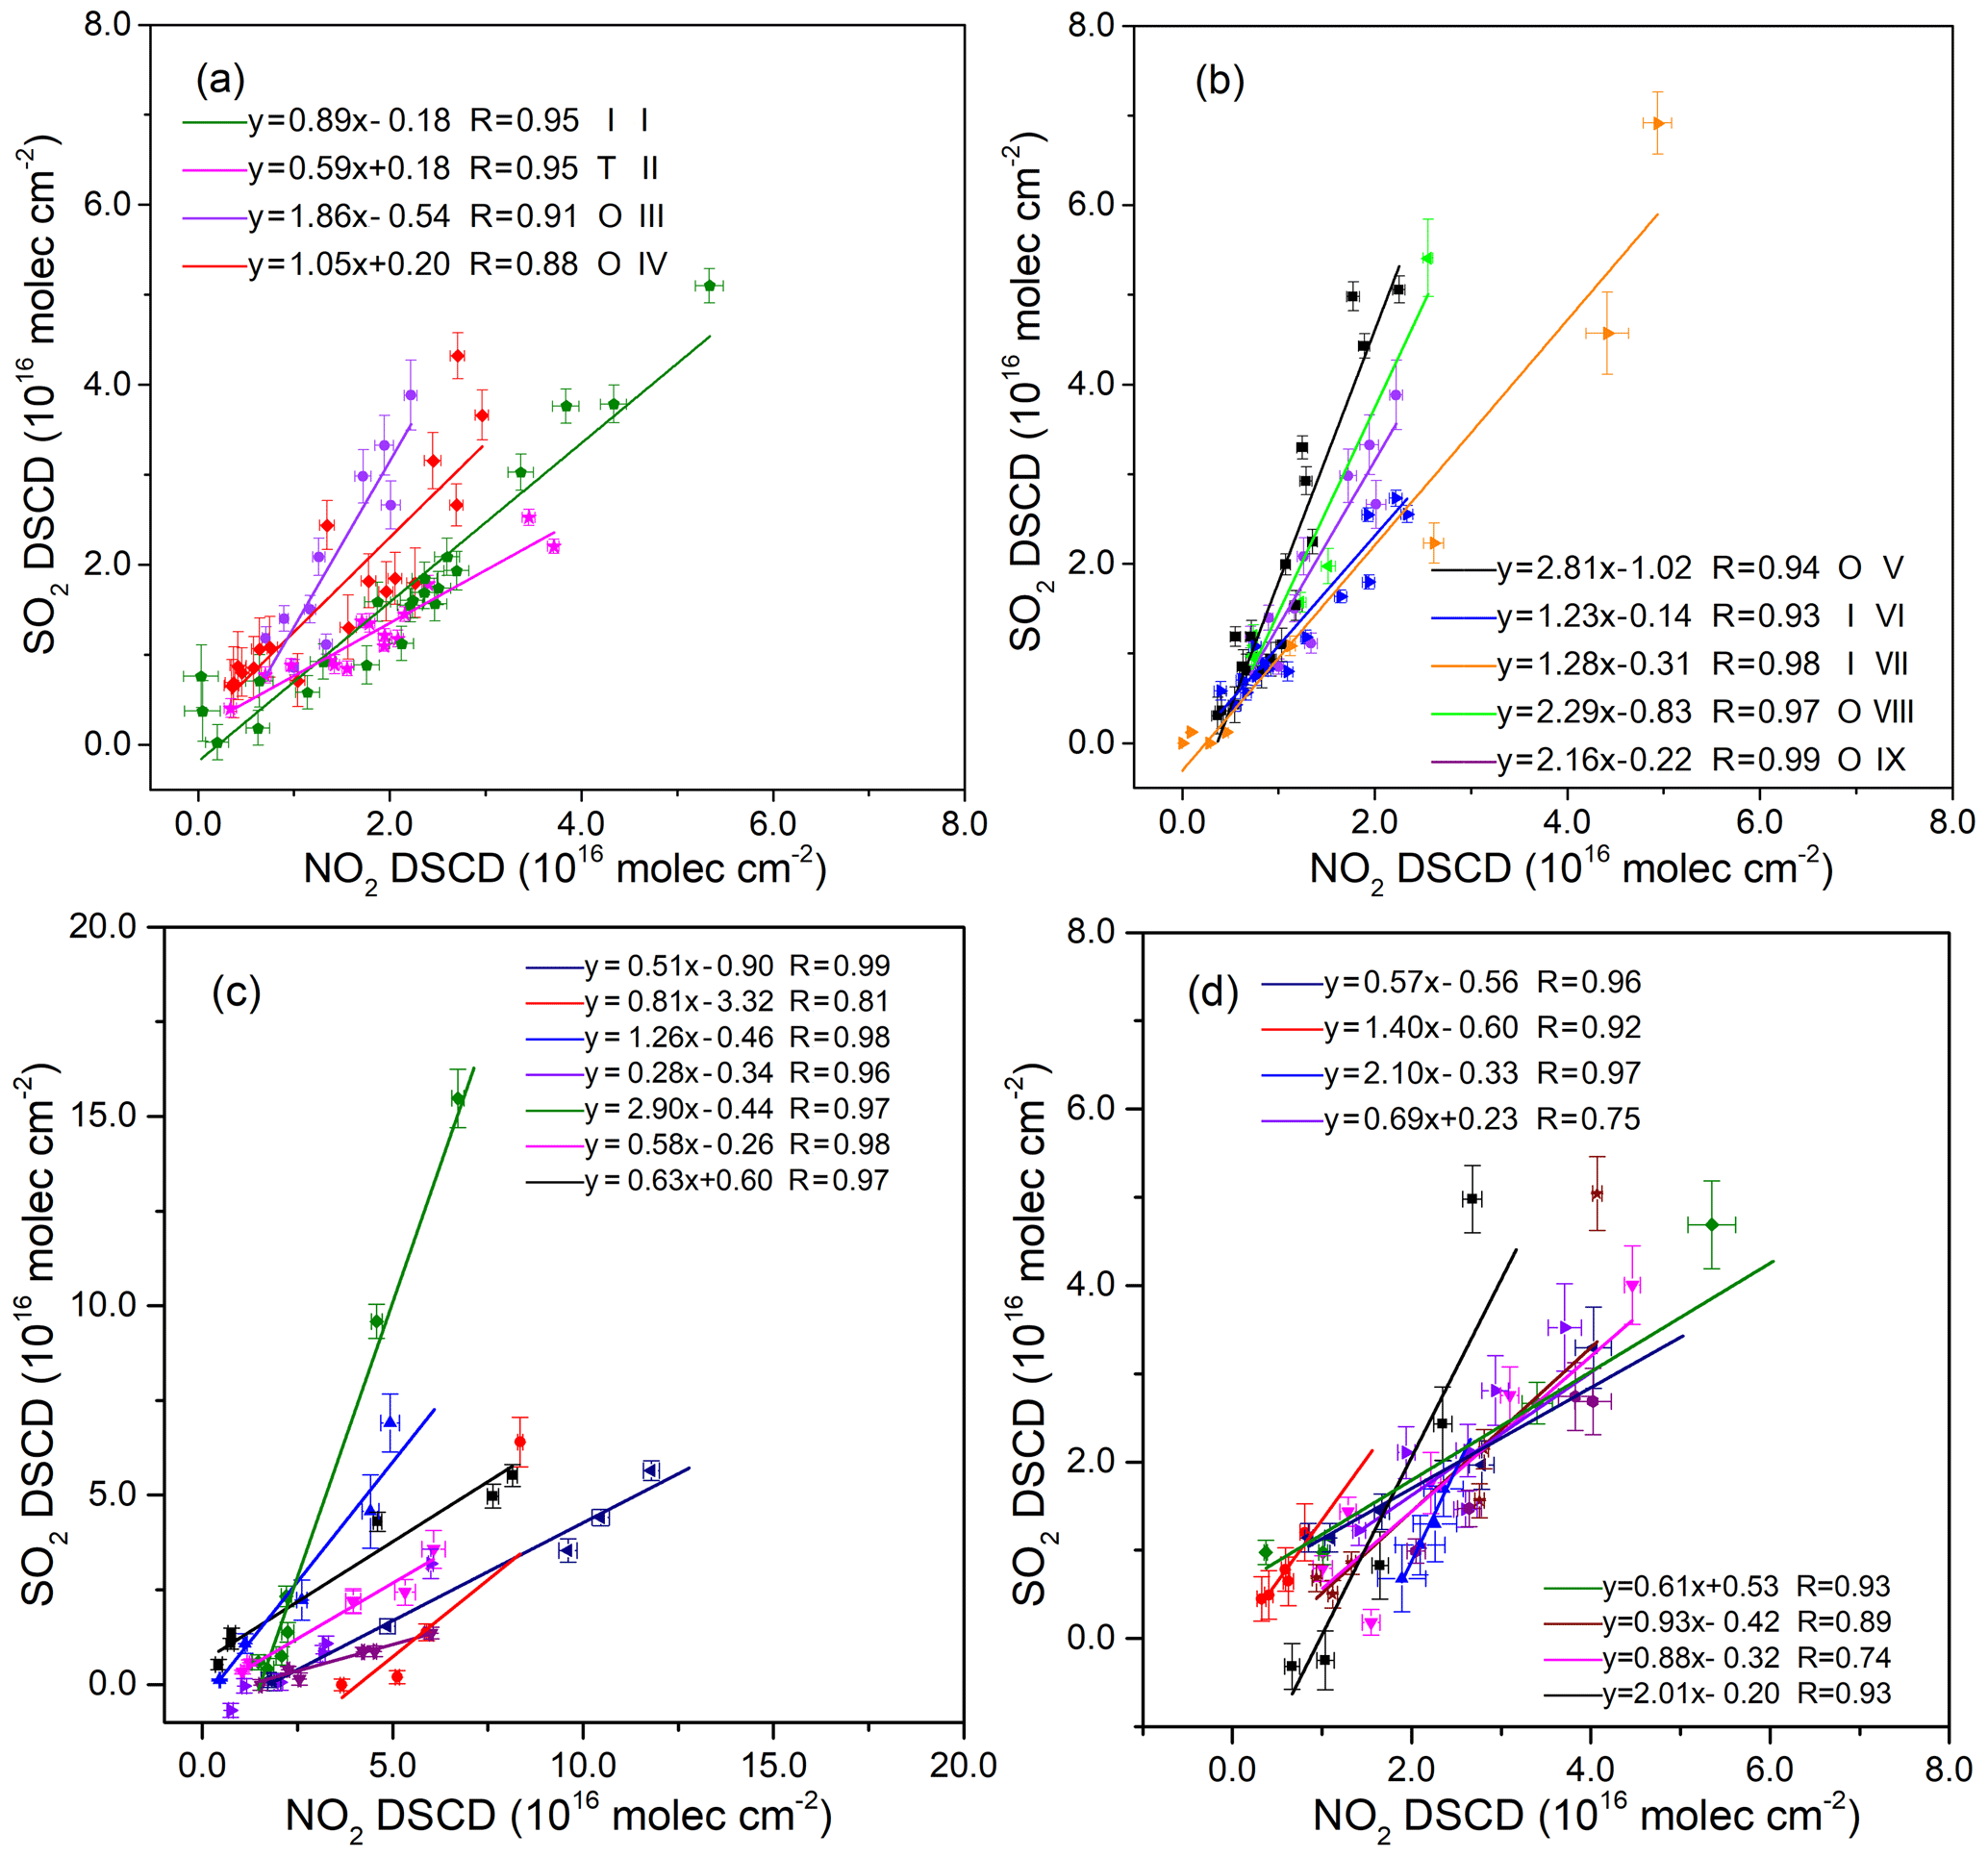
Figure 13The relationship between SO2 and NO2 emitted by several typical vessels.”O” indicates outbound vessels, ”I” indicates inbound vessels and ”T” indicates tugboats.
During the MAX-DOAS observations, we also carried out some fuel sample analyses in addition to the investigation of the activity data and engine parameters of vessels, and five of the vessels in question are shown in Fig. 12. We also indicate the different status of nine individual vessels in Fig. 14, along with information regarding their fuel sulfur content and the rated power of their engines (“inbound” and “outbound” in this figure refer to the rated power of the main and auxiliary engines, respectively). Vessel II is a tugboat that was operating in the port area; thus, it used fuel with the lowest fuel sulfur content of 0.001 % and showed a low SO2∕NO2 ratio in the DSCDs. Furthermore, the inbound vessels I, VI and VII (indicated by diamonds in Fig. 14) had switched off their main engines when they entered the MAX-DOAS instrument's field of view, and were moved by tugboats before finally docking by inertia. As previously stated, the sulfur content of fuels used to power auxiliary engines are much lower than those utilized to power main engines; thus, SO2∕NO2 ratios of inbound vessels are much lower than those of outbound vessels. The other vessels, indicated by circles in Fig. 14, are all in outbound ships. As these outbound vessels launched their main engine, and, thus, utilized high sulfur fuels, the vessels exhibited relatively higher SO2∕NO2 ratios (over 2.0), except for vessel IV. Due to the use of much cleaner fuel (with a sulfur content of 1.28 %), vessel IV presented the lowest SO2∕NO2 ratio among all of the outbound vessels. Compared with vessel III, which had a similar engine power rating but used fuel with a higher sulfur content, it can be observed that the SO2∕NO2 ratio in the plume increased with the increase in the fuel sulfur content used by the vessels (Fig. 14). This phenomenon is also notable with respect to vessels V and VIII. It is worth noting that outbound cargo vessel IX deviates from the results seen for the other vessels, as it has very low rated power but a very high SO2∕NO2 ratio ( > 2.0). Therefore, vessel IX can be flagged as a suspicious ship that is probably using fuel with a sulfur content exceeding the regulation limit.
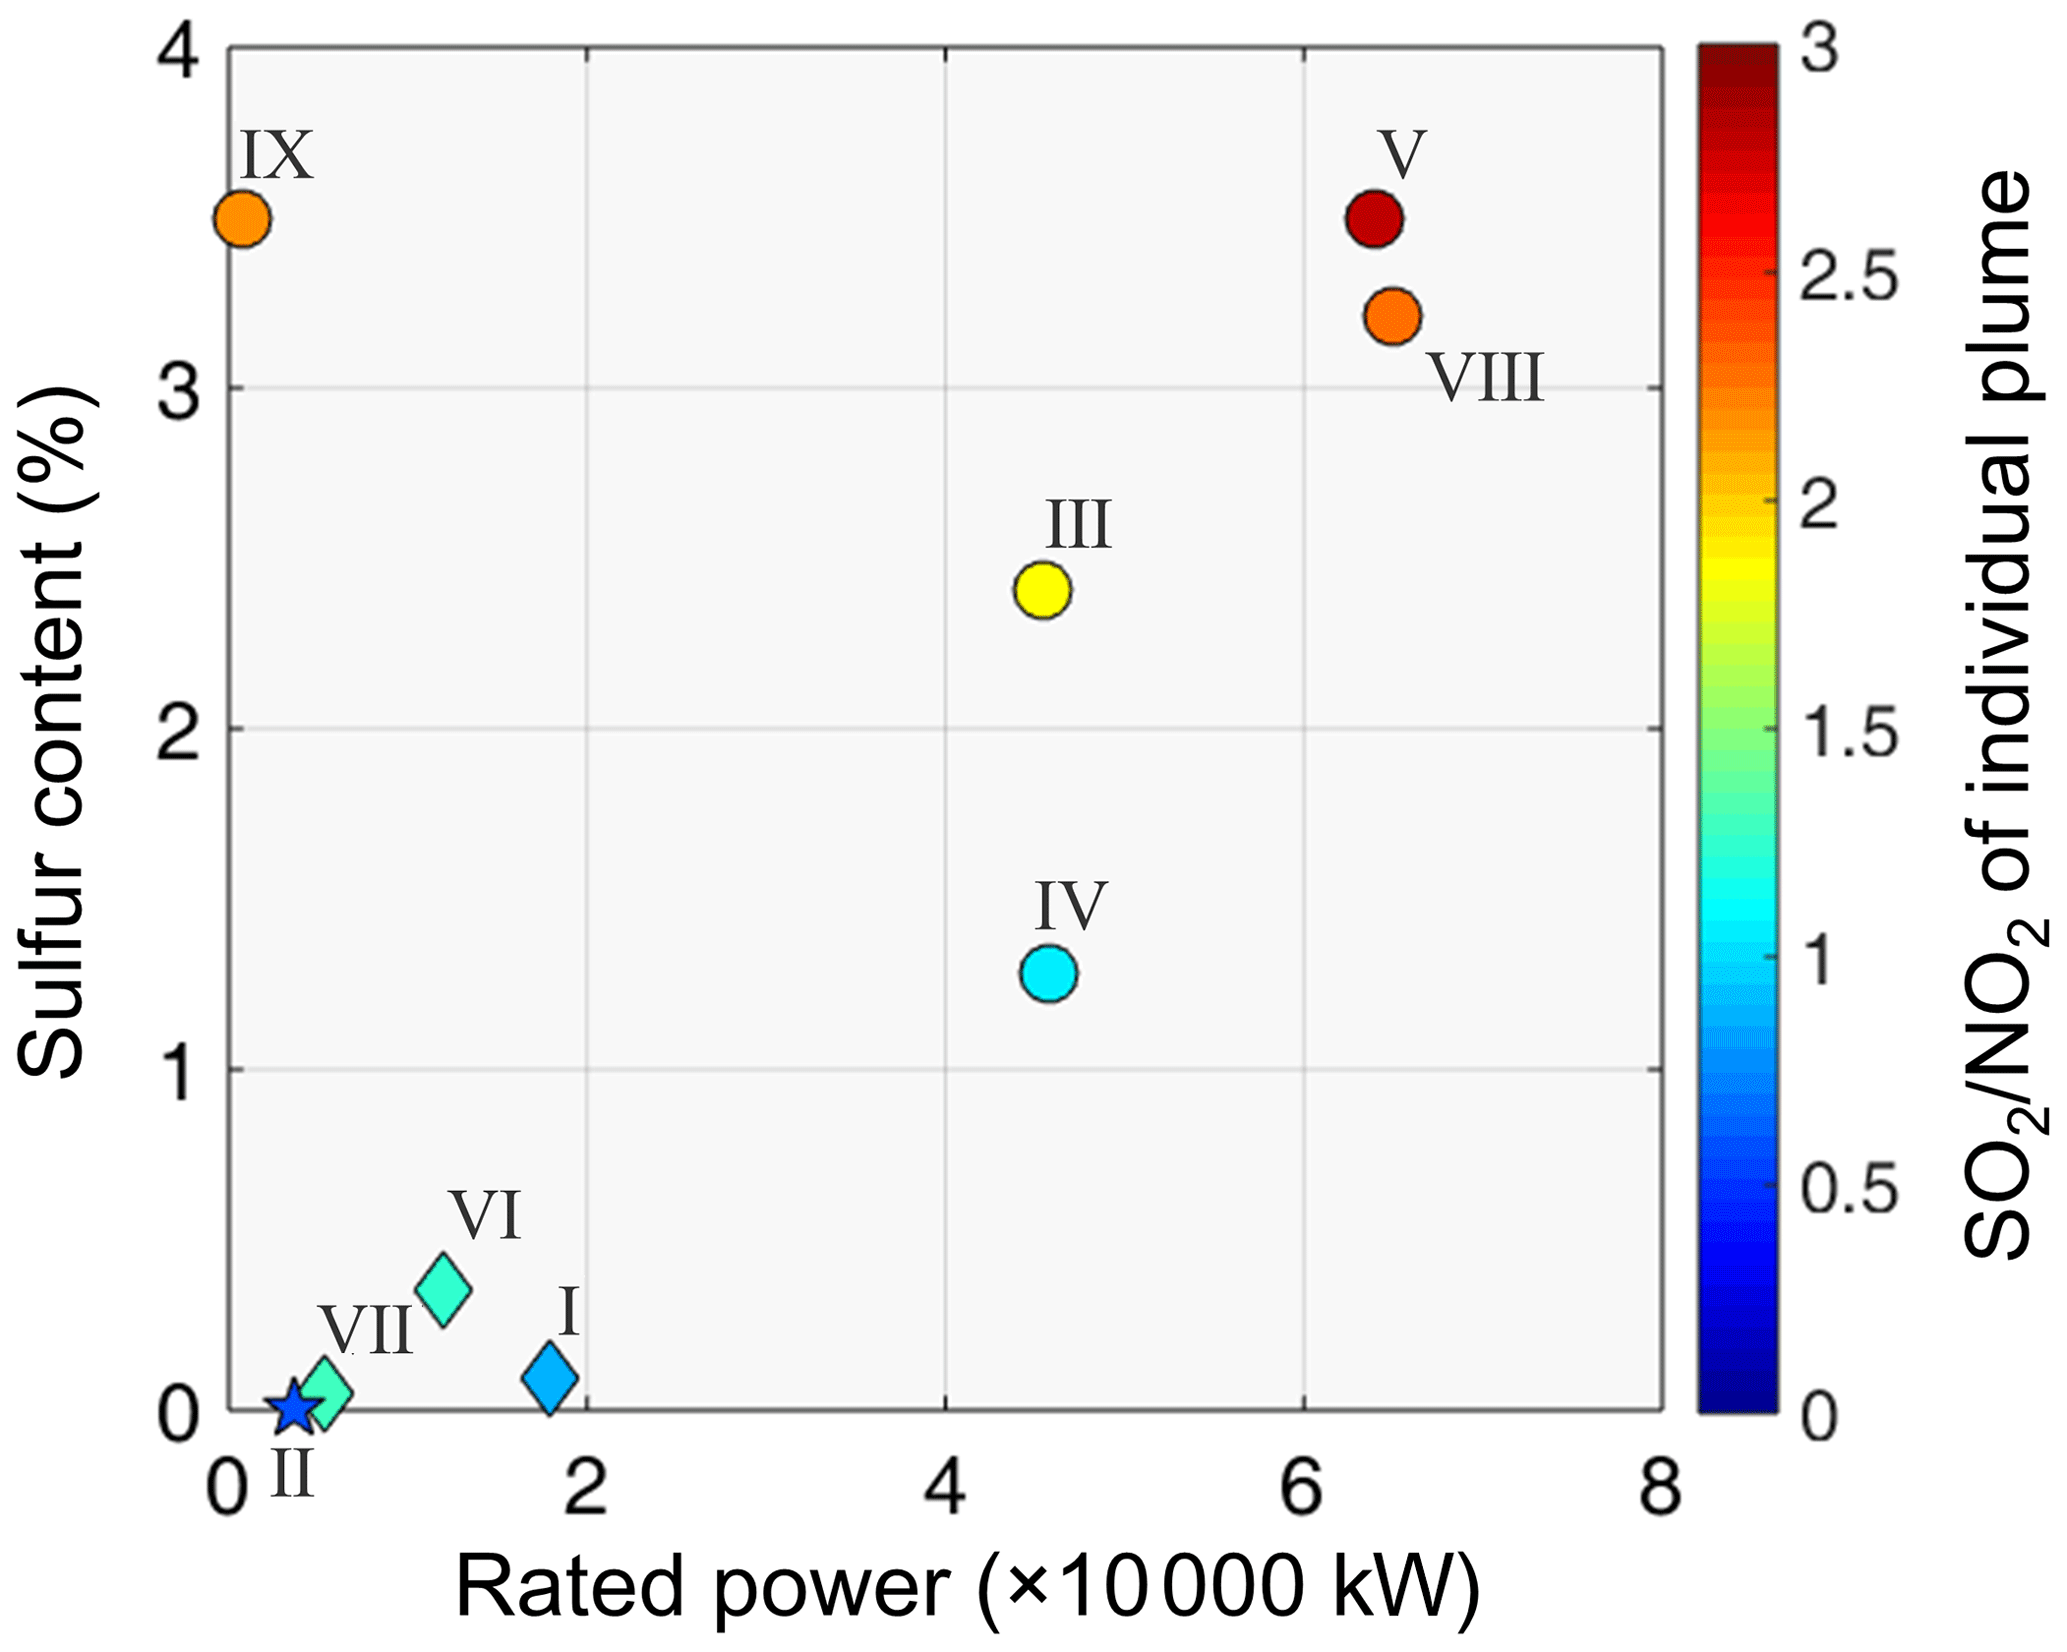
Figure 14The relationship between the SO2∕NO2 ratio and the fuel sulfur content and engine rated power of all nine vessels, obtained by linear regression. Tugboats, and inbound and outbound vessels are represented by a star, diamonds and circles, respectively.
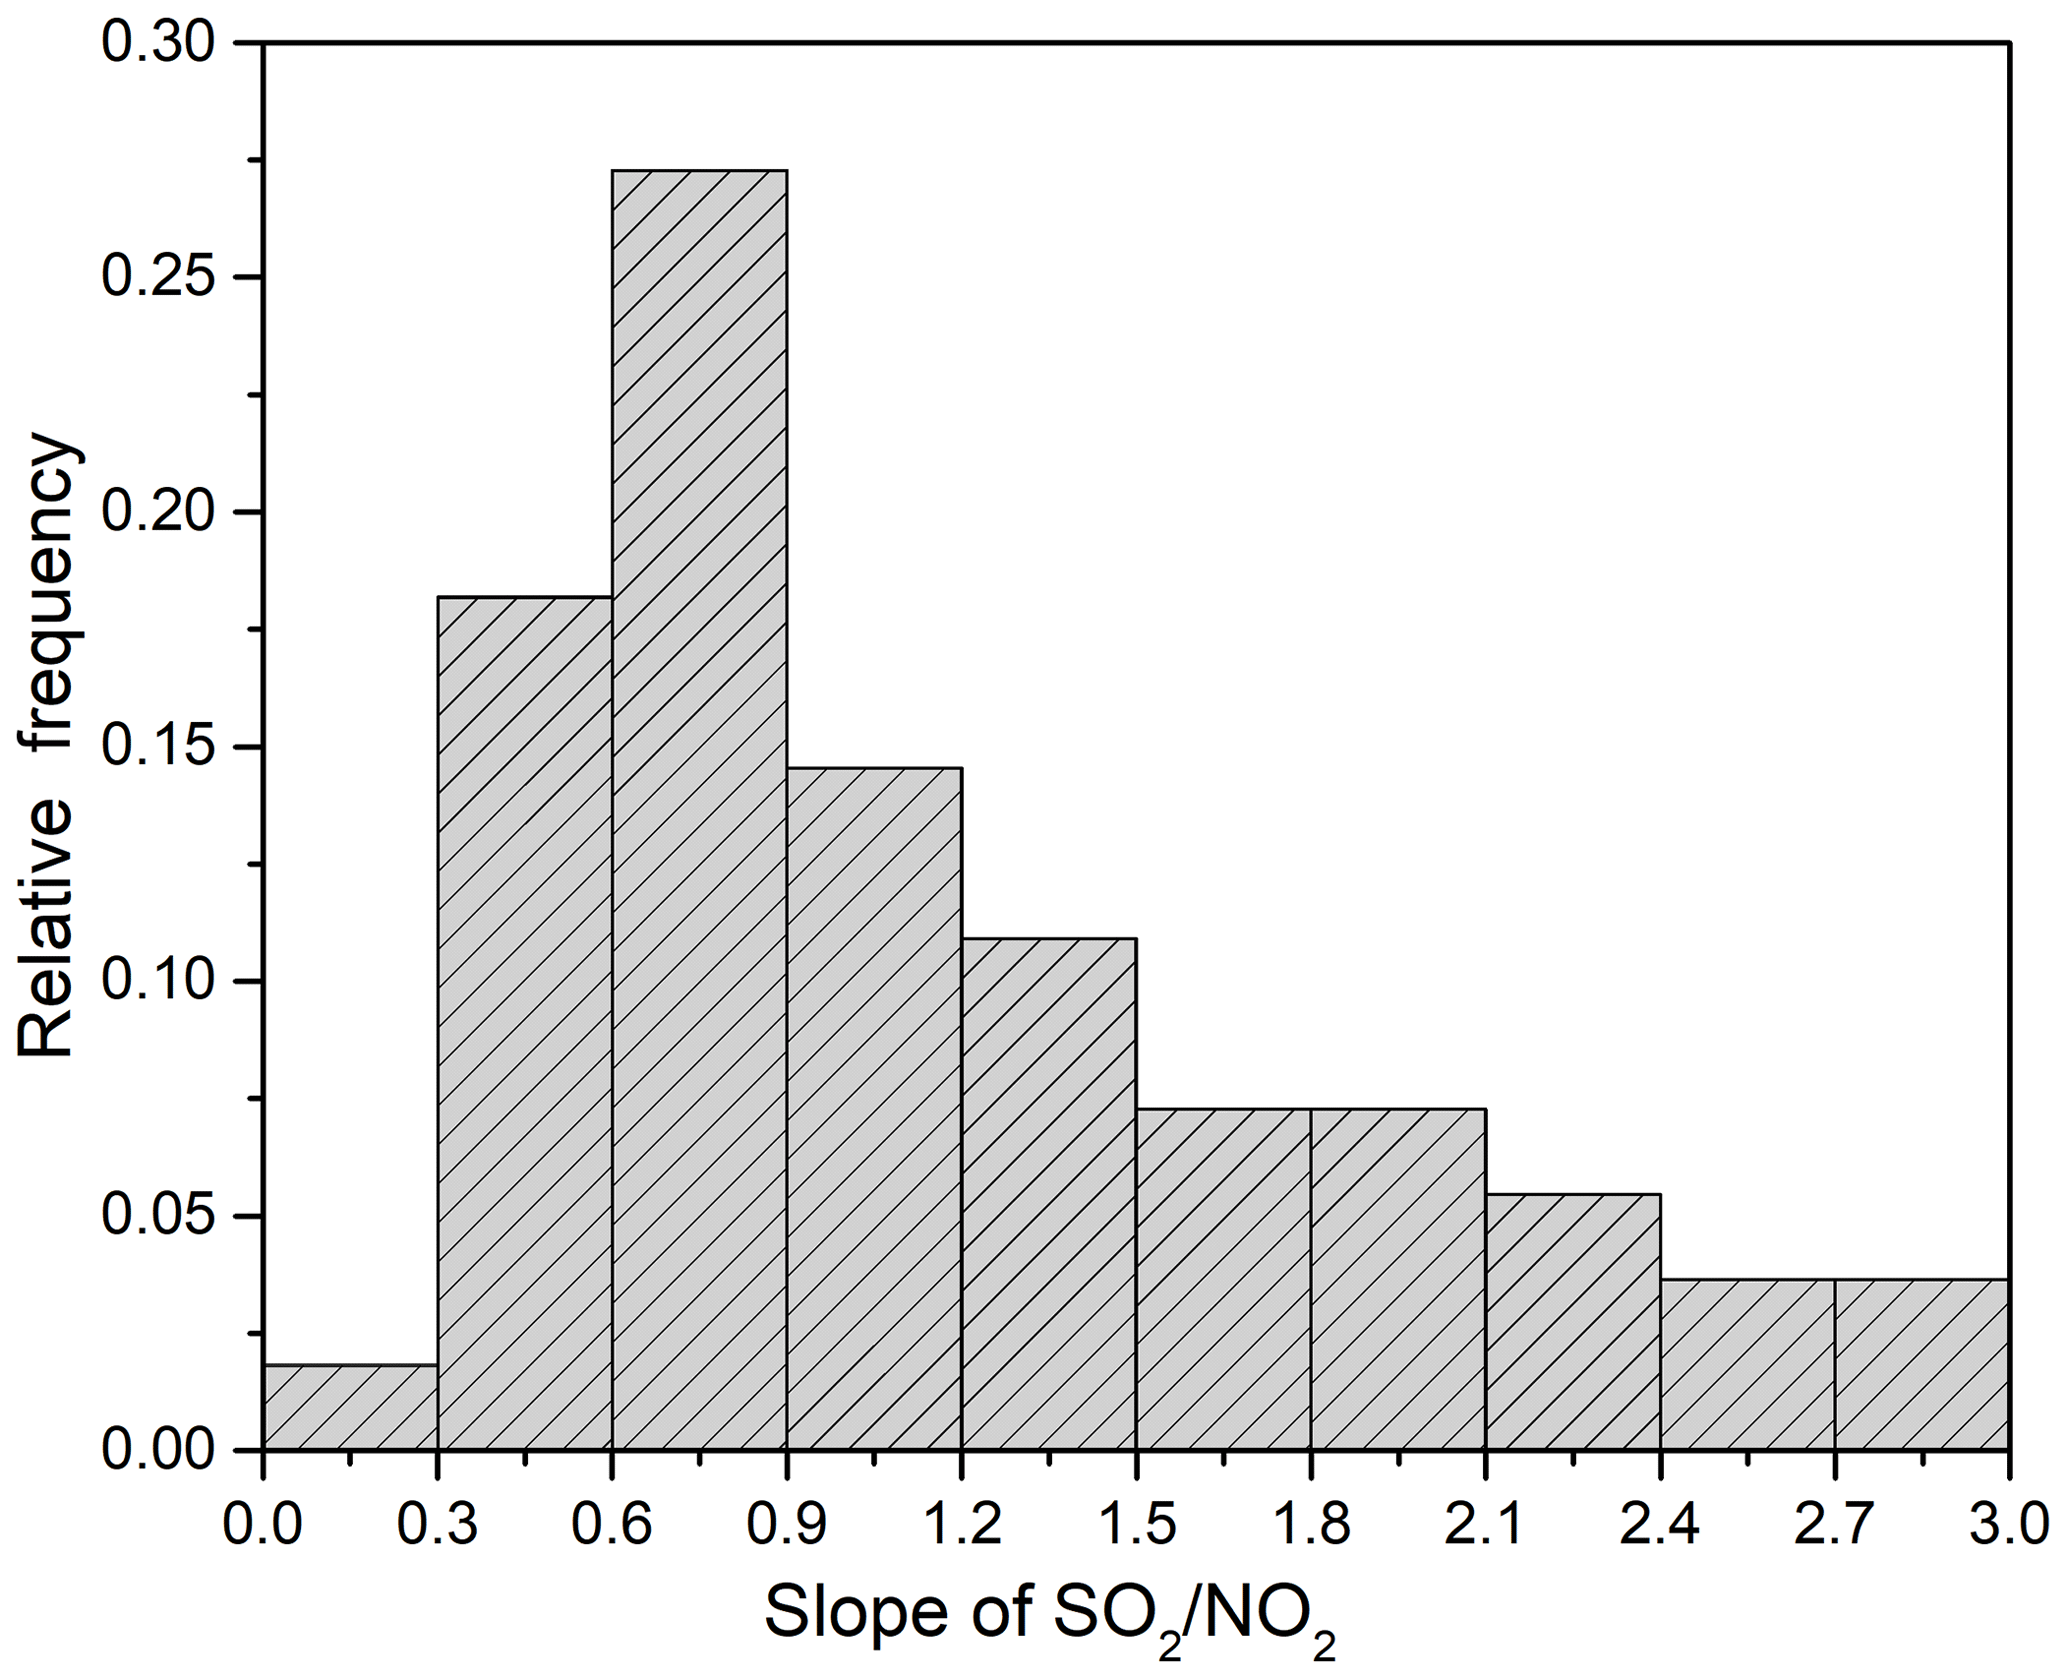
Basically, the SO2∕NO2 ratios in the plumes discharged from inbound vessels and tugboats are usually lower than 1.5 under normal conditions, which are much smaller values than those of outbound vessels using high rated power engines and high sulfur content fuels. For outbound vessels, the SO2∕NO2 ratios are more related to the fuel sulfur content. An irregular observed SO2∕NO2 ratio can flag a vessel as possibly not being in conformance with the enforced sulfur content limitation. Therefore, the MAX-DOAS measurement provides promising technology for the compliance monitoring of fuel sulfur content by investigating the SO2∕NO2 ratio in ship plumes, in addition to more accurate estimation of ship emissions during operation due to the inclusion of the load and emission factors. During the course of this study, the statistical analysis of SO2∕NO2 ratios in the plumes of 55 ships were performed. The frequency distribution of the slope of the SO2∕NO2 ratio is shown in Fig. 15. It can be seen that the SO2∕NO2 ratios were mostly less than 1.5 (72.7 % of observations). Ships with SO2∕NO2 ratios between 0.6 and 0.9 comprised the highest proportion of observations. This indicates that most of the fuels used by ships in Yantian Port could be qualified. However, there are still some ships that may be using noncompliant fuels, as 27 % of the ships observed were found to have a SO2∕NO2 ratio greater than 1.5.
In this study, we performed MAX-DOAS measurements to observe ship emissions of SO2 and NO2 in Shanghai and Shenzhen, China, under three different typical ship traffic conditions. At Waigaoqiao container terminal in Shanghai, the SO2 and NO2 exhausted by ships at berth could be easily identified using 2-D MAX-DOAS observations with respect to the locations and intensities of the emissions. In the inland waterway area at Wusong Wharf it was difficult to determine individual ship emissions due to the dense traffic volume and complex background environment. The long-term MAX-DOAS measurements showed that the changes in SO2 and NO2 were correlated with the ship traffic density under stable and unstable atmospheric conditions. However, better dispersion under unstable atmospheric condition was favorable for the decrease of pollutant levels. For open-sea waters in the Yantian deep-water port, the DSCDs of SO2 and NO2 measured by MAX-DOAS were highly sensitive to the emitted plumes of vessels passing through the shore-based instrument's field of view, which showed a significant increase in the pollutant concentrations as well as a 10–30 min duration of the emission signals. Considering the distance and the size of the vessels, the DSCDs observed at an elevation angle of 7∘ are hot spots of the concentration in altitude; thus, these values were further selected to investigate the fuel sulfur content. According to the linear regression of the SO2 and NO2 DSCDs, the SO2∕NO2 ratios are found to be very helpful to infer the levels of sulfur emission. Combined with fuel sample analysis and vessel data, the SO2∕NO2 ratio in plumes is usually lower than 1.5 for inbound vessels and tugboats, and is much smaller than that of other vessels. The abnormally high SO2∕NO2 ratio in a plume usually implies that a vessel is not in compliance with the enforced sulfur content limitation.
In summary, optical remote sensing using the MAX-DOAS technique is highly beneficial for measurements of ship-emitted NO2 and SO2. These applications under different ship traffic conditions demonstrated the feasibility of shore-based MAX-DOAS to observe SO2 and NO2 emitted from vessels docked at berth, vessels navigation in riverine shipping lanes and inbound and outbound operations. Nevertheless, the main ship-emitted pollutants – NO and CO2 – cannot be monitored due to the limitation of the observed wavelength range. As MAX-DOAS uses solar scattered light as a source, it cannot be utilized at night when there is no sunlight, and there is also large error for observations carried out during twilight and under rainy conditions. In the future, the combination of MAX-DOAS remote sensing of ship plumes and the estimation of emissions using theoretical fuel sulfur contents and actual operation data will provide a promising approach for ship emission surveillance in the future.
Data are available for scientific purposes upon request from the corresponding authors.
YC, SW and BZ designed and implemented the research, and prepared the paper. JZ, YG and RZ contributed to the MAX-DOAS measurements at different sites. YC and SW carried out the MAX-DOAS retrieval and the combined analysis involving other auxiliary data. YL, YZ, YQ and WM provided constructive comments and support for the ship emissions research portion of this study.
The authors declare that they have no conflict of interest.
This article is part of the special issue “Shipping and the Environment – From Regional to Global Perspectives (ACP/OS inter-journal SI)”. It is not associated with a conference.
This research was supported by the National Key Research and Development Program of China (grant nos 2016YFC0200401 and 2017YFC0210002), the National Natural Science Foundation of China (grant nos. 41775113, 21777026 and 21677038), the Shanghai Pujiang Talent Program (grant no. 17PJC015) and the Pudong Science and Technology committee of Shanghai (grant no. PKJ2018-C05). We would like to thank the Shenzhen Maritime Safety Administration and the Wusong and Pudong Maritime Safety Bureau of Shanghai for the coordination of field measurements.
This research has been supported by the National Key Research and Development Program of China (grant nos. 2016YFC0200401 and 2017YFC0210002), the National Natural Science Foundation of China (grant nos. 41775113, 21777026, and 21677038), the Shanghai Pujiang Talent Program (grant no. 17PJC015) and the Pudong Science and Technology committee of Shanghai (grant no. PKJ2018-C05).
This paper was edited by Markus Quante and reviewed by Andreas Weigelt and one anonymous referee.
Balzani Lööv, J. M., Alfoldy, B., Gast, L. F. L., Hjorth, J., Lagler, F., Mellqvist, J., Beecken, J., Berg, N., Duyzer, J., Westrate, H., Swart, D. P. J., Berkhout, A. J. C., Jalkanen, J.-P., Prata, A. J., van der Hoff, G. R., and Borowiak, A.: Field test of available methods to measure remotely SOx and NOx emissions from ships, Atmos. Meas. Tech., 7, 2597–2613, https://doi.org/10.5194/amt-7-2597-2014, 2014.
Becagli, S., Sferlazzo, D. M., Pace, G., di Sarra, A., Bommarito, C., Calzolai, G., Ghedini, C., Lucarelli, F., Meloni, D., Monteleone, F., Severi, M., Traversi, R., and Udisti, R.: Evidence for heavy fuel oil combustion aerosols from chemical analyses at the island of Lampedusa: a possible large role of ships emissions in the Mediterranean, Atmos. Chem. Phys., 12, 3479–3492, https://doi.org/10.5194/acp-12-3479-2012, 2012.
Beecken, J., Mellqvist, J., Salo, K., Ekholm, J., Jalkanen, J.-P., Johansson, L., Litvinenko, V., Volodin, K., and Frank-Kamenetsky, D. A.: Emission factors of SO2, NOx and particles from ships in Neva Bay from ground-based and helicopter-borne measurements and AIS-based modeling, Atmos. Chem. Phys., 15, 5229–5241, https://doi.org/10.5194/acp-15-5229-2015, 2015.
Berg, N., Mellqvist, J., Jalkanen, J.-P., and Balzani, J.: Ship emissions of SO2 and NO2: DOAS measurements from airborne platforms, Atmos. Meas. Tech., 5, 1085–1098, https://doi.org/10.5194/amt-5-1085-2012, 2012.
Berglen, T. F., Bernsten, T. K., Isaksen, I. S. A., and Sundet, J. K.: A global model of the coupled sulfur/oxidant chemistry in the troposphere: the sulfur cycle, J. Geophys. Res., 109, D19310, https://doi.org/10.1029/2003JD003948, 2004.
Bogumil, K., Orphal, J., Homann, T., Voigt, S., Spietz, P., Fleischmann, O. C., Vogel, A., Hartmann, M., Bovensmann, H., Frerik, J., and Burrows, J. P.: Measurements of Molecular Absorption Spectra with the SCIAMACHY Pre-Flight Model: Instrument Characterization and Reference Data for Atmospheric Remote-Sensing in the 230–2380 nm Region, J. Photoch. Photobio. A., 157, 167–184, https://doi.org/10.1016/S1010-6030(03)00062-5, 2003.
Chance, K. and Kurucz, R.: An improved high-resolution solar reference spectrum for earth's atmosphere measurements in the ultraviolet, visible, and near infrared, J. Quant. Spectrosc. Ra., 111, 1289–1295, https://doi.org/10.1016/j.jqsrt.2010.01.036, 2010.
Coggon, M. M., Sorooshian, A., Wang, Z., Metcalf, A. R., Frossard, A. A., Lin, J. J., Craven, J. S., Nenes, A., Jonsson, H. H., Russell, L. M., Flagan, R. C., and Seinfeld, J. H.: Ship impacts on the marine atmosphere: insights into the contribution of shipping emissions to the properties of marine aerosol and clouds, Atmos. Chem. Phys., 12, 8439–8458, https://doi.org/10.5194/acp-12-8439-2012, 2012.
Corbett, J. J., Fischbeck, P. S., and Pandis, S. N.: Global nitrogen and sulfur inventories for oceangoing ships, J. Geophys. Res., 104, 3457–3470, https://doi.org/10.1029/1998JD100040, 1999.
Diesch, J.-M., Drewnick, F., Klimach, T., and Borrmann, S.: Investigation of gaseous and particulate emissions from various marine vessel types measured on the banks of the Elbe in Northern Germany, Atmos. Chem. Phys., 13, 3603–3618, https://doi.org/10.5194/acp-13-3603-2013, 2013.
Dimitriades, B.: Effects of hydrocarbon and nitrogen oxides on photochemical smog formation, Environ. Sci. Tech, 6, 253–260, 1972.
Edner, H., Ragnarson, P., Spännare, S., and Svanberg, S.: Differential optical absorption spectroscopy (DOAS) system for urban atmospheric pollution monitoring, Appl. Opt., 32, 327–333, https://doi.org/10.1364/AO.32.000327, 1993.
Endresen, Ø., Sørgård, E., Sundet, J. K., Dalsøren, S. B., Isaksen, I. S. A., Berglen, T. F., and Gravir, G.: Emissions from International Sea Transportation and Environmental Impact, J. Geophys. Res.-Atmos., 108, 4560, https://doi.org/10.1029/2002JD002898, 2003.
Eyring, V., Köhler, H. W., van Aardenne, J., and Lauer, A.: Emissions from international shipping: 1. The last 50 years, J. Geophys. Res., 110, D17305, https://doi.org/10.1029/2004JD005619, 2005.
Eyring, V., Isaksen, I. S., Berntsen, T., Collins, W. J., Corbett, J. J., Endresen, O., Grainger, R. G., Moldanova, J., Schlager, H., and Stevenson, D. S.: Transport impacts on atmosphere and climate: Shipping, Atmos. Environ., 44, 4735–4771, https://doi.org/10.1016/j.atmosenv.2009.04.059, 2010.
Fan, Q., Zhang, Y., Ma, W., Ma, H., Feng, J., Yu, Q., Yang, X., Ng, S. K. W., Fu, Q., and Chen, L.: Spatial and seasonal dynamics of ship emissions over the Yangtze River Delta and East China Sea and their potential environmental Influence, Environ. Sci. Technol., 50, 1322–1329, https://doi.org/10.1021/acs.est.5b03965, 2016
Fleischmann, O. C., Hartmann, M., Burrows, J. P., and Orphal, J.: New ultraviolet absorption cross-sections of BrO at atmospheric temperatures measured by time-windowing Fourier transform spectroscopy, J. Photoch. Photobio. A, 168, 117–132, https://doi.org/10.1016/j.jphotochem.2004.03.026, 2004.
General, S., Pöhler, D., Sihler, H., Bobrowski, N., Frieß, U., Zielcke, J., Horbanski, M., Shepson, P. B., Stirm, B. H., Simpson, W. R., Weber, K., Fischer, C., and Platt, U.: The Heidelberg Airborne Imaging DOAS Instrument (HAIDI) – a novel imaging DOAS device for 2-D and 3-D imaging of trace gases and aerosols, Atmos. Meas. Tech., 7, 3459–3485, https://doi.org/10.5194/amt-7-3459-2014, 2014.
Hong, Q., Liu, C., Chan, K. L., Hu, Q., Xie, Z., Liu, H., Si, F., and Liu, J.: Ship-based MAX-DOAS measurements of tropospheric NO2, SO2, and HCHO distribution along the Yangtze River, Atmos. Chem. Phys., 18, 5931–5951, https://doi.org/10.5194/acp-18-5931-2018, 2018.
Hönninger, G., von Friedeburg, C., and Platt, U.: Multi axis differential optical absorption spectroscopy (MAX-DOAS), Atmos. Chem. Phys., 4, 231–254, https://doi.org/10.5194/acp-4-231-2004, 2004.
International Maritime Organization (IMO): Second GHG study 2009: Prevention of Air Pollution from Ships, IMO, London, 2009.
Johansson, L., Jalkanen, J. P., and Kukkonen, J.: Global assessment of shipping emissions in 2015 on a high spatial and temporal resolution, Atmos. Environ., 167, 403–415, https://doi.org/10.1016/j.atmosenv.2017.08.042, 2017.
Kattner, L., Mathieu-Üffing, B., Burrows, J. P., Richter, A., Schmolke, S., Seyler, A., and Wittrock, F.: Monitoring compliance with sulfur content regulations of shipping fuel by in situ measurements of ship emissions, Atmos. Chem. Phys., 15, 10087–10092, https://doi.org/10.5194/acp-15-10087-2015, 2015.
Kurtenbach, R., Vaupel, K., Kleffmann, J., Klenk, U., Schmidt, E., and Wiesen, P.: Emissions of NO, NO2 and PM from inland shipping, Atmos. Chem. Phys., 16, 14285–14295, https://doi.org/10.5194/acp-16-14285-2016, 2016.
Lai, H. K., Tsang, H., Chau, J., Lee, C. H., McGhee, S. M., Hedley, A. J., and Wong, C. M.: Health impact assessment of marine emissions in Pearl River Delta region, Marine Pollut. Bull., 66, 158–163, https://doi.org/10.1016/j.marpolbul.2012.09.029, 2013.
Lauer, A., Eyring, V., Hendricks, J., Jöckel, P., and Lohmann, U.: Global model simulations of the impact of ocean-going ships on aerosols, clouds, and the radiation budget, Atmos. Chem. Phys., 7, 5061–5079, https://doi.org/10.5194/acp-7-5061-2007, 2007.
Liu, H., Fu, M., Jin, X., Shang, Y., Shindell, D., Faluvegi, G., Shindell, C., and He, K.: Health and climate impacts of ocean-going vessels in East Asia, Nat. Clim. Change., 6, 1037–1041, 2016.
Lv, Z., Liu, H., Ying, Q., Fu, M., Meng, Z., Wang, Y., Wei, W., Gong, H., and He, K.: Impacts of shipping emissions on PM2.5 pollution in China, Atmos. Chem. Phys., 18, 15811–15824, https://doi.org/10.5194/acp-18-15811-2018, 2018.
Ma, J. Z., Beirle, S., Jin, J. L., Shaiganfar, R., Yan, P., and Wagner, T.: Tropospheric NO2 vertical column densities over Beijing: results of the first three years of ground-based MAX-DOAS measurements (2008–2011) and satellite validation, Atmos. Chem. Phys., 13, 1547–1567, https://doi.org/10.5194/acp-13-1547-2013, 2013.
Matthias, V., Bewersdorff, I., Aulinger, A., and Quante, M.: The contribution of ship emissions to air pollution in the North Sea regions, Environ. Pollut., 158, 2241–2250, https://doi.org/10.1016/j.envpol.2010.02.013, 2010.
McLaren, R., Wojtal, P., Halla, J. D., Mihele, C., and Brook, J. R.: A survey of NO2: SO2 emission ratios measured in marine vessel plumes in the Strait of Georgia, Atmos. Environ., 46, 655–658, https://doi.org/10.1016/j.atmosenv.2011.10.044, 2012.
Meller, R. and Moortgat, G. K.: Temperature dependence of the absorption cross sections of formaldehyde between 223 and 323 K in the wavelength range 225–375 nm, J. Geophys. Res.-Atmos., 105, 7089–7101, https://doi.org/10.1029/1999JD901074, 2000.
Mellqvist, J. and Rosén, A.: DOAS for flue gas monitoring – II, Deviations from the Beer-Lambert law for the UV/visible absorption spectra of NO, NO2, SO2 and NH3, J. Quant. Spectrosc. Ra., 56, 209–224, https://doi.org/10.1016/0022-4073(96)00043-X, 1996.
Mellqvist, J., Beecken, J., Conde, V., and Ekholm, J.: Surveillance of Sulfur Emissions from Ships in Danish Waters. Report to the Danish Environmental Protection Agency, https://doi.org/10.17196/DEPA.001, 2017.
MOT: Implementation of the Ship Emission Control Area in Pearl River Delta, the Yangtze River Delta and the Bohai Rim (Beijing-Tianjin-Hebei area), Ministry of Transport, China, 8, 2015.
Murphy, S. M., Agrawal, H., Sorooshian, A., Padro, L. T., Gates, H., Hersey, S., Welch, W. A., Jung, H., Miller, J. W., Cocker, D. R., Nenes, A., Jonsson, H. H., Flagan, R. C., and Seinfeld, J. H.: Comprehensive simultaneous shipboard and airborne characterisation of exhaust from a modern container ship at sea, Environ. Sci. Technol., 43, 4626–4640, https://doi.org/10.1021/es802413j, 2009.
Ning, X., Selesnick, I., and Duval, L.: Chromatogram baseline estimation and denoising using sparsity (BEADS), Chemom. Intell. Lab. Syst., 139, 156–167, https://doi.org/10.1016/j.chemolab.2014.09.014, 2014.
Pikelnaya, O., Flynn, J. H., Tsai, C., and Stutz, J.: Imaging DOAS detection of primary formaldehyde and sulfur dioxide emissions from petrochemical flares, J. Geophys. Res.-Atmos., 118, 8716–8728, https://doi.org/10.1002/jgrd.50643, 2013.
Pillot, D., Guiot, D., Le Cottier, B., Perret, P., and Tassel, P.: Exhaust emissions from in-service inland waterways vessels, J. Earth Sci. Geotech. Eng., 6, 205–225, 2016.
Platt, U., and Stutz, J.: Differential Optical Absorption Spectroscopy, Springer, Berlin-Heidelberg, 2008.
Platt, U., Perner, D., and Patz, H. W.: Simultaneous Measurement of Atmospheric CH2O, O3 and NO2 by Differential Optical Absorption, J. Geophys. Res., 84, 6329–6335, https://doi.org/10.1029/JC084iC10p06329, 1979.
Prata, A. J.: Measuring SO2 ship emissions with an ultraviolet imaging camera, Atmos. Meas. Tech., 7, 1213–1229, https://doi.org/10.5194/amt-7-1213-2014, 2014.
Premuda, M., Masieri, S., Bortoli, D., Kostadinov, I., Petritoli, A., and Giovanelli, G.: Evaluation of vessel emissions in a lagoon area with ground based Multi axis DOAS measurements, Atmos. Environ., 45, 5212–5219, https://doi.org/10.1016/j.atmosenv.2011.05.067, 2011.
Schreier, S. F., Peters, E., Richter, A. Lampel, J., Wittrock, F., and Burrowsa, J. P.: Ship-based MAX-DOAS measurements of tropospheric NO2 and SO2 in the South China and Sulu Sea, Atmos. Environ., 102, 331–343, https://doi.org/10.1016/j.atmosenv.2014.12.015, 2015.
Seinfeld, J. H. and Pandis, S. N.: Atmospheric chemistry and physics: From air pollution to climate change, 2nd edn., John Wiley and Sons, Hoboken, NJ, 2006.
Serdyuchenko, A., Gorshelev, V., Weber, M., Chehade, W., and Burrows, J. P.: High spectral resolution ozone absorption cross-sections – Part 2: Temperature dependence, Atmos. Meas. Tech., 7, 625–636, https://doi.org/10.5194/amt-7-625-2014, 2014.
Seyler, A., Wittrock, F., Kattner, L., Mathieu-Üffing, B., Peters, E., Richter, A., Schmolke, S., and Burrows, J. P.: Monitoring shipping emissions in the German Bight using MAX-DOAS measurements, Atmos. Chem. Phys., 17, 10997–11023, https://doi.org/10.5194/acp-17-10997-2017, 2017.
Singh, H. B.: Reactive nitrogen in the troposphere, Environ. Sci. Technol., 21, 320–327, https://doi.org/10.1021/es00158a001, 1987.
Sinreich, R., Frieß, U., Wagner, T., and Platt, U.: Multi axis differential optical absorption spectroscopy (MAX-DOAS) of gas and aerosol distributions, Faraday Discuss., 130, 153–164, https://doi.org/10.1039/b419274p, 2005.
Takashima, H., Irie, H., Kanaya, Y., and Syamsudin, F.: NO2 observations over the western Pacific and Indian Ocean by MAX-DOAS on Kaiyo, a Japanese research vessel, Atmos. Meas. Tech., 5, 2351–2360, https://doi.org/10.5194/amt-5-2351-2012, 2012.
Tan, W., Liu, C., Wang, S., Xing, C., Su, W., Zhang, C., Xia, C., Liu, H., Cai, Z., and Liu, J.: Tropospheric NO2, SO2, and HCHO over the East China Sea, using ship-based MAX-DOAS observations and comparison with OMI and OMPS satellite data, Atmos. Chem. Phys., 18, 15387–15402, https://doi.org/10.5194/acp-18-15387-2018, 2018.
Thalman, R. and Volkamer, R.: Temperature dependent absorption cross-sections of O2-O2 collision pairs between 340 and 630 nm and at atmospherically relevant pressure., Phys. Chem. Chem. Phys., 15, 15371–15381, https://doi.org/10.1039/C3CP50968K, 2013.
Van Roy, W. and Scheldeman, K.: Best Practices Airborne MARPOL Annex VI Monitoring, Royal Belgian Institute of Natural Sciences, OD Nature, Scientific service MUMM (Management Unit of the Mathematical Model of the North Sea), Brussels, Belgium, https://www.trafi.fi/filebank/a/1482762219/d80cdd7de80e58885ce5a4dd0af86c02/23541-Best_Practices_Airborne_MARPOL_Annex_VI_Monitoring.pdf (last access: 1 November 2019), 2016.
Vandaele, A. C., Hermans, C., Simon, P. C., Carleer, M., Colin, R., Fally, S., Merienne, M.-F., Jenouvrier, A., and Coquart, B.: Measurements of the NO2 absorption cross-section from 42 000 cm−1 to 10 000 cm−1 (238–1000 nm) at 220 K and 294 K, J. Quant. Spectrosc. Ra., 59, 171–184, https://doi.org/10.1016/S0022-4073(97)00168-4, 1998.
Villa, T. F., Salimi, F., Moryon, K., Morawska, L., and Gomzalez, F,: Development and balidation of a UAV based system for air pollution measurements, Sensors, 16, 2202, https://doi.org/10.3390/s16122202, 2016.
Wagner, T., Ibrahim, O., Shaiganfar, R., and Platt, U.: Mobile MAX-DOAS observations of tropospheric trace gases, Atmos. Meas. Tech., 3, 129–140, https://doi.org/10.5194/amt-3-129-2010, 2010.
Wang, T., Hendrick, F., Wang, P., Tang, G., Clémer, K., Yu, H., Fayt, C., Hermans, C., Gielen, C., Müller, J.-F., Pinardi, G., Theys, N., Brenot, H., and Van Roozendael, M.: Evaluation of tropospheric SO2 retrieved from MAX-DOAS measurements in Xianghe, China, Atmos. Chem. Phys., 14, 11149–11164, https://doi.org/10.5194/acp-14-11149-2014, 2014.
Yang, D., Kwan, S., Lu, T., Fu, Q., Cheng, J., Streets, D. G., Wu, Y., and Li, J.: An emission inventory of marine vessels in shanghai in 2003, Environ. Sci. Technol., 41, 5183–5190, https://doi.org/10.1021/es061979c, 2007.
Zhang, J., Wang, S., Guo, Y., Zhang, R., Qin, X., Huang, K., Wang, D., Fu, Q., Wang, J., and Zhou, B.: Aerosol vertical profile retrieved from ground-based MAX-DOAS observation and characteristic distribution during wintertime in Shanghai, China, Atmos. Environ., 192, 193–205, https://doi.org/10.1016/j.atmosenv.2018.08.051, 2018.
Zhang, Y., Gu, J., Wang, W., Peng, Y., Wu, X., and Feng, X.: Inland port vessel emissions inventory based on Ship Traffic Emission Assessment Model–Automatic Identification System, Adv. Mech. Eng., 9, 1–9, https://doi.org/10.1177/1687814017712878, 2017.
Zhang, Y., Deng, F., Man, H., Fu, M., Lv, Z., Xiao, Q., Jin, X., Liu, S., He, K., and Liu, H.: Compliance and port air quality features with respect to ship fuel switching regulation: a field observation campaign, SEISO-Bohai, Atmos. Chem. Phys., 19, 4899–4916, https://doi.org/10.5194/acp-19-4899-2019, 2019.
Zhao, M., Zhang, Y., Ma, W., Fu, Q., Yang, X., Li, C., Zhou, B., Yu, Q., and Chen, L.: Characteristics and ship traffic source identification of air pollutants in China's largest port, Atmos. Environ., 64, 277–286, https://doi.org/10.1016/j.atmosenv.2012.10.007, 2013.