the Creative Commons Attribution 4.0 License.
the Creative Commons Attribution 4.0 License.
 | 05 Nov 2019
Effects of strengthening the Baltic Sea ECA regulations
Jan Eiof Jonson
Michael Gauss
Jukka-Pekka Jalkanen
Lasse Johansson
Emissions of most land-based air pollutants in western Europe have decreased in the last decades. Over the same period emissions from shipping have also decreased, but with large differences depending on species and sea area. At sea, sulfur emissions in the SECAs (Sulphur Emission Control Areas) have decreased following the implementation of a 0.1 % limit on sulfur in marine fuels from 2015. In Europe the North Sea and the Baltic Sea are designated as SECAs by the International Maritime Organisation (IMO).
Model calculations assuming present (2016) and future (2030) emissions have been made with the regional-scale EMEP model covering Europe and the sea areas surrounding Europe, including the North Atlantic east of 30∘ W. The main focus in this paper is on the effects of ship emissions from the Baltic Sea. To reduce the influence of meteorological variability, all model calculations are presented as averages for 3 meteorological years (2014, 2015, 2016). For the Baltic Sea, model calculations have also been made with higher sulfur emissions representative of year 2014 emissions.
From Baltic Sea shipping the largest effects are calculated for NO2 in air, accounting for more than 50 % of the NO2 concentrations in central parts of the Baltic Sea. In coastal zones contributions to NO2 and also nitrogen depositions can be of the order of 20 % in some regions. Smaller effects, up to 5 %–10 %, are also seen for PM2.5 in coastal zones close to the main shipping lanes. Country-averaged contributions from ships are small for large countries that extend far inland like Germany and Poland, and larger for smaller countries like Denmark and the Baltic states Estonia, Latvia, and Lithuania, where ship emissions are among the largest contributors to concentrations and depositions of anthropogenic origin. Following the implementations of stricter SECA regulations, sulfur emissions from Baltic Sea shipping now have virtually no effects on PM2.5 concentrations and sulfur depositions in the Baltic Sea region.
Adding to the expected reductions in air pollutants and depositions following the projected reductions in European emissions, we expect that the contributions from Baltic Sea shipping to NO2 and PM2.5 concentrations, and to depositions of nitrogen, will be reduced by 40 %–50 % from 2016 to 2030 mainly as a result of the Baltic Sea being defined as a Nitrogen Emission Control Area from 2021. In most parts of the Baltic Sea region ozone levels are expected to decrease from 2016 to 2030. For the Baltic Sea shipping, titration, mainly in winter, and production, mainly in summer, partially compensate. As a result the effects of Baltic Sea shipping on ozone are similar in 2016 and 2030.


Even though emissions of most air pollutants have decreased in the countries surrounding the Baltic Sea (BAS) in past decades (Tista et al., 2018), air pollution and atmospheric depositions affecting ecosystems remain a problem in the region. Significant contributions to the emissions also come from shipping, both inside and outside the region. Obtaining reliable data on emissions from international shipping has always been challenging, but in recent years ship emissions estimated based on AIS (automatic identification system) positioning data have become available, continuously tracking the position of the vessels, resulting in substantial improvements in the reliability of ship emissions data.
A number of IMO (International Maritime Organisation) and EU regulations have been implemented in the recent past or will be implemented in the near future, affecting ship emissions in European waters. Most noteworthy are the SECA (Sulphur Emission Control Area) regulations, reducing the maximum sulfur content allowed in marine fuels from 1.0 % to 0.1 % from 1 January 2015 (IMO, 2008). Fuels with higher sulfur content may be used in combination with emission reduction technology, reducing sulfur emission to levels equivalent to the use of compliant low-sulfur fuels. In European waters the North Sea (NOS) and BAS are designated as SECAs by the IMO. These two sea areas are also accepted as NECAs (NOx Emission Control Areas) from 2021 (IMO, 2017). Reductions in NOx emissions are expected to occur only gradually in the NECAs as these regulations only apply to new ships or when major modifications are made on existing ships. Furthermore, from 2020 a global cap on sulfur content in marine fuels of 0.5 % will be implemented.
The global effects of international shipping on air pollution and depositions have been discussed in several papers (Corbett et al., 2007; Endresen et al., 2003; Eyring et al., 2007; Sofiev et al., 2018). In a global model calculation Jonson et al. (2018) found that a large portion of the anthropogenic contributions to air pollution and nitrogen depositions in adjacent countries could be attributed to NOS and BAS ship emissions of NOx and particles also after the introduction of stricter SECA regulations in 2015. In addition, several regional studies focusing on the effects of NOS and BAS ship emissions have been performed. Jonson et al. (2015) studied the effects of reducing the sulfur content in marine fuels from 1.5 % to 1 % in 2011 on air pollution, including also calculations of health effects as well as effects of future (2030) ship emissions. They found that the introduction of a NECA from 2016 (later postponed to 2021) would reduce the burden on health due to shipping in the BAS region. Reductions in future PM2.5 (particulate matter with diameter less than 2.5 µm) levels as a result of the 2021 NECA are also predicted by Karl et al. (2019a). Brandt et al. (2013) calculated the effects of ship emission on Europe for the years 2000 and 2020. They found that the implementation of the stricter SECA regulations in the BAS and the NOS would result in substantial health improvements in Europe. Karl et al. (2019b) compared the effects of BAS shipping calculated by three different chemistry transport models using year 2012 emissions and meteorology. They found that in the entire BAS region the average contribution from ships to PM2.5 is in the range of 4.3 %–6.5 % for the three CTMs, and deposition of oxidised nitrogen to the Baltic Sea is in the 20–24 kt N per year range. Claremar et al. (2017) calculated the dispersion of air pollutants and depositions from NOS and BAS shipping for the period 2011 to 2050, with the main focus on seawater acidity in BAS. They found that, also in the future, ship emissions could remain a major source of acidity, in particular when assuming high penetration of open-loop scrubbers in combination with the use of high-sulfur-content fuels.
SOx removal by scrubbing the exhaust can significantly reduce both the gaseous sulfur compounds as well as particulate matter. Scrubbers may use seawater as a cleaning agent if the alkalinity of seawater is high enough and contains enough carbonates, bicarbonates, and borates. However, in areas of low alkalinity, like the Bothnian Bay in the Baltic Sea, the required wash water volume becomes very large, and chemicals like caustic soda are added to neutralise the acidic releases. The wash water may also contain other pollutants such as heavy metals.
Ship owners can also comply with stringent sulfur rules by using LNG (liquefied natural gas). However, during 2016 only about 0.8 % of the energy need of the Baltic Sea fleet was produced with LNG. Use of renewable liquid fuels is rather limited because of high price and low availability. Liquid biofuels are not used by any ship in our modelling approach.
In this paper we have calculated the effects of ship emissions in the BAS on air pollution and depositions of oxidised sulfur and nitrogen in adjacent countries. Calculations have been made applying BAS emissions prior to (2014) and after (2016) the implementation of the stricter SECA regulations, which went into force on 1 January 2015. Furthermore, model calculations have been made with future (2030) land-based and ship emissions.
2.1 Emissions
Land-based emissions have been provided by the International Institute for Applied Systems Analysis (IIASA) within European FP7 project ECLIPSE. In this study we use version 5a (hereafter “ECLIPSEv5a”), a global emission data set at 0.5×0.5∘ resolution, which has been widely used in recent years by the scientific community (http://www.iiasa.ac.at/web/home/research/researchPrograms/air/ECLIPSEv5.html, last access: 27 February 2019). ECLIPSEv5a is available in 5-year intervals from 2005 onwards, and in this study we have chosen data for 2015 and 2030.
The ECLIPSE v5a emissions were re-gridded using the TNO-MACC-III 0.125×0.0625 long–lat emission distribution (Kuenen et al., 2014) for the year 2011. During the re-gridding process only the spatial distribution of the ECLIPSE v5a emissions was modified, while the national and sector totals remained unchanged. Where TNO-MACC-III emissions are not available (such as northern Africa), the gridded ECLIPSE v5a emissions were interpolated to the TNO-MACC grid resolution. Any missing sectors for countries which were included in the TNO-MACC-III emission data were also completed from the interpolated ECLIPSE v5a emissions.
In reality land-based emissions will change between years. Annual emissions from years 2000 to 2016 for the European countries are listed in EMEP Status Report 1/2018 (2018). In the Baltic region reported changes in country emission are small, with the exception of SOx emissions in Poland dropping by almost 20 % from 2014 to 2016.
In regard to ship emissions in the BAS, we use emission data as provided by the FMI (Finish Meteorological Institute) for the year 2014 (i.e. with 1 % maximum sulfur content in fuels in the SECA) and 2016 (maximum sulfur content reduced to 0.1 % in the SECA). For the remaining sea areas, ship emissions for the year 2015 are used from a previous global data set (Johansson et al., 2017).
The emissions from shipping have been calculated with the Ship Traffic Emission Assessment Model (STEAM) based on ship movements from the AIS which provides real-time information on ship positions. The model requires as input detailed technical specifications of all onboard fuel-consuming systems and other relevant technical details for all ships considered. The data from IHS Global (2017) constituted the most significant source of this information. The STEAM model is described in Jalkanen et al. (2009, 2012, 2016) and Johansson et al. (2013, 2017). Hourly emission grids for Baltic Sea ship emissions were produced based on vessel-specific modelling, considering the changes in fuel sulfur content that occurred between 2014 and 2016.
In STEAM scrubbers can operate in closed- or open-loop mode, depending on the equipment installed. If a hybrid scrubber system is known to be installed, it is assumed to operate in open-loop mode when the vessel operates in an area where open-loop systems are feasible. Closed-loop mode of a hybrid scrubber is assumed in the Bothnian Bay and restricted zones, like German waters. If a vessel has an open-loop scrubber installed and it enters a restriction zone, the model assumes a fuel switch to low-sulfur fuels. Emission modelling uses scrubber equipment type (closed/open/hybrid), vessel identity, and installation date as input to emission modelling. All future scrubber scenarios introduce hybrid scrubbers to the fleet.
Globally, during 2014 there were 77 vessels using a scrubber, of which 30 % were of open-loop, 48 % of closed-loop, and 22 % of hybrid type. By 2016 scrubber installations were doubled globally to 155 units. In the Baltic Sea area during 2016, there were 85 vessels operating a scrubber releasing 73 million tonnes of wash water into the sea. Almost all of this (99.8 %) discharge came from open-loop operation of scrubbers.
Ship-emitted pollutants were modelled using AIS data for the years 2014 and 2016. Any changes in vessel activity, fleet size, and development will have an impact on energy use and all pollutant emissions. However, the sulfur rule was the only significant change which had a large impact on emitted pollutants. Both PM and SOx were reduced by this change, but only the sulfate fraction of PM was reduced accordingly, whereas other components of PM were less affected.
From 2021 onward, NOx emissions for new ships have to comply with IMO Tier 3 regulations. These contributions were taken into account in the emission modelling. Future emission projections for the year 2030 also include changes in
-
energy efficiency improvements, modelled following the method of Kalli et al. (2013), which goes beyond the Energy Efficiency Defined Index (EEDI) requirements of the IMO;
-
fleet size increase;
-
vessel size growth, assuming a linear annual growth dependent on ship types.
Annual growth rates in fleet size are implemented as percentage increase per type of ship: for example, if the annual percentage growth is n % for container ships, we duplicate n % of the container ships in the current fleet in the following year. The following growth rates are assumed for vessel DWT: vehicle carriers and RoRo: 1.25 % per annum; dry cargo: 0.4 % per annum; container carriers: 1.2 % per annum; liquid cargo: 2.0 % per annum; passenger vessels, ferries, and high-speed craft: 0.3 % per annum; cruise ships: 0.3 % per annum; fishing vessels: 0.3 % per annum. Vessel size growth for other types was set to zero. For those vessels, the vessel size remains at the 2014 level.
As the ship emission data are used for multiple meteorological years (see the next section), we did not retain the high (hourly) temporal resolution in the data, but rather aggregated them to monthly resolution before use in the chemistry transport model.
2.2 Model calculations of air pollutants and depositions
Concentrations of air pollutants and depositions of sulfur and nitrogen have been calculated with the EMEP MSC-W model (hereafter “EMEP model”), version rv4.14, at 0.1×0.1∘ resolution for the domain between 30∘ W and 45∘ E and between 30 and 75∘ N. A detailed description of the EMEP model can be found in Simpson et al. (2012), with later model updates being described in Simpson et al. (2018), and references therein. The EMEP model is available as open source (see https://github.com/metno/emep-ctm, last access: 27 February 2019) and is regularly evaluated against measurements as part of the EMEP status reports. See Gauss et al. (2016, 2017, 2018) for evaluations of the meteorological years 2014, 2015, and 2016, respectively. In addition, the EMEP model has successfully participated in model intercomparisons and model evaluations presented in a number of peer-reviewed publications: Colette et al. (2011, 2012), Angelbratt et al. (2011), Dore et al. (2015), Karl et al. (2019b), Stjern et al. (2016), and Jonson et al. (2018). Vivanco et al. (2018) evaluated depositions of sulfur and nitrogen species in Europe calculated by 14 regional models, showing good results for the EMEP model.
In the present study the model is driven by meteorological data from the European Centre for Medium-Range Weather Forecasts (ECMWF) based on the CY40R1 version of their IFS (Integrated Forecast System) model. All simulations for this paper have been run for the 3 meteorological years 2014, 2015, and 2016 and then averaged, in order to cancel out meteorological variability. The simulations are the following.
-
Present_Base: base case with ship emissions of 2016. Land-based emissions for 2015 (from ECLIPSEv5).
-
Present_NoShip: as Present_Base, but without ship emissions in the BAS.
-
Present_HiSulphur: as Present_Base, but with ship emissions of 2014 (i.e. high sulfur content) in the BAS.
-
Future_Base: ship emissions of 2030 (assuming NECA and business-as-usual development) and land-based emissions of 2030 (from ECLIPSEv5).
-
Future_NoShip: as Future_Base, but without ship emissions in the BAS.
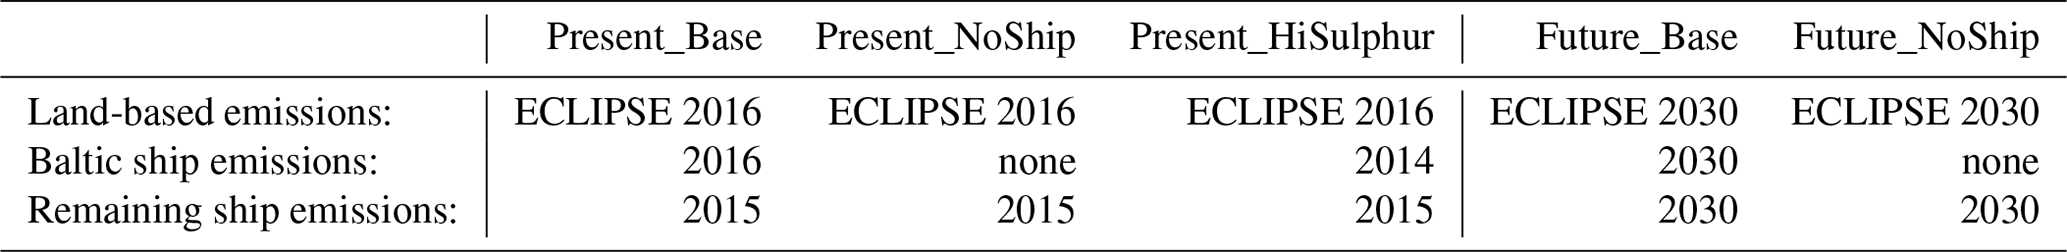
The emissions are also summarised in Table 1. In the future scenarios it is assumed that ships that are in compliance with the NECA regulations will operate the equipment (i.e. be compliant) also when sailing outside the NECA.
Table 1All model scenarios have been calculated for the 3 meteorological years 2014, 2015, and 2016. In the comparisons to measurements in Table 2 only year 2016 model calculations are shown. The land-based ECLIPSE emissions for 2016 have been interpolated between 2015 and 2020. SECA regulations for the North Sea are included in the remaining sea ship emissions. The 2020 sulfur cap is included in the 2030 ship emissions outside the SECAS.
In this section model results for parts of Europe centred around the BAS are shown. Concentrations and depositions are shown as averages for 3 meteorological years for Present_Base and Future_Base and for differences between the two Base runs and the perturbation scenarios as described in Sect. 2.2. The impact on PM2.5 levels and on the depositions of oxidised nitrogen and sulfur species derived from the perturbation model runs presented here forms the basis of upcoming papers discussing the effects on human health (Barregård et al., 2019) and assessing the environmental impacts, including the exceedances of critical loads from ship emissions in the BAS (Repka et al., 2019).
In Gauss et al. (2018) the EMEP model results for 2016 compared to measurements are discussed in detail. Although the model setup is not completely identical, the results are qualitatively very similar. The model underestimates NO2. Measured PM2.5 is also underestimated, and results for the individual PM2.5 components are mixed, with SO4 underestimated, whereas other components are overestimated compared to measurements.
Table 2Annual average measured (Obs) and model-calculated concentrations (Calc) of NO2 and SO2 for the present (2016) Base, NoShip, and HiSulphur scenarios. The figure continues on the next page with SO4 and PM2.5. Also listed are normalised mean bias (NMB), the daily correlations (Corr.), and rms errors (rms) between model and measurements. For Hallahus there are PM2.5 measurements only for parts of the year, and bias, correlations, and rms errors are not listed. The time-series plots for the same sites are shown in Appendix A. Km Balt. is a classification of the distance in kilometres between the stations and the Baltic Sea coast. The distance is equal to or smaller than the distance listed. The positions of the measurement sites and the time-series plots are shown in Appendix A.
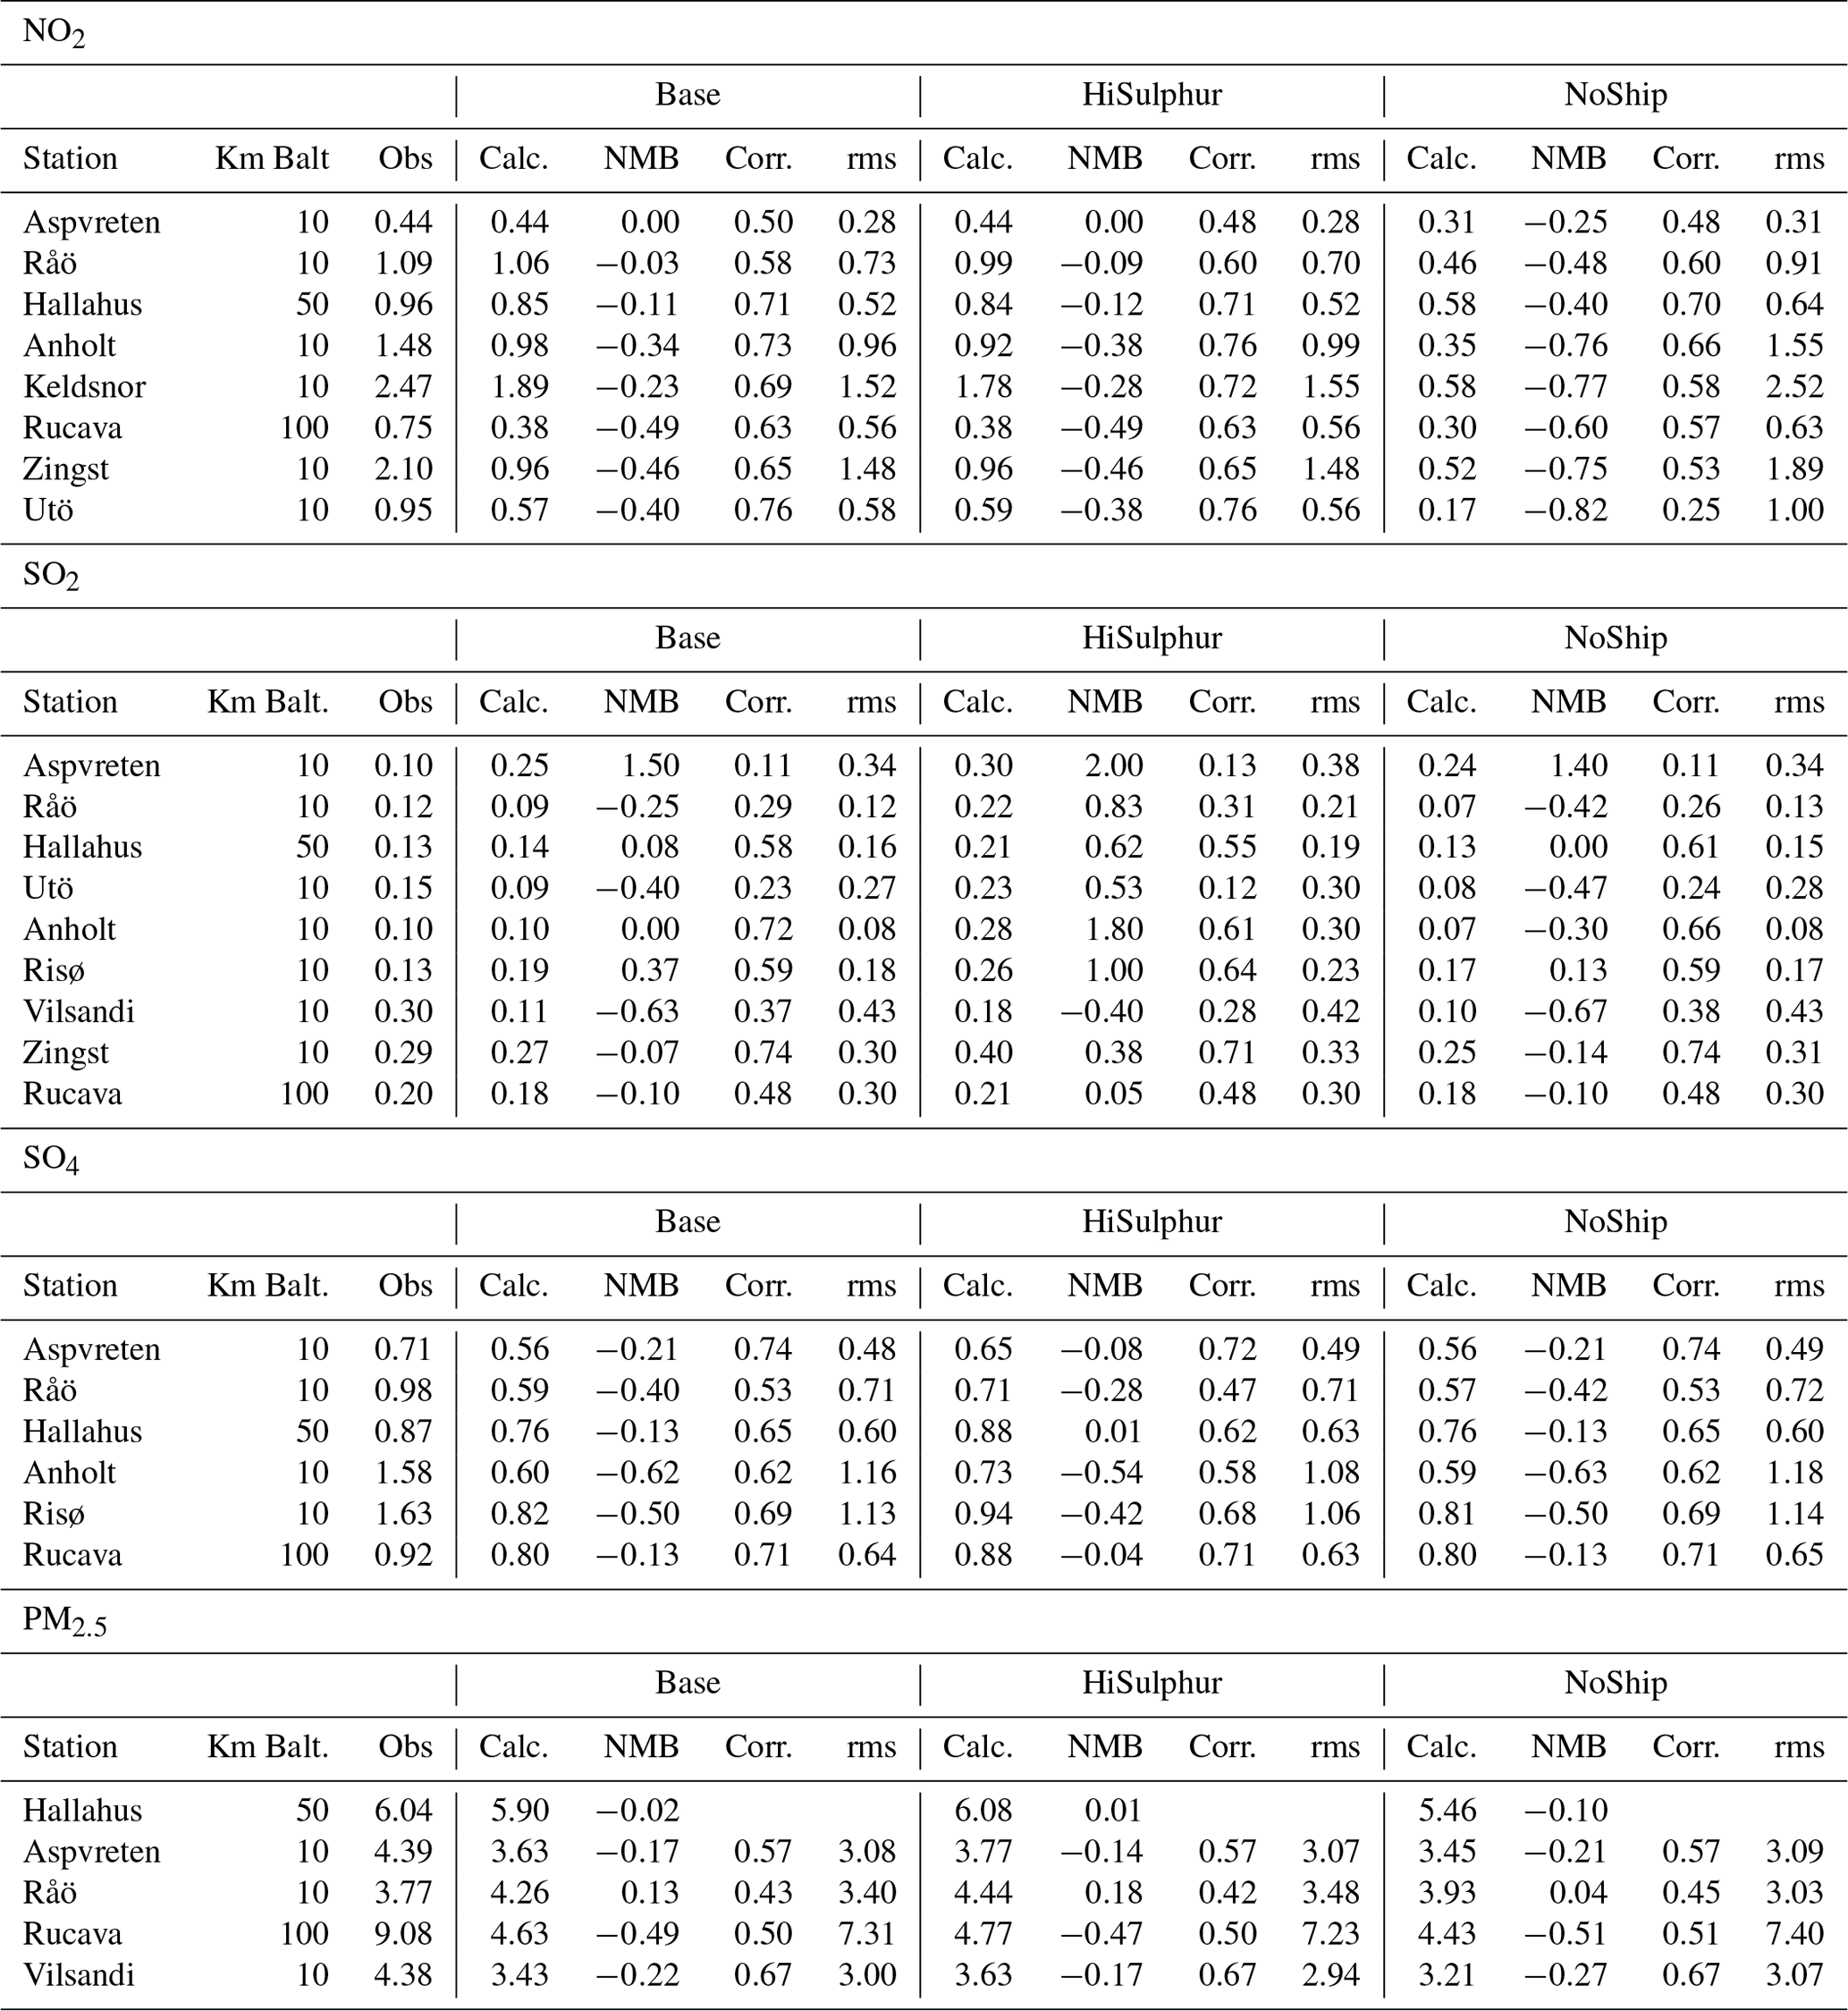
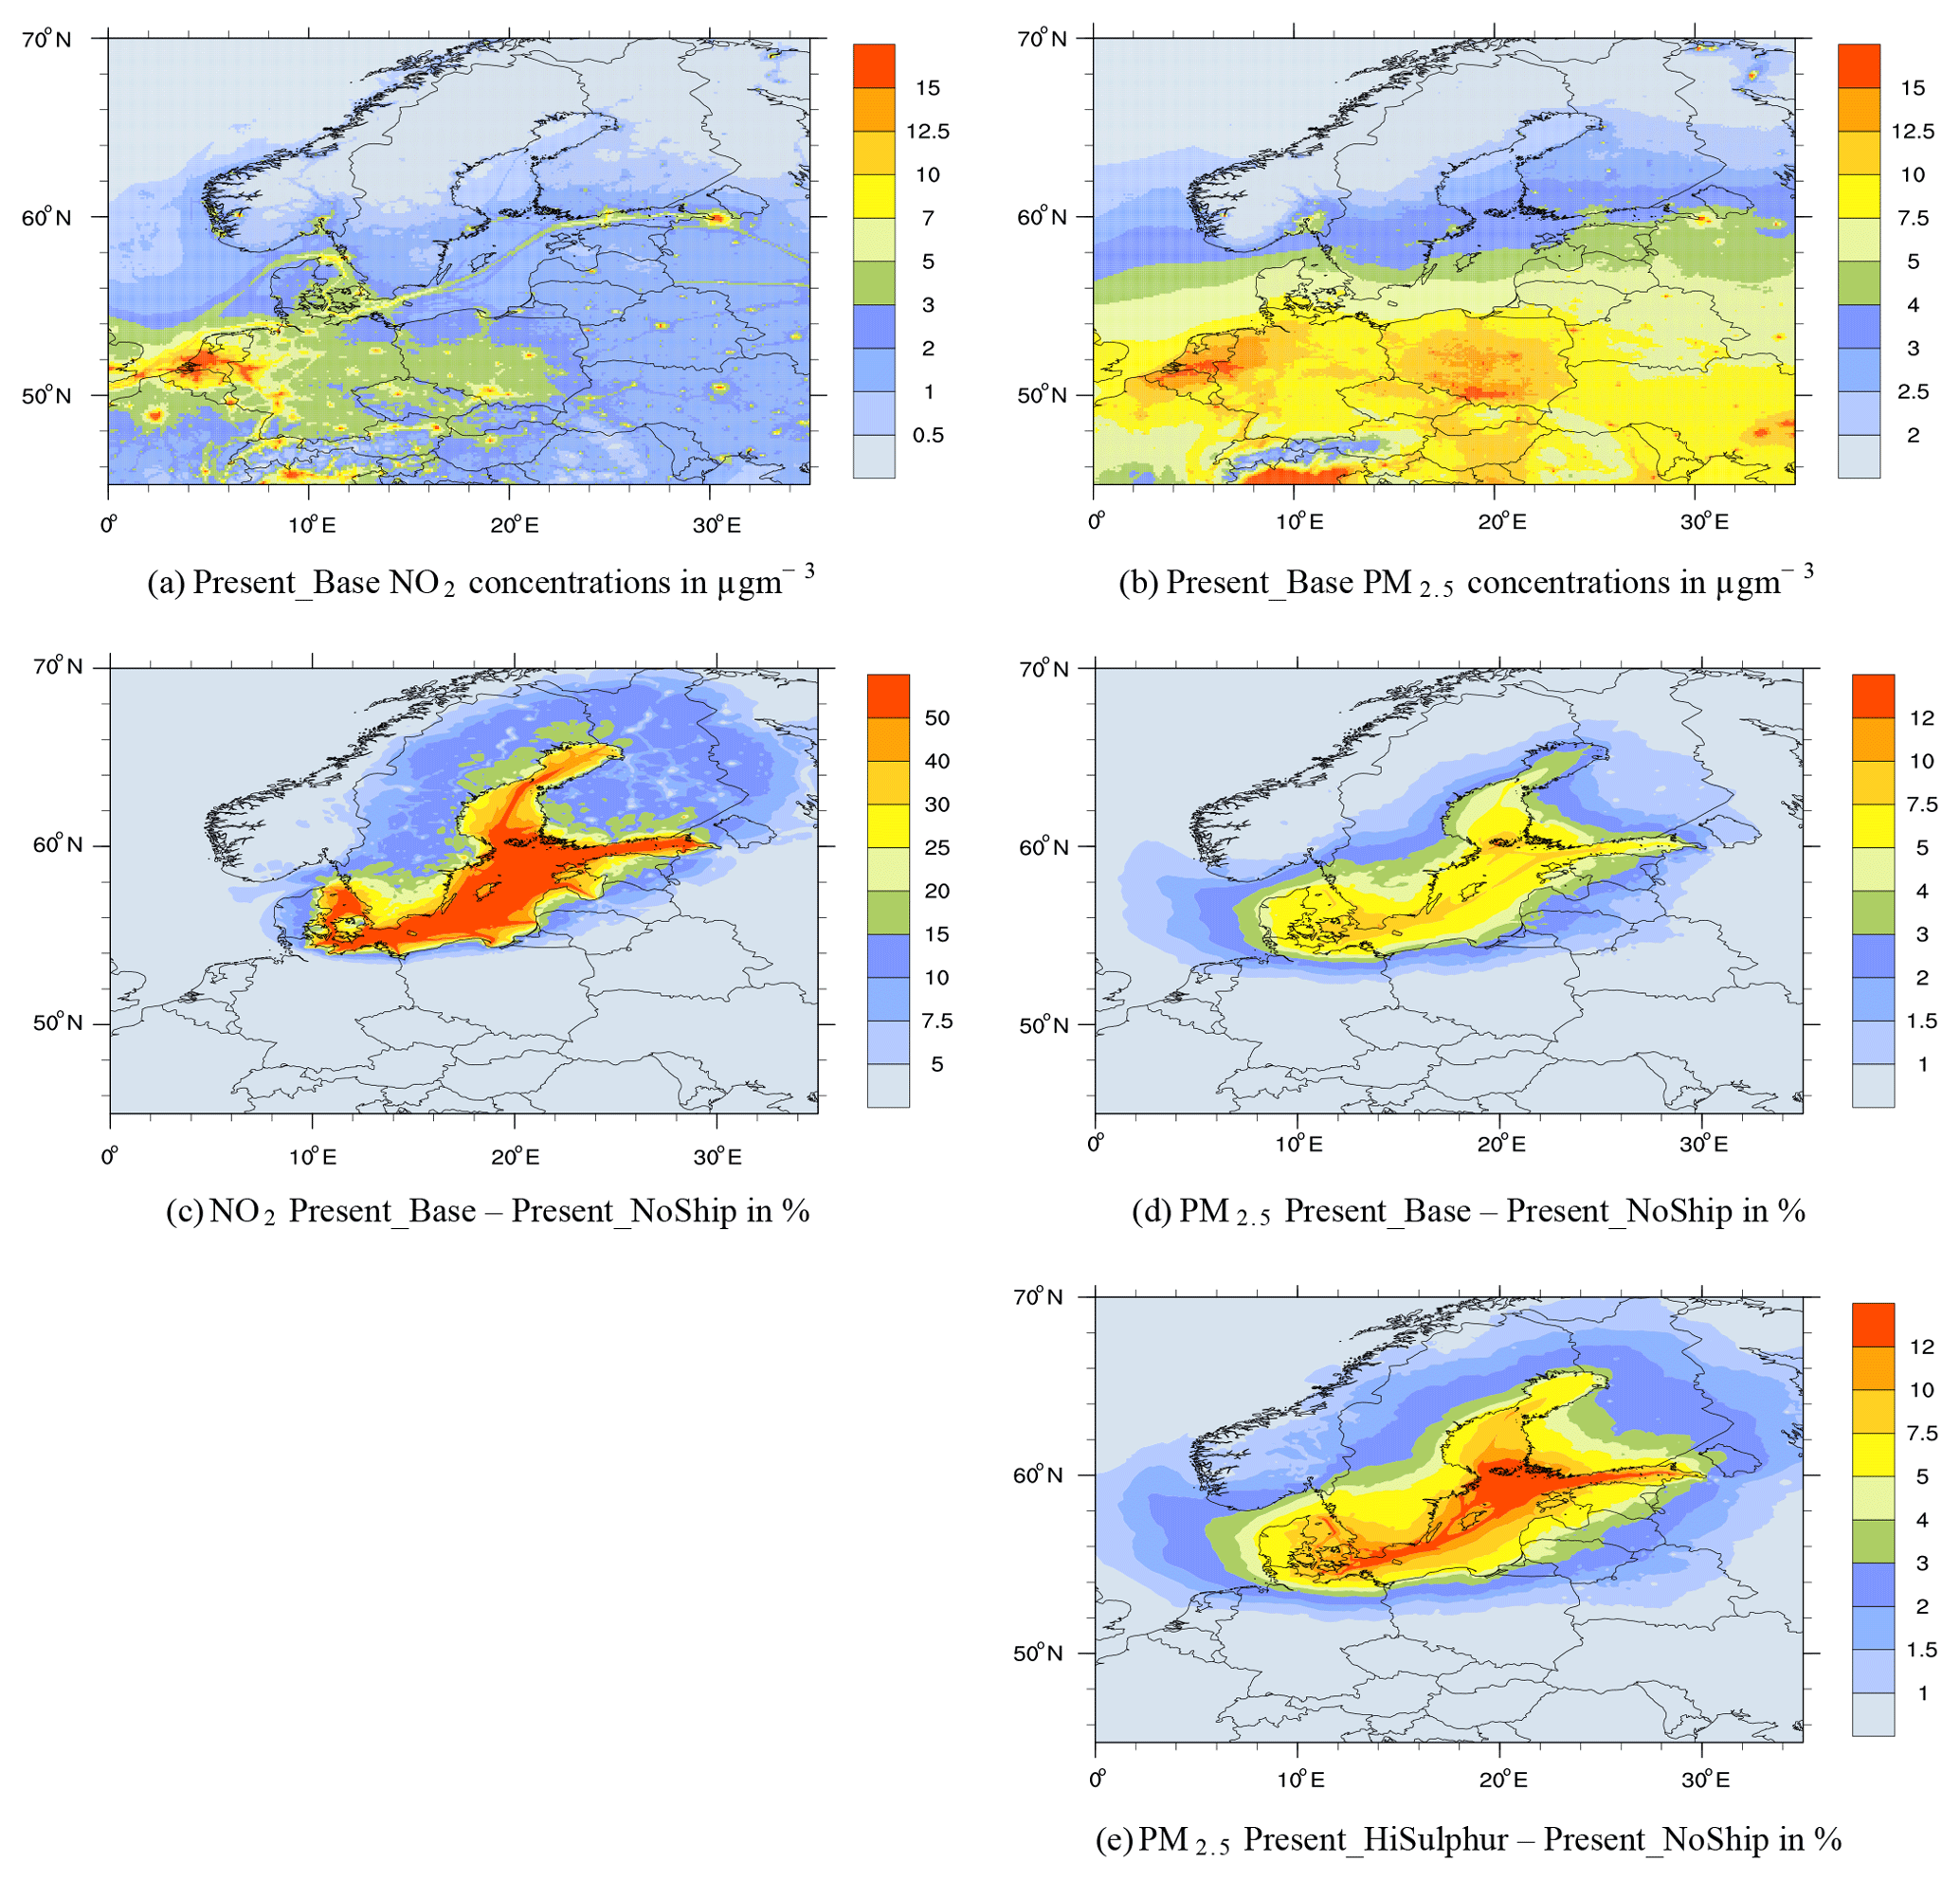
Figure 1(a, b) Concentrations of NO2 and PM2.5 in the Present_Base case. (c, d) Present percentage contribution from BAS ship emissions to NO2 and PM2.5 after the new sulfur regulations. (e) Percentage contribution to PM2.5 concentrations before the new sulfur regulations.
3.1 Air pollution due to Baltic Sea shipping
Concentrations of NO2 for Present_Base are shown in Fig. 1a. The lifetime of NO2 is relatively short, and as a result the concentrations largely reflect the locations of the main source areas. Concentrations of NO2 are high in central Europe and in and around the English Channel, with markedly lower concentrations north and east of the BAS. In the NOS and the BAS the major ship tracks are clearly visible. Figure 1c shows the difference between the Present_Base and Present_NoShip scenarios. The calculations show that ship emissions account for more than 50 % of NO2 in central parts of the BAS and for a substantial percentage also in coastal zones, in particular in Denmark, southern parts of Sweden and Finland, and the Baltic states (Estonia, Latvia, and Lithuania). This is also illustrated in Table 2, where measured NO2 at sites located in the BAS coastal regions are compared to the Present_Base, Present_NoShip, and Present_HiSulphur model calculations calculated with 2016 meteorology. The position of the measurement sites and the corresponding time-series plots for NO2 are shown in Appendix A. In the Present_NoShip case NO2 levels are clearly underestimated and correlations and rms errors deteriorated compared to the Present_Base calculation, in particular for those sites located very close to major shipping routes. The comparisons with measurements convincingly show that these measurements can only be reproduced when BAS ship emissions are included. The contributions to individual countries will be further discussed in a later section.
As shown in Table 2, measured SO2 levels for 2016 are relatively well reproduced by the model for the Present_Base calculation. The position of the measurement sites and the corresponding time-series plots for SO2 are shown in Appendix A. The effects of excluding the BAS ship emissions in the Present_NoShip scenario have only minor effects on the SO2 levels. Replacing 2016 BAS emissions with 2014 ones (Present_HiSulphur) has much larger effects, resulting in an overestimation of SO2 levels at most of the sites listed in Table 2, and in particular for Anholt and Råö, located very close to the shipping routes. This clearly illustrates the effects of the stricter SECA regulations. With the high ship emissions of 2014, the measurements for 2016 can not be reproduced. This is also a strong indication that the ships are largely in compliance with the SECA regulations. As for NO2, the contributions to individual countries are discussed further in a later section.
PM2.5 in the atmosphere is a mixture of many chemical species of both natural and anthropogenic origins. It is emitted as a primary pollutant and formed as a secondary pollutant in the atmosphere. As a result PM2.5 concentrations are more spread out compared to NO2. Concentrations decrease from south to north from a maximum in central Europe. As shown in Fig. 1d the percentage contributions from BAS shipping, calculated as Present_Base–Present_NoShip, are much smaller for PM2.5 than for NO2, but with noticeable contributions in coastal zones, in particular in parts of Denmark, Sweden, and Finland. Figure 1e shows higher contributions when assuming BAS shipping at 2014 levels (Present_HiSulphur), prior to the implementation of the stricter SECA regulations. These results are also illustrated in the comparisons of model scenario calculations at the measurement sites located in BAS coastal regions as listed in Table 2. The positions of the measurement sites and the corresponding time-series plots for PM2.5 are shown in Appendix A. For PM2.5 differences between the Present_Base and Present_NoShip cases are much smaller than for NO2. Likewise, differences are smaller than for SO2 between Present_Base and Present_HiSulphur. In Table 2 we also show measured and model-calculated concentrations of SO4.
Continuing a downward trend from the late 1980s, land-based sulfur emissions have decreased by more than 50 %, i.e. more than for any other of the major air pollutants (Tista et al., 2018), and thus the importance of sulfur in particle formation has decreased relative to other anthropogenic emitted species and natural sources. In the SECAs the sulfur content in marine fuels has decreased from the global average of about 2.5 % to 1 % in 2011 and finally to 0.1 % in 2015. As a result of these large emission reductions the fraction of SO4 in PM2.5 in the BAS region has decreased even further here. At the sites in Table 2 both the measured and model-calculated fractions of SO4 in PM2.5 are about 0.15. As SO4 makes up a moderate portion of the PM2.5 composition, this fraction increases only by a small amount with the Present_HiSulphur scenario.
The model results underestimate the measurements at most of the sites listed. Based only on the comparisons between measurements and the different model scenarios for PM2.5, one can not conclude that the Present_Base scenario is more realistic than the other two. As for NO2 and SO2, the contributions to individual countries are discussed further in a later section.
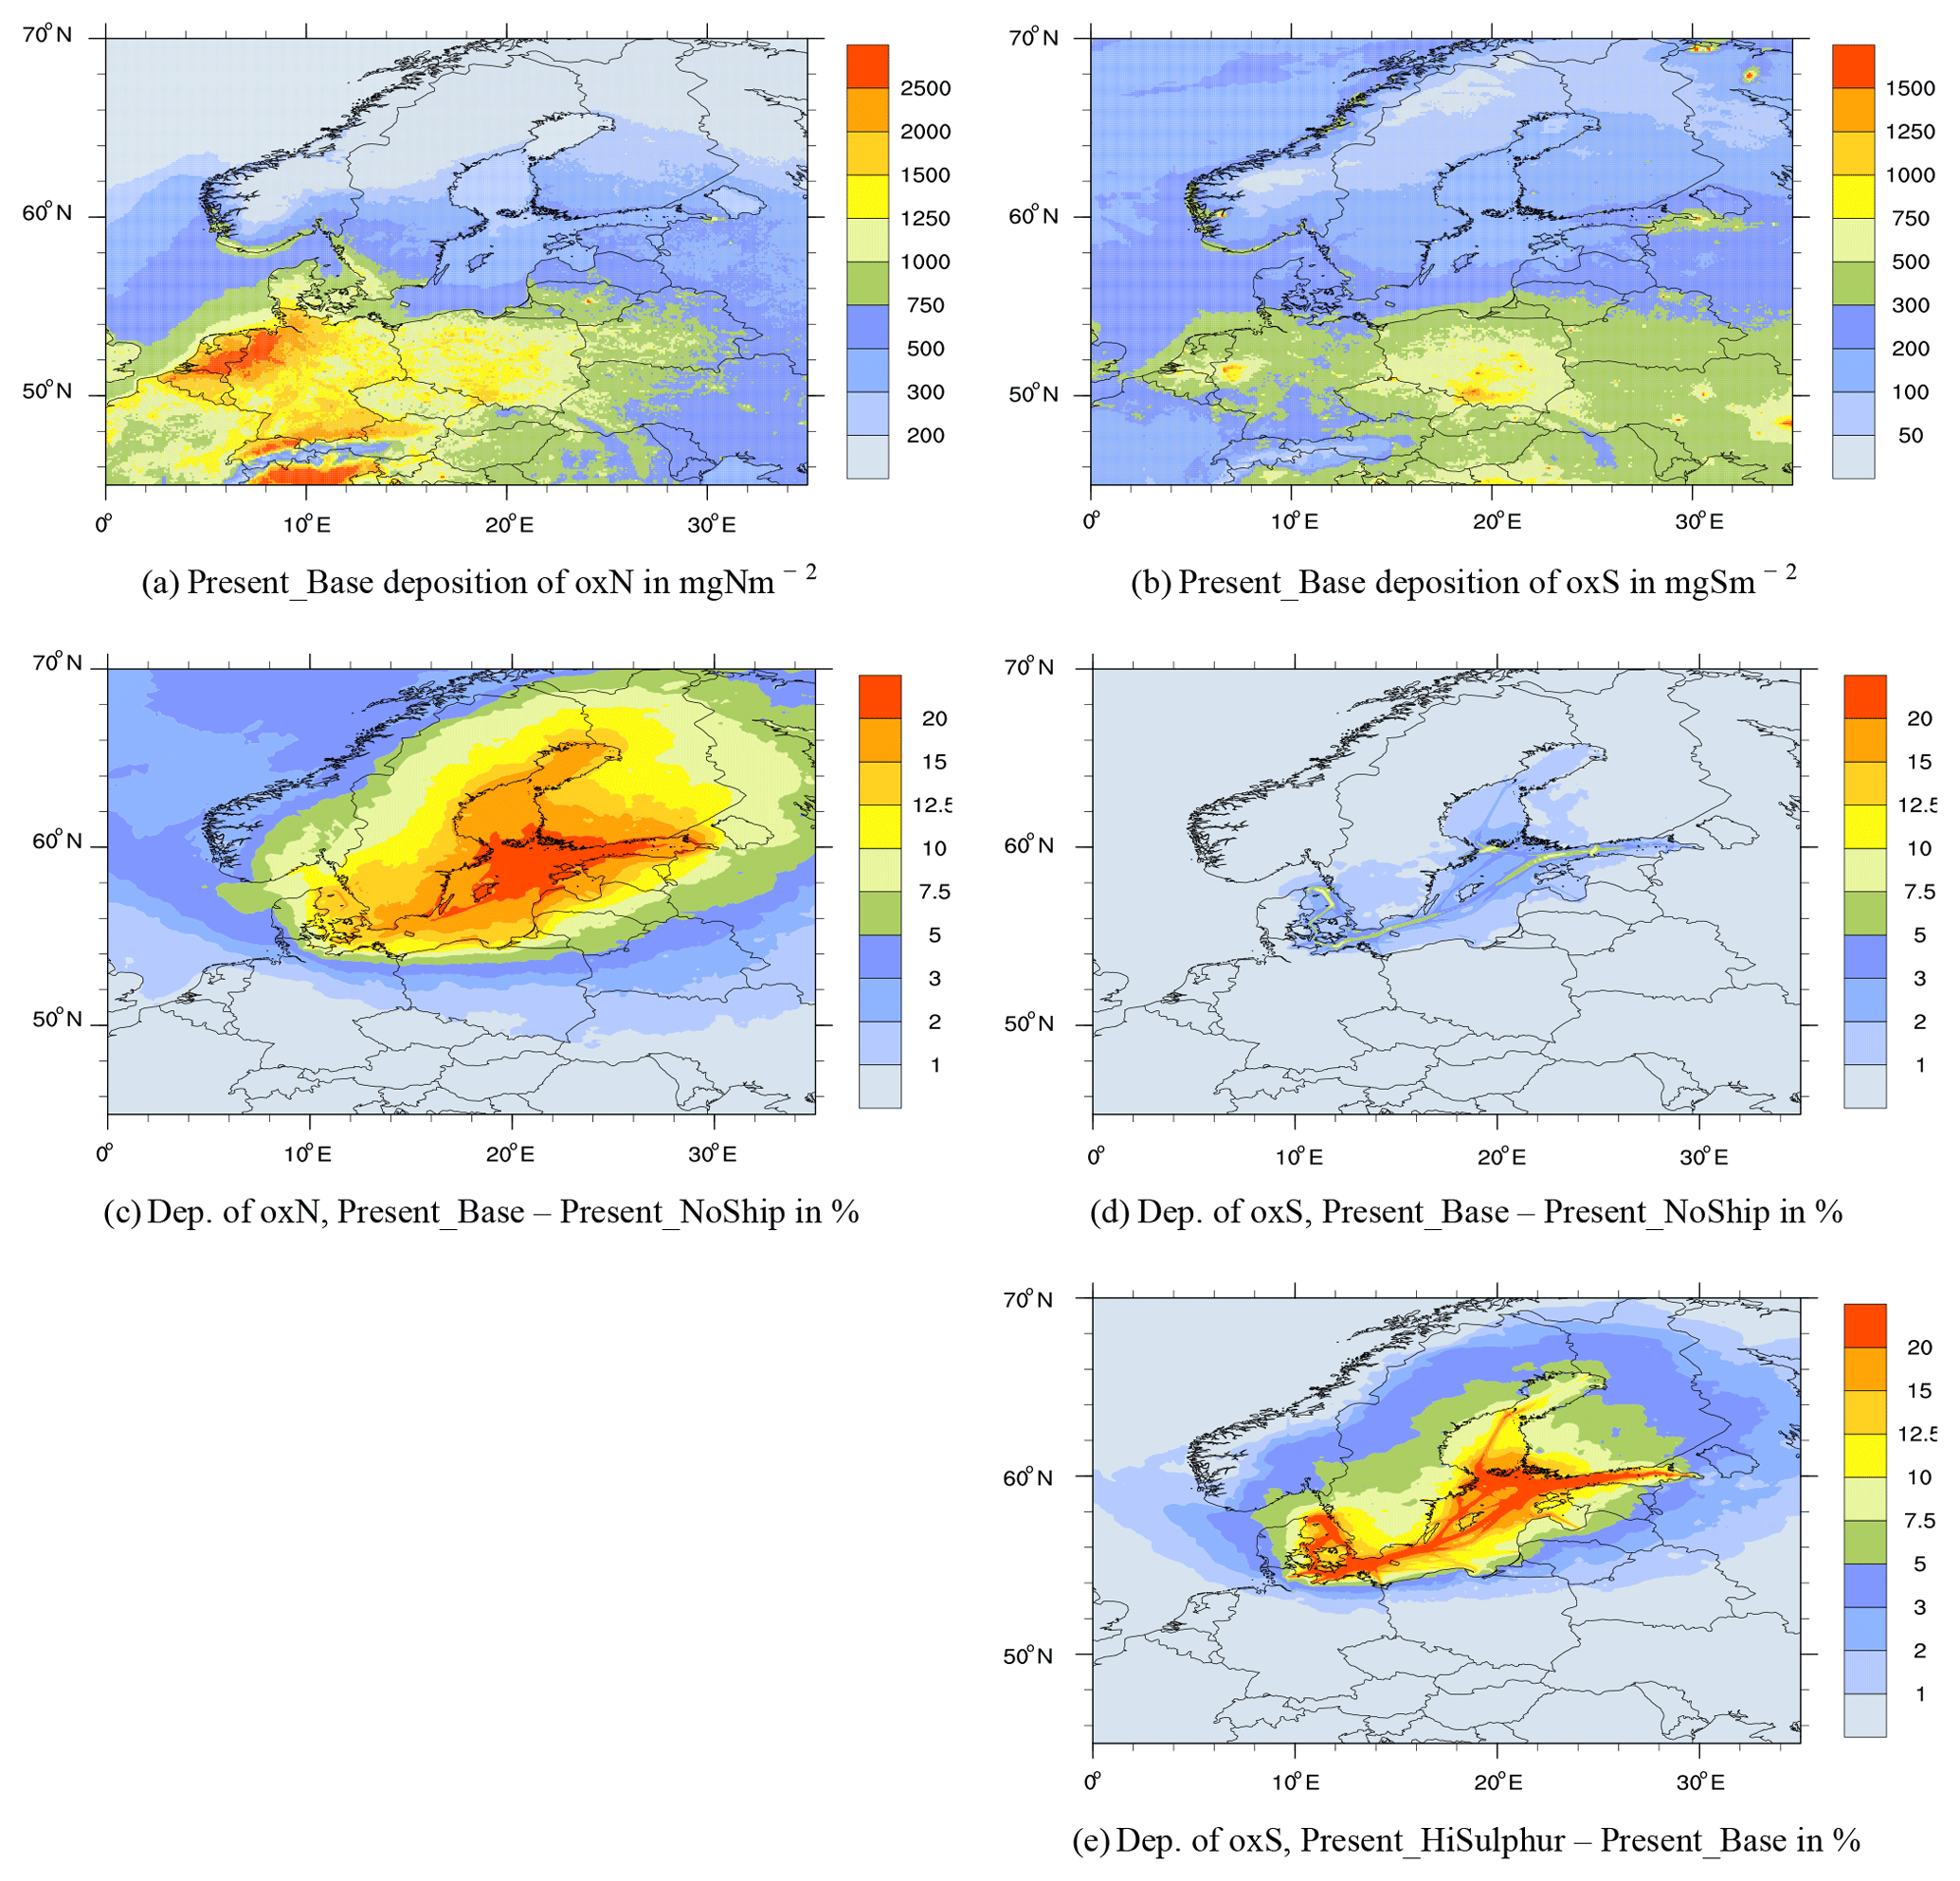
Figure 2(a, b) Calculated depositions of oxidised nitrogen and sulfur. (c, d) Present percentage contributions from BAS ship emissions to depositions of oxidised nitrogen and oxidised sulfur with reference to Base 2016. (e) Percentage contribution to depositions of oxidised sulfur with reference to 2014 BAS emissions.
3.2 Depositions of sulfur and nitrogen from Baltic Sea shipping
Total depositions (wet and dry) of oxidised sulfur and nitrogen for Present_Base are shown in Fig. 2a, b. The highest depositions of both sulfur and nitrogen are seen over central Europe. For nitrogen, high levels of depositions also extend into northern Germany and Denmark. Based on the difference between Present_Base and Present_NoShip, a significant amount of the nitrogen depositions can be attributed to BAS shipping (Fig. 2c), contributing more than 15 % of the total nitrogen depositions in major parts of the BAS and also in parts of Sweden, Finland, and the Baltic states (Estonia, Latvia, and Lithuania). Dry deposition is parameterised as a function of subgrid-scale ecosystems and is typically higher than the grid average for forest ecosystems (both coniferous and deciduous). This will affect the calculations of critical loads for acidification and eutrophication as the subgrid-scale ecosystem depositions are used in the critical load calculations. Critical loads will be discussed in a companion paper (Repka et al., 2019). Figure 2d shows that the calculated contributions from BAS shipping in 2016 to depositions of sulfur are very low (Present_Base–Present_NoShip) and much lower than what has been calculated assuming 2014 emissions (Present_HiSulphur–Present_Base) as shown in Fig. 2e, with percentage contributions exceeding 10 % in many coastal zones.
Table 3Annual average measured (Obs) and model-calculated concentrations (Calc.) in precipitation of oxidised nitrogen in mg N L−1 and oxidised sulfur in mg (inS) L−1 in 2016 for the present Base, NoShip, and HiSulphur scenarios. Also listed are the normalised mean bias (NMB), the daily correlations (Corr.), and rms errors (rms) between model and measurements. Km Balt. is a classification of the distance in kilometres between the stations and the Baltic Sea coast. The distance is equal to or smaller than the distance listed. The position of the measurement sites and the time-series plots are shown in Appendix A.
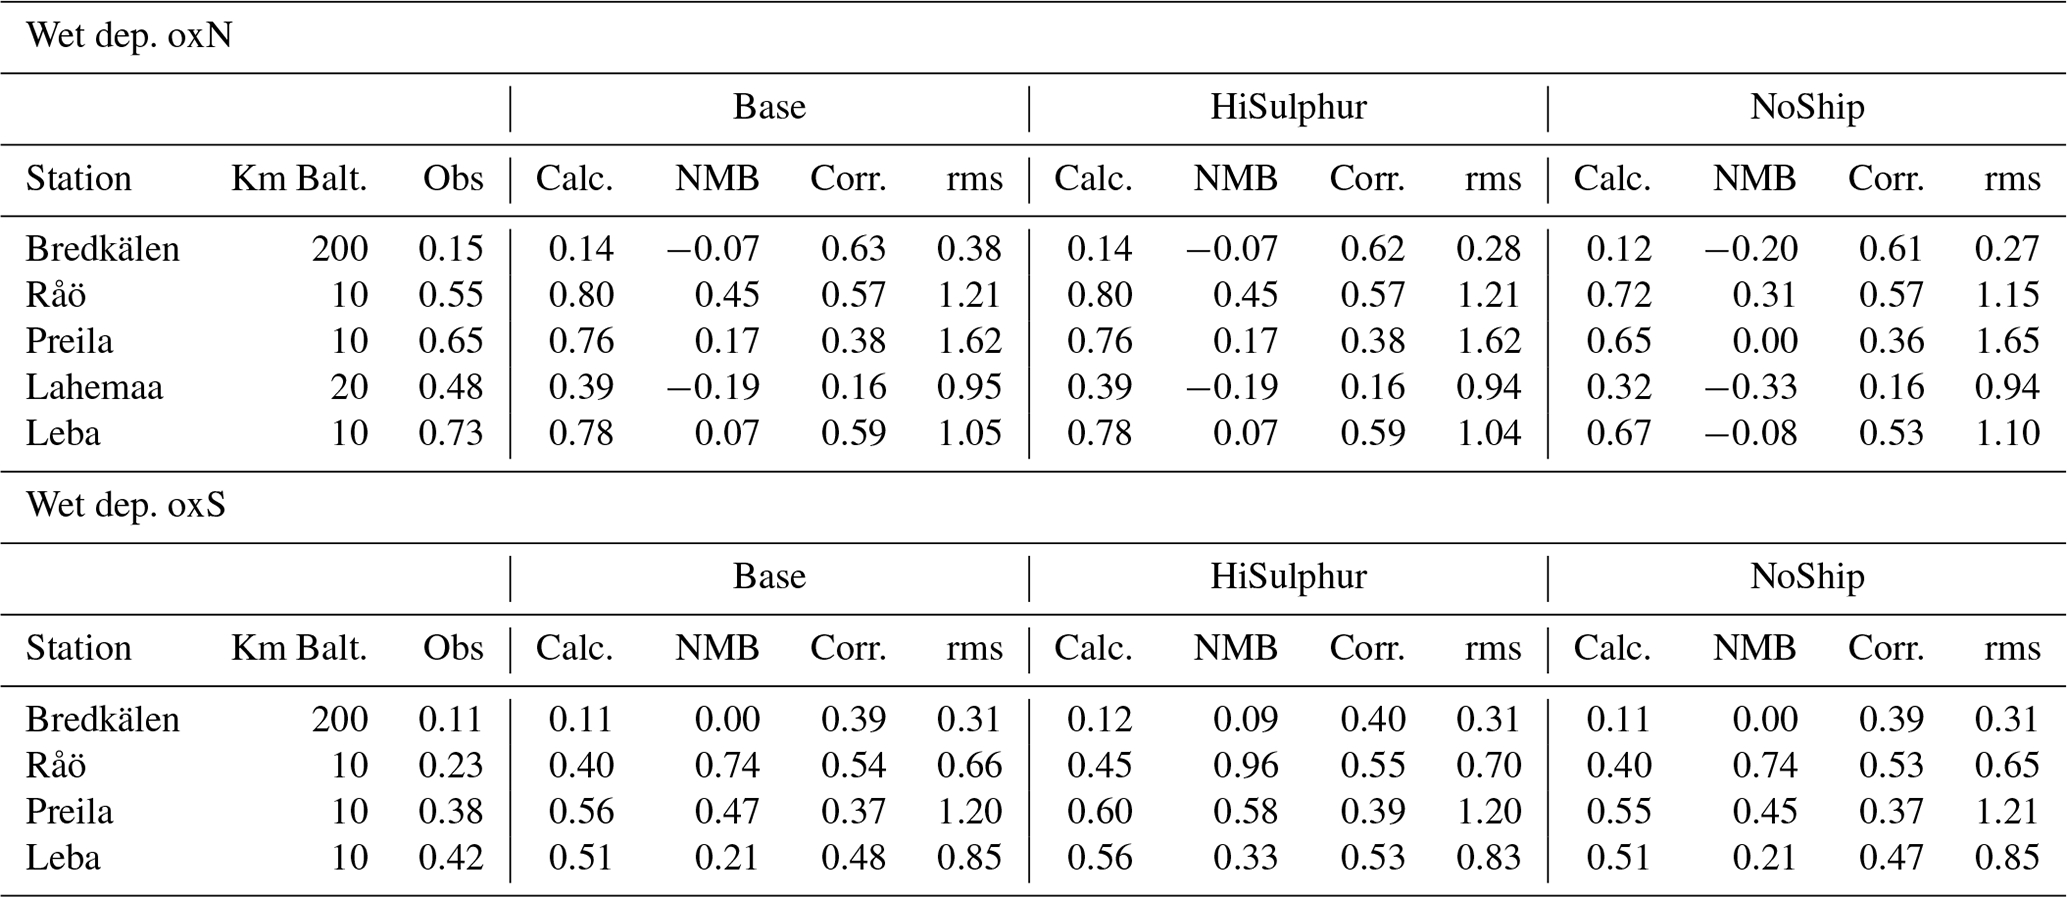
These findings for the depositions of oxidised nitrogen and sulfur are also illustrated in Table 3, where measured concentrations in precipitation at sites located in the BAS coastal regions are compared to the Present_Base, Present_NoShip, and Present_HiSulphur model calculations. Compared to Present_Base, averaged concentrations in precipitation are about 14 % lower for oxidised nitrogen when BAS ship emissions are excluded (Present_Base–Present_NoShip). The effects of the stricter SECA regulations are demonstrated by an increase of about 9 % in the calculated concentrations of oxidised sulfur in precipitation in the Present_HiSulphur scenario compared to the Present_Base calculation.
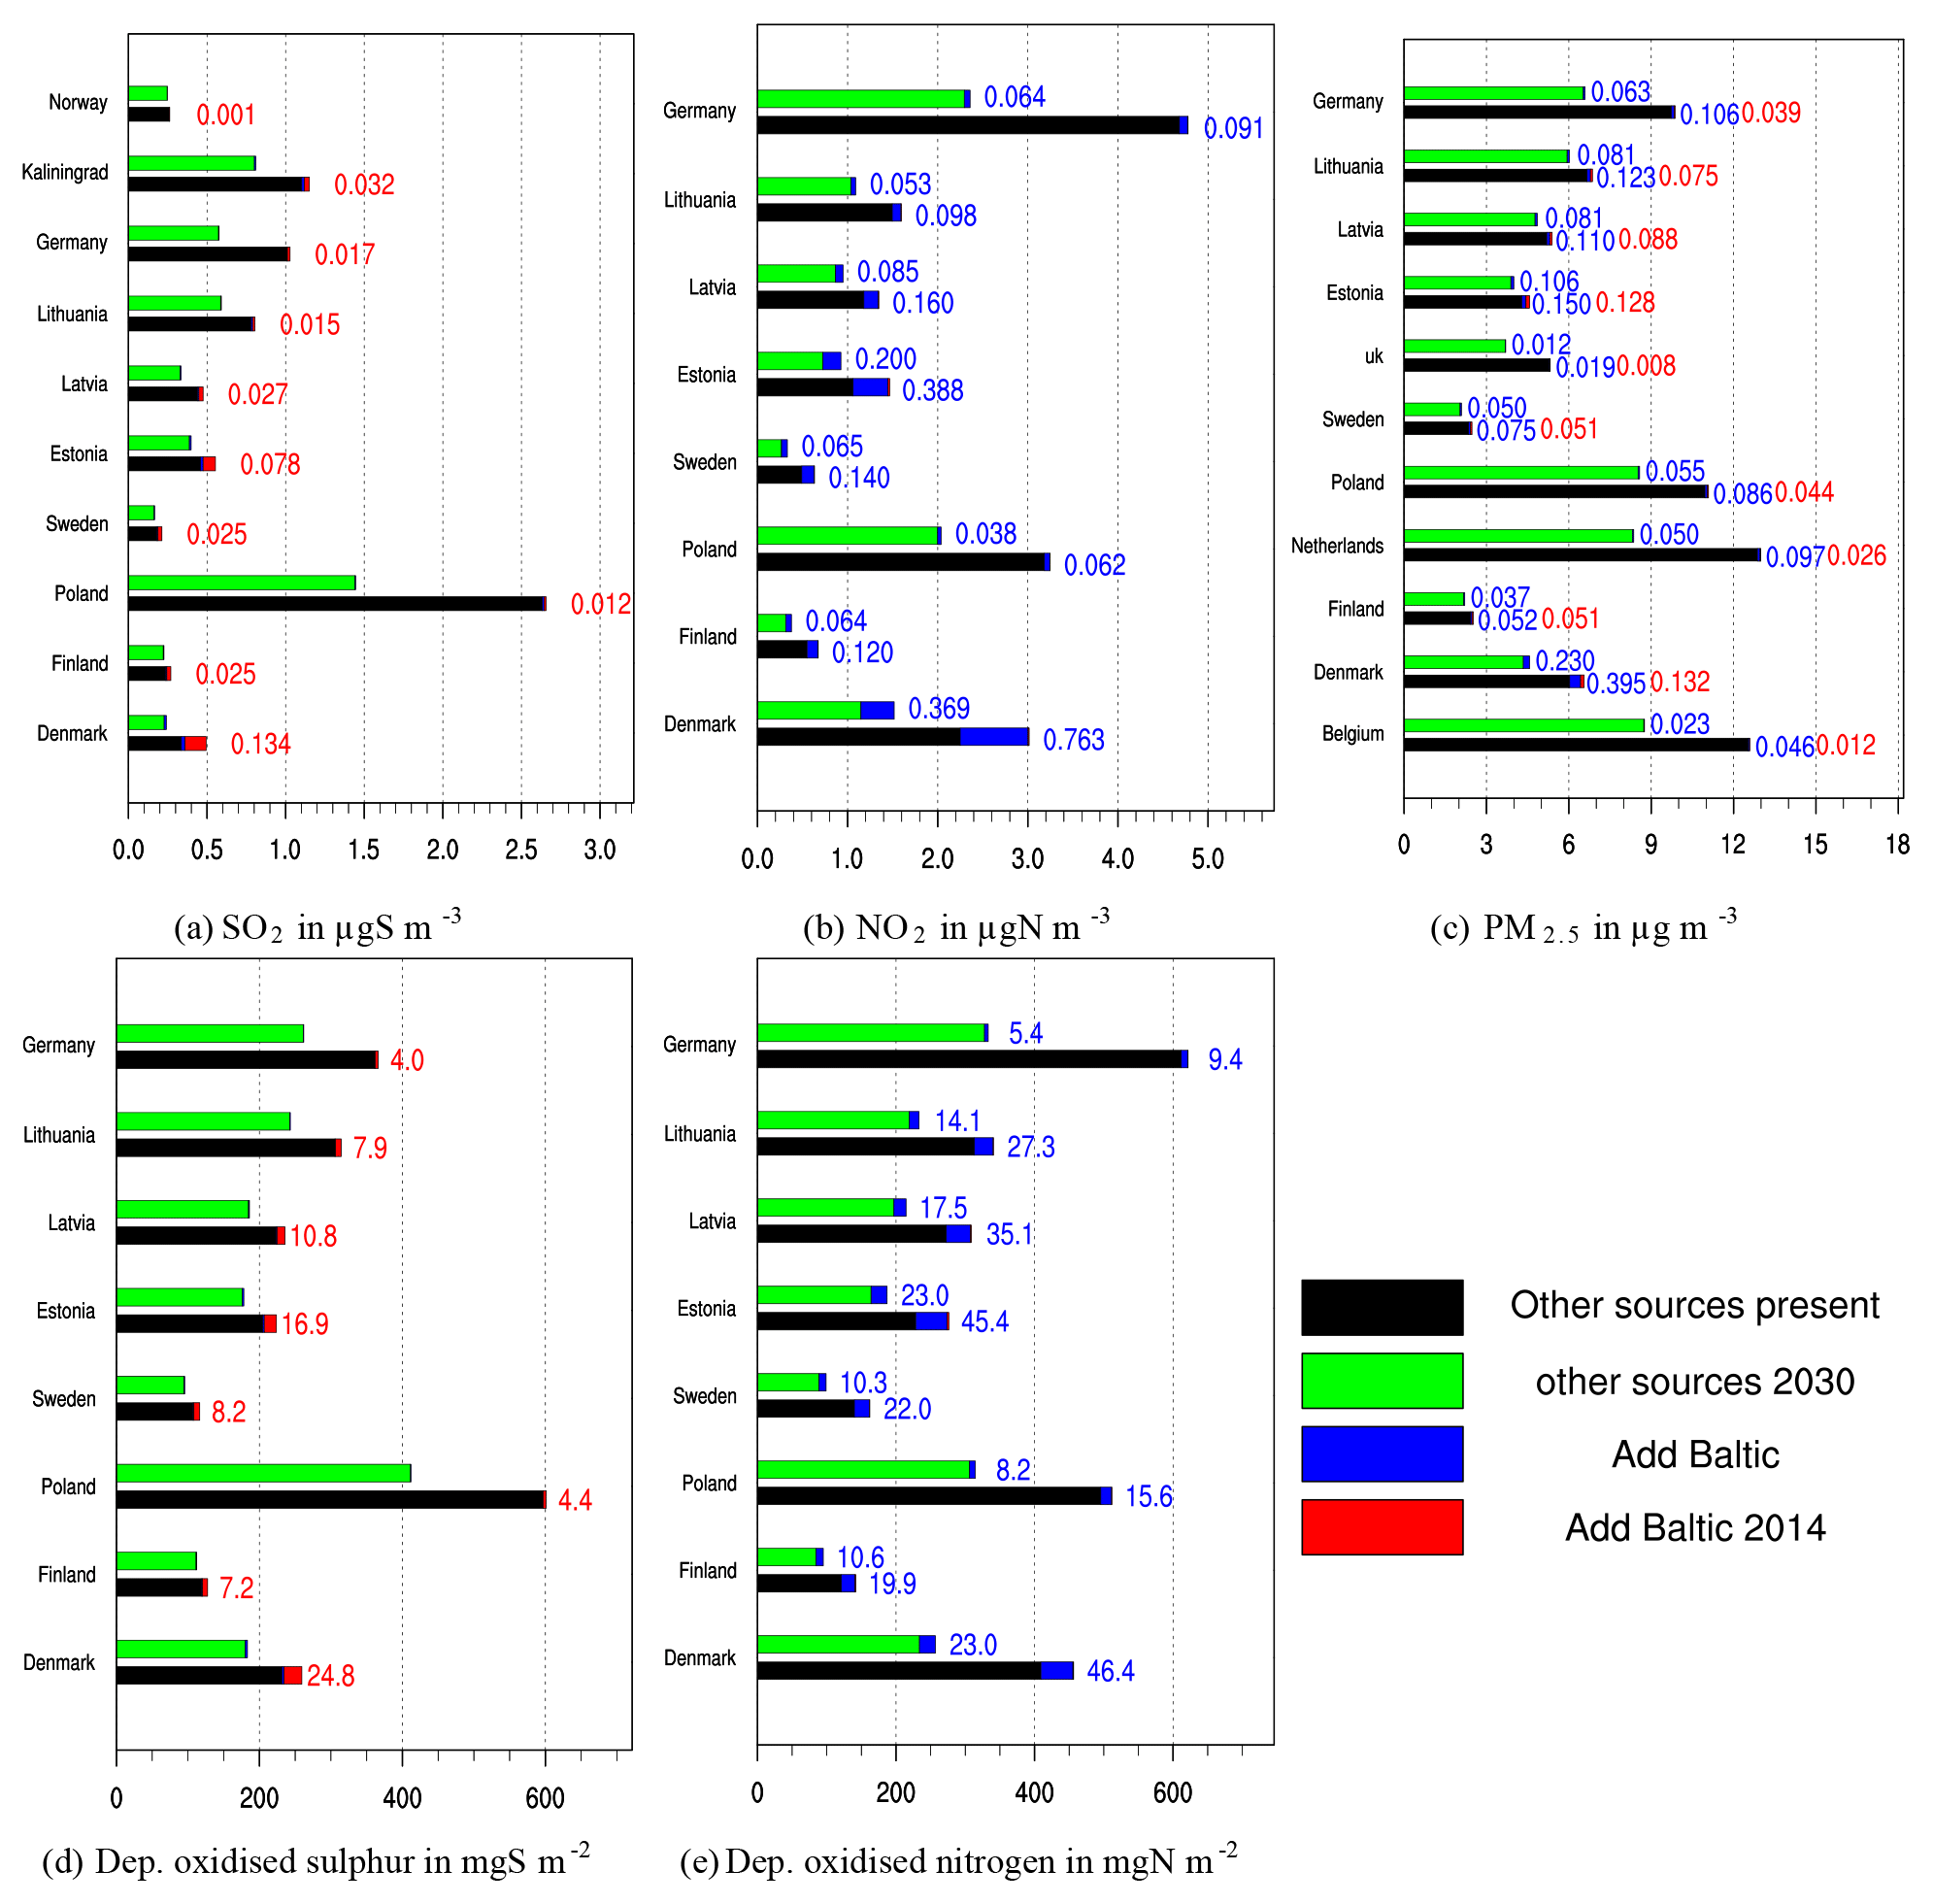
Figure 3For each country, the upper bar shows the future (2030) case and the lower bar the present case country average concentration. (a) SO2, (b) NO2, (c) PM2.5, and depositions of oxidised sulfur (d) and oxidised nitrogen (e). The black and green bars represent the Present_NoShip and Future_NoShip calculations, respectively. The additional contributions from BAS (Add Baltic) are shown in blue and the additional effect assuming high sulfur fuel emissions (Add Baltic 2014) in red. (These are also given as numbers. Numerical values for NO2 Add Baltic 2014 and for SO2 Add Baltic are not given as they are very small.)
3.3 Contributions to individual countries from BAS shipping.
Figure 3 shows the concentrations of NO2, SO2, and PM2.5 and the depositions of oxidised sulfur and oxidised nitrogen averaged over the individual countries bordering the BAS. The black (Present) and green (Future) bars represent contributions from all other sources (both anthropogenic and natural) than BAS shipping. The blue part of the bars represents the (present and future) contributions from BAS shipping calculated as Base–NoShip, where Base can be either Present_Base or Future_Base and NoShip can be either Present_NoShip or Future_NoShip. The sum of the black or blue and green parts of the bars then adds up to the total concentrations and depositions averaged over the individual countries bordering the BAS for the Present_Base and Future_Base scenarios. The red part is the additional BAS contributions assuming BAS ship emissions at 2014 levels calculated as Present_HiSulphur–Present_Base. The calculations are made assuming linearity. Previous calculations, adding up contributions from different sources, have shown that this assumption is reasonable (Jonson et al., 2017, 2018). Irrespective of species and depositions, the largest contributions are seen for smaller countries with long coastlines exposed to the BAS such as Denmark and the Baltic states, and the least for large countries such as Germany and Poland with major parts of their areas located far from the shipping routes.
Following the expected reductions between 2016 and 2030 in both land-based and ship emissions, calculated concentrations and depositions are reduced over the 2016 to 2030 time span. For SO2 and depositions of sulfur, BAS shipping is already an insignificant source in 2016 and the differences between 2030 and 2016 are almost entirely caused by changes in land-based emissions. For NO2 concentrations and depositions of oxidised nitrogen, reductions in land-based and BAS ship emissions both contribute to the improvements in pollution levels. In the BAS region the fractional reductions in future concentrations attributed to (mainly) land-based and BAS ship emissions are roughly in the same range.
The largest contributions from BAS shipping are seen for NO2 (Fig. 3b), depositions of oxidised nitrogen (Fig. 3c), and partially also for SO2 (Fig. 3a) when assuming 2014 emissions (Present_HISulphur). However, for SO2 calculated contributions are insignificant following the implementation of the stricter SECA in 2015. The same conclusion also holds for sulfur depositions (Fig. 3d). PM2.5 contributions from BAS shipping are markedly smaller than for NO2. Contributions are higher when assuming Present_HiSulphur emissions. After the implementation of stricter SECA regulations in 2015, PM2.5 from shipping mainly originates from NO2 and, in part, primary PM emissions. As shown in Fig. 1d, e, elevated PM2.5 concentrations from BAS shipping are mainly seen in coastal zones close to shipping lanes. Much of these coastal zones is densely populated. When assessing the health effects of PM in a forthcoming companion paper (Barregård et al., 2019), population-weighted PM2.5 concentrations are used.
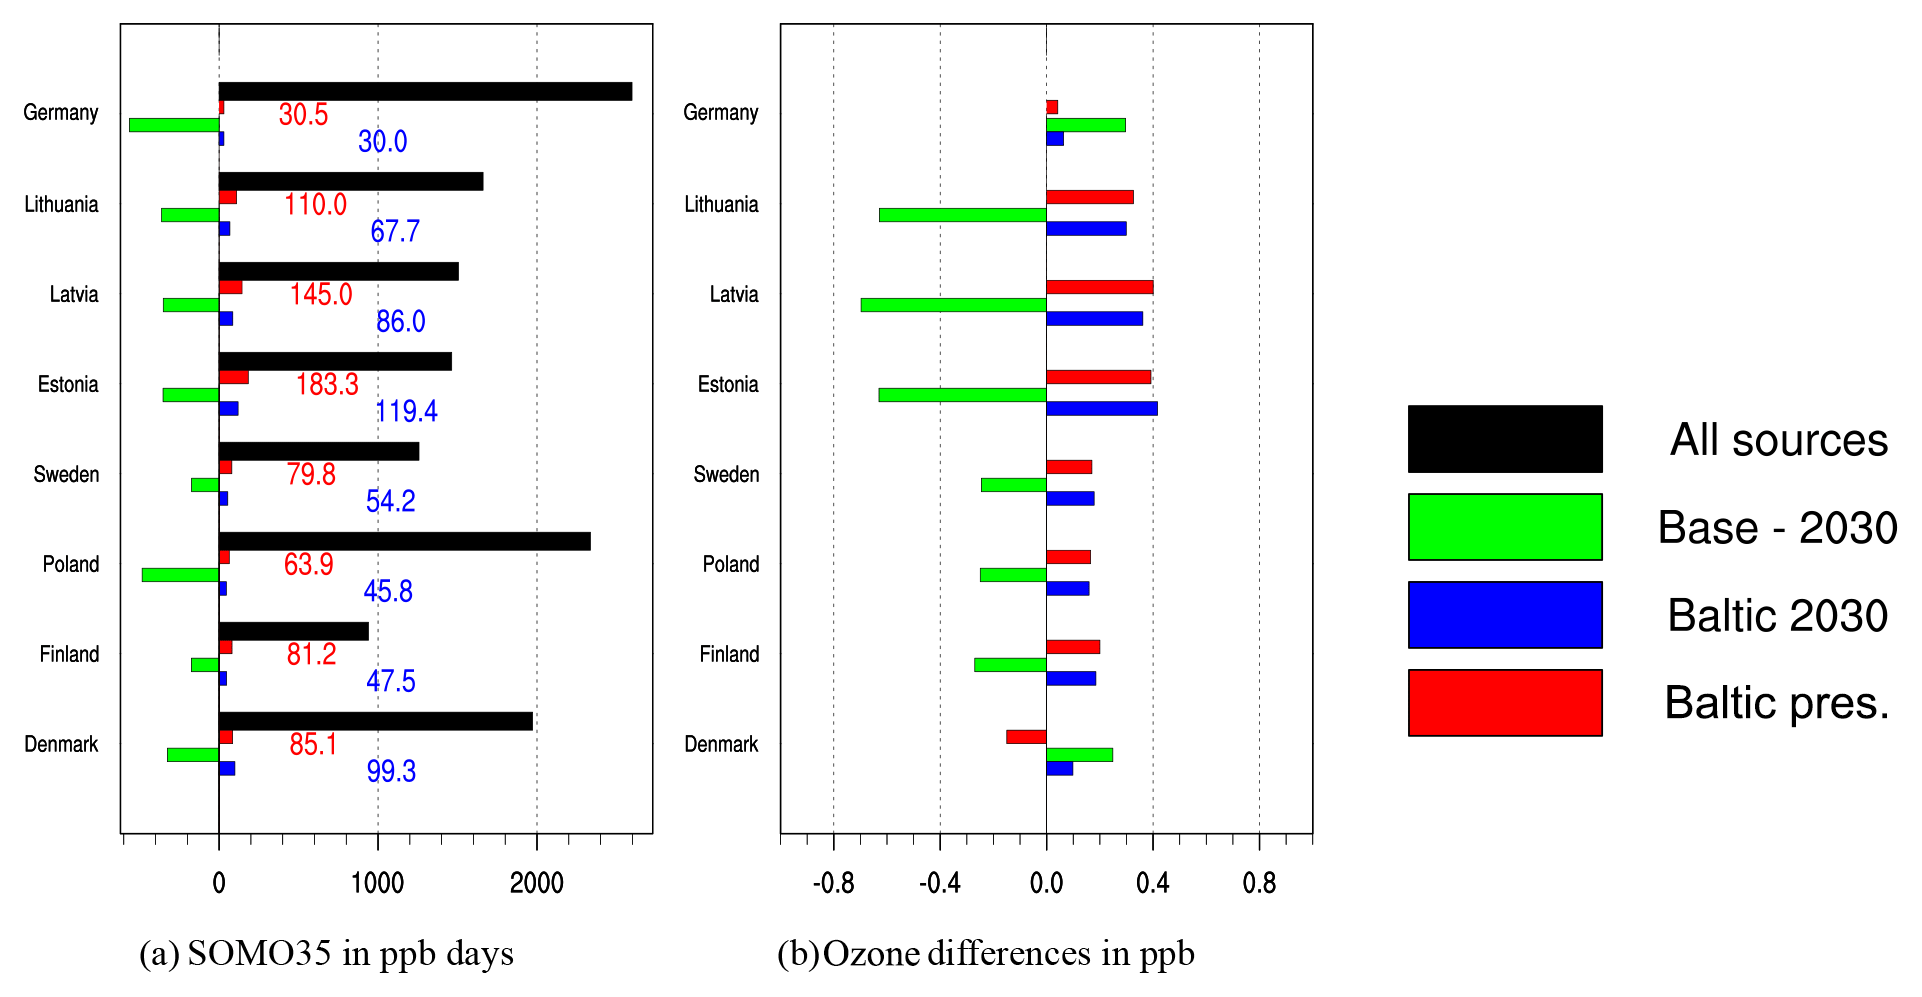
Figure 4(a) SOMO35 in ppb days where black bars represent Present_Base levels. (b) Changes in annual ozone in ppb (annual average ozone is in the 30–35 ppb range in all countries). For both SOMO35 and annual ozone green bars represent changes in levels from 2016 to 2030 (Future_Base–Present_Base), red bars contributions from BAS (Present_Base–Present_NoShip), and blue bars contributions from BAS in 2030 (Future_Base–Future_NoShip).
Figure 4 (left) shows calculated SOMO351 as an average for countries around the Baltic Sea and the effect of BAS shipping. The effects on annually averaged ozone are shown in the same figure (right). For all countries annually averaged ozone is in the 33–37 ppb range. For most countries both SOMO35 and annually averaged ozone increase only slightly as a result of BAS shipping, and relatively more so for SOMO35 than for annually averaged ozone. However, in Denmark emissions from BAS shipping result in a decrease in annually averaged ozone with present emissions.
Changes in ozone are caused by a combination of ozone production, mainly in the summer months, and ozone titration by NO, mainly in winter. In winter reductions in NOx emissions (including reductions in emissions from ships) result in a decrease in ozone titration and subsequently higher ozone levels. This is illustrated in Fig. A5a with ozone winter levels in 2030 higher than in 2016 throughout northern and central Europe. Ozone production dominates in the summer months (Fig. A5b) and, with the exception of a region around the English Channel, the expected reductions in the emissions of ozone precursors result in lower ozone levels. For SOMO35 (Fig. A5c, d) the relative increase in winter is much smaller as ozone is largely below the 35 ppb threshold. In summer the increase in ozone from present to future caused by less titration around the English Channel is confined to a much smaller area. As a result annually averaged ozone production and titration in the BAS region partially cancel out, and for some regions and countries titration dominates the annual values. As shown in Fig. 4 (green bars), the expected emission reductions (land-based and from ships) from the years 2016 to 2030 result in overall reductions in ozone levels (both annually averaged ozone and SOMO35) for all countries except Germany and Denmark, where calculated average ozone levels are higher in 2030 (but SOMO35 is reduced). In 2030 the additional emissions from BAS shipping result in increased SOMO35 and annually averaged ozone in all countries. (blue bars in Fig. 4). These results are in good agreement with detailed model calculations with projected emission changes, demonstrating a future transition from NMVOC2-limited to NOx-limited regimes in large parts of Europe north of the Alps (Beekmann and Vautard, 2010).
It has to be noted that in our model calculations the ship emissions are instantly diluted throughout the model grid cell where the emissions occur. Previous studies (Vinken et al., 2011; Huszar et al., 2010) have shown that this could lead to an overestimation of ozone formation. However, Vinken et al. (2011) found that the overestimation caused by instant dilution was small in polluted regions, such as the central parts of the BAS.
Our calculations clearly show that, following the stricter SECA regulations from 1 January 2015, sulfur emissions from BAS shipping now contribute little to depositions of oxidised sulfur and PM2.5 concentrations in air. This is in contrast to pre-2015 conditions when less stringent sulfur regulations were in place, and even more compared to pre-2011 conditions when up to 1.5 % in sulfur was allowed in marine fuels in the SECAs.
Still, emissions of NOx and particles from BAS shipping continue to be high, causing health problems and other detrimental impacts on the environment in the BAS region. At present emission levels, particles originating from BAS shipping are mainly formed from NOx emissions and partially by primary particles other than SO4.
Currently very few openly available emission factor data exist for marine diesels using ultra-low sulfur heavy fuel oil and covering the whole engine load range from zero to 100 %. Hypothetically, with these cases STEAM calculates the SOx emission factor based on available sulfur in the fuel. If this was close to zero, then the SOx emission factor is very small. The conversion of fuel sulfur to sulfate has a similar mechanism, and only a small fraction of available sulfur is converted to SO4. Again, the emission factor for SO4 would be very small if the fuel sulfur content is close to zero. For other species of PM, like EC, OC, and ash, emission factors will be similar to with HFO, and thus emissions of non-sulfur particles from BAS shipping are assumed to be virtually unaffected by the SECA regulations.
EMEP source–receptor calculations for the individual countries (see EMEP country reports for the year 2016; Klein et al., 2018) show that, for many countries in the region, BAS shipping is among the five to six largest regions/countries contributing to SIA (secondary inorganic aerosol). SIA is a major constituent of PM2.5, typically ranging from about 30 % to 60 % of PM2.5 mass in (scarce) measurements and in EMEP model calculations (Tsyro et al., 2018). Other constituents in PM2.5 include sea salt and organics (both natural and anthropogenic) with no or minor contributions from shipping, as well as primary particles. As a result, the percentage contributions from BAS shipping to SIA are of the order of a factor of 2 higher than for PM2.5. As the natural part of PM2.5 (and likewise PM10) is not included in the EMEP source–receptor calculations (EMEP Status Report 1/2018, 2018), they bear some resemblance to SIA. Thus the relative contributions from BAS shipping presented here are lower than the above source–receptor calculations as compared to PM2.5 (and likewise PM10) of both anthropogenic and natural origin. In a global model calculation with ship emission from the BAS and NOS also provided by FMI, source–receptor relationships are in the same range as the reported EMEP results for 2014 and 2016 (Jonson et al., 2018). It should however be noted that the EMEP source–receptor relationships are calculated by perturbing the emissions by 15 %, whereas in this study we have excluded the emissions altogether in the NoShip scenarios.
The largest contributions from shipping are calculated for the coastal zones. Many of the larger cities in the BAS region are located in the coastal zones where contributions can be of the order of 20 % for NO2 but smaller (up to 5 %–10 %) for PM2.5. In the companion paper (Barregård et al., 2019) health effects from BAS shipping have been adjusted to the population density, resulting in a proportionally higher contribution from shipping than presented here as area-averaged concentrations.
BAS ship emissions also affect the formation of ground-level ozone. In much of the BAS region NO2 levels are already influenced by large land-based sources, and additional contributions from BAS shipping to ozone and ozone metrics, exemplified by SOMO35, are moderate and for several regions even negative. In this paper we have shown that for most countries future ozone and ozone metrics are expected to decrease from their present levels.
In addition to influencing particle formation and ozone levels, NOx emissions also contribute to the depositions of oxidised nitrogen, causing exceedances of critical loads for acidification and in particular eutrophication. Depositions do however depend on the type of land cover. In the EMEP model the calculations of dry depositions are made separately for each sub-grid land-cover classification. These sub-grid estimates are aggregated to provide output deposition estimates for broader ecosystem categories as deciduous and coniferous forests. The ecosystem-specific depositions are not shown here, but will be used in a companion paper (Repka et al., 2019) when calculating exceedances of critical loads for acidification and eutrophication.
A significant portion of the depositions of oxidised nitrogen is due to BAS shipping. This is also corroborated by the source–receptor calculations for the individual countries in Europe for 2016: see Klein et al. (2018), where they calculate that BAS shipping is the largest contributor to oxidised nitrogen deposition in Estonia (with 14 %) and among the three to five largest contributors in several other countries in the region. As discussed above, these depositions are projected to be gradually reduced following the implementation of the NECA regulations, with relative reductions largely comparable to the decrease from other anthropogenic sources.
Presently there are no further emission mitigation regulations targeted for the Baltic Sea and the North Sea apart from the NECA regulation entering into force in 2021. This regulation is expected to result in gradual reductions in PM2.5 concentrations and in depositions of nitrogen from BAS shipping, as shown in our calculations for future versus present conditions. The relative reductions are largely comparable to the decrease from other anthropogenic sources in the region. However, according to IMO (2018) the target set by the IMO is “to reduce CO2 emissions per transport work, as an average across international shipping, by at least 40 % by 2030, pursuing efforts towards 70 % by 2050, compared to 2008; and GHG emissions from international shipping to peak and decline as soon as possible and to reduce the total annual GHG emissions by at least 50 % by 2050 compared to 2008 whilst pursuing efforts towards phasing them out as called for in the vision as a point on a pathway of CO2 emissions reduction consistent with the Paris Agreement temperature goals.” It is unlikely that this goal can be reached without substantial penetration of zero emission ships. If a portion of these zero emission ships run on electricity or hydrogen in 2030 they will be zero emission also for sulfur, nitrogen, and PM2.5 (in addition to CO2), potentially resulting in reductions in these air pollutants beyond what is assumed in the Future_Base scenario in this paper.
The EMEP model is available as open source (see https://github.com/metno/emep-ctm, code version rv4.14, last access: 29 October 2019) (EMEP MSC-W, 2019, https://doi.org/10.5281/zenodo.3355041).
Model output data are available upon request to the first author.
This Appendix contains time-series plots for NO2, SO2, and PM2.5 for the meteorological year 2016. Measured and model-calculated annual average concentrations, correlations, and rms errors are listed in Table 2 in the main text. For many sites the time series for the different model scenarios are virtually identical, and the HiSulphur and NoShip scenarios are masked by the Base scenario.
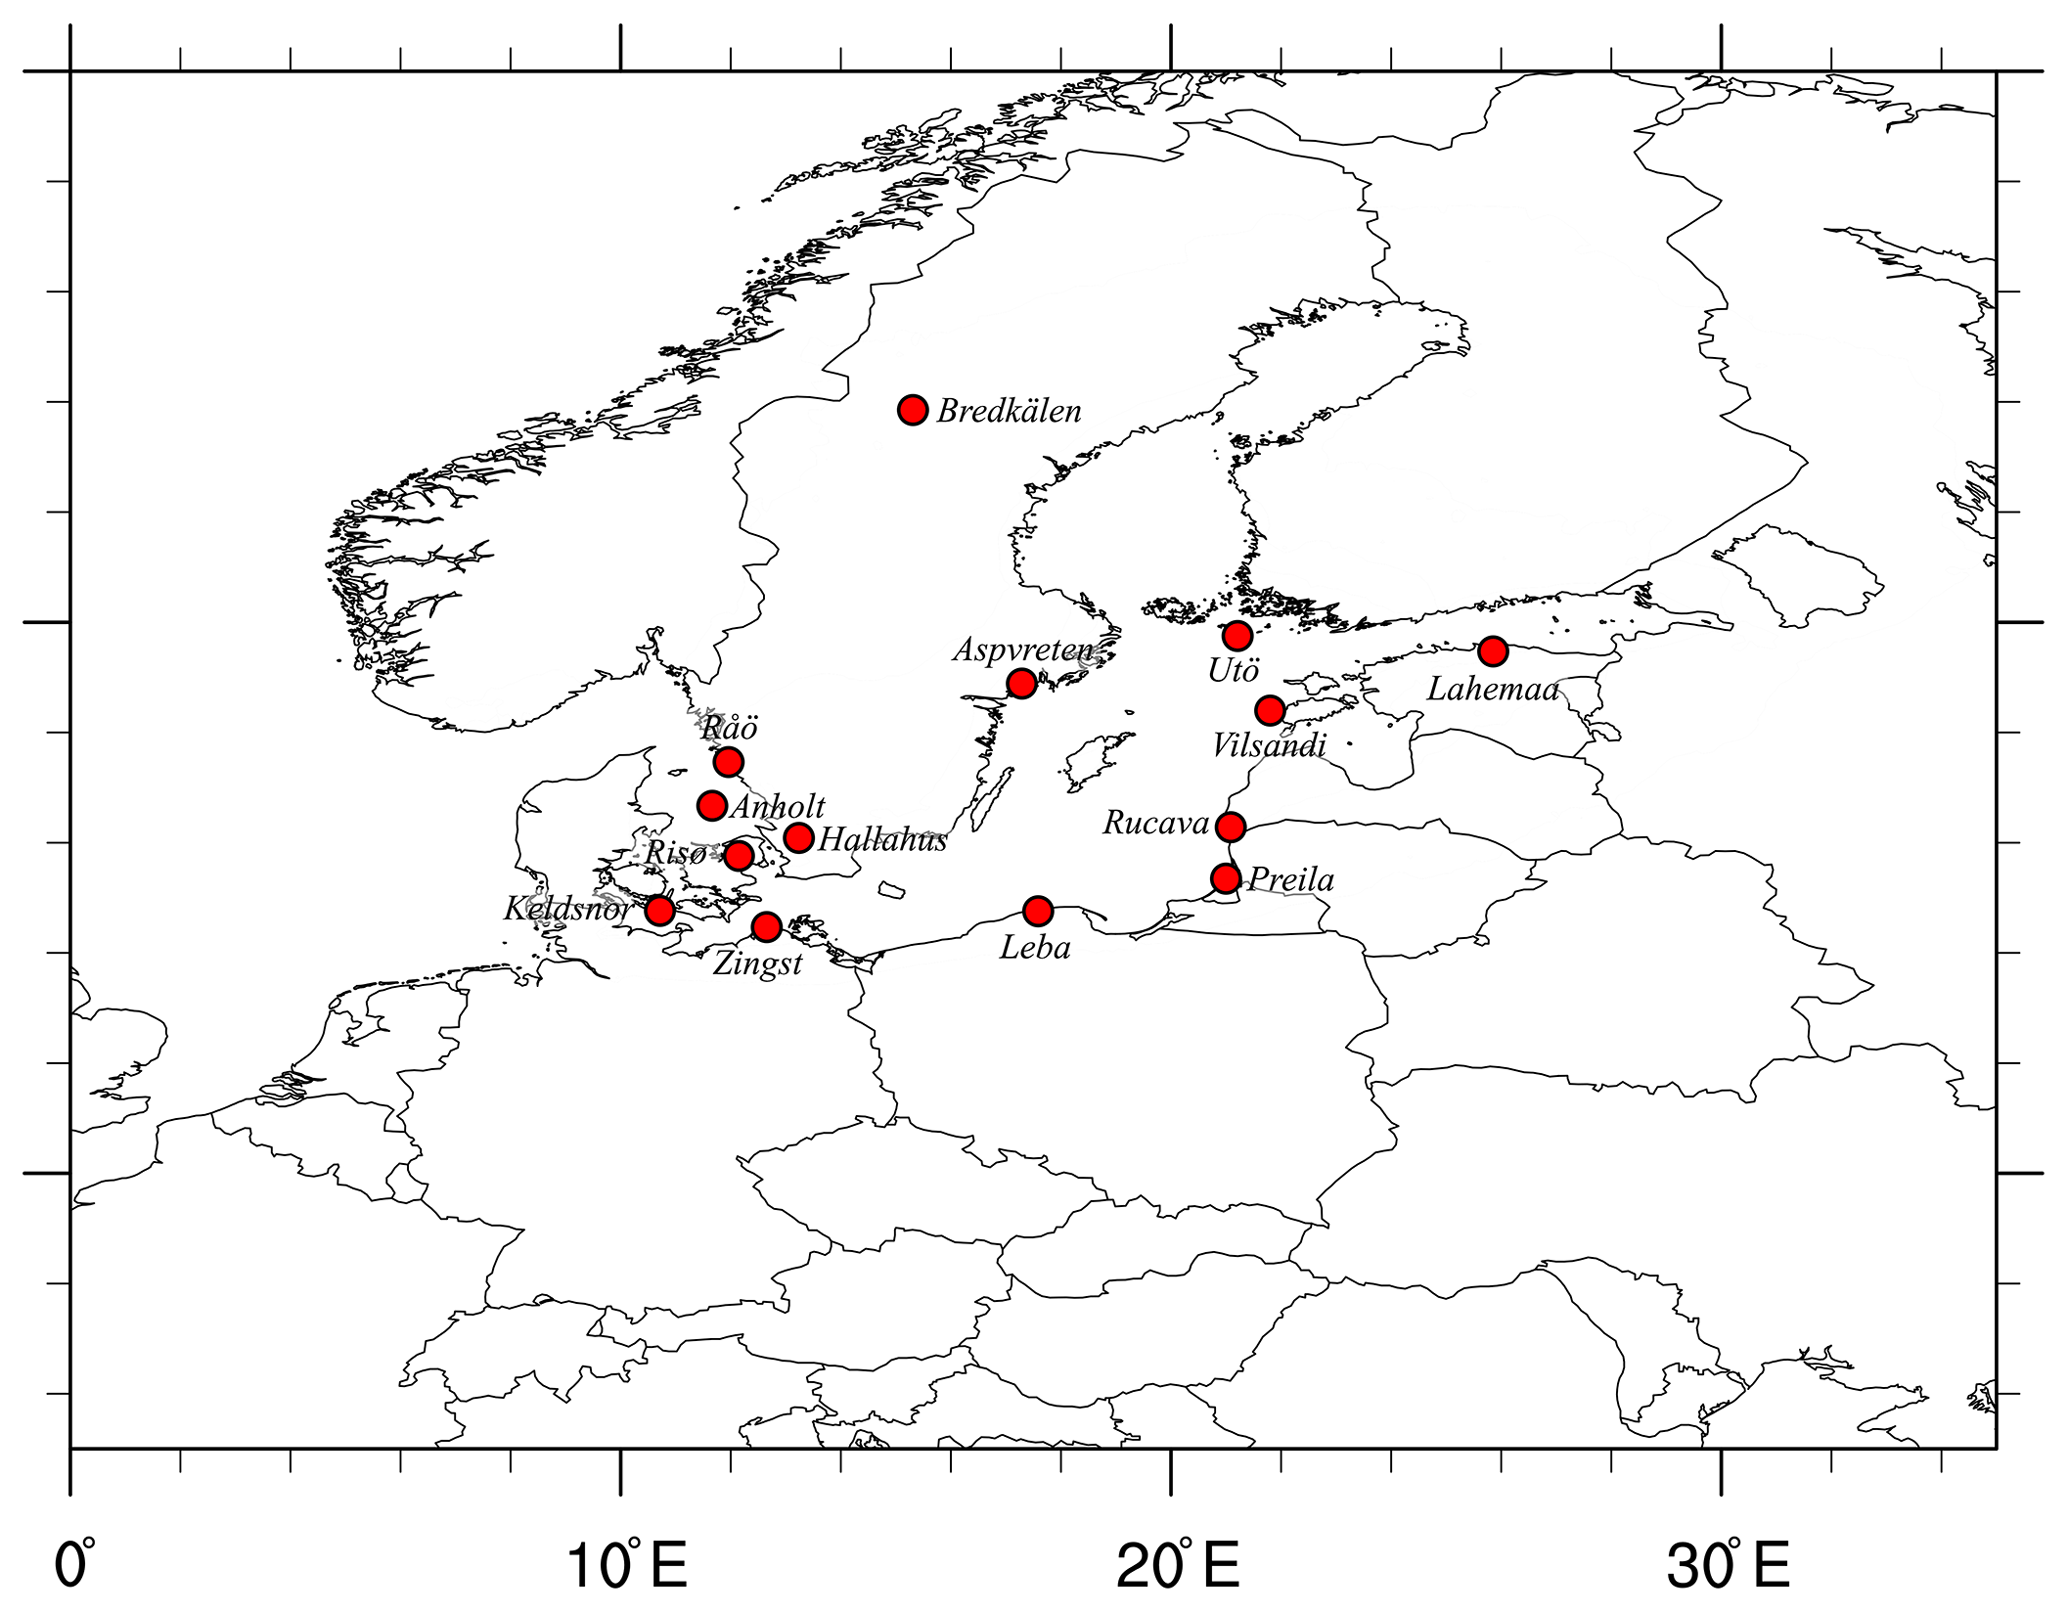

Figure A2Measured and model-calculated present (2016) concentrations of NO2. Present model-calculated results are shown for the Base, HiSulphur, and NoShip scenarios. The HiSulphur calculations are not visible as they are almost identical to Present_Base.
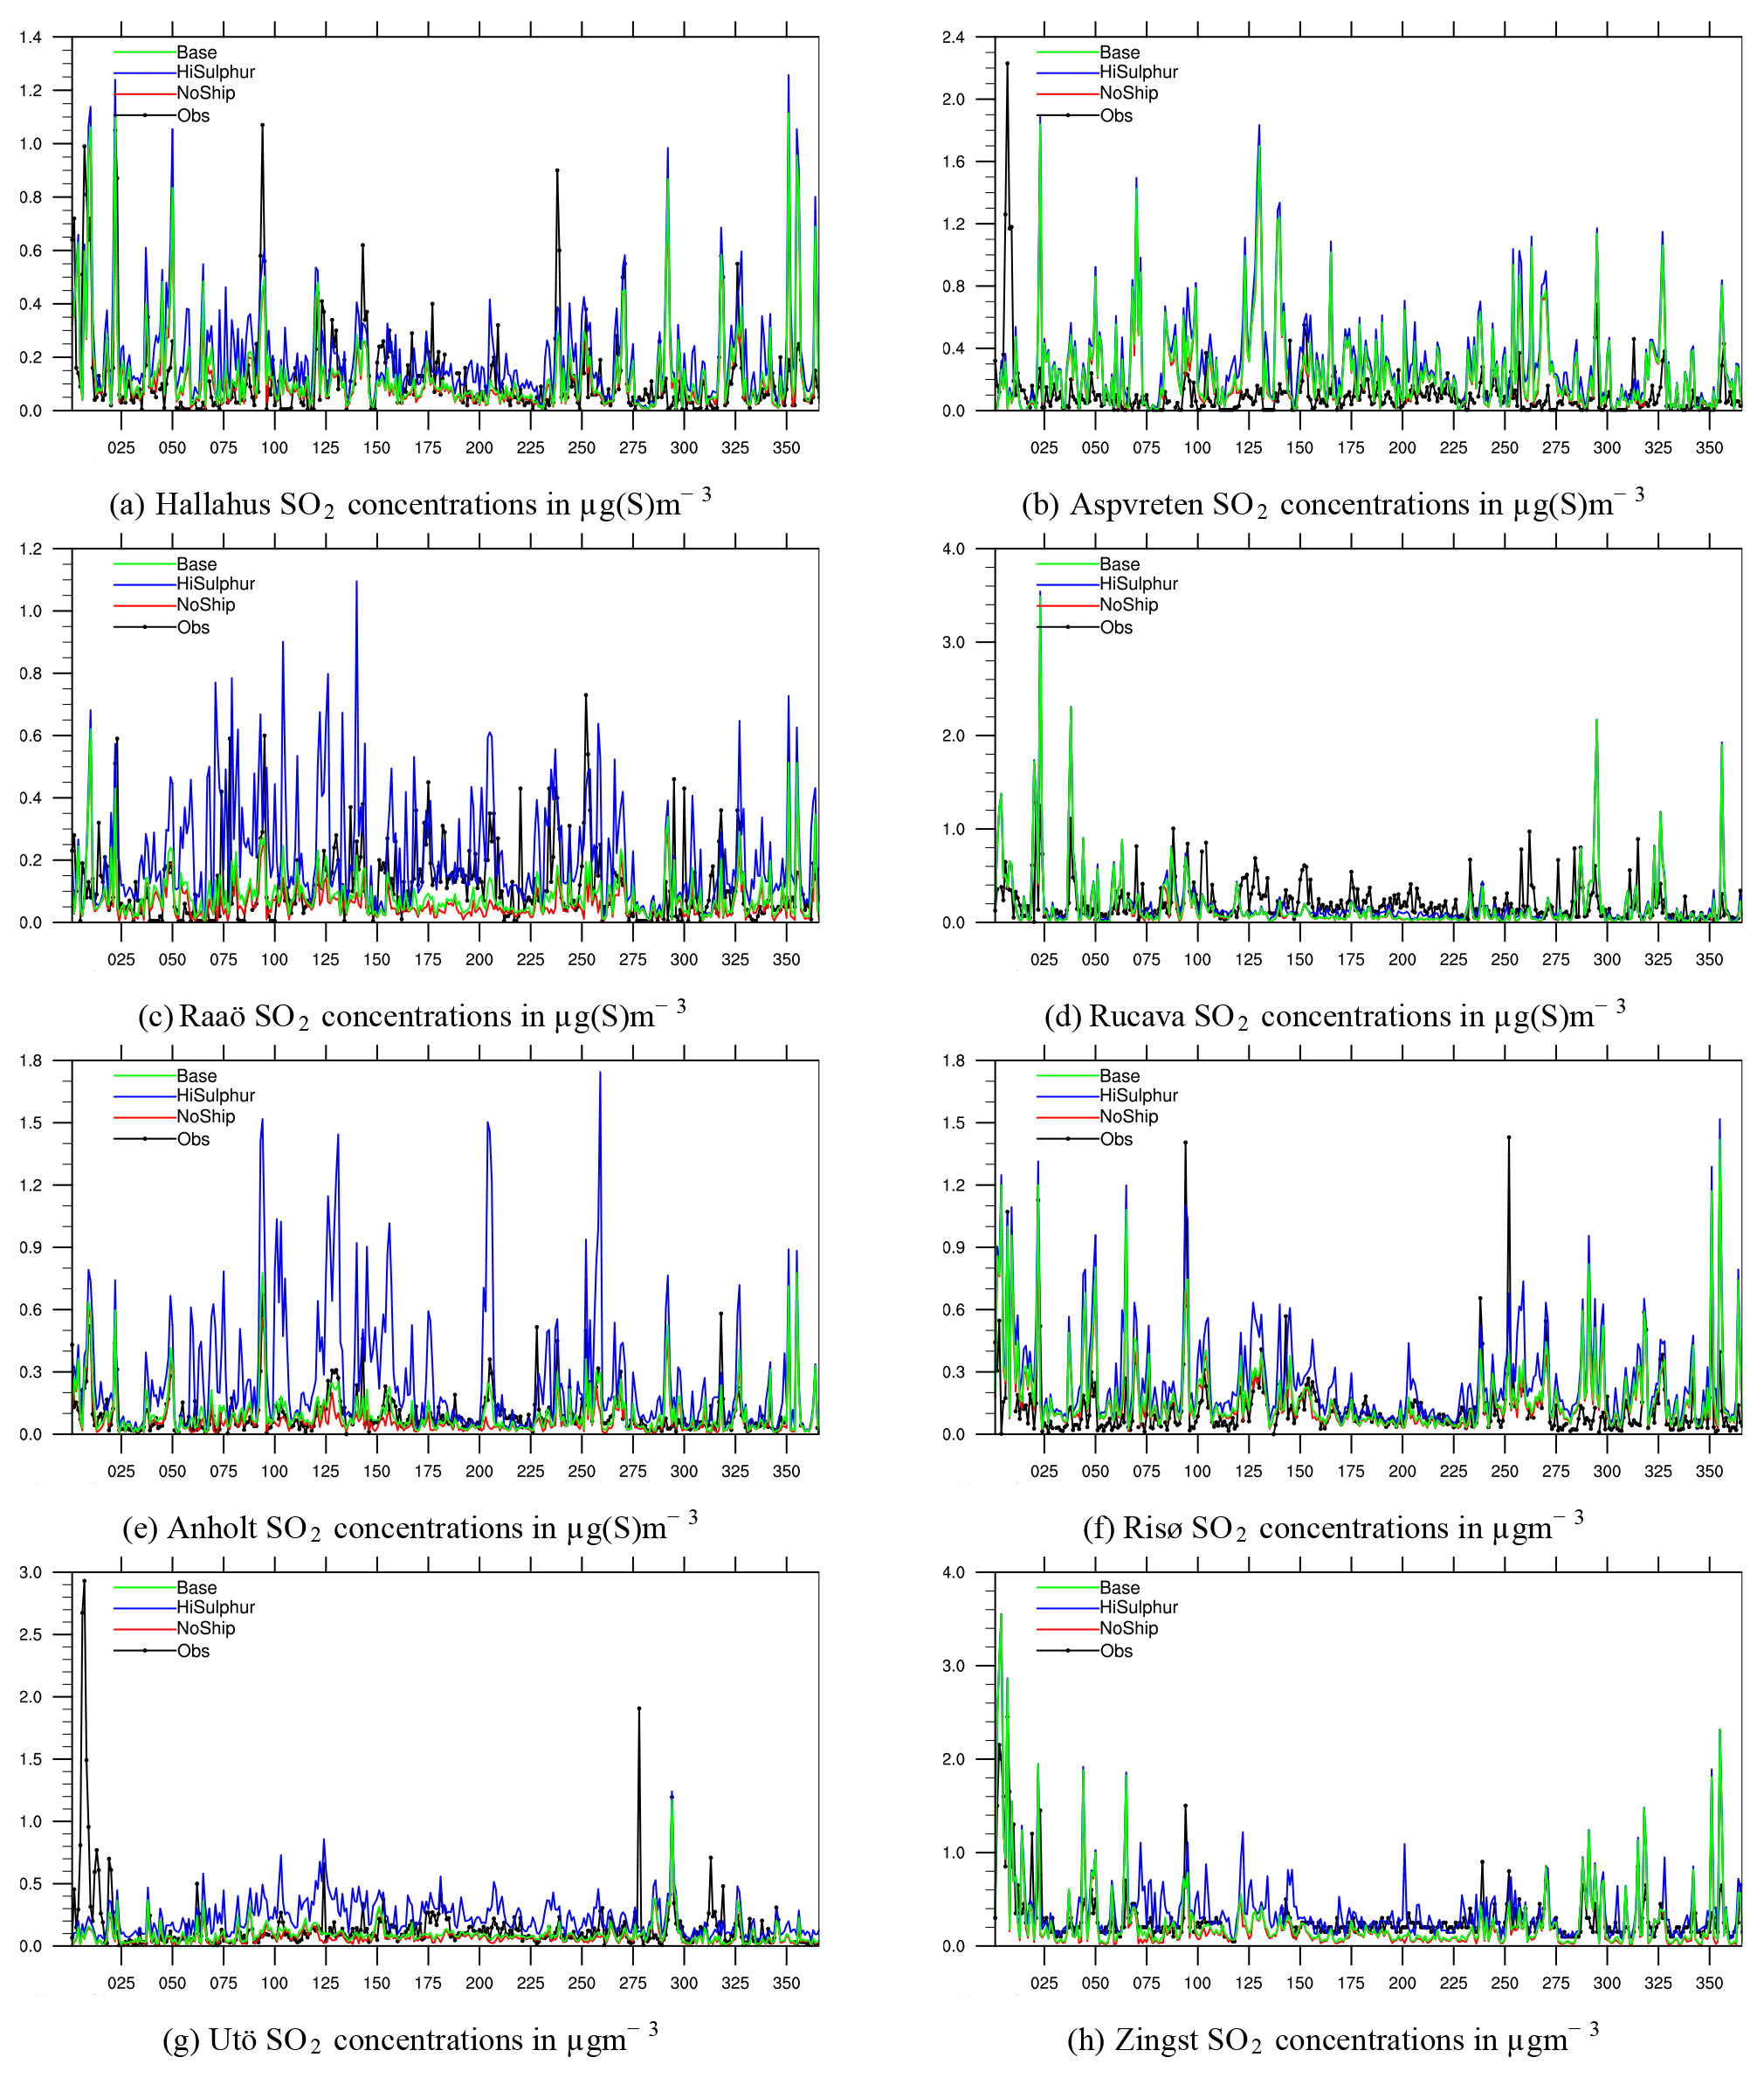
Figure A3Measured and model-calculated present (2016) concentrations of SO2. Present model-calculated results are shown for the Base, HiSulphur, and NoShip scenarios.
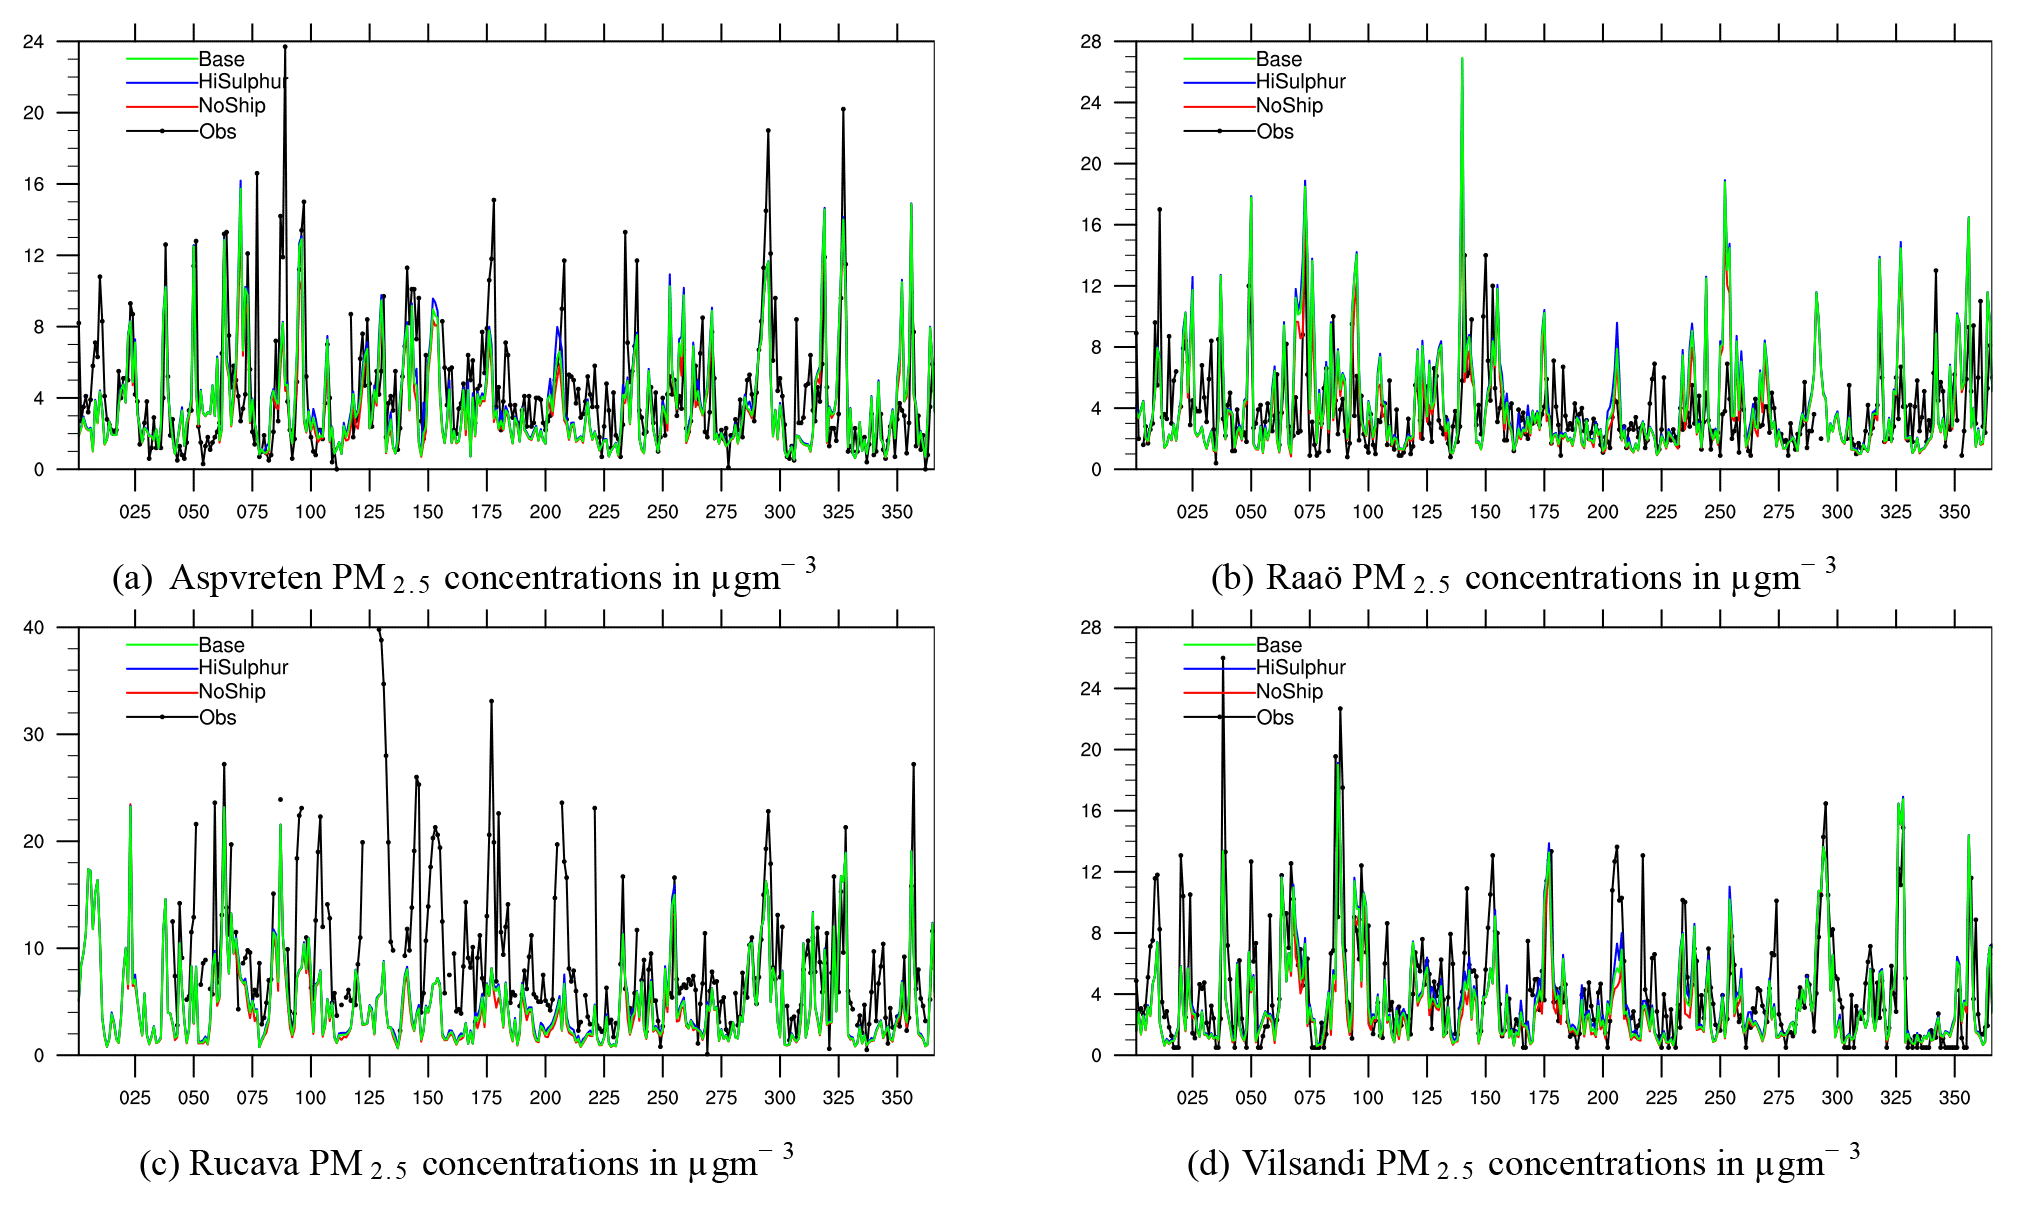
Figure A4Measured and model-calculated present (2016) concentrations of PM2.5. Present model-calculated results are shown for the Base, HiSulphur, and NoShip scenarios.
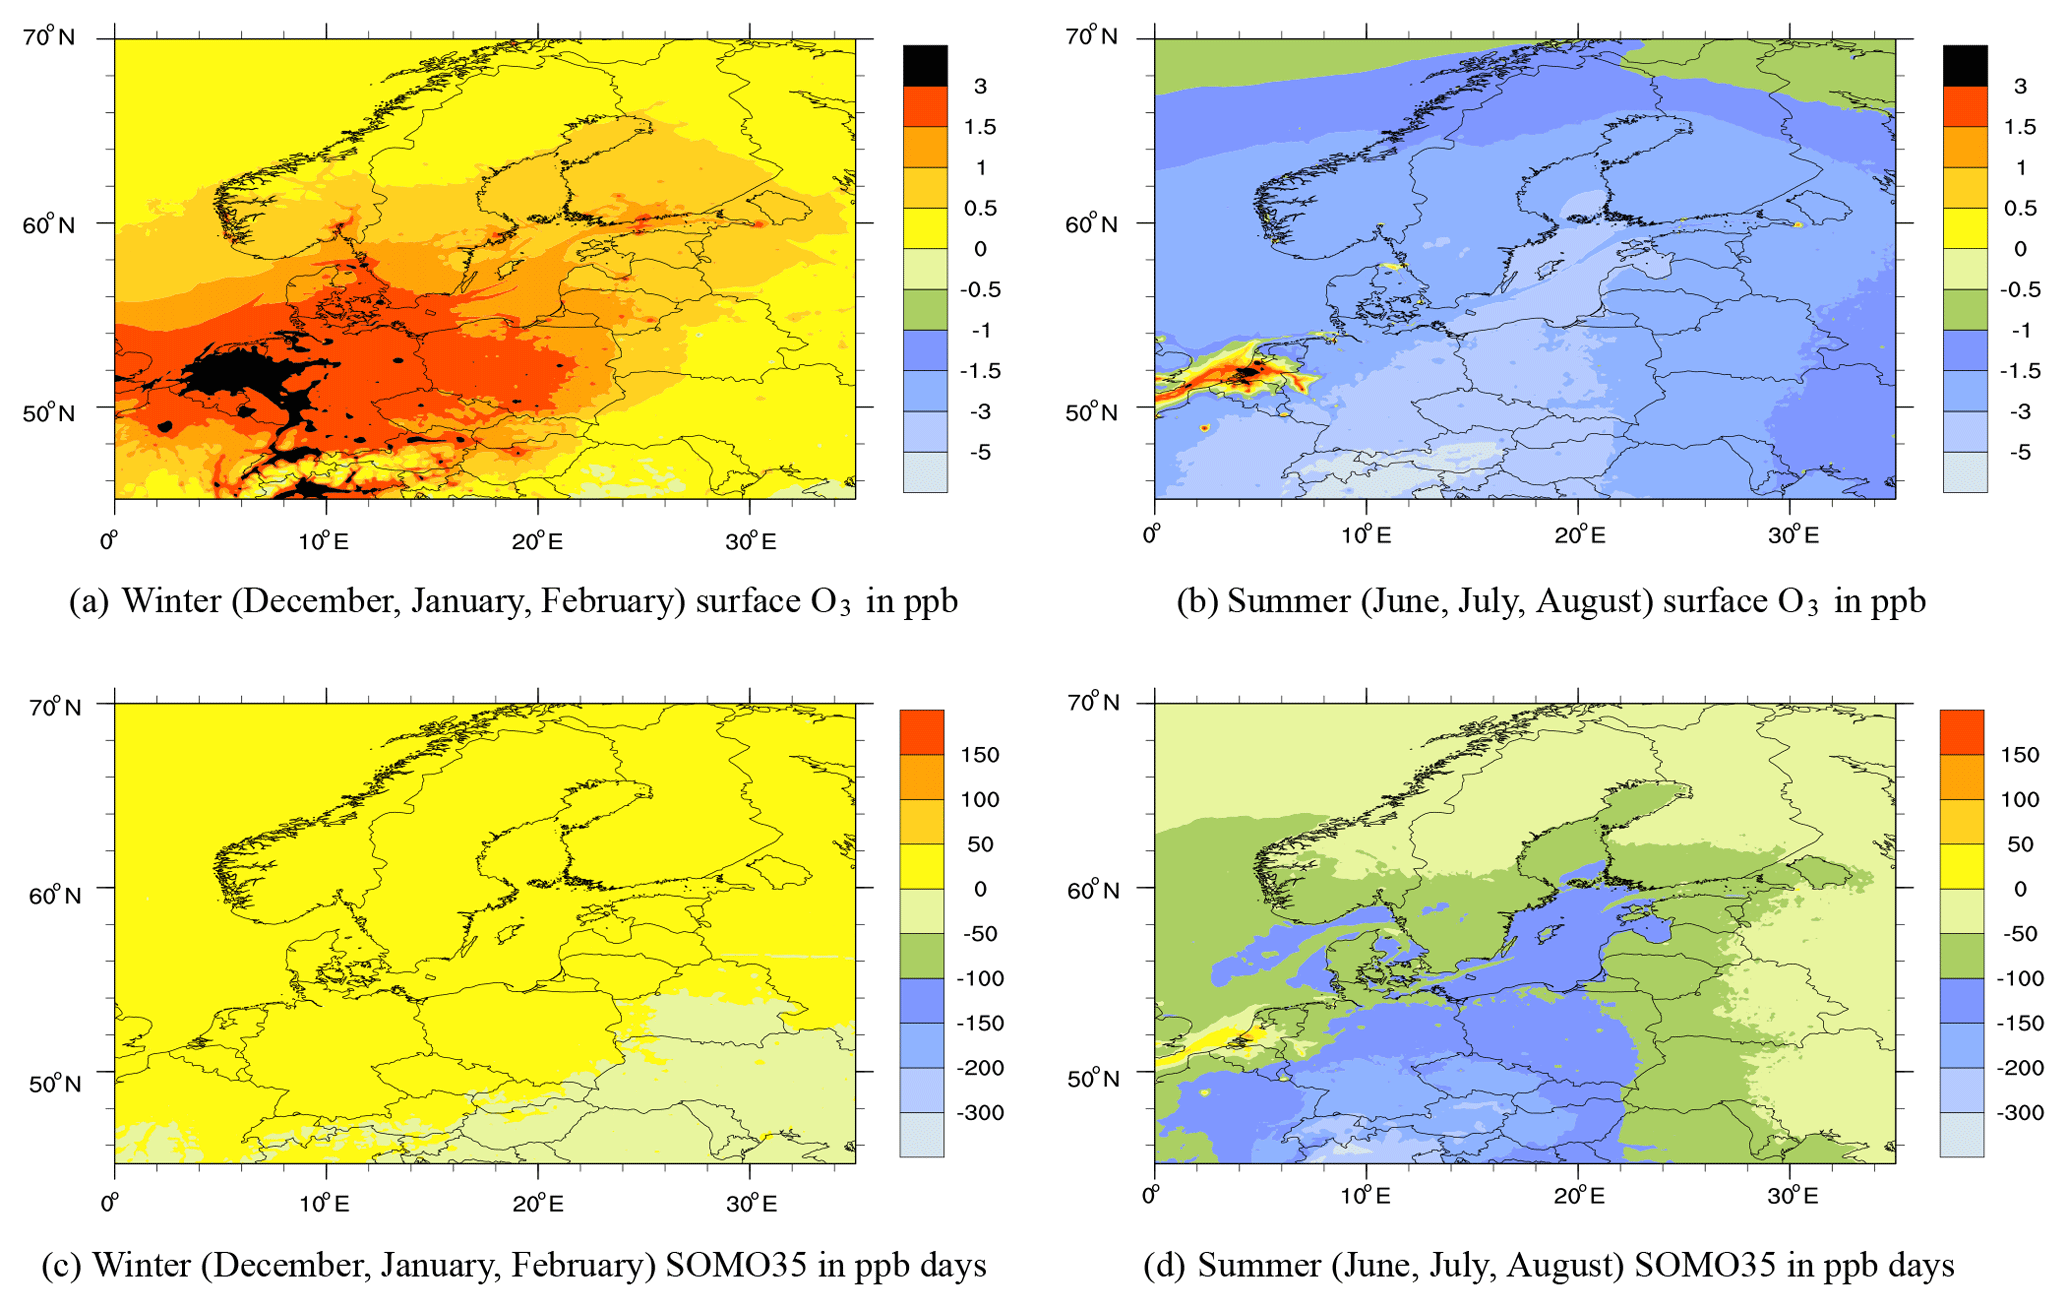
Figure A5Difference between Future_Base and Present_Base for average surface ozone in winter (a) and summer (b) and for SOMO35 in winter (c) and summer (d).
JEJ made the model calculations and wrote most of the paper. MG assisted in designing the model scenarios and in writing the paper. JPJ and LJ provided the ship emission data for both the present and future scenarios. JPJ also assisted in the writing of the paper.
The authors declare that they have no conflict of interest.
This article is part of the special issue “Shipping and the Environment – From Regional to Global Perspectives (ACP/OS inter-journal SI)”. It is not associated with a conference.
Computer time for EMEP model runs was supported by the Research Council of Norway through NOTUR project EMEP (NN2890K) for CPU and NorStore project European Monitoring and Evaluation Programme (NS9005K) for storage of data and partially by UNECE through the EMEP programme under CLRTAP. Surface measurements have been made available through the EBAS web site at http://ebas.nilu.no/Default.aspx, last access: 27 February 2019.
This research has been supported by European Union (European Regional Development Fund) project EnviSum (grant no. ERDF Ro27).
This paper was edited by Huan Liu and reviewed by three anonymous referees.
Angelbratt, J., Mellqvist, J., Simpson, D., Jonson, J. E., Blumenstock, T., Borsdorff, T., Duchatelet, P., Forster, F., Hase, F., Mahieu, E., De Mazière, M., Notholt, J., Petersen, A. K., Raffalski, U., Servais, C., Sussmann, R., Warneke, T., and Vigouroux, C.: Carbon monoxide (CO) and ethane (C2H6) trends from ground-based solar FTIR measurements at six European stations, comparison and sensitivity analysis with the EMEP model, Atmos. Chem. Phys., 11, 9253–9269, https://doi.org/10.5194/acp-11-9253-2011, 2011. a
Barregård, L., Molnàr, P., Jonson, J. E., and Stockfeld, L.: Impact on population health of emissions of pollutants from Baltic shipping, Int. J. Env. Res. Pub. He., 59, 11, https://doi.org/10.3390/ijerph16111954, 2019. a, b, c
Beekmann, M. and Vautard, R.: A modelling study of photochemical regimes over Europe: robustness and variability, Atmos. Chem. Phys., 10, 10067–10084, https://doi.org/10.5194/acp-10-10067-2010, 2010. a
Brandt, J., Silver, J. D., Christensen, J. H., Andersen, M. S., Bønløkke, J. H., Sigsgaard, T., Geels, C., Gross, A., Hansen, A. B., Hansen, K. M., Hedegaard, G. B., Kaas, E., and Frohn, L. M.: Assessment of past, present and future health-cost externalities of air pollution in Europe and the contribution from international ship traffic using the EVA model system, Atmos. Chem. Phys., 13, 7747–7764, https://doi.org/10.5194/acp-13-7747-2013, 2013. a
Claremar, B., Haglund, K., and Rutgersson, A.: Ship emissions and the use of current air cleaning technology: contributions to air pollution and acidification in the Baltic Sea, Earth Syst. Dynam., 8, 901–919, https://doi.org/10.5194/esd-8-901-2017, 2017. a
Colette, A., Granier, C., Hodnebrog, Ø., Jakobs, H., Maurizi, A., Nyiri, A., Bessagnet, B., D'Angiola, A., D'Isidoro, M., Gauss, M., Meleux, F., Memmesheimer, M., Mieville, A., Rouïl, L., Russo, F., Solberg, S., Stordal, F., and Tampieri, F.: Air quality trends in Europe over the past decade: a first multi-model assessment, Atmos. Chem. Phys., 11, 11657–11678, https://doi.org/10.5194/acp-11-11657-2011, 2011. a
Colette, A., Granier, C., Hodnebrog, Ø., Jakobs, H., Maurizi, A., Nyiri, A., Rao, S., Amann, M., Bessagnet, B., D'Angiola, A., Gauss, M., Heyes, C., Klimont, Z., Meleux, F., Memmesheimer, M., Mieville, A., Rouïl, L., Russo, F., Schucht, S., Simpson, D., Stordal, F., Tampieri, F., and Vrac, M.: Future air quality in Europe: a multi-model assessment of projected exposure to ozone, Atmos. Chem. Phys., 12, 10613–10630, https://doi.org/10.5194/acp-12-10613-2012, 2012. a
Corbett, J., Winebrake, J., Green, E., Kasibhatla, P., and Laurer, E. A. V.: Mortality from ship emissions: A global assessment, Environ. Sci. Tech., 4, 8512–8518, 2007. a
Dore, A. J., Carslaw, D. C., Braban, C., Cain, M., Chemel, C., Conolly, C., Derwent, R. G., Griffiths, S. J., Hall, J., Hayman, G., Lawrence, S., Metcalfe, S. E., Redington, A., Simpson, D., Sutton, M. A., Sutton, P., Tang, Y. S., Vieno, M., Werner, M., and Whyatt, J. D.: Evaluation of the performance of different atmospheric chemical transport models and inter-comparison of nitrogen and sulphur deposition estimates for the UK, Atmos. Environ., 119, 131–143, https://doi.org/10.1016/j.atmosenv.2015.08.008, 2015. a
EMEP MSC-W: metno/emep-ctm: OpenSource rv4.15 (201709) (Version rv4_15), Zenodo, https://doi.org/10.5281/zenodo.3355041, 30 July 2019. a
EMEP Status Report 1/2018: Transboundary particulate matter, photo-oxidants, acidifying and eutrophying components, EMEP MSC-W & CCC & CEIP, Norwegian Meteorological Institute (EMEP/MSC-W), Oslo, Norway, 2018. a, b
Endresen, Ø., Sørgård, E., Sundet, J., Dalsøren, S., Isaksen, I., Berglen, T., and Gravir, G.: Emission from international sea transport and environmental impact, J. Geophys. Res., 108, D17, https://doi.org/10.1029/2002JD002898, 2003. a
Eyring, V., Isaksen, I., Berntsen, T., Collins, W., Corbett, J., Endresen, Ø., Grainger, R., Moldanova, J., Schlager, H., and Stevenson, D.: Transport impacts on atmosphere and climate: Shipping, Atmos. Environ., 44, 4735–4771, 2007. a
Gauss, M., Tsyro, S., Benedictow, A., Fagerli, H., Hjellbrekke, A.-G., Aas, W., and Solberg, S.: EMEP/MSC-W model performance for acidifying and eutrophying components, photo-oxidants and particulate matter in 2014, Supplementary material to EMEP Status Report 1/2016, available at: https://www.emep.int/ (last access: 27 February 2019), The Norwegian Meteorological Institute, Oslo, Norway, 2016. a
Gauss, M., Tsyro, S., Fagerli, H., Hjellbrekke, A.-G., Aas, W., and Solberg, S.: EMEP MSC-W model performance for acidifying and eutrophying components, photo-oxidants and particulate matter in 2015, Supplementary material to EMEP Status Report 1/2017, available online at https://www.emep.int/ (last access: 27 February 2019), The Norwegian Meteorological Institute, Oslo, Norway, 2017. a
Gauss, M., Tsyro, S., Fagerli, H., Hjellbrekke, A.-G., Aas, W., and Solberg, S.: EMEP MSC-W model performance for acidifying and eutrophying components, photo-oxidants and particulate matter in 2016, Supplementary material to EMEP Status Report 1/2018, available online at https://www.emep.int/ (last access: 27 February 2019), The Norwegian Meteorological Institute, Oslo, Norway, 2018. a, b
Huszar, P., Cariolle, D., Paoli, R., Halenka, T., Belda, M., Schlager, H., Miksovsky, J., and Pisoft, P.: Modeling the regional impact of ship emissions on NOx and ozone levels over the Eastern Atlantic and Western Europe using ship plume parameterization, Atmos. Chem. Phys., 10, 6645–6660, https://doi.org/10.5194/acp-10-6645-2010, 2010. a
IHS Global: SeaWeb database of the global ship fleet, Commercial content, IHS Global, Chemin de la Mairie, Perly, Geneva), available at: https://maritime.ihs.com/ (last access: 27 February 2019), 2017. a
IMO: Amendments to the annex of the protocol of 1997 to amend the international convention for the prevention of pollution from ships 1973, as modified by the protocol of 1978 relating thereto, Annex vi, IMO (International Maritime Organization), available at: http://www.imo.org/en/OurWork/Environment/PollutionPrevention/AirPollution/Documents/176% 2858% 29.pdf (last access: 27 February 2019), 2008. a
IMO: RESOLUTION MEPC.286(71). Adopted on 7 July 2017. Amendments to the annex of the protocol of 1997 to amend the international convention for the prevention of pollution from ships, 1973, as modified by the protocol of 1978 relating there to Amendments to MARPOL Annex VI, available at: http://www.imo.org/en/OurWork/Environment/PollutionPrevention/AirPollution/Documents/Res_MEPC_286% 2871% 29_Tier% 20III% 20ECA% 20and% 20BDN.pdf (last access: 27 February 2019), IMO (International Maritime Organization), 2017. a
IMO: Adoption of the initial IMO strategy on reduction of GHG emissions from ships and existing IMO activity related to reducing GHG emissions in the shipping sector., Available at https://unfccc.int/sites/default/files/resource/250_IMO% 20submission_Talanoa% 20Dialogue_April% 202018.pdf (last access: 5 April 2019), IMO (International Maritime Organization), 2018. a
Jalkanen, J.-P., Brink, A., Kalli, J., Pettersson, H., Kukkonen, J., and Stipa, T.: A modelling system for the exhaust emissions of marine traffic and its application in the Baltic Sea area, Atmos. Chem. Phys., 9, 9209–9223, https://doi.org/10.5194/acp-9-9209-2009, 2009. a
Jalkanen, J.-P., Johansson, L., Kukkonen, J., Brink, A., Kalli, J., and Stipa, T.: Extension of an assessment model of ship traffic exhaust emissions for particulate matter and carbon monoxide, Atmos. Chem. Phys., 12, 2641–2659, https://doi.org/10.5194/acp-12-2641-2012, 2012. a
Jalkanen, J.-P., Johansson, L., and Kukkonen, J.: A comprehensive inventory of ship traffic exhaust emissions in the European sea areas in 2011, Atmos. Chem. Phys., 16, 71–84, https://doi.org/10.5194/acp-16-71-2016, 2016. a
Johansson, L., Jalkanen, J.-P., Kalli, J., and Kukkonen, J.: The evolution of shipping emissions and the costs of regulation changes in the northern EU area, Atmos. Chem. Phys., 13, 11375–11389, https://doi.org/10.5194/acp-13-11375-2013, 2013. a
Johansson, L., Jalkanen, J.-P., and Kukkonen, J.: Global assessment of shipping emissions in 2015 on a high spatial and temporal resolution, Atmos. Environ., 167, 403–415, https://doi.org/10.1016/j.atmosenv.2017.08.042, 2017. a, b
Jonson, J., Borken-Kleefeld, J., Nyíri, A., Posch, M., and Heyes, C.: Impact of excess NOx emissions from diesel cars on air quality, public health and eutrophication in Europe, Environ. Res. Lett., 12, 9, https://doi.org/10.1088/1748-9326/aa8850, 2017. a
Jonson, J., Gauss, M., Schulz, M., and Nyíri, A.: Emissions from international shipping, in: Transboundary particulate matter, photo-oxidants, acidifying and eutrophying components. EMEP Status Report 1/2018, pp. 83–98, The Norwegian Meteorological Institute, Oslo, Norway, available at: http://emep.int/publ/reports/2018/EMEP_Status_Report_1_2018.pdf (last access: 27 February 2019), 2018. a, b, c, d
Jonson, J. E., Jalkanen, J. P., Johansson, L., Gauss, M., and Denier van der Gon, H. A. C.: Model calculations of the effects of present and future emissions of air pollutants from shipping in the Baltic Sea and the North Sea, Atmos. Chem. Phys., 15, 783–798, https://doi.org/10.5194/acp-15-783-2015, 2015. a
Kalli, J., Jalkanen, J.-P., Johansson, L., and Repka, S.: Atmospheric emissions of European SECA shipping: long-term projections, WMU Journal of Maritime Affairs, 12, 129–145, https://doi.org/10.1007/s13437-013-0050-9, 2013. a
Karl, M., Bieser, J., Geyer, B., Matthias, V., Jalkanen, J.-P., Johansson, L., and Fridell, E.: Impact of a nitrogen emission control area (NECA) on the future air quality and nitrogen deposition to seawater in the Baltic Sea region, Atmos. Chem. Phys., 19, 1721–1752, https://doi.org/10.5194/acp-19-1721-2019, 2019a. a
Karl, M., Jonson, J. E., Uppstu, A., Aulinger, A., Prank, M., Sofiev, M., Jalkanen, J.-P., Johansson, L., Quante, M., and Matthias, V.: Effects of ship emissions on air quality in the Baltic Sea region simulated with three different chemistry transport models, Atmos. Chem. Phys., 19, 7019–7053, https://doi.org/10.5194/acp-19-7019-2019, 2019b. a, b
Klein, H., Gauss, M., Nyíri, A., and Benedictow, A.: Transboundary air pollution by main pollutants (S, N, O3) and PM, MSC-W Data Note 1/2018 Individual Country Reports, available at: https://www.emep.int (last access: 27 February 2019), The Norwegian Meteorological Institute, Oslo, Norway, 2018. a, b
Kuenen, J. J. P., Visschedijk, A. J. H., Jozwicka, M., and Denier van der Gon, H. A. C.: TNO-MACC_II emission inventory; a multi-year (2003–2009) consistent high-resolution European emission inventory for air quality modelling, Atmos. Chem. Phys., 14, 10963–10976, https://doi.org/10.5194/acp-14-10963-2014, 2014. a
Repka, S., Erkkilä-Välimäki, A., Törrönen, J., Jalkanen, J.-P., Jonson, J. E., and Posch, M.: IMO regulation on ship-originated SOx and NOx in the Baltic Sea – assessing the relevance of environmental impacts, in preparation, 2019. a, b, c
Simpson, D., Benedictow, A., Berge, H., Bergström, R., Emberson, L. D., Fagerli, H., Flechard, C. R., Hayman, G. D., Gauss, M., Jonson, J. E., Jenkin, M. E., Nyíri, A., Richter, C., Semeena, V. S., Tsyro, S., Tuovinen, J.-P., Valdebenito, Á., and Wind, P.: The EMEP MSC-W chemical transport model – technical description, Atmos. Chem. Phys., 12, 7825–7865, https://doi.org/10.5194/acp-12-7825-2012, 2012. a
Simpson, D., Wind, P., Bergström, R., Gauss, M., Tsyro, S., and Valdebenito, A.: Updates to the EMEP MSC-W model, 2017–2018, EMEP Status Report 1/2018, available at: http://emep.int/publ/reports/2018/EMEP_Status_Report_1_2018.pdf (last access: 27 February 2019), The Norwegian Meteorological Institute, Oslo, Norway, 2018. a
Sofiev, M., Winebrake, J. J., Johansson, L., Carr, E. W., Prank, M., Soares, J., Vira, J., Kouznetsov, R., Jalkanen, J.-P., and Corbett, J. J.: Cleaner fuels for ships provide public health benefits with climate tradeoffs, Nature, 9, 406, https://doi.org/10.1038/s41467-017-02774-9, 2018. a
Stjern, C. W., Samset, B. H., Myhre, G., Bian, H., Chin, M., Davila, Y., Dentener, F., Emmons, L., Flemming, J., Haslerud, A. S., Henze, D., Jonson, J. E., Kucsera, T., Lund, M. T., Schulz, M., Sudo, K., Takemura, T., and Tilmes, S.: Global and regional radiative forcing from 20 a
Tista, M., Wankmüller, R., Matthews, B., Mareckova, K., Fagerli, H., and Nyíri, A.: Emissions in 2016, in: Transboundary particulate matter, photo-oxidants, acidifying and eutrophying components. EMEP Status Report 1/2018, pp. 41–64, The Norwegian Meteorological Institute, Oslo, Norway, available at: http://emep.int/publ/reports/2018/EMEP_Status_Report_1_2018.pdf (last access: 27 February 2019), 2018. a, b
Tsyro, S., Aas, W., Solberg, S., Benedictow, A., Fagerli, H., and Posch, M.: Status of transboundary air pollution in 2016, in: Transboundary particulate matter, photo-oxidants, acidifying and eutrophying components, EMEP Status Report 1/2018, pp. 15–40, The Norwegian Meteorological Institute, Oslo, Norway, available at: http://emep.int/publ/reports/2018/EMEP_Status_Report_1_2018.pdf (last access: 27 February 2019), 2018. a
Vinken, G. C. M., Boersma, K. F., Jacob, D. J., and Meijer, E. W.: Accounting for non-linear chemistry of ship plumes in the GEOS-Chem global chemistry transport model, Atmos. Chem. Phys., 11, 11707–11722, https://doi.org/10.5194/acp-11-11707-2011, 2011. a, b
Vivanco, M. G., Theobald, M. R., García-Gómez, H., Garrido, J. L., Prank, M., Aas, W., Adani, M., Alyuz, U., Andersson, C., Bellasio, R., Bessagnet, B., Bianconi, R., Bieser, J., Brandt, J., Briganti, G., Cappelletti, A., Curci, G., Christensen, J. H., Colette, A., Couvidat, F., Cuvelier, C., D'Isidoro, M., Flemming, J., Fraser, A., Geels, C., Hansen, K. M., Hogrefe, C., Im, U., Jorba, O., Kitwiroon, N., Manders, A., Mircea, M., Otero, N., Pay, M.-T., Pozzoli, L., Solazzo, E., Tsyro, S., Unal, A., Wind, P., and Galmarini, S.: Modeled deposition of nitrogen and sulfur in Europe estimated by 14 air quality model systems: evaluation, effects of changes in emissions and implications for habitat protection, Atmos. Chem. Phys., 18, 10199–10218, https://doi.org/10.5194/acp-18-10199-2018, 2018. a