the Creative Commons Attribution 4.0 License.
the Creative Commons Attribution 4.0 License.
 | 16 Oct 2019
A new parameterization scheme for the real part of the ambient urban aerosol refractive index
Gang Zhao
Tianyi Tan
Weilun Zhao
Ping Tian
Chunsheng Zhao
The refractive index of ambient aerosols, which directly determines the aerosol optical properties, is widely used in atmospheric models and remote sensing. Traditionally, the real part of the refractive index (RRI) is parameterized by the measurement of ambient aerosol main inorganic components. In this paper, the characteristics of the ambient aerosol RRI are studied based on field measurements in East China. The results show that the measured ambient aerosol RRI varies significantly between 1.36 and 1.56. The direct aerosol radiative forcing is estimated to vary by 40 % when the RRI values were varied between 1.36 and 1.56. We find that the ambient aerosol RRI is highly correlated with the aerosol effective density (ρeff) rather than the main chemical components. However, the parameterization of the ambient aerosol RRI by ρeff is not available due to the lack of corresponding simultaneous field measurements. For the first time, the size-resolved ambient aerosol RRI and ρeff are measured simultaneously by our designed measurement system. A new parameterization scheme for the ambient aerosol RRI using ρeff is proposed for urban environments. The measured and parameterized RRI values agree well, with a correlation coefficient of 0.75 and slope of 0.99. Knowledge of the ambient aerosol RRI would improve our understanding of ambient aerosol radiative effects.
- Article
(4901 KB) - Full-text XML
-
Supplement
(267 KB) - BibTeX
- EndNote


Atmospheric aerosols can significantly influence regional air quality (An et al., 2019; Zhang et al., 2015). They change the climate system by scattering and absorbing solar radiation (Seinfeld et al., 1998; Wang et al., 2013). However, the estimation of aerosol radiative effects has large uncertainties due to the high temporal and spatial variations in aerosol microphysical properties (Levoni et al., 1997). The complex refractive index (RI), which directly determines aerosol scattering and absorbing abilities (Bohren and Huffman, 2007), is one of the most important microphysical parameters of aerosol optics and radiation. RI is widely employed in atmospheric models and remote sensing (Zhao et al., 2017). When estimating direct aerosol radiative forcing (DARF), many studies showed that great uncertainties may arise due to small uncertainties in the real part of the RI (RRI). It was found that a small perturbation in RRI (0.003) can lead to an uncertainty of 1 % in DARF for nonabsorbing particles (Zarzana et al., 2014). An increment of 12 % in DARF occurred when the RRI increased from 1.4 to 1.5 (Moise et al., 2015) over the wavelength range between 0.2 and 5 µm. Therefore, it is necessary to measure or parameterize the ambient aerosol RRI with high accuracy.
Traditionally, the RRI is derived from measurements of aerosol main inorganic chemical compositions (Han et al., 2009). For ambient aerosol with multiple components, the linear volume average of known aerosol chemical composition is widely used to estimate the aerosol effective RRI (Hand and Kreidenweis, 2002; Liu and Daum, 2008; Hänel, 1968; Wex et al., 2002) with
where fi and RRIi are the volume fraction and real part of the refractive index of known composition i. However, the influences of the organic component on the aerosol RRI were not considered when estimating the RRI using the traditional method. The organic component contributes more than 20 % of the total aerosol component in China (Hu et al., 2012; Liu et al., 2014). At the same time, the RRI of the organic aerosol changes significantly between 1.36 and 1.66 (Moise et al., 2015). Ignoring the organic component may lead to significant biases when estimating the ambient aerosol RRI. A comparison between the estimated RRI using the main aerosol composition and measured aerosol RRI using other methods was not available due to the lack of measurement of ambient aerosol RRI.
Information on RRI may be helpful for knowledge of ambient aerosol chemical composition. Many studies find that ambient aerosols of different size have different properties such as shape (Peng et al., 2016), chemical composition (Hu et al., 2012) and density (Qiao et al., 2018). Until now, there has been limited information about the size-resolved RRI (; denoted in Table S1 in the Supplement) of ambient particles. The characteristics of ambient aerosol have not been well studied yet.
The RRI of a mono-component particle is defined as (Liu and Daum, 2008)
where NA is the universal Avogadro's number, α is the mean molecular polarizability, M is the molecular weight of the material and ρeff is the mass effective density of the chemical component. The RRI should be highly related to ρeff. However, there has been no study that investigated the relationship between the RRI and ρ of ambient aerosol in China.
The ρeff of ambient aerosols is one of the crucial parameters in aerosol thermodynamical and optical models. It can be used to infer the ambient particle aging process (Peng et al., 2016). Based on Eq. (2), the aerosol ρeff is directly related to the aerosol RRI. Few studies measure the ambient aerosol RRI and ρeff simultaneously. So far, parameterizations of the RRI by ρeff using simultaneous measurements have not been available. Real-time measurements of the ρeff and aerosol RRI concurrently can help us to better understand the relationship between the aerosol RRI and ρeff.
In this study, the aerosol and size-resolved ρeff () are measured simultaneously during a field measurement conducted in Taizhou in East China. Ambient aerosol is measured by our designed system, which combines a differential mobility analyzer (DMA) and a single-particle soot photometer (SP2) (Zhao et al., 2019). The is measured by using a centrifugal particle mass analyzer (CMPA) and a scanning mobility particle sizer (SMPS). The characteristics of the and are analyzed in this study. It is the first time that the and of ambient aerosol have been measured simultaneously. A parameterization scheme for the RRI by the ρeff using simultaneous measurement is proposed. Based on the measured variability of the measured RRI, we estimated the corresponding variation of the aerosol direct aerosol radiative forcing, which to some extent gives valuable information on the influence of aerosol RRI variations on aerosol radiative effects.
The structure of this study is as follows: a description of the instrument setup is given in Sect. 2.1, 2.2 and 2.3. The methodology of evaluating the aerosol optical properties and radiative effects corresponding to the variations of the measured RRI is presented in Sect. 2.4 and 2.5, respectively. Section 3.1 describes the characteristics of the measured and . Section 3.3 proposes the parameterization for the aerosol RRI. The corresponding variations in aerosol optical properties and radiative effects corresponding to the variations of the measured RRI are both discussed in Sect. 3.4.
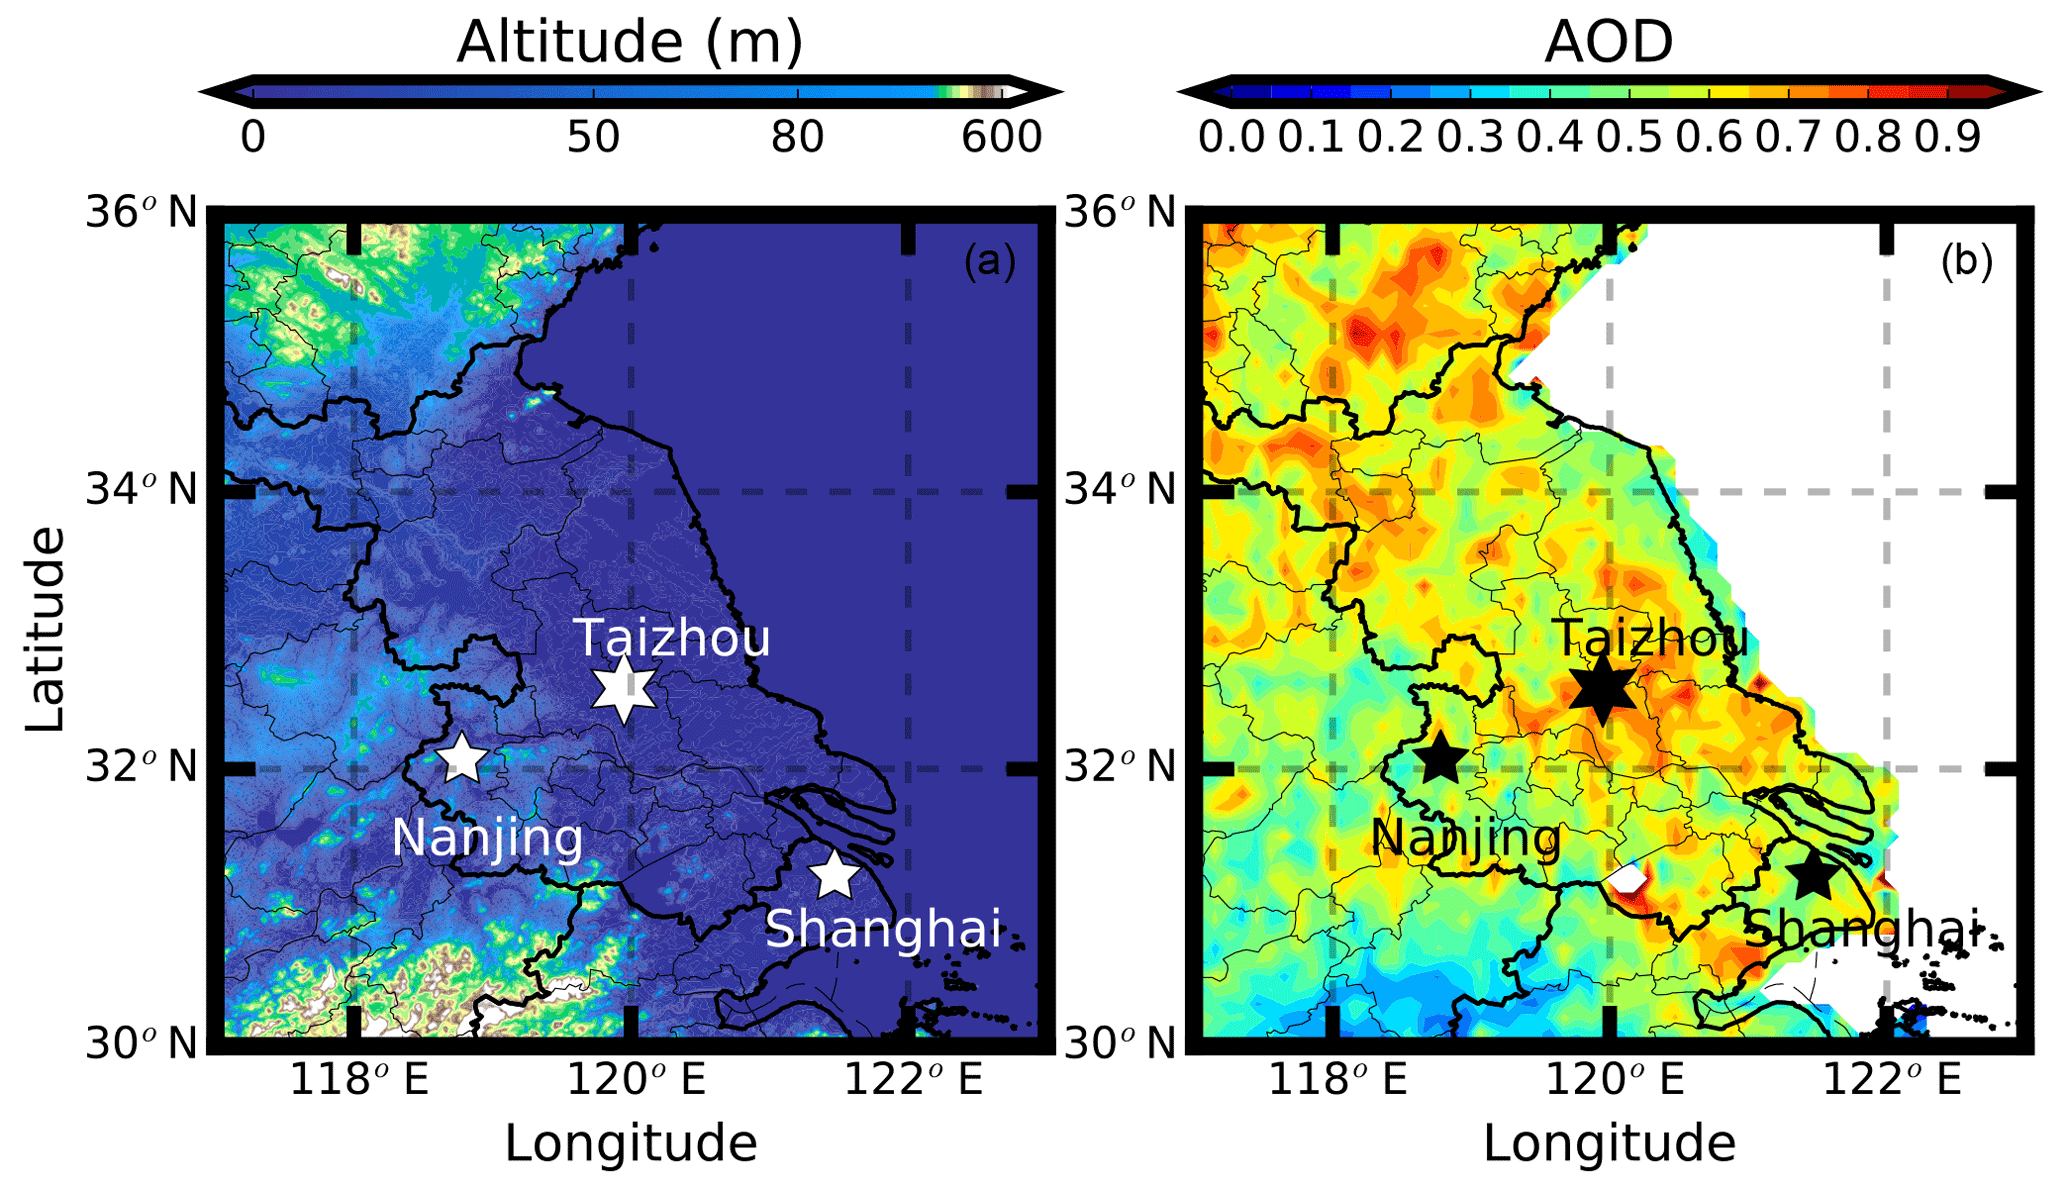
Figure 1Measurement site of Taizhou (marked with stars). Filled colors represent (a) the topography of the Jianghuai Plain. (b) The average aerosol optical depth at 550 nm during the year 2017 from the Moderate Resolution Imaging Spectroradiometer onboard the satellite Aqua.
2.1 Description of the measurement campaign
The measurements were conducted at a suburban site, Taizhou (119∘57′ E, 32∘35′ N), as shown in Fig. 1a, which lies at the south end of the Jianghuai Plain in central Eastern China. It is located to the northeast of the megacity Nanjing at a distance of 118 km. Another megacity, Shanghai, is 200 km away from Taizhou in the southeastern direction. The industrial area between Nanjing and Shanghai has experienced severe pollution in the past 20 years. The average Moderate Resolution Imaging Spectroradiometer (MODIS) aerosol optical depth data at 550 nm over the year 2017, as shown in Fig. 1b, also reflects the fact that the measurement site is more polluted than the surrounding areas.
During the field campaign, all of the instruments were placed in a container in which the temperature was well controlled within 24±2 ∘C. The sample air was collected from a PM10 impactor (Mesa Labs, model SSI2.5) mounted on the top of the container and then passed through a Nafion dryer tube to ensure that the relative humidity of the sample particles was controlled below 30 %.
Along with the measurement of the and , the aerosol scattering coefficients (σsca) at three different wavelengths (450, 525 and 635 nm) were measured by an nephelometer (Aurora 3000, Ecotech, Australia) (Müller et al., 2011) at a resolution of 5 min. The scattering truncation and non-Lambertian error were corrected using the same method as that of Ma et al. (2011). The aerosol water-soluble ions (, , , Cl−) of PM2.5 were measured by an In situ Gas and Aerosol Compositions Monitor (TH-GAC3000, China). The mass concentrations of elementary carbon and organic carbon (OC) of PM2.5 were measured using a thermal optical transmittance aerosol carbon analyzer (ECOC, Focused Photonics Inc.). The concentrations of organic matter (OM) are achieved by multiplying the OC concentration by 1.4 (Hu et al., 2012). The time resolution of the aerosol composition measurement was 1 h.
Another field measurement were conducted at the campus of Peking University (PKU) (39∘59′ N, 116∘18′ E) in the North China Plain, where the aerosol effective density and real part of the refractive index were measured concurrently from 16 to 20 December 2018. For more detail on this site, refer to Zhao et al. (2018).
2.2 Measuring the
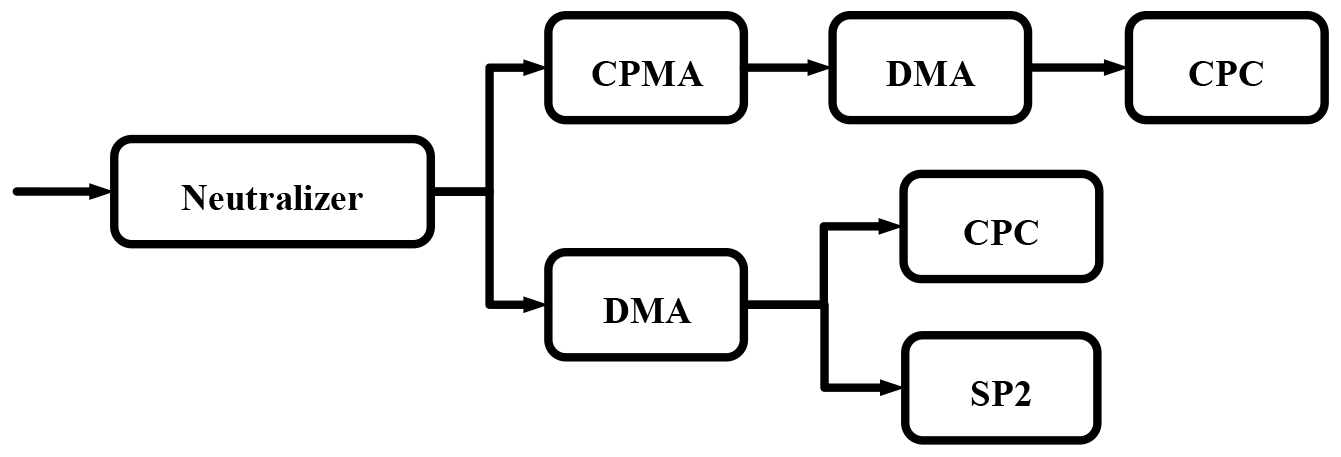
A coupled DMA–SP2 system was employed to measure the aerosol from 24 May to 18 June 2018. This system is introduced elsewhere by Zhao et al. (2019), and a brief description is presented here. As schematically shown in Fig. 2, the monodispersed aerosols selected by a DMA (model 3081, TSI, USA) are drawn into an SP2 to measure the corresponding scattering properties. The SP2 is capable of distinguishing pure scattering aerosols from aerosols containing black carbon (BC) by measuring the incandescence signals at 1064 nm. For the pure scattering aerosol, the scattering strength (S) measured by SP2 is expressed as
where C is a constant that is determined by the instrument response character; I0 is the instrument's laser intensity; and and are the scattering functions of the sampled aerosol at 45 and 135∘, respectively. From Mie scattering theory, aerosol size and RRI directly determine the scattering function at a given direction. Inversely, the aerosol RRI can be retrieved when the aerosol size and scattering strength are determined. This system can measure the ambient aerosol with an uncertainty less than 0.02 (Zhao et al., 2019).
Before the measurement, this system is calibrated with ammonia sulfate (RRI = 1.52). After calibration, ammonium chloride is used to validate the method of deriving the RRI at different aerosol diameters. The RRI value of ammonium chloride is 1.642 (Lide, 2006), and the measured RRI of ammonium chloride is in the range between 1.624 and 1.656 in our study. Therefore, this system can measure ambient aerosol RRI with high accuracy.
2.3 Measuring the
The was measured by a centrifugal particle mass analyzer (CPMA; version 1.53, Cambustion Ltd, UK) in tandem with a scanning mobility particle sizer (SMPS) system from 12 to 18 June 2018. The ρeff is defined as
where mp is the particle mass and dm is the aerosol mobility diameter selected by a DMA.
The controlling of the CPMA–SMPS system is achieved by self-established LabVIEW software. The CPMA is set to scan 12 different aerosol masses at 1.0, 1.4, 2.0, 2.9, 4.2, 5.9, 8.5, 12.1, 17.2, 24.6, 35.0 and 50.0 fg every 5 min. The SMPS scans the aerosol diameters between 60 nm and 500 nm every 5 min, which results in a period of 1 h for measuring the effective density of different masses.
At the beginning of the field measurement, the CPMA–SMPS system was calibrated using polystyrene latex (PSL) particles with different masses. The corresponding measured effective densities of PSL particles are 1.04 and 1.07 g cm−3, which agree well with the PSL material density of 1.05 g cm−3.
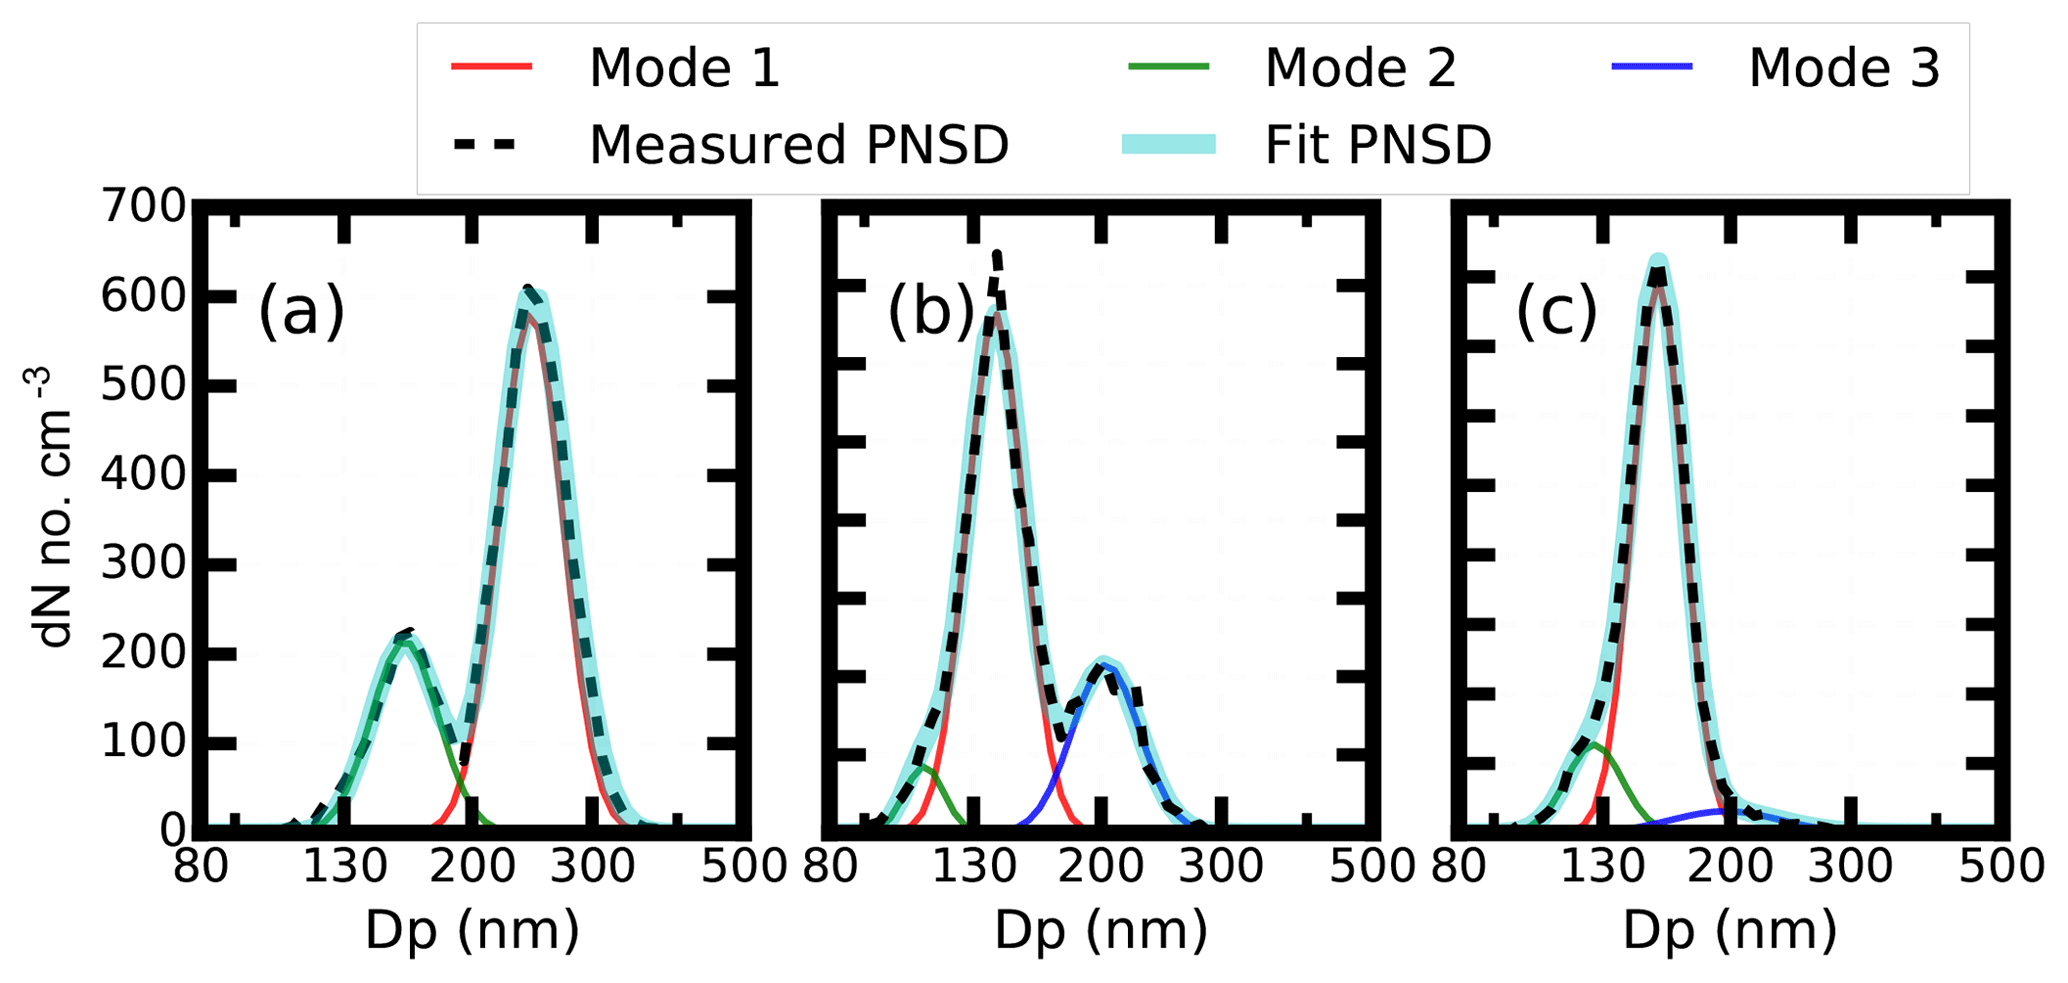
Figure 3The measured aerosol PNSD (black dotted line), fit aerosol number PNSD (blue solid line) and fit aerosol PNSD at three different modes in different colors that passed through the CPMA. (a–c) The aerosol mass concentrations of 12, 1 and 1.45 fg, respectively.
Figure 3 presents three examples of the aerosol particle number size distributions (PNSDs) that passed the CPMA and were measured by the SMPS. The mass values of the aerosol that can pass through the CPMA were set to be 12, 1 and 1.4 fg. From Fig. 3, it is clear that the aerosols that passed through the CPMA were mainly composed of three modes. For each mode, the aerosol number concentrations were fit by a lognormal distribution function:
where σg is the geometric standard deviation, Dp is the geometric mean diameter and N0 is the number concentrations for a peak mode. The geometric mean diameter is further analyzed.
We demonstrate mode 1, 2 and 3 in Fig. 3, corresponding to absorbing aerosol, scattering aerosol and scattering aerosol with double charges, respectively.
Based on the principle of CPMA, the CPMA selects aerosols at mass m0 of single-charged aerosol particles. These multiple-charged (numbers of charges is n) aerosol particles with a mass concentration of nm0 can pass through the CPMA at the same time. We assumed that the geometric diameter of the single-charged aerosol particles was D0, and the effective density among different aerosol diameters did not have significant variations. Thus, the geometric diameter of the multiple-charged aerosol particles is .
As for the DMA, when a voltage (V) is applied to the DMA, only a narrow size range of aerosol particles with the same electrical mobility (Zp) can pass through the DMA (Knutson and Whitby, 1975). The Zp is expressed as
where Qsh is the sheath flow rate; L is the length of the DMA; r1 is the outer radius of annular space; and r2 is the inner radius of the annular space. The aerosol Zp, which is highly related to the aerosol diameter (Dp) and the number of elementary charges on the particle (n), is defined as
where e is the elementary charge, μ is the gas viscosity coefficient and C(Dp) is the Cunningham slip correction defined by
where τ is the gas mean free path.
Therefore, the electrical diameter Zp(n) of the particles with n charges and diameters can be calculated based on Eq. (5). Thus, the corresponding diameter (Dn) measured by the DMA can be calculated with electrical diameter Zp(n) and single-charged particles by using Eq. (5) again. The relationship of the Dn and the aerosol diameter selected by the DMA can be determined by changing the aerosol Dp and charge numbers. The results are shown in Fig. 4.
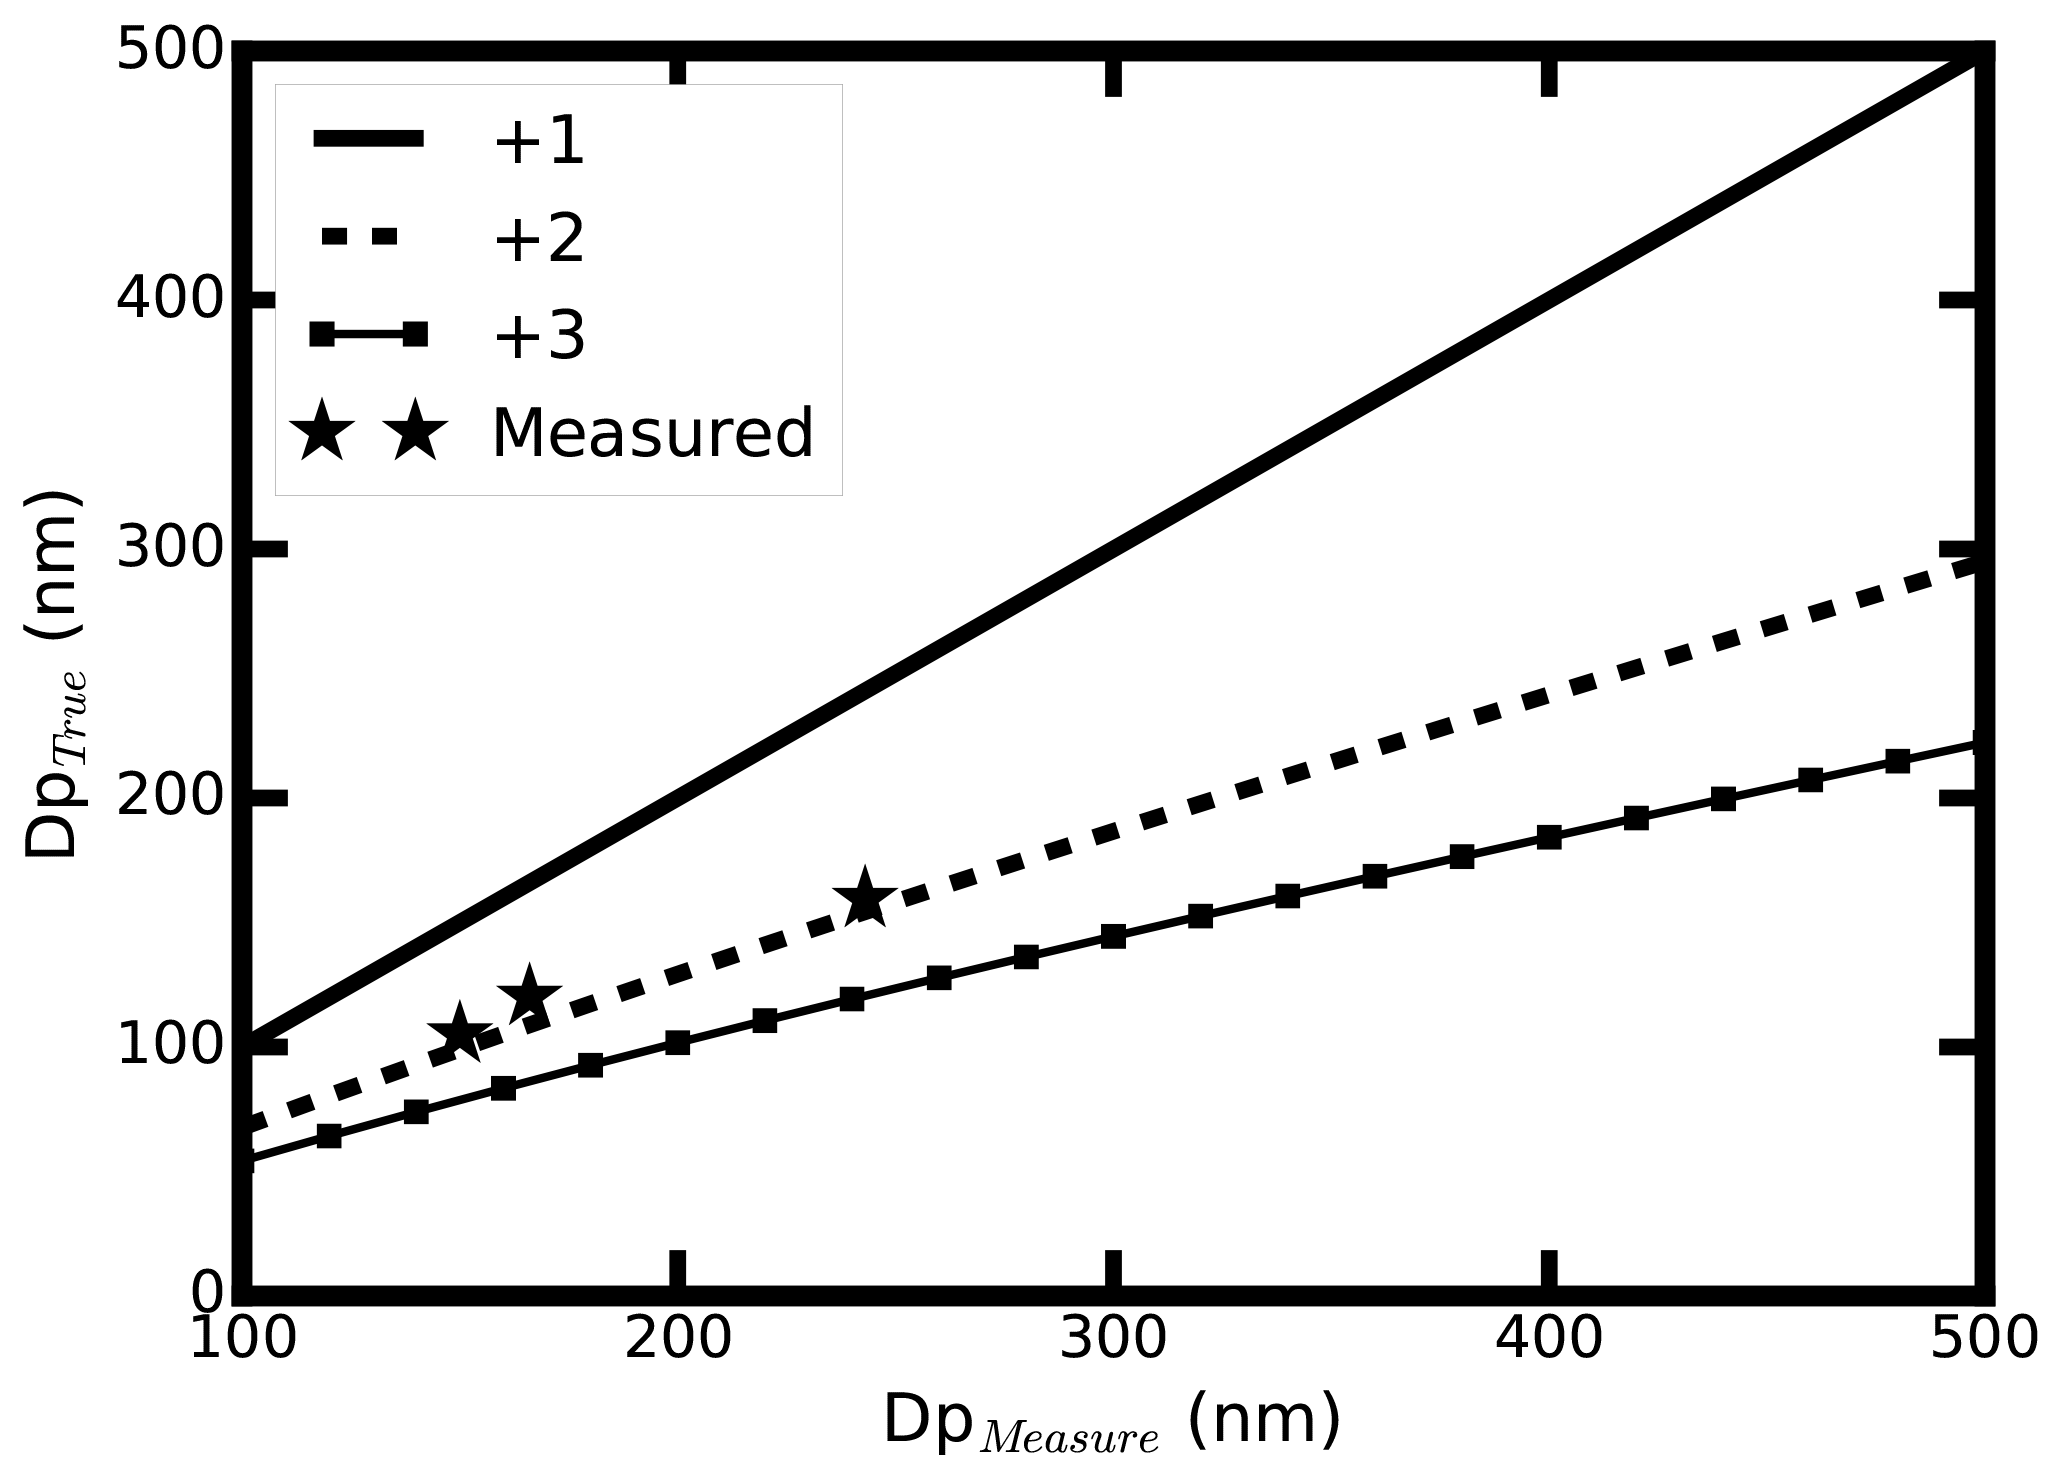
Figure 4The relationship between the measured diameter by the DMA and the calculated aerosol diameter of different charges in the CPMA–SMPS system.
The fit geometric diameters of mode 2 and mode 3 are also shown in Fig. 4. From Fig. 4, it is clear that the measured diameter relationships of mode 2 and mode 3 agree well with the calculated one between the single-charged and double-charged diameters. The little deviation might result from the assumption that the aerosol effective density does not change among different diameters. We concluded that mode 3 corresponds to double-charged aerosols. Mode 3 is not used in our study.
Mode 1 and mode 2 correspond to effective densities of around 1.0 and 1.5 g cm−3. Previous studies have shown that ambient BC aerosol is chain like in morphology and has smaller effective density values (Peng et al., 2016). At the same time, the fit aerosol number concentrations of mode 1 are only between 1∕5 and 1∕3 of mode 2. Based on the size-selected aerosol properties measured by the SP2, only a mean of 25 % percent of ambient aerosols contain BC. Therefore, mode 1 and mode 2 corresponded to BC-containing aerosols and scattering aerosols, respectively. There were some compacted BC-containing aerosols that may fit in mode 2. We focus on the fit geometric mean diameter of mode 2, which corresponds to the scattering aerosols that dominated this mode. Therefore, these compacted BC aerosols will not influence our final conclusion.
The effective density used in our study corresponds to the geometric diameters of mode 2. Thus, both the measured aerosol ρeff and RRI correspond to scattering aerosols.
2.4 Calculating aerosol optical properties using different RRI
Aerosol optical properties are highly related to the RRI. From Mie scattering theory, we know that variation in aerosol RRI may result in significant variations in the aerosol optical properties, such as the aerosol extinction coefficient (σext), σsca, single-scattering albedo (SSA) and asymmetry factor (g) (Bohren and Huffman, 2007). The σext, SSA and g are the most important three factors that influence the aerosol radiative properties in radiative calculation (Kuang et al., 2015; Zhao et al., 2018).
In this study, sensitivity studies of aerosol optical properties to the aerosol RRI are carried out by employing Mie scattering theory. The input variables of the Mie scattering model include the aerosol particle number size distribution (PNSD) as well as the BC mixing state and aerosol complex refractive index. The Mie model can calculate the σext, σsca, SSA and g. The mixing state of the ambient BC comes from the measurements of the DMA–SP2 system. All of the aerosols are divided into pure scattering aerosols and BC-containing aerosols. The BC-containing aerosols are assumed to be core–shell mixed. As for the RI of BC, 1.8 + 0.54i is used (Kuang et al., 2015). With this, the aerosol σext, σsca, SSA and g at different RRI values can be calculated.
2.5 Estimating the aerosol DARF
In this study, the DARF under different aerosol RRI conditions is estimated by the Santa Barbara DISORT (discrete ordinates radiative transfer) Atmospheric Radiative Transfer (SBDART) model (Ricchiazzi et al., 1998). Under cloud-free conditions, DARF at the top of the atmosphere (TOA) is calculated as the difference between radiative flux under aerosol-free conditions and aerosol-present conditions (Kuang et al., 2016). The instant DARF value is calculated over the wavelength range between 0.25 and 4 µm.
Input data for the model are shown below. The vertical profiles of temperature, pressure and water vapor adopt the radiosonde observations at the Taizhou site. The measured mean results corresponding the field measurement period are used. Vertical distributions of aerosol σext, SSA and g, with a resolution of 50 m, result from the calculation using the Mie model and parameterized aerosol vertical distributions. The methods for the parameterization and calculation of the aerosol optical profiles can be found in Zhao et al. (2018). The surface albedo adopts the mean results of the MODIS V005 Climate Modeling Grid (CMG) Albedo Product (MCD43C3) at the area of Taizhou from May 2017 to April 2018. Other default values are used in the simulation (Ricchiazzi et al., 1998).
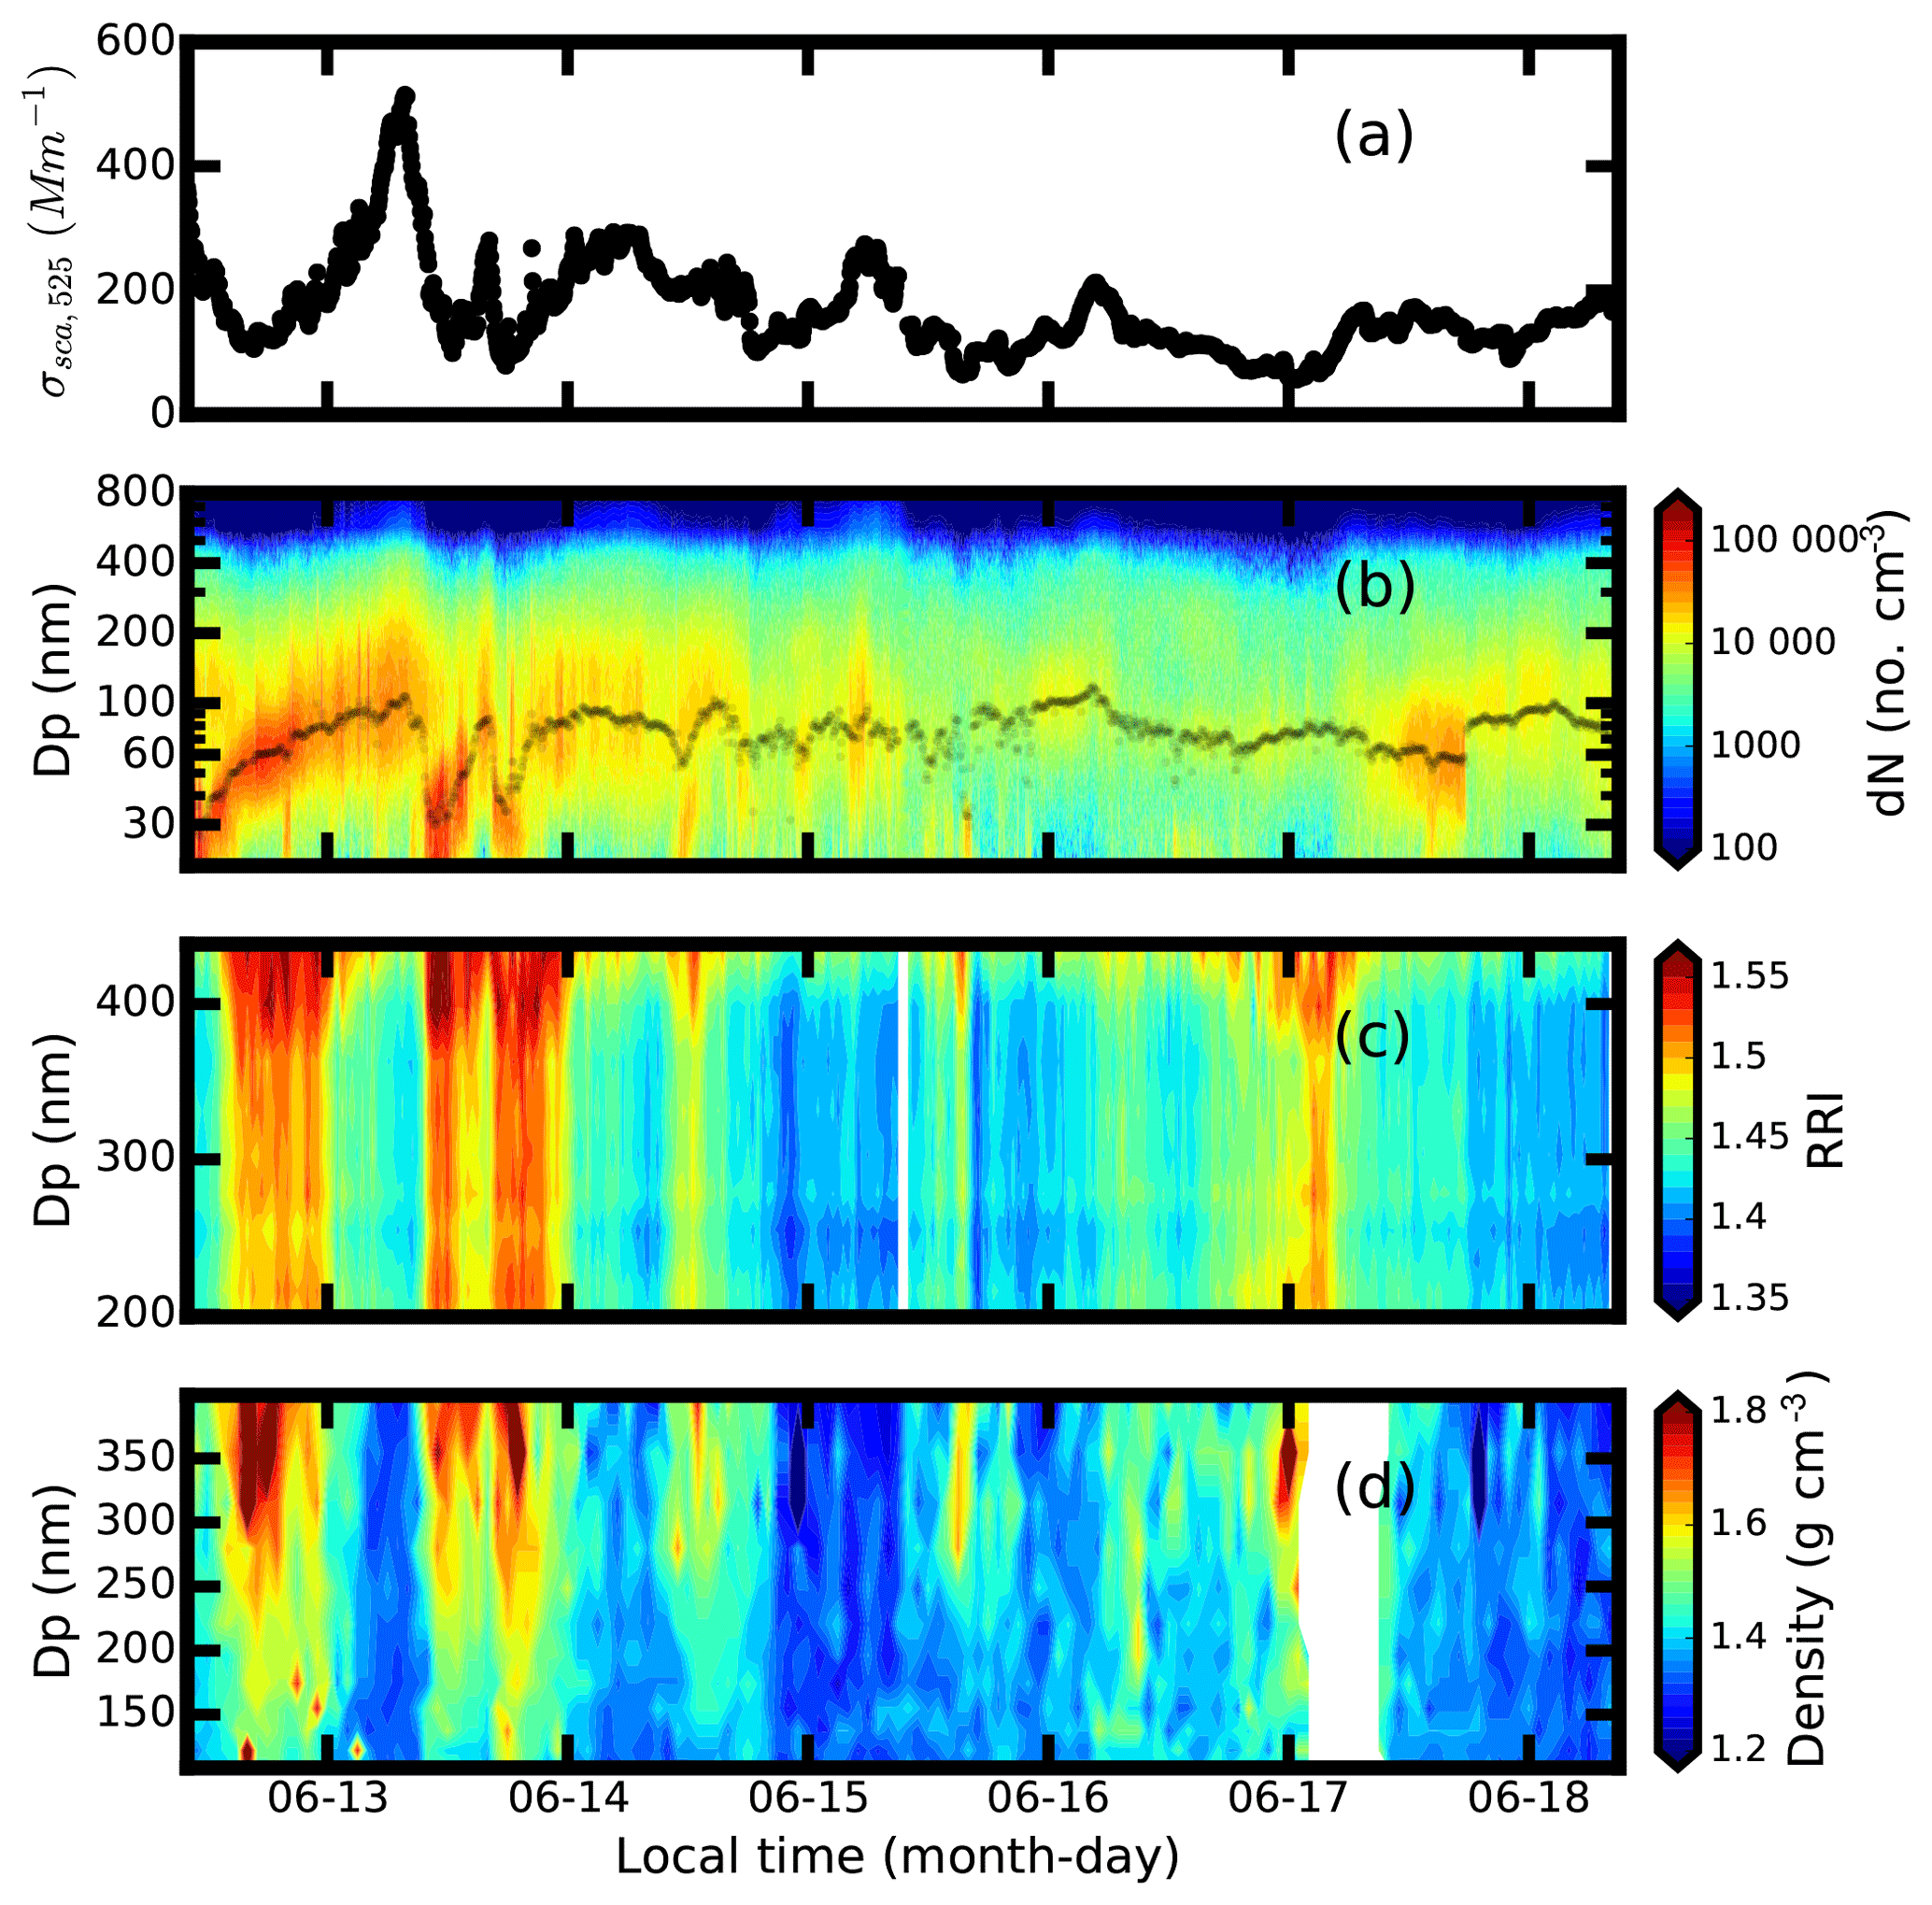
Figure 5Time series of measured (a) scattering coefficient at 525 nm, (b) PNSD, (c) size-resolved RRI, (d) size-resolved effective density.
3.1 Measurement results
An overview of the measurement is shown in Fig. 5. During the measurement, the σsca is relatively low with a mean value of 167±74 Mm−1. There was one major pollution episode that occurred based on the σsca time series as shown in Fig. 5a. This pollution happened on 13 June and did not last long. The corresponding σsca reaches 540 Mm−1. A moderate polluted condition between 14 and 15 June is observed. The aerosol PNSD changes substantially with the pollution conditions as shown in Fig. 5b. The geometric median aerosol diameter changes between 30 and 105 nm. The median diameter tends to be lower when the surrounding air is cleaner. Despite the fact that the median diameter reaches 105 nm on 16 June, the surrounding are is relatively clean due to the low aerosol number concentration. The varies from 1.34 to 1.54, and the ranges between 1.21 and 1.80 g cm−3 as shown in Fig. 5c and d. In Fig. 5, the measured RRI shows the same variation pattern with the ρeff. Both the and increase with diameter, which may indicate that the aerosol chemical composition varies among different aerosol particle sizes.
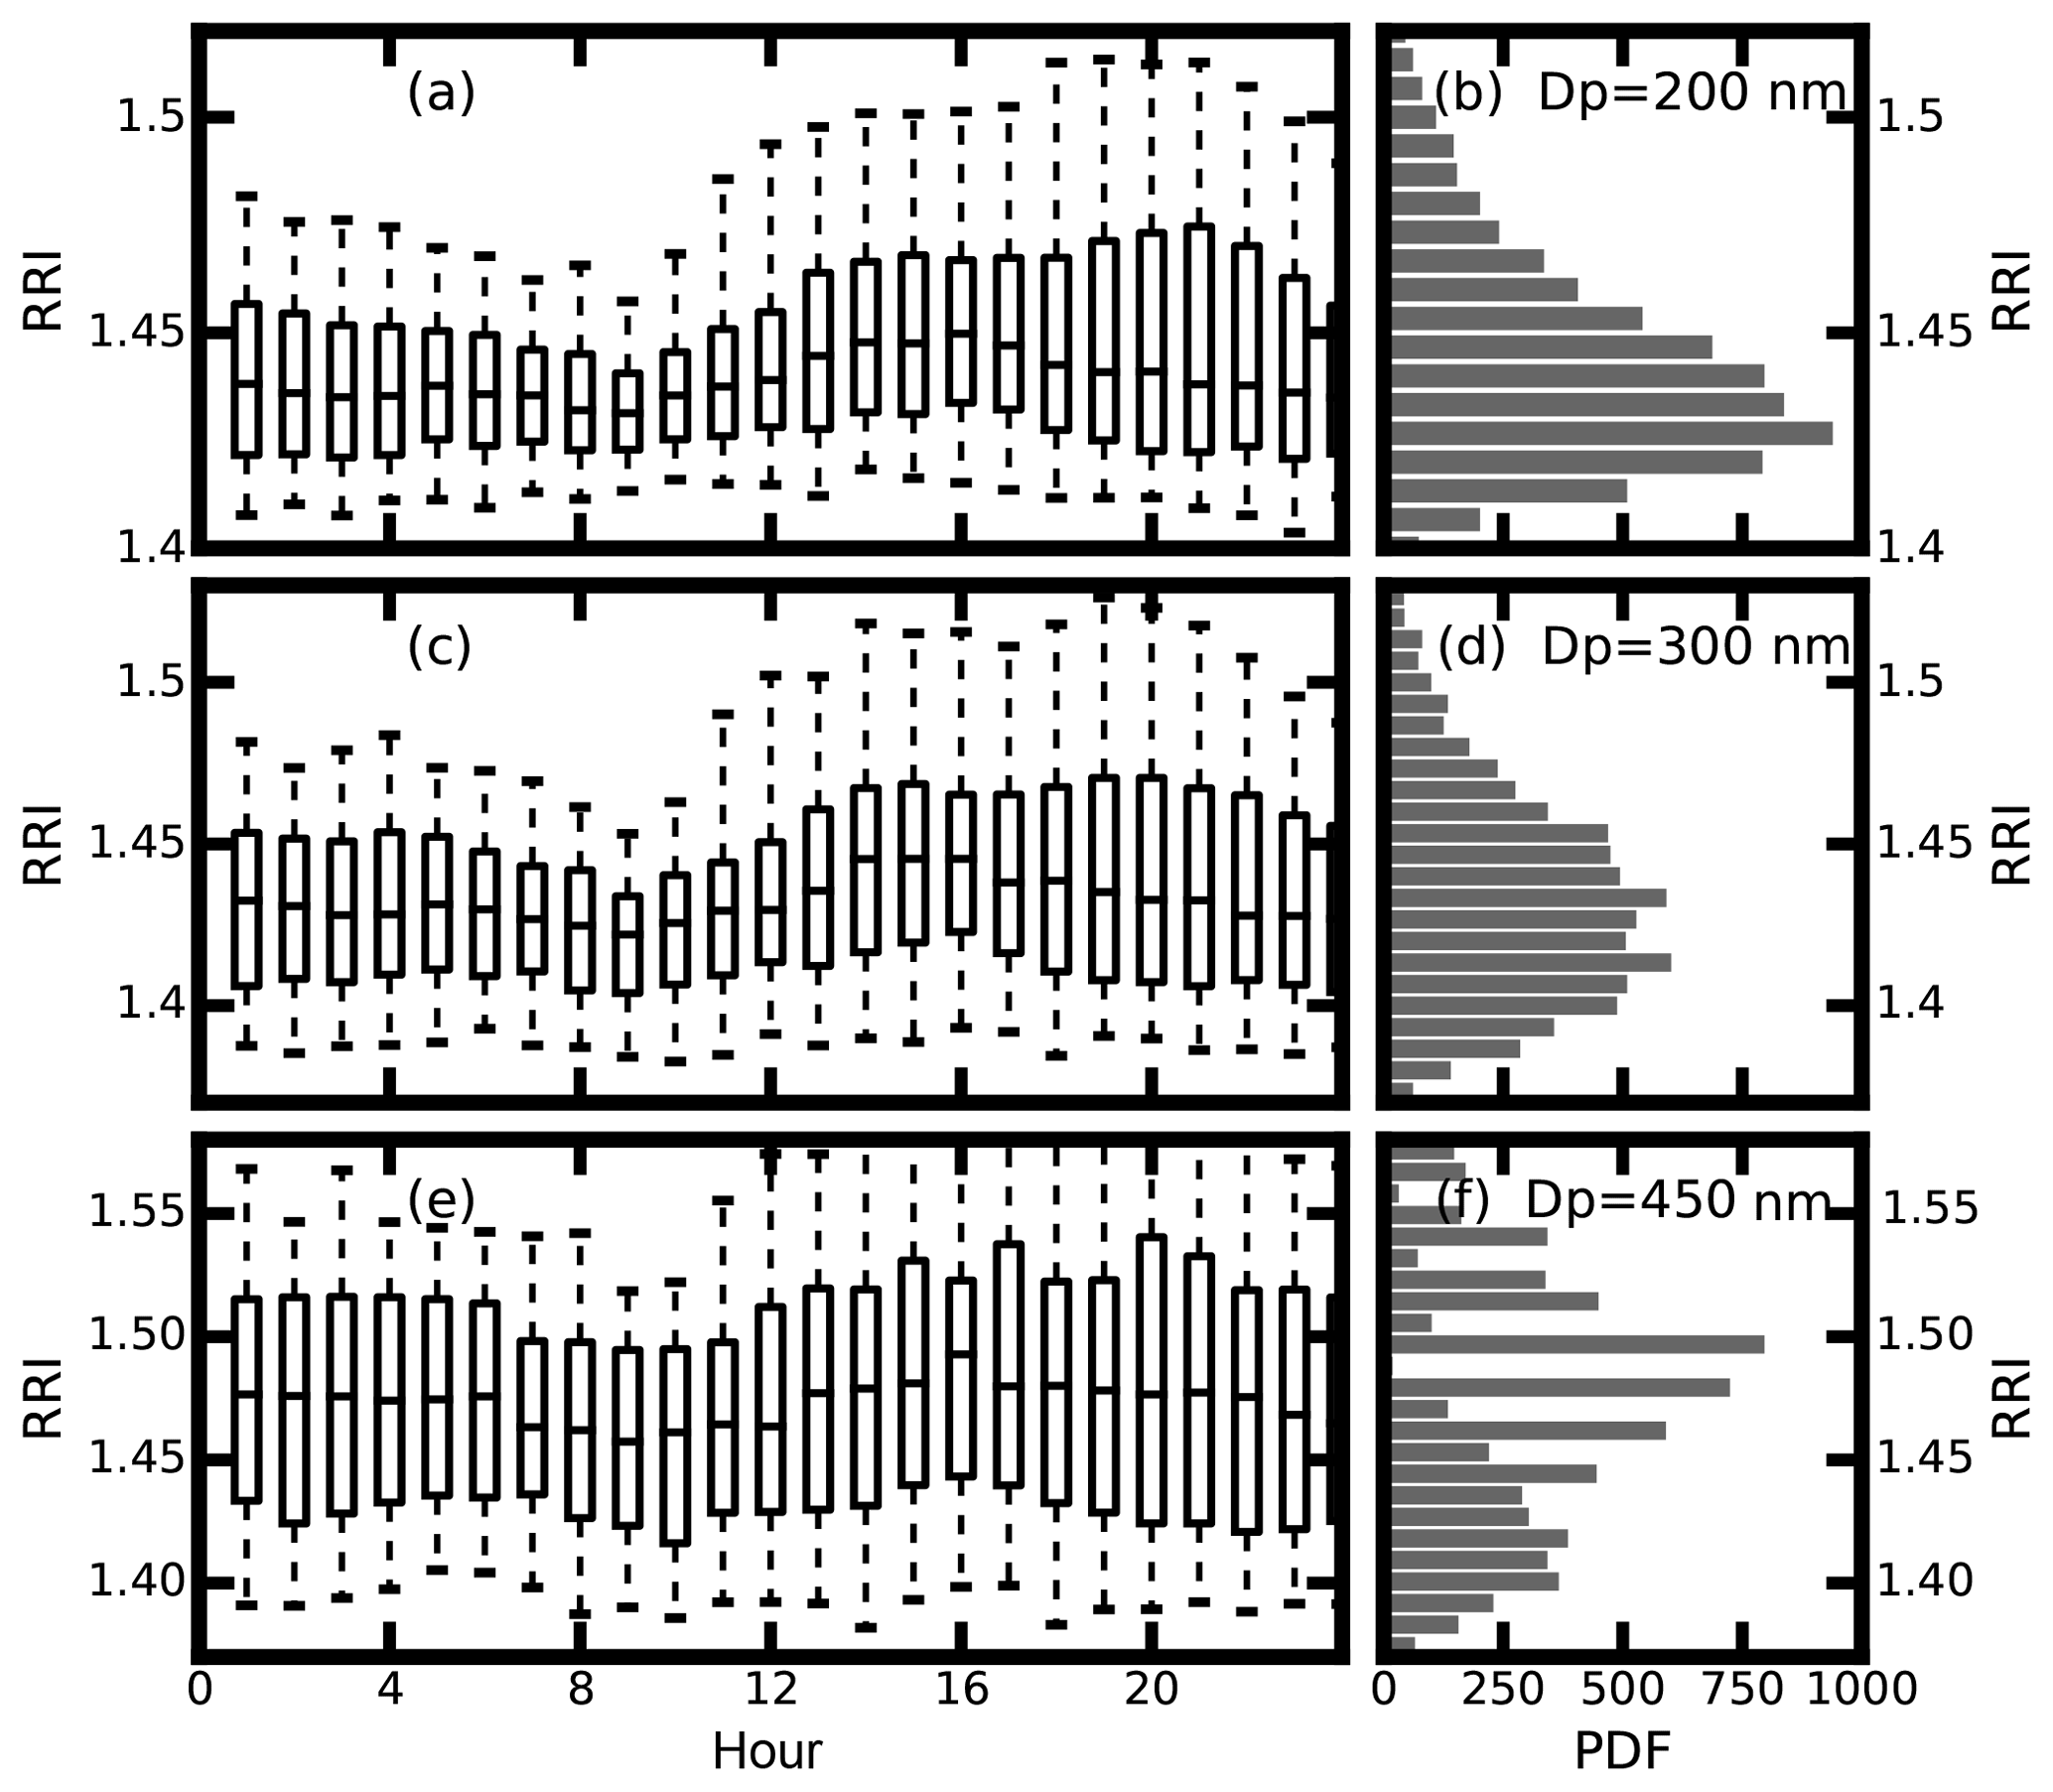
Figure 6Daily variations of the RRI (a, c, e) and the probability distribution of the measured RRI (b, d, f) for (a, b) 200 nm, (c, d) 300 nm and (e, f) 450 nm aerosol. The box-and-whisker plots represent the 5th, 25th, 75th and 95th percentiles.
As for the , the corresponding mean RRI values for aerosol diameters at 200, 300 and 450 nm are 1.425±0.031, 1.435±0.041 and 1.47±0.059. When comparing the probability distribution of the RRI for different diameters in Fig. 6, the RRI is more dispersed when the particle size increases, indicating that the aerosol compositions become complicated when the aerosol becomes aged. Figure 6a, c and e give the diurnal variation of the values at different particle sizes of 200, 300 and 450 nm. The RRI shows diurnal cycles for different diameters. They reach a peak at about 15:00 UTC and fall to the valley at around 09:00 UTC.
The range of the measured RRI (1.34–1.56) is a little wider than the literature values. Past measurements of ambient aerosol RRI values vary between 1.4 and 1.6 (Dubovik, 2002; Guyon et al., 2003; Zhang et al., 2016) over a different measurement site. This is the first time that such high variations in ambient aerosol RRI have been observed at one site.
The shows almost the same diurnal variations as the as shown Fig. S1 in the Supplement. The diurnal variations of the are more dispersed because the time period of measuring the is shorter (7 d) compared with the time of (28 d). It is evident that the ρeff increased with particle size. The difference of ρeff among different particle sizes should result from different contributions of chemical compositions, especially OM. Based on previous measurements of size-resolved chemical compositions using a micro-orifice uniform deposit impactor (MOUDI), the mass fraction of OM decreases with the increment of aerosol diameter (Hu et al., 2012). At the same time, the effective density of OM is lower than the other main inorganic compositions.
From Eqs. (1) and (2), the aerosol RRI can be determined by aerosol chemical composition (Liu and Daum, 2008). Many studies calculate the RRI using measurement results of the relative contributions of aerosol chemical composition (Yue et al., 1994; Hänel, 1968; Guyon et al., 2003; Stelson, 1990; Wex et al., 2002). However, there has been no comparison between the RRI calculated from chemical composition and the real-time measurement until now. In this study, the relationship between the measured RRI and the mass fraction of each ion component is investigated.
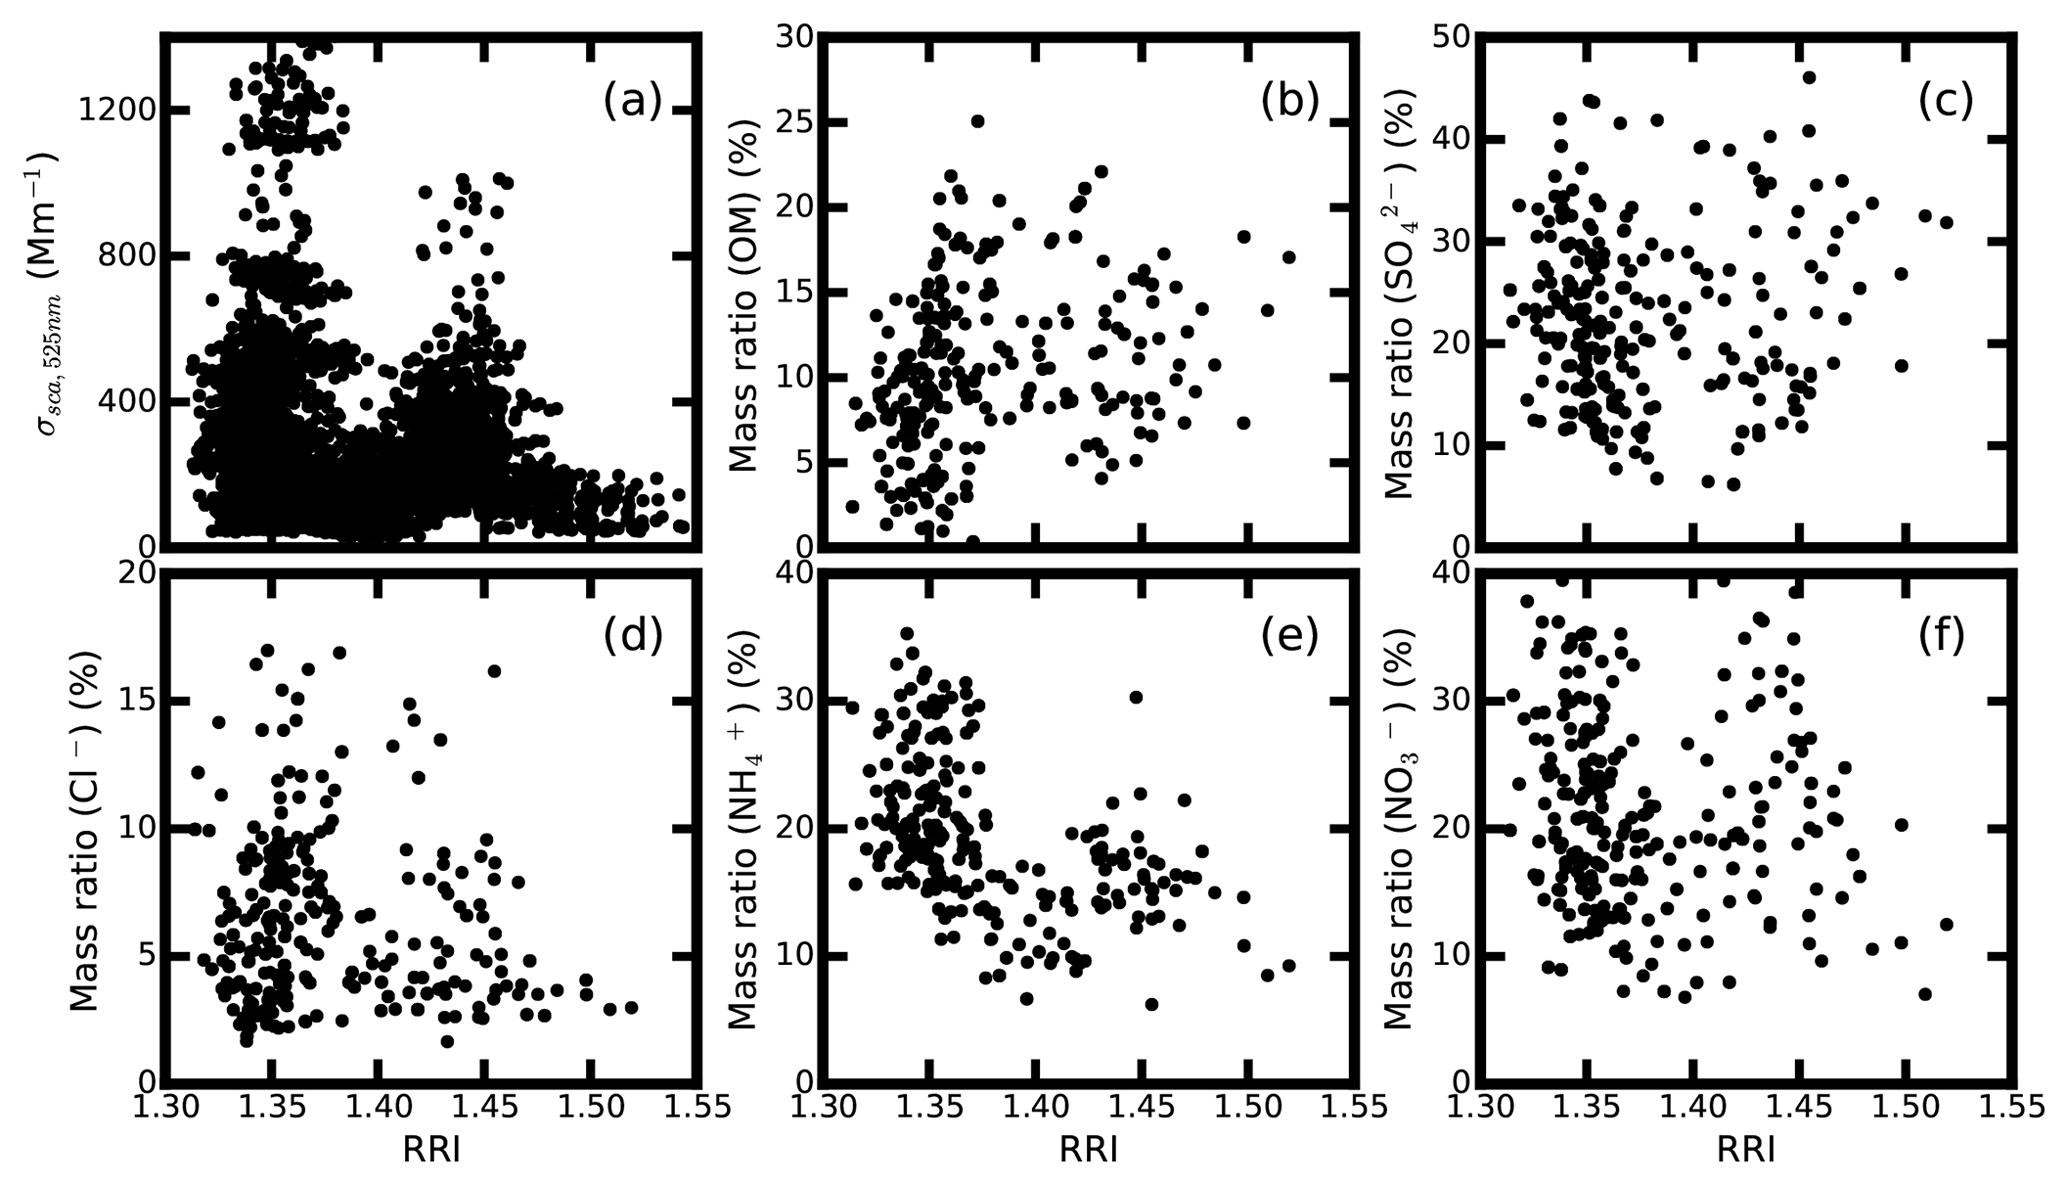
Figure 7Comparison of the measured RRI at 300 nm with the measured (a) σsca at 525 nm; mass fraction of (b) OM, (c) , (d) Cl−, (e) and (f) .
As illustrated in Fig. 7, the measured RRI values have an implicit relationship with the mass fraction of the σsca at 525 nm, OM, , Cl− and . The mass ratio of seems to be negatively correlated with the measured RRI. At the same time, the measured RRI values have no clear relationship with the absolute mass concentrations of the main aerosol chemical components, as shown in Fig. S2.
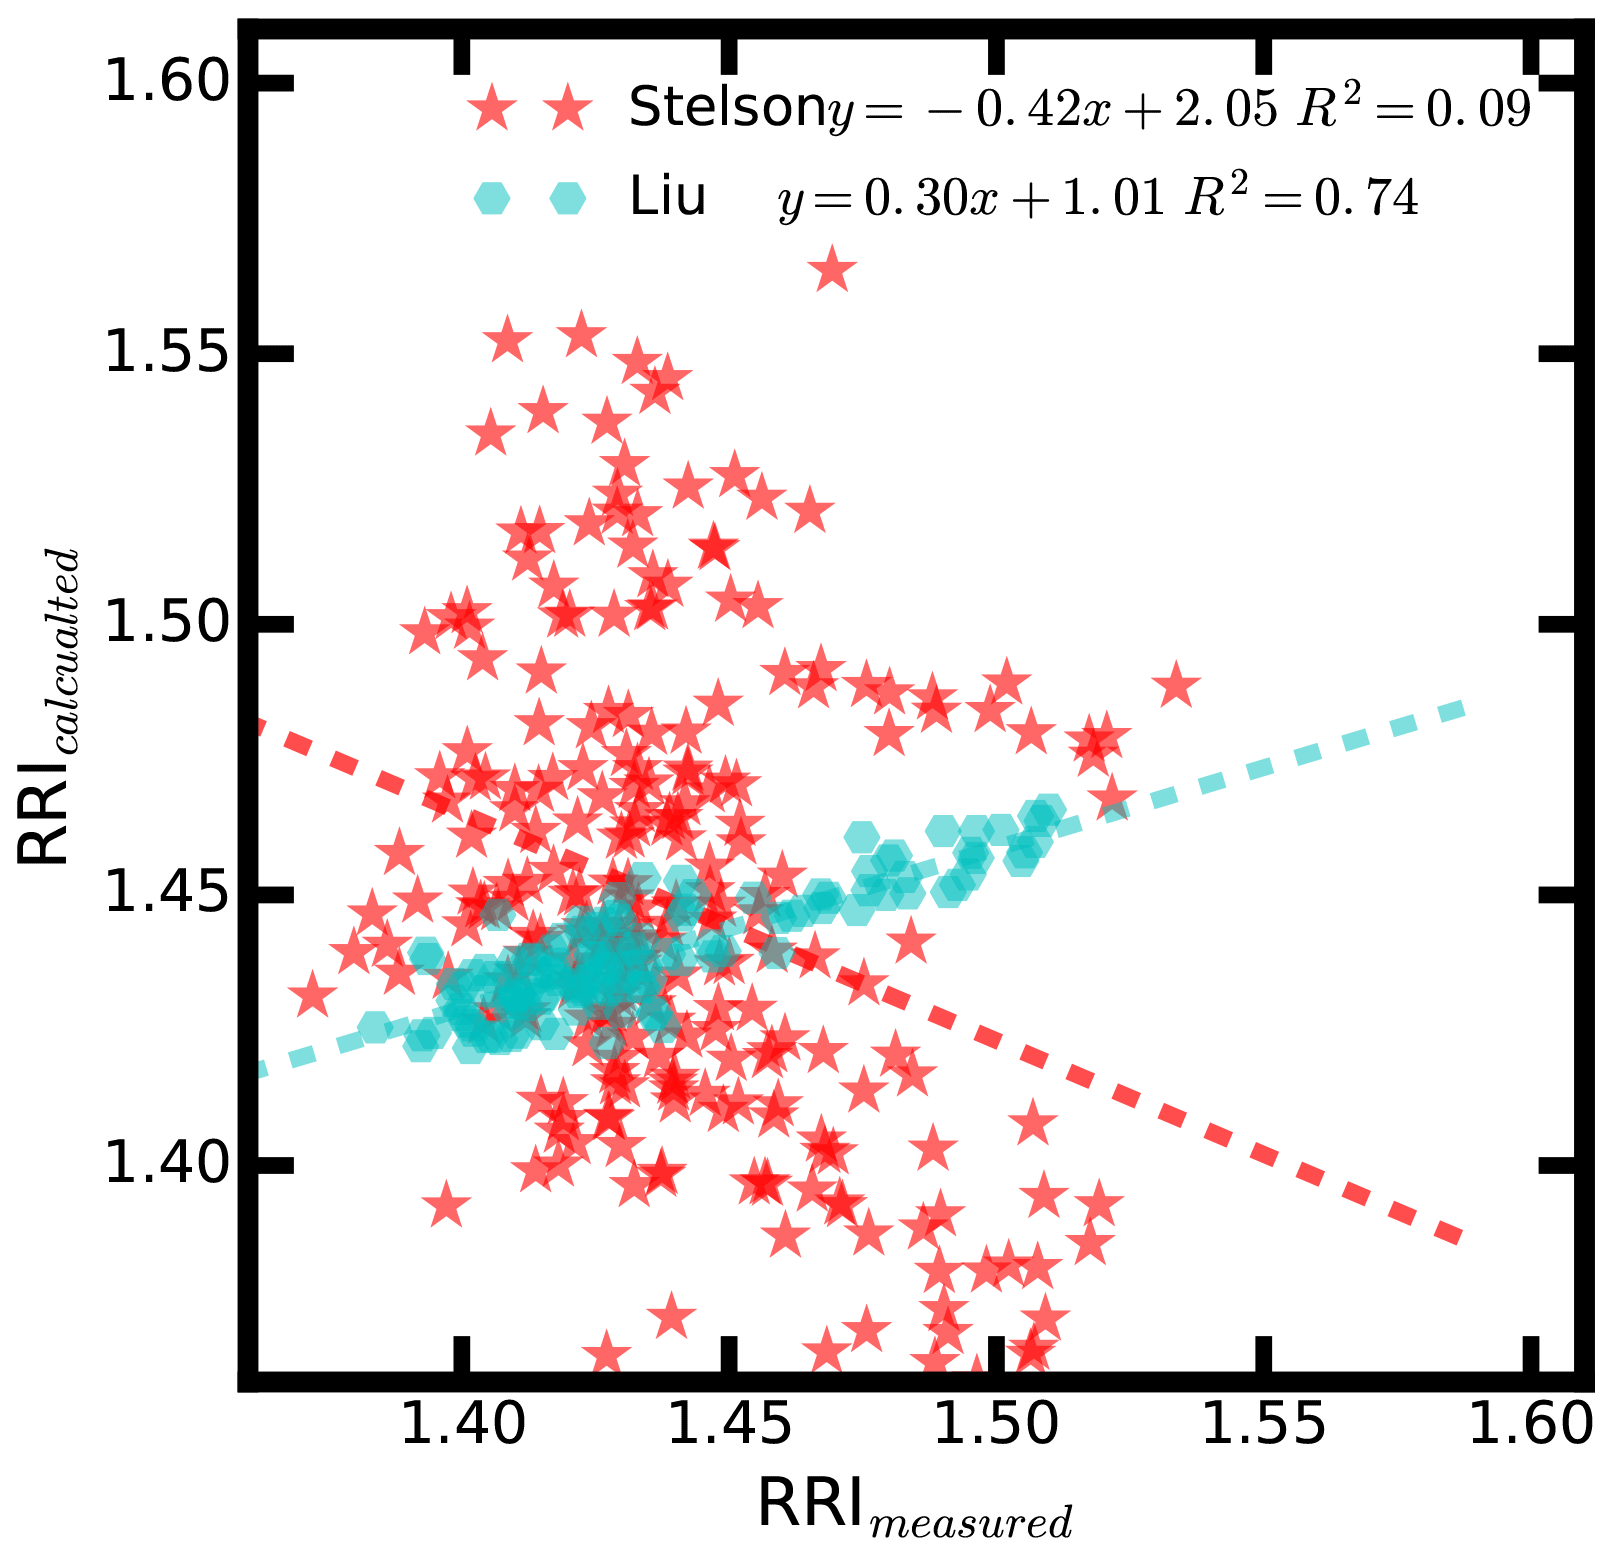
Figure 8Comparison between the measured RRI and calculated RRI using the main aerosol chemical component by applying the method of Stelson (1990) (red stars) and the parameterization scheme proposed by Liu and Daum (2008) (cyan hexagons).
The RRI is also calculated by applying the method proposed by Stelson (1990), in which the bulk chemical composition is used. The comparison between the calculated RRI and the measured RRI is shown in Fig. 8. It can be noticed that the calculated RRI and the measured RRI do not agree well. There are several factors that may cause the discrepancies. The first reason might be that the aerosol chemical information used in the method is the average mass of a whole aerosol population. The aerosol chemical composition may vary significantly among different sizes. Secondly, the OM of ambient aerosols is very complicated, and the influence of OM on the aerosol RRI has not been studied well. Therefore, more research is necessary when parameterizing the ambient aerosol RRI with the measured aerosol chemical composition.
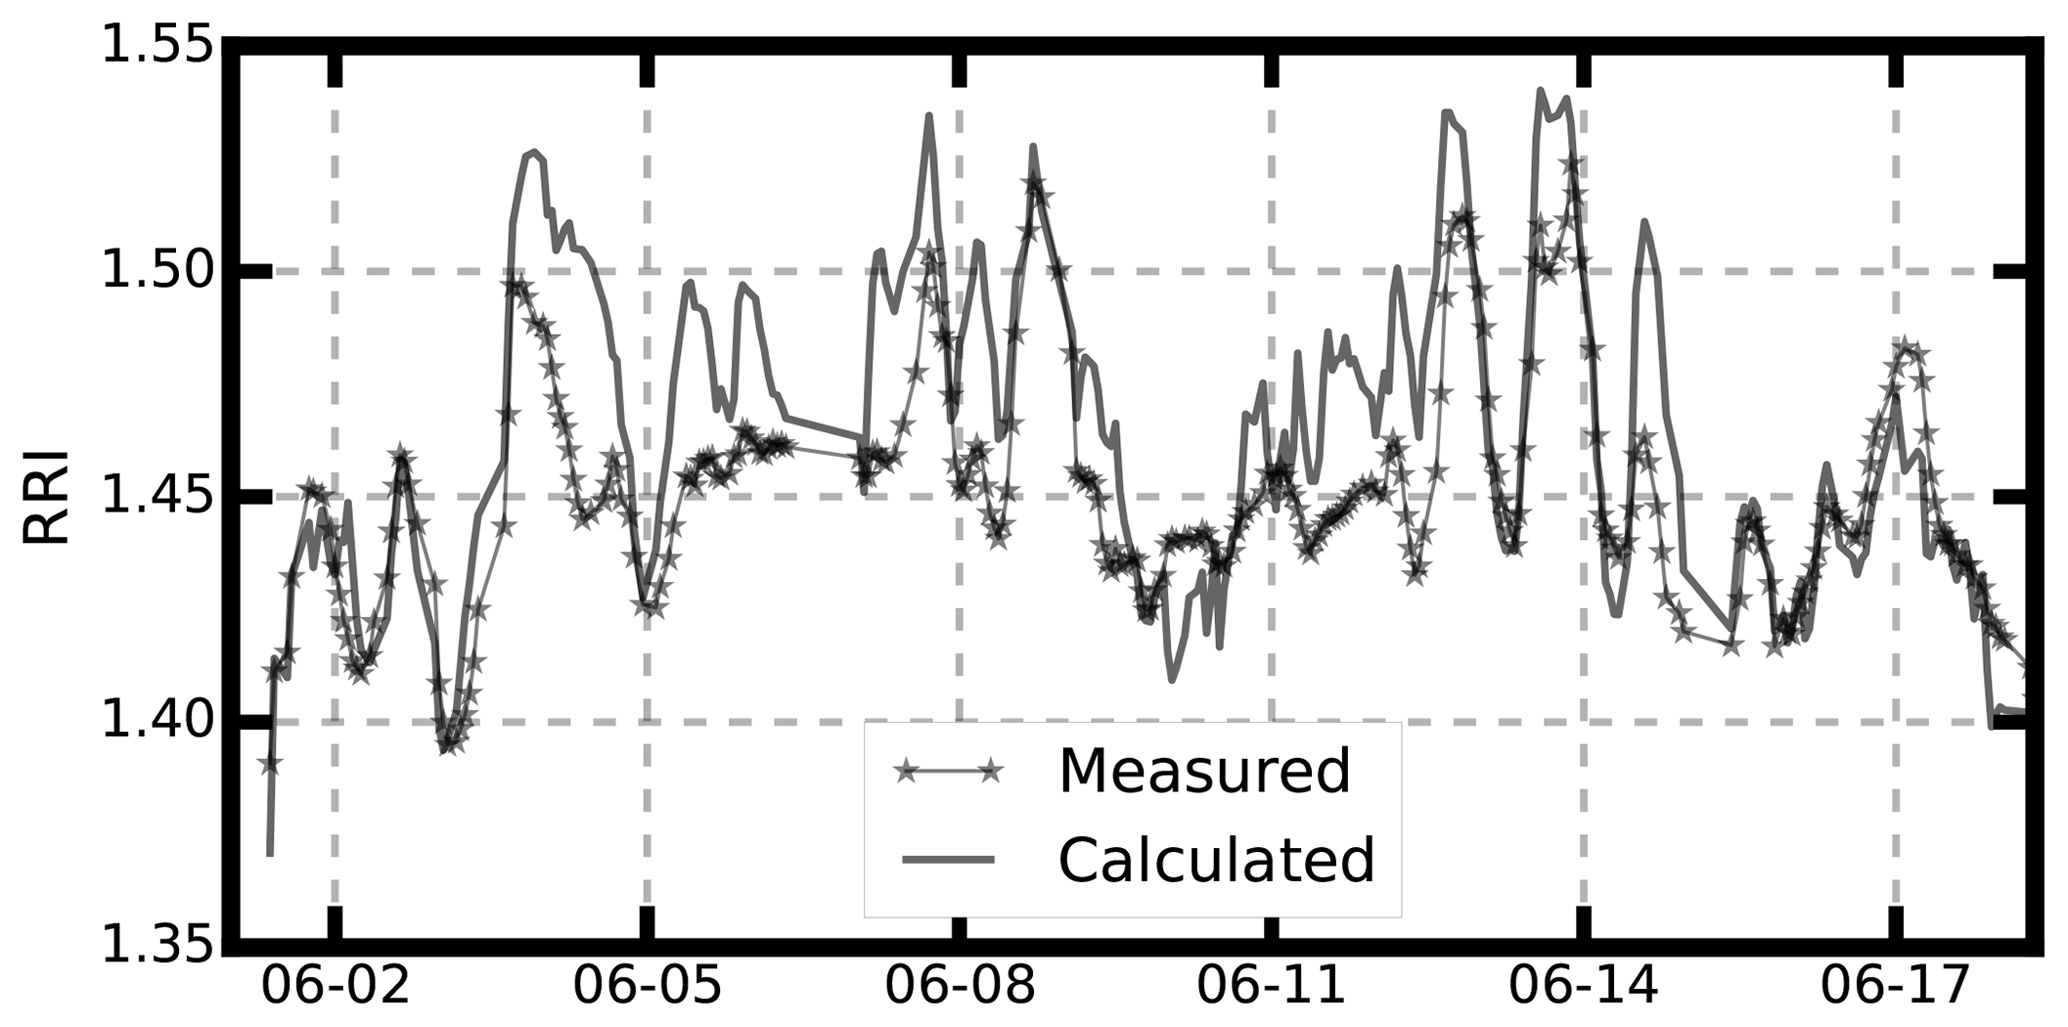
Figure 9Time series of the measured RRI at 300 nm and the calculated RRI using the aerosol bulk aerosol optical properties.
We demonstrate that the measured RRI at a given diameter of 300 nm is consistent with that of the RRIopt derived from bulk aerosol optical properties. The aerosol effective RRI of bulk aerosol was retrieved by applying the Mie scattering theory to the aerosol particle number size distribution (PNSD), aerosol bulk scattering coefficient and aerosol absorbing coefficient data (Cai et al., 2011). Figure 9 shows the time series of measured RRI and retrieved RRIopt. The results in Fig. 9 demonstrate that the measured RRI and retrieved RRIopt show good consistency with R2=0.58. Therefore, the measured size-resolved aerosol RRI can be used to represent the bulk aerosol optical properties. The measured RRI at 300 nm and calculated aerosol RRI using the bulk aerosol main chemical composition should to some extent be correlated with each other. However, as shown in Fig. 8, the measured RRI at 300 nm and calculated RRI using the method of Stelson (1990) has an R2 of 0.07. Therefore, calculating the ambient aerosol RRI using the bulk aerosol main inorganic component may lead to great uncertainties.

Figure 10Comparison between the measured and calculated RRI for the PKU (red circles) and Taizhou (cyan hexagons) station. The triangles in black, red, blue and green correspond to the data from Hänel (1968), Tang (1996), Hand and Kreidenweis (2002), and Guyon et al. (2003), respectively. The black dashed line is the 1:1 line.
4.1 Parameterizing the RRI using ρeff
As shown in Fig. 5, there is good consistency between the variation of the measured and . When defining the specific refractive index Re with , we found that the Re is highly correlated with ρeff with an R2 equaling 0.75 and slope 0.99 (Fig. 10). The linear relationship between the Re and ρeff is
The RRI can be calculated based on Eq. (6):
Based on Eq. (9) and Fig. 10, the aerosol RRI can be parameterized by the ρeff with high accuracy, and the uncertainties of the calculated RRI using Eq. (10) can be constrained within 0.025. The aerosol ρeff is easier to measure, and Eq. (10) might be used as a good probe of parameterizing the RRI.
The RRI values were also calculated using the parameterization scheme in Eq. (9) with field measurement data at the PKU site. The slope and correlation coefficient at the PKU site are 0.97 and 0.56, respectively. The calculated and measured RRI show good consistency. Therefore, this scheme is applicable for different seasons in both central China and the North China Plain. We also compared the measured RRI and calculated RRI using measured ρeff values that have been previously published (Hänel, 1968; Tang and Munkelwitz, 1994; Tang, 1996; Hand and Kreidenweis, 2002; Guyon et al., 2003). The measured and calculated RRI show good consistency with R2 of 0.91 and slope of 1.0. Therefore, our parameterization scheme is universal and applicable for urban aerosols.
This parameterization scheme is easy to use because the effective density is the only parameter used as input. We have demonstrated that the traditional method of calculating the RRI using aerosol main chemical components can have significant bias because the effects of organic aerosol are not considered. The RRI can be easy to calculate based on our parameterization scheme, as the effective density of ambient aerosol is rather easier to measure.
Liu and Daum (2008) summarized some of the measured RRI and the ρeff, then parameterized the RRI as
The feasibility of this scheme is tested here and the results are shown in Fig. 8. The measured and parameterized RRI using the method of Liu and Daum (2008) deviated from the 1:1 line. The relationship of the effective density and RRI was mainly determined from 4000 pure materials and few ambient aerosol data. However, the ambient aerosols were far from pure materials. At the same time, most of the pure materials have a negligible contribution to the total aerosol. Therefore, the parameterization scheme from Liu and Daum (2008) cannot adequately describe the relationships of the effective density and RRI of ambient aerosol.
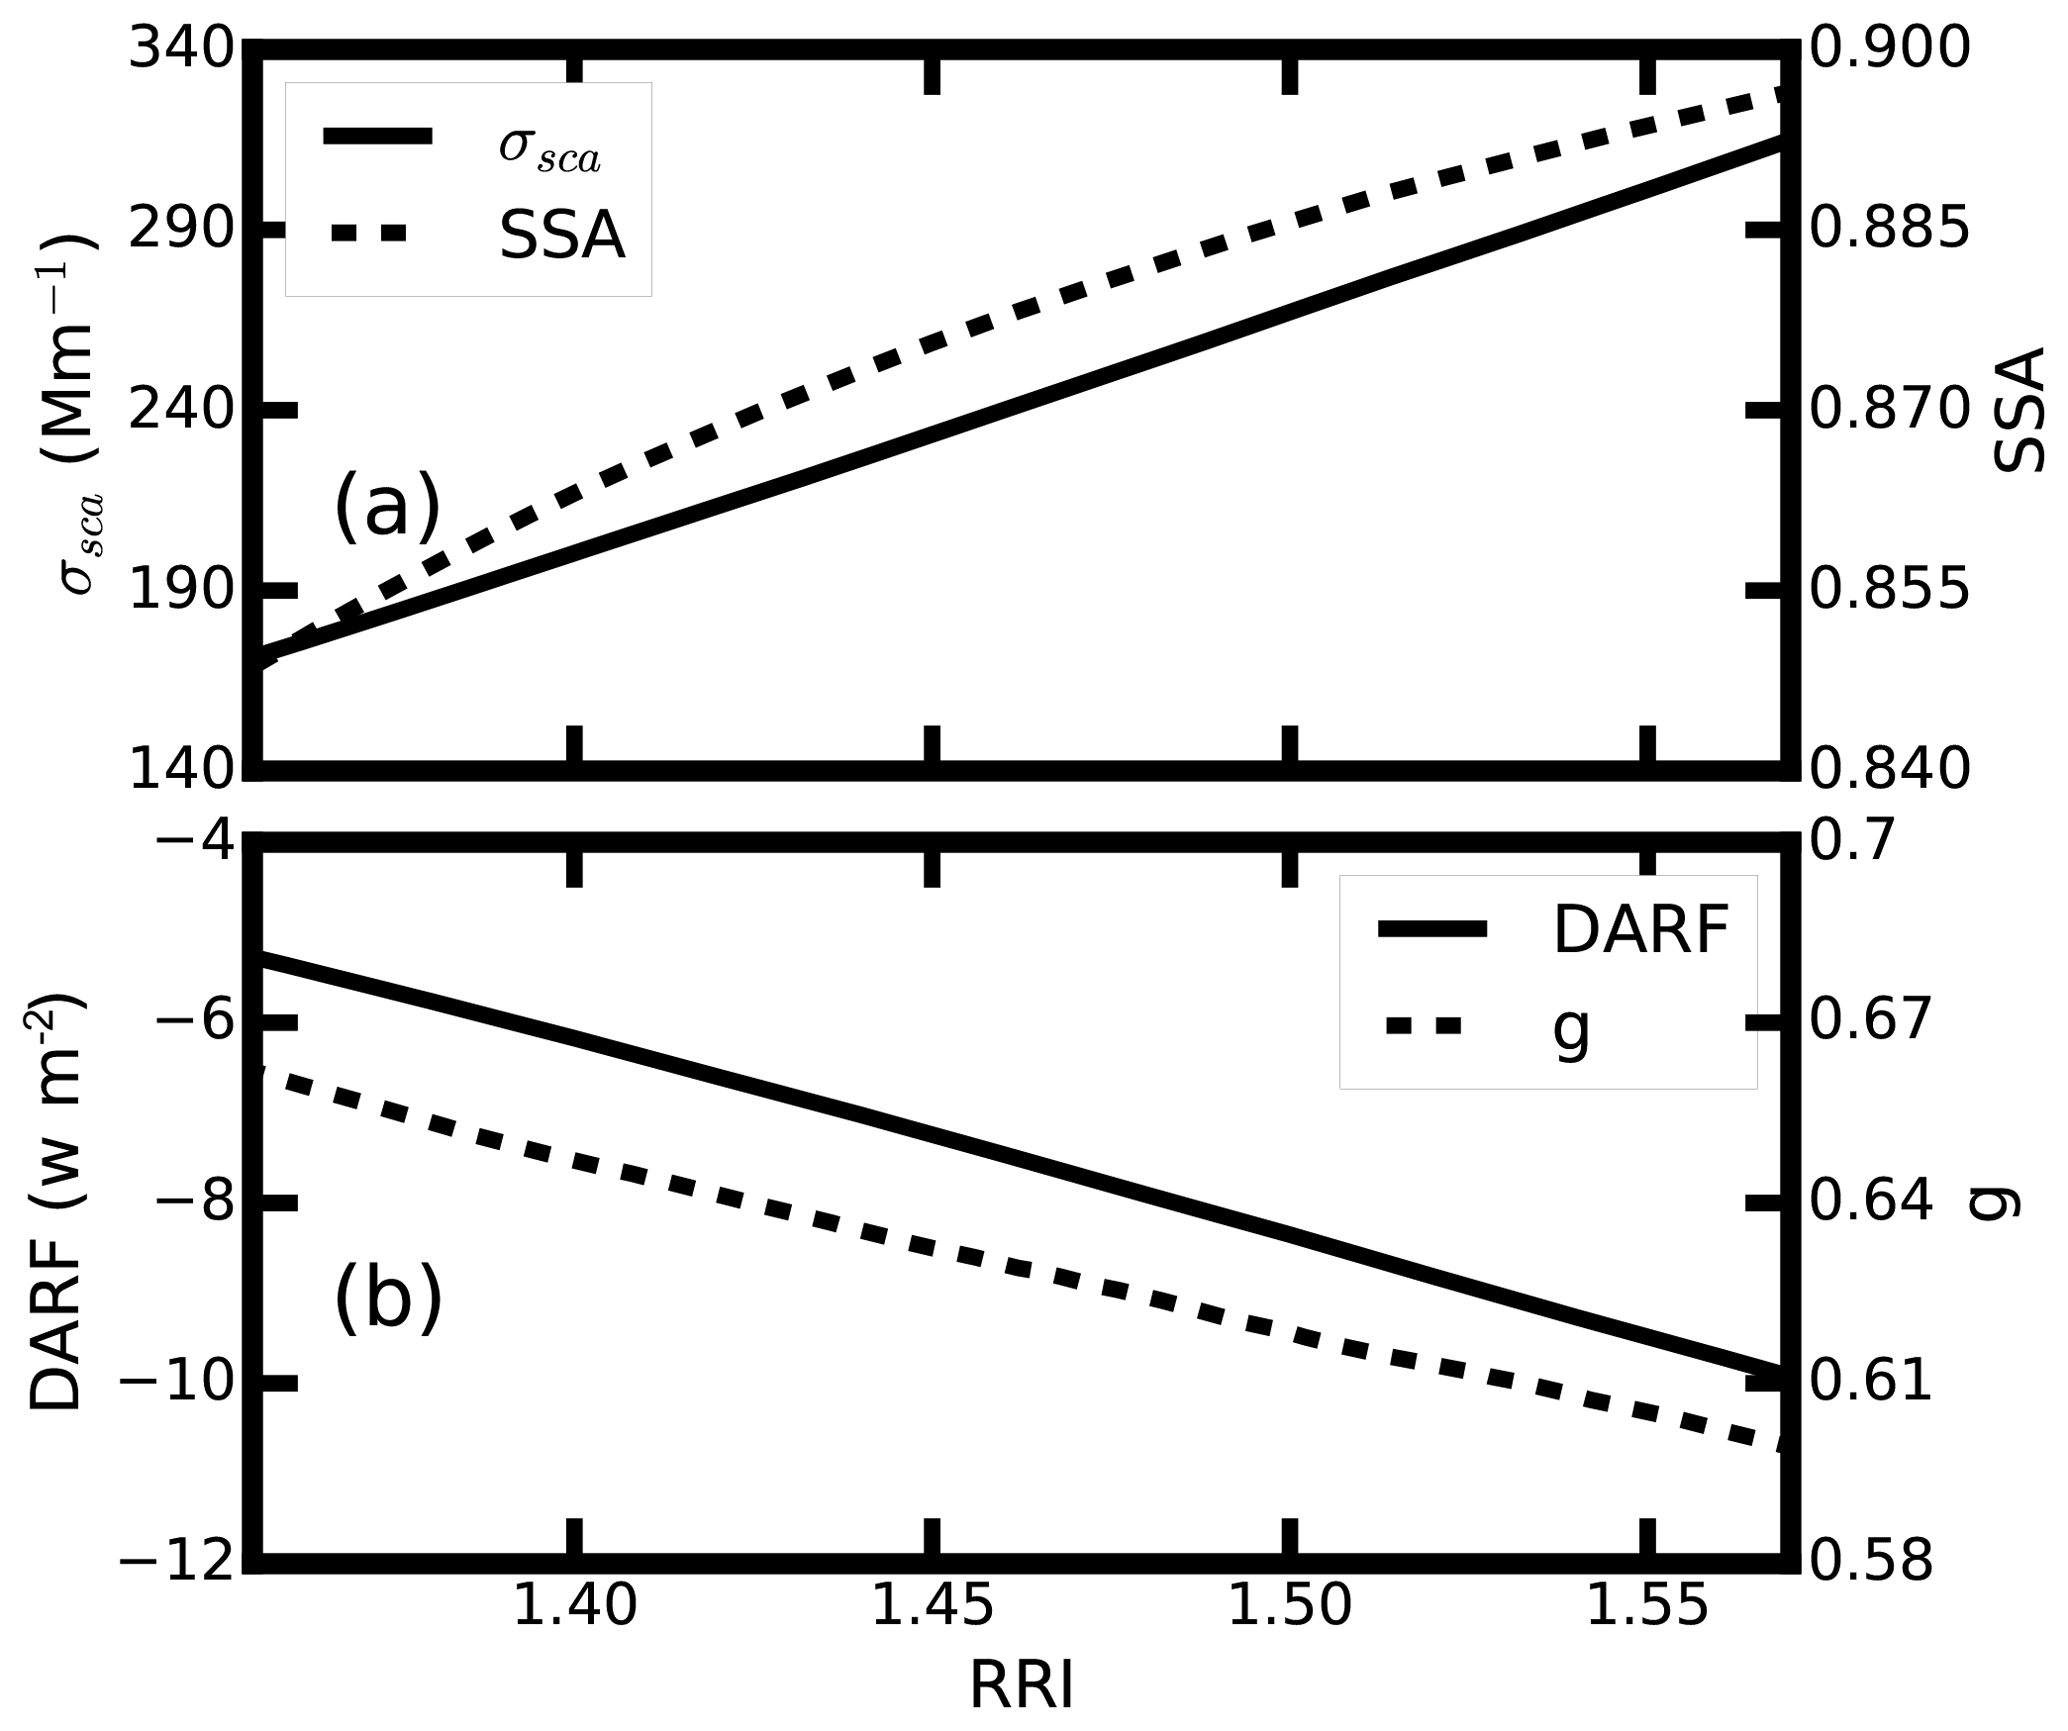
Figure 11Variations of the estimated (a) σsca as a solid line, SSA as a dotted line, (b) g as a dotted line and DARF as a solid line for different aerosol RRI values.
4.2 Influence of RRI variation on aerosol optical properties and radiative properties
The measured RRI varies between 1.34 and 1.56 during the field campaign. The corresponding aerosol optical properties are estimated. When estimating the aerosol optical properties with different aerosol RRI, the measured mean aerosol PNSD and mixing states are used. Figure 11 gives the variation of the aerosol σsca, SSA and g. In Fig. 11, the σsca varies from 162 to 308 Mm−1. The SSA varies between 0.843 and 0.895, which matches the variations of the dry aerosol SSA for different aerosol size distributions in the North China Plain (NCP) (Tao et al., 2014). As for the aerosol g, it decreases from 0.667 to 0.602 with the increment of the aerosol RRI. The ambient g values in the NCP are found to be within 0.55 and 0.66 (Zhao et al., 2018). Thus, the variations of the RRI have a significant influence on g. The aerosol optical properties change significantly with the variation of the ambient aerosol RRI.
The instant DARF values under different RRI are also estimated and the results are illustrated in Fig. 11b. When the aerosol RRI increases from 1.4 to 1.5, the DARF varies from −6.17 to −8.35, corresponding to 15 % variation in DARF. These values are in accordance with the work of Moise et al. (2015), who estimate that an increment of 12 % in the DARF occurs when the RRI varies from 1.4 to 1.5. The DARF can change from −4.9 to −10.14 W m−2 when the aerosol RRI increases from 1.34 to 1.56, which corresponds to 40 % variation in DARF. Great uncertainties may arise when estimating the aerosol radiative forcing using a constant RRI. The RRI should be different under different aerosol conditions. The real-time-measured RRI should be used rather than a constant RRI when estimating the ambient aerosol optical and radiative properties. However, the real-time measurement of ambient aerosol RRI is not available for most conditions. Therefore, parameterization of the ambient aerosol RRI is necessary.
The ambient aerosol RRI is a key parameter in determining aerosol optical properties, and knowledge of it can help constrain the uncertainties in aerosol radiative forcing. In this study, ambient aerosol was measured in East China from 24 May to 18 June 2018. Results show that the ambient aerosol RRI varies over a wide range between 1.34 and 1.56. The RRI increases slowly with the increment of the aerosol diameter. The mean aerosol RRI values are 1.425±0.031, 1.435±0.041 and 1.47±0.059 for aerosol diameters of 200, 300 and 450 nm, respectively. Probability distributions of the RRI show that the RRI is more dispersed with the increment of aerosol diameter, which reflects the complex aging process of ambient aerosol. The aerosol optical properties change significantly, and the DARF is estimated to vary by 40 %, corresponding to the variation of the measured ambient aerosol RRI. The real-time-measured RRI should be used rather than a constant RRI when estimating ambient aerosol optical and radiative properties.
We find that the ambient aerosol RRI is highly correlated with the ρeff rather than the main chemical compositions of aerosols. There is discrepancy between the measured and parameterized RRI using the concurrently measured main chemical inorganic compositions of ambient aerosol. This might result from two factors. The first one is that the aerosol chemical information used for the calculation is the total aerosol loading as the aerosol chemical compositions may change significantly among different sizes. Another one is that the influence of OM in ambient aerosols is not considered. The RRI of OM varies significantly for different compositions (Moise et al., 2015).
Despite the fact that the RRI is correlated with the ρeff, a parameterization scheme for the ambient aerosol RRI using ρeff is not available due to the lack of simultaneous measurements. For the first time, the and were measured simultaneously using our designed system. A new parameterization scheme for the ambient aerosol RRI using the ρeff is proposed based on the field measurement results. The measured and parameterized RRI values agree well, with a correlation coefficient of 0.75 and slope of 0.99. This simple scheme is reliable and ready to use in the calculation of aerosol optical and radiative properties. The corresponding measurement results can also be further used in climate models.
The data used in this study are available upon request from the authors.
The supplement related to this article is available online at: https://doi.org/10.5194/acp-19-12875-2019-supplement.
GZ, CZ, WZ and SG designed and conducted the experiments; PT, TY and GZ discussed the results.
The authors declare that they have no conflict of interest.
This research has been supported by the National Natural Science Foundation of China (grant no. 41590872) and the National Key R&D Program of China (grant no. 2016YFC020000: Task 5).
This paper was edited by Jianping Huang and reviewed by five anonymous referees.
An, Z., Huang, R.-J., Zhang, R., Tie, X., Li, G., Cao, J., Zhou, W., Shi, Z., Han, Y., Gu, Z., and Ji, Y.: Severe haze in northern China: A synergy of anthropogenic emissions and atmospheric processes, P. Natl. Acad. Sci. USA, 116, 8657–8666, https://doi.org/10.1073/pnas.1900125116, 2019.
Bohren, C. F. and Huffman, D. R.: Absorption and Scattering by a Sphere, in: Absorption and Scattering of Light by Small Particles, Wiley-VCH Verlag GmbH, 82–129, 2007.
Cai, Y., Montague, D. C., and Deshler, T.: Comparison of measured and calculated scattering from surface aerosols with an average, a size-dependent, and a time-dependent refractive index, J. Geophys. Res., 116, https://doi.org/10.1029/2010jd014607, 2011.
Dubovik, O.: Variability of absorption and optical properties of key aerosol types observed in worldwide locations, J. Atmos. Sci., 59, 590–608, 2002.
Guyon, P., Boucher, O., Graham, B., Beck, J., Mayol-Bracero, O. L., Roberts, G. C., Maenhaut, W., Artaxo, P., and Andreae, M. O.: Refractive index of aerosol particles over the Amazon tropical forest during LBA-EUSTACH 1999, J. Aerosol Sci., 34, 883–907, https://doi.org/10.1016/s0021-8502(03)00052-1, 2003.
Han, Y., Lü, D., Rao, R., and Wang, Y.: Determination of the complex refractive indices of aerosol from aerodynamic particle size spectrometer and integrating nephelometer measurements, Appl. Opt., 48, 4108–4117, https://doi.org/10.1364/AO.48.004108, 2009.
Hand, J. L. and Kreidenweis, S. M.: A New Method for Retrieving Particle Refractive Index and Effective Density from Aerosol Size Distribution Data, Aerosol Sci. Tech., 36, 1012–1026, https://doi.org/10.1080/02786820290092276, 2002.
Hänel, G.: Real part of mean complex refractive index and mean density of samples of atmospheric aerosol particles, Tellus, 20, 371–379, https://doi.org/10.3402/tellusa.v20i3.10016, 1968.
Hu, M., Peng, J., Sun, K., Yue, D., Guo, S., Wiedensohler, A., and Wu, Z.: Estimation of size-resolved ambient particle density based on the measurement of aerosol number, mass, and chemical size distributions in the winter in Beijing, Environ. Sci. Technol., 46, 9941–9947, https://doi.org/10.1021/es204073t, 2012.
Knutson, E. O. and Whitby, K. T.: Aerosol classification by electric mobility: apparatus, theory, and applications, J. Aerosol Sci., 6, 443–451, https://doi.org/10.1016/0021-8502(75)90060-9, 1975.
Kuang, Y., Zhao, C. S., Tao, J. C., and Ma, N.: Diurnal variations of aerosol optical properties in the North China Plain and their influences on the estimates of direct aerosol radiative effect, Atmos. Chem. Phys., 15, 5761–5772, https://doi.org/10.5194/acp-15-5761-2015, 2015.
Kuang, Y., Zhao, C. S., Tao, J. C., Bian, Y. X., and Ma, N.: Impact of aerosol hygroscopic growth on the direct aerosol radiative effect in summer on North China Plain, Atmos. Environ., 147, 224–233, 2016.
Levoni, C., Cervino, M., Guzzi, R., and Torricella, F.: Atmospheric aerosol optical properties: a database of radiative characteristics for different components and classes, Appl. Opt., 36, 8031–8041, 1997.
Lide, D. R.: Handbook of Chemistry and Physics, 86th Edition Edited(National Institute of Standards and Technology), J. Am. Chem. Soc., 128, 5585–5585, https://doi.org/10.1021/ja059868l, 2006.
Liu, H. J., Zhao, C. S., Nekat, B., Ma, N., Wiedensohler, A., van Pinxteren, D., Spindler, G., Müller, K., and Herrmann, H.: Aerosol hygroscopicity derived from size-segregated chemical composition and its parameterization in the North China Plain, Atmos. Chem. Phys., 14, 2525–2539, https://doi.org/10.5194/acp-14-2525-2014, 2014.
Liu, Y. and Daum, P. H.: Relationship of refractive index to mass density and self-consistency of mixing rules for multicomponent mixtures like ambient aerosols, J. Aerosol Sci., 39, 974–986, https://doi.org/10.1016/j.jaerosci.2008.06.006, 2008.
Ma, N., Zhao, C. S., Nowak, A., Müller, T., Pfeifer, S., Cheng, Y. F., Deng, Z. Z., Liu, P. F., Xu, W. Y., Ran, L., Yan, P., Göbel, T., Hallbauer, E., Mildenberger, K., Henning, S., Yu, J., Chen, L. L., Zhou, X. J., Stratmann, F., and Wiedensohler, A.: Aerosol optical properties in the North China Plain during HaChi campaign: an in-situ optical closure study, Atmos. Chem. Phys., 11, 5959–5973, https://doi.org/10.5194/acp-11-5959-2011, 2011.
Moise, T., Flores, J. M., and Rudich, Y.: Optical properties of secondary organic aerosols and their changes by chemical processes, Chem. Rev., 115, 4400–4439, 2015.
Müller, T., Laborde, M., Kassell, G., and Wiedensohler, A.: Design and performance of a three-wavelength LED-based total scatter and backscatter integrating nephelometer, Atmos. Meas. Tech., 4, 1291–1303, https://doi.org/10.5194/amt-4-1291-2011, 2011.
Peng, J., Hu, M., Guo, S., Du, Z., Zheng, J., Shang, D., Levy Zamora, M., Zeng, L., Shao, M., Wu, Y.-S., Zheng, J., Wang, Y., Glen, C. R., Collins, D. R., Molina, M. J., and Zhang, R.: Markedly enhanced absorption and direct radiative forcing of black carbon under polluted urban environments, P. Natl. Acad. Sci. USA, 113, 4266–4271, https://doi.org/10.1073/pnas.1602310113, 2016.
Qiao, K., Wu, Z., Pei, X., Liu, Q., Shang, D., Zheng, J., Du, Z., Zhu, W., Wu, Y., Lou, S., Guo, S., Chan, C. K., Pathak, R. K., Hallquist, M., and Hu, M.: Size-resolved effective density of submicron particles during summertime in the rural atmosphere of Beijing, China, J. Environ. Sci., 73, 69–77, https://doi.org/10.1016/j.jes.2018.01.012, 2018.
Ricchiazzi, P., Yang, S., Gautier, C., and Sowle, D.: SBDART: A Research and Teaching Software Tool for Plane-Parallel Radiative Transfer in the Earth's Atmosphere, B. Am. Meteorol. Soc., 79, 2101–2114, https://doi.org/10.1175/1520-0477(1998)079<2101:sarats>2.0.co;2, 1998.
Seinfeld, J. H., Pandis, S. N., and Noone, K.: Atmospheric Chemistry and Physics: From Air Pollution to Climate Change, Environ. Sci. Policy, 40, 26–26, 1998.
Stelson, A. W.: Urban aerosol refractive index prediction by partial molar refraction approach, Environ. Sci. Technol., 24, 1676–1679, 1990.
Tang, I. N.: Chemical and size effects of hygroscopic aerosols on light scattering coefficients, J. Geophys. Res.-Atmos., 101, 19245–19250, https://doi.org/10.1029/96jd03003, 1996.
Tang, I. N. and Munkelwitz, H. R.: Water activities, densities, and refractive-indexes of aqueous sulfates and sodium-nitrate droplets of atmospheric importance, J. Geophys. Res.-Atmos., 99, 18801–18808, https://doi.org/10.1029/94jd01345, 1994.
Tao, J. C., Zhao, C. S., Ma, N., and Liu, P. F.: The impact of aerosol hygroscopic growth on the single-scattering albedo and its application on the NO2 photolysis rate coefficient, Atmos. Chem. Phys., 14, 12055–12067, https://doi.org/10.5194/acp-14-12055-2014, 2014.
Wang, Y., Khalizov, A., Levy, M., and Zhang, R.: New Directions: Light absorbing aerosols and their atmospheric impacts, Atmos. Environ., 81, 713–715, https://doi.org/10.1016/j.atmosenv.2013.09.034, 2013.
Wex, H., Neusüß, C., Wendisch, M., Stratmann, F., Koziar, C., Keil, A., Wiedensohler, A., and Ebert, M.: Particle scattering, backscattering, and absorption coefficients: An in situ closure and sensitivity study, J. Geophys. Res.-Atmos., 107, LAC 4-1-LAC 4-18, https://doi.org/10.1029/2000jd000234, 2002.
Yue, G. K., Poole, L. R., Wang, P. H., and Chiou, E. W.: Stratospheric aerosol acidity, density, and refractive-index deduced from sage-II and nmc temperature data, J. Geophys. Res.-Atmos., 99, 3727–3738, https://doi.org/10.1029/93jd02989, 1994.
Zarzana, K. J., Cappa, C. D., and Tolbert, M. A.: Sensitivity of Aerosol Refractive Index Retrievals Using Optical Spectroscopy, Aerosol Sci. Tech., 48, 1133–1144, https://doi.org/10.1080/02786826.2014.963498, 2014.
Zhao, G., Zhao, C., Kuang, Y., Tao, J., Tan, W., Bian, Y., Li, J., and Li, C.: Impact of aerosol hygroscopic growth on retrieving aerosol extinction coefficient profiles from elastic-backscatter lidar signals, Atmos. Chem. Phys., 17, 12133–12143, https://doi.org/10.5194/acp-17-12133-2017, 2017.
Zhao, G., Zhao, C., Kuang, Y., Bian, Y., Tao, J., Shen, C., and Yu, Y.: Calculating the aerosol asymmetry factor based on measurements from the humidified nephelometer system, Atmos. Chem. Phys., 18, 9049–9060, https://doi.org/10.5194/acp-18-9049-2018, 2018.
Zhao, G., Zhao, W., and Zhao, C.: Method to measure the size-resolved real part of aerosol refractive index using differential mobility analyzer in tandem with single-particle soot photometer, Atmos. Meas. Tech., 12, 3541–3550, https://doi.org/10.5194/amt-12-3541-2019, 2019.
Zhang, G., Bi, X., Qiu, N., Han, B., Lin, Q., Peng, L., Chen, D., Wang, X., Peng, P., Sheng, G., and Zhou, Z.: The real part of the refractive indices and effective densities for chemically segregated ambient aerosols in Guangzhou measured by a single-particle aerosol mass spectrometer, Atmos. Chem. Phys., 16, 2631–2640, https://doi.org/10.5194/acp-16-2631-2016, 2016.
Zhang, R., Wang, G., Guo, S., Zamora, M. L., Ying, Q., Lin, Y., Wang, W., Hu, M., and Wang, Y.: Formation of urban fine particulate matter, Chem. Rev., 115, 3803–3855, 2015.