the Creative Commons Attribution 4.0 License.
the Creative Commons Attribution 4.0 License.
 | 08 Oct 2019
Foreign influences on tropospheric ozone over East Asia through global atmospheric transport
Huiling Yuan
Tijian Wang
Bingliang Zhuang
Xun Zhang
Tropospheric ozone in East Asia is influenced by the transport of ozone from foreign regions around the world. However, the magnitudes and variations in such influences remain unclear. This study was performed to investigate the influences using a global chemical transport model, GEOS-Chem, through the tagged ozone and emission perturbation simulations. The results show that foreign ozone is transported to East Asia (20–60∘ N, 95–150∘ E) mainly through the middle and upper troposphere. In East Asia, the influence of foreign ozone increases rapidly with altitude. In the middle and upper troposphere, the regional mean concentrations of foreign ozone range from 32 to 65 ppbv, being 0.8–4.8 times higher than its native counterpart (11–18 ppbv). Annually, ∼60 % of foreign ozone in the East Asian middle and upper troposphere comes from North America (5–13 ppbv) and Europe (5–7 ppbv), as well as from foreign oceanic regions (9–21 ppbv). Over the East Asian tropospheric columns, foreign ozone appears most in spring when ozone concentrations in the foreign regions are high and the westerlies are strong and least in summer when the South Asian High blocks eastward foreign ozone from reaching East Asia south of 35∘ N. At the East Asian surface, the annual mean of foreign ozone concentrations is ∼22.2 ppbv, which is comparable to its native counterpart of ∼20.4 ppbv. In the meantime, the annual mean of anthropogenic ozone concentrations from foreign regions is ∼4.7 ppbv, half of which comes from North America (1.3 ppbv) and Europe (1.0 ppbv). Seasonally, foreign ozone concentrations at the East Asian surface are highest in winter (27.1 ppbv) and lowest in summer (16.5 ppbv). This strong seasonality is largely modulated by the East Asian monsoon (EAM) via its influence on vertical motion. The large-scale subsidence prevailing during the East Asian winter monsoon (EAWM) favours the downdraft of foreign ozone to the surface, while widespread convection in the East Asian summer monsoon (EASM) blocks such transport. Interannually, the variation in foreign ozone at the East Asian surface is found to be closely related to the intensity of the EAM. Specifically, the stronger the EAWM is in a winter, the more ozone from North America and Europe reaches the East Asian surface because of the stronger subsidence behind the East Asian trough. In summer, ozone from South and South-east Asia is reduced in strong EASM years due to weakened south-westerly monsoon winds. This study suggests substantial foreign influences on ozone at the East Asian surface and in its tropospheric columns. It also underscores the importance of the EAM in the seasonal and interannual variations in foreign influences on surface ozone in East Asia.
- Article
(10952 KB) -
Supplement
(1064 KB) - BibTeX
- EndNote


Tropospheric ozone is a major pollutant, atmospheric oxidant, and greenhouse gas (Monks et al., 2015). Its sources include photochemical production in the troposphere and downward transport of ozone from the stratosphere (Lelieveld and Dentener, 2000; Gettelman et al., 2011). Having a lifetime of weeks to months in the free troposphere, ozone can be transported across regions and continents, driven by atmospheric circulation (HTAP, 2010). Therefore, tropospheric ozone in a region is affected by both native and foreign emissions of ozone precursors and various physical and chemical processes (Doherty et al., 2017; Huang et al., 2017; Han et al., 2018). Atmospheric transport makes ozone pollution a globalized issue related to health (Liang et al., 2018), ecosystems (Zhang et al., 2017), and climate (B. Li et al., 2016). For example, the Task Force on Hemispheric Transport of Air Pollution (TF HTAP) (Galmarini et al., 2017) has been established under the UNECE Convention on Long-Range Transboundary Air Pollution to improve the understanding of the intercontinental transport of air pollutants across the Northern Hemisphere. In recent years, East Asia has experienced increasingly severe ozone pollution (Gaudel et al., 2018; Lu et al., 2018). Through trans-Pacific and trans-Atlantic transport, ozone precursors emitted or ozone produced in East Asia can affect the ozone levels in North America (Verstraeten et al., 2015; Dunker et al., 2017; Nopmongcol et al., 2017) and Europe (Karamchandani et al., 2017; Knowland et al., 2017; Jonson et al., 2018). Therefore, research on ozone outflow from East Asia to other areas of the world has been active, while relatively less attention has been paid to the ozone inflow from foreign regions to East Asia.
Concerning air quality, most previous studies focused on foreign influences on ozone in the lower troposphere or at the surface in East Asia. These studies showed that the concentrations of ozone from foreign regions are larger at the East Asian surface in colder seasons (November–April) than in warmer seasons (May–October) (Fiore et al., 2009; Nagashima et al., 2010; Wang et al., 2011; Yoshitomi et al., 2011). They also found an uneven distribution of imported ozone from foreign regions at the East Asian surface (Hou et al., 2014; Y. Zhu et al., 2017; Han et al., 2018) and assessed the anthropogenic impacts from individual source regions (Ni et al., 2018). For example, several studies suggested that 1–3 ppbv and ∼1 ppbv of surface ozone in East Asia in spring can be, respectively, attributed to European (Holloway et al., 2008; X. Li et al., 2014) and South Asian (Chakraborty et al., 2015) anthropogenic emissions. Moreover, the HTAP has made considerable progress in quantifying the contributions of anthropogenic emissions in foreign regions to surface ozone in East Asia (Turnock et al., 2018) and its health impact (Liang et al., 2018). However, foreign influences on ozone in the East Asian middle and upper troposphere have been rarely documented (Liu et al., 2002; Sudo and Akimoto, 2007). Limited studies have suggested that foreign influences are stronger in the higher altitudes than at the surface in East Asia, such as Y. Zhu et al. (2017) and Han et al. (2018) on North American and African ozone, respectively. The contribution of anthropogenic emissions from foreign regions to ozone over China is also greater at high altitudes than at the surface in spring (Ni et al., 2018). As ozone in the middle and upper troposphere has a considerable climate effect (Myhre et al., 2017), the radiative forcing of ozone is much higher in these layers than in the lower layers (Worden et al., 2008). The strongly latitude- and altitude-dependent radiative forcing of tropospheric ozone requires a further examination of imported ozone in East Asia throughout the entire tropospheric columns. Quantifying imported ozone sources at different altitudes also helps in understanding the transport mechanisms.
Previous studies suggested that the East Asian monsoon (EAM), a predominant climate feature in East Asia, could be a key player in modulating seasonal variation in foreign influences on East Asia (Wang et al., 2011; Chakraborty et al., 2015; B. Zhu et al., 2016; Y. Zhu et al., 2017; Han et al., 2018). Wang et al. (2011) suggested that the seasonal switch in horizontal wind patterns of the EAM can bring ozone from different foreign regions to China. Y. Zhu et al. (2017) and Han et al. (2018) demonstrated the importance of the EAM to the vertical transport of imported ozone. In addition, imported ozone can significantly drive the interannual variation in ozone over the East Asian troposphere (Chatani and Sudo, 2011; Nagashima et al., 2017). Therefore, the role of the EAM should be further investigated so as to find new insight on atmospheric transport of foreign ozone to East Asia.
Since the 2000s, our understanding of the foreign influence on tropospheric ozone in East Asia has been advanced. Nevertheless, previous studies individually focused on some specific aspects of this influence, such as that from one or a few source regions (X. Li et al., 2014; Y. Zhu et al., 2017; Han et al., 2018), that occurring during one or a few seasons (Ni et al., 2018), or that affecting surface ozone only (Wang et al., 2011). The sources of ozone over the entire East Asian troposphere and the underlying transport mechanisms are inadequately documented. The interannual variations in foreign influences and the associated meteorology have been inadequately studied. This study aims to address these research gaps and engage in a comprehensive assessment of foreign influences on tropospheric ozone in East Asia.
In this study, we use a global chemical transport model, GEOS-Chem, to quantify foreign influences on tropospheric ozone in East Asia. We characterize the seasonal, horizontal, and vertical variations in these influences and explore the potential mechanisms. We also search for a link between the interannual variations in foreign influences and the EAM. In the following, Sect. 2 describes the GEOS-Chem model and the simulation experiments. The seasonal and interannual variations in the foreign influences are presented in Sects. 3 and 4, respectively. A summary is provided in Sect. 5.
To clearly identify different sources of tropospheric ozone in East Asia, we define some terms used in this paper. East Asia is defined as the receptor region (Fig. 1), while the regions outside East Asia are the foreign regions. Tropospheric ozone refers to ozone in the troposphere (Table S1 in the Supplement). Tropospheric ozone in East Asia consists of ozone produced in the troposphere and downward ozone injected from the stratosphere (termed stratospheric ozone); i.e. tropospheric ozone is equal to ozone produced in the troposphere plus stratospheric ozone. In this paper, we discuss the foreign influence on tropospheric ozone in East Asia from multiple perspectives (Table S1). The first is by regions inside and outside East Asia, in which the terms “native ozone” and “foreign ozone” refer to ozone produced in the troposphere inside and outside East Asia, respectively. Foreign ozone, in most cases, refers to ozone that is originally generated in the troposphere of a foreign region and then is imported to the domain of the East Asian troposphere. Foreign ozone may be distributed outside East Asia, depending on the context. The second is by foreign region, in which ozone produced in the troposphere over a foreign region is named after that region, such as “European ozone”. Note that stratospheric ozone injected into a foreign region is counted as stratospheric ozone because it is not originally produced in the troposphere. The third is by the sources of ozone precursors, in which the term “anthropogenic ozone” refers to ozone produced from its precursors with anthropogenic sources. “Non-anthropogenic ozone” refers to ozone produced in the troposphere from its precursors with non-anthropogenic sources. In the fourth perspective, the components of tropospheric ozone are termed in more detail by further divisions, such as by both sources of ozone precursors and foreign regions. For example, European anthropogenic ozone refers to ozone produced from the anthropogenic precursors emitted from Europe. The foreign influences are assessed in terms of the absolute contribution with a unit of parts per billion by volume and the fractional contribution with a unit of percentage (%), which is the ratio of foreign ozone to tropospheric ozone in the same domain of interest, unless stated otherwise.
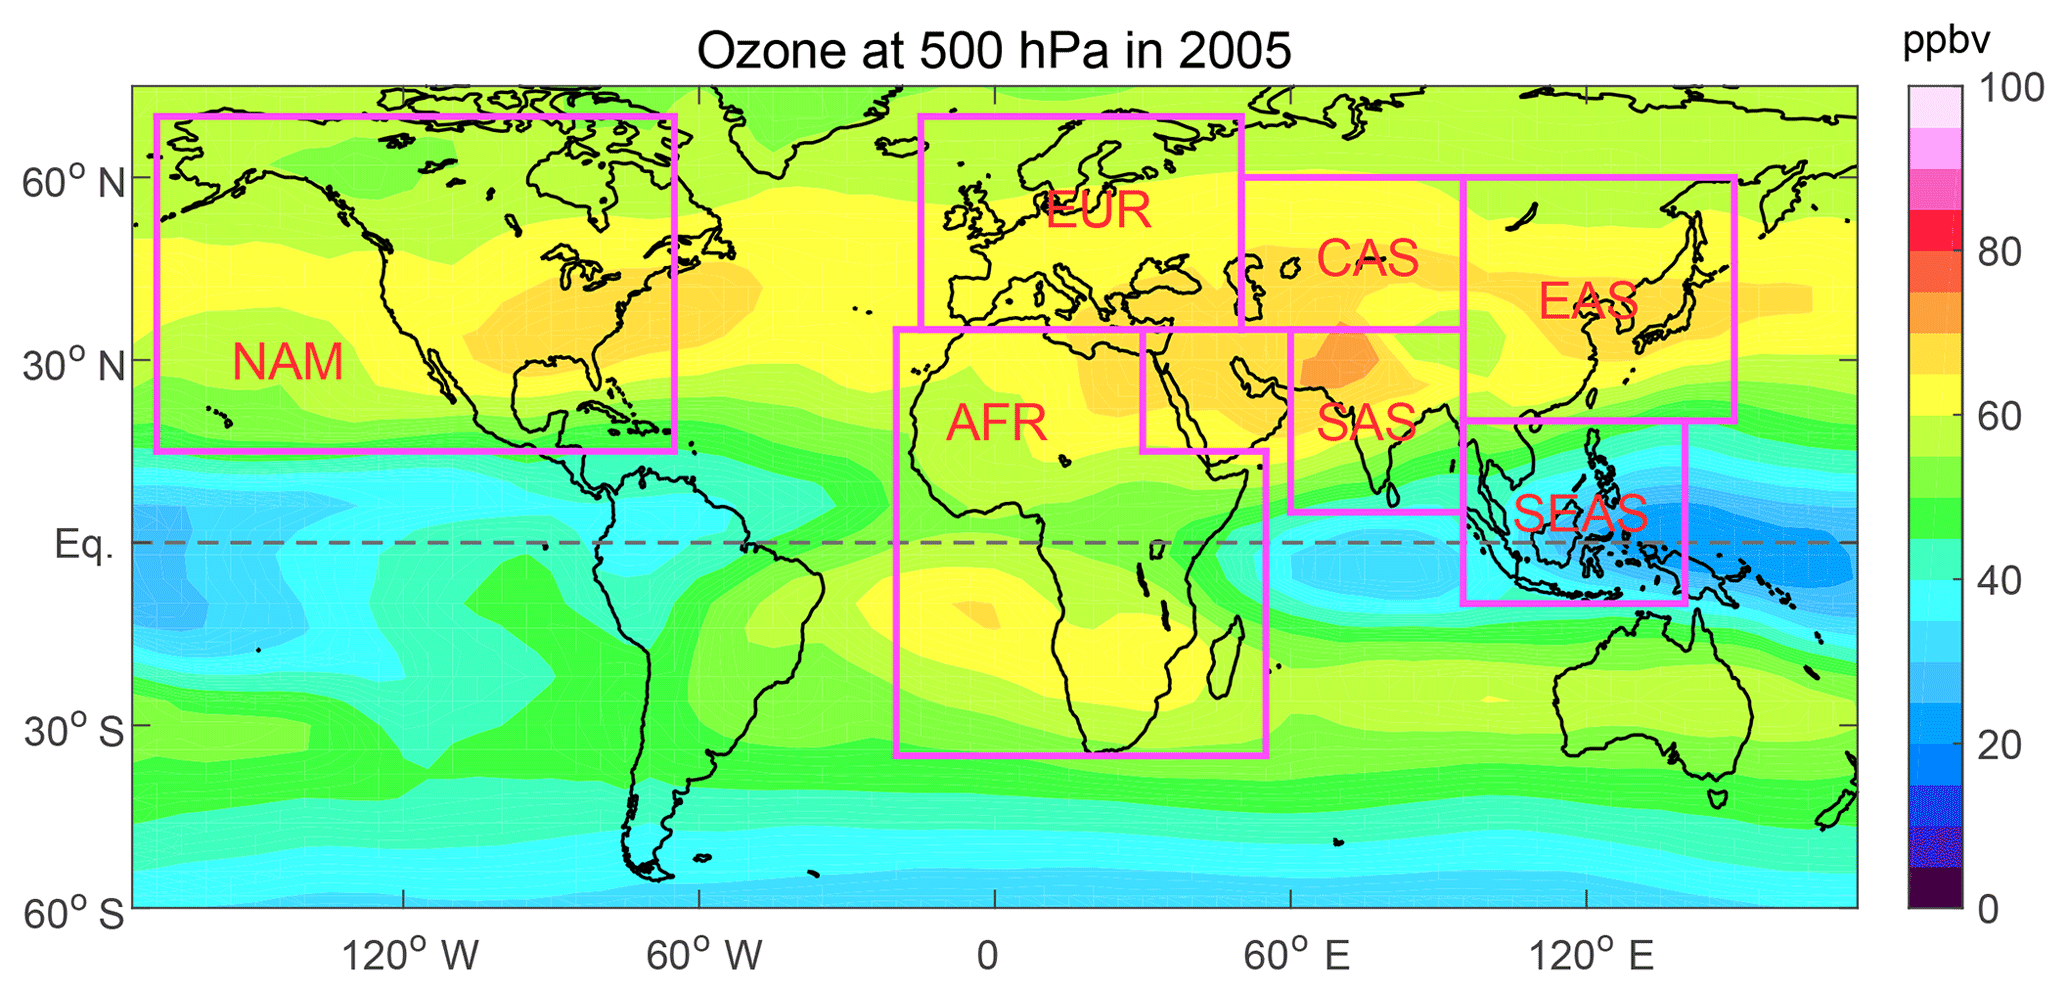
Figure 1Annual mean ozone concentrations in the middle troposphere (500 hPa) in 2005 from GEOS-Chem simulations. The magenta boxed areas define seven regions, plus the rest of the world (ROW, all regions except the boxed regions). The seven regions include East Asia (EAS; 20–60∘ N, 95–150∘ E), North America (NAM; 15–70∘ N, 170–65∘ W), Europe (EUR; 35–70∘ N, 15–50∘ E), Africa (AFR; 0–35∘ N, 20∘ W–30∘ E and 35∘ S–0, 20∘ W–55∘ E), central Asia (CAS; 35–60∘ N, 50–95∘ E), South Asia (SAS; 5–35∘ N, 60–95∘ E), and South-east Asia (SEAS; 10∘ S–20∘ N, 95–140∘ E).
Two numerical simulations have been widely used for studying source–receptor relationships (Butler et al., 2018): emission perturbation (sensitivity) (Wild and Akimoto, 2001; Fiore et al., 2009; Y. Zhu et al., 2017) and tagging tracer (Wang et al., 1998; Liu et al., 2009; Hou et al., 2014) simulations. The perturbation simulation examines how ozone within a receptor region responds to a perturbation of ozone precursor emissions in different foreign regions, while the tagged ozone simulation tracks ozone in a receptor region back to its various source regions. In this study, a global three-dimensional chemical transport model, GEOS-Chem (version v9-02) (Bey et al., 2001, http://geos-chem.org, last access: 27 September 2019), was used to simulate the global transport of foreign ozone to East Asia from different source regions. GEOS-Chem includes detailed tropospheric O3–NOx–hydrocarbon and aerosol chemistry. We ran GEOS-Chem simulations in two modes: the full chemistry and tagged ozone modes, corresponding to the emission perturbation and tagged tracer approaches, respectively. The emission perturbation simulation quantifies foreign anthropogenic influences on East Asia, while the tagged ozone simulation specifies overall foreign influences (anthropogenic and non-anthropogenic), as well as the stratospheric influence on East Asia. The simulations were driven by the GEOS-4 meteorology from the Goddard Earth Observing System (GEOS) at the NASA Global Modeling and Assimilation Office (GMAO), with 30 reduced vertical layers at the horizontal resolution of 4∘ latitude by 5∘ longitude. To assess the sensitivity of the simulations to different meteorological data and spatial resolutions, we also ran GEOS-Chem driven by GEOS-4 at 2∘ by 2.5∘, GEOS-5 at 4∘ by 5∘, and GEOS-5 at 2∘ by 2.5∘ in the full chemistry mode.
Table 1GEOS-Chem simulations and experiments in this study.a

a The abbreviations stand for different regions: East Asia (EAS), North America (NAM), Europe (EUR), Africa (AFR), central Asia (CAS), South Asia (SAS), South-east Asia (SEAS), and the rest of the world (ROW) (see Fig. 1). “CTRL” represents “a controlled run”. “EAnth” means “Excluding anthropogenic emissions”. b The daily ozone production and loss data in 2005 were generated in Experiment 1 (CTRL) and archived for the tagged ozone simulation. Therefore, the tagged ozone simulation includes the seasonal variation in chemistry but without interannual variation in chemistry.
Table 1 describes the experiments conducted in this study. We divided the world into eight regions (Fig. 1): East Asia, North America, Europe, Africa, central Asia, South Asia, South-east Asia, and the rest of the world (ROW). East Asia, North America, South Asia, and Europe are also the study domains in HTAP Phase 1, where the definitions were only slightly different. Ten simulations in full chemistry mode were conducted from January 2004 to February 2006 (2004 for spin-up), including one control experiment (CTRL) and nine sensitivity experiments. In the CTRL experiment, all anthropogenic and natural emissions were turned on, while in the sensitivity experiments, the anthropogenic emissions including nitrogen oxides (NOx), carbon monoxide (CO), and non-methane volatile organic compounds (NMVOCs) were turned off (100 % perturbation) individually in each of the eight defined regions and in the whole world (EAnth-GLO). The anthropogenic ozone from a region Xi can be represented by the difference in the ozone concentration between CTRL and the sensitivity experiment for that region (EAnth-Xi) (X. Li et al., 2014). Because ozone does not linearly respond to the reduction of its precursors (Fiore et al., 2009), the sum of the ozone response to the 100 % perturbation for each region, i.e. , is not equal to the ozone response to the 100 % perturbation for the globe (CTRL-EAnth-GLO). Specifically in this study, ozone concentration from is approximately 0–4 ppbv (0 %–20 %) higher than that from CTRL-EAnth-GLO over East Asia depending on altitude (Fig. S1 in the Supplement). Therefore, to fit the total anthropogenic ozone and isolate the relative contributions of anthropogenic emissions from different regions to the total anthropogenic ozone, a “normalized marginal” linearization method (B. Li et al., 2016; Ni et al., 2018) was used to adjust the simulations:
where EAnth-A indicates the ozone concentration from the sensitivity experiment for A. CON-A is the anthropogenic ozone from a specific region A. The calculation was conducted at every model grid. Anthropogenic ozone from a specific region is named after that region, such as “European anthropogenic ozone” (Table S1).
Meteorology can modulate foreign ozone over East Asia interannually through its influences on both transport and chemical processes (Liu et al., 2011; Sekiya and Sudo, 2012, 2014). In this study, we focus on its impact on the interannual variation in ozone transport. Therefore, we conducted a tagged ozone simulation from December 1985 to November 2006 (the first year was for spin-up). In the simulation, labelled “Tagged-Ozone” (Table 1), daily ozone production and loss data in 2005 were produced from the full chemistry simulation (CTRL) beforehand and then were used in Tagged-Ozone for the years over 1985–2006. In this way, the seasonal variation in chemistry is considered in the simulation while there is no year-to-year variation in chemistry. In the meantime, both seasonal and interannual variations in meteorology are considered in the simulation. Tagged-Ozone includes 10 tracers, i.e. overall ozone, ozone produced in the stratosphere (STR), and ozone produced in the troposphere over East Asia and the seven foreign regions (Fig. 1). Ozone produced in the troposphere over a region is named after that region, such as “European ozone” (Table S1). Ozone produced in the stratosphere is termed “stratospheric ozone”, no matter whether it is directly transported to the East Asian troposphere or has passed through the troposphere over any of the foreign regions. The Linoz linearized ozone parameterization scheme (McLinden et al., 2000) was used in the calculation of stratospheric ozone. The tropopause pressure from the GEOS-4 meteorology was used at each dynamic time step. The calculated global cross-tropopause ozone varies interannually and is ∼484 Tg in 2005. The natural and anthropogenic emissions of ozone precursors and the model configuration were the same as those in Han et al. (2018) and are described in detail there.
Figure 2 compares the ozone vertical profiles from the simulations with different meteorological data and resolutions, averaged over East Asia by season. Among the simulations, ozone profiles over East Asia were similar in shape and magnitude in each of the seasons, except near the surface, where the simulated ozone concentrations obtained with GEOS-4 data were larger than those obtained with GEOS-5. Overall, the differences between these simulations were smaller in summer and autumn than in winter and spring. A difference within ±5 % existed between the tagged ozone and full chemistry simulations (Figs. S2–S3), likely owing to the nonlinearity in chemistry. We further compared the GEOS-Chem simulations with the Tropospheric Emission Spectrometer (TES) satellite retrievals using the monthly product TL2O3LN achieved from the NASA Langley Atmospheric Science Data Center (https://eosweb.larc.nasa.gov/project/tes/tes_table, last access: 27 September 2019). The GEOS-Chem simulations smoothed with TES a priori and the averaging kernels appeared lower than the TES measurements in the middle troposphere by approximately 10 ppbv in spring and 5 ppbv in other seasons (Fig. 2). Note that TES tropospheric ozone retrievals generally have a positive bias compared with ozonesonde measurements (Nassar et al., 2008; Verstraeten et al., 2013). Verstraeten et al. (2013) identified that the bias is approximately 2–7 ppbv and is different for the tropics (3 ppbv), subtropics (5 ppbv), and midlatitudes (7 ppbv). Our confidence in the GEOS-Chem performance is extended on the basis of extensive validations of GEOS-Chem simulations of tropospheric ozone in East Asia (Wang et al., 2011; Jiang et al., 2015; J. Zhu et al., 2017; Y. Zhu et al., 2017), North America (Zhang et al., 2008; Y. Zhu et al., 2017), Europe (Liu et al., 2005; Kim et al., 2015), Africa (Han et al., 2018), and other regions (Liu et al., 2009; Jiang et al., 2016).
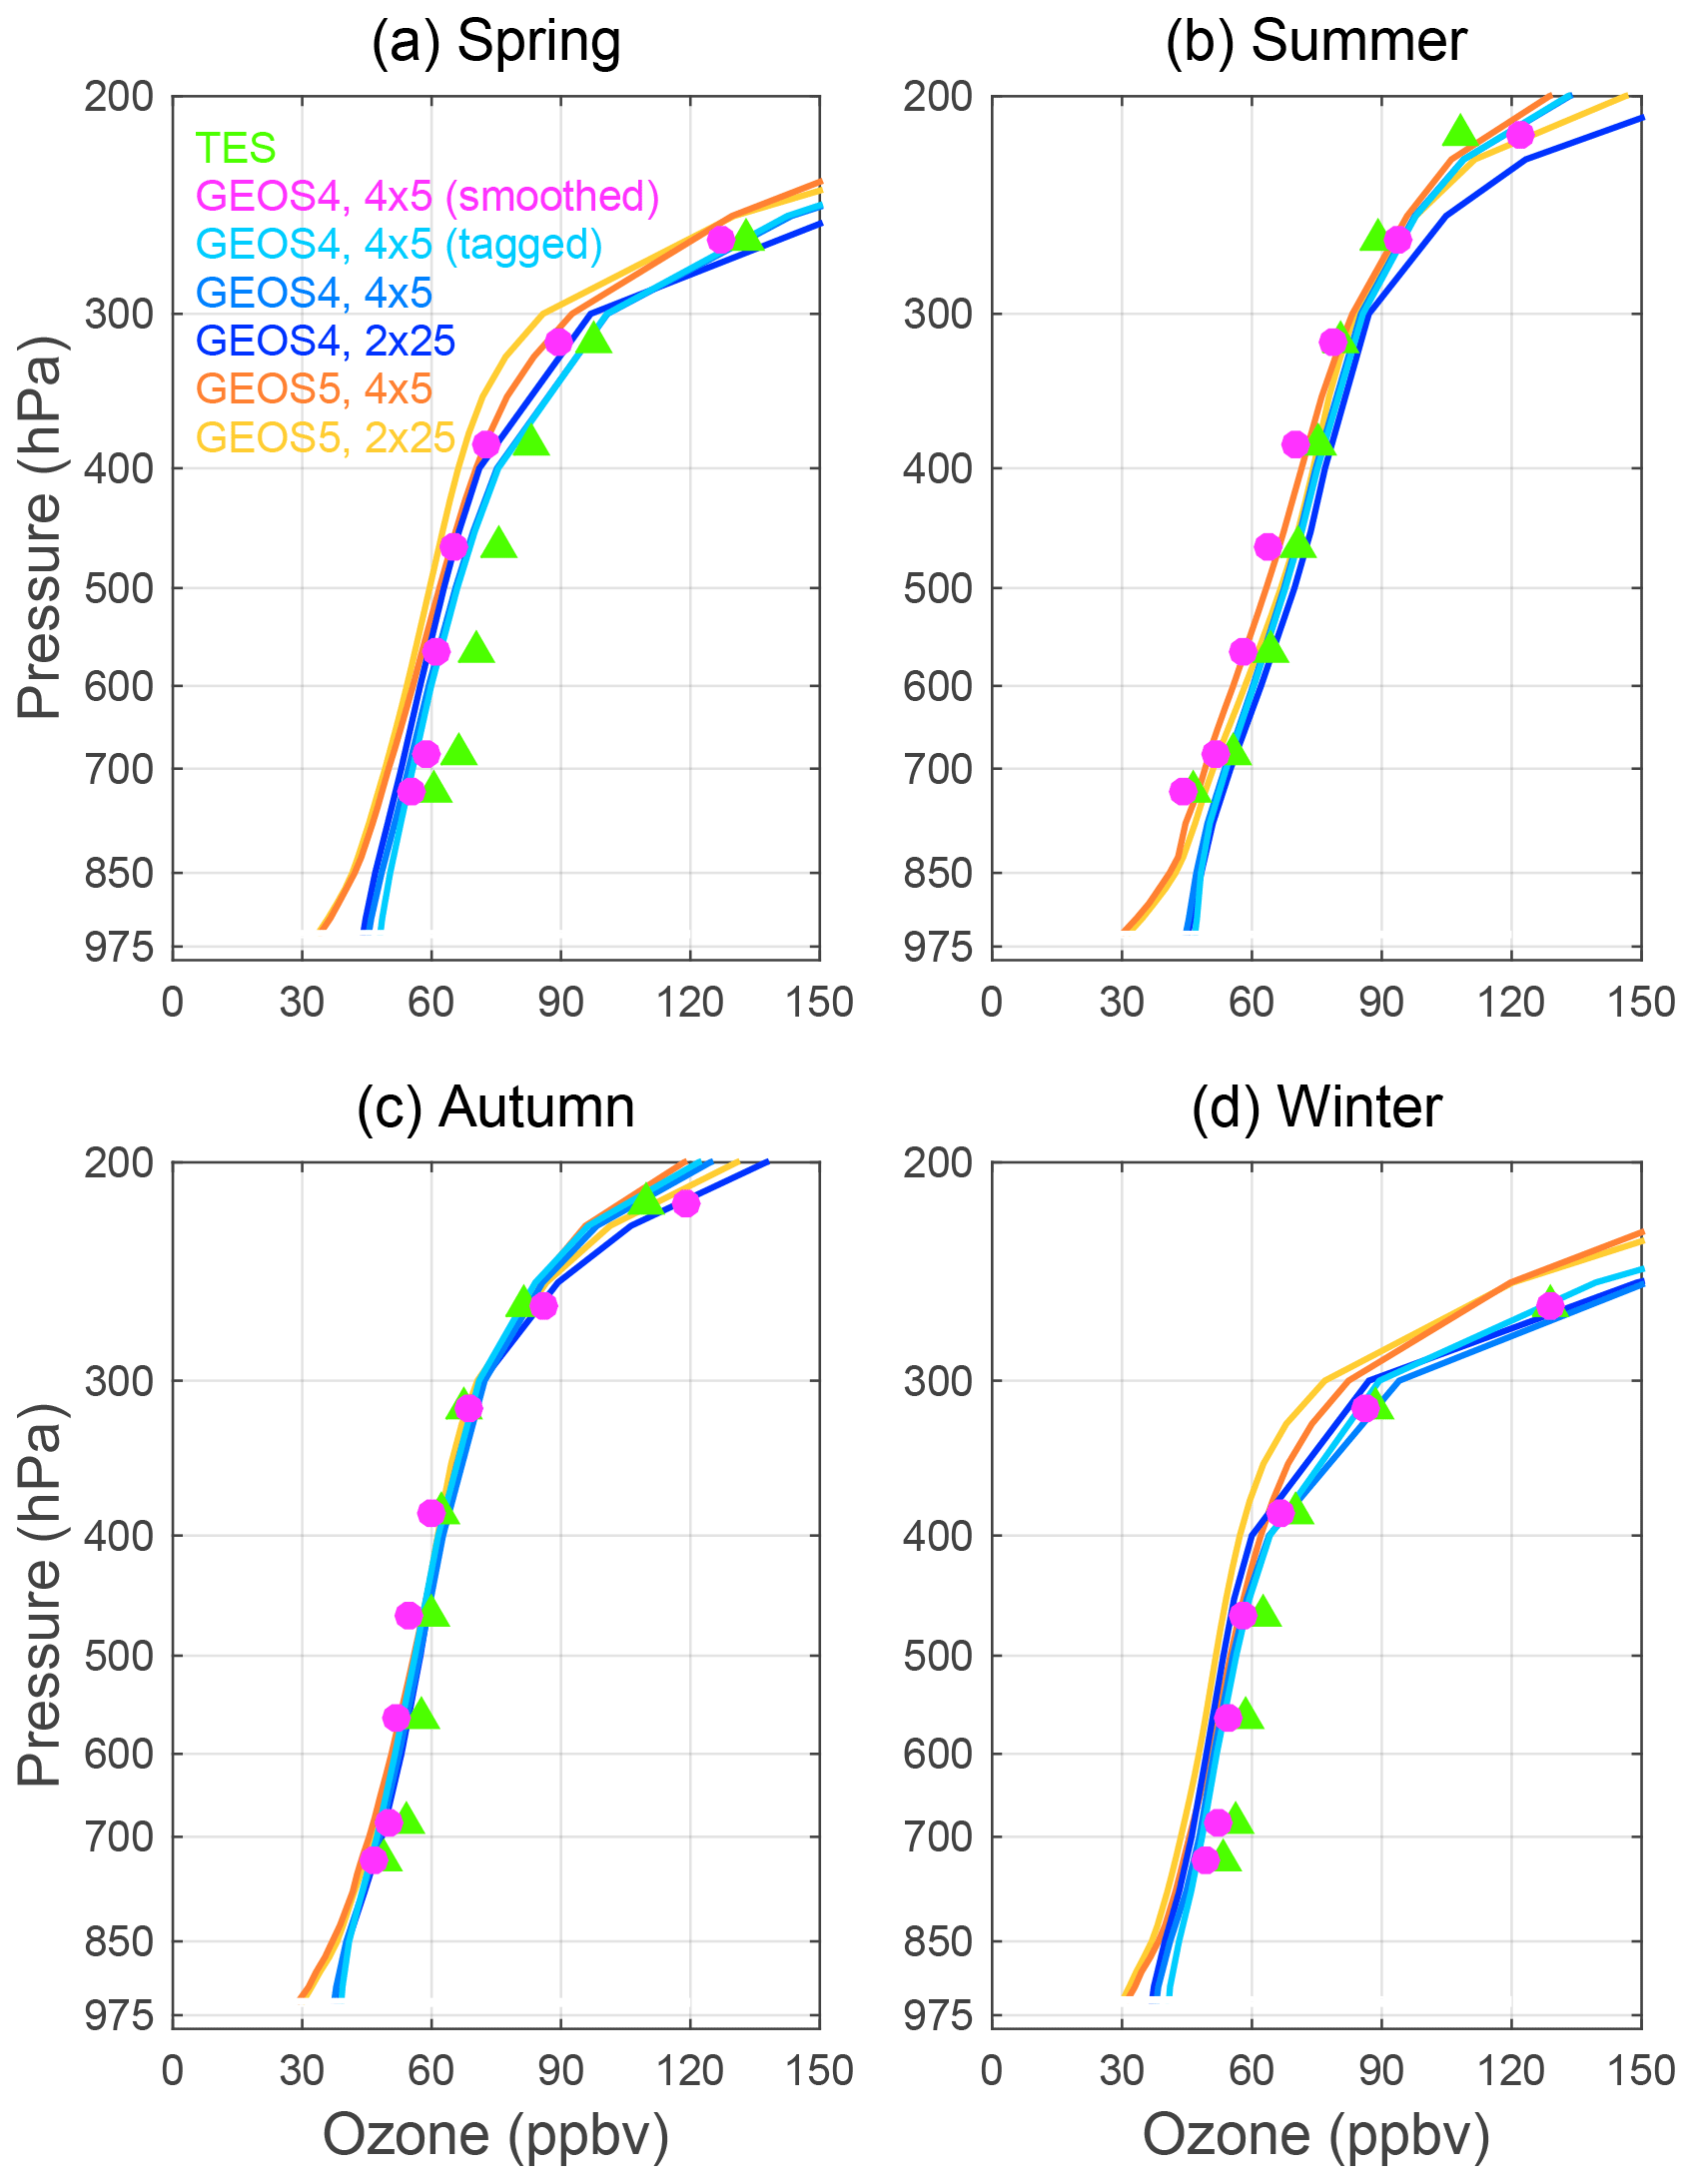
Figure 2Vertical ozone profiles averaged over East Asia in 2005 from GEOS-Chem simulations driven by GEOS-4 and GEOS-5 meteorological data with different horizontal resolutions (4∘ by 5∘ and 2∘ by 2.5∘ in latitude and longitude). TES retrievals (in green) and GEOS-Chem simulations smoothed with the TES a priori and averaging kernels (in magenta) are also shown.
3.1 Native and foreign ozone over East Asia
Based on GEOS-Chem simulations in 2005, we show native and foreign ozone over East Asia at the surface (Tables 2–3 and Fig. 3) and in the East Asian troposphere (Figs. 3–5). Figure 3 shows the horizontal variation in the partition of native and foreign ozone at the surface and three pressure levels in terms of the annual mean, while Fig. 4 shows the vertical variation in the partition of native and foreign ozone over East Asia by season. Figure 5 is the same as Fig. 4 but for anthropogenic ozone.
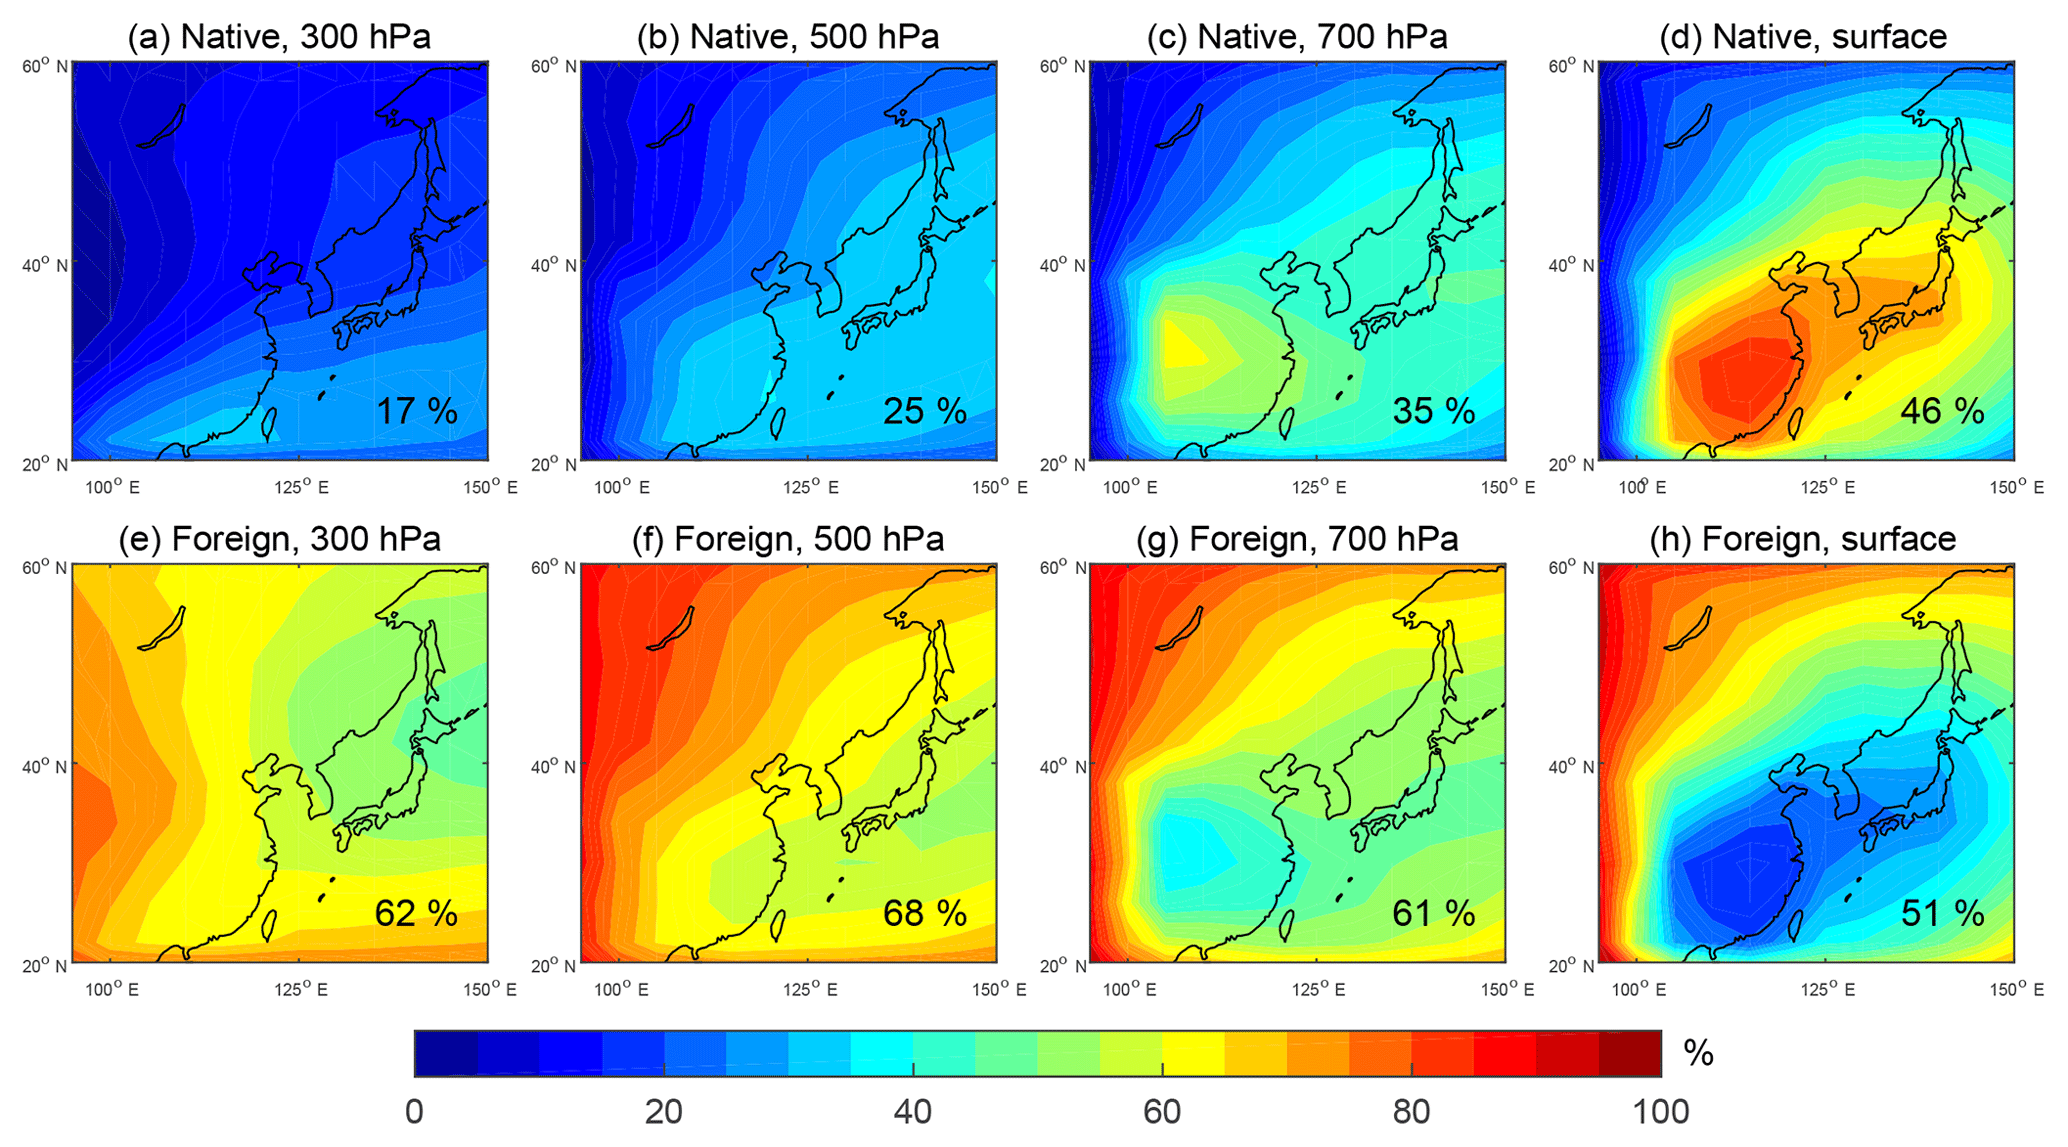
Figure 3Fractional contributions (in %) of native (a–d) and foreign (e–h) ozone to ozone at different layers over East Asia in 2005. The regional mean of the fractional contribution is shown in the bottom right corner of each panel.
Through the tropospheric columns in East Asia, the annual mean of foreign ozone partitions more in the upper layers than at the surface and reaches a regional mean of 68 % at 500 hPa (Fig. 3f). At the surface, the fractional contribution of foreign ozone is lowest over South China, where foreign ozone is also lower than native ozone (Fig. 3d and h). Vertically, foreign ozone constantly increases with altitude in all seasons (Fig. 4a–d). The concentrations of foreign ozone are larger than those of native ozone in spring, autumn, and winter throughout the troposphere and in summer above ∼650 hPa. Fractionally (Fig. 4e–h), foreign ozone accounts for most ozone in the middle or upper troposphere, depending on seasons. In contrast, the fraction of native ozone is largest near the surface and decreases with altitude. Specifically, between 700 and 200 hPa, the annual mean concentrations of foreign ozone averaged over East Asia range between 32 and 65 ppbv, which are 0.8–4.8 times higher than native ozone concentrations. Seasonally, the difference between foreign and native ozone between 700 and 200 hPa ranges from 17 to 64 ppbv in spring (or foreign ozone is 1–7.8 times its counterpart), −3 to 47 ppbv (−0.1–2.1 times) in summer, 16 to 53 ppbv in autumn (1–5.3 times), and 26 to 54 ppbv (2.9–13 times) in winter. In the middle troposphere at 500 hPa, foreign ozone is largest in spring (47.3 ppbv, 72 % of ozone) and lowest in summer (40.0 ppbv, 58 % of ozone), while in the upper troposphere at 300 hPa, foreign ozone is highest in spring (63.4 ppbv, 63 % of ozone) and lowest in winter (51.1 ppbv, 57 % of ozone).
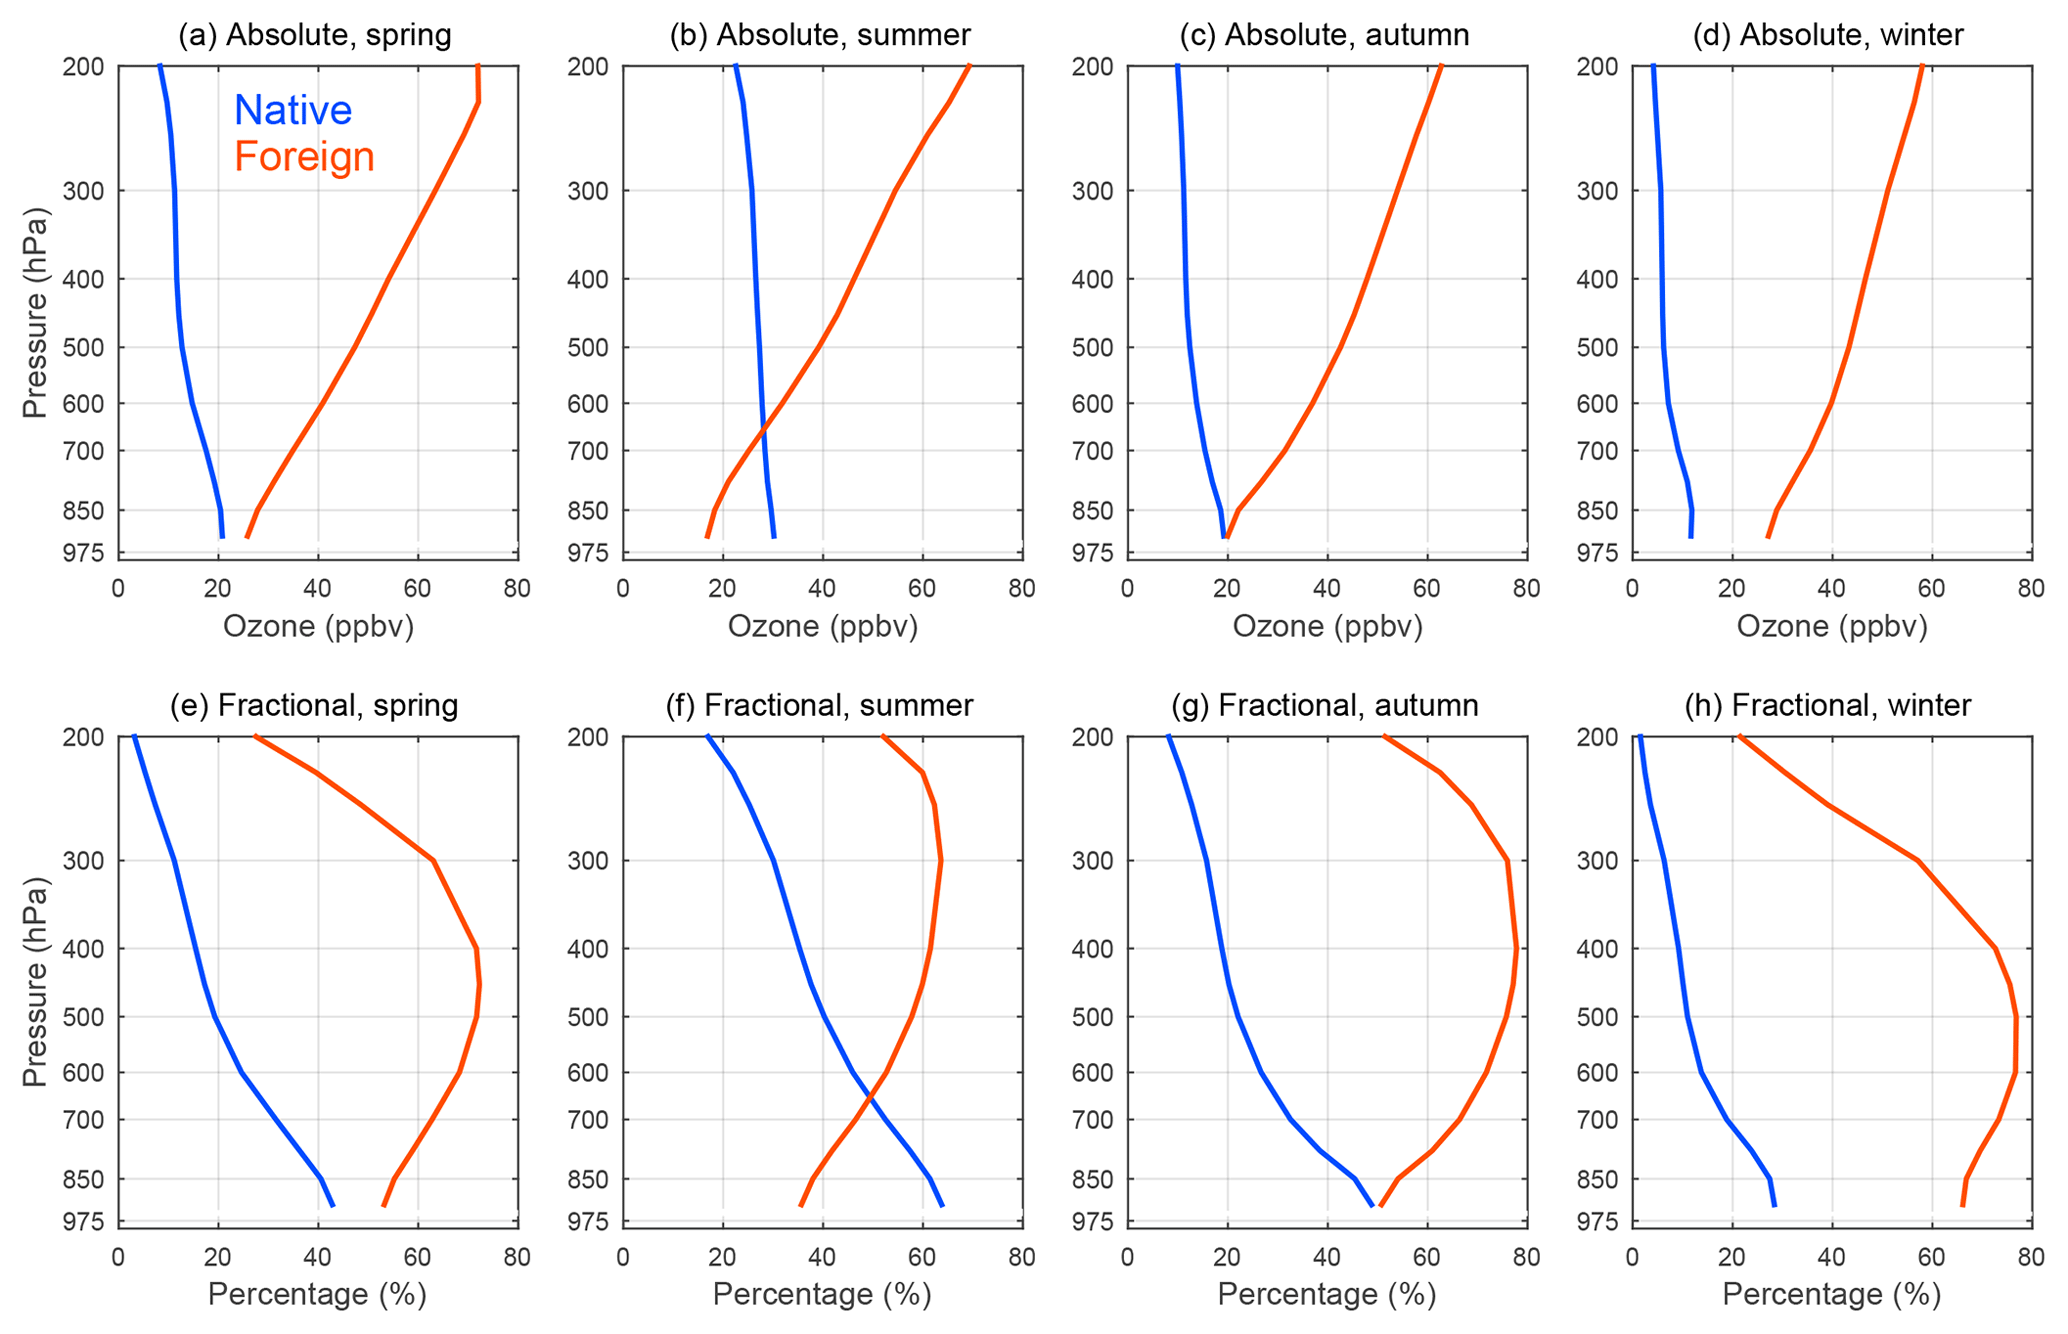
Figure 4(a–d) Vertical variation in native ozone (in blue) and foreign ozone (in red) (in ppbv) averaged over East Asia by season in 2005. (e–h) The same as (a–d) but for the fractional contribution (in %) of each component to ozone in the East Asian troposphere at each altitude.
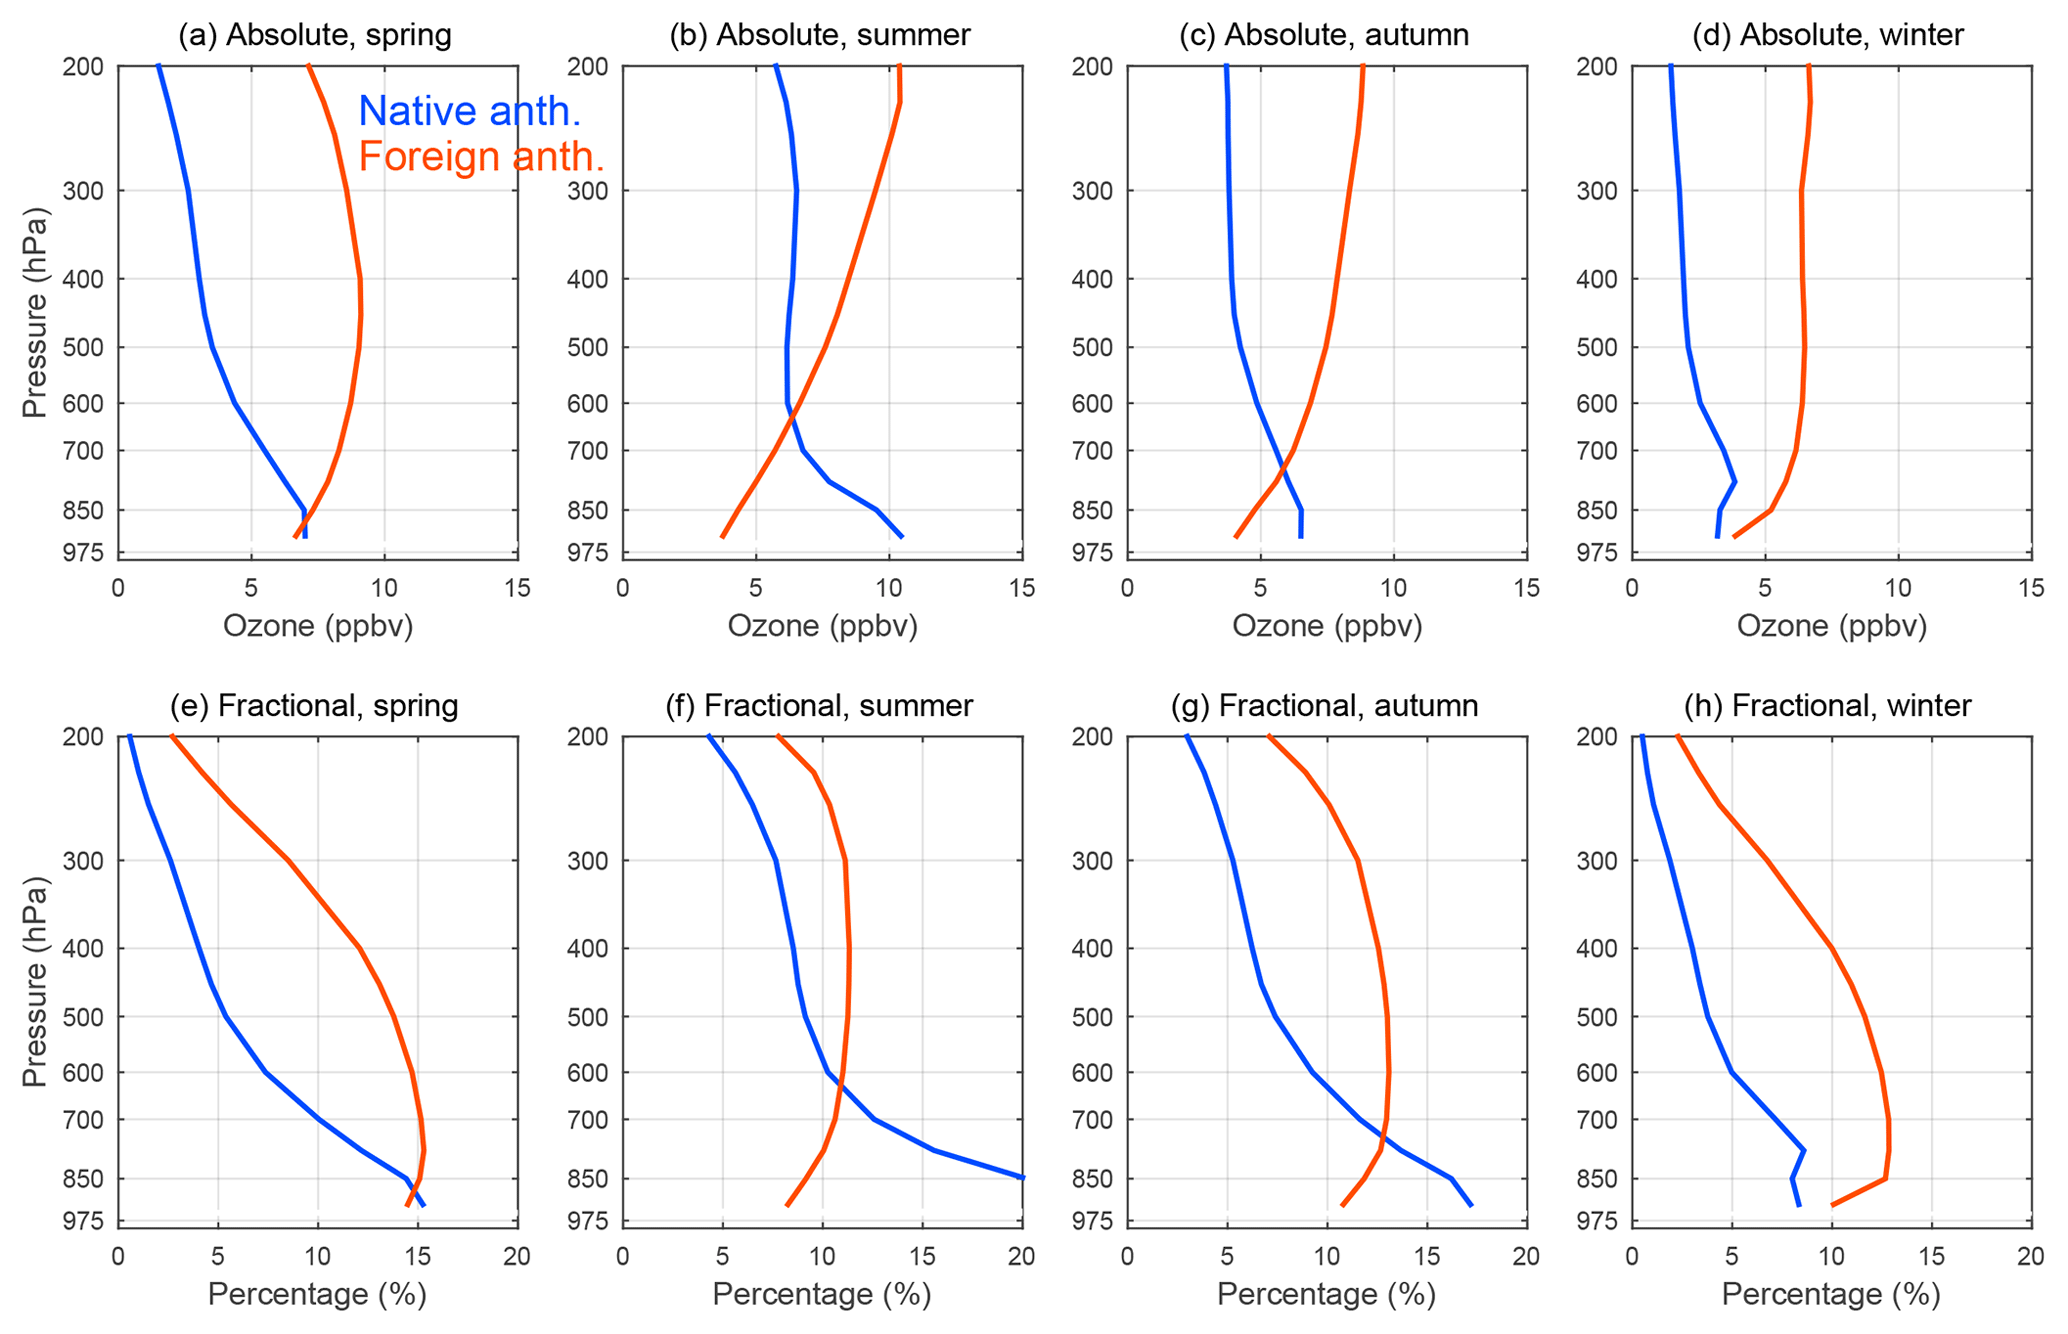
Figure 5(a–d) Vertical variation in native anthropogenic ozone (in blue) and foreign anthropogenic ozone (in red) (in ppbv) averaged over East Asia by season in 2005. (e–h) The same as (a–d) but for the fractional contribution (in %) of each component to ozone in the East Asian troposphere at each altitude. Note the difference in the scale of the x axis between Figs. 4 and 5.
In Table 2, the total foreign ozone concentrations are summed up from the foreign ozone concentrations from all foreign regions. At the East Asian surface, the annual mean of foreign ozone concentrations is ∼22.2 ppbv, which is comparable to that of its native counterpart (∼20.4 ppbv) (Table 2). Seasonally, foreign ozone is the largest in winter (27.1 ppbv), the second largest in spring (25.4 ppbv), and the smallest in summer (16.5 ppbv) (Table 2, Fig. 4). Foreign ozone accounts for over 50 % of ozone at the East Asian surface throughout the year, except in summer. This is in agreement with the estimate of 50 %–80 % foreign contributions in spring made by Nagashima et al. (2010) and J. Li et al. (2016).
Table 2The contributions of foreign ozone (in ppbv) from different regions to surface ozone in East Asia in 2005. The fractional contributions are indicated in brackets, taking surface ozone in East Asia as 100 %. The results are from the tagged ozone simulations (Experiment 11 in Table 1).*
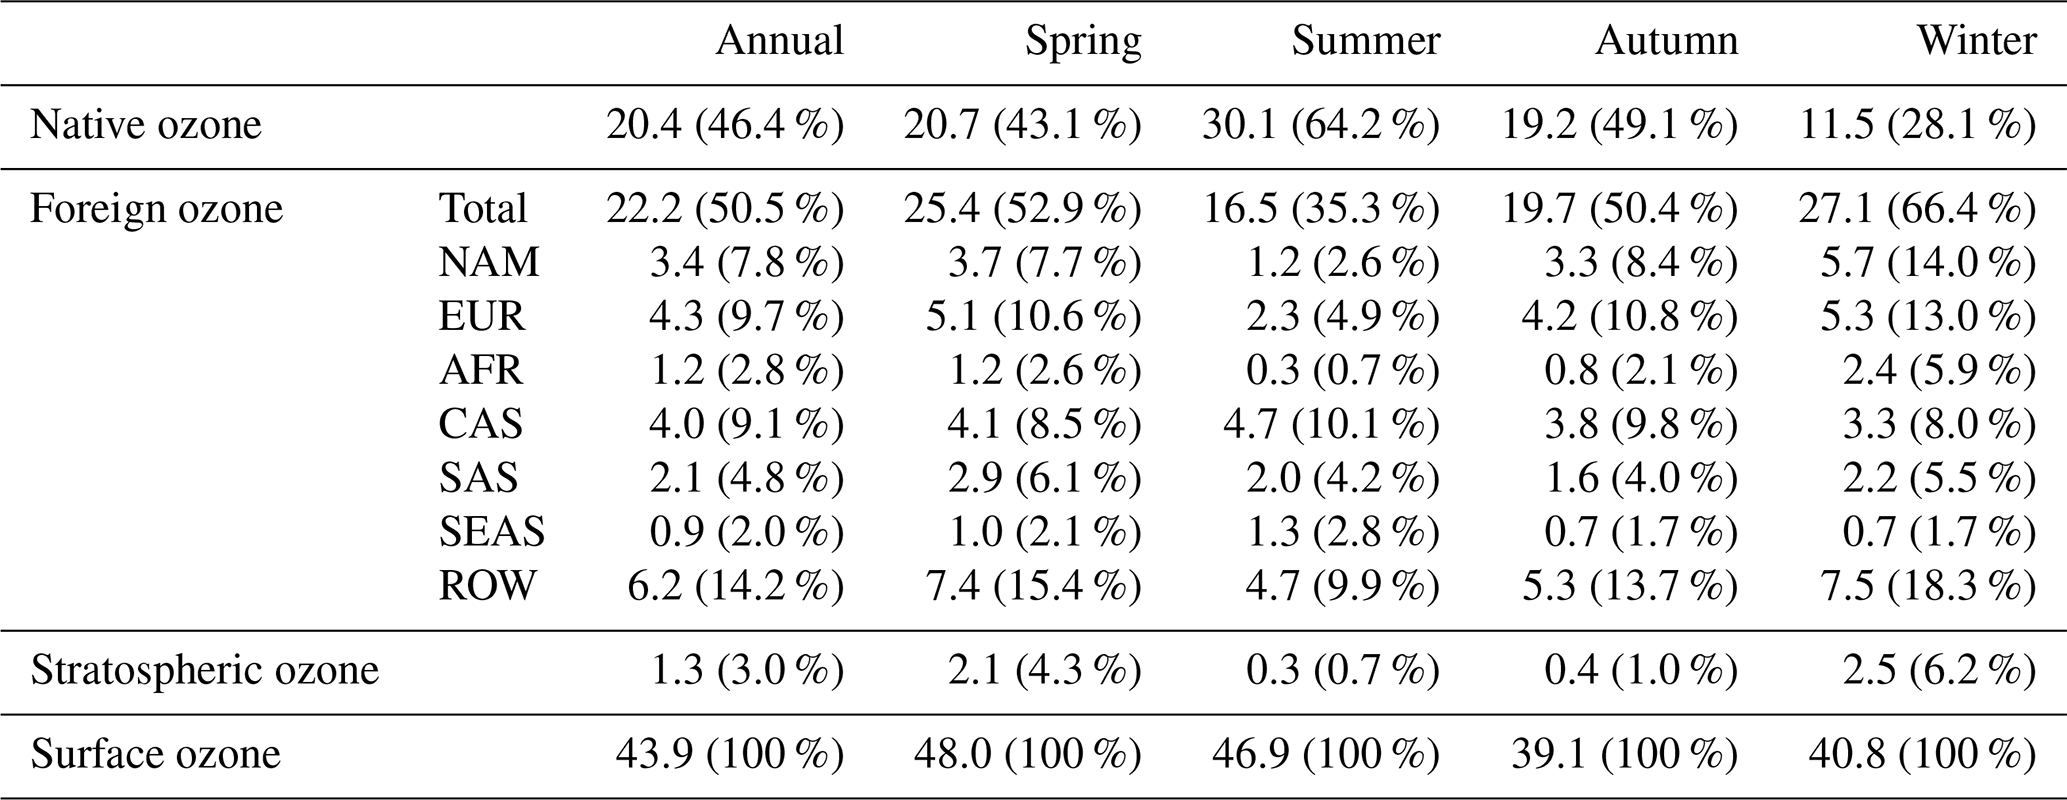
* All values are the means over East Asia. The abbreviations stand for different regions (Fig. 1): Asia (EAS), North America (NAM), Europe (EUR), Africa (AFR), central Asia (CAS), South Asia (SAS), South-east Asia (SEAS), and the rest of the world (ROW). Total foreign ozone is the sum of the contributions from all foreign ozone.
Table 3The contributions of anthropogenic ozone (in ppbv) from different regions to surface ozone in East Asia in 2005. The fractional contributions are indicated in brackets, taking surface ozone in East Asia as 100 %.* The results are from the full chemistry simulations (experiments 1–10 in Table 1).
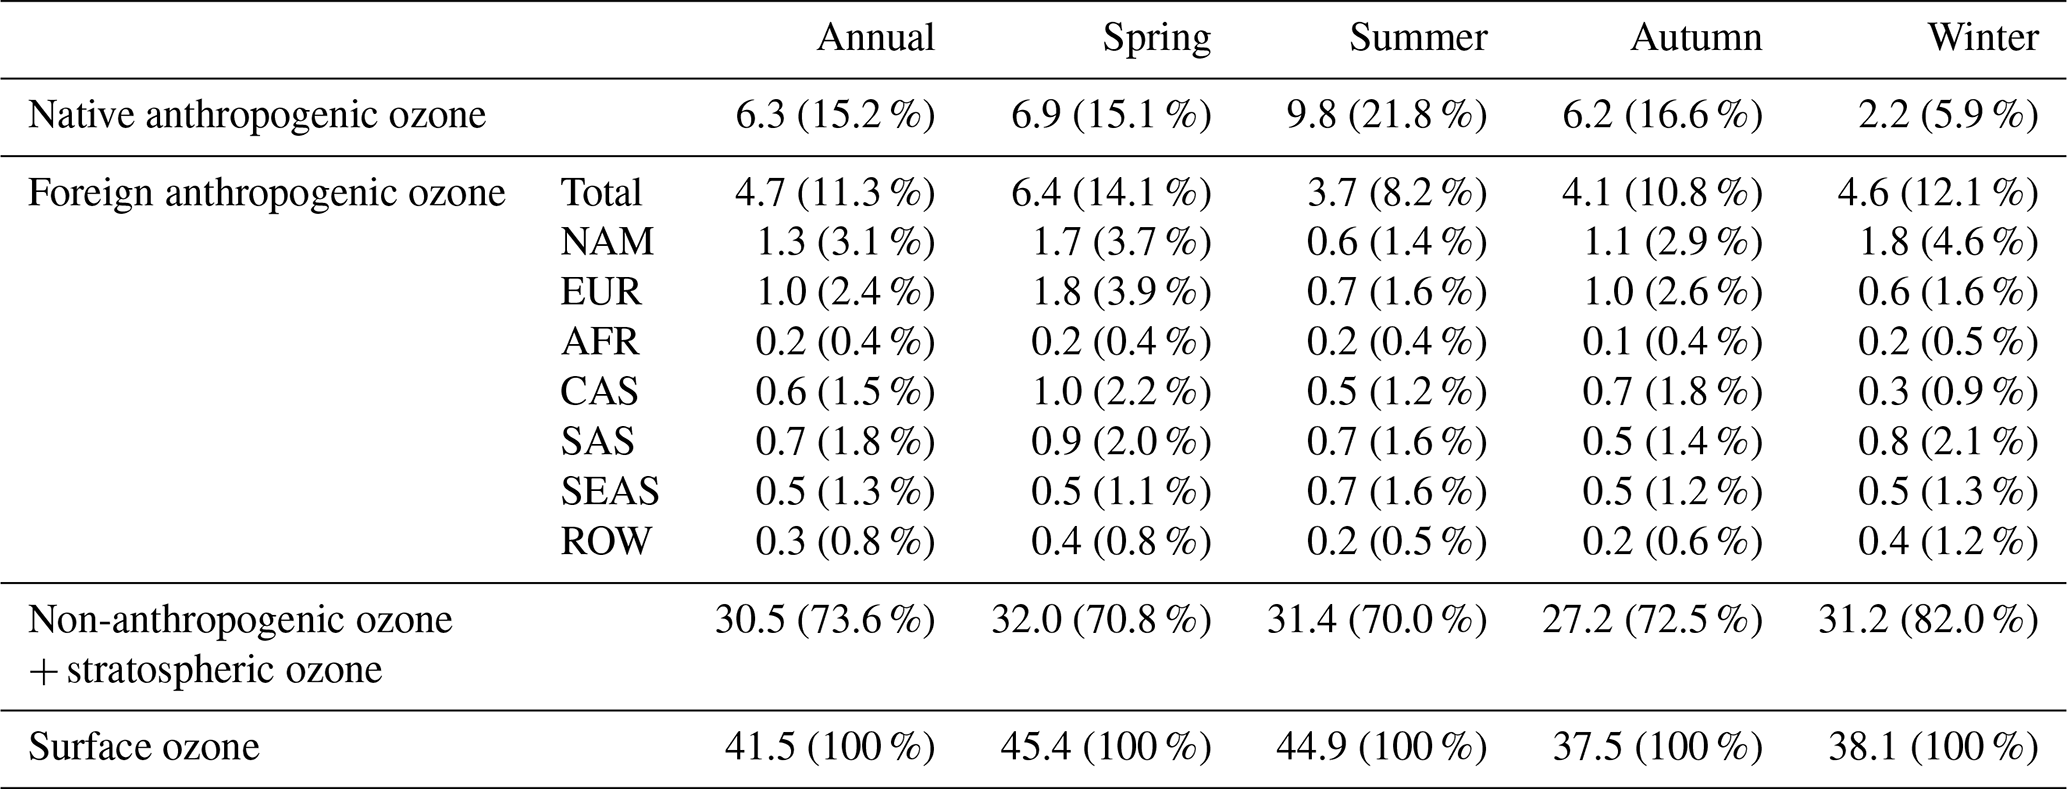
* All values are the means over East Asia. The abbreviations stand for different regions (Fig. 1): East Asia (EAS), North America (NAM), Europe (EUR), Africa (AFR), central Asia (CAS), South Asia (SAS), South-east Asia (SEAS), and the rest of the world (ROW). Total foreign anthropogenic ozone is the sum of the contributions from all foreign anthropogenic ozone.
Table 3 and Fig. 5 show the contribution of the foreign anthropogenic ozone at the surface and through the tropospheric columns in East Asia, respectively. At the East Asian surface, foreign anthropogenic ozone is 4.7 ppbv in the annual mean and peaks in spring, when foreign anthropogenic ozone (6.4 ppbv, 14.1 % of ozone) is comparable to its native counterpart (6.9 ppbv, 15.1 % of ozone). In summer, foreign anthropogenic ozone (3.7 ppbv, 8.2 % of ozone), like foreign ozone (16.5 ppbv, 35.2 % of ozone), is at seasonal minimums, whereas native anthropogenic ozone (9.8 ppbv, 21.8 % of ozone), like native ozone (30.1 ppbv, 64.1 % of ozone), reaches the seasonal maximum (Tables 2 and 3, Figs. 4 and 5). These results are of a similar order of magnitude to those in Ni et al. (2018), who estimated that foreign and native anthropogenic ozone were both approximately 6 ppbv at the surface in China in the spring of 2008. Wang et al. (2011) suggested an estimate of 12.6±2.3 ppbv in the annual mean of foreign anthropogenic ozone in China. Among all altitudes (Fig. 5), foreign anthropogenic ozone is the largest in the upper troposphere in all seasons except in spring when it peaks in the middle troposphere (Fig. 5a–b). In contrast, native anthropogenic ozone is the largest at the surface and decrease with altitude in all seasons. Seasonally, in the middle troposphere at 500 hPa, foreign anthropogenic ozone peaks in spring (9 ppbv or 14 % of ozone), while in the upper troposphere at 300 hPa, foreign anthropogenic ozone is highest in summer (9.5 ppbv, 11 % of ozone) and lowest in winter (6.3 ppbv, 7 % of ozone).
The seasonal variation in foreign influences on tropospheric ozone over East Asia is modulated by multiple factors. Ozone lifetime is one of the important factors, as a longer lifetime can lengthen the transport distance. Here, ozone lifetime in the boundary layer was calculated by the daily average dry deposition and chemical loss rate of ozone at each of the model grids. In the free troposphere, only the chemical loss rate of ozone is used for the calculation. As shown in Fig. 6, ozone lifetime at the East Asian surface is longest in winter (11.3 d), shortest in summer (1.1 d), and intermediate in spring (4 d) and autumn (3.8 d). Ozone lifetime at the East Asian surface is approximately 9–28 d shorter than that in the middle troposphere (500 hPa), due to the dry deposition and more active chemical reactions of ozone in the boundary layer (Fiore et al., 2002; Wang et al., 2011). From the meteorological perspective, subtropical westerlies are the major transport pathway for atmospheric pollutants moving from the west to East Asia (Wild et al., 2004; Y. Zhu et al., 2017; Han et al., 2018). The strength and location of the westerlies vary with season. The East Asian subtropical westerly jet is strongest in winter and weakest in summer (Fig. 7; see also Zhang et al., 2006). Therefore, the combined effect of the ozone lifetime and the westerlies is more favourable to the transport of foreign ozone to East Asia in winter and spring than in summer. However, because the ozone concentrations in the inflows to East Asia are low in winter (Fig. 7d and h), both foreign ozone and foreign anthropogenic ozone in the East Asian upper troposphere are at a minimum in winter (Figs. 4 and 5).

Figure 6Ozone lifetime averaged in various regions in the middle troposphere (MT, 500 hPa) and at the surface in 2005, calculated from the ozone dry deposition and chemical loss rate in GEOS-Chem simulations. The error bar is 4 times the standard error of the mean (equivalent to the 95 % confidence limit of the mean). The regions are (a) East Asia (EAS), (b) North America (NAM), (c) Europe (EUR), (d) Africa (AFR), (e) central Asia (CAS), (f) South Asia (SAS), (g) South-east Asia (SEAS), and (h) the Northern Hemisphere (NH).
Because of the longer lifetime of ozone and the stronger westerly wind in the middle and upper troposphere (Figs. 6 and 7), ozone concentrations in the middle and upper troposphere are 1–2 times higher than at the surface in foreign regions (Fig. 4). Figure 7 clearly shows that foreign ozone is transported to East Asia mostly through the middle and upper troposphere. It also demonstrates that the seasonality of foreign ozone in different tropospheric layers, particularly near the surface, is greatly impacted by vertical transport. In winter, the East Asian trough located around 130–140∘ E in the middle troposphere is an important feature of the East Asian winter monsoon (EAWM) system. The downdrafts behind the East Asian trough (100–140∘ E) favour the descent of foreign ozone from upper levels to the surface. Winter has the strongest downdrafts, followed by spring (Fig. 7). Oppositely, in summer, the prevailing ascents in the East Asian summer monsoon (EASM) block foreign ozone from reaching the lower troposphere (Fig. 7b and f; see also Y. Zhu et al., 2017; Han et al., 2018). Combined with the obstruction of the Tibetan Plateau, the blocking effect is obvious in summer (Fig. 7b and f; see also Han et al., 2018). In addition, the downdrafts behind the European trough (∼0–40∘ E in Fig. 7b and f) divert foreign ozone from reaching East Asia in summer (Y. Zhu et al., 2017; Han et al., 2018). Because of all the reasons mentioned above, both foreign anthropogenic ozone and foreign ozone at the surface layer in East Asia are higher in winter than in summer (Figs. 4 and 5). Overall, the EAM is a dominant meteorological system influencing the seasonal variations in foreign ozone at the East Asian surface, primarily through the vertical motion of air masses.
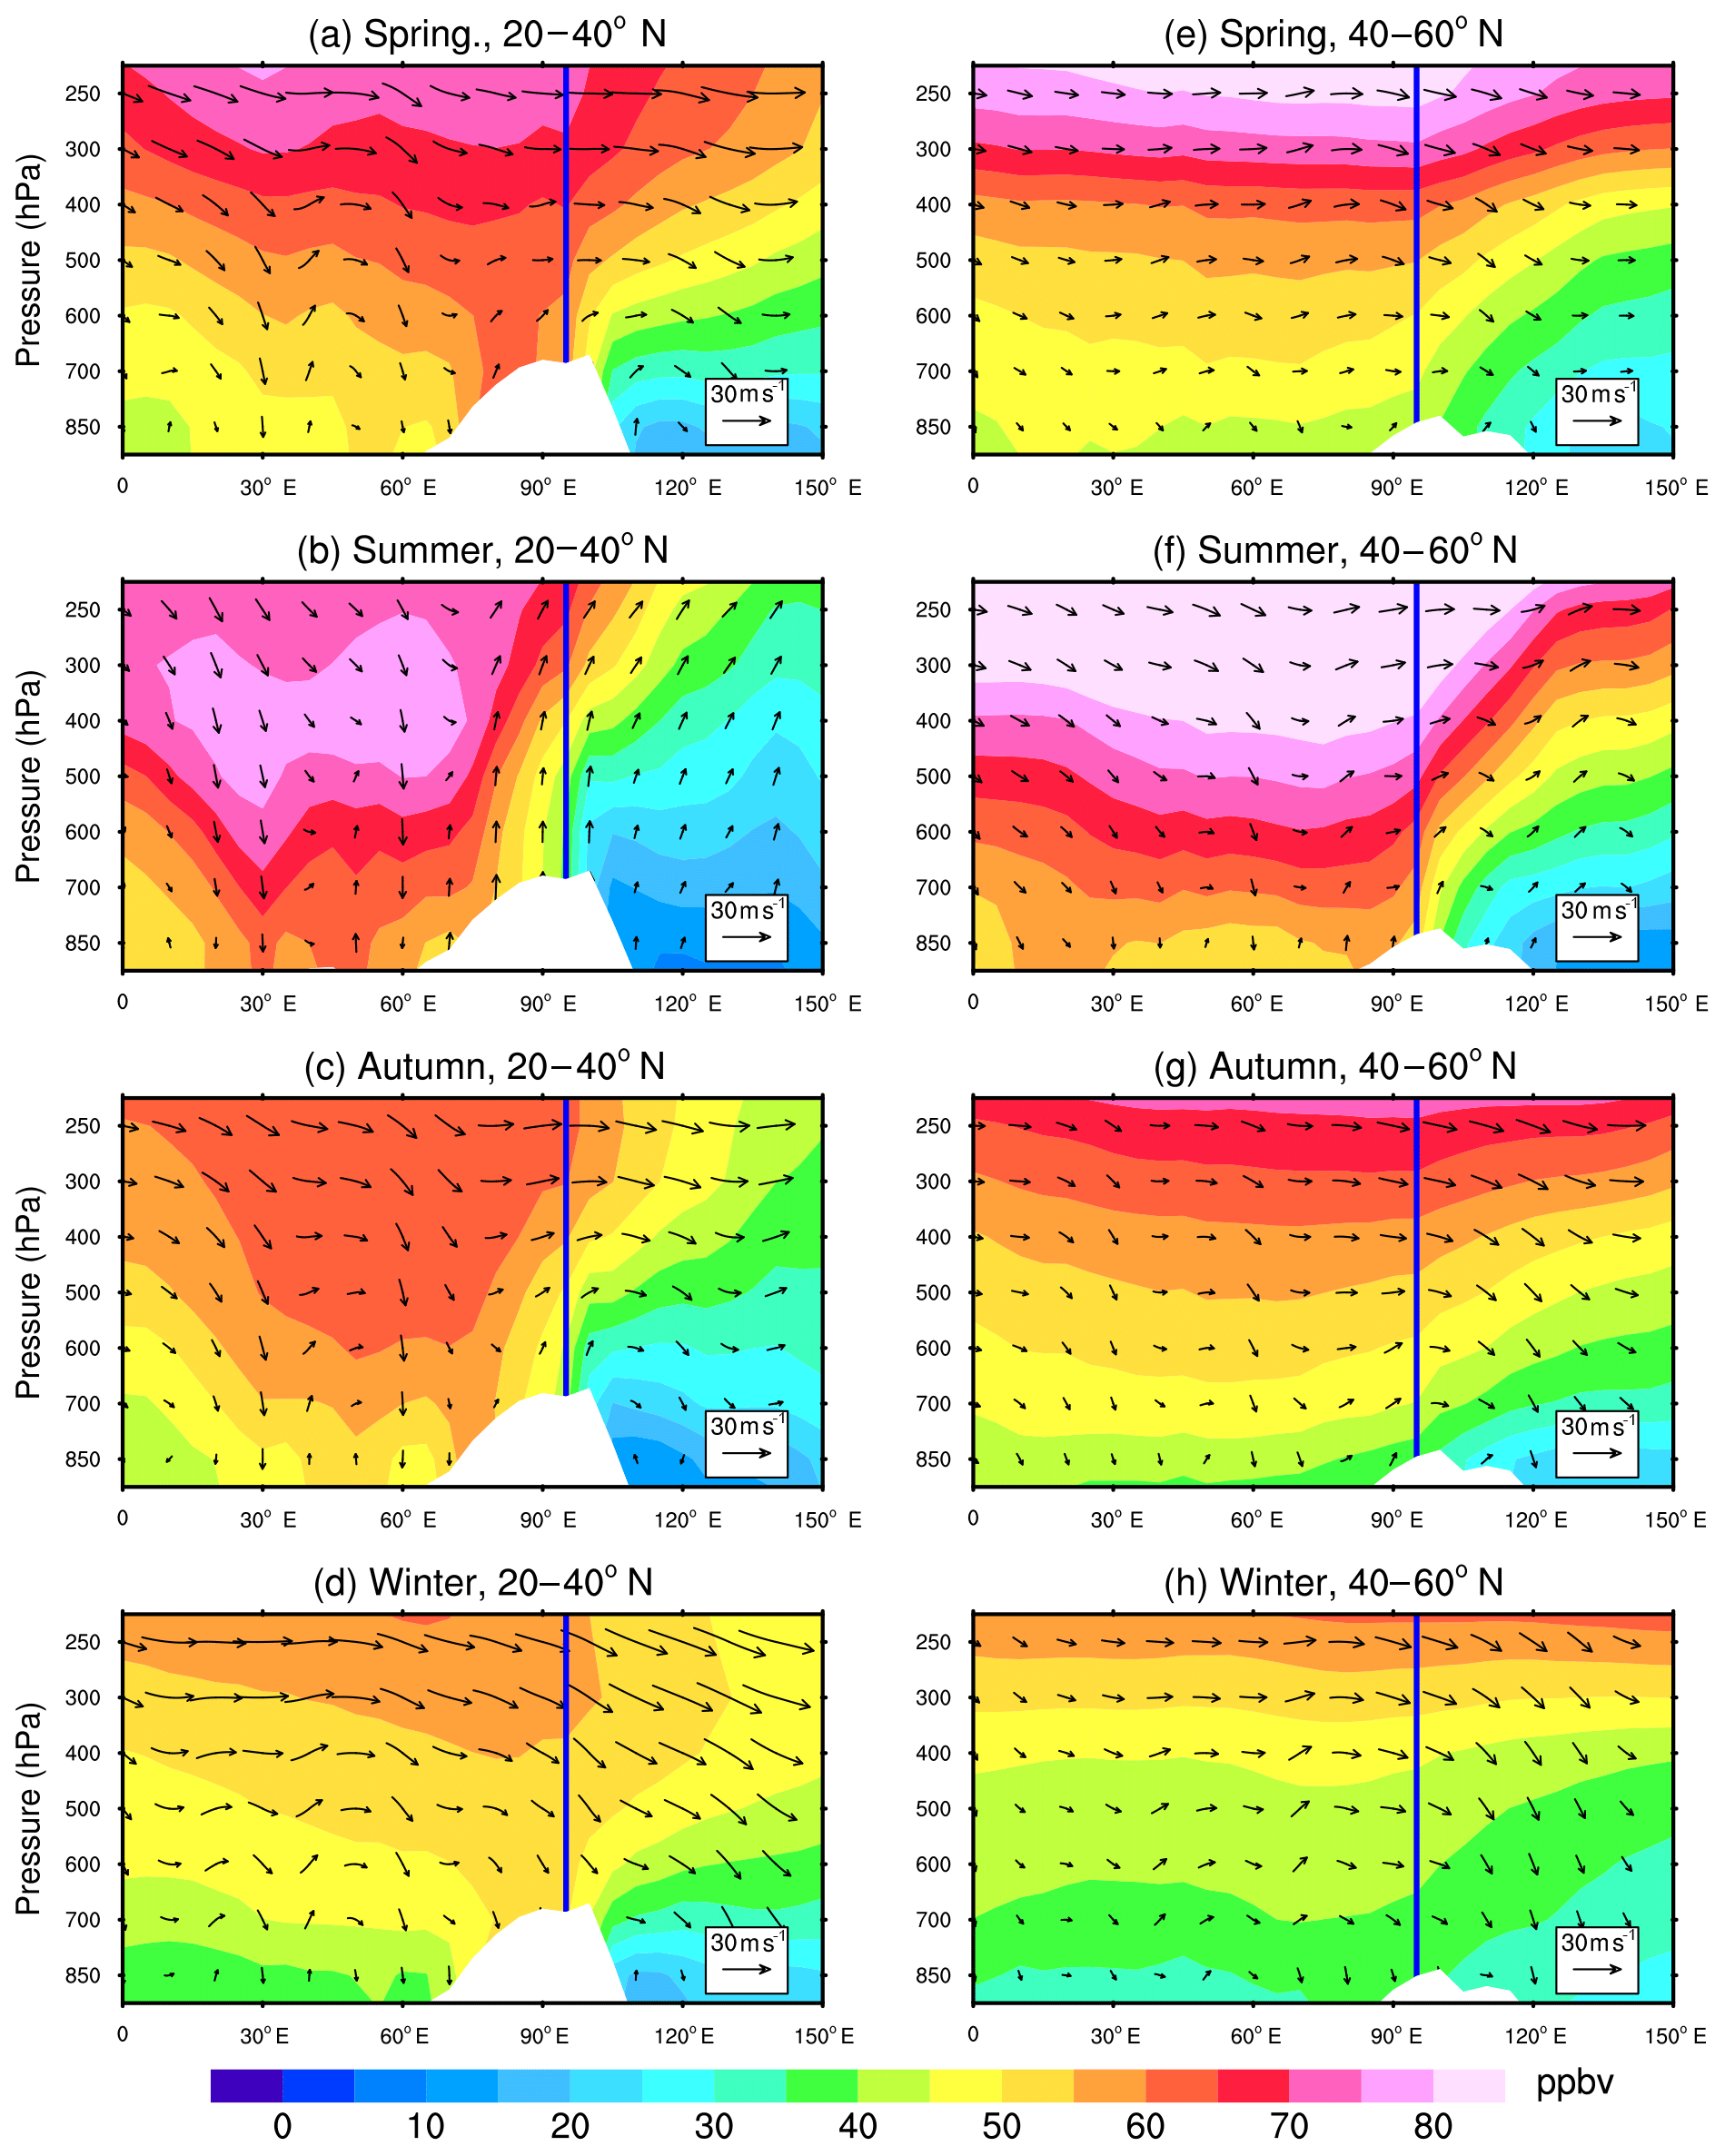
Figure 7Longitude–pressure cross sections of foreign ozone (in colour) and wind field (arrows) averaged between 20–40∘ N (a–d) and 40–60∘ N (e–h) in 2005. The white areas indicate topography. The blue lines indicate the western border of East Asia. The vertical velocities in the p coordinates are enlarged 1000 times for illustration purposes.
3.2 Foreign ozone over East Asia by source region
3.2.1 Foreign ozone in the East Asian middle and upper troposphere by source region
Figure 8b–g show how ozone from different foreign regions is distributed horizontally in the middle troposphere, illustrating significant foreign impacts on ozone over East Asia at this layer. The streamlines in Fig. 8 roughly show the transport pathways, demonstrating the importance of the westerlies in driving the ozone transport to East Asia from North America, Europe, Africa, and central Asia. Foreign ozone over East Asia is shown vertically by region in Fig. 9. In the East Asian middle and upper troposphere, foreign ozone accounts for 65 %–85 % of all ozone produced in the troposphere (Fig. 9e–h), varying with season. On average, ROW, North America, and Europe contribute 9–21 ppbv (10 %–19 % of ozone), 5–13 ppbv (7 %–12 %), and 5–7 ppbv (3 %–11 %), respectively, to ozone in the East Asian middle and upper troposphere. The sum of ozone from these three regions accounts for ∼60 % of foreign ozone at these layers. The mean concentrations of North American ozone are higher than those of European ozone over East Asia at layers above 500 hPa because of larger anthropogenic and non-anthropogenic emissions including biogenic and lightning emissions in North America (Fig. S4).
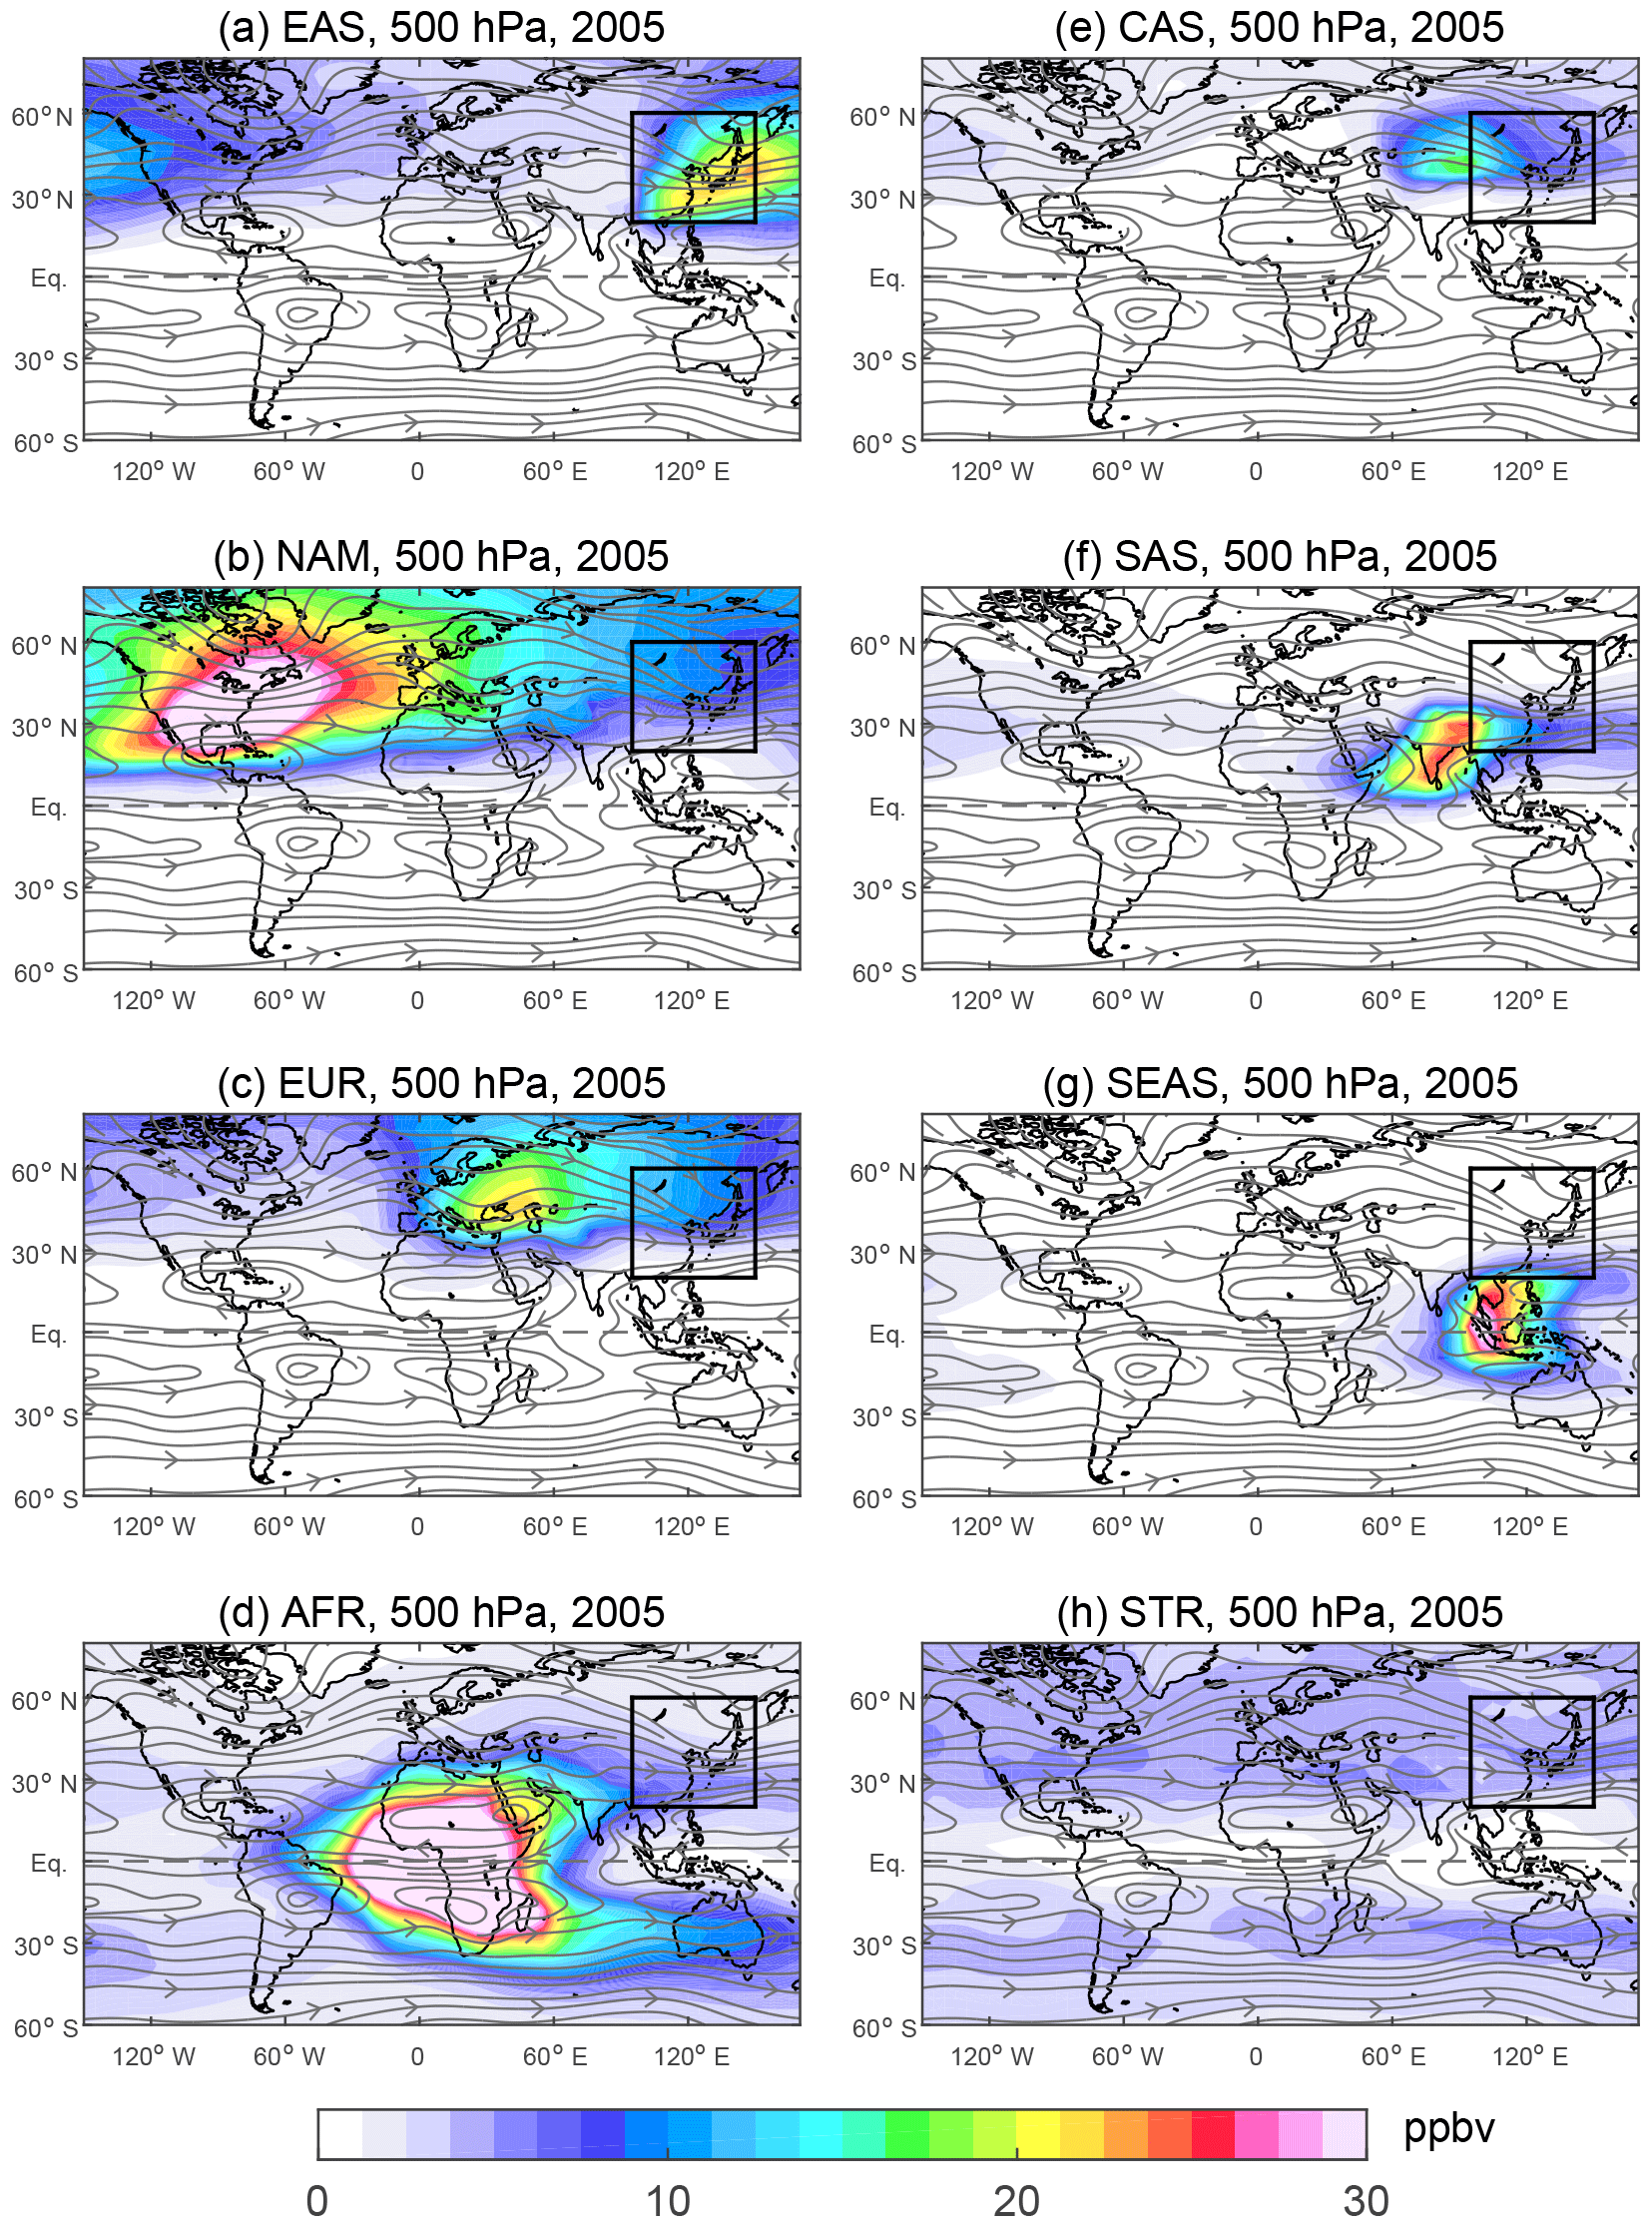
Figure 8Horizontal distributions of ozone produced in different regions in the middle troposphere (500 hPa) averaged in 2005. The boxed area indicates East Asia. The abbreviations are for (a) East Asia (EAS), (b) North America (NAM), (c) Europe (EUR), (d) Africa (AFR), (e) central Asia (CAS), (f) South Asia (SAS), (g) South-east Asia (SEAS), and (h) the stratosphere (STR).
Taking 500 hPa as an example for the middle troposphere, the difference between foreign and native ozone concentrations at this level is highest in winter, when the difference is 37 ppbv or foreign ozone is 6 times native ozone (Figs. 4 and 9). At the time, among all foreign regions, ROW is the largest contributor (13.5 ppbv, 31 % of foreign ozone), followed by North America (9.1 ppbv, 21 %), Africa (7.1 ppbv, 16 %), Europe (4.9 ppbv, 11 %), and South Asia (4.3 ppbv, 10 %). In the upper troposphere at 300 hPa, the concentrations of foreign ozone from ROW, North America, and Africa in winter are 17.3, 10.9, and 8.0 ppbv, respectively, all higher than the concentrations of native ozone (5.6 ppbv).
In winter, the transport of African ozone to the East Asian middle and upper troposphere is mainly driven by the Hadley circulation and the subtropical westerlies (Han et al., 2018). Although South Asia and South-east Asia are closer to East Asia, the atmospheric circulations are less favourable for the ozone transport from South and South-east Asia to East Asia (Fig. S5).
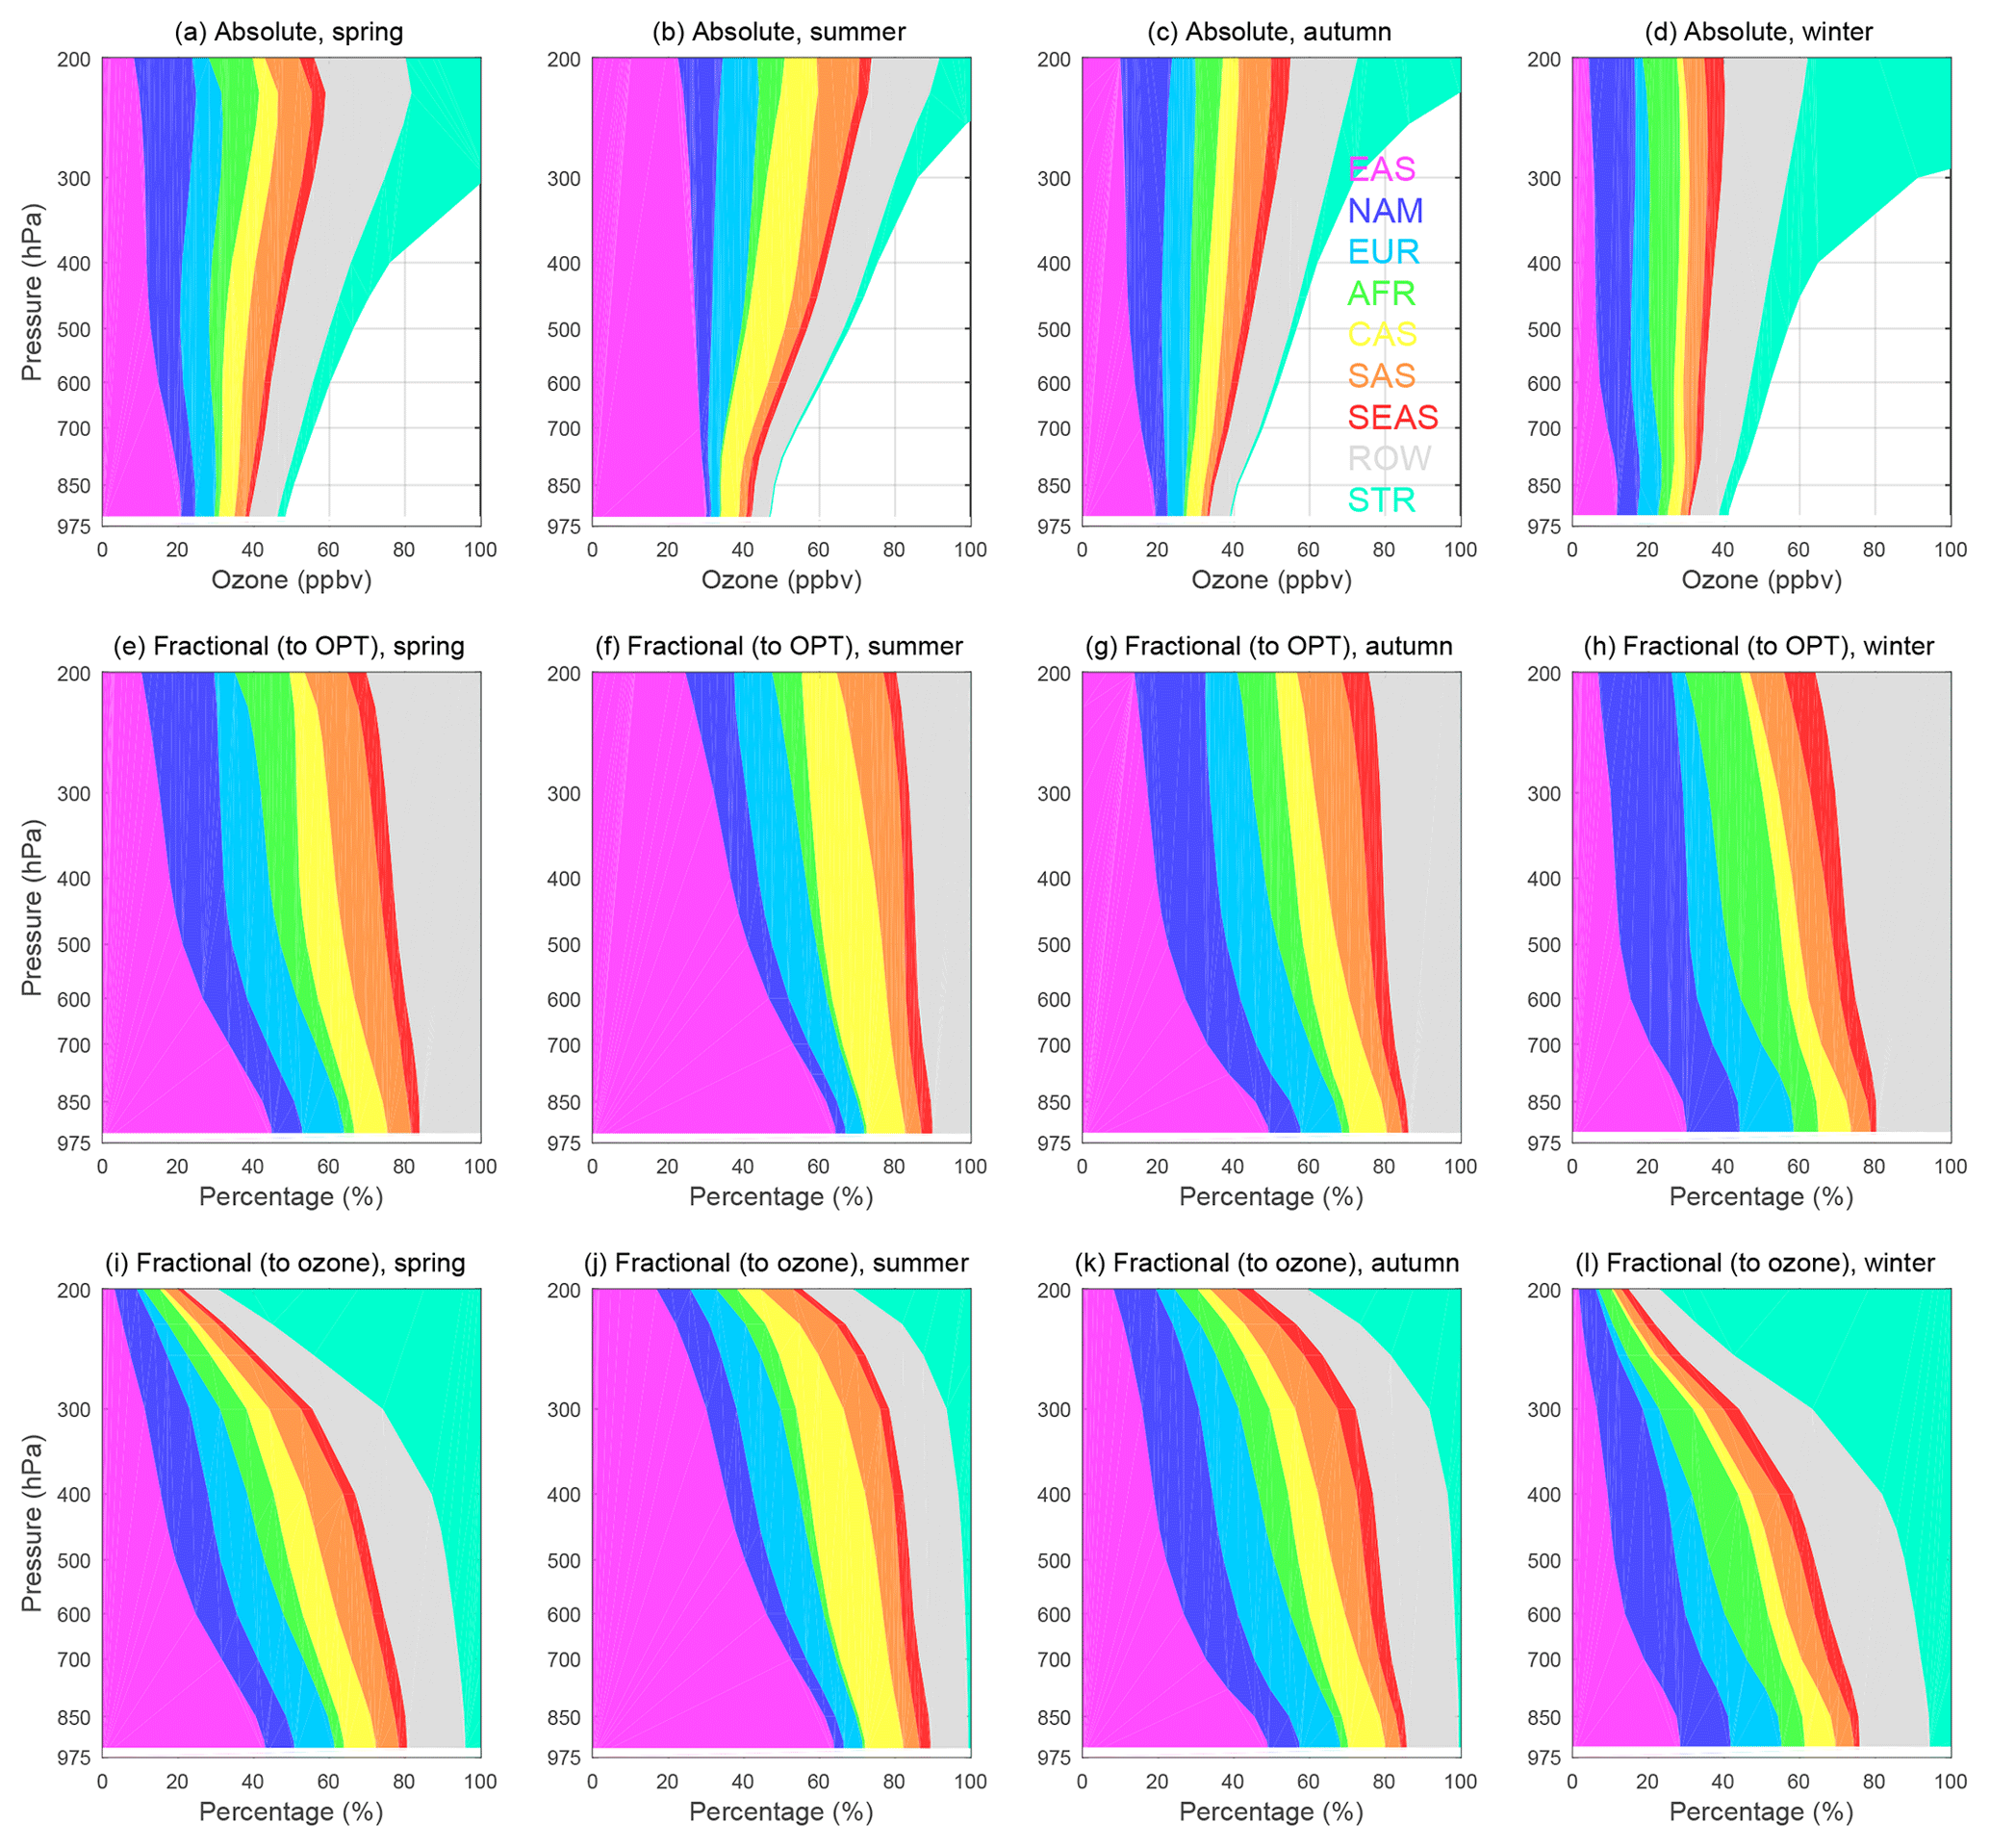
Figure 9(a–d) Vertical variations in ozone (in ppbv) from native and foreign sources over East Asia by season. (e–h) The same as (a–d) but in terms of the factional contributions (in %) to ozone produced in the troposphere (OPT). (i–l) The same as (a–d) but in terms of the fractional contributions (in %) to ozone over East Asia. All values are the means over East Asia at each altitude in 2005. The abbreviations are for East Asia (EAS), North America (NAM), Europe (EUR), Africa (AFR), central Asia (CAS), South Asia (SAS), South-east Asia (SEAS), the rest of the world (ROW), and the stratosphere (STR).
Along the vertical direction in the East Asian troposphere, foreign ozone from five of the source regions – North America, Africa, South Asia, South-east Asia, and ROW – increases obviously with altitude in all seasons (Fig. 9). European ozone also increases with altitude in the East Asian troposphere except in winter. Central Asian ozone in the entire East Asian troposphere is lowest in winter and highest in summer, when it peaks in the middle troposphere.
Stratospheric ozone in the East Asian troposphere increases rapidly with altitude, being largest in winter and second largest in spring (Fig. 9). For instance, stratospheric ozone in spring rises from 2.1 ppbv (4.3 % of ozone) at the surface to 6.4 ppbv (9.6 %) at 500 hPa and 27.1 ppbv (26.6 %) at 300 hPa (Fig. 9a and i). The simulated springtime stratospheric ozone at the East Asian surface in this study is lower than that in some previous studies that used different global chemical transport models or different versions of GEOS-Chem. The stratospheric contribution was estimated as 10 %–26 % by Nagashima et al. (2010), 4–10 ppbv in China by Wang et al. (2011), and 11.2±2.5 ppbv (February–April) in Japan by Yoshitomi et al. (2011). The seasonality of the stratospheric influence in the middle troposphere is similar to those in B. Zhu et al. (2016), who showed that stratospheric ozone at some mountain sites (> 1500 m) in China peaks in winter. By comparing GEOS-Chem simulations with Microwave Limb Sounder (MLS) satellite observations and Modern-Era Retrospective Analysis for Research and Applications (MERRA and MERRA-2) data, Jaeglé et al. (2017) suggested that GEOS-Chem underestimates the ozone enhancement from stratospheric intrusions in extratropical cyclones by a factor of 2, corresponding to a systematic underestimate of ozone in the lowermost extratropical stratosphere.
3.2.2 Foreign ozone at the East Asian surface by source region
Tables 2 and 3 show, respectively, foreign ozone and foreign anthropogenic ozone at the East Asian surface by source region. On annual average (Table 2), foreign ozone plus stratospheric ozone at the East Asian surface is ∼23.5 ppbv (54 % of surface ozone). The annual mean ozone concentrations from each of the foreign regions range between 0.9 and 6.2 ppbv, which account for 2.0 %–14.2 % of surface ozone. The largest contributing region is ROW, followed by Europe, central Asia, North America, South Asia, Africa, and South-east Asia. Seasonally, ozone from North America (5.7 ppbv, 14 % of surface ozone), Europe (5.3 ppbv, 13 %), Africa (2.4 ppbv, 6 %), and ROW (7.5 ppbv, 18 %) peaks in winter, whereas ozone from South Asia (2.9 ppbv, 6 %) peaks in spring and ozone from Central Asia (4.7 ppbv, 10 %) and South-east Asia (1.3 ppbv, 3 %) peaks in summer. The seasonal variations in North American, European, and African ozone are similar, i.e. decreasing from winter to summer and then increasing in autumn (Table 2), forming a unimodal distribution. South Asian ozone exhibits a unimodal seasonality as well (Chakraborty et al., 2015).
By ozone precursor, each of the foreign regions contributes less than 3 ppbv of anthropogenic ozone to the East Asian surface ozone in all seasons (Table 3). On average, the largest contributing regions are North America (27 % of foreign anthropogenic ozone), followed by Europe (21 %), South Asia (16 %), central Asia (14 %), and South-east Asia (12 %). Seasonally, a springtime maximum appears for anthropogenic ozone from Europe (1.8 ppbv, 4 % of surface ozone), central Asia (1.0 ppbv, 2 %), and South Asia (0.9 ppbv, 2 %), while anthropogenic ozone from North America is high in both winter (1.8 ppbv, 5 %) and spring (1.7 ppbv, 4 %). Anthropogenic ozone from Africa and ROW is the smallest in total, less than 1 ppbv throughout the year. It is noteworthy that ROW ozone generated from anthropogenic precursors contributes little to the East Asian surface ozone (0.8 % of surface ozone, Table 3), whereas the contribution of ROW ozone from both anthropogenic and non-anthropogenic precursors is much more (14.2 %, Table 2), implying the importance of non-anthropogenic emissions in ROW to the East Asian surface ozone.
The foreign anthropogenic influence on the East Asian surface ozone in spring was previously studied. Holloway et al. (2008) reported that anthropogenic ozone from both North America and Europe ranges between 1 and 3 ppbv in various regions in East Asia. Fiore et al. (2009) found that if anthropogenic emissions of ozone precursors were reduced by 20 % in spring over North America, Europe, and South Asia, surface ozone in East Asia would decrease by 0.3–0.4, 0.2–0.3, and 0.1–0.2 ppbv, respectively. Chakraborty et al. (2015) suggested a decrease of 0.2 ppbv ozone at the East Asian surface in response to a 20 % reduction in anthropogenic emissions in South Asia. Regarding foreign influences on a specific region in East Asia, X. Li et al. (2014) estimated that European and South Asian anthropogenic emissions can each contribute 2.4 and 1 ppbv to surface ozone in western China. Ni et al. (2018) suggested that Europe and South Asia contributed 1.6 and 1.4 ppbv, respectively, to surface ozone in China in the spring of 2008. Wild et al. (2004) demonstrated that North American and European anthropogenic ozone in spring each range from 1.5 to 2.5 ppbv at the surface over Japan. Using the same model but with different emission data from those in Wild et al. (2004), Yoshitomi et al. (2011) simulated that North American and European anthropogenic ozone contribute 2.8±0.5 and 3.5±1.1 ppbv, respectively, to surface ozone in Japan during February–April. Overall, simulations from this study in spring are at the same magnitude as those in previous studies and are slightly smaller than those in Yoshitomi et al. (2011), probably resulting from differences in the emission inventories and numerical models.
3.2.3 Latitudinal and longitudinal variations in foreign ozone in the East Asian troposphere by source region
Foreign ozone over East Asia varies largely with latitude as a whole (Figs. 3 and 10) and for different source regions (Figs. 8 and 10). In the troposphere (Fig. 10a–d), South Asian ozone and South-east Asian ozone are distributed mostly in the regions south of 35∘ N in East Asia. In contrast, ozone from North America, Europe, and central Asia mainly appears north of 35∘ N in East Asia. The fractional contributions of foreign ozone from South Asia, South-east Asia, and Africa all decrease with latitude, whereas the fractional contributions of foreign ozone from North America, Europe, and central Asia increase with latitude. The latitudinal variations in North American and European ozone are consistent with those in Hou et al. (2014) and Y. Zhu et al. (2017). At the East Asian surface (Fig. 10e–h), the fractional contribution of foreign ozone peaks at the northern border of East Asia (60∘ N) in the four seasons, ranging from 55 % in summer to 85 % in winter. The concentrations of stratospheric ozone at the East Asian surface are largest between 42 and 46∘ N in spring (2.4 ppbv) and winter (2.7 ppbv).
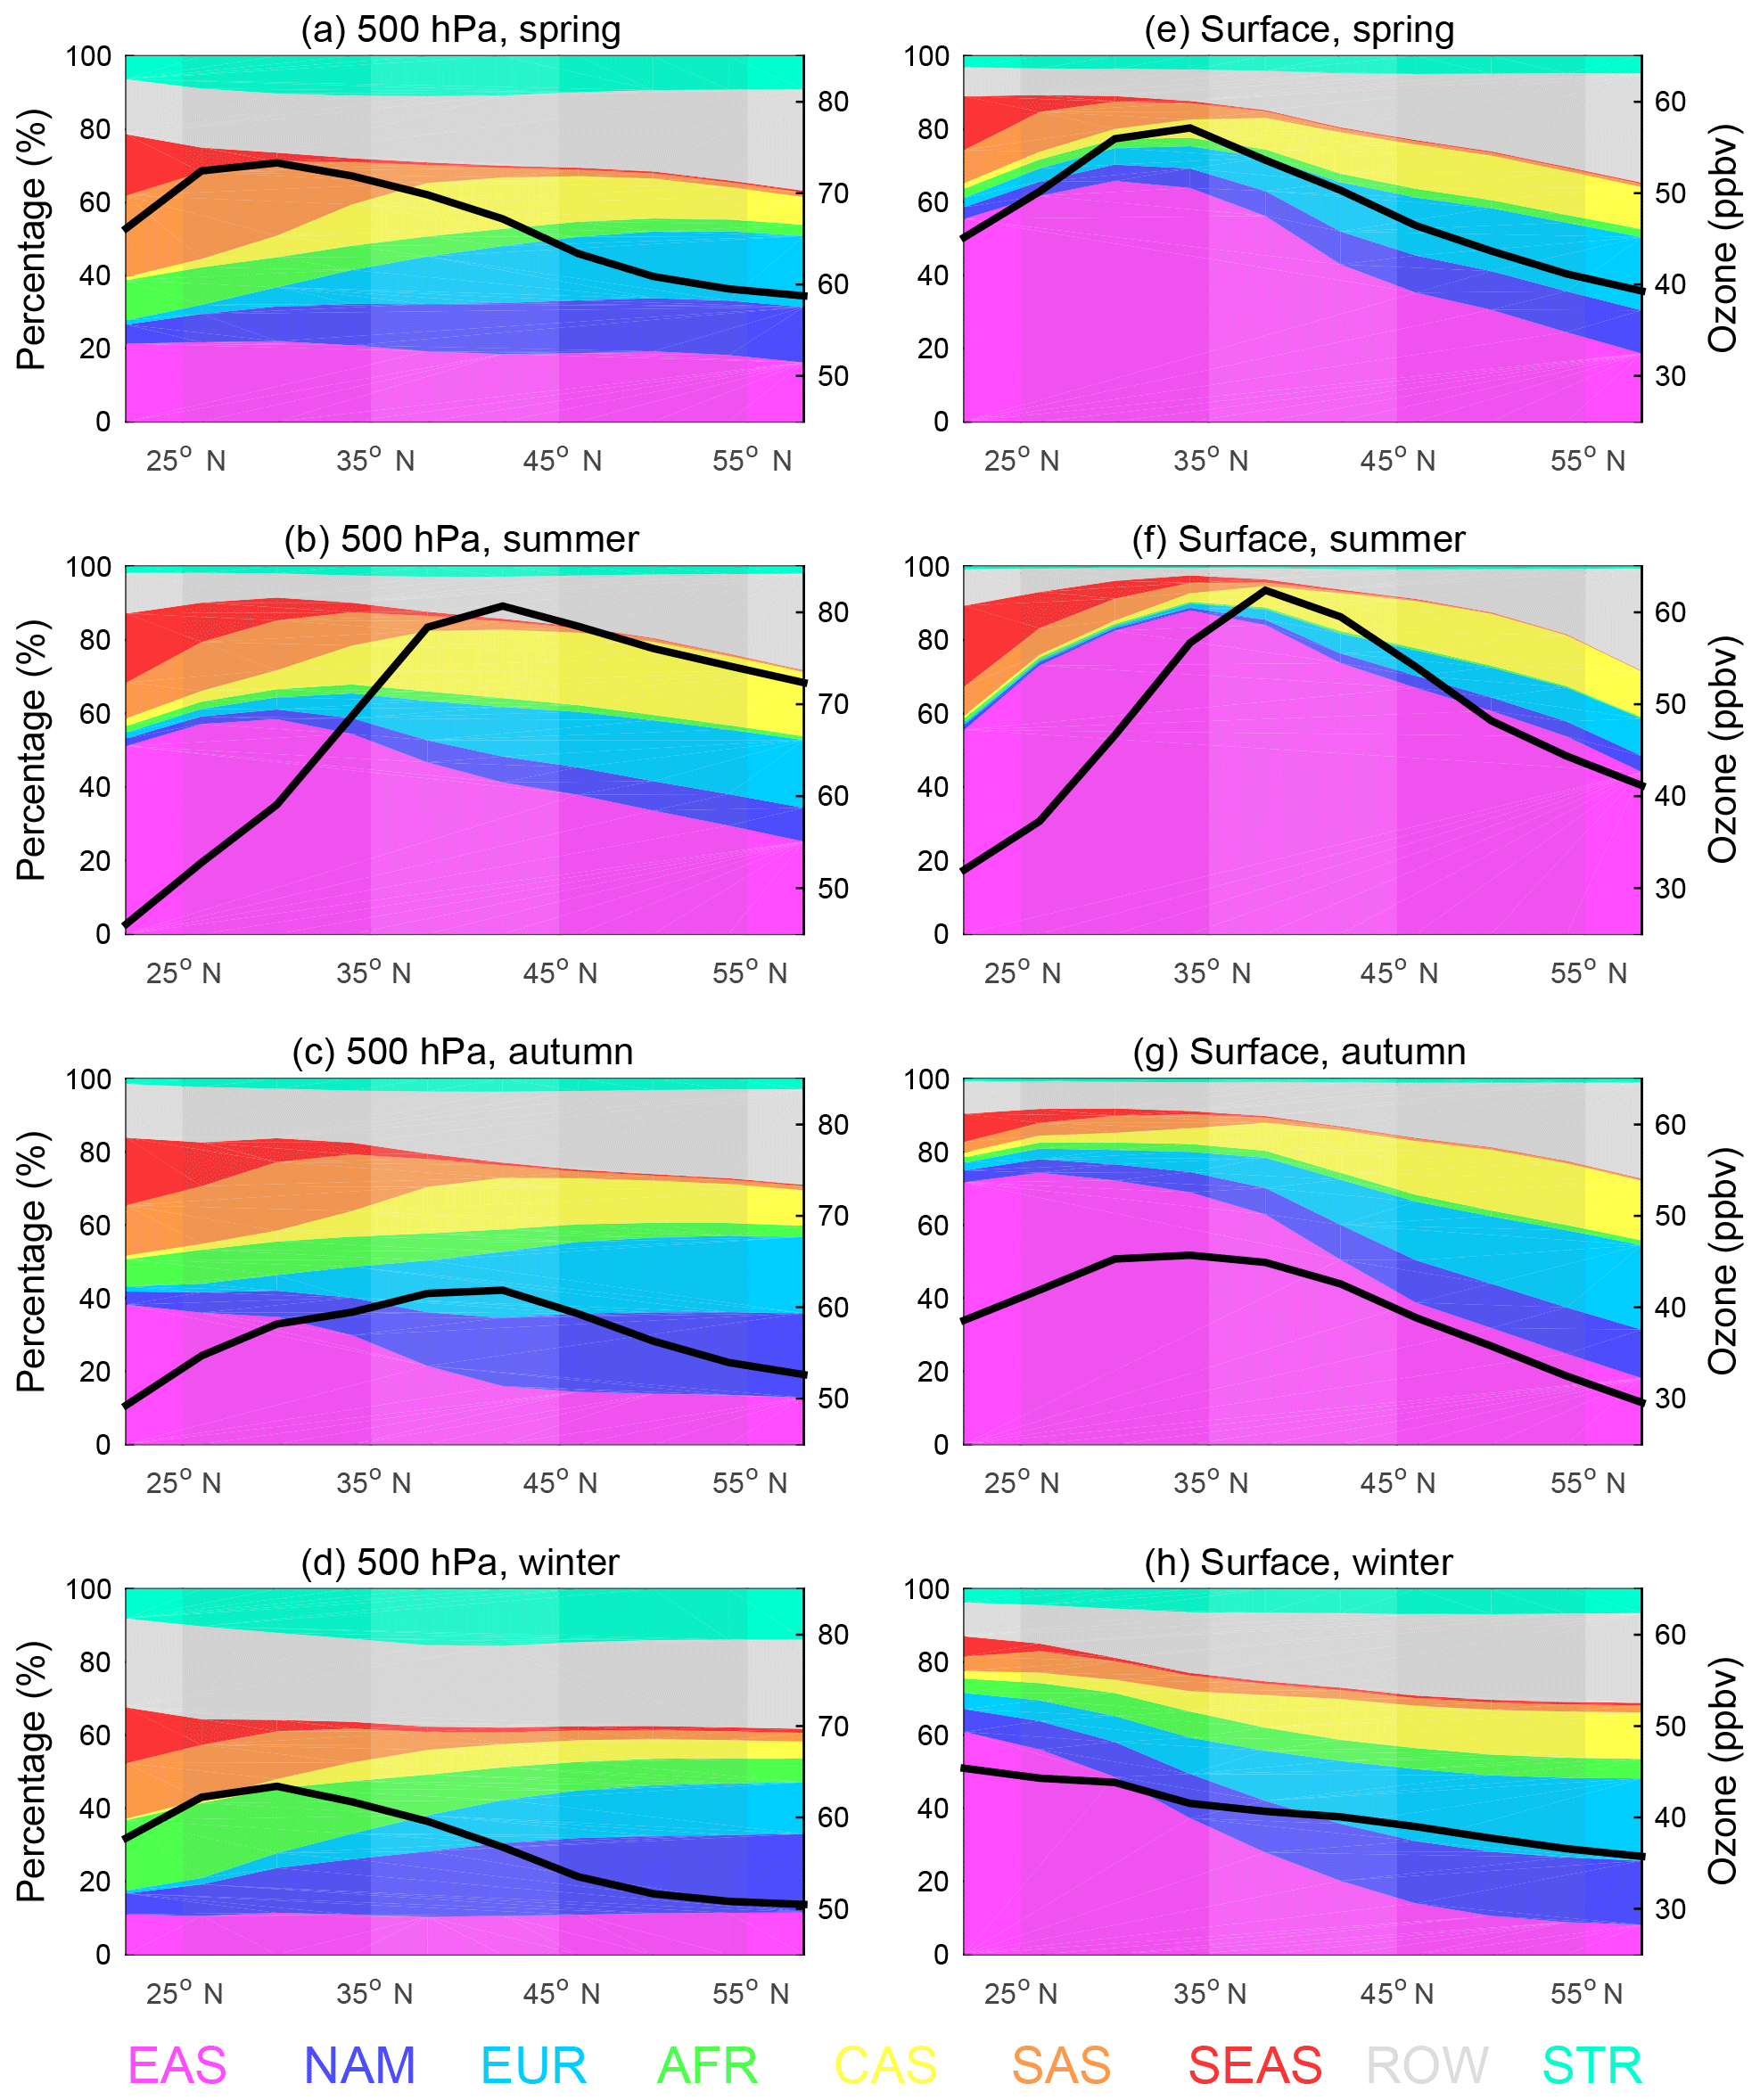
Figure 10Latitudinal variations in the fractional contributions (in %, left y axis) of native and foreign ozone to ozone in East Asia in the middle troposphere (500 hPa) (a–d) and at the surface (e–h) in 2005. The black lines indicate ozone concentrations averaged over East Asia (in ppbv, right y axis). The abbreviations are for East Asia (EAS), North America (NAM), Europe (EUR), Africa (AFR), central Asia (CAS), South Asia (SAS), South-east Asia (SEAS), the rest of the world (ROW), and the stratosphere (STR).
Regarding native ozone at the East Asian surface, in spring, it is largest around 30∘ N (36.8 ppbv, 65.8 % of ozone, Fig. 10e). The latitude at which native ozone peaks shift northward to 35∘ N in summer (50 ppbv, 88 % of ozone, Fig. 10f) and then southward to 25∘ N in autumn (31 ppbv, 74 % of ozone, Fig. 10g) and farther southward to 20∘ N in winter (28 ppbv, 61 % of ozone, Fig. 10h). This seasonal migration may be partially related to the variation in ozone production influenced by the EAM (Hou et al., 2015; S. Li et al., 2018).
The latitudinal variations in foreign ozone from different source regions are likely due to the proximity of these foreign regions to East Asia, the topography in East Asia, and the meteorology along the transport pathways, such as the variations in the subtropical westerlies. In particular, in summer, atmospheric circulations in the upper troposphere over Eurasia are greatly influenced by the South Asian High (SAH, or Tibetan High, or Asian summer monsoon anticyclone), and its position and coverage are shown by the streamlines in Fig. 11. The SAH constrains foreign ozone from North America, Europe, Africa, and ROW to latitudes north of 35∘ N in the East Asian upper troposphere (Fig. 11). The SAH also blocks the northward transport of South-east Asian ozone to East Asia. Furthermore, the SAH facilitates the build-up of South Asian ozone in the East Asian upper troposphere (Fig. 11f) (Vogel et al., 2015), being a reason for the summer maximum of South Asian ozone over the region (Fig. 9b).
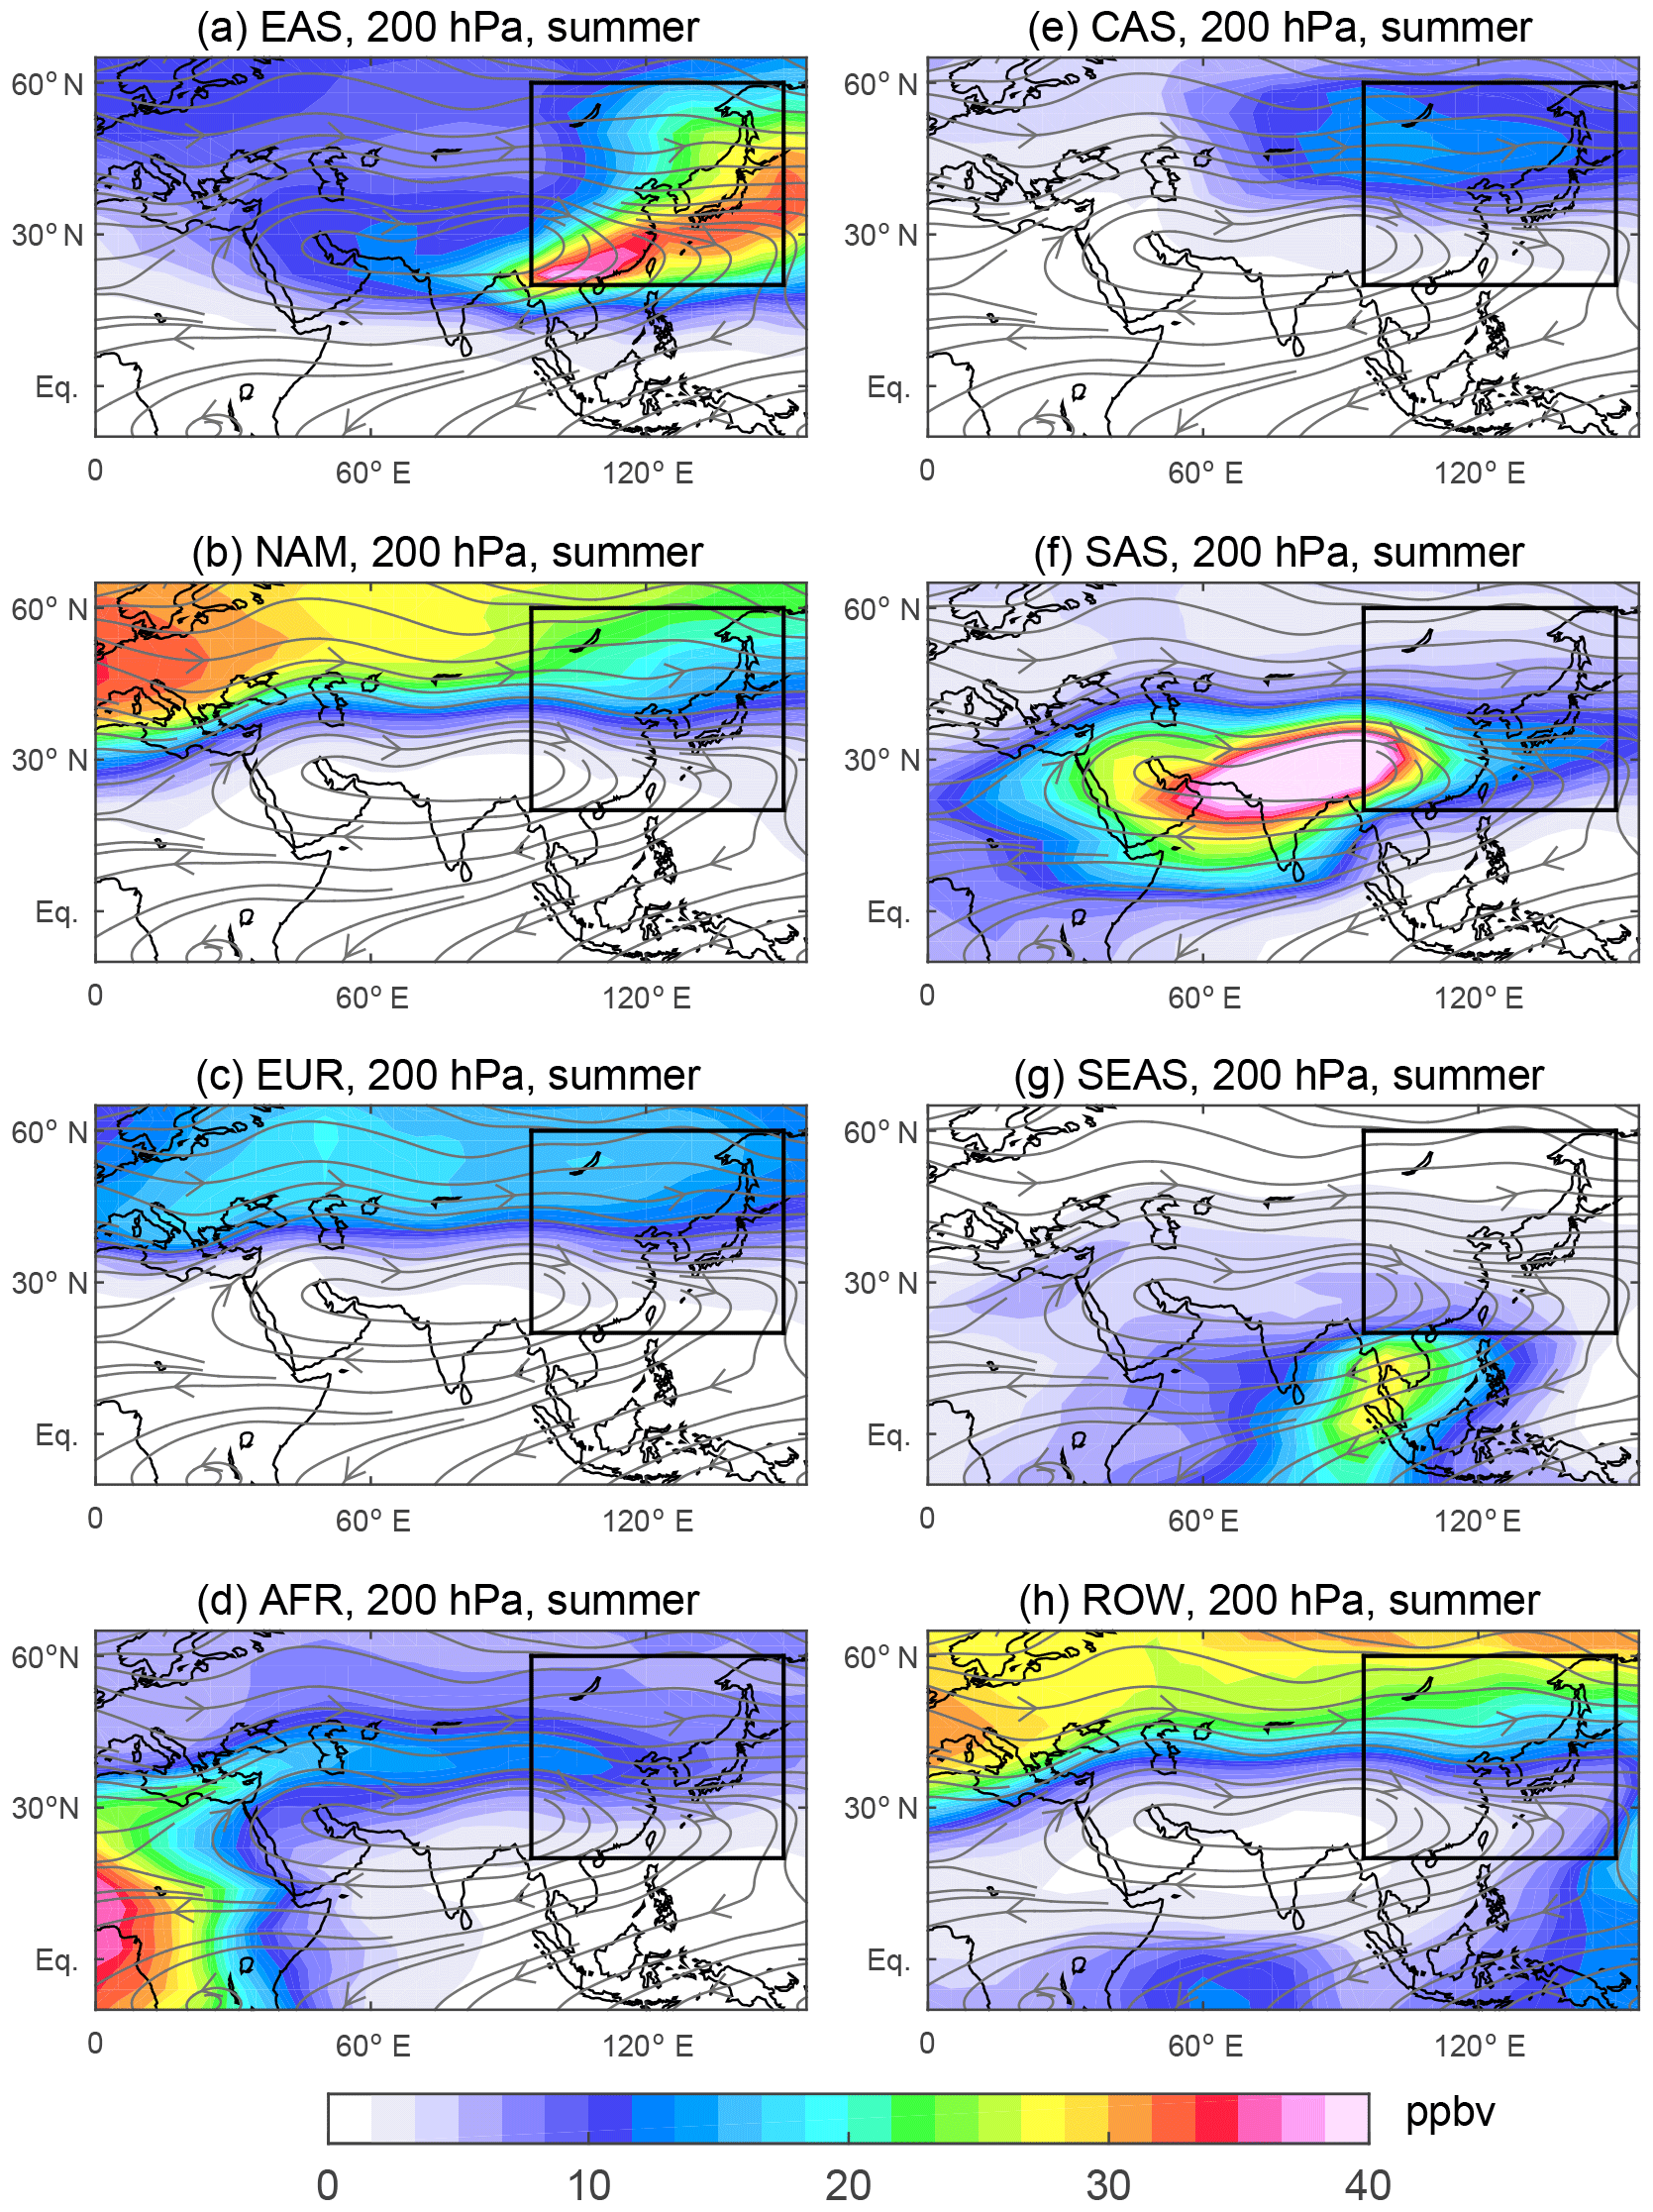
Figure 11Horizontal distributions of ozone produced in different regions overlaid with streamlines in the upper troposphere (200 hPa) in the summer of 2005. The boxed area indicates East Asia. The abbreviations are for (a) East Asia (EAS), (b) North America (NAM), (c) Europe (EUR), (d) Africa (AFR), (e) central Asia (CAS), (f) South Asia (SAS), (g) South-east Asia (SEAS), and (h) the rest of the world (ROW).
The longitudinal variations in foreign ozone from different source regions over East Asia are shown in Fig. S6. In the East Asian middle and upper troposphere, the variations in foreign and native ozone with longitude are less evident than those with latitude, especially in winter (Figs. 10 vs. S6). In the East Asian middle troposphere (500 hPa), central Asian and South Asian ozone decreases with longitude in summer but varies slightly with longitude in winter. At the East Asian surface, ozone from central Asia and South Asia decreases with longitude. The longitudinal variations in North American, European, African, and South-east Asian ozone are less obvious than those of central and South Asian ozone.
The Tagged-Ozone simulation (Table 1) was used to search for possible connections in the interannual variations between meteorology and foreign ozone in East Asia. The Tagged-Ozone simulation provides the means and year-to-year variations in native and foreign ozone from the different regions during the 20-year period (not shown). The mean native and foreign ozone at the East Asian surface are in close agreement with those in 2005 (Table 2) in the corresponding regions and seasons.
As a typical monsoon region, East Asia is largely influenced by the EAM. The monsoon circulation can impact ozone transport and distribution in East Asia (Y. Zhu et al., 2017; S. Li et al., 2018). To search for possible linkages between the EAM and the transport of foreign ozone to East Asia, we selected three EAWM indices and three EASM indices, respectively, for winter and summer. These monsoon indices were proposed to describe the features of the EAM from different perspectives (Q. Li et al., 2016; S. Li et al., 2018). The monsoon indices are each correlated with different types of foreign ozone at the East Asian surface. The linkages between the EAM and foreign ozone at the East Asian surface were assessed according to the mean of the correlation coefficients from the three indices in a season.
These six monsoon indices are widely used. The three EAWM indices were proposed by Sun and Li (1997), Jhun and Lee (2004), and Wang and Jiang (2004), corresponding to Eqs. (2)–(4), respectively. EAWMI1, defined by Sun and Li (1997), represents the EAWM strength by the averaged geopotential heights in the middle troposphere in the location of the East Asian trough, which is an important component of the EAWM. EAWMI2 (Jhun and Lee, 2004) reflects the meridional wind shear associated with the jet stream in the upper troposphere, mainly describing the variability of the EAWM in the East Asian midlatitudes. EAWMI3 (Wang and Jiang, 2004) uses the anomaly of the wind velocity around the coast of East Asia in the lower troposphere. The three EASM indices were proposed by Wang and Fan (1999), Li and Zeng (2002), and Zhang et al. (2003), corresponding to Eqs. (5)–(8), respectively. EASMI1 (Wang and Fan, 1999) is defined from the shear vorticity in the lower troposphere that reflects variations in both the monsoon trough and the subtropical high (Wang et al., 2008). EASMI2 (Li and Zeng, 2002) is a unified dynamical index of the monsoon which characterizes the seasonal and interannual variability of monsoons over different areas in the world. EASMI3 (Zhang et al., 2003) is a vorticity index similar to that in Wang and Fan (1999) but in a slightly modified domain.
In Eqs. (2)–(6), GPH500 is the geopotential height at 500 hPa, U300 is the zonal wind at 300 hPa, WS850 is the wind speed at 850 hPa, U850 is the zonal wind at 850 hPa, and δ is a dynamical normalized seasonality obtained from Eq. (7). In Eq. (7), and Vi are the January climatological and monthly wind vectors at a grid and is the mean of the January and July climatological wind vectors in the same grid. The norm ||V|| is defined as , where S denotes the domain of integration. in Eq. (8) is the anomaly of U850 from the long-term mean climatology.
Figure 12 shows the interannual variations in foreign and native ozone at the East Asian surface driven by meteorology and the strength of the EAM. In winter (Fig. 12a), the transport of both North American and European ozone is significantly related to the strength of the EAWM. The EAWM can explain more than 30 % of the interannual variations in ozone at the East Asian surface from these two regions. A positive correlation between North American ozone and the EAWM was also found by Y. Zhu et al. (2017), who suggested that the increase in ozone transport under a strong EAWM condition is mainly caused by the enhanced downdraft from the Siberian High and the East Asian trough. This explanation can also be applied to European ozone. In contrast, native ozone is negatively correlated with the interannual variation in the EAWM strength. When the EAWM is strong in winter, the enhanced Siberian High strengthens the northerly wind in the East Asian lower troposphere, and, consequently, more native ozone is taken away (Q. Li et al., 2016). Among the three EAWM indices, foreign ozone from North America and Europe at the East Asian surface correlates the best with EAWM1 (Table S2), indicating the importance of the East Asian trough for the ozone transport. When the East Asian trough is deeper in a stronger EAWM, the enhanced downdrafts behind the trough can transport more foreign ozone from the upper levels to the East Asian surface.

Figure 12Interannual variations in the anomalies of foreign ozone (in ppbv, left y axis) from various regions at the East Asian surface driven by meteorology (Tagged-Ozone) in winter (a) and summer (b). The values are averaged over 22–46∘ N, 110–145∘ E in winter and , 22–46∘ N, 95–130∘ E in summer, where the correlations are the most significant. The correlation coefficients calculated with the three sets of monsoon indices in each season are averaged. The abbreviations are for East Asia (EAS), North America (NAM), Europe (EUR), South Asia (SAS), and South-east Asia (SEAS).
In summer (Fig. 12b), the interannual variations in the EASM strength are found to be positively correlated with those of ozone and native ozone but negatively correlated with those of South Asian and South-east Asian ozone at the East Asian surface. The positive correlation between the EASM and surface ozone in East Asia was also reported in previous studies (Zhou et al., 2013; Yang et al., 2014; Hou et al., 2015; S. Li et al., 2018). Among the three EASM indices, the correlation coefficients are higher for EASM1 and EASM3 than EASM2 (Table S2), indicating that these ozone anomalies correlate closely with shear vorticity during the EASM. In a strong EASM year, a clear anomalous cyclonic circulation appears over the area south-east of China in the lower troposphere, and the south-westerly monsoon wind is weakened, as depicted by multiple studies (for example, Fig. 5 in Yang et al., 2014, and Fig. 2 in S. Li et al., 2018). The weakened south-westerly monsoon wind during a strong EASM year enhances ozone and native ozone at the East Asian surface by reducing ozone export (Yang et al., 2014). Meanwhile, the south-westerly wind brings less South Asian and South-east Asian ozone to the East Asian surface. The variation in the EASM intensity can approximately explain 32 %, 31 %, and 64 % of the interannual variability in native, South Asian, and South-east Asian ozone, respectively.
Using a global chemical transport model, GEOS-Chem, we investigated foreign influences on tropospheric ozone over East Asia. We estimated these influences from the perspectives of the anthropogenic and total emissions of ozone precursors, using the emission perturbation and tagged ozone simulations, respectively. The distributions of foreign ozone in East Asia were characterized in time (seasonally) and space (horizontally and vertically). Based on six EAM indices, links between the EAM and interannual variations in foreign ozone at the East Asian surface were explored. Conclusions are drawn as follows.
Foreign ozone is transported to East Asia mainly through the middle and upper troposphere because of the longer lifetime of ozone and the stronger westerlies at these layers than in the lower troposphere. In the East Asian middle and upper troposphere (700–200 hPa), the annual mean concentrations of foreign ozone are 0.8–4.8 times higher than that of native ozone, as foreign ozone ranges between 32 and 65 ppbv and native ozone ranges between 11 and 18 ppbv (Figs. 4 and 9).
At the East Asian surface, the annual mean of native ozone (20.4 ppbv) is comparable to that of foreign ozone (22.2 ppbv) (Table 2), which is mostly attributed to foreign ozone from ROW, followed by that from Europe, central Asia, and North America. Regarding anthropogenic ozone only, the annual mean of foreign anthropogenic ozone (4.7 ppbv, 11.3 % of ozone) is slightly lower than its native counterpart (6.3 ppbv, 15.2 % of ozone) (Table 3). Three-quarters of foreign anthropogenic ozone at the surface is from North America (3.1 % of ozone), Europe (2.4 % of ozone), South Asia (1.8 % of ozone), and South-east Asia (1.3 % of ozone). Foreign ozone at the East Asian surface is greatly modulated by the downward transport in East Asia, and thus, its seasonality is dominated by the EAM system (Fig. 7). The subsidence prevailing in the EAWM favours the downward transport of foreign ozone to the surface, while ascending flows in the EASM block such transport. Therefore, foreign ozone at the East Asian surface is highest in winter (27.1 ppbv, 66 % of ozone) and lowest in summer (16.5 ppbv, 35 % of ozone) (Table 2).
In the East Asian troposphere, foreign ozone from North America, Europe, and central Asia generally increases with latitude from 20 to 60∘ N, whereas foreign ozone from South Asia and South-east Asia decreases with latitude (Figs. 8 and 10). In the upper troposphere, the SAH in summer blocks North American, European, and African ozone from transporting to latitudes south of 35∘ N in East Asia (Fig. 11).
The interannual variations in foreign ozone at the East Asian surface are found to be closely related to the EAM strength (Fig. 12). In winter, when the EAWM is stronger, more North American and European ozone tends to be transported to the East Asian surface because of the heavier downdrafts behind the East Asian trough. Meanwhile, the strengthened north-westerly and north-easterly monsoon winds can enhance the outflow of native ozone and thus reduce its concentrations in East Asia. In summer, if the EASM is stronger, the weakened south-westerly monsoon wind enhances native ozone in East Asia by subsiding outflow of native ozone. In the meantime, the weakened south-westerlies reduce the transport of South Asian and South-east Asian ozone to the East Asian surface.
This study revealed the significant foreign influences on tropospheric ozone over East Asia through global atmospheric transport. We provided a comprehensive assessment on this topic, which covers all seasons, all foreign regions, and the tropospheric column in East Asia. We discussed this issue from multiple perspectives: by native and foreign ozone, by foreign region, by ozone precursor, and further by both source of ozone precursors and foreign region. In comparison, previous studies mostly focused on the influences from one or a few foreign regions (X. Li et al., 2014; Chakraborty et al., 2015; Y. Zhu et al., 2017; Han et al., 2018) or during one or a few seasons (Ni et al., 2018) or on the foreign influences at the East Asian surface or boundary layer (Holloway et al., 2008; Wang et al., 2011; Hou et al., 2014). For the foreign influences at the East Asian surface, the results from this study compare reasonably well with most of the previous studies, although there are some disagreements in various details.
We examined the foreign influence on ozone in East Asia throughout the entire tropospheric columns. The simulations show that the concentrations of foreign ozone increase remarkably with altitude and are much higher than its native counterpart in the middle and upper troposphere. The influence in the East Asian middle and upper troposphere is important to climate change because of the considerable ozone radiative forcing in these altitudes (Myhre et al., 2017). Such an impact has been rarely documented (Sudo and Akimoto, 2007).
We found influences of the EAM on the seasonal and interannual variations in foreign ozone distribution in East Asia, primarily through the vertical transport. Advancing from Y. Zhu et al. (2017) for North American ozone, we found strong correlations between the strength of the EAM and the interannual variation in foreign ozone from various regions including Europe, South Asia, and South-east Asia. These findings highlight the importance of meteorology in the receptor region of East Asia, offering a new insight on the issue of foreign influence on tropospheric ozone in East Asia.
This study is subject to some uncertainties arising from the following sources. Firstly, GEOS-Chem, as a numerical model, can be biased in simulating various processes in the atmosphere, which are common to all numerical models. For example, some studies suggested that the stratospheric influence may be underestimated in GEOS-Chem (Jaeglé et al., 2017). If this is the case, the absolute foreign influences assessed in this study would remain the same but the fractional contributions of foreign ozone would be overestimated. Secondly, we ran GEOS-Chem simulations with the GEOS-4 meteorology. Although GEOS-Chem driven by GEOS-4 performs strongly in simulating tropospheric ozone (Choi et al., 2017), the comparison between the GEOS-Chem and TES ozone data still indicates some biases in the simulation, especially in spring and winter (Fig. 2). Thirdly, the anthropogenic emissions in 2005 were used in the simulation, which were scaled from the most recent inventories, such as the global inventory EDGAR v3.2 in 2000 (Olivier and Berdowski, 2001; Pulles et al., 2007) and the INTEX-B Asia emissions in 2006 (Zhang et al., 2009). However, the anthropogenic emissions have significantly changed globally in the last decade (Jiang et al., 2018), especially in East Asia (Zheng et al., 2018). In the EDGAR emission inventories, global NOx, CO, and NMVOCs from 2000 to 2010 changed by 9.5 %, −1.2 %, and 5.2 %, respectively, and the three species decreased across North America and Europe, while increasing in East Asia (Turnock et al., 2018). Moreover, there have been some changes in the global natural emissions, such as in biogenic NMVOC emissions (Chen et al., 2018). Note that a change in anthropogenic emissions in foreign regions will affect the estimate of foreign anthropogenic ozone, which is quantitatively ∼20 % of the total foreign ozone in the East Asian surface and troposphere (Figs. 5 vs. 4, Tables 3 vs. 2). Fourthly, methane from anthropogenic emissions were not addressed in this version of GEOS-Chem. Finally, ozone production and loss data generated from the full chemistry simulation for the tagged ozone simulation are archived at a daily time step so that the chemical processes at a sub-daily time step are not considered in the tagged ozone simulation. We assessed these uncertainties in Figs. 2, S2, and S3. The assessments suggest that the main conclusions from this study are robust, including the orders of the magnitudes of foreign ozone in the East Asian troposphere, the variations in foreign ozone with time and space, and the importance of the EAM in modulating the foreign ozone variations in East Asia.
Regarding the meteorological impacts on the interannual variation in foreign ozone in East Asia, this study underscores the importance of the EAM, representing an advancement from Y. Zhu et al. (2017) and Han et al. (2018). Future studies can examine the influences of other prominent climate systems, for instance, the North Atlantic Oscillation (NAO) (Bacer et al., 2016) and the El Niño Southern Oscillation (ENSO) (Sekiya and Sudo, 2012, 2014; Hou et al., 2016).
The GEOS-Chem model is openly available at http://acmg.seas.harvard.edu/geos/ (last access: 27 September 2019). The TES ozone data can be downloaded from https://eosweb.larc.nasa.gov/project/tes/tes_table (last access: 27 September 2019).
The supplement related to this article is available online at: https://doi.org/10.5194/acp-19-12495-2019-supplement.
HH and JL conceived the study, designed and conducted the simulations, analysed the results, and wrote the paper. HY, TW, BZ, and XZ contributed to the data analysis and result interpretation.
The authors declare that they have no conflict of interest.
This article is part of the special issue “Regional transport and transformation of air pollution in eastern China”. It is not associated with a conference.
We gratefully acknowledge that the GEOS-Chem model has been developed and managed by the Atmospheric Chemistry Modeling Group at Harvard University. The TES ozone data were acquired from the NASA Langley Atmospheric Science Data Center. The NCEP/NCAR reanalysis data are from the NOAA Earth System Research Laboratory. We thank the constructive comments and suggestions from the anonymous reviewers.
This research has been supported by the Chinese Ministry of Science and Technology under the National Key Basic Research Development Program (grant no. 2016YFA0600204), the Natural Science Foundation of China (grant nos. 91544230 and 41375140), and the National Key Basic Research Development Program (grant no. 2014CB441203).
This paper was edited by Frank Dentener and reviewed by two anonymous referees.
Bacer, S., Christoudias, T., and Pozzer, A.: Projection of North Atlantic Oscillation and its effect on tracer transport, Atmos. Chem. Phys., 16, 15581–15592, https://doi.org/10.5194/acp-16-15581-2016, 2016.
Bey, I., Jacob, D. J., Yantosca, R. M., Logan, J. A., Field, B. D., Fiore, A. M., Li, Q., Liu, H. Y., Mickley, L. J., and Schultz, M. G.: Global modeling of tropospheric chemistry with assimilated meteorology: Model description and evaluation, J. Geophys. Res., 106, 23073–23095, https://doi.org/10.1029/2001JD000807, 2001.
Butler, T., Lupascu, A., Coates, J., and Zhu, S.: TOAST 1.0: Tropospheric Ozone Attribution of Sources with Tagging for CESM 1.2.2, Geosci. Model Dev., 11, 2825–2840, https://doi.org/10.5194/gmd-11-2825-2018, 2018.
Chakraborty, T., Beig, G., Dentener, F. J., and Wild, O.: Atmospheric transport of ozone between Southern and Eastern Asia, Sci. Total Environ., 523, 28–39, https://doi.org/10.1016/j.scitotenv.2015.03.066, 2015.
Chatani, S. and Sudo, K.: Influences of the variation in inflow to East Asia on surface ozone over Japan during 1996–2005, Atmos. Chem. Phys., 11, 8745–8758, https://doi.org/10.5194/acp-11-8745-2011, 2011.
Chen, W. H., Guenther, A. B., Wang, X. M., Chen, Y. H., Gu, D. S., Chang, M., Zhou, S. Z., Wu, L. L., and Zhang, Y. Q.: Regional to Global Biogenic Isoprene Emission Responses to Changes in Vegetation From 2000 to 2015, J. Geophys. Res., 123, 3757–3771, https://doi.org/10.1002/2017JD027934, 2018.
Choi, H.-D., Liu, H., Crawford, J. H., Considine, D. B., Allen, D. J., Duncan, B. N., Horowitz, L. W., Rodriguez, J. M., Strahan, S. E., Zhang, L., Liu, X., Damon, M. R., and Steenrod, S. D.: Global O3–CO correlations in a chemistry and transport model during July–August: evaluation with TES satellite observations and sensitivity to input meteorological data and emissions, Atmos. Chem. Phys., 17, 8429–8452, https://doi.org/10.5194/acp-17-8429-2017, 2017.
Doherty, R. M., Orbe, C., Zeng, G., Plummer, D. A., Prather, M. J., Wild, O., Lin, M., Shindell, D. T., and Mackenzie, I. A.: Multi-model impacts of climate change on pollution transport from global emission source regions, Atmos. Chem. Phys., 17, 14219–14237, https://doi.org/10.5194/acp-17-14219-2017, 2017.
Dunker, A. M., Koo, B., and Yarwood, G.: Contributions of foreign, domestic and natural emissions to US ozone estimated using the path-integral method in CAMx nested within GEOS-Chem, Atmos. Chem. Phys., 17, 12553–12571, https://doi.org/10.5194/acp-17-12553-2017, 2017.
Fiore, A. M., Jacob, D. J., Bey, I., Yantosca, R. M., Field, B. D., Fusco, A. C., and Wilkinson, J. G.: Background ozone over the United States in summer: Origin, trend, and contribution to pollution episodes, J. Geophys. Res., 107, D15, https://doi.org/10.1029/2001JD000982, 2002.
Fiore, A. M., Dentener, F. J., Wild, O., Cuvelier, C., Schultz, M. G., Hess, P., Textor, C., Schulz, M., Doherty, R. M., Horowitz, L. W., MacKenzie, I. A., Sanderson, M. G., Shindell, D. T., Stevenson, D. S., Szopa, S., Van Dingenen, R., Zeng, G., Atherton, C., Bergmann, D., Bey, I., Carmichael, G., Collins, W. J., Duncan, B. N., Faluvegi, G., Folberth, G., Gauss, M., Gong, S., Hauglustaine, D., Holloway, T., Isaksen, I. S. A., Jacob, D. J., Jonson, J. E., Kaminski, J. W., Keating, T. J., Lupu, A., Marmer, E., Montanaro, V., Park, R. J., Pitari, G., Pringle, K. J., Pyle, J. A., Schroeder, S., Vivanco, M. G., Wind, P., Wojcik, G., Wu, S., and Zuber, A.: Multimodel estimates of intercontinental source-receptor relationships for ozone pollution, J. Geophys. Res., 114, D04301, https://doi.org/10.1029/2008JD010816, 2009.
Galmarini, S., Koffi, B., Solazzo, E., Keating, T., Hogrefe, C., Schulz, M., Benedictow, A., Griesfeller, J. J., Janssens-Maenhout, G., Carmichael, G., Fu, J., and Dentener, F.: Technical note: Coordination and harmonization of the multi-scale, multi-model activities HTAP2, AQMEII3, and MICS-Asia3: simulations, emission inventories, boundary conditions, and model output formats, Atmos. Chem. Phys., 17, 1543–1555, https://doi.org/10.5194/acp-17-1543-2017, 2017.
Gaudel, A., Cooper, O., Ancellet, G., Barret, B., Boynard, A., Burrows, J., Clerbaux, C., Coheur, P.-F., Cuesta, J., and Cuevas Agulló, E.: Tropospheric Ozone Assessment Report: Present-day distribution and trends of tropospheric ozone relevant to climate and global atmospheric chemistry model evaluation, Elem. Sci. Anth., 6, 39, https://doi.org/10.1525/elementa.291, 2018.
Gettelman, A., Hoor, P., Pan, L. L., Randel, W. J., Hegglin, M. I., and Birner, T.: The extratropical upper troposphere and lower stratosphere, Rev. Geophys., 49, RG3003, https://doi.org/10.1029/2011RG000355, 2011.
Han, H., Liu, J., Yuan, H., Zhuang, B., Zhu, Y., Wu, Y., Yan, Y., and Ding, A.: Characteristics of intercontinental transport of tropospheric ozone from Africa to Asia, Atmos. Chem. Phys., 18, 4251–4276, https://doi.org/10.5194/acp-18-4251-2018, 2018.
Holloway, T., Sakurai, T., Han, Z., Ehlers, S., Spak, S. N., Horowitz, L. W., Carmichael, G. R., Streets, D. G., Hozumi, Y., Ueda, H., Park, S. U., Fung, C., Kajino, M., Thongboonchoo, N., Engardt, M., Bennet, C., Hayami, H., Sartelet, K., Wang, Z., Matsuda, K., and Amann, M.: MICS-Asia II: Impact of global emissions on regional air quality in Asia, Atmos. Environ., 42, 3543–3561, https://doi.org/10.1016/j.atmosenv.2007.10.022, 2008.
Hou, X., Zhu, B., Kang, H., and Gao, J.: Analysis of seasonal ozone budget and spring ozone latitudinal gradient variation in the boundary layer of the Asia-Pacific region, Atmos. Environ., 94, 734–741, https://doi.org/10.1016/j.atmosenv.2014.06.006, 2014.
Hou, X., Zhu, B., Fei, D., and Wang, D.: The impacts of summer monsoons on the ozone budget of the atmospheric boundary layer of the Asia-Pacific region, Sci. Total Environ., 502, 641–649, https://doi.org/10.1016/j.scitotenv.2014.09.075, 2015.
Hou, X., Zhu, B., Fei, D., Zhu, X., Kang, H., and Wang, D.: Simulation of tropical tropospheric ozone variation from 1982 to 2010: The meteorological impact of two types of ENSO event, J. Geophys. Res., 121, 9220–9236, https://doi.org/10.1002/2016JD024945, 2016.
HTAP: Hemispheric transport of air pollution 2010, United Nations, edited by: Dentener, F., Keating, T., and Akimoto, H., New York and Geneva, 2010.
Huang, M., Carmichael, G. R., Pierce, R. B., Jo, D. S., Park, R. J., Flemming, J., Emmons, L. K., Bowman, K. W., Henze, D. K., Davila, Y., Sudo, K., Jonson, J. E., Tronstad Lund, M., Janssens-Maenhout, G., Dentener, F. J., Keating, T. J., Oetjen, H., and Payne, V. H.: Impact of intercontinental pollution transport on North American ozone air pollution: an HTAP phase 2 multi-model study, Atmos. Chem. Phys., 17, 5721–5750, https://doi.org/10.5194/acp-17-5721-2017, 2017.
Jaeglé, L., Wood, R., and Wargan, K.: Multiyear Composite View of Ozone Enhancements and Stratosphere-to-Troposphere Transport in Dry Intrusions of Northern Hemisphere Extratropical Cyclones, J. Geophys. Res., 122, 13436–13457, https://doi.org/10.1002/2017JD027656, 2017.
Jhun, J.-G. and Lee, E.-J.: A new East Asian winter monsoon index and associated characteristics of the winter monsoon, J. Climate, 17, 711–726, https://doi.org/10.1175/1520-0442(2004)017<0711:ANEAWM>2.0.CO;2, 2004.
Jiang, Z., Worden, J. R., Jones, D. B. A., Lin, J.-T., Verstraeten, W. W., and Henze, D. K.: Constraints on Asian ozone using Aura TES, OMI and Terra MOPITT, Atmos. Chem. Phys., 15, 99–112, https://doi.org/10.5194/acp-15-99-2015, 2015.
Jiang, Z., Miyazaki, K., Worden, J. R., Liu, J. J., Jones, D. B. A., and Henze, D. K.: Impacts of anthropogenic and natural sources on free tropospheric ozone over the Middle East, Atmos. Chem. Phys., 16, 6537–6546, https://doi.org/10.5194/acp-16-6537-2016, 2016.
Jiang, Z., McDonald, B. C., Worden, H., Worden, J. R., Miyazaki, K., Qu, Z., Henze, D. K., Jones, D. B. A., Arellano, A. F., Fischer, E. V., Zhu, L., and Boersma, K. F.: Unexpected slowdown of US pollutant emission reduction in the past decade, P. Natl. Acad. Sci. USA, 115, 5099, https://doi.org/10.1073/pnas.1801191115, 2018.
Jonson, J. E., Schulz, M., Emmons, L., Flemming, J., Henze, D., Sudo, K., Tronstad Lund, M., Lin, M., Benedictow, A., Koffi, B., Dentener, F., Keating, T., Kivi, R., and Davila, Y.: The effects of intercontinental emission sources on European air pollution levels, Atmos. Chem. Phys., 18, 13655–13672, https://doi.org/10.5194/acp-18-13655-2018, 2018.
Karamchandani, P., Long, Y., Pirovano, G., Balzarini, A., and Yarwood, G.: Source-sector contributions to European ozone and fine PM in 2010 using AQMEII modeling data, Atmos. Chem. Phys., 17, 5643–5664, https://doi.org/10.5194/acp-17-5643-2017, 2017.
Kim, M. J., Park, R. J., Ho, C.-H., Woo, J.-H., Choi, K.-C., Song, C.-K., and Lee, J.-B.: Future ozone and oxidants change under the RCP scenarios, Atmos. Environ., 101, 103–115, https://doi.org/10.1016/j.atmosenv.2014.11.016, 2015.
Knowland, K. E., Doherty, R. M., Hodges, K. I., and Ott, L. E.: The influence of mid-latitude cyclones on European background surface ozone, Atmos. Chem. Phys., 17, 12421-12447, https://doi.org/10.5194/acp-17-12421-2017, 2017.
Lelieveld, J. and Dentener, F. J.: What controls tropospheric ozone?, J. Geophys. Res., 105, 3531–3551, https://doi.org/10.1029/1999JD901011, 2000.
Li, B., Gasser, T., Ciais, P., Piao, S., Tao, S., Balkanski, Y., Hauglustaine, D., Boisier, J.-P., Chen, Z., Huang, M., Li, L. Z., Li, Y., Liu, H., Liu, J., Peng, S., Shen, Z., Sun, Z., Wang, R., Wang, T., Yin, G., Yin, Y., Zeng, H., Zeng, Z., and Zhou, F.: The contribution of China's emissions to global climate forcing, Nature, 531, 357–361, https://doi.org/10.1038/nature17165, 2016.
Li, J. and Zeng, Q.: A unified monsoon index, Geophys. Res. Lett., 29, 115-111-115-114, https://doi.org/10.1029/2001GL013874, 2002.
Li, J., Yang, W., Wang, Z., Chen, H., Hu, B., Li, J., Sun, Y., Fu, P., and Zhang, Y.: Modeling study of surface ozone source-receptor relationships in East Asia, Atmos. Res., 167, 77–88, https://doi.org/10.1016/j.atmosres.2015.07.010, 2016.
Li, Q., Zhang, R., and Wang, Y.: Interannual variation of the wintertime fog–haze days across central and eastern China and its relation with East Asian winter monsoon, Int. J. Climatol., 36, 346–354, https://doi.org/10.1002/joc.4350, 2016.
Li, S., Wang, T., Huang, X., Pu, X., Li, M., Chen, P., Yang, X.-Q., and Wang, M.: Impact of East Asian summer monsoon on surface ozone pattern in China, J. Geophys. Res., 123, 1401–1411, https://doi.org/10.1002/2017JD027190, 2018.
Li, X., Liu, J., Mauzerall, D. L., Emmons, L. K., Walters, S., Horowitz, L. W., and Tao, S.: Effects of trans-Eurasian transport of air pollutants on surface ozone concentrations over Western China, J. Geophys. Res., 119, 12338–12354, https://doi.org/10.1002/2014JD021936, 2014.
Liang, C.-K., West, J. J., Silva, R. A., Bian, H., Chin, M., Davila, Y., Dentener, F. J., Emmons, L., Flemming, J., Folberth, G., Henze, D., Im, U., Jonson, J. E., Keating, T. J., Kucsera, T., Lenzen, A., Lin, M., Lund, M. T., Pan, X., Park, R. J., Pierce, R. B., Sekiya, T., Sudo, K., and Takemura, T.: HTAP2 multi-model estimates of premature human mortality due to intercontinental transport of air pollution and emission sectors, Atmos. Chem. Phys., 18, 10497–10520, https://doi.org/10.5194/acp-18-10497-2018, 2018.
Liu, H., Jacob, D. J., Chan, L. Y., Oltmans, S. J., Bey, I., Yantosca, R. M., Harris, J. M., Duncan, B. N., and Martin, R. V.: Sources of tropospheric ozone along the Asian Pacific Rim: An analysis of ozonesonde observations, J. Geophys. Res., 107, D21, https://doi.org/10.1029/2001JD002005, 2002.
Liu, J., Mauzerall, D. L., and Horowitz, L. W.: Analysis of seasonal and interannual variability in transpacific transport, J. Geophys. Res., 110, D04302, https://doi.org/10.1029/2004JD005207, 2005.
Liu, J. J., Jones, D. B. A., Worden, J. R., Noone, D., Parrington, M., and Kar, J.: Analysis of the summertime buildup of tropospheric ozone abundances over the Middle East and North Africa as observed by the Tropospheric Emission Spectrometer instrument, J. Geophys. Res., 114, 730–734, https://doi.org/10.1029/2008JD010993, 2009.
Liu, J. J., Jones, D. B. A., Zhang, S., and Kar, J.: Influence of interannual variations in transport on summertime abundances of ozone over the Middle East, J. Geophys. Res., 116, D20310, https://doi.org/10.1029/2011JD016188, 2011.
Lu, X., Hong, J., Zhang, L., Cooper, O. R., Schultz, M. G., Xu, X., Wang, T., Gao, M., Zhao, Y., and Zhang, Y.: Severe surface ozone pollution in China: A global perspective, Environ. Sci. Tech. Let., 5, 487–494, https://doi.org/10.1021/acs.estlett.8b00366, 2018.
McLinden, C. A., Olsen, S. C., Hannegan, B., Wild, O., Prather, M. J., and Sundet, J.: Stratospheric ozone in 3-D models: A simple chemistry and the cross-tropopause flux, J. Geophys. Res., 105, 14653–14665, https://doi.org/10.1029/2000JD900124, 2000.
Monks, P. S., Archibald, A. T., Colette, A., Cooper, O., Coyle, M., Derwent, R., Fowler, D., Granier, C., Law, K. S., Mills, G. E., Stevenson, D. S., Tarasova, O., Thouret, V., von Schneidemesser, E., Sommariva, R., Wild, O., and Williams, M. L.: Tropospheric ozone and its precursors from the urban to the global scale from air quality to short-lived climate forcer, Atmos. Chem. Phys., 15, 8889–8973, https://doi.org/10.5194/acp-15-8889-2015, 2015.
Myhre, G., Aas, W., Cherian, R., Collins, W., Faluvegi, G., Flanner, M., Forster, P., Hodnebrog, Ø., Klimont, Z., Lund, M. T., Mülmenstädt, J., Lund Myhre, C., Olivié, D., Prather, M., Quaas, J., Samset, B. H., Schnell, J. L., Schulz, M., Shindell, D., Skeie, R. B., Takemura, T., and Tsyro, S.: Multi-model simulations of aerosol and ozone radiative forcing due to anthropogenic emission changes during the period 1990–2015, Atmos. Chem. Phys., 17, 2709–2720, https://doi.org/10.5194/acp-17-2709-2017, 2017.
Nagashima, T., Ohara, T., Sudo, K., and Akimoto, H.: The relative importance of various source regions on East Asian surface ozone, Atmos. Chem. Phys., 10, 11305–11322, https://doi.org/10.5194/acp-10-11305-2010, 2010.
Nagashima, T., Sudo, K., Akimoto, H., Kurokawa, J., and Ohara, T.: Long-term change in the source contribution to surface ozone over Japan, Atmos. Chem. Phys., 17, 8231–8246, https://doi.org/10.5194/acp-17-8231-2017, 2017.
Nassar, R., Logan, J. A., Worden, H. M., Megretskaia, I. A., Bowman, K. W., Osterman, G. B., Thompson, A. M., Tarasick, D. W., Austin, S., Claude, H., Dubey, M. K., Hocking, W. K., Johnson, B. J., Joseph, E., Merrill, J., Morris, G. A., Newchurch, M., Oltmans, S. J., Posny, F., Schmidlin, F. J., Vömel, H., Whiteman, D. N., and Witte, J. C.: Validation of Tropospheric Emission Spectrometer (TES) nadir ozone profiles using ozonesonde measurements, J. Geophys. Res., 113, D15S17, https://doi.org/10.1029/2007JD008819, 2008.
Ni, R., Lin, J., Yan, Y., and Lin, W.: Foreign and domestic contributions to springtime ozone over China, Atmos. Chem. Phys., 18, 11447–11469, https://doi.org/10.5194/acp-18-11447-2018, 2018.
Nopmongcol, U., Liu, Z., Stoeckenius, T., and Yarwood, G.: Modeling intercontinental transport of ozone in North America with CAMx for the Air Quality Model Evaluation International Initiative (AQMEII) Phase 3, Atmos. Chem. Phys., 17, 9931–9943, https://doi.org/10.5194/acp-17-9931-2017, 2017.
Olivier, J. G. J. and Berdowski, J. J. M.: Global emissions sources and sinks, in: The Climate System, edited by: Berdowski, J., Guicherit, R., and Heij, B. J., 33–78. A. A. Balkema Publishers/Swets & Zeitlinger Publishers, Lisse, the Netherlands, 2001.
Pulles, T., Bolscher, M. V. H., Brand, R., and Visschedijk, A.: Assessment of Global Emissions from Fuel Combustion in the Final Decades of the 20th Century, TNO report A-R0132/B, Ned. Org. voor toegepast Natuurwet, Onderzoek, Apeldoorn, the Netherlands, 2007.
Sekiya, T. and Sudo, K.: Role of meteorological variability in global tropospheric ozone during 1970–2008, J. Geophys. Res., 117, D18303, https://doi.org/10.1029/2012JD018054, 2012.
Sekiya, T. and Sudo, K.: Roles of transport and chemistry processes in global ozone change on interannual and multidecadal time scales, J. Geophys. Res., 119, 4903–4921, https://doi.org/10.1002/2013JD020838, 2014.
Sudo, K. and Akimoto, H.: Global source attribution of tropospheric ozone: Long-range transport from various source regions, J. Geophys. Res., 112, D12302, https://doi.org/10.1029/2006JD007992, 2007.
Sun, B. and Li, C.: Relationship between the disturbances of East Asian trough and tropical convective activities in boreal winter, Chin. Sci. Bull. 42, 500–504, 1997. (in Chinese)
Turnock, S. T., Wild, O., Dentener, F. J., Davila, Y., Emmons, L. K., Flemming, J., Folberth, G. A., Henze, D. K., Jonson, J. E., Keating, T. J., Kengo, S., Lin, M., Lund, M., Tilmes, S., and O'Connor, F. M.: The impact of future emission policies on tropospheric ozone using a parameterised approach, Atmos. Chem. Phys., 18, 8953–8978, https://doi.org/10.5194/acp-18-8953-2018, 2018.
Verstraeten, W. W., Boersma, K. F., Zörner, J., Allaart, M. A. F., Bowman, K. W., and Worden, J. R.: Validation of six years of TES tropospheric ozone retrievals with ozonesonde measurements: implications for spatial patterns and temporal stability in the bias, Atmos. Meas. Tech., 6, 1413–1423, https://doi.org/10.5194/amt-6-1413-2013, 2013.
Verstraeten, W. W., Neu, J. L., Williams, J. E., Bowman, K. W., Worden, J. R., and Boersma, K. F.: Rapid increases in tropospheric ozone production and export from China, Nat. Geosci., 8, 690–695, https://doi.org/10.1038/ngeo2493, 2015.
Vogel, B., Günther, G., Müller, R., Grooß, J.-U., and Riese, M.: Impact of different Asian source regions on the composition of the Asian monsoon anticyclone and of the extratropical lowermost stratosphere, Atmos. Chem. Phys., 15, 13699–13716, https://doi.org/10.5194/acp-15-13699-2015, 2015.
Wang, B. and Fan, Z.: Choice of South Asian Summer Monsoon Indices, B. Am. Meteorol. Soc., 80, 629–638, https://doi.org/10.1175/1520-0477(1999)080<0629:COSASM>2.0.CO;2, 1999.
Wang, B., Wu, Z., Li, J., Liu, J., Chang, C.-P., Ding, Y., and Wu, G.: How to Measure the Strength of the East Asian Summer Monsoon, J. Climate, 21, 4449–4463, https://doi.org/10.1175/2008JCLI2183.1, 2008.
Wang, H. and Jiang, D.: A new East Asian winter monsoon intensity index and atmospheric circulation comparison between strong and weak composite, Quat. Sci., 24, 19–27, 2004. (in Chinese)
Wang, Y., Jacob, D. J., and Logan, J. A.: Global simulation of tropospheric O3-NOx – hydrocarbon chemistry: 3, Origin of tropospheric ozone and effects of nonmethane hydrocarbons, J. Geophys. Res., 103, 10757–10767, https://doi.org/10.1029/98jd00156, 1998.
Wang, Y., Zhang, Y., Hao, J., and Luo, M.: Seasonal and spatial variability of surface ozone over China: contributions from background and domestic pollution, Atmos. Chem. Phys., 11, 3511–3525, https://doi.org/10.5194/acp-11-3511-2011, 2011.
Wild, O. and Akimoto, H.: Intercontinental transport of ozone and its precursors in a three-dimensional global CTM, J. Geophys. Res., 106, 27729–27744, https://doi.org/10.1029/2000JD000123, 2001.
Wild, O., Pochanart, P., and Akimoto, H.: Trans-Eurasian transport of ozone and its precursors, J. Geophys. Res., 109, D11302, https://doi.org/10.1029/2003JD004501, 2004.
Worden, H. M., Bowman, K. W., Worden, J. R., Eldering, A., and Beer, R.: Satellite measurements of the clear-sky greenhouse effect from tropospheric ozone, Nat. Geosci., 1, 305–308, https://doi.org/10.1038/ngeo182, 2008.
Yang, Y., Liao, H., and Li, J.: Impacts of the East Asian summer monsoon on interannual variations of summertime surface-layer ozone concentrations over China, Atmos. Chem. Phys., 14, 6867–6879, https://doi.org/10.5194/acp-14-6867-2014, 2014.
Yoshitomi, M., Wild, O., and Akimoto, H.: Contributions of regional and intercontinental transport to surface ozone in the Tokyo area, Atmos. Chem. Phys., 11, 7583–7599, https://doi.org/10.5194/acp-11-7583-2011, 2011.
Zhang, L., Jacob, D. J., Boersma, K. F., Jaffe, D. A., Olson, J. R., Bowman, K. W., Worden, J. R., Thompson, A. M., Avery, M. A., Cohen, R. C., Dibb, J. E., Flock, F. M., Fuelberg, H. E., Huey, L. G., McMillan, W. W., Singh, H. B., and Weinheimer, A. J.: Transpacific transport of ozone pollution and the effect of recent Asian emission increases on air quality in North America: an integrated analysis using satellite, aircraft, ozonesonde, and surface observations, Atmos. Chem. Phys., 8, 6117–6136, https://doi.org/10.5194/acp-8-6117-2008, 2008.
Zhang, Q., Streets, D. G., Carmichael, G. R., He, K. B., Huo, H., Kannari, A., Klimont, Z., Park, I. S., Reddy, S., Fu, J. S., Chen, D., Duan, L., Lei, Y., Wang, L. T., and Yao, Z. L.: Asian emissions in 2006 for the NASA INTEX-B mission, Atmos. Chem. Phys., 9, 5131–5153, https://doi.org/10.5194/acp-9-5131-2009, 2009.
Zhang, Q., Jiang, X., Tong, D., Davis, S. J., Zhao, H., Geng, G., Feng, T., Zheng, B., Lu, Z., Streets, D. G., Ni, R., Brauer, M., van Donkelaar, A., Martin, R. V., Huo, H., Liu, Z., Pan, D., Kan, H., Yan, Y., Lin, J., He, K., and Guan, D.: Transboundary health impacts of transported global air pollution and international trade, Nature, 543, 705–709, https://doi.org/10.1038/nature21712, 2017.
Zhang, Q. Y., Tao, S. Y., and Chen, L. T.: The inter-annual variability of East Asian summer monsoon indices and its association with the pattern of general circulation over East Asia, Acta Meteorol. Sin., 61, 559–568, https://doi.org/10.11676/qxxb2003.056, 2003. (in Chinese)
Zhang, Y., Kuang, X., Guo, W., and Zhou, T.: Seasonal evolution of the upper-tropospheric westerly jet core over East Asia, Geophys. Res. Lett., 33, L11708, https://doi.org/10.1029/2006GL026377, 2006.
Zheng, B., Tong, D., Li, M., Liu, F., Hong, C., Geng, G., Li, H., Li, X., Peng, L., Qi, J., Yan, L., Zhang, Y., Zhao, H., Zheng, Y., He, K., and Zhang, Q.: Trends in China's anthropogenic emissions since 2010 as the consequence of clean air actions, Atmos. Chem. Phys., 18, 14095–14111, https://doi.org/10.5194/acp-18-14095-2018, 2018.
Zhou, D., Ding, A., Mao, H., Fu, C., Wang, T., Chan, L. Y., Ding, K., Zhang, Y., Liu, J., Lu, A., and Hao, N.: Impacts of the East Asian monsoon on lower tropospheric ozone over coastal South China, Environ. Res. Lett., 8, 044011, https://doi.org/10.1088/1748-9326/8/4/044011, 2013.
Zhu, B., Hou, X., and Kang, H.: Analysis of the seasonal ozone budget and the impact of the summer monsoon on the northeastern Qinghai-Tibetan Plateau, J. Geophys. Res., 121, 2029–2042, https://doi.org/10.1002/2015JD023857, 2016.
Zhu, J., Liao, H., Mao, Y., Yang, Y., and Jiang, H.: Interannual variation, decadal trend, and future change in ozone outflow from East Asia, Atmos. Chem. Phys., 17, 3729–3747, https://doi.org/10.5194/acp-17-3729-2017, 2017.
Zhu, Y., Liu, J., Wang, T., Zhuang, B., Han, H., Wang, H., Chang, Y., and Ding, K.: The Impacts of Meteorology on the Seasonal and Interannual Variabilities of Ozone Transport From North America to East Asia, J. Geophys. Res., 122, 10612–10636, https://doi.org/10.1002/2017JD026761, 2017.
- Abstract
- Introduction
- Model description and simulation experiments
- Seasonal variations in foreign ozone over East Asia
- Interannual variations in foreign ozone at the East Asian surface
- Discussion and conclusions
- Data availability
- Author contributions
- Competing interests
- Special issue statement
- Acknowledgements
- Financial support
- Review statement
- References
- Supplement