the Creative Commons Attribution 4.0 License.
the Creative Commons Attribution 4.0 License.
 | 31 Jan 2019
Modeling the effect of non-ideality, dynamic mass transfer and viscosity on SOA formation in a 3-D air quality model
Karine Sartelet
Florian Couvidat
In this study, assumptions (ideality and thermodynamic equilibrium) commonly made in three-dimensional (3-D) air quality models were reconsidered to evaluate their impacts on secondary organic aerosol (SOA) formation over Europe.
To investigate the effects of non-ideality, dynamic mass transfer and aerosol viscosity on the SOA formation, the Secondary Organic Aerosol Processor (SOAP) model was implemented in the 3-D air quality model Polyphemus. This study presents the first 3-D modeling simulation which describes the impact of aerosol viscosity on the SOA formation. The model uses either the equilibrium approach or the dynamic approach with a method specially designed for 3-D air quality models to efficiently solve particle-phase diffusion when particles are viscous.
Sensitivity simulations using two organic aerosol models implemented in Polyphemus to represent mass transfer between gas and particle phases show that the computation of the absorbing aerosol mass strongly influences the SOA formation. In particular, taking into account the concentrations of inorganic aerosols and hydrophilic organic aerosols in the absorbing mass of the aqueous phase increases the average SOA concentration by 5 % and 6 %, respectively. However, inorganic aerosols influence the SOA formation not only because they constitute an absorbing mass for hydrophilic SOA, but also because they interact with organic compounds. Non-ideality (short-, medium- and long-range interactions) was found to influence SOA concentrations by about 30 %.
Concerning the dynamic mass transfer for the SOA formation, if the viscosity of SOA is not taken into account and if ideality of aerosols is assumed, the dynamic approach is found to give generally similar results to the equilibrium approach (indicating that equilibrium is an efficient hypothesis for inviscid and ideal aerosols). However, when a non-ideal aerosol is assumed, taking into account the dynamic mass transfer leads to a decrease of concentrations of the hydrophilic compounds (compared to equilibrium). This decrease is due to differences in the values of activity coefficients, which are different between values computed for bulk aerosols and those for each size section. This result indicates the importance of non-ideality on the dynamic evolution of SOA.
For viscous aerosols, assuming a highly viscous organic phase leads to an increase in SOA concentrations during daytime (by preventing the evaporation of the most volatile organic compounds). The partitioning of nonvolatile compounds is not affected by viscosity, but the aging of more volatile compounds (that leads to the formation of the less volatile compounds) slows down as the evaporation of those compounds is stopped due to the viscosity of the particle. These results imply that aerosol concentrations may deviate significantly from equilibrium as the gas–particle partitioning could be higher than predicted by equilibrium. Furthermore, although a compound evaporates in the simulation using the equilibrium approach, the same compound can condense in the simulation using the dynamic approach if the particles are viscous.
The results of this study emphasize the need for 3-D air quality models to take into account the effect of non-ideality on SOA formation and the effect of aerosol viscosity for the more volatile fraction of semi-volatile organic compounds.


Inorganic and organic aerosols constitute an important fraction of aerosols (Putaud et al., 2004; Jimenez et al., 2009) which influence climate and health (Rattanavaraha et al., 2011; Boucher, 2015; Shrivastava et al., 2017). A large fraction of inorganic and organic aerosols are not directly emitted, but they are formed in the atmosphere by the condensation of condensable compounds, which are often semi-volatile; i.e., they exist both in the gas and in the particle phases. The modeling of the mass transfer of condensable compounds (inorganic and organic) from the gas phase to the particle phase is important because it determines the fraction of the condensable compounds in the particle phase and therefore the particle concentration. It is usually modeled by three approaches: the dynamic approach, the equilibrium approach and the hybrid approach. In the dynamic approach, the mass transfer between the gas and the particle phases is explicitly calculated by solving the mass flux equation (e.g., Wexler and Seinfeld, 1990; Bowman et al., 1997). In the equilibrium approach, instantaneous equilibrium is assumed between the gas and particle phases (Pankow, 1994). The dynamic approach provides a more accurate representation of the gas–particle mass transfer but is computationally more expensive than the equilibrium approach. The hybrid approach combines these two approaches. As gas-phase molecules condense more rapidly on fine than on coarse particles (and therefore reach equilibrium more rapidly with fine particles), the mass transfer is explicitly computed for coarse particles using the dynamic approach, and instantaneous equilibrium is assumed for fine particles in the hybrid approach (Capaldo et al., 2000; Zhang et al., 2004; Debry et al., 2007).
Several previous studies showed that organic aerosols can be highly viscous (Virtanen et al., 2010; Cappa and Wilson, 2011; Pfrang et al., 2011; Shiraiwa et al., 2011, 2013; Vaden et al., 2011; Shiraiwa and Seinfeld, 2012; Abramson et al., 2013; Renbaum-Wolff et al., 2013; Reid et al., 2018). The diffusion of organic compounds from the particle surface inside the particle is influenced by the viscosity of organic aerosols, which depends on relative humidity and aerosol composition (Song et al., 2016a; O'Meara et al., 2017). The diffusion is very slow when the particle-phase state is semisolid, solid or glassy solid (Shiraiwa et al., 2017). By influencing the diffusion inside the particle, viscosity influences the mass transfer between gas and particle phases, which is much slower than for nonviscous particles (Shrivastava et al., 2017). Several models explicitly treat the particle-phase diffusion of organic compounds (Shiraiwa et al., 2012; Roldin et al., 2014). However, the use of these models is limited in three-dimensional (3-D) air quality models because particles need to be discretized with a high number of particle layers, which leads to an expensive computational cost.
Although the equilibrium approach is widely used in 3-D air quality models because of its computational efficiency, the dynamic approach is also sometimes used in 3-D air quality models for inorganic aerosols (Jacobson, 1997; Meng et al., 1998; Sun and Wexler, 1998; Sartelet et al., 2007a). However, to our knowledge, the impact of viscosity of particles on gas–particle phase partitioning and organic aerosol concentrations has not yet been taken into account in 3-D air quality models.
The mass transfer of condensable organic compounds between the gas and particle phases is influenced by interactions with other compounds. The activity coefficients reflect the non-ideality of aerosols and the influence of the interactions between compounds on the mass transfer between the gas and particle phases.
Organic aerosol models often assume ideality, and they do not take into account the influence of activity coefficients on the formation of secondary organic aerosols (SOAs). Activity coefficients may be determined by thermodynamic models. For example, the UNIQUAC Functional-group Activity Coefficients (UNIFAC) thermodynamic model (Fredenslund et al., 1975) is based on a functional group method, which estimates short-range activity coefficients (interactions between uncharged molecules) by using the structure of the molecules present in the particles. However, in the aqueous phase, for hydrophilic organic compounds, due to the presence of ions, such as inorganic ions, medium- and long-range activity coefficients (resulting from electrostatic interactions) may also influence activity coefficients. These medium- and long-range activity coefficients are described by the Aerosol Inorganic-Organic Mixtures Functional groups Activity Coefficients (AIOMFAC) model (Zuend et al., 2008). The effect of activity coefficients was already investigated by a previous study (Couvidat et al., 2012) by using the UNIFAC model. Compared to assuming ideality, computing activity coefficients was found to decrease the concentrations of hydrophobic SOA (condensing onto the organic phase of particles) but also to increase the concentrations of hydrophilic SOA (condensing onto the aqueous phase of particles). AIOMFAC and UNIFAC are used in this study to compute the activity coefficients for organic–inorganic mixtures. These models were developed using a group contribution method. Eighteen main functional groups and 45 subgroups in AIOMFAC are used in this study. The SOA surrogates are split into these functional groups. The computation of activity coefficients depends on the functional groups that are present in the SOA surrogates. It is assumed here that the SOA surrogates represent the major SOA compound types in terms of functional groups. However, considering more compounds in the model may affect the computation of activity coefficients and enhance their effect as a stronger variability of composition would be simulate. Pye et al. (2017) obtained a reduction of the bias in SOA for routine monitoring stations taking into account the non-ideality via activity coefficients. However, this study did not take into account the effect of interactions between inorganic and organic compounds.
The Secondary Organic Aerosol Processor (SOAP) model (Couvidat and Sartelet, 2015) was developed to represent the condensation and evaporation of organic aerosols using both the equilibrium and dynamic approaches. The SOAP model was designed to be implemented in 3-D air quality models and can be used to implicitly represent the diffusion of organic compounds inside the particle phase, using a low number of particle layers. Compared to an explicit representation of the diffusion of organic compounds with a high number of particle layers, the SOAP model showed good agreements of modeled organic concentrations of viscous particles, using a lower number of aerosol layers.
In this study, we present the implementation of the SOAP model in the 3-D air quality model Polyphemus, and present differences between SOAP and the hydrophilic/hydrophobic organic (H2O) model (Couvidat et al., 2012) and how the new processes implemented in the SOAP model influence SOA formation (absorbing mass, non-ideality, viscosity). Jathar et al. (2016) showed that organic-phase water uptake leads to an increase in total organic aerosol concentration. Water uptake is taken into account in the SOAP model to estimate the absorbing mass. We estimate for the first time in a 3-D air quality model the maximum influence of aerosol viscosity on particle organic concentrations over Europe. To do so, we compare simulations assuming inviscid or extremely viscous aerosols. We also estimate the influence of non-ideality, in particular the influence of inorganic concentrations via medium- and long-range activity coefficients on SOA concentrations. The SOAP model and differences with H2O, the previously used SOA model in Polyphemus, are described in Sect. 2. Section 3 details the modeling of the newly added processes studied here: medium- and long-range activity coefficients, aerosol dynamics and viscosity. Finally, Sect. 4 presents the simulations and the sensitivity to these processes.
The SOAP model was implemented in the chemistry transport model Polair3D (Sartelet et al., 2007b) of the air quality platform Polyphemus version 1.8 (Mallet et al., 2007). The aerosol dynamics (coagulation, condensation and evaporation) is modeled with the SIze REsolved Aerosol Model (SIREAM; Debry et al., 2007). The particle size distribution is divided into sections, each section corresponding to a range of diameters. Similarly to H2O, the SOAP model is based on the molecular surrogate approach. It distinguishes hydrophobic compounds from hydrophilic compounds.
In the molecular surrogate approach, organic compounds are represented by surrogates, which are model compounds chosen depending on their sources (anthropogenic vs. biogenic) and their properties, such as their affinity with water (hydrophilic vs. hydrophobic) and their volatility. Oxidation of the SOA precursors differs depending on the regime of nitrogen oxides (NOx) (low NOx regime vs. high NOx regime). Different reactions (Kim et al., 2011) were added to the gas-phase chemistry model of Polyphemus (CB05 is used here; Yarwood et al., 2005) to model the formation of organic compounds from five classes of SOA precursors (intermediate and semi-volatile organic compounds of anthropogenic emissions, aromatic compounds, isoprene, monoterpenes and sesquiterpenes). As detailed in Couvidat et al. (2012), surrogates from anthropogenic precursors are mostly hydrophobic, while those from biogenic precursors are mostly hydrophilic. Table 1 summarizes the surrogates and their properties (volatility and hydrophilicity).
Table 1Description of the SOA surrogate compounds (Couvidat and Sartelet, 2015).
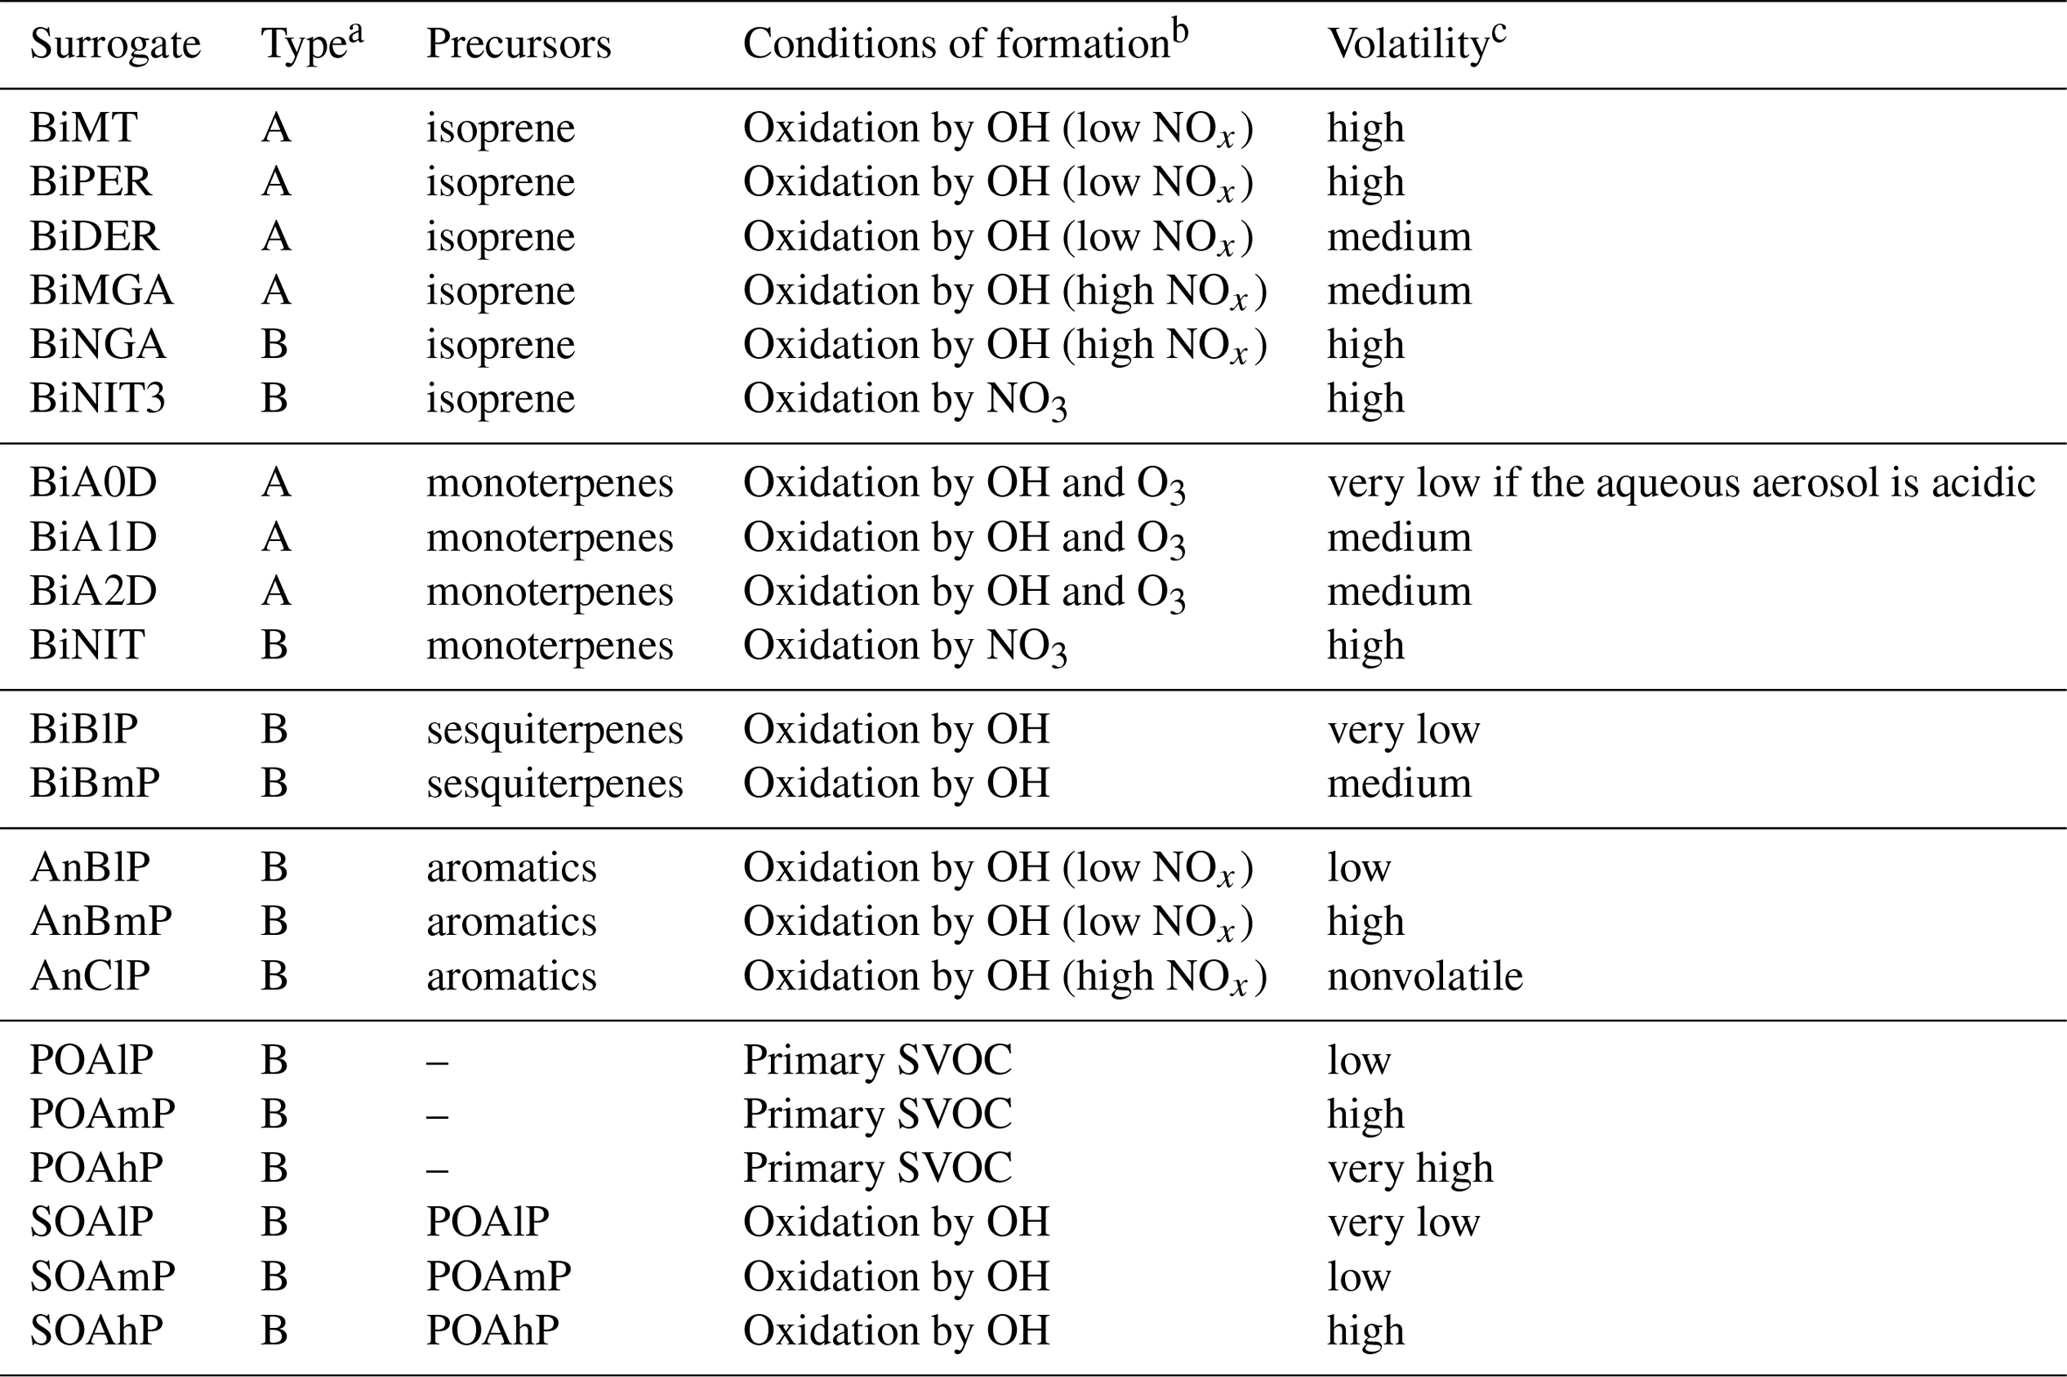
a Type A and B correspond to hydrophilic and hydrophobic compounds, respectively. b Hydroxyl radical (OH), nitrogen oxides (NOx), ozone (O3) and semi-volatile organic compounds (SVOCs). cVery low for compounds with Kp>100 m3 µg−1, low for compounds with 100 m3 µg m3 µg−1, medium for compounds with 1 m3 µg m3 µg−1, high for compounds with 0.1 m3 µg m3 µg−1 and very high for compounds with Kp≤0.01 m3 µg−1 .
In previous studies using Polyphemus (Couvidat et al., 2012, 2013; Sartelet et al., 2012; Zhu et al., 2016), the H2O model was used to partition organics between the gas and particle phases; instantaneous equilibrium was assumed between the gas and particle phases, and only short-range activity coefficients were taken into account. They were computed with UNIFAC (Fredenslund et al., 1975), i.e., without taking into account the impact of inorganic compounds, as if the aqueous phase is only constituted of water and organics. In other words, H2O only takes into account solvents in the computation of short-range interactions, and H2O implicitly assumed that organics have no interaction with inorganics.
However, AIOMFAC (Zuend et al., 2008) is a thermodynamic model designed for the calculation of activity coefficients of different chemical species in inorganic–organic mixtures. It takes into account the short-range, middle-range and long-range interactions between molecules and ions. For short-range interactions, AIOMFAC differs from UNIFAC because it takes inorganics into account in short-range interactions by taking relative van der Waals subgroup volume and surface area UNIFAC parameters. It assumes that interaction parameters of inorganics with organics for short-range interactions are zero; i.e., the short-range organic–inorganic interactions are ideal.
The SOAP model inherits all the characteristics of the H2O model, and new processes (such as modeling of inorganic–organic interactions via activity coefficients and dynamic evolution of gas–particle partitioning) are added (Couvidat and Sartelet, 2015). However, SOAP differs from H2O not only because of the possibility of modeling inorganic–organic interactions via activity coefficients and of dynamically modeling the gas–particle partitioning of viscous aerosols, but also differences occur in the gas–particle partitioning due to the computation of the absorbing mass.
In SOAP and H2O, ideality is defined by reference to the pure state for hydrophobic compounds (activity coefficients are equal to one when the compound is pure) and to the infinite dilution state for hydrophilic compounds (activity coefficients are equal to one when the compounds is diluted into an infinite amount of water). The partitioning is computed according to Raoult's law for hydrophobic compounds and to Henry's law for hydrophilic compounds.
The differences between SOAP and H2O are now detailed, and their impact on previously published simulations using the H2O is quantitatively assessed.
2.1 Gas–particle partitioning for the aqueous and organic phases
The equilibrium approach is used in the H2O model, and it can be used in the SOAP model. In this approach, the partitioning between the gas and particle organic phases is done following Pankow (1994):
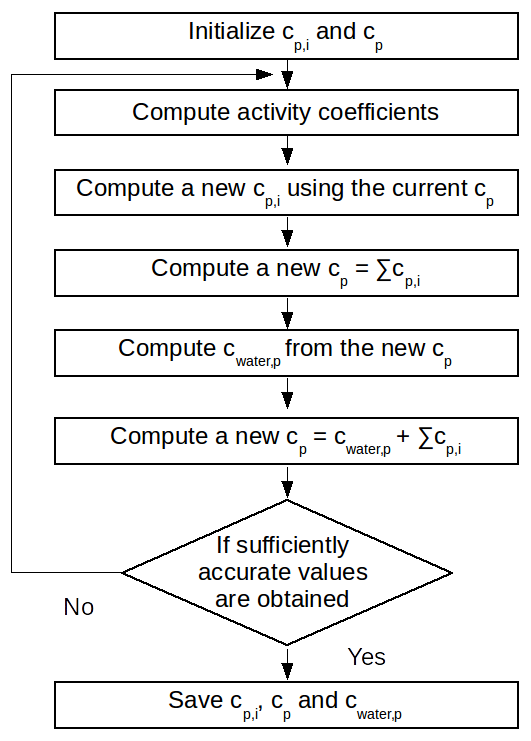
where Kp,i is the organic-phase gas–particle partitioning coefficient (m3 µg−1), cp,i is concentration of the compounds i in the organic phase (µg m−3), cg,i is the gas-phase concentration (µg m−3) and cp is the total concentration of the particles in the organic phase (µg m−3). Whereas in the H2O model cp is only the concentration of the organic compounds in the particles, in the SOAP model the absorption of water by the organic phase, cwater,p (µg m−3), is also included in cp. The absorption of water by the organic phase is computed using Eq. (2) following Couvidat and Sartelet (2015):
where Mwater is the molar mass of water (g mol−1), RH is the relative humidity, γwater,p is the activity coefficient of water in the organic phase and Mp is the averaged molar mass of the organic phase (g mol−1). Figure 1 shows the computation steps for the gas–particle partitioning and the water absorption.
The partitioning between the gas and the aqueous phases is done similarly as in the organic phase:
where caq,i is the aqueous-phase concentration of the compound i (µg m−3), Kaq,i is the aqueous-phase gas–particle partitioning coefficient (m3 µg−1) and caq is the total concentration of the particles in the aqueous phase (µg m−3). Kaq,i is computed as detailed in Couvidat and Sartelet (2015) and depends on the activity coefficient. In the H2O model, caq corresponds only to the liquid water content (LWC) calculated using a thermodynamic model, e.g., ISORROPIA (Nenes et al., 1999), for inorganic aerosols. However, caq includes inorganic aerosols, hydrophilic organic aerosols and absorbed water by hydrophilic organic aerosols in addition to LWC in the SOAP model. The larger concentrations of caq in the SOAP model than in the H2O model lead in return to larger compounds concentrations in the aqueous phase (caq,i).
2.2 Impact on SOA concentrations
Sensitivity simulations are performed to quantify the impact on organic concentrations of the differences between the H2O and SOAP models in the formulation of the absorbing mass used in the modeling (cp and caq: the total particle concentrations of the organic and aqueous phases respectively). Within the Polyphemus platform, the two SOA models are implemented with the SIREAM aerosol module (Debry et al., 2007). The simulations of Couvidat et al. (2012) are rerun using the SOAP model instead of H2O. The model configuration is detailed in Couvidat et al. (2012). The simulation domain covers Europe (see Fig. 2) with a horizontal resolution of and nine vertical levels (20, 80, 210, 550, 1150, 1950, 2950, 4750, 9000 m). The initial and boundary conditions are calculated using data from global models MOZART (gas) and ECHAM5-HAMMOZ (particles). Anthropogenic emissions are taken from the EMEP (European Monitoring and Evaluation Programme) inventory (http://www.ceip.at/, last access: 25 January 2019) and biogenic emissions are estimated with MEGAN (Model of Emissions of Gases and Aerosols from Nature) (Guenther et al., 2006).
Sensitivity simulations are conducted for June 2002 and detailed in Table 2. Domain-averaged concentrations of SOA are used to compare the sensitivity simulations in Fig. 3. In the SOAP-Reference simulation, caq is computed by considering the water absorbed by inorganic aerosols and by hydrophilic aerosols (inorganic aerosols and hydrophilic organic aerosols), while cp is computed by considering hydrophobic organic aerosols and the water absorbed by hydrophobic organic aerosols. Overall, the average difference in SOA concentrations between the SOAP-Reference and H2O-Reference simulations is 15 %. The differences between these two simulations are mostly due to the influence of the different compounds included in the absorbing mass used for the partitioning of the gas and particle phases, i.e., in the computation of cp and caq (the total particle concentrations of the organic and aqueous phases). Simulations using the same absorbing mass in SOAP and H2O (water absorbed by inorganic aerosols for caq and hydrophobic organic aerosol for cp) lead to similar concentrations (see the comparison of the simulations H2O-Ideal and SOAP-Ideal in Fig. 3). Adding water absorbed by organic aerosols in the absorbing mass leads to a slight increase in SOA concentration (comparisons of the simulations SOAP-no_inorg and SOAP-no_water). Adding inorganic aerosols in the absorbing mass of hydrophilic aerosols (caq) has a larger impact than the addition of water absorbed by organic aerosols (5 %, see the comparison of the simulations SOAP-Reference and SOA-no_inorg). Adding organic aerosols in the absorbing mass of caq has an impact as large as inorganic aerosols (6 %, see the comparison of the simulations SOAP-no_inorg and SOAP-basic).
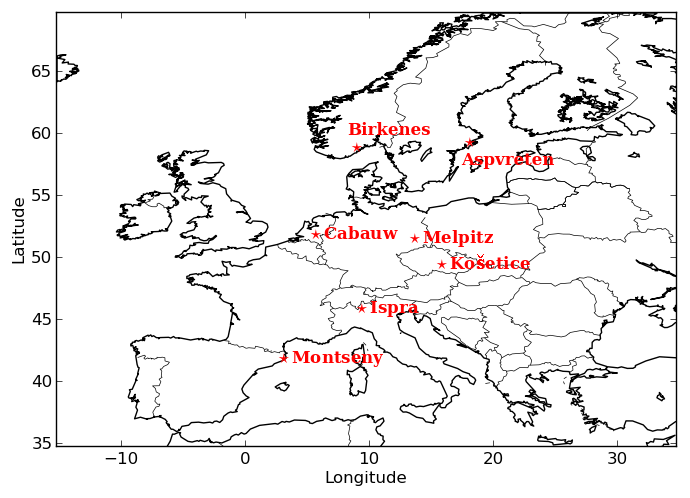
Table 2List of the sensitivity simulations to compare the H2O and SOAP models.
a Total particle concentration of the organic phase
(cp) and aqueous phase (caq). b Ideal
mixture, activity coefficient is set to 1.0. c Short-range
activity coefficients are calculated
taking into account
inorganic aerosols.
Not only does the absorbing mass strongly influence the SOA concentrations, but it also influences the interactions between compounds, as modeled by activity coefficients. The influence of taking into account organic–organic interactions by short-range activity coefficients is as high as 18 % (see the comparison between the simulations H2O-Reference and H2O-Ideal). The difference between the SOAP-Reference and SOAP-Ideal simulations is much larger (35 %) because of differences in the computation of the absorbing mass between SOAP and H2O.
An additional sensitivity simulation SOAP-sr is used to estimate UNIFAC sensitivities when inorganic aerosols are added in the computation of the short-range activity coefficient as in AIOMFAC. The averaged SOA concentrations in SOAP-sr increase by 15 % compared to those of SOAP-Reference. This difference is further discussed in Sect. 4.3. As inorganic–organic interaction parameters are set to zero in UNIFAC, taking into account inorganics in the computation of short-range activity coefficients (simulation SOAP-sr) leads to activity coefficients closer to the pure compound state and therefore to a decrease of the activity coefficients (as organics are generally more stable at pure state than in water). As activity coefficients are lower in SOAP-sr than in SOAP-Reference, organic concentrations are higher.
The differences between the simulations SOAP-basic and SOAP-Ideal are larger during nighttime than those during daytime. This shows that the effect of ideality is larger during nighttime than daytime. This is due to the lower temperature, leading to the condensation of a larger number of organic compounds (some compounds are too volatile to condense during daytime but condense during nighttime).

Figure 3Temporal variation of the average SOA concentrations over the domain (see Table 2 for the description of simulations).
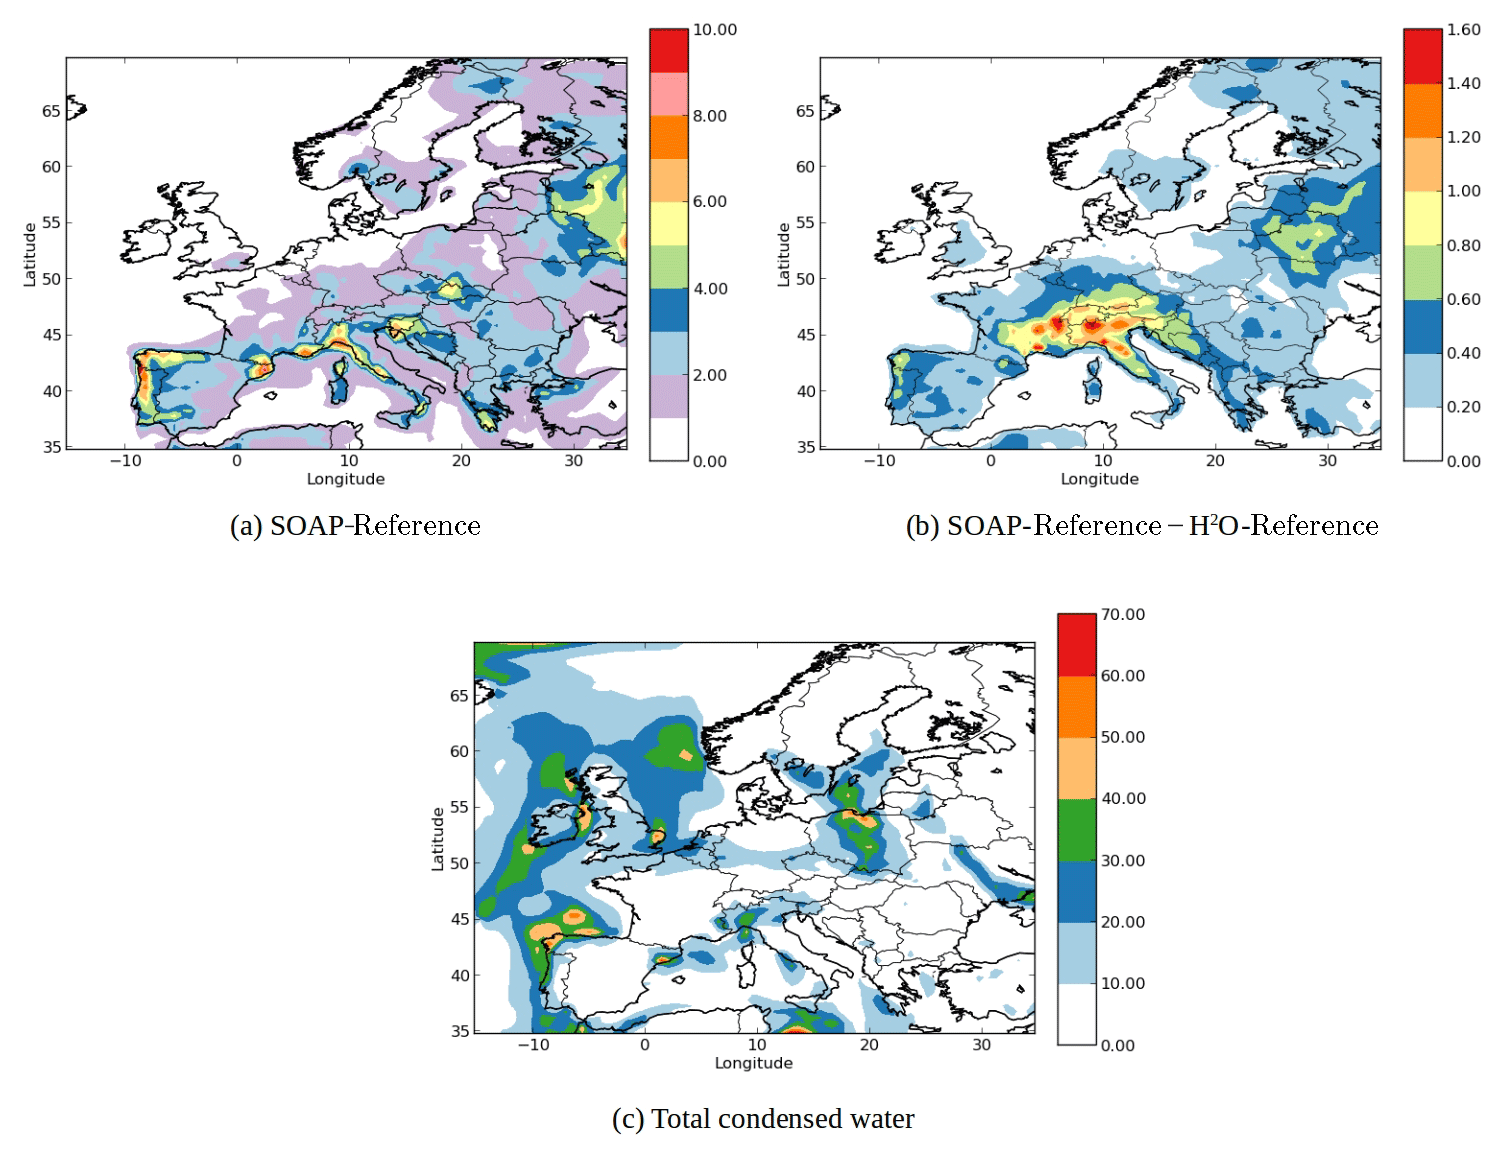
Figure 4(a) SOA concentrations in the SOAP-Reference simulation (µg m−3), (b) the differences of the SOA concentrations between the SOAP-Reference and H2O-Reference simulations (µg m−3) and (c) concentration of total condensed water in the SOAP-Reference simulation (µg m−3).
Figure 4a shows the horizontal distribution of SOA concentrations obtained by the SOAP-Reference simulation, and Fig. 4b shows the differences between the SOAP-Reference and H2O-Reference simulations. As expected, the SOA concentrations are higher in the SOAP-Reference simulation than in the H2O-Reference simulation. Depending on the location, the differences in the SOA concentrations between the simulations are due to different compounds used to compute the partitioning between the gas and particle phases. Over northeastern Europe, the differences are due to the large hydrophilic biogenic organic aerosol concentrations. Taking them into account in the computation of caq strongly increases the concentrations of monoterpene SOA over southwestern Europe (especially in northern Italy, where simulated concentrations of nitrate are high). Over northern Italy, large differences are also observed for anthropogenic aromatic organic aerosol concentrations. Even though these compounds are hydrophobic, taking into account the water they absorbed when computing cp leads to an increase in their concentrations. Similarly, near North Africa and the Iberian Peninsula, the concentrations of hydrophilic surrogates from isoprene oxidation are higher with SOAP than with H2O because of the large concentrations of sulfate from shipping emissions. Taking sulfate into account (but without taking into account its influence on activity coefficients) when computing the partitioning between the gas and particle phases leads to an increase in the concentrations of hydrophilic organic compounds in the particle phase.
The coupling of inorganic and organic aerosol formation influences the water absorption by particles. This coupling consists of two effects: the influence of organic species on the inorganic aerosol formation and the influence of inorganic species on the organic aerosol formation. The latter is implemented in the SOAP model, but the influence of organic species on the inorganic aerosol formation is not included. According to Choi and Chan (2002), the organic species can either reduce or enhance the water absorption of inorganic species, which in turn can lead to a change in the condensation of organic species.
Figure 4c shows the concentration of total condensed water in the SOAP-Reference simulation. The coupling of inorganic and organic aerosol formation may lead to changes in the aerosol concentrations in the regions where both the concentrations of total condensed water and hydrophilic organic species are large, e.g., Barcelona, Milan and eastern Spain.
3.1 Interaction of inorganic–organic aerosols using the AIOMFAC model
Although activity coefficients are computed with the UNIFAC model for H2O, depending on the user's choice, in the SOAP model, activity coefficients can be calculated using the UNIFAC or the AIOMFAC model. UNIFAC was developed to reproduce the short-range interactions between water and organic compounds, which are dominant for a nonelectrolyte liquid mixture. In UNIFAC, organic compounds are represented by different functional groups including alkane, aromatic carbon, alcohol and carbonyl. Interaction coefficients between water and these functional groups are calculated. However, for an electrolyte liquid mixture, the mixed organic and inorganic system may influence activity coefficients by middle-range and long-range interactions in addition to the short-range interaction. This influence of inorganic aerosols on the calculation of activity coefficients in the SOAP model can be estimated by the AIOMFAC model that considers this mixed organic–inorganic system.
The activity coefficient in the AIOMFAC model is calculated by the following equation:
where , and are the contributions of long-range interactions (electrostatic force between ions), middle-range interactions (interactions between ions and molecular dipoles) and short-range interactions (group-contribution method as in UNIFAC).
3.2 Equilibrium and dynamic approaches
Typically, 3-D air quality models mostly use an equilibrium approach to represent condensation and evaporation of aerosols. However, using a dynamic approach may be necessary if the kinetic effects are large (for example if the diffusion in the organic phase is low due to the high particle viscosity or if condensation over coarse particles occurs). In the SOAP model, depending on the user's choice, either the equilibrium approach or the dynamic approach can be used to model condensation and evaporation. An explicit representation of diffusion inside particles, which would involve discretizing the particle along the radius of the particle, cannot be used in 3-D air quality models due to the heavy computation time of such a method. To solve this issue, a method was developed by Couvidat and Sartelet (2015) to implicitly represent the condensation, evaporation and diffusion of organic compounds for a specified organic-phase diffusion coefficient. This method separates the particle into a low number of layers that represent different areas of the particle (the gas–particle interface, the core of the particle and intermediate layers).
To use the dynamic approach in this study, several simplifications are carried out for hydrophilic compounds. As a dynamic approach is not used to simulate the formation of inorganic aerosols, the thermodynamic model ISORROPIA (Nenes et al., 1998) with the equilibrium approach is used to estimate the partitioning of inorganics, the aerosol liquid water content and the pH. The pH given by ISORROPIA is used for each size section, and the liquid water content is redistributed over sections proportionally to the amount of inorganics.
In the dynamic approach, the mass transfer rate, J (µg m−3 s−1) by condensation and evaporation at the gas–particle interface is calculated as follows:
where kabsorption is the kinetic rate of absorption (s−1), cg is the gas-phase concentration (µg m−3) and ceq is the gas-phase concentration at the interface of particles (µg m−3).
The ceq value is calculated taking into account a deviation from an equilibrium concentration. This deviation is presented in Couvidat and Sartelet (2015) (Eqs. 52 to 55).
The kinetic rate of absorption kabsorption is defined as follows (Seinfeld and Pandis, 1998):
where dp is the particle mean diameter (m), Dair is the diffusivity of the condensing compounds in air (m2 s−1) and N is the number concentration of particles (n m−3). The function f(Kn,α) depends on the Knudsen number (), which is calculated using the mean free path in air λ (m), and the accommodation coefficient α, which accounts for imperfect surface accommodation. It is taken equal to 0.5 following Saleh et al. (2013) and Krechmer et al. (2017).
For viscous particles, the condensation and evaporation is limited by the diffusion flux in the internal layers of the particles.
We assume that in each particle layer the evolution of concentration of species i can be described as a deviation of an equilibrium concentration () when the condensation and evaporation of the species is limited by the diffusion of organic compounds in the organic phase.
This deviation can be described by taking into account the flux of diffusion with the mass transfer rate by condensation and evaporation for each particle layer (Eq. 36 of Couvidat and Sartelet, 2015).
The kinetic rate of diffusion (s−1) is computed as follows (Couvidat and Sartelet, 2015):
The τdiff value is the characteristic time (s) for diffusion in the particle:
where Rp is the radius of the particle (m) and Dorg is the organic-phase diffusivity (m2 s−1).
The sum of the diffusion fluxes over all aerosol layers is obtained as follows:
The final mass flux by the mixed phenomenon condensation, evaporation and diffusion for the particle is computed by assuming that the characteristic time of the combined effect of condensation, evaporation and diffusion is equal to the sum of the characteristic time of condensation and evaporation (Jcond∕evap) and the sum of the diffusion fluxes over all aerosol layers (Jdiff) as follows:
More details on the model are obtained in Couvidat and Sartelet (2015).
3.3 Particle-phase diffusion cases and impact of viscosity on SOA formation
To assess the maximum impact of viscosity on SOA formation, two theoretical studies are studied. The first case, referred hereafter as the “Dynamic inviscid” simulation, assumes that particles are inviscid; i.e., SOA formation is not limited by the particle-phase diffusion, and the particle-phase diffusion is so fast that there is no difference in concentrations inside the particle. In this case, compounds condense or evaporate until reaching equilibrium over the whole particle.
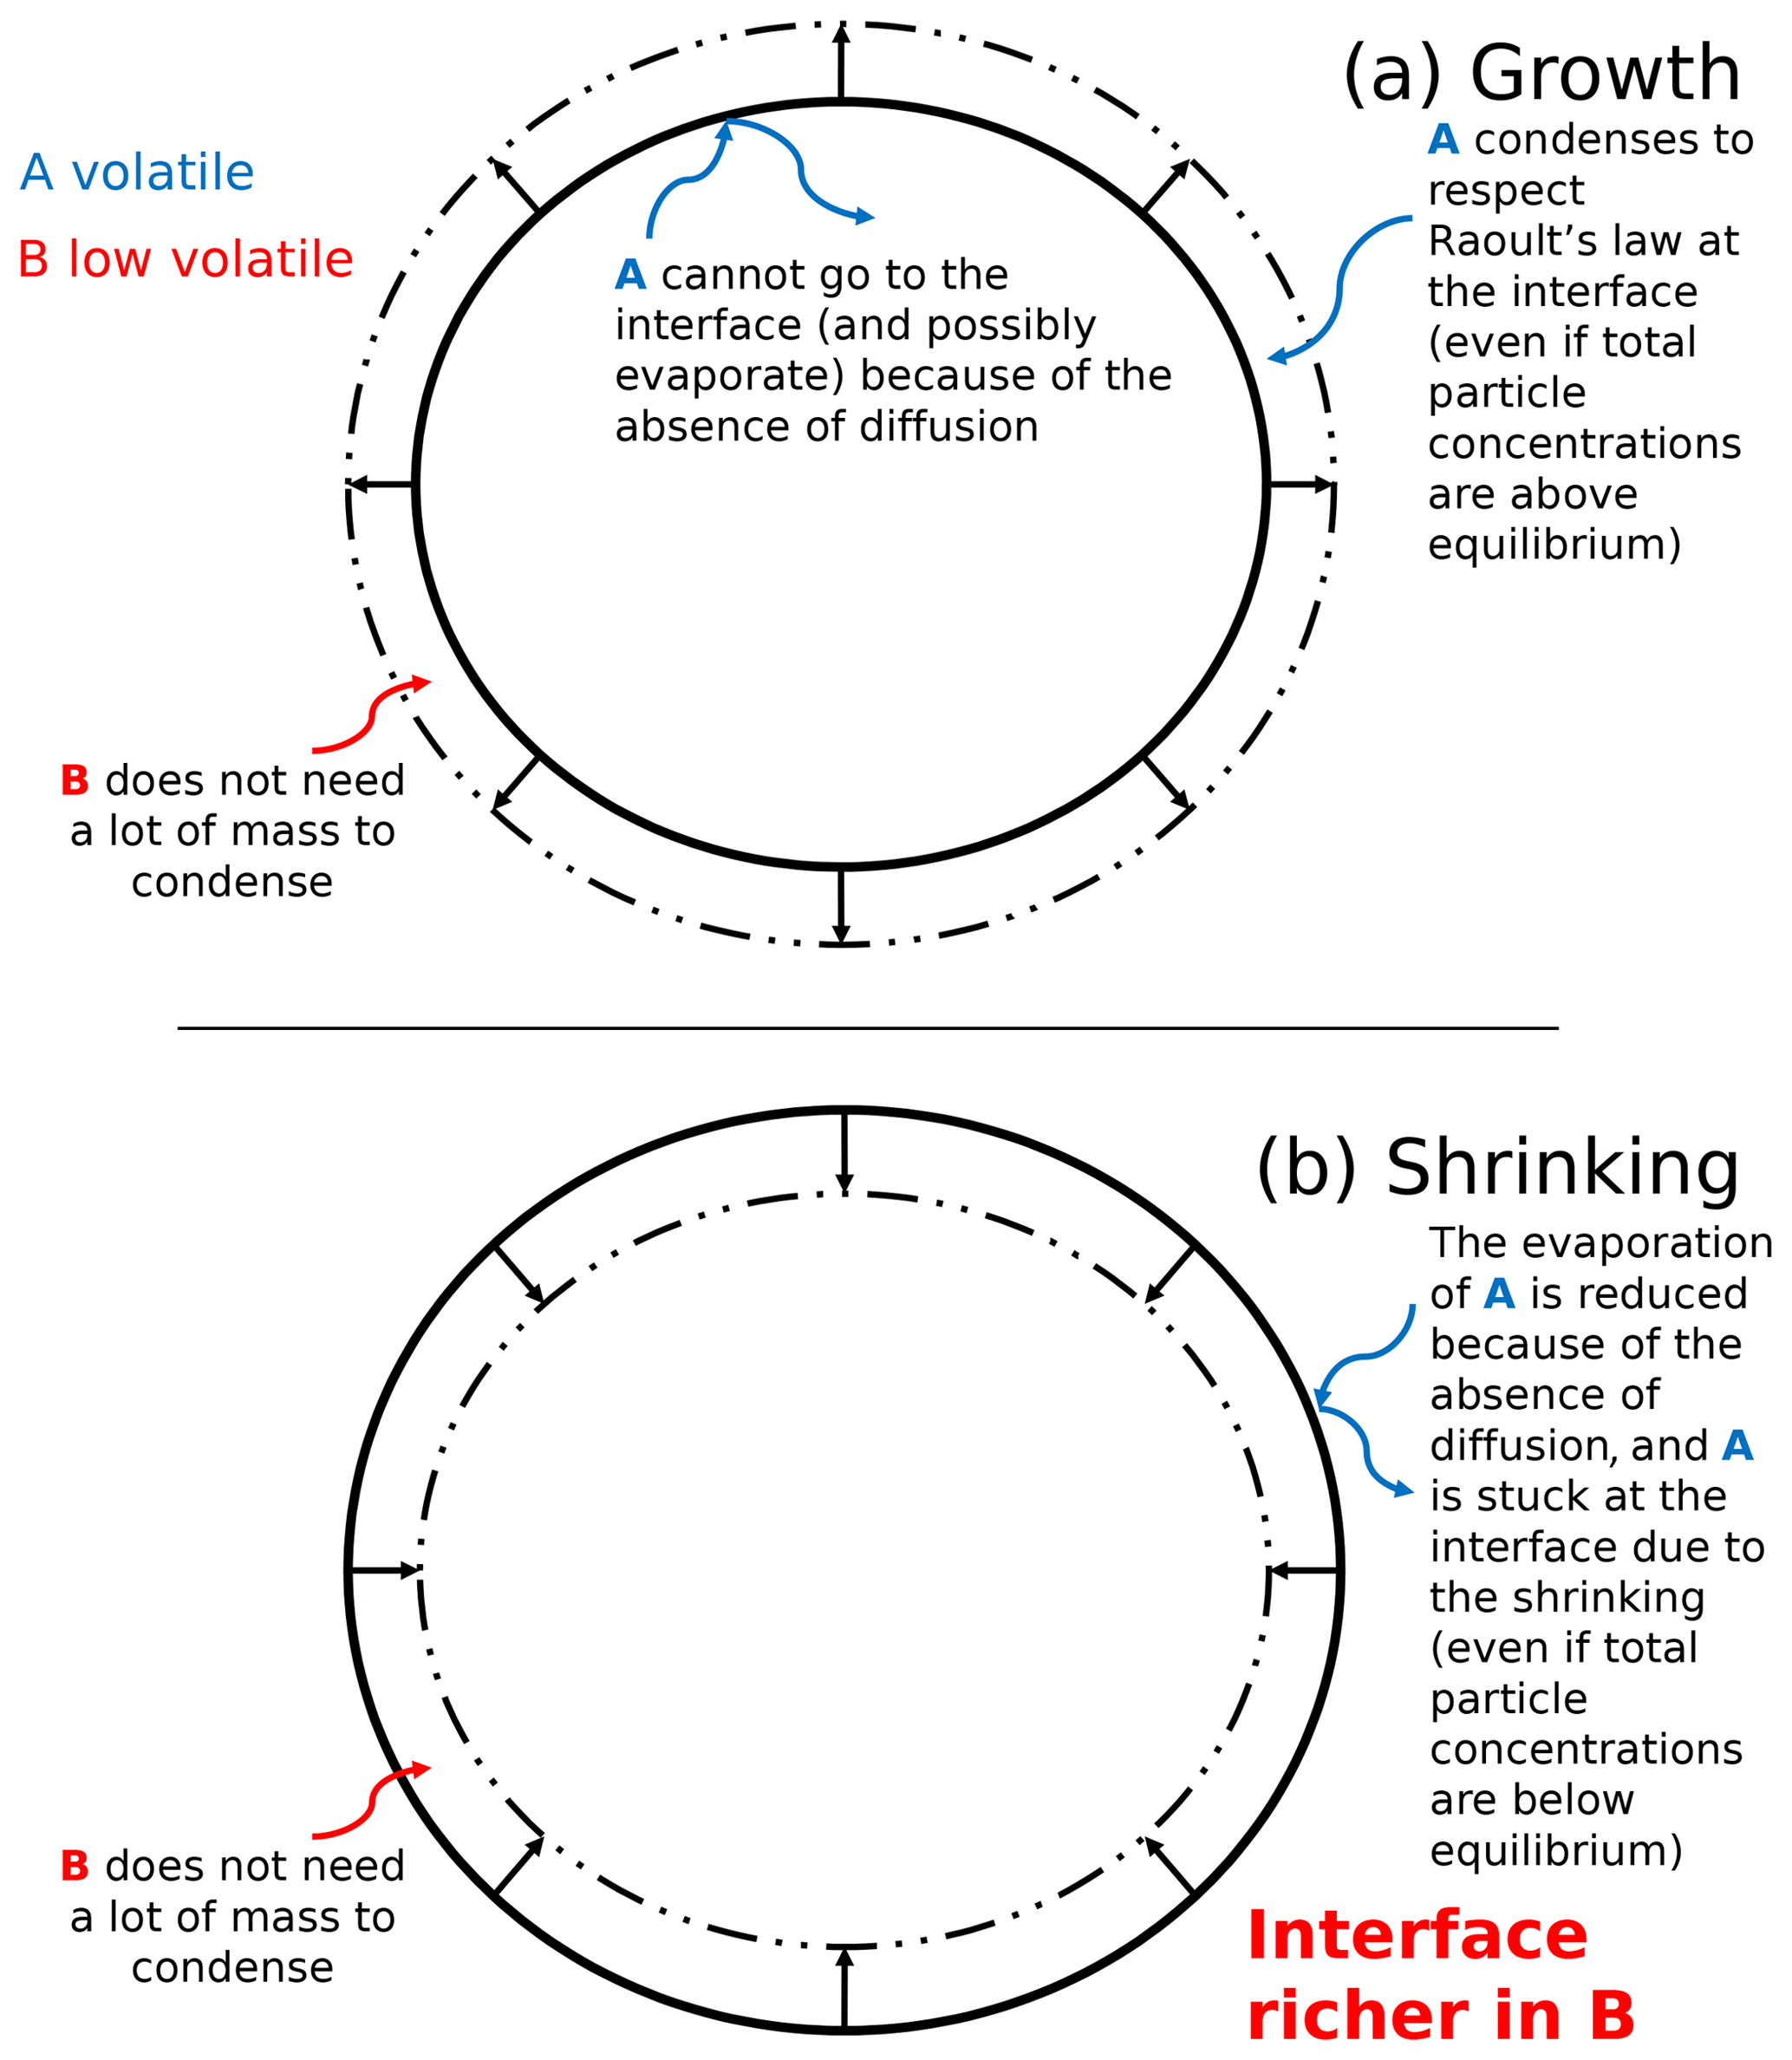
Figure 5Schematic representation of SOA formation for a growing (a) and shrinking (b) highly viscous aerosol. The blue curved arrows describe the behavior of an organic compound A (blue), and the red curved arrows describe the behavior of a low-volatility organic compound B (red).
The other case, referred as the “Dynamic viscous” simulation, assumes that the particle is “infinitely viscous” (i.e., too viscous for diffusion to occur inside the particle even at high relative humidity). A very low diffusivity of 10−30 m2 s−1 is assumed in order to investigate the maximum deviation of SOA concentrations from the inviscid condition. The diffusivity of organic species is modeled using a bulk viscosity of the mixture estimated by the Refutas method (Maples, 2000). According to measurement studies, the diffusivity of organic species in SOA can be lower than 10−21 m2 s−1 (e.g., Pfrang et al., 2011; Abramson et al., 2013). Song et al. (2016b) and DeRieux et al. (2018) showed that scaled values from measured viscosities and predicted values can pass through a viscosity of 1012 Pa s, which is on the order of a diffusivity of 10−30 m2 s−1, at low relative humidity. In addition, Couvidat and Sartelet (2015) reported that at a diffusivity of 10−24 m2 s−1, diffusivity does not influence the mass of the condensed organic species as the diffusion is too low to significantly affect the formation of organic aerosol that still occur by condensation and evaporation of organic compounds at the interface. Therefore a diffusivity lower than 10−24 m2 s−1 may not affect the concentrations of organic aerosols compared to simulation results with a diffusivity of 10−24 m2 s−1.
Practically, for simplification purposes, two aerosol layers (the interface and an internal layer) are used in the “Dynamic viscous” simulation. The internal layer and the interface represent 99 % and 1 % of the aerosol mass, respectively, following the method of Couvidat and Sartelet (2015), in which condensation at interface is not limited by particle-phase diffusion.
The SOA formation for a highly viscous particle is complex. The evolution of the concentration of an organic compound depends on the volatility of the compound with respect to the other compounds. The SOA formation for a highly viscous particle is schematized in Fig. 5 in the case of the growth and the shrinking of an extremely viscous particle.
Figure 5 theoretically presents different behaviors of volatile and low-volatility organic species in a highly viscous aerosol. For these theoretical cases, mass transfer between the interface and the core is neglected because of an extremely low diffusion flux. The condensation of low-volatility compounds influences the behavior of higher volatility compounds.
In the case of an organic particle growth (mass increase), the condensation of a low-volatility organic compound B (its behavior is described by the red curved arrows in Fig. 5) onto a particle can favor the condensation of a compound A of higher volatility (its behavior is described by blue curved arrows in Fig. 5) at the interface of the particle (even if the total concentration of A inside the particle exceeds equilibrium). Compound A condenses onto the new layer created by compound B to respect Raoult's law at the interface. Even though compound A would evaporate if the particle was inviscid and the concentration of A exceeds equilibrium, for the extremely viscous case, the condensation of compound B at the interface can prevent the evaporation of compound A stuck in the core of the particle (because of the absence of diffusion) and can lead to its “entrapment”.
In the case of a shrinking particle (mass decrease), a volatile compound A would evaporate from the inner layers to meet the equilibrium condition if the particle is inviscid and concentration of A in the particle exceeds equilibrium. However, if the particle is viscous, this evaporation can be strongly slowed down because there is no diffusion of compound A from the core to the interface.
Even though the total particle mass reduces, a low-volatility compound B may condense at the interface and may therefore slow down the shrinking of the particle. This condensation at the interface prevents the evaporation of compound A from the core of the particle.
In SOAP, a redistribution is done every time step to keep the interface thin and the mass fraction of layers constant (to prevent numerical issues, only the mass of the interface would change for a very viscous particle). This redistribution represents the fact that if the particle grows the compounds that have previously condensed are not at the interface anymore (because other compounds have condensed onto the particle) or that if the particle shrinks the compounds that were previously at the core of the particle will eventually be at the interface. Using two layers, compounds are immediately transferred between the core and the interface. A more accurate representation of the particle dynamics would be obtained using more inner layers to better represent the position of the compounds inside the particle. Nonetheless, the simulation using two layers should give a good estimation on the effect of viscosity on SOA formation.
These SOA formations for a highly viscous particle are discussed more in Sect. 4.5.
4.1 Simulation setup
The Polair3D model coupled to the SOAP model is evaluated during summer 2012. The modeling domain covers Europe with a horizontal resolution of (see Fig. 2). Anthropogenic emissions are generated with the EMEP inventory for 2012. Intermediate and semi-volatile organic compound (IVOC and SVOC) emissions are estimated as detailed in Couvidat et al. (2012) by multiplying the primary organic aerosol emissions by a factor of 4 and by assigning them to compounds of different volatilities (POAlP, POAmP and POAhP). Biogenic emissions are generated with the MEGAN model (Guenther et al., 2006). ECMWF (European Centre for Medium-Range Weather Forecasts) meteorological reanalysis data (http://www.ecmwf.int/, last access: 25 January 2019, ERA-Interim) are used to calculate meteorological fields. Initial and boundary conditions are obtained from the simulation data of MOZART-4 and GEOS-5 (http://www.acom.ucar.edu/wrf-chem/mozart.shtml, last access: 25 January 2019). The aerosols are assumed to be internally mixed in this model. The number of aerosol bins is 5 covering from 0.01 to 10 µm. An adaptive time step is used to solve the dynamics of organics. The minimum time step is 1 s and the maximum time step is set to 10 min in the simulations of this study. The 10 min duration corresponds to the time step used to split the different processes in the 3-D model (advection, diffusion and chemistry). When concentrations are computed by the dynamic approach, the second-order Rosenbrock scheme is used for time integration (Couvidat and Sartelet, 2015). Further details about the model configuration may be found in Couvidat et al. (2012).
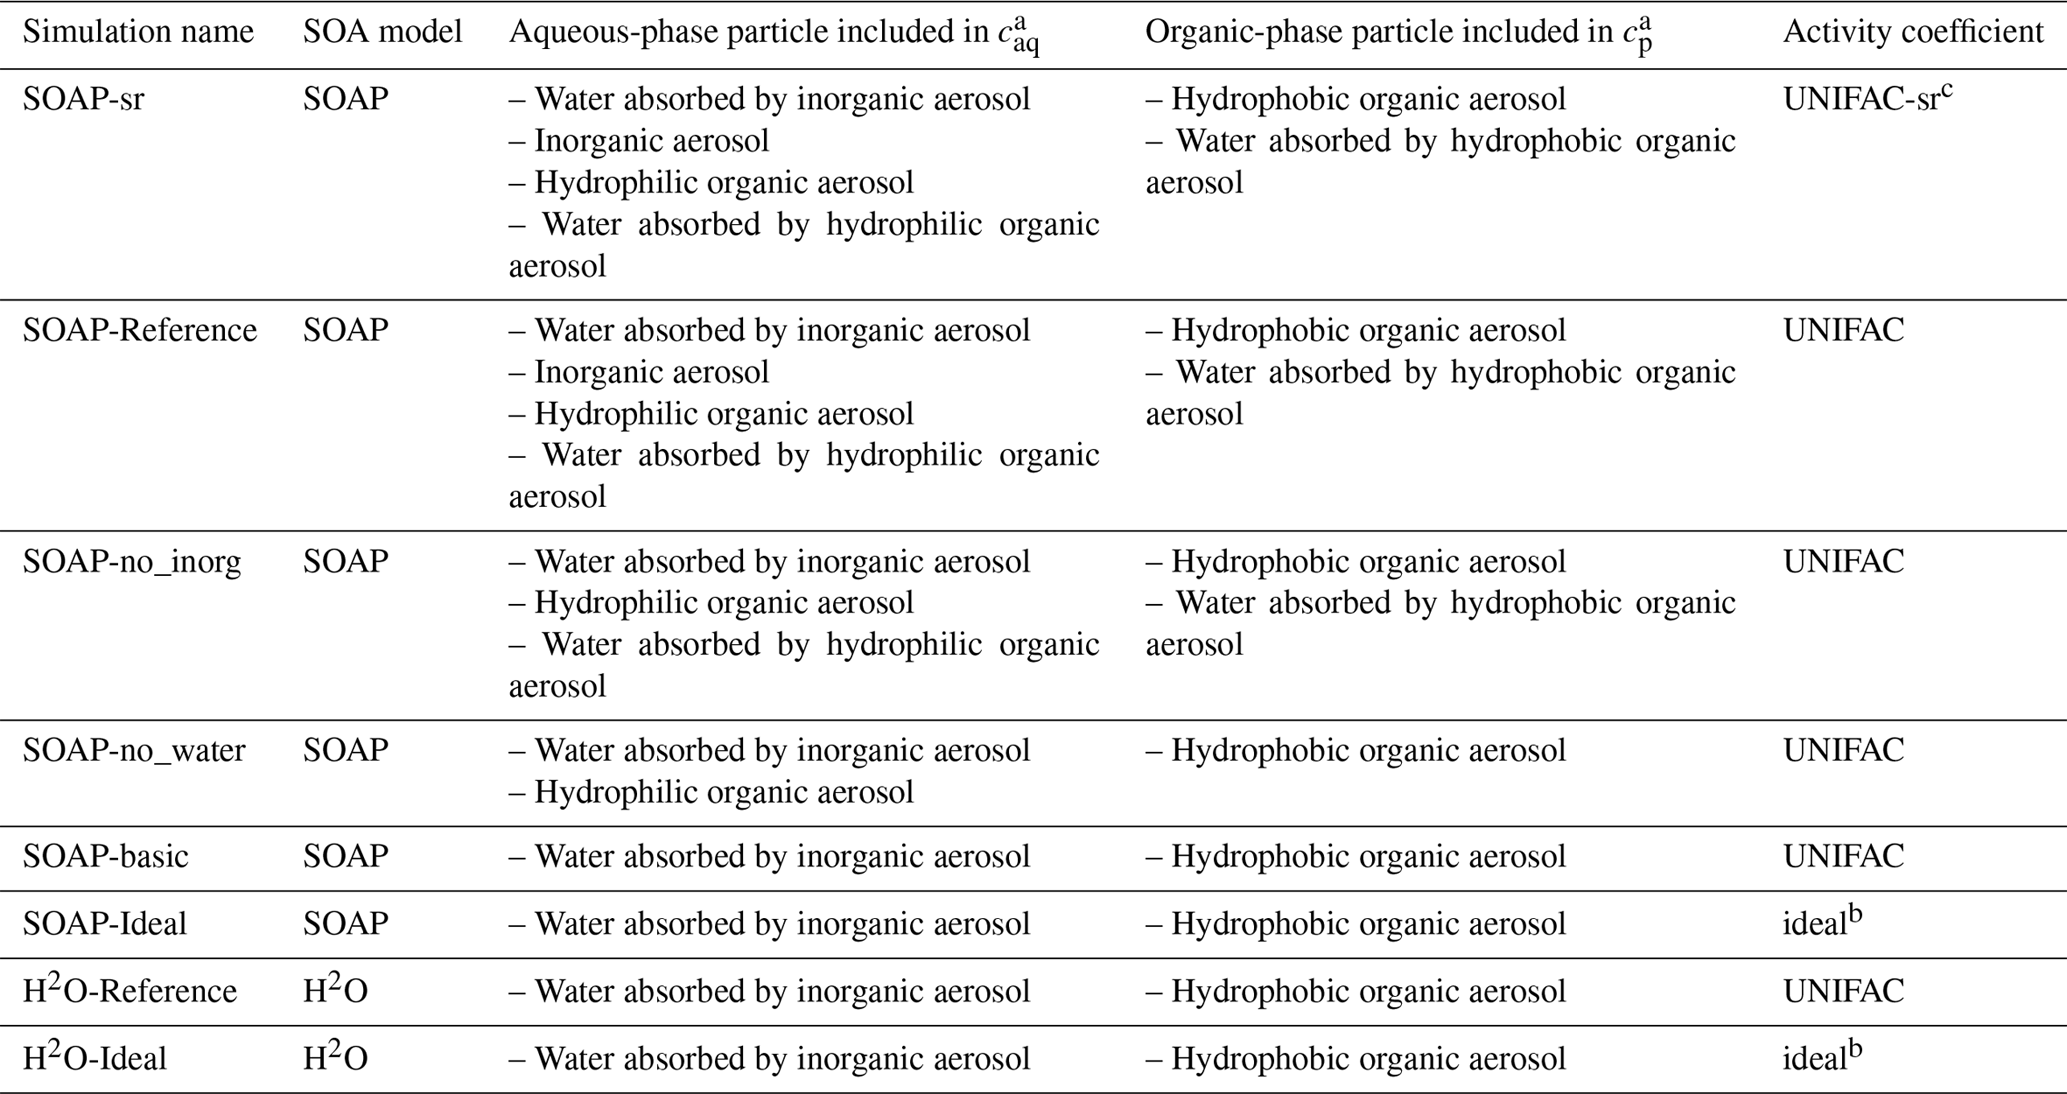
Table 3List of the sensitivity simulations using different options in SOAP.
* activity coefficients are calculated taking into account inorganic aerosols.
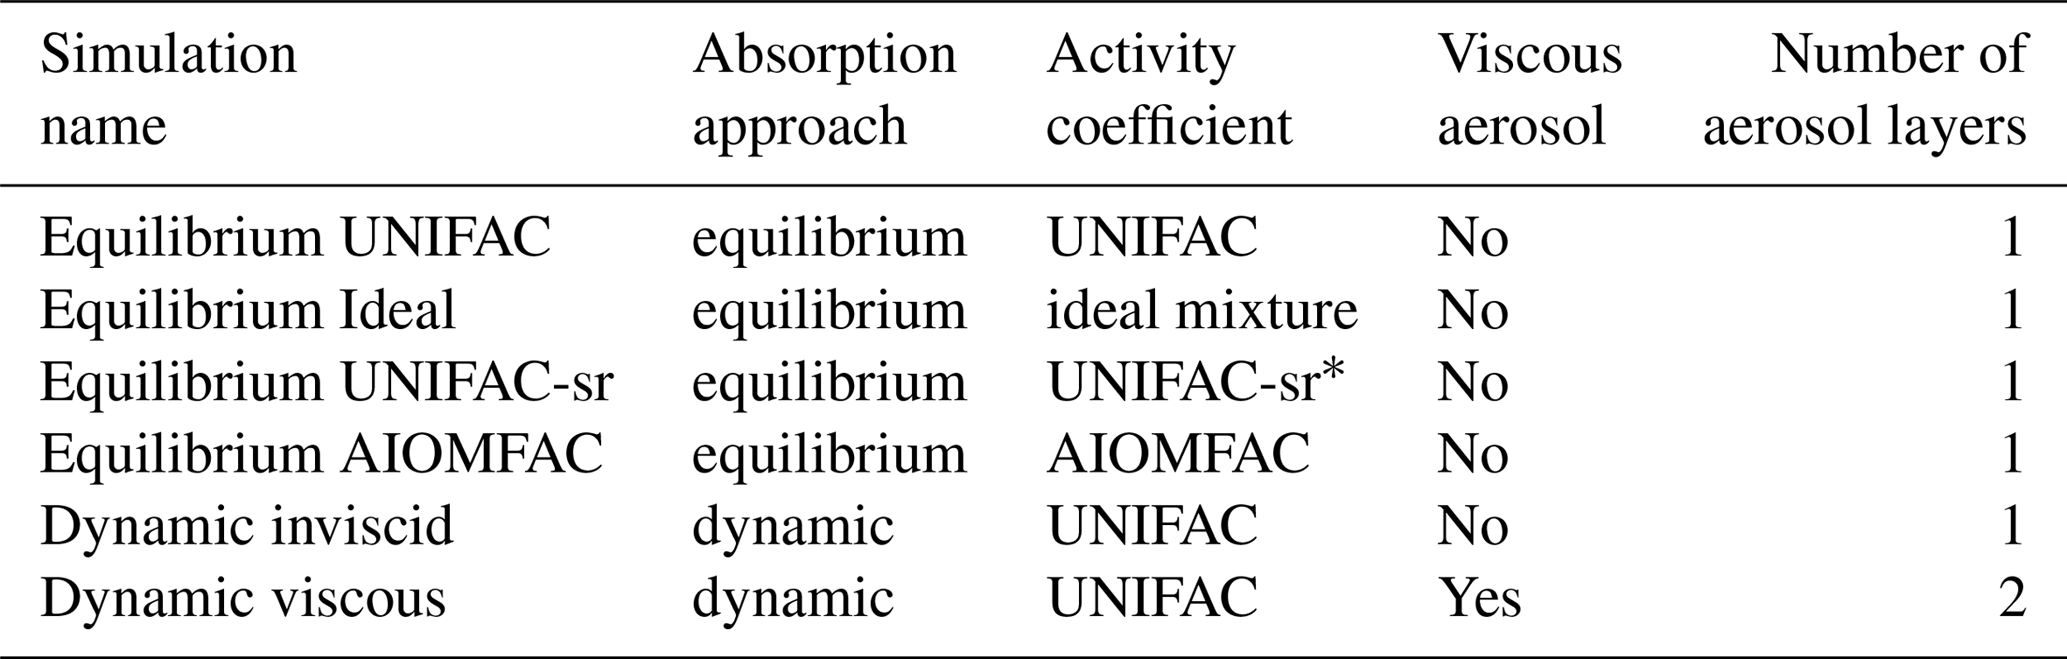
Six sensitivity simulations are conducted over Europe to study the effect of non-ideality and nonequilibrium phenomena on SOA formation. The list of the simulations is presented in Table 3. The reference simulation (named “Equilibrium UNIFAC”) uses the default model options; thermodynamic equilibrium between the gas and particle phases is assumed, and activity coefficients are computed with UNIFAC. To evaluate the impact of activity coefficients on concentrations, a simulation (named “Equilibrium Ideal”) is run. The impact of inorganic aerosols on the short-range activity coefficients using UNIFAC is estimated with a simulation (named “Equilibrium UNIFAC-sr”). To evaluate the impact of inorganic concentrations on activity coefficients, a simulation (named “Equilibrium AIOMFAC”) using AIOMFAC to compute activity coefficients instead of UNIFAC is run.
To evaluate the impact of the particle viscosity on SOA concentrations, two other simulations are run: one with a dynamic approach to model condensation and evaporation of inviscid particles (simulation named “Dynamic inviscid”) and one with a dynamic approach but extremely viscous particles (simulation named “Dynamic viscous”). The simulations that use the equilibrium approach for condensation and evaporation are run from 1 June to 31 August 2012. However, the sensitivity simulations using the dynamic approach are run for only 3 weeks starting 1 June 2012 because of expensive computational time.
The used absorption approaches for the simulations are presented in Table 3. The absorbing mass includes inorganic aerosol, hydrophilic organic aerosol and water absorbed by inorganic aerosol and hydrophilic organic aerosol for caq. The cp value includes hydrophobic organic aerosol and water absorbed by hydrophobic organic aerosol as listed in Table 2.
The algorithm of SOAP was developed in order to consider both the organic and the aqueous phases inside a particle. It assumes that the organic and the aqueous phases coexist in a particle but evolve separately in different regions of the particle. For example, for the dynamic representation, if a compound tends to go from the aqueous to the organic phases, it has to first evaporate to the gas phase and then condense to the organic phases instead of a direct mass transfer between the phases. It is due to the complexity of properly representing these transfers. This assumption is discussed in more details in Sect. 2.3 of Couvidat and Sartelet (2015).
4.2 Model evaluation
To evaluate the general performances of the model, the concentrations of organic aerosols given by the Equilibrium UNIFAC simulation are compared to the concentrations of organic matter (OM), organic carbon (OC) and inorganic aerosols measured at stations of the ACTRIS observation network (http://actris.nilu.no, last access: 25 January 2019) in Europe. OC concentrations are measured by high and low volume samplers, and those of OM and inorganic aerosols are measured by aerosol mass spectrometers. The locations of stations are presented in Fig. 2. To compare the simulated OM concentrations with the measured OC, the simulated OM concentrations are converted into OC concentrations using the OM / OC ratio for each surrogate of the organic aerosols, as described in Couvidat et al. (2012).
Table 4Comparison of the simulated concentrations to the measurements. Performance statistics are calculated with daily mean concentrations.
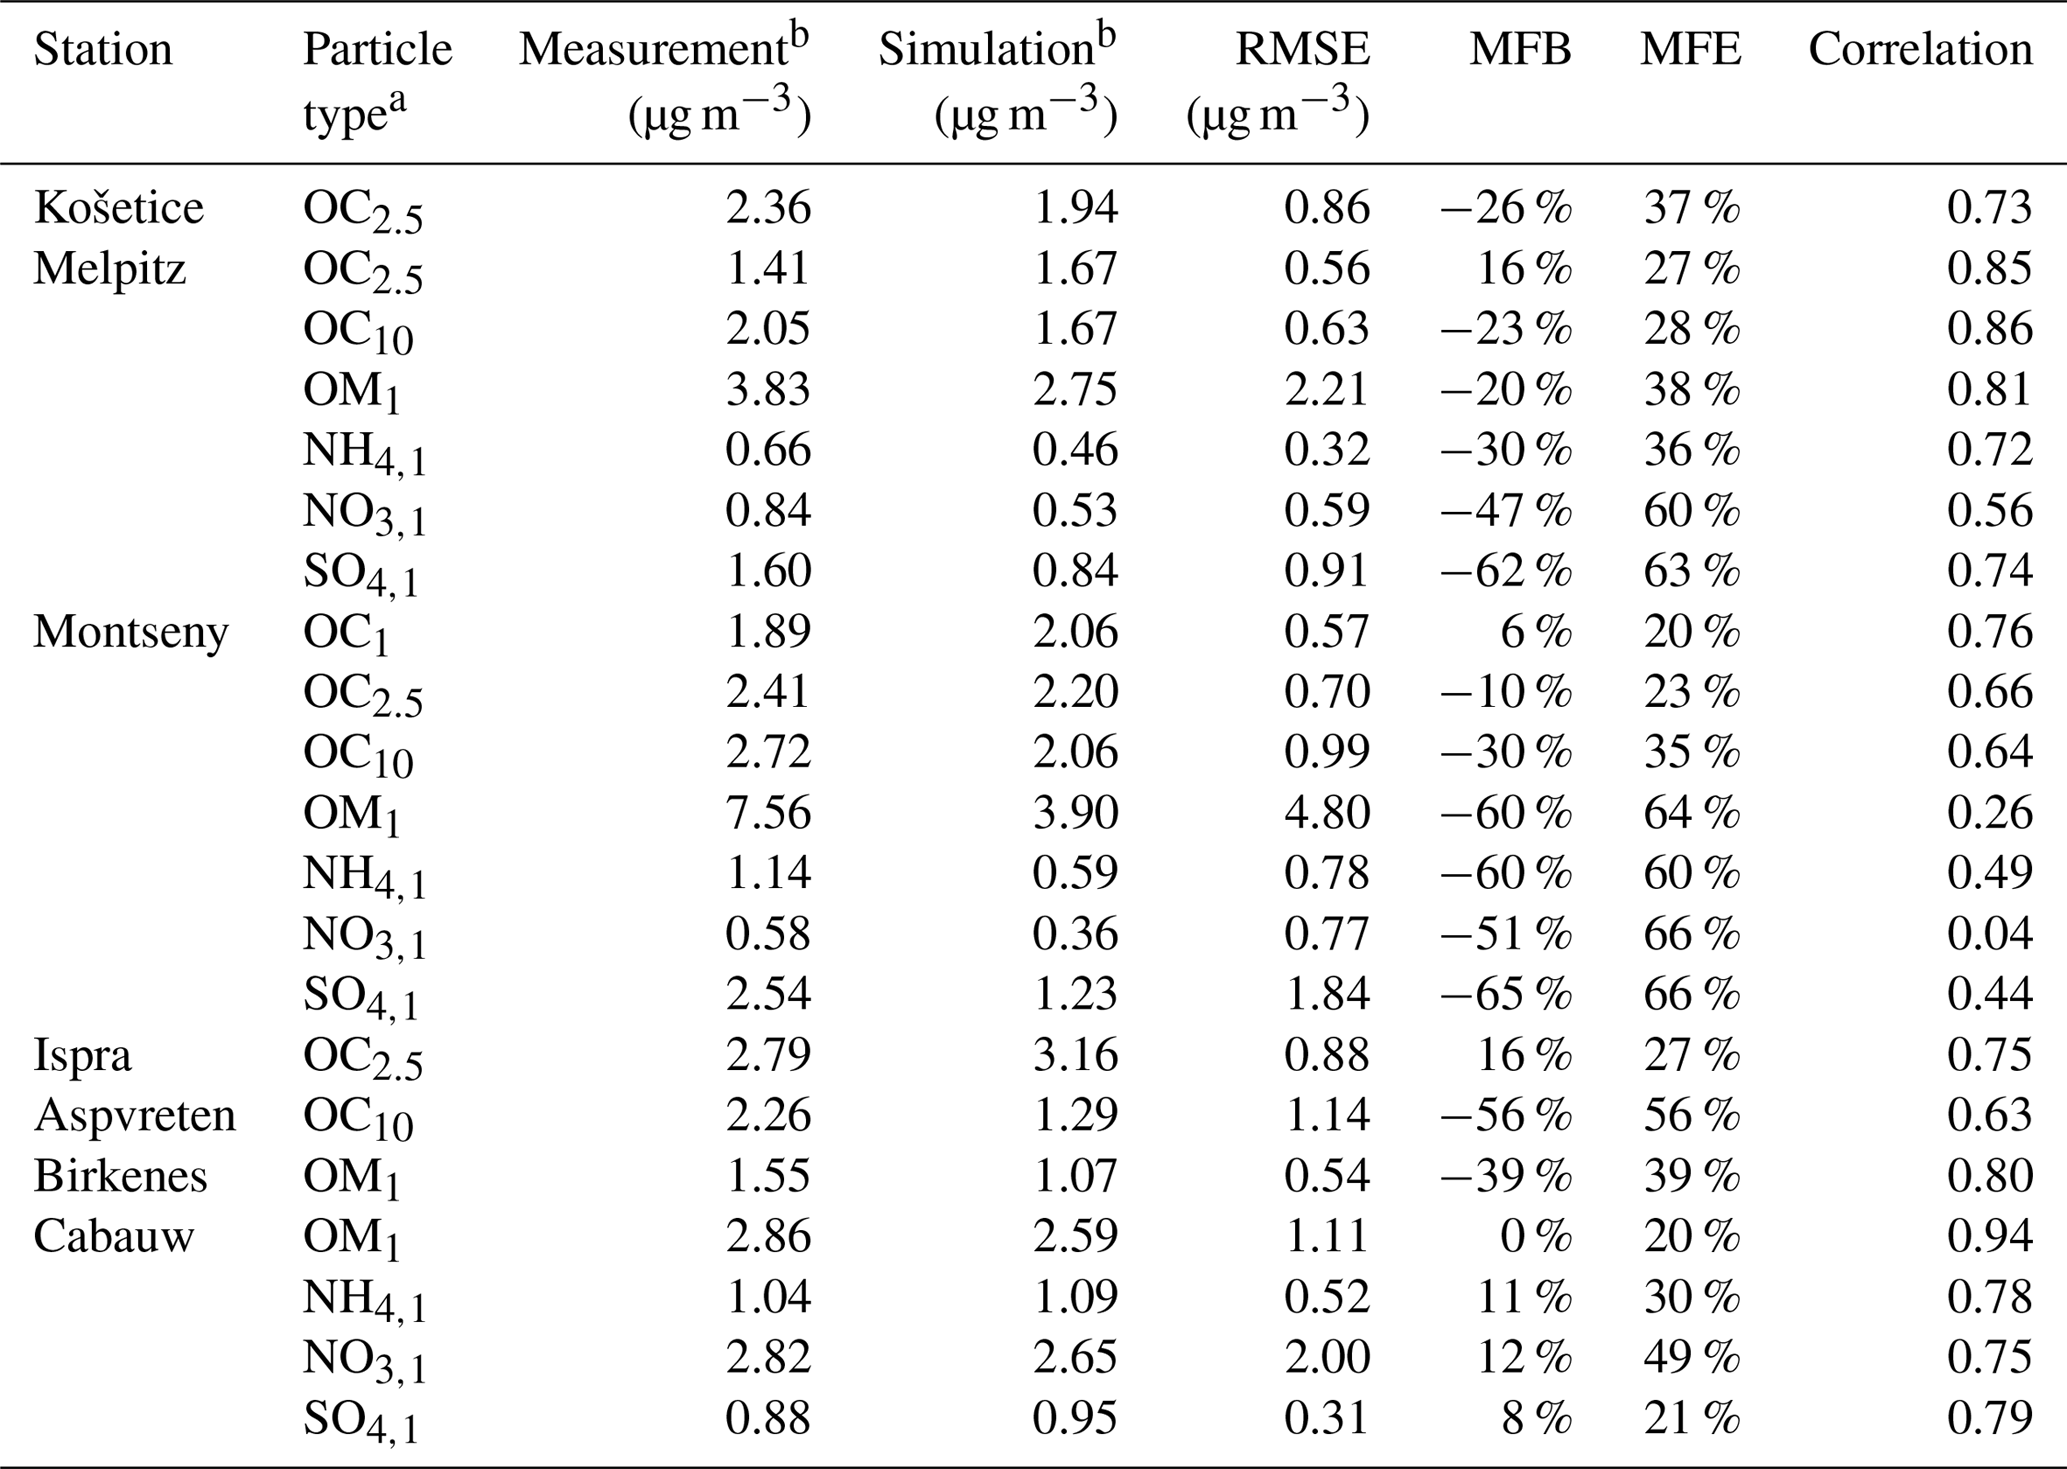
a Subscripts are used for the particle size. For example, OC2.5 is organic carbon of aerodynamic diameter lower than 2.5 µm. For ammonium (NH4), sulfate (SO4) and nitrate (NO3), e.g., SO4,1 is sulfate of aerodynamic diameter lower than 1 µm. b Mean concentration from 1 June to 31 August 2012.
To evaluate the model ability to reproduce SOA concentrations, the standard metrics of the model performance for particulate matter of Boylan and Russell (2006) are used: the mean fractional bias (MFB), the mean fractional error (MFE), the root mean square error (RMSE) and the correlation. Boylan and Russell (2006) proposed a performance evaluation criteria ( % and MFE<75 %) and a goal evaluation criteria ( % and MFE<50 %). Model performance statistics are presented in Table 4. For organic compounds, the model performance and goal criteria are satisfied for the stations Košetice, Melpitz, Ispra, and Cabauw ( % and MFE<50 %, see Fig. 6). For the Birkenes station, the performance criteria are satisfied, but the goal criteria are almost satisfied, although the concentrations of OM1 are quite underestimated (MFB: −33 %). For the Aspvreten station, the model performance criteria are satisfied, but the OC10 concentrations are significantly underestimated (MFB: −56 %). For the Montseny stations, the goal criteria are satisfied for OC, and the performance criteria are satisfied for OM1 with a significant underestimation.
For inorganic PM1 aerosols, the performance biases and errors are satisfied at the Cabauw station. However, inorganic PM1 concentrations are underestimated at the Montseny and Melpitz stations, even though the MFE satisfies the model performance criteria.
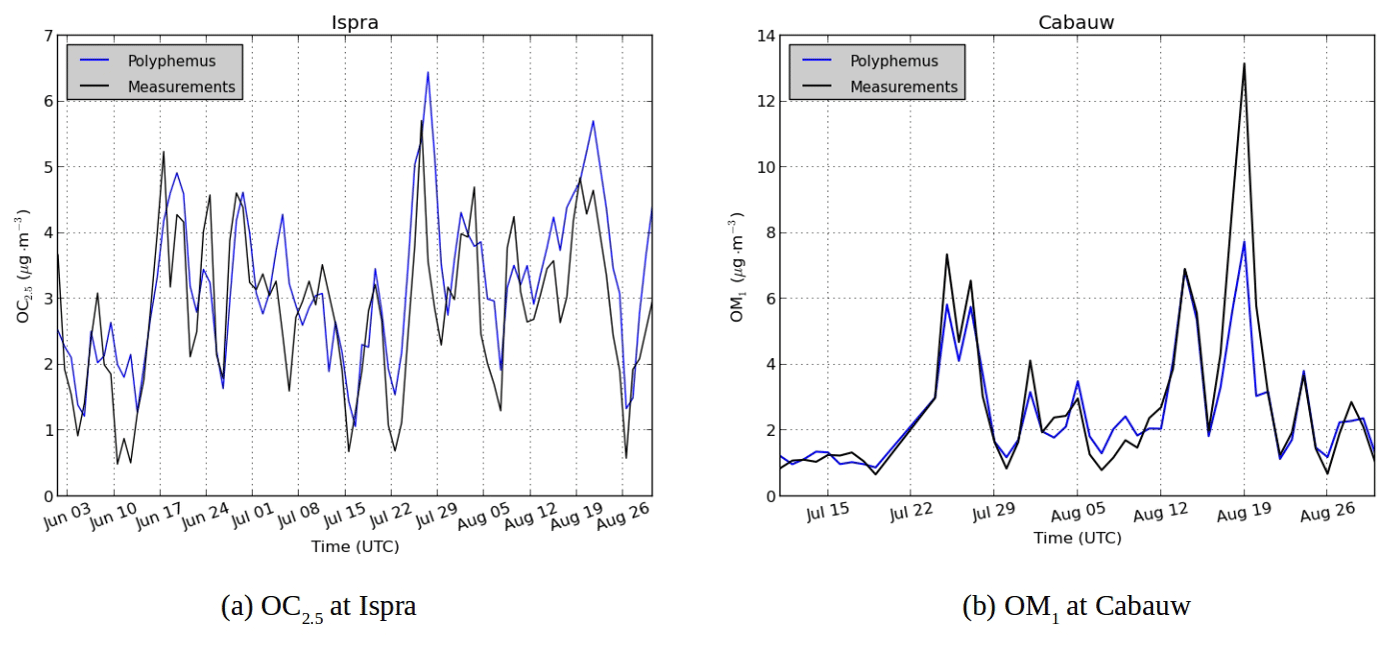
Figure 6Comparison of modeled SOA concentrations (blue) with observations (black) for (a) OC2.5 concentrations at Ispra and (b) OM1 concentrations at Cabauw.
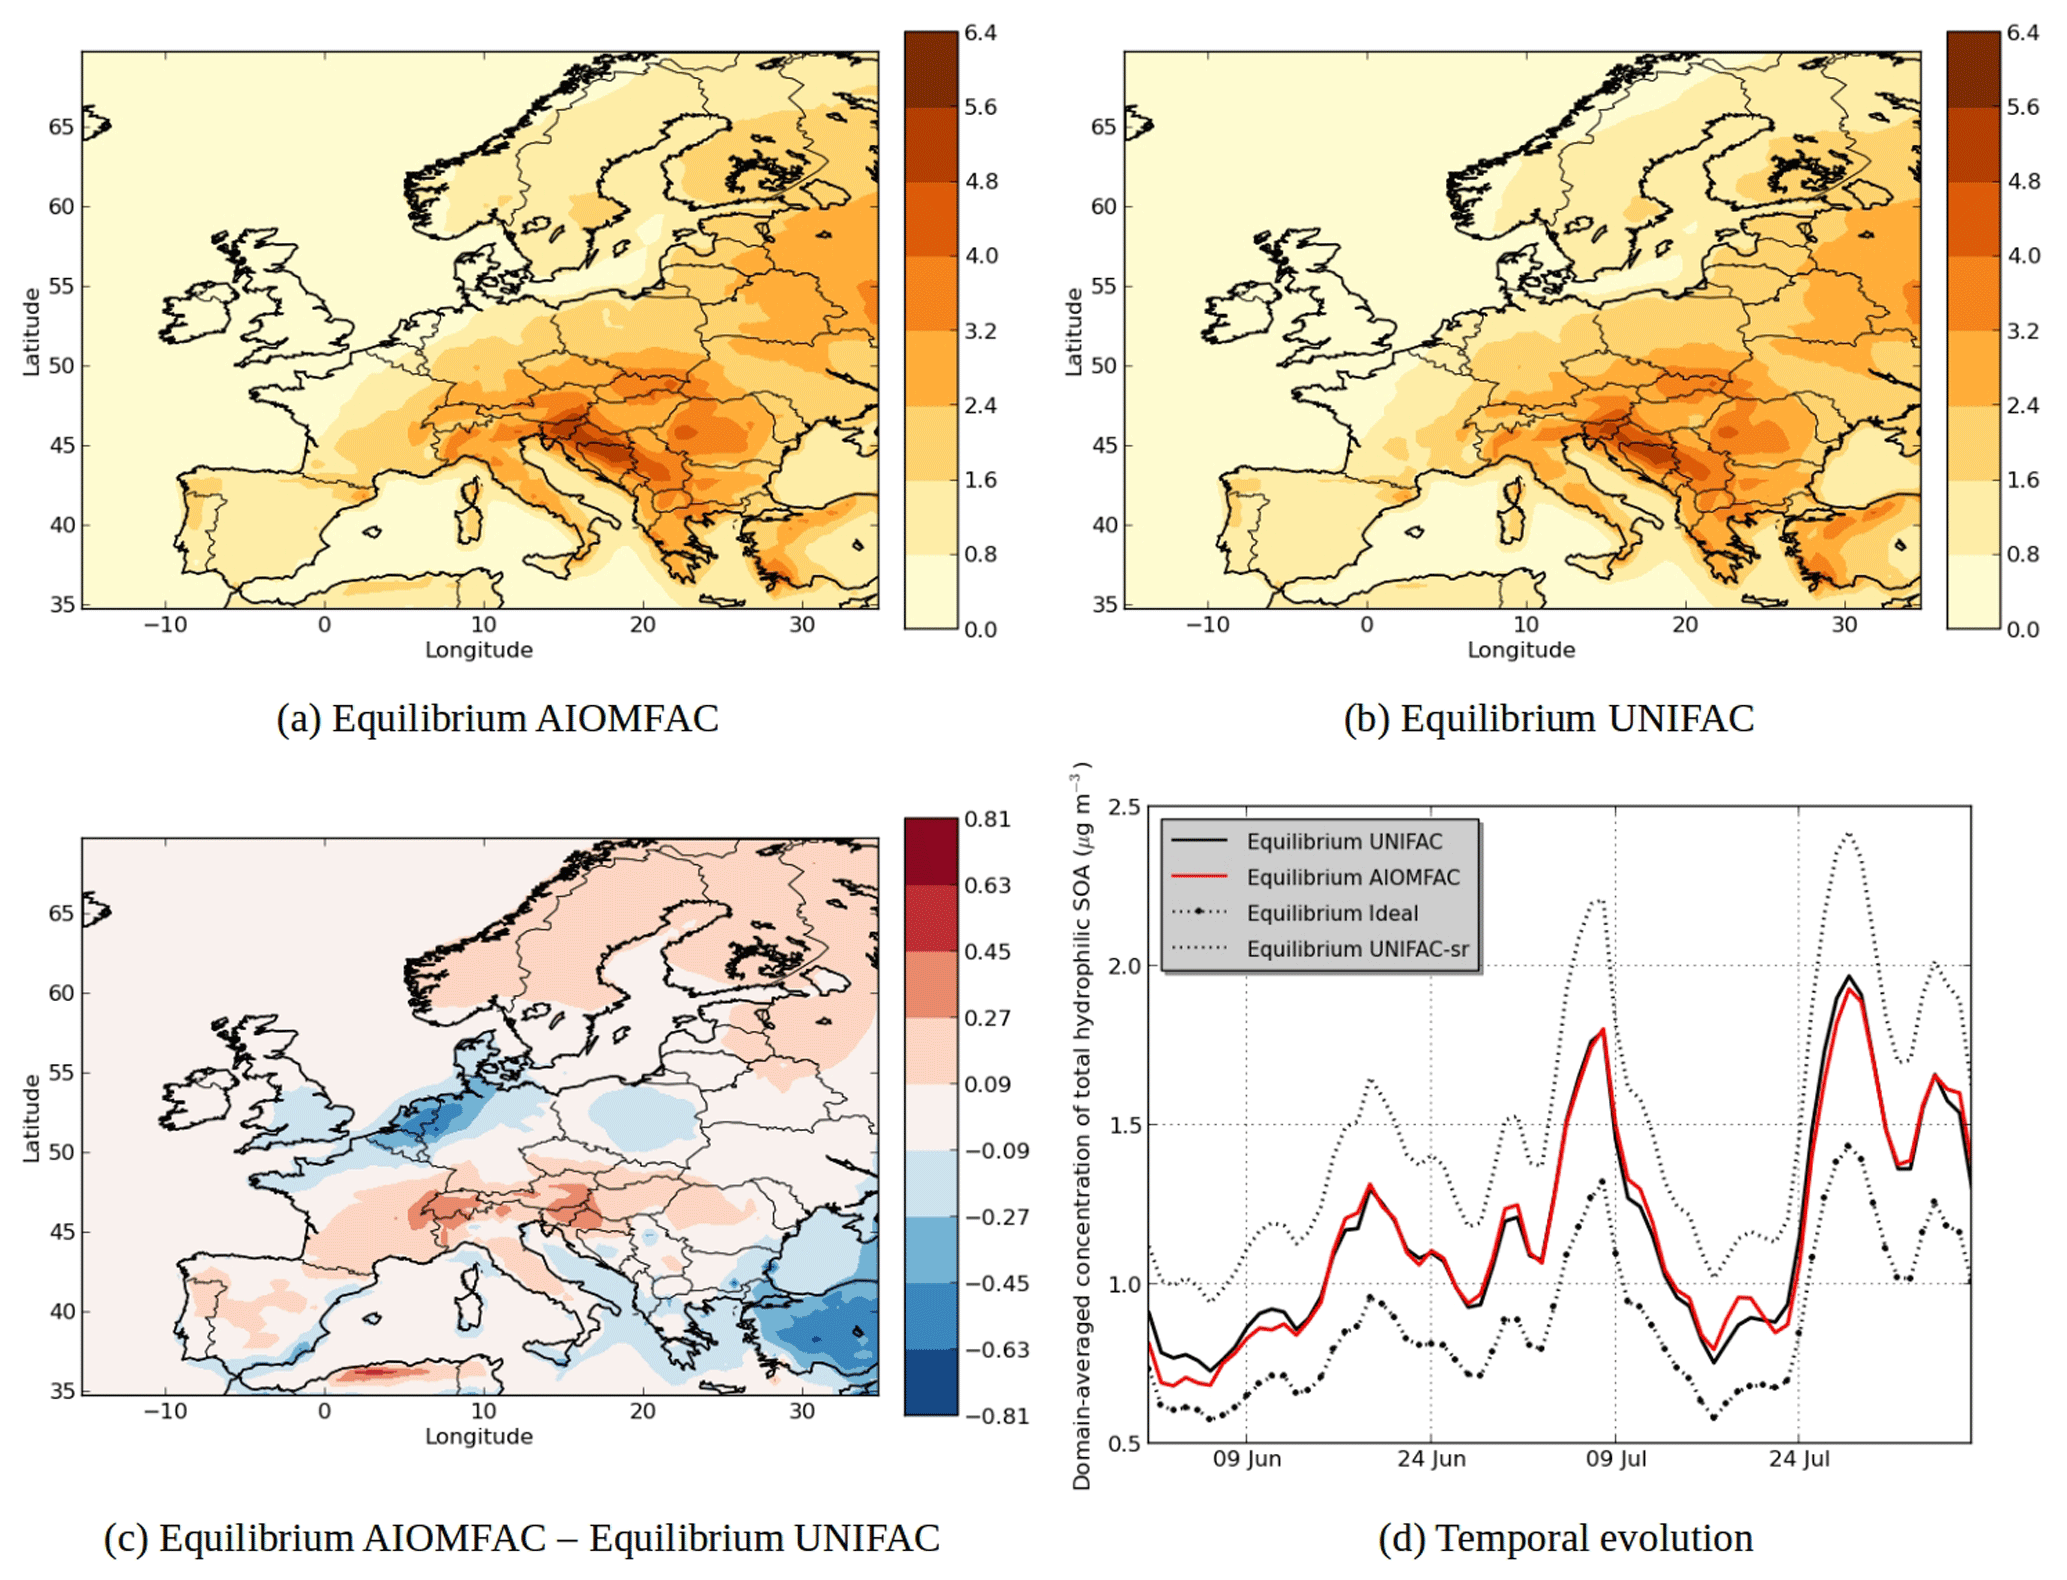
Figure 7Modeled hydrophilic SOA concentrations in (a) the Equilibrium AIOMFAC simulation, (b) the Equilibrium UNIFAC simulation, (c) the differences between the simulations (µg m−3) and (d) the temporal evolutions of domain-averaged concentrations.

4.3 Impact of inorganic–organic interactions
Figure 7 shows the modeled hydrophilic SOA concentrations. The choice of thermodynamic model affects the spatial distribution of hydrophilic SOA, with a decrease of concentrations when using AIOMFAC over the Netherlands, Belgium, parts of Italy, Spain, over the Mediterranean coast and southeastern Europe and an increase of concentrations over northern Europe, parts of the Alps, southern France, parts of Italy and parts of Spain. The area with the strongest decrease of concentrations corresponds to areas with strong inorganic concentrations. For example, the decrease of concentrations over Netherlands corresponds to high ammonium nitrate concentrations, while the decrease in southeastern Europe corresponds to high ammonium sulfate concentrations.
The changes in concentration of specific SOA compounds using AIOMFAC and UNIFAC are illustrated by Fig. 8. The local increases of concentrations can be due to nonlinear effects. Indeed, while the concentrations of the less oxidized hydrophilic compounds (BiA0D with a ratio of oxygen to carbon atoms (O∕C) of 0.2 and BiA1D with a O∕C of 0.5) mainly decrease over Europe (−2 % for BiA0D and −27 % for BiA1D), the concentrations of the more oxidized compounds (BiPER with a O∕C of 1.2 and BiDER with an O∕C of 0.8) mainly increase (6 % for BiPER and 16 % for BiDER). This finding is in agreement with Pye et al. (2018), who found that in the eastern US, particle-phase interactions of organic and inorganic compounds increase partitioning toward the particle phase (vs. gas phase) for highly oxidized compounds () but decrease particle-phase partitioning for low O∕C.
Figure 7d shows the temporal evolution of the domain-averaged concentration of hydrophilic SOA for different simulations. Modeling organic interactions by activity coefficients strongly influences hydrophilic SOA. It leads on average to a concentration increase of 33 % (Equilibrium UNIFAC simulation compared to Equilibrium Ideal simulation). When the computation of short-range interactions between inorganic and organic aerosols is taken into account in UNIFAC, the SOA concentrations increase because of a decrease of activity coefficient (see Equilibrium UNIFAC-sr simulation in Fig. 7d). Long-range and medium-range interactions in the Equilibrium AIOMFAC simulation lead to an increase of activity coefficients as concentrations decrease compared to the Equilibrium UNIFAC-sr simulation by 28 %. This evaporation of hydrophilic organic concentrations by the medium- and long-range inorganic–organic interactions agrees with the results of Zuend et al. (2008), who showed that the activity coefficients of hydrophilic organic aerosols increase because of the interactions with inorganic aerosols.
The SOA concentrations simulated with the AIOMFAC model are close to the concentrations simulated with the UNIFAC model (without taking into account inorganics in the computation of short-range interactions). It suggests that computing activity coefficients for hydrophilic organic compounds by only taking water and organic compounds (and therefore by ignoring inorganics) could give a good first approximation of activity coefficients. Medium- and long-range interactions compensate the decrease of activity coefficients due to the inclusion of inorganic ions in short-range interactions. We estimated the contributions of long-range and medium-range interactions in this decrease by an additional simulation. In this additional simulation, only the medium-range interactions are taken into account in the AIOMFAC model. According to the results of this simulation, the differences in the concentrations of hydrophilic SOA are due to the medium-range interactions by 65 % and the long-range interactions by 35 %.
4.4 Impact of the thermodynamic equilibrium assumption
The aqueous phase of the particles is assumed to be inviscid, and organics are strongly influenced by inorganic concentrations because they constitute an absorbing mass for hydrophilic organics. However, in the organic phase, the particles may be viscous, and the dynamic evolution of the SOA concentrations by condensation and evaporation may be limited by diffusion due to the particle viscosity (Couvidat and Sartelet, 2015).
To evaluate the impact of particle viscosity on SOA concentrations, condensation and evaporation need to be solved using the dynamic approach. Because condensation and evaporation are solved using the equilibrium approach in the previous simulations, the impact of using the dynamic approach, while still assuming particles to be inviscid, is assessed by running the “Dynamic inviscid” simulation.
Differences between the Equilibrium UNIFAC and the “Dynamic inviscid” simulations are very low for hydrophobic compounds (less than 1 %), whereas a decrease of concentrations by about 6 % is found for hydrophilic compounds in the “Dynamic inviscid” simulation. The differences are due to the non-ideality of the aerosols as low differences are found when assuming ideality (3 %). In the Equilibrium UNIFAC simulation, activity coefficients are computed by taking the composition of the aerosols averaged over size sections. However, for the “Dynamic inviscid” simulation, activity coefficients are computed for each size section. The section activity coefficients of the “Dynamic inviscid” simulation are therefore different from the activity coefficients of the Equilibrium UNIFAC simulation.
For hydrophobic compounds, the differences are mainly due to the variations of the mass transfer rate computed by Eq. (5). In the dynamic approach, the condensation and evaporation process is slower than in the equilibrium approach. Therefore, using the dynamic approach reduces the magnitudes of the peaks in the temporal variations of the SOA concentrations, although the average concentrations do not change much with the temporal and spatial resolutions used here. In the dynamic approach, in opposition to the equilibrium approach, low-volatility secondary compounds formed by gas-phase chemistry are found to not be completely into the particle phase due to the kinetics of condensation. For example, 97 % of SOAlP is absorbed inside the particle, and 3 % of SOAlP is still present in the gas phase.
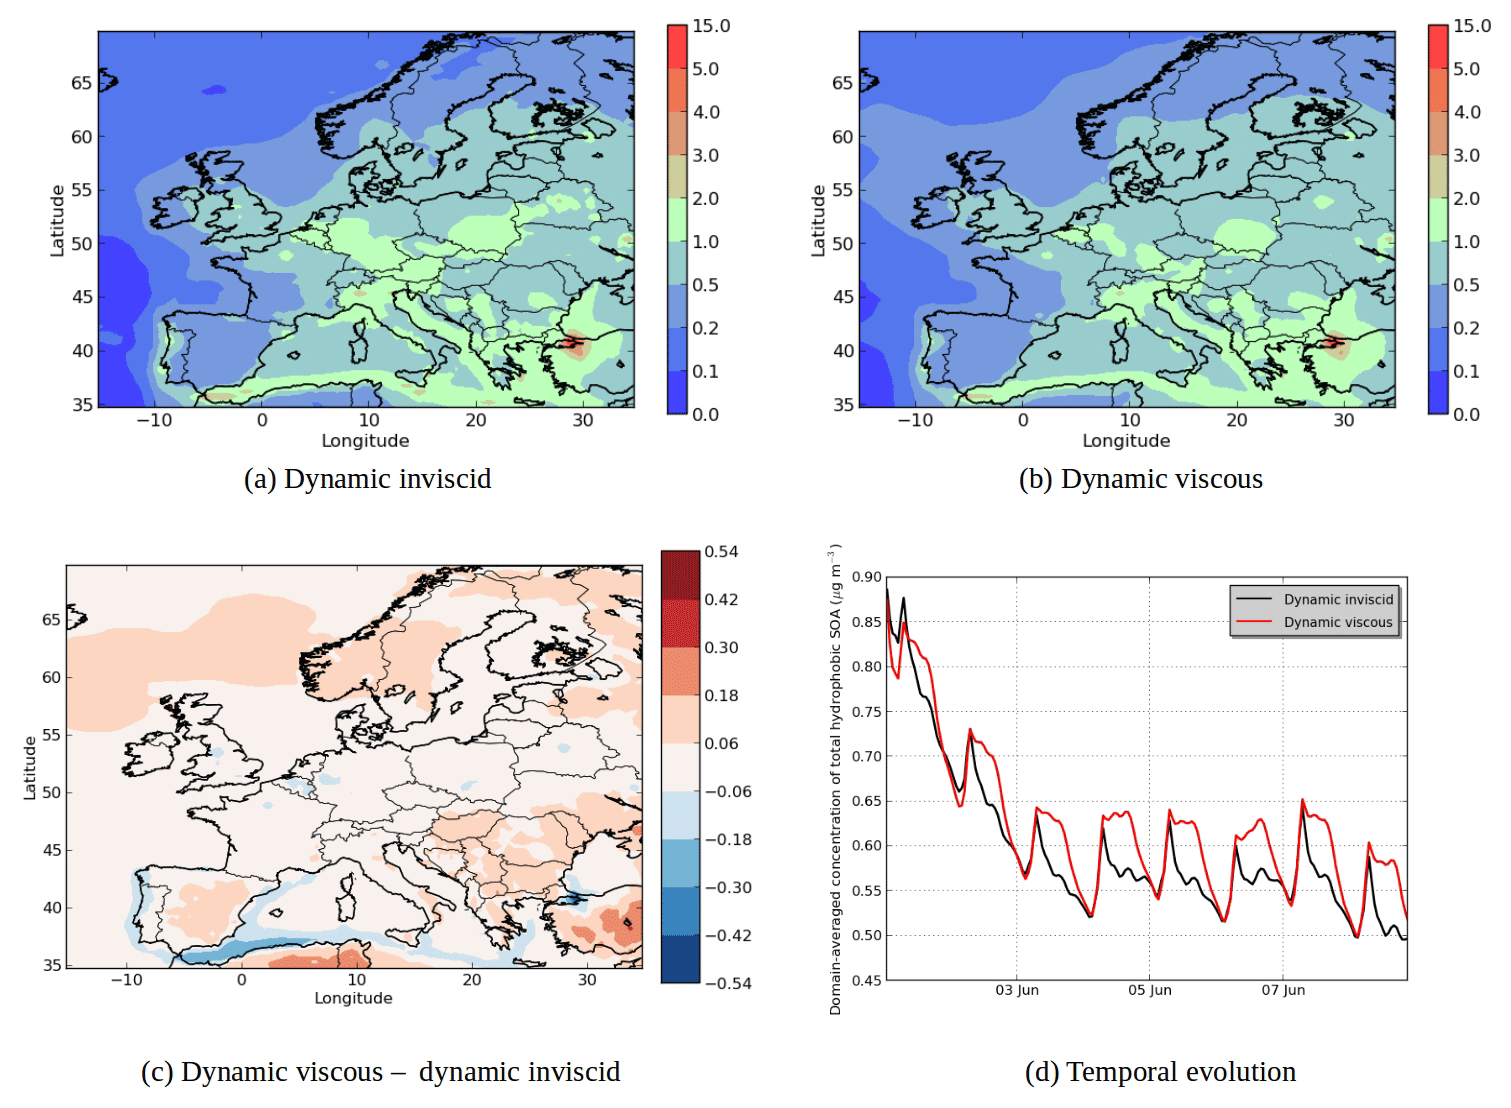
Figure 9Modeled hydrophobic SOA concentrations in (a) the “Dynamic inviscid” simulation, (b) the “Dynamic viscous” simulation, (c) the differences between the simulations (µg m−3) and (d) the temporal evolutions.
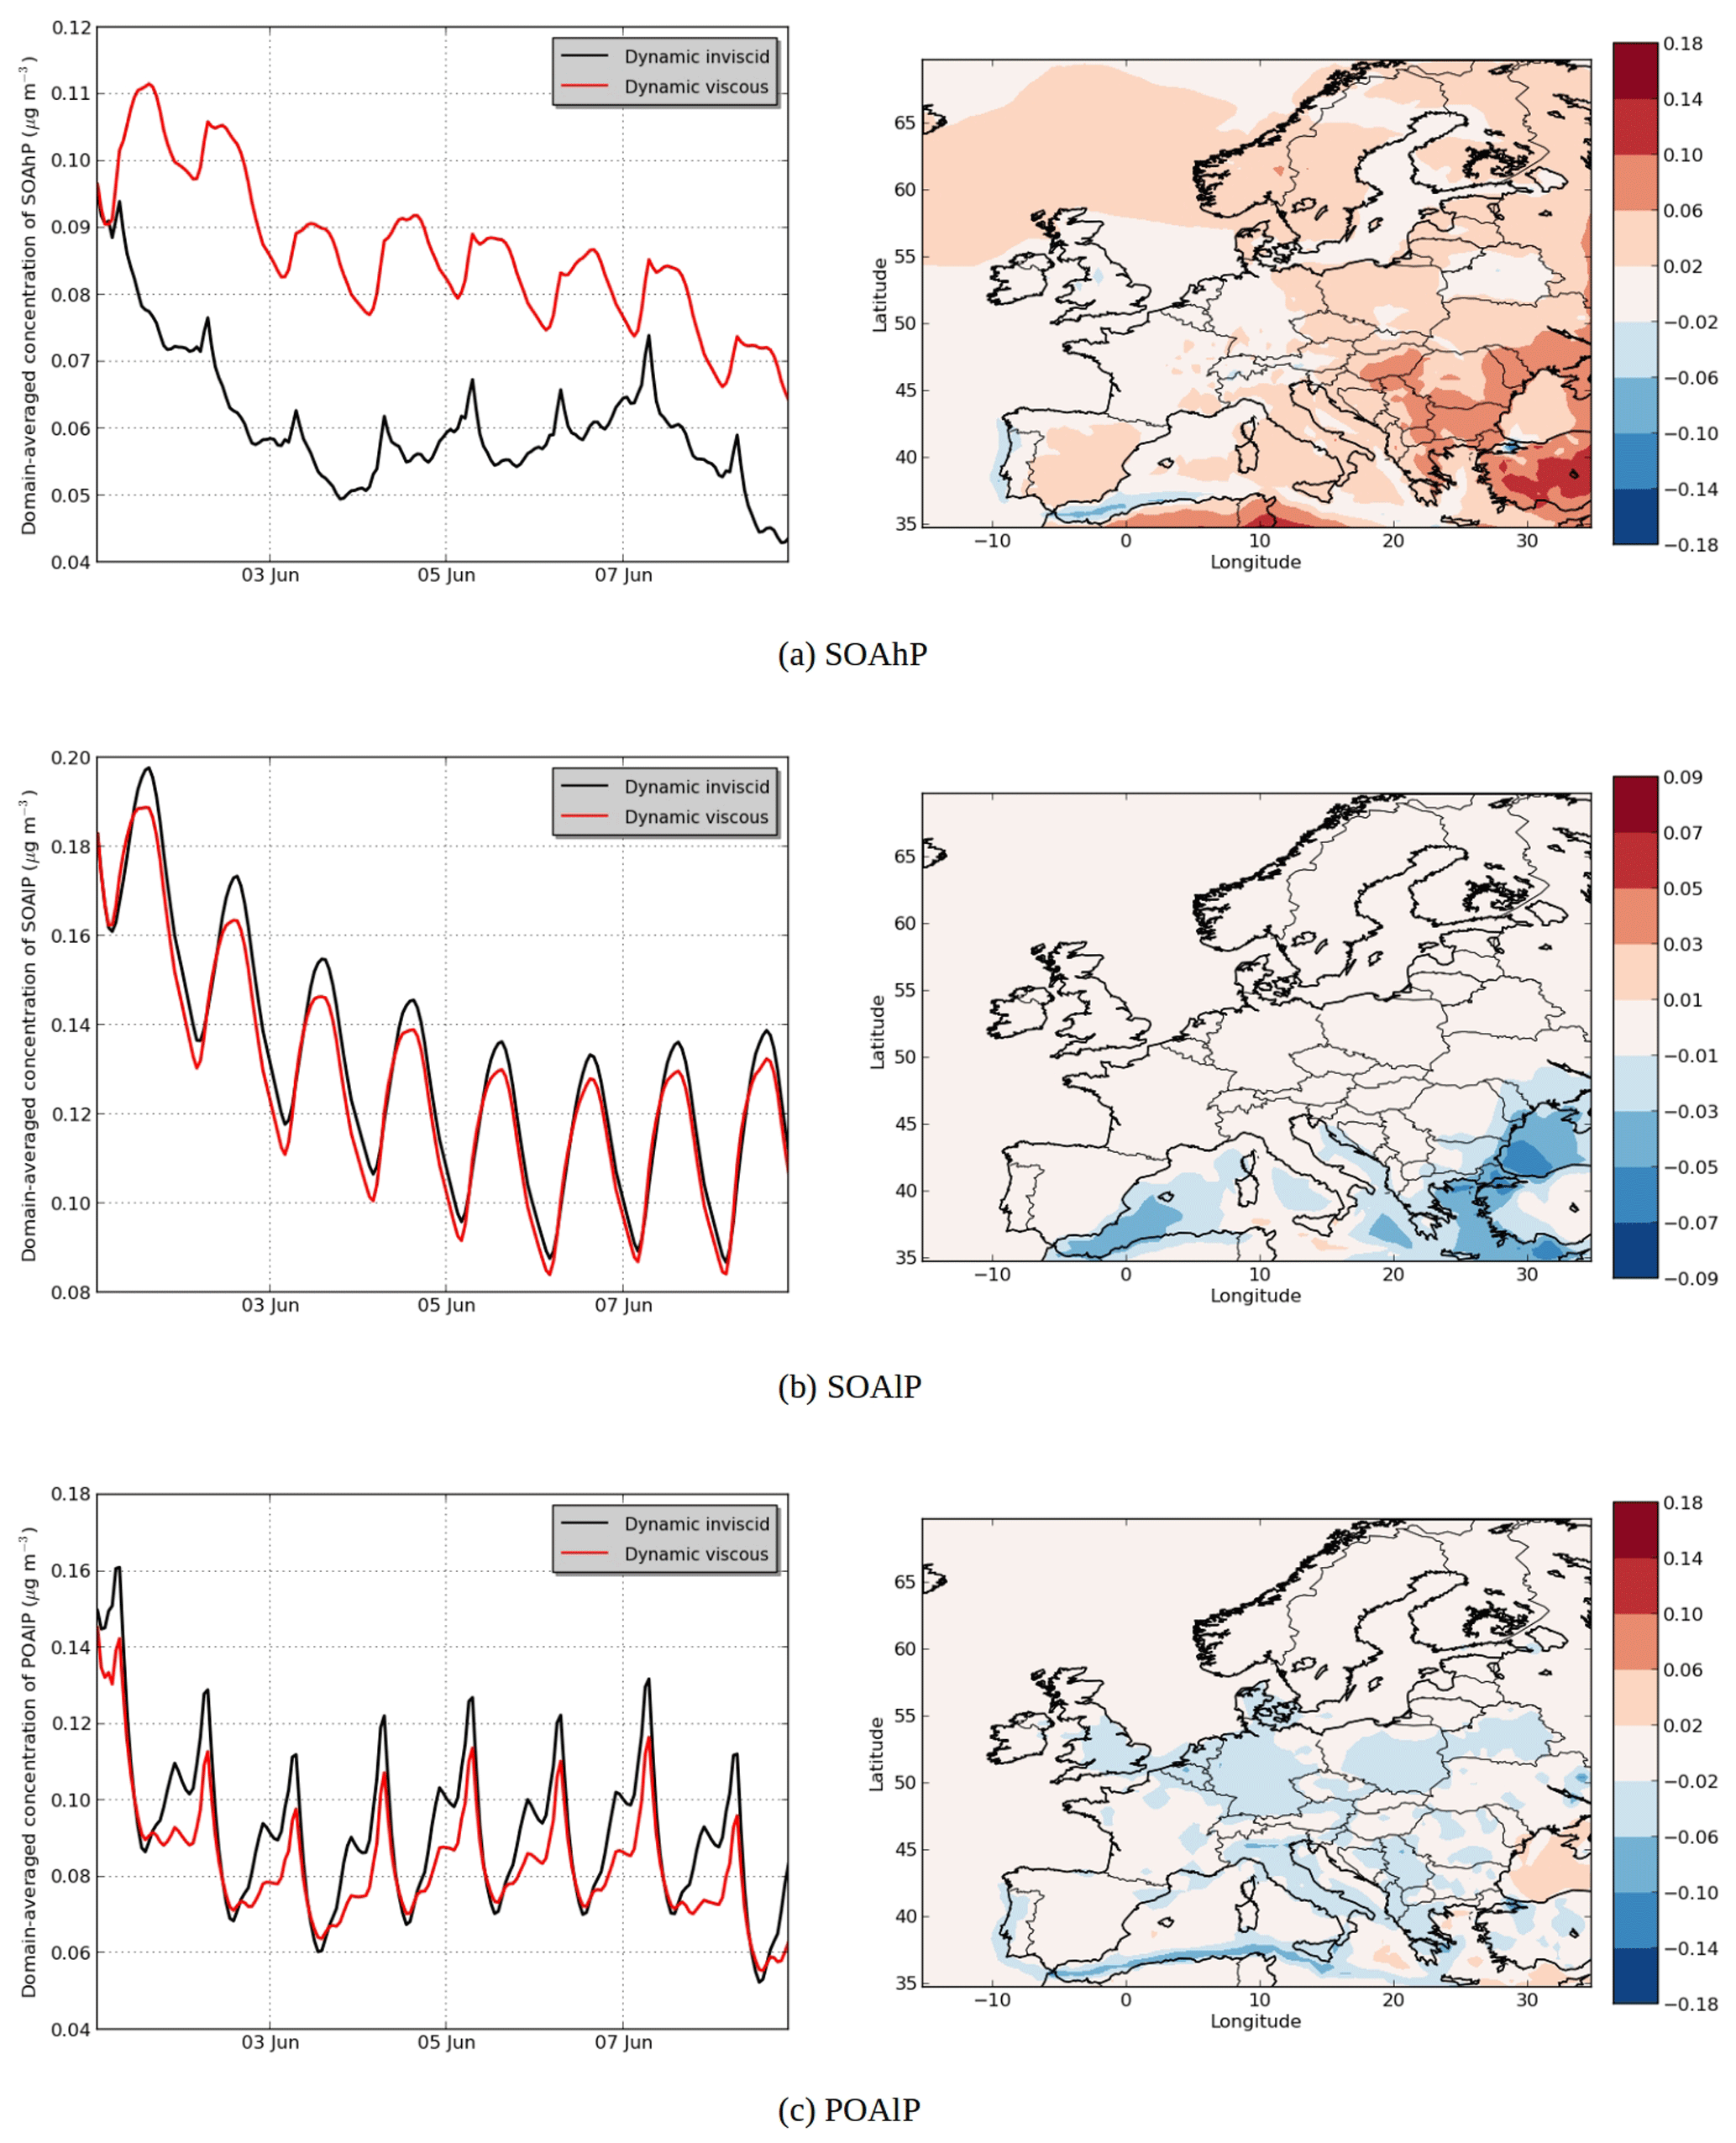
Figure 10Temporal evolution (left) and differences between the “Dynamic viscous” and “Dynamic inviscid” simulations (right) of modeled SOA concentrations for (a) SOAhP, (b) SOAlP and (c) POAlP (µg m−3).
4.5 Impact of viscosity of the organic phase
In the “Dynamic viscous” simulation, as expected, the dynamic evolution of the hydrophilic SOA concentration does not change from those of the “Dynamic inviscid” simulation, but the organic hydrophobic phase is strongly influenced by the viscosity.
Assuming that the organic phase is very viscous leads to an increase in concentrations of hydrophobic SOA: 6 % on average of the total concentrations (see Fig. 9). The increase can exceed 20 % over areas with low concentrations in the “Dynamic inviscid” simulation (Spain and northern Europe). This increase of concentrations of hydrophobic SOA is due to the absence of evaporation (because of the absence of diffusion) when concentrations exceed equilibrium. The hydrophobic SOA concentrations in the “Dynamic viscous” simulation decrease, where they are very high in the “Dynamic inviscid” simulation (the Strait of Gibraltar and Istanbul). As shown in Fig. 9d, the increase of concentrations in the “Dynamic viscous” simulation happens mainly during daytime.
The influence of viscosity differs depending on the volatility of the surrogate. For example, in the model, the emitted anthropogenic IVOC and SVOC are represented by surrogates of different volatility classes: high volatility (POAhP, Kp=0.00031 m3 µg−1), average volatility (POAmP, Kp=0.0116 m3 µg−1) and low volatility (POAlP, Kp=1.1 m3 µg−1). The chemical kinetic mechanism used for the SOAP model includes the oxidation of these surrogates to other surrogates with lower volatilities: SOAhP (Kp=0.031 m3 µg−1), SOAmP (Kp=1.16 m3 µg−1) and SOAlP (Kp=110 m3 µg−1) with the following equations (Couvidat et al., 2012).
In Fig. 10a, the concentrations of SOAhP (one of the most volatile compounds of the mechanism) strongly increase in the “Dynamic viscous” simulation (by 44 % in average). This increase is especially strong in southeastern Europe, where concentrations double and increase by 0.1 µg m−3. In the “Dynamic viscous” simulation, concentrations increase strongly at the beginning of the day and reach a maximum during daytime. On the contrary, in the “Dynamic inviscid” simulation, concentrations decrease at the beginning of the day and reach a minimum during daytime (as the volatility of the compound increases during daytime). In the “Dynamic viscous” simulation, the diurnal variations of SOAhP follow those of the low-volatility compound SOAlP (Fig. 10b). Figure 11 shows the deviation of the particle–gas partitioning from equilibrium for SOAhP (defined as the particle–gas concentration ratio in the “Dynamic viscous” simulation over that in the “Dynamic inviscid” simulation, which is close to equilibrium). This deviation often exceeds 50 % and particle-phase concentrations exceed equilibrium over most of Europe. As presented in Sect. 3.3, condensation of a semi-volatile compound can happen without respecting equilibrium as long as the particle is growing (growth that can be due to the condensation of a low-volatility compound such as SOAlP). The condensation during the day of low-volatility compounds formed during daytime stops the evaporation of SOAhP captured inside the particle (evaporation that would occur for an inviscid organic phase) and is even able to bring further condensation of the compound.
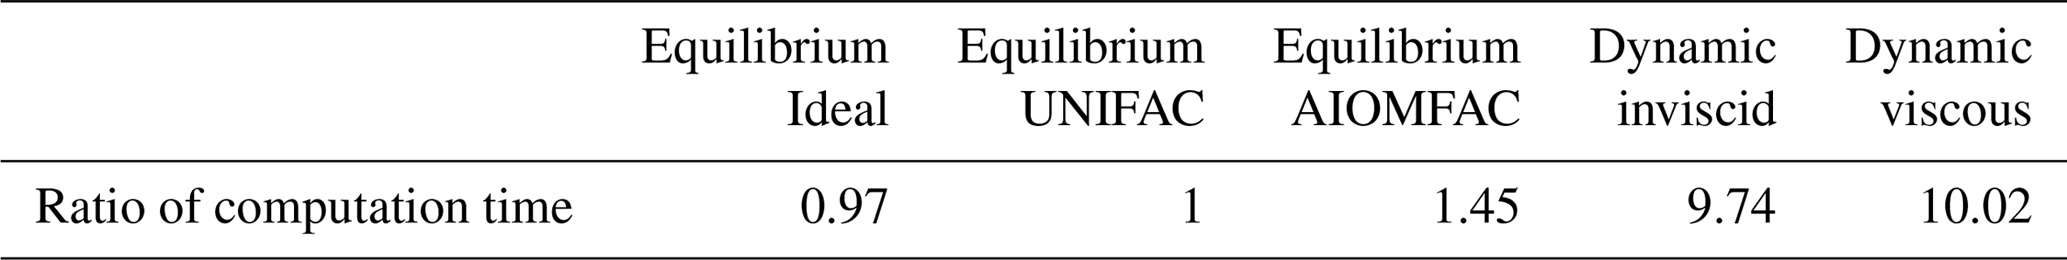
Table 5Comparison of the time elapsed for the simulations. The elapsed time for the Equilibrium UNIFAC simulation is set to a reference time. Ratios between the reference time and the time elapsed for other simulations are presented.
Concentrations for the low-volatility compound SOAlP slightly decrease (see Fig. 10b). This decrease is mainly due to the increase of the POAlP particle-phase concentration during daytime (see Fig. 10c). In the chemical kinetic mechanism used in this study, SOAlP is formed from the gas-phase oxidation of POAlP by OH radicals (mainly present daytime). The increase of POAlP in the particle-phase during daytime slows down the formation of the compound SOAlP. On the contrary, at the end of the day, concentrations of POAlP become higher in the “Dynamic inviscid” simulation due to the decrease of volatility (because of the decrease of temperature). However, in the “Dynamic viscous” simulation, the decrease of the volatility has a small effect on concentrations (because the inner layer cannot absorb more compounds to reach equilibrium due to the absence of diffusion).
The large deviations from equilibrium suggested by this study agree with the measurements of Yatavelli et al. (2014) and Lopez-Hilfiker et al. (2015), who observed that the concentrations of pinonic acid in SOA are much higher than predicted ,with the equilibrium assumption using saturation vapor pressures. It could also be possible that this phenomenon is due to nonideal effects and the possibility for pinonic acid to be absorbed onto an aqueous phase with an acidic dissociation.
The viscosity effect is very low for low-volatility compounds (Couvidat and Sartelet, 2015). Here, extremely low-volatility compounds from the oxidation of monoterpenes are not modeled (Chrit et al., 2017). Taking them into account may decrease the viscosity effect estimated in this study.
4.6 Comparison of computation times
Table 5 presents the time elapsed for each simulation. The elapsed time for the Equilibrium UNIFAC simulation is set to a reference time. The time elapsed for the Equilibrium AIOMFAC simulation increases by 45 % compared to the reference time. Using the dynamic approach leads to an increase of the computation time by a factor of 10, making it difficult to represent viscous aerosols in long-term 3-D simulations. However, these computation times are acceptable for short-term 3-D simulations.
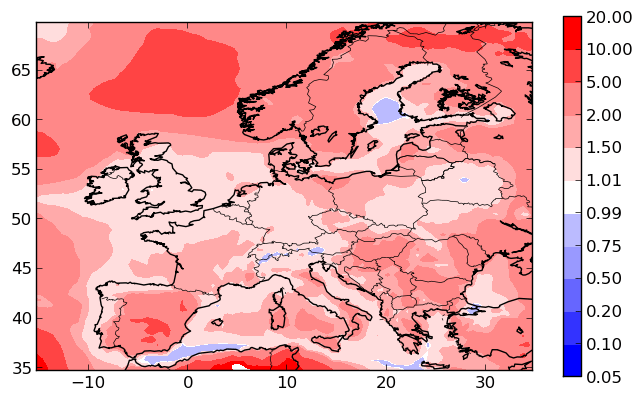
Figure 11Equilibrium deviation for compound SOAhP. A deviation close to 1 means that the compound reaches equilibrium, above 1 means that particle-phase concentrations are above equilibrium and under 1 means that concentrations have not reached equilibrium.
The SOAP model, which uses either the equilibrium approach or the dynamic approach for the mass transfer of organic compounds from the gas phase to the particle phases, was implemented in the 3-D air quality model of Polyphemus. Compared to its predecessor, SOAP provides a more complete description of the partitioning of semi-volatile compounds, in particular, by taking into account the effect of inorganic aerosols on SOA formation based on the computation of activity coefficients given by AIOMFAC. Sensitivity simulations indicate that including inorganic aerosols and hydrophilic organic aerosols in the absorbing mass of the aqueous phase can lead to an increase of concentrations around 5 % and 6 %, respectively. Overall, hydrophilic SOA concentrations using AIOMFAC are higher than those with the ideality assumption by about 33 %. The results of this study suggest that non-ideality via organic–organic and inorganic–organic interactions strongly influence the condensation of hydrophilic organic compounds.
For an inviscid aerosol, the results of this study show that the equilibrium assumption is an efficient approximation when assuming ideality for organic aerosols. However, assuming equilibrium can lead to significant differences in the concentrations of hydrophilic compounds when non-ideality is taken into account. Indeed, with a dynamic approach, different values of activity coefficients can be simulated for the different size sections. These results indicate that differences in the composition of particles with particle size can impact the formation of SOA. Note that in this study, an equilibrium approach is used for the condensation of inorganics. Using a dynamic approach to model the condensation and evaporation of both inorganic and organic compounds may be necessary to properly estimate the formation of hydrophilic SOA.
The dynamic approach in the SOAP model is used to account for the viscosity of aerosol to study SOA formation via two theoretical cases: the inviscid case, where diffusion is extremely fast and concentrations inside the particle are homogeneous, and the infinite viscosity case, where viscosity is too high for diffusion to occur inside the particle but where condensation or evaporation of compounds at the gas–particle interface can still occur. Even if the two cases presented in this study are theoretical, the results provide a first insight on how viscosity may affect SOA formation. For the inviscid case, concentrations of hydrophobic compounds are close to those in the equilibrium simulation. However, assuming a highly viscous organic phase leads to an increase of hydrophobic SOA concentration during daytime (by stopping the evaporation of the most volatile compounds without stopping their condensation). SOA formation for a highly viscous particle can therefore significantly deviate from thermodynamic equilibrium; e.g., condensation can happen when evaporation occurs if equilibrium is assumed. This deviation may explain why some observed concentrations in the literature are significantly different to concentrations calculated with the equilibrium assumption and saturation vapor pressures.
Those results emphasize the need to study the effect of the dynamics of SOA formation. Next modeling studies should focus on the sensitivity of results to the organic-phase diffusion coefficient and try to take into account the effect of temperature, the aerosol water content and also aerosol composition on this parameter.
The estimation of the computation time shows that the dynamic approach used in the SOAP model can be applicable to the 3-D air quality modeling for a short period or with high computation time capability. Although, the results emphasize the need to study the effect of a dynamic approach compared to an equilibrium approach, the computation-time issue is probably a limiting factor in the possibility for the implementation of dynamic approaches in 3-D air quality models.
Finally, the effect of morphology for a highly viscous aerosol may be critical for a highly viscous aerosol. The coagulation of two highly viscous spherical particles may form a nonspherical particle composed of two spheres stuck together. Nonspherical particles may lead to higher surface-to-volume ratios and faster condensation, evaporation and diffusion.
The model code is available at https://gforge.inria.fr/projects/polyphemus/ (last access: 25 January 2019). The data in the study are available upon request from the corresponding author Youngseob Kim (youngseob.kim@enpc.fr).
YK, KS and FC performed the simulations.
The authors declare that they have no conflict of interest.
This work was funded by the French Ministry of Environment and Sustainable
Development under the project NATORGA of the COPERNICUS-MDD program. The
authors would like to thank the principal investigators of the ACTRIS
measurements used for the model evaluation (Rupert Holzinger, Patrick Schlag
and Astrid Kiendler-Scharr for the station Cabauw; Wenche Aas and Chris
Lunder for the station Birkenes; Maria Cruz Minguillon, Anna Ripoll and
Andres Alastuey for the station Montseny; Laurent Poulain for the station
Melpitz; Fabrizia Cavalli and Jean-Philippe Putaud for the station Ispra; Milan Vana for the station Košetice; and Peter
Tunved and Hans Areskoug for the station
Aspvreten).
Edited by: Kari Lehtinen
Reviewed by: two anonymous referees
Abramson, E., Imre, D., Beranek, J., Wilson, J., and Zelenyuk, A.: Experimental determination of chemical diffusion within secondary organic aerosol particles, Phys. Chem. Chem. Phys., 15, 2983–2991, https://doi.org/10.1039/C2CP44013J, 2013. a, b
Boucher, O.: Atmospheric Aerosols, Properties and Climate Impact, Springer-Netherlands, https://doi.org/10.1007/978-94-017-9649-1, 2015. a
Bowman, F. M., Odum, J. R., Seinfeld, J. H., and Pandis, S. N.: Mathematical model for gas-particle partitioning of secondary organic aerosols, Atmos. Environ., 31, 3921–3931, https://doi.org/10.1016/S1352-2310(97)00245-8, 1997. a
Boylan, J. W. and Russell, A. G.: PM and light extinction model performance metrics, goals, and criteria for three-dimensional air quality models, Atmos. Environ., 40, 4946–4959, https://doi.org/10.1016/j.atmosenv.2005.09.087, 2006. a, b
Capaldo, K. P., Pilinis, C., and Pandis, S. N.: A computationally efficient hybrid approach for dynamic gas/aerosol transfer in air quality models, Atmos. Environ., 34, 3617–3627, https://doi.org/10.1016/S1352-2310(00)00092-3, 2000. a
Cappa, C. D. and Wilson, K. R.: Evolution of organic aerosol mass spectra upon heating: implications for OA phase and partitioning behavior, Atmos. Chem. Phys., 11, 1895–1911, https://doi.org/10.5194/acp-11-1895-2011, 2011. a
Choi, M. Y. and Chan, C. K.: The effects of organic species on the hygroscopic behaviors of inorganic aerosols, Environ. Sci. Technol., 36, 2422–2428, https://doi.org/10.1021/es0113293, 2002. a
Chrit, M., Sartelet, K., Sciare, J., Pey, J., Marchand, N., Couvidat, F., Sellegri, K., and Beekmann, M.: Modelling organic aerosol concentrations and properties during ChArMEx summer campaigns of 2012 and 2013 in the western Mediterranean region, Atmos. Chem. Phys., 17, 12509–12531, https://doi.org/10.5194/acp-17-12509-2017, 2017. a
Couvidat, F. and Sartelet, K.: The Secondary Organic Aerosol Processor (SOAP v1.0) model: a unified model with different ranges of complexity based on the molecular surrogate approach, Geosci. Model Dev., 8, 1111–1138, https://doi.org/10.5194/gmd-8-1111-2015, 2015. a, b, c, d, e, f, g, h, i, j, k, l, m, n, o, p
Couvidat, F., Debry, É., Sartelet, K., and Seigneur, C.: A hydrophilic/hydrophobic organic (H2O) model: Model development, evaluation and sensitivity analysis, J. Geophys. Res., 117, D10304, https://doi.org/10.1029/2011JD017214, 2012. a, b, c, d, e, f, g, h, i, j
Couvidat, F., Kim, Y., Sartelet, K., Seigneur, C., Marchand, N., and Sciare, J.: Modeling secondary organic aerosol in an urban area: application to Paris, France, Atmos. Chem. Phys., 13, 983–996, https://doi.org/10.5194/acp-13-983-2013, 2013. a
Debry, E., Fahey, K., Sartelet, K., Sportisse, B., and Tombette, M.: Technical Note: A new SIze REsolved Aerosol Model (SIREAM), Atmos. Chem. Phys., 7, 1537–1547, https://doi.org/10.5194/acp-7-1537-2007, 2007. a, b, c
DeRieux, W.-S. W., Li, Y., Lin, P., Laskin, J., Laskin, A., Bertram, A. K., Nizkorodov, S. A., and Shiraiwa, M.: Predicting the glass transition temperature and viscosity of secondary organic material using molecular composition, Atmos. Chem. Phys., 18, 6331–6351, https://doi.org/10.5194/acp-18-6331-2018, 2018. a
Fredenslund, A., Jones, R. L., and Prausnitz, J. M.: Group-contribution estimation of activity coefficients in nonideal liquid mixtures, AIChE J., 21, 1086–1099, https://doi.org/10.1002/aic.690210607, 1975. a, b
Guenther, A., Karl, T., Harley, P., Wiedinmyer, C., Palmer, P. I., and Geron, C.: Estimates of global terrestrial isoprene emissions using MEGAN (Model of Emissions of Gases and Aerosols from Nature), Atmos. Chem. Phys., 6, 3181–3210, https://doi.org/10.5194/acp-6-3181-2006, 2006. a, b
Jacobson, M. Z.: Development and application of a new air pollution modeling system – II. Aerosol module structure and design, Atmos. Environ., 31, 131–144, https://doi.org/10.1016/1352-2310(96)00202-6, 1997. a
Jathar, S. H., Mahmud, A., Barsanti, K. C., Asher, W. E., Pankow, J. F., and Kleeman, M. J.: Water uptake by organic aerosol and its influence on gas/particle partitioning of secondary organic aerosol in the United States, Atmos. Environ., 129, 142–154, https://doi.org/10.1016/j.atmosenv.2016.01.001, 2016. a
Jimenez, J. L., Canagaratna, M. R., Donahue, N. M., Prevot, A. S., Zhang, Q., Kroll, J. H., DeCarlo, P. F., Allan, J. D., Coe, H., Ng, N. L., Aiken, A. C., Docherty, K. D., Ulbrich, I., Grieshop, A. P., Robinson, A. L., Duplissy, J., Smith, J. D., Wilson, K. R., Lanz, V. A., Hueglin, C., Sun, Y. L., Tian, J., Laaksonen, A., Raatikainen, T., Rautiainen, J., Vaattovaara, P., Ehn, M., Kulmala, M., Tomlinson, J. M., Collins, D. R., Cubison, M. J., Dunlea, E. J., Huffman, J. A., Onasch, T. B., Alfarra, M. R., Williams, P. I., Bower, K., Kondo, Y., Schneider, J., Drewnick, F., Borrmann, S., Weimer, S., Demerjian, K., Salcedo, D., Cottrell, L., Griffin, R., Takami, A., Miyoshi, T., Hatakeyama, S., Shimono, A., Sun, J. Y., Zhang, Y. M., Dzepina, K., Kimmel, J. R., Sueper, D., Jayne, J. T., Herndon, S. C., Trimborn, A. M., Williams, L. R., Wood, E. C., Kolb, C. E., Middlebrook, A. M., Baltensperger, U., and Worsnop, D. R.: Evolution of organic aerosols in the atmosphere, Science, 326, 1525–1529, https://doi.org/10.1126/science.1180353, 2009. a
Kim, Y., Couvidat, F., Sartelet, K., and Seigneur, C.: Comparison of different gas-phase mechanisms and aerosol modules for simulating particulate matter formation, Japca J. Air Waste Ma., 61, 1–9, https://doi.org/10.1080/10473289.2011.603999, 2011. a
Krechmer, J. E., Day, D. A., Ziemann, P. J., and Jimenez, J. L.: Direct measurements of gas/particle partitioning and mass accommodation coefficients in environmental chambers, Environ. Sci. Technol., 51, 11867–11875, https://doi.org/10.1021/acs.est.7b02144, 2017. a
Lopez-Hilfiker, F. D., Mohr, C., Ehn, M., Rubach, F., Kleist, E., Wildt, J., Mentel, Th. F., Carrasquillo, A. J., Daumit, K. E., Hunter, J. F., Kroll, J. H., Worsnop, D. R., and Thornton, J. A.: Phase partitioning and volatility of secondary organic aerosol components formed from α-pinene ozonolysis and OH oxidation: the importance of accretion products and other low volatility compounds, Atmos. Chem. Phys., 15, 7765–7776, https://doi.org/10.5194/acp-15-7765-2015, 2015. a
Mallet, V., Quélo, D., Sportisse, B., Ahmed de Biasi, M., Debry, É., Korsakissok, I., Wu, L., Roustan, Y., Sartelet, K., Tombette, M., and Foudhil, H.: Technical Note: The air quality modeling system Polyphemus, Atmos. Chem. Phys., 7, 5479–5487, https://doi.org/10.5194/acp-7-5479-2007, 2007. a
Maples, R. E.: Petroleum Refinery Process Economics, Pennwell Books, 2nd Edn., 2000. a
Meng, Z., Dabdub, D., and Seinfeld, J. H.: Size-resolved and chemically resolved model of atmospheric aerosol dynamics, J. Geophys. Res., 103, https://doi.org/10.1029/97JD02796, 1998. a
Nenes, A., Pandis, S. N., and Pilinis, C.: ISORROPIA: A new thermodynamic equilibrium model for multiphase multicomponent inorganic aerosols, Aquat. Geochem., 4, 123–152, https://doi.org/10.1023/A:1009604003981, 1998. a
Nenes, A., Pandis, S. N., and Pilinis, C.: Continued development and testing of a new thermodynamic aerosol module for urban and regional air quality models, Atmos. Environ., 33, 1553–1560, https://doi.org/10.1016/S1352-2310(98)00352-5, 1999. a
O'Meara, S., Topping, D. O., Zaveri, R. A., and McFiggans, G.: An efficient approach for treating composition-dependent diffusion within organic particles, Atmos. Chem. Phys., 17, 10477–10494, https://doi.org/10.5194/acp-17-10477-2017, 2017. a
Pankow, J. F.: An absorption model of gas/particle partitioning of organic compounds in the atmosphere, Atmos. Environ., 28, 185–188, https://doi.org/10.1016/1352-2310(94)90093-0, 1994. a, b
Pfrang, C., Shiraiwa, M., and Pöschl, U.: Chemical ageing and transformation of diffusivity in semi-solid multi-component organic aerosol particles, Atmos. Chem. Phys., 11, 7343–7354, https://doi.org/10.5194/acp-11-7343-2011, 2011. a, b
Putaud, J.-P., Raes, F., Van Dingenen, R., Brüggemann, E., Facchini, M.-C., Decesari, S., Fuzzi, S., Gehrig, R., Hüglin, C., Laj, P., Lorbeer, G., Maenhaut, W., Mihalopoulos, N., Müller, K., Querol, X., Rodriguez, S., Schneider, J., Spindler, G., ten Brink, H., Tørseth, K., and Wiedensohler, A.: A european aerosol phenomenology – 2: chemical characteristics of particulate matter at kerbside, urban, rural and background sites in Europe, Atmos. Environ., 38, 2579–2595, https://doi.org/10.1016/j.atmosenv.2004.01.041, 2004. a
Pye, H. O. T., Murphy, B. N., Xu, L., Ng, N. L., Carlton, A. G., Guo, H., Weber, R., Vasilakos, P., Appel, K. W., Budisulistiorini, S. H., Surratt, J. D., Nenes, A., Hu, W., Jimenez, J. L., Isaacman-VanWertz, G., Misztal, P. K., and Goldstein, A. H.: On the implications of aerosol liquid water and phase separation for organic aerosol mass, Atmos. Chem. Phys., 17, 343–369, https://doi.org/10.5194/acp-17-343-2017, 2017. a
Pye, H. O. T., Zuend, A., Fry, J. L., Isaacman-VanWertz, G., Capps, S. L., Appel, K. W., Foroutan, H., Xu, L., Ng, N. L., and Goldstein, A. H.: Coupling of organic and inorganic aerosol systems and the effect on gas–particle partitioning in the southeastern US, Atmos. Chem. Phys., 18, 357–370, https://doi.org/10.5194/acp-18-357-2018, 2018. a
Rattanavaraha, W., Rosen, E., Zhang, H., Li, Q., Pantong, K., and Kamens, R. M.: The reactive oxidant potential of different types of aged atmospheric particles: An outdoor chamber study, Atmos. Environ., 45, 3848–3855, https://doi.org/10.1016/j.atmosenv.2011.04.002, 2011. a
Reid, J. P., Bertram, A. K., Topping, D. O., Laskin, A., Martin, S. T., Petters, M. D., Pope, F. D., and Rovelli, G.: The viscosity of atmospherically relevant organic particles, Nat. Commun., 9, 956, https://doi.org/10.1038/s41467-018-03027-z, 2018. a
Renbaum-Wolff, L., Grayson, J. W., Bateman, A. P., Kuwata, M., Sellier, M., Murray, B. J., Shilling, J. E., Martin, S. T., and Bertram, A. K.: Viscosity of α-pinene secondary organic material and implications for particle growth and reactivity, P. Natl. Acad. Sci. USA, 110, 8014–8019, https://doi.org/10.1073/pnas.1219548110, 2013. a
Roldin, P., Eriksson, A. C., Nordin, E. Z., Hermansson, E., Mogensen, D., Rusanen, A., Boy, M., Swietlicki, E., Svenningsson, B., Zelenyuk, A., and Pagels, J.: Modelling non-equilibrium secondary organic aerosol formation and evaporation with the aerosol dynamics, gas- and particle-phase chemistry kinetic multilayer model ADCHAM, Atmos. Chem. Phys., 14, 7953–7993, https://doi.org/10.5194/acp-14-7953-2014, 2014. a
Saleh, R., Donahue, N. M., and Robinson, A. L.: Time scales for gas-particle partitioning equilibration of secondary organic aerosol formed from alpha-pinene ozonolysis, Environ. Sci. Technol., 47, 5588–5594, https://doi.org/10.1021/es400078d, 2013. a
Sartelet, K., Hayami, H., and Sportisse, B.: Dominant aerosol processes during high-pollution episodes over Greater Tokyo, J. Geophys. Res., 112, D14214, https://doi.org/10.1029/2006JD007885, 2007a. a
Sartelet, K. N., Debry, E., Fahey, K., Roustan, Y., Tombette, M., and Sportisse, B.: Simulation of aerosols and gas-phase species over Europe with the Polyphemus system: Part I–Model-to-data comparison for 2001, Atmos. Environ., 41, 6116–6131, https://doi.org/10.1016/j.atmosenv.2007.04.024, 2007b. a
Sartelet, K. N., Couvidat, F., Seigneur, C., and Roustan, Y.: Impact of biogenic emissions on air quality over Europe and North America, Atmos. Environ., 53, 131–141, https://doi.org/10.1016/j.atmosenv.2011.10.046, 2012. a
Seinfeld, J. H. and Pandis, S. N.: Atmospheric chemistry and physics: from air pollution to climate change, Wiley-Interscience, New York, 1998. a
Shiraiwa, M. and Seinfeld, J. H.: Equilibration timescale of atmospheric secondary organic aerosol partitioning, Geophys. Res. Lett., 39, L24801, https://doi.org/10.1029/2012GL054008, 2012. a
Shiraiwa, M., Ammann, M., Koop, T., and Pöschl, U.: Gas uptake and chemical aging of semisolid organic aerosol particles, P. Natl. Acad. Sci. USA, 108, 11003–11008, https://doi.org/10.1073/pnas.1103045108, 2011. a
Shiraiwa, M., Pfrang, C., Koop, T., and Pöschl, U.: Kinetic multi-layer model of gas-particle interactions in aerosols and clouds (KM-GAP): linking condensation, evaporation and chemical reactions of organics, oxidants and water, Atmos. Chem. Phys., 12, 2777–2794, https://doi.org/10.5194/acp-12-2777-2012, 2012. a
Shiraiwa, M., Zuend, A., Bertram, A. K., and Seinfeld, J. H.: Gas-particle partitioning of atmospheric aerosols: interplay of physical state, non-ideal mixing and morphology, Phys. Chem. Chem. Phys., 15, 11441–11453, https://doi.org/10.1039/C3CP51595H, 2013. a
Shiraiwa, M., Li, Y., Tsimpidi, A. P., Karydis, V. A., Berkemeier, T., Pandis, S. N., Lelieveld, J., Koop, T., and Pöschl, U.: Global distribution of particle phase state in atmospheric secondary organic aerosols, Nat. Commun., 8, 15002, https://doi.org/10.1038/ncomms15002, 2017. a
Shrivastava, M., Cappa, C., Fan, J., Goldstein, A., Guenther, A., Jimenez, J., Kuang, C., Laskin, A., Martin, S., Ng, N., Petaja, T., Pierce, J., Rasch, P., Roldin, P., Seinfeld, J., Shilling, J., Smith, J., Thornton, J., Volkamer, R., Wang, J., Worsnop, D., Zaveri, R., Zelenyuk, A., and Zhang, Q.: Recent advances in understanding secondary organic aerosol: Implications for global climate forcing, Rev. Geophys., 55, 509–559, https://doi.org/10.1002/2016RG000540, 2017. a, b
Song, M., Liu, P. F., Hanna, S. J., Zaveri, R. A., Potter, K., You, Y., Martin, S. T., and Bertram, A. K.: Relative humidity-dependent viscosity of secondary organic material from toluene photo-oxidation and possible implications for organic particulate matter over megacities, Atmos. Chem. Phys., 16, 8817–8830, https://doi.org/10.5194/acp-16-8817-2016, 2016a. a
Song, Y. C., Haddrell, A. E., Bzdek, B. R., Reid, J. P., Bannan, T., Topping, D. O., Percival, C., and Cai, C.: Measurements and predictions of binary component aerosol particle viscosity, J. Phys. Chem. A, 120, 8123–8137, https://doi.org/10.1021/acs.jpca.6b07835, 2016b. a
Sun, Q. and Wexler, A. S.: Modeling urban and regional aerosols–condensation and evaporation near acid neutrality, Atmos. Environ., 32, 3527–3531, https://doi.org/10.1016/S1352-2310(98)00059-4, 1998. a
Vaden, T. D., Imre, D., Beránek, J., Shrivastava, M., and Zelenyuk, A.: Evaporation kinetics and phase of laboratory and ambient secondary organic aerosol, Proc. Natl. Acad. Sci., 108, 2190–2195, https://doi.org/10.1073/pnas.1013391108, 2011. a
Virtanen, A., Joutsensaari, J., Koop, T., Kannosto, J., Yli-Pirilä, P., Leskinen, J., Mäkelä, J. M., Holopainen, J. K., Pöschl, U., Kulmala, M., Worsnop, D. R., and Laaksonen, A.: An amorphous solid state of biogenic secondary organic aerosol particles, Nature, 467, 824–827, https://doi.org/10.1038/nature09455, 2010. a
Wexler, A. S. and Seinfeld, J. H.: The distribution of ammonium salts among a size and composition dispersed aerosol, Atmos. Environ., 24, 1231–1246, https://doi.org/10.1016/0960-1686(90)90088-5, 1990. a
Yarwood, G., Rao, S., Yocke, M., and Whitten, G.: Updates to the carbon bond chemical mechanism: CB05, Rep. RT-0400675, available at: http://www.camx.com/files/cb05_final_report_120805.aspx (last access: 21 September 2018), 2005. a
Yatavelli, R. L. N., Stark, H., Thompson, S. L., Kimmel, J. R., Cubison, M. J., Day, D. A., Campuzano-Jost, P., Palm, B. B., Hodzic, A., Thornton, J. A., Jayne, J. T., Worsnop, D. R., and Jimenez, J. L.: Semicontinuous measurements of gas–particle partitioning of organic acids in a ponderosa pine forest using a MOVI-HRToF-CIMS, Atmos. Chem. Phys., 14, 1527–1546, https://doi.org/10.5194/acp-14-1527-2014, 2014. a
Zhang, Y., Pun, B., Vijayaraghavan, K., Wu, S.-Y., Seigneur, C., Pandis, S. N., Jacobson, M. Z., Nenes, A., and Seinfeld, J. H.: Development and application of the Model of Aerosol Dynamics, Reaction, Ionization, and Dissolution (MADRID), J. Geophys. Res., 109, D01202, https://doi.org/10.1029/2003JD003501, 2004. a
Zhu, S., Sartelet, K., Healy, R., and Wenger, J.: Simulation of particle diversity and mixing state over Greater Paris: A model-measurement inter-comparison, Faraday Discuss., 189, 547–566, https://doi.org/10.1039/C5FD00175G, 2016. a
Zuend, A., Marcolli, C., Luo, B. P., and Peter, T.: A thermodynamic model of mixed organic-inorganic aerosols to predict activity coefficients, Atmos. Chem. Phys., 8, 4559–4593, https://doi.org/10.5194/acp-8-4559-2008, 2008. a, b, c