the Creative Commons Attribution 4.0 License.
the Creative Commons Attribution 4.0 License.
 | 02 Oct 2019
Relative humidity and O3 concentration as two prerequisites for sulfate formation
Yanhua Fang
Chunxiang Ye
Junxia Wang
Yusheng Wu
Weili Lin
Fanfan Xu
Sulfate formation mechanisms have been discussed extensively but are still disputed. In this work, a year-long particulate matter (PM2.5) sampling campaign was conducted together with measurements of gaseous pollutant concentrations and meteorological parameters in Beijing, China, from March 2012 to February 2013. The sulfur oxidation ratio (SOR), an indicator of secondary sulfate formation, displayed a clear summer peak and winter valley, even though no obvious seasonal variations in sulfate mass concentration were observed. A rapid rise in the SOR was found at a relative humidity (RH) threshold of ∼45 % or an O3 concentration threshold of ∼35 ppb, allowing us to first introduce the idea that RH and O3 concentrations are two prerequisites for rapid sulfate formation via multiphase reactions. In the case of the RH threshold, this is consistent with current understanding of the multiphase formation of sulfate, since it relates to the semisolid-to-liquid phase transition of atmospheric aerosols. Correlation analysis between SOR and aerosol water content (AWC) further backed this up. In the case of the O3 concentration threshold, this is consistent with the consumption of liquid oxidants in multiphase sulfate formation. The thresholds introduced here lead us to a better understanding of the sulfate formation mechanisms and sulfate formation variations. H2O2 might be the major oxidant of sulfate formation, since another liquid-phase oxidant, O3, has previously been shown to be unimportant. The seasonal variations in sulfate formation could be accounted for by variations in the RH and O3 prerequisites. For example, over the year-long study, the fastest SO2-to-sulfate conversion occurred in summer, which was associated with the highest values of O3 (and also H2O2) concentration and RH. The SOR also displayed variations with pollution levels; i.e. the SOR increased with PM2.5 in all seasons. Such variations were primarily associated with a transition from the slow gas-phase formation of sulfate to rapid multiphase reactions, since RH increased higher than its prerequisite value of around 45 % as pollution evolved. In addition, the self-catalytic nature of sulfate formation (i.e. the formation of hydrophilic sulfate aerosols under high RH conditions results in an increase in aerosol water content, which results in greater particle volume for further multiphase sulfate formation) also contributed to variations among the pollution scenarios.
- Article
(5039 KB) -
Supplement
(791 KB) - BibTeX
- EndNote


Beijing, the capital of China, suffers from serious air pollution due to its rapid economic growth and urbanisation (Hu et al., 2015). The chemical composition and sources of fine particulate matter (PM2.5) in Beijing have been studied extensively (Han et al., 2015; Lv et al., 2016; Zhang et al., 2013; Zheng et al., 2005). Secondary components, especially sulfate, nitrate, and ammonium (SNA), are the main contributors to PM2.5 (Huang et al., 2014). On the most severely polluted days, SNA accounts for more than half of total PM2.5 mass concentrations and plays a more important role than on clean days (Quan et al., 2014; Y. S. Wang et al., 2014; G. J. Zheng et al., 2015).
The kinetics and mechanisms of the formation of sulfate, a major component of SNA, are complex and remain unclear (Ervens, 2015; Harris et al., 2013; Warneck, 2018). For example, two key questions concerning sulfate formation are (1) exactly how various parameters (oxidants, catalysts, meteorological conditions, etc.) influence sulfate formation, and (2) how multiple formation routes compete and contribute together to sulfate formation under ambient conditions. In general, sulfate is produced from SO2 via gas-phase oxidation reactions involving the hydroxide radical (OH) and Criegee intermediates (Gleason et al., 1987; Sarwar et al., 2014; Vereecken et al., 2012), heterogeneous reactions (mainly on dust aerosols), and multiphase transformations with O3, H2O2, or O2 (catalysed by transition metal ions (TMIs) (i.e. TMIs + O2) and NO2 (NO2+O2)) as liquid-phase oxidants, which occur mainly in clouds but also in aerosol droplets near the ground (Zhu et al., 2011).
Due to the major role of multiphase transformations, sulfate production is presumed to be self-catalysed; i.e. the formation of hydrophilic sulfate aerosols under high relative humidity (RH) conditions results in an increase in aerosol water content (AWC), which results in greater particle volume for further multiphase sulfate formation (Cheng et al., 2016; Pan et al., 2009; Xu et al., 2017). Analyses of the correlation of sulfate formation with RH and AWC have been conducted to test this hypothesis, using the concept of the sulfur oxidation ratio (SOR), defined as the molar ratio of sulfate to total sulfur (the combination of sulfate and SO2). It is used to indicate the magnitude of the secondary formation of sulfate and expressed as (Wang et al., 2005)
where and represent the molar concentrations of sulfate and SO2, respectively. Even though regional transport or intrusion of SO2 or sulfate (or local sulfate emissions) would modify the SOR, it has still often been a relatively good proxy of secondary sulfate formation (i.e. local SO2-to-sulfate conversion). For example, Sun et al. (2014, 2013) found positive correlations between the SOR and RH, and observed rapid increases in SORs at elevated RH levels. Xu et al. (2017) found positive correlations of the SOR with both RH and AWC. Multiphase transformation routes, including O3 oxidation, TMIs + O2, and NO2+O2, are pH sensitive and suppressed at low pH (Seinfeld and Pandis, 2006). Sulfate production raises the acidity of aerosols, and therefore the multiphase transformations of sulfate are presumed to be self-constrained (Cheng et al., 2016). For example, a significant contribution from the O3 oxidation route can only be expected under alkaline conditions (e.g. sea salt); otherwise, O3 oxidation is a minor pathway for sulfate formation (Alexander et al., 2005; Sievering et al., 2004). How the self-constraining nature of sulfate formation influences the relative significance of the TMIs + O2 and NO2+O2 routes is still under debate. Cheng et al. (2016) proposed that the NO2+O2 route is important during severe haze events under neutral pH conditions (He et al., 2018; Wang et al., 2016). Guo et al. (2017) suggested that aerosols are acidic in Beijing (except for during the limited cases of dust or sea-salt events), casting doubt on the importance of the NO2+O2 route in sulfate formation (M. Liu et al., 2017). According to laboratory-based Raman spectroscopy studies, sulfate can be produced via the aqueous oxidation of SO2 by NO2+O2, with an SO2 reactive uptake coefficient of 10−5, which represents an atmospherically relevant value (Yu et al., 2018), whereas others have suggested that this route is of minor importance in the atmosphere (Li et al., 2018; Zhao et al., 2018). In addition, Xie et al. (2015) proposed that NO2 could enhance the formation of sulfate in certain cases, for example, in biomass burning plumes or dust storms (He et al., 2014). Evaluation of the contribution of TMIs + O2 reactions appears to be more complex since it depends on aerosol acidity, solubility, oxidation state, and the synergistic effects of different TMIs (Deguillaume et al., 2005; Warneck, 2018).
The compensating effects among AWC, aerosol acidity, and the concentrations of precursors and catalysts show that the kinetics and mechanisms of sulfate formation are highly complex. It can be inferred that there is competition between the various routes, with dependence on atmospheric conditions (e.g. seasonal and pollution-level variations) likely, but this has not received much research attention previously. Here, daily PM2.5 samples were collected in Beijing from March 2012 to February 2013 and their chemical composition was analysed. The main parameters that influenced sulfate formation (i.e. RH, O3 concentration, TMIs, etc.) were determined. This valuable dataset enabled us to explore (1) the specific role of each influencing factor in sulfate formation, and (2) how multiple sulfate formation routes compete in different seasons and under various pollution scenarios.
2.1 Measurements
2.1.1 Measurement stations
The two measurement stations are shown in Fig. 1. The Peking University (PKU) station (39.99∘ N, 116.30∘ E) is about 20 m above ground level on the campus of Peking University, Beijing, China (Liang et al., 2017). Daily PM2.5 samples were collected using a four-channel sampler (TH-16A; Wuhan Tianhong Instruments, China) at a flow rate of 16.7 L min−1 from 1 March 2012 to 28 February 2013. The gaseous pollutants SO2, NOx, and O3 were measured with a pulsed fluorescence SO2 analyser (Model 43i TLE; Thermo Fisher Scientific, Waltham, MA, USA), chemiluminescence NO–NO2–NOx analyser (Model 42i TL; Thermo Fisher Scientific), and an ultraviolet photometric O3 analyser (Model 49i; Thermo Fisher Scientific), respectively. Temperature and RH were also monitored (MSO; Met One Instruments, Grants Pass, OR, USA). Solar radiation data were obtained from the Beijing Meteorological Observatory Station (39.81∘ N, 116.47∘ E). Daily averages were used for all analyses conducted in this work.
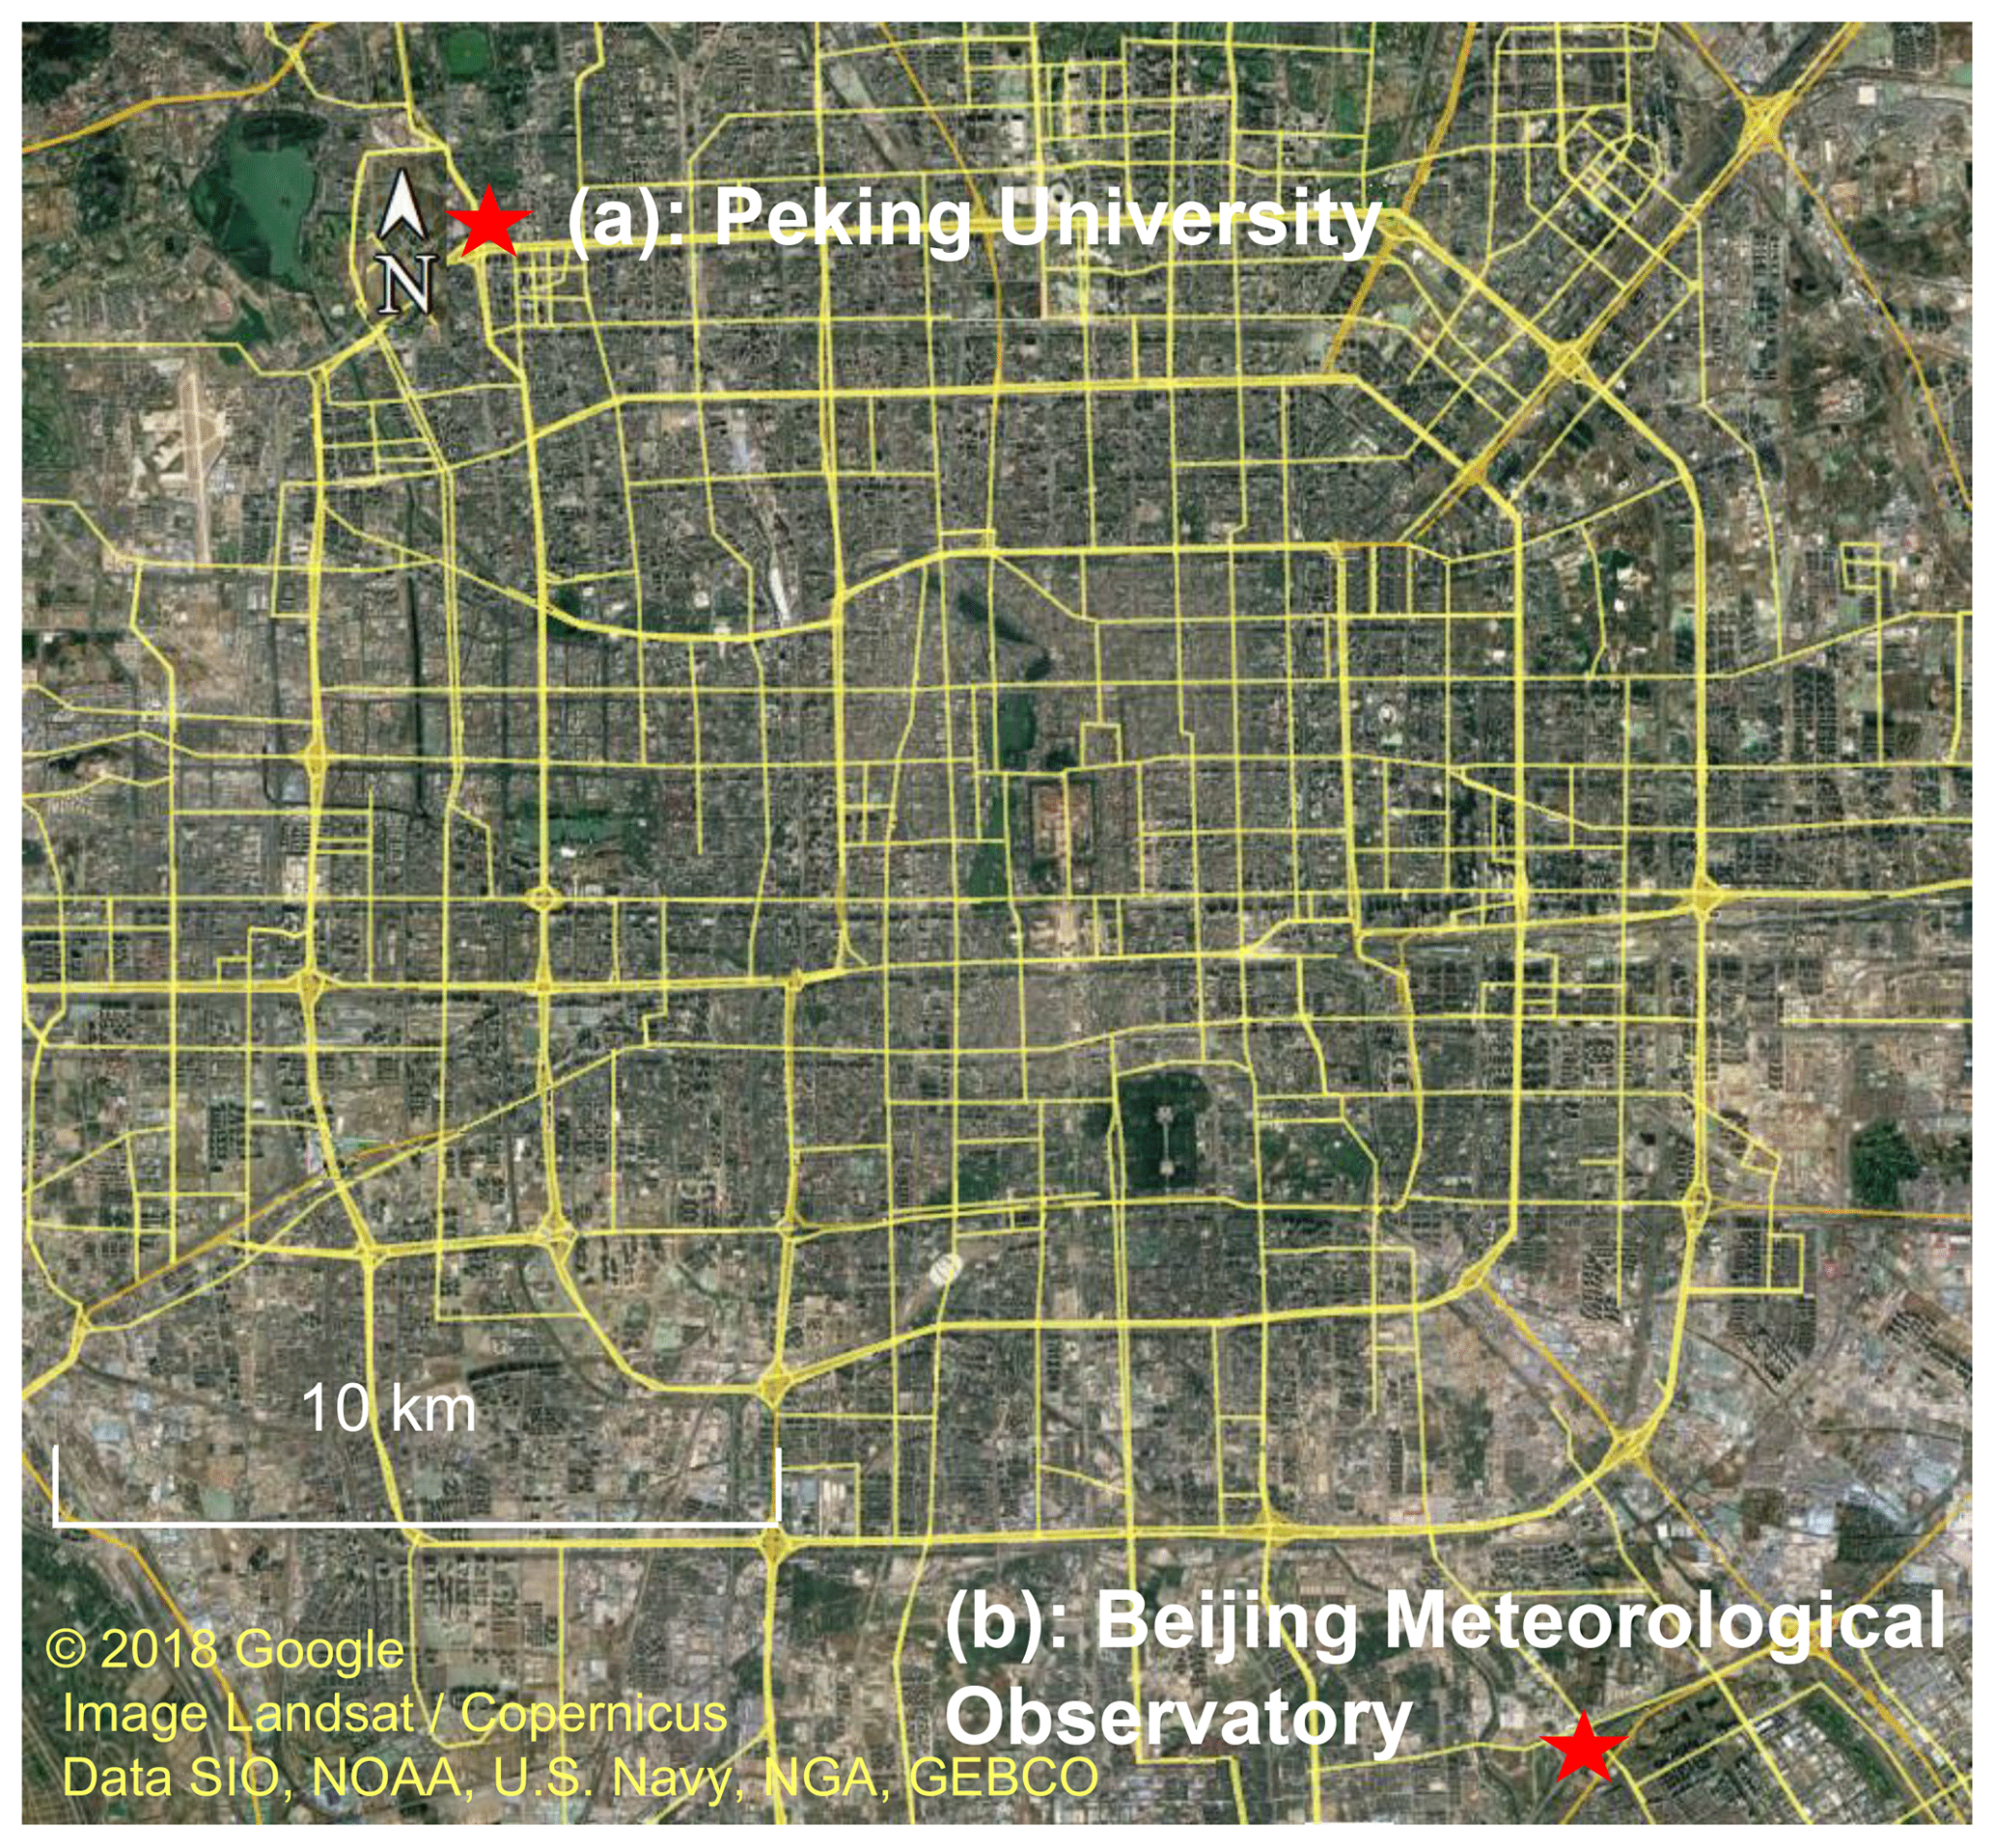
Figure 1Sample sites in this study (red stars): (a) Peking University and (b) Beijing Meteorological Observatory.
2.1.2 Filter sampling and analysis
Each PM2.5 sample set consisted of one quartz filter (47 mm; Whatman QM/A, Maidstone, England) and three Teflon filters (47 mm; pore size 2 µm; Whatman PTFE). The quartz filters were baked for 5.5 h at 550 ∘C before use. The Teflon filters were weighed in a weighing room before and after sampling using a delta range balance (0.01 mg/0.1 mg precision; AX105; Mettler Toledo, Switzerland). To minimise contamination, all Teflon filters were placed in a super-clean room (temperature of 22±1 ∘C; RH of 40±2 %) for 24 h before being weighed. After sampling, all filters were stored at −20 ∘C prior to analysis.
Water-soluble cations (Na+, , K+, Mg2+, and Ca2+) and anions (, , Cl−, and F−) were measured using ion chromatography (ICS-2500 and ICS-2000; DIONEX, USA). Trace elements (Na, Mg, Al, Ca, Ti, Cr, Mn, Fe, Co, Ni, Cu, Zn, Se, Mo, Cd, Ba, Tl, Pb, Th, and U) were analysed by inductively coupled plasma–mass spectrometry (ICP–MS, X-Series; Thermo Fisher Scientific). Organic carbon (OC) and elemental carbon (EC) were measured using a thermal/optical carbon analyser (RT-4; Sunset Laboratory Inc., Tigard, OR, USA). The procedure for the measurement of water-soluble Fe has been described in detail in a previous study (Xu et al., 2018).
2.2 Estimation of the mass concentrations of PM2.5 components
The chemical components of PM2.5 were divided into eight categories: sulfate, nitrate, ammonium, organic matter (OM), EC, minerals, trace element oxides (TEOs), and others. The mass concentrations of OM, minerals, and TEOs were calculated from OC, Al, and trace element concentrations, respectively. The details of this method are provided in the Supplement. For minerals, validation of the method using only Al to represent all minerals is shown in Fig. S1 in the Supplement. TEOs mostly originated from anthropogenic sources (Fig. S2).
2.3 Quality assurance and quality control
The PM2.5 sampling instruments were cleaned and calibrated every 2–3 months. Before the daily filter replacement, filter plates were scrubbed with degreasing cotton that had been immersed in dichloromethane. For water-soluble ions, OC∕EC, and trace element measurements, standard solutions were analysed before each series of measurements. The R2 values of the calibration curves were all >0.999. For water-soluble ion measurements, beakers, tweezers, and vials were cleaned with deionised water (18.2 MΩ; Milli-Q, USA) three times before use. Certified reference standards (National Institute of Metrology, China) were used for calibration. For OC∕EC measurements, tweezers and scissors were scrubbed with degreasing cotton immersed in dichloromethane for every filter. Total organic carbon (TOC) was calculated based on calibration with external standard solutions. For trace element measurements, containers and tweezers were cleaned three times with nitric acid before use, and the analysis of a certified reference standard (NIST SRM-2783) was used to verify accuracy. The recovery of all measured trace elements fell within ±20 % of their certified values. For gaseous pollutants and meteorological parameters, all instruments were maintained and calibrated weekly based on manufacturers' protocols.
3.1 General description
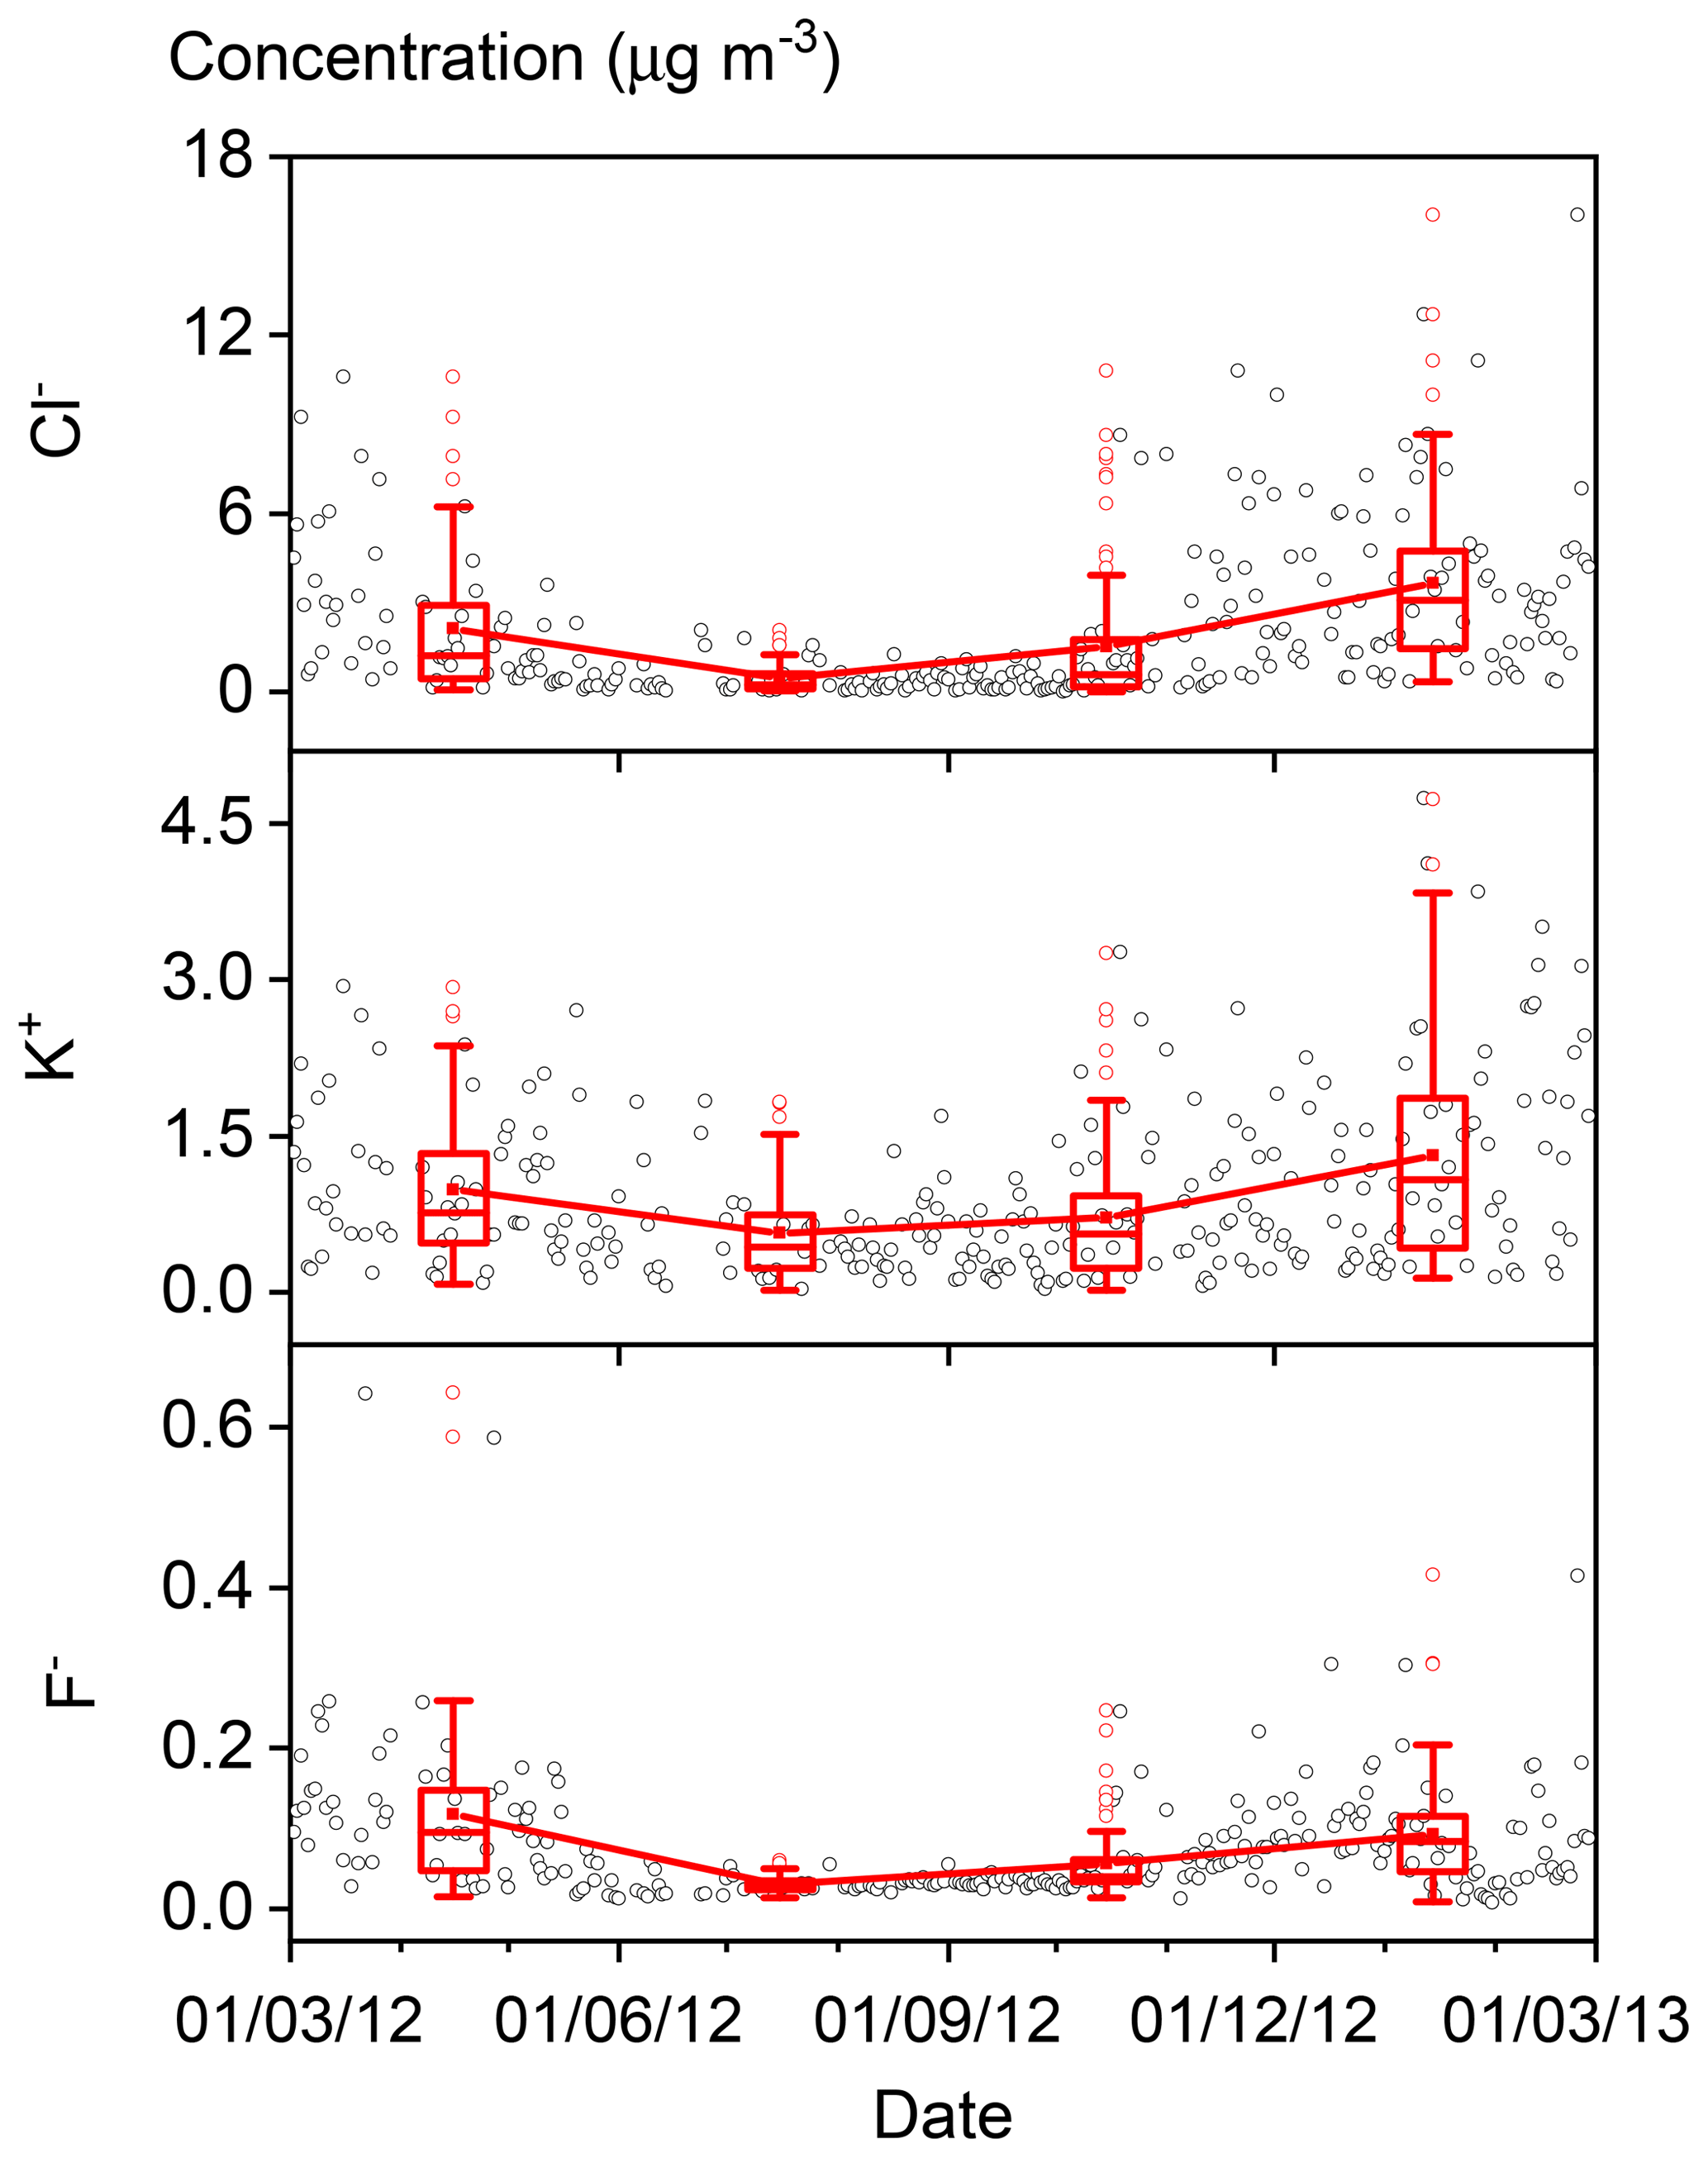
The annual and seasonal mean (± 1 standard deviation; SD) concentrations of PM2.5 and its seven major known components are summarised in Table 1. The annual mean PM2.5 concentration was 84.1 (±63.1) µg m−3, which is more than 2 times greater than the Chinese National Ambient Air Standard annual mean concentration of 35 µg m−3. On 145 of the 318 (46 %) measurement days, daily mean PM2.5 concentrations were above the Chinese National Ambient Air Standard 24 h mean concentration of 75 µg m−3. Time series of PM2.5 concentrations and its seven major known components are shown in Fig. 2. Seasonal variations in PM2.5 loading are obvious, with spring and winter peaks and summer and autumn valleys. OM and EC concentrations displayed common seasonal variations, with a plateau from mid-October to mid-February and a valley in summer (Fig. 2), which resembles the variations in PM2.5, K+, Cl−, and F− (Figs. 2 and 3). The seasonal variations in minerals also indicate an important contribution of dust events to PM2.5 loading during spring, which is a well-known phenomenon (Zhang et al., 2003; Zhuang et al., 2001). TEOs displayed no obvious seasonal variations (Fig. 2). SNA accounted for more than one-third of PM2.5 annually and showed similar seasonal variations to that of PM2.5 (Fig. 2), with the notable exception that sulfate became the highest contributor to PM2.5 (∼25 %) in summer (Fig. 4). The summer peak in sulfate could be accounted for by fast secondary formation, as will be discussed later.
Table 1Annual and seasonal mean concentrations (µg m−3, ±1 standard deviation) of PM2.5 and its seven major known components.

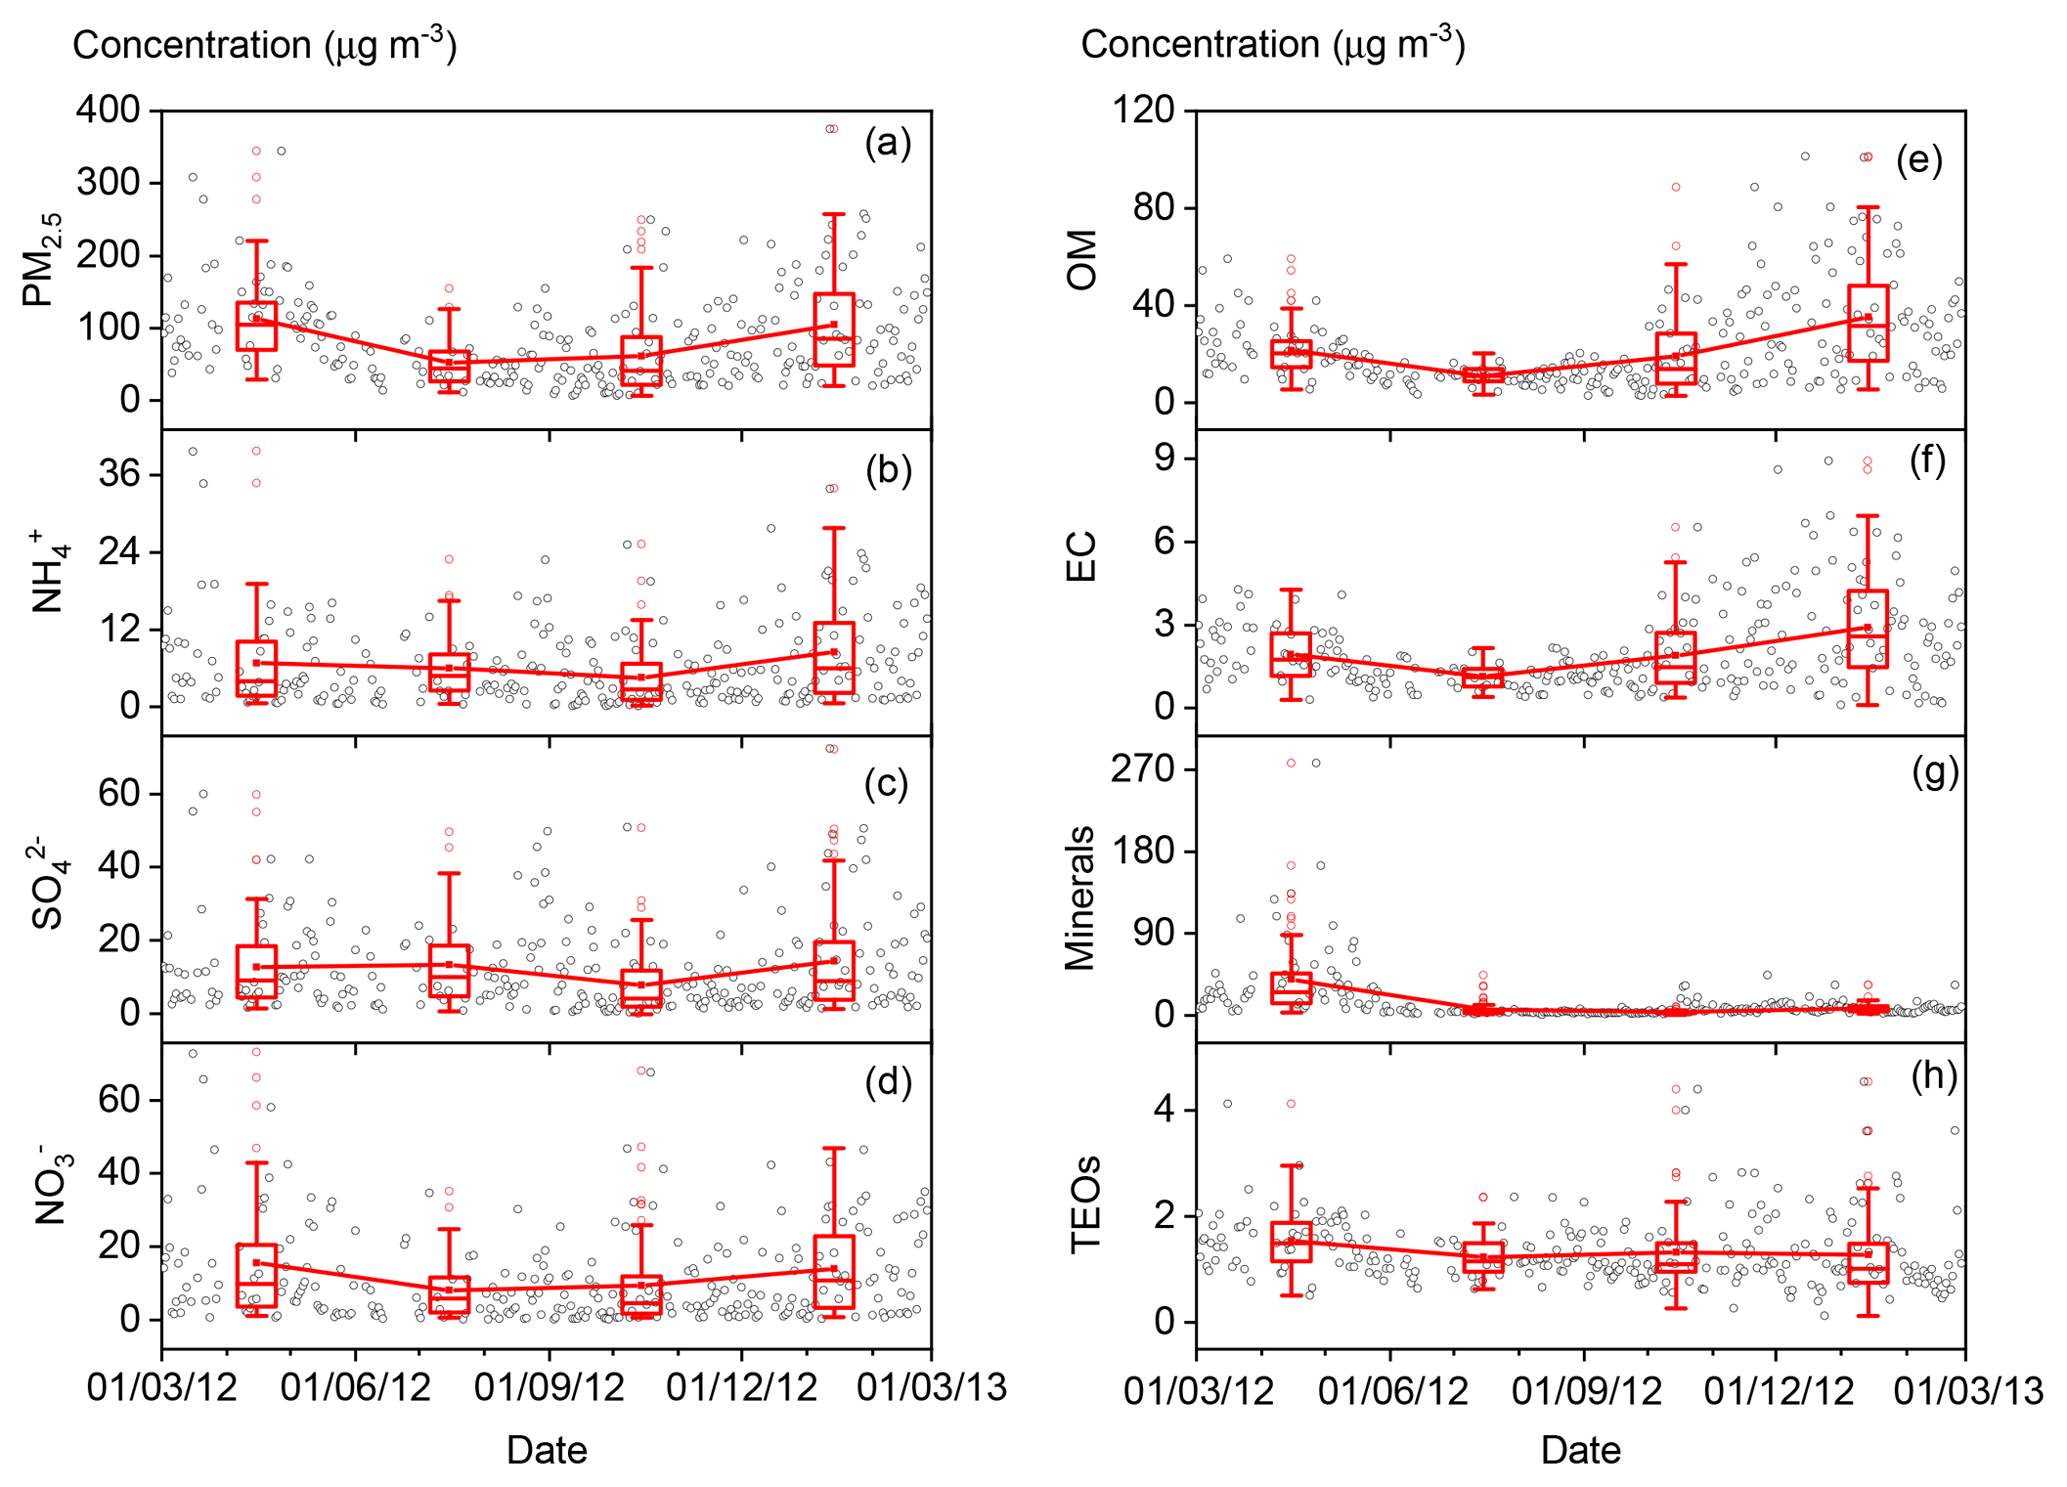
Figure 2Time series of fine particulate matter (PM2.5) concentrations and its seven major known components from March 2012 to 28 February 2013 (open black circles). The boxes represent, from top to bottom, the 75th, 50th, and 25th percentiles for each season. The whiskers, solid red squares, and open red circles represent 1.5 times the interquartile range (IQR), seasonal mean values, and outlier data points, respectively.
On an annual basis, the seven major known components accounted for over 80 % of PM2.5 (Fig. 4). The diversity of the seasonal variations in PM2.5 and its major components found in our study imply that there were seasonal variations in both the primary sources and secondary formation of PM2.5.
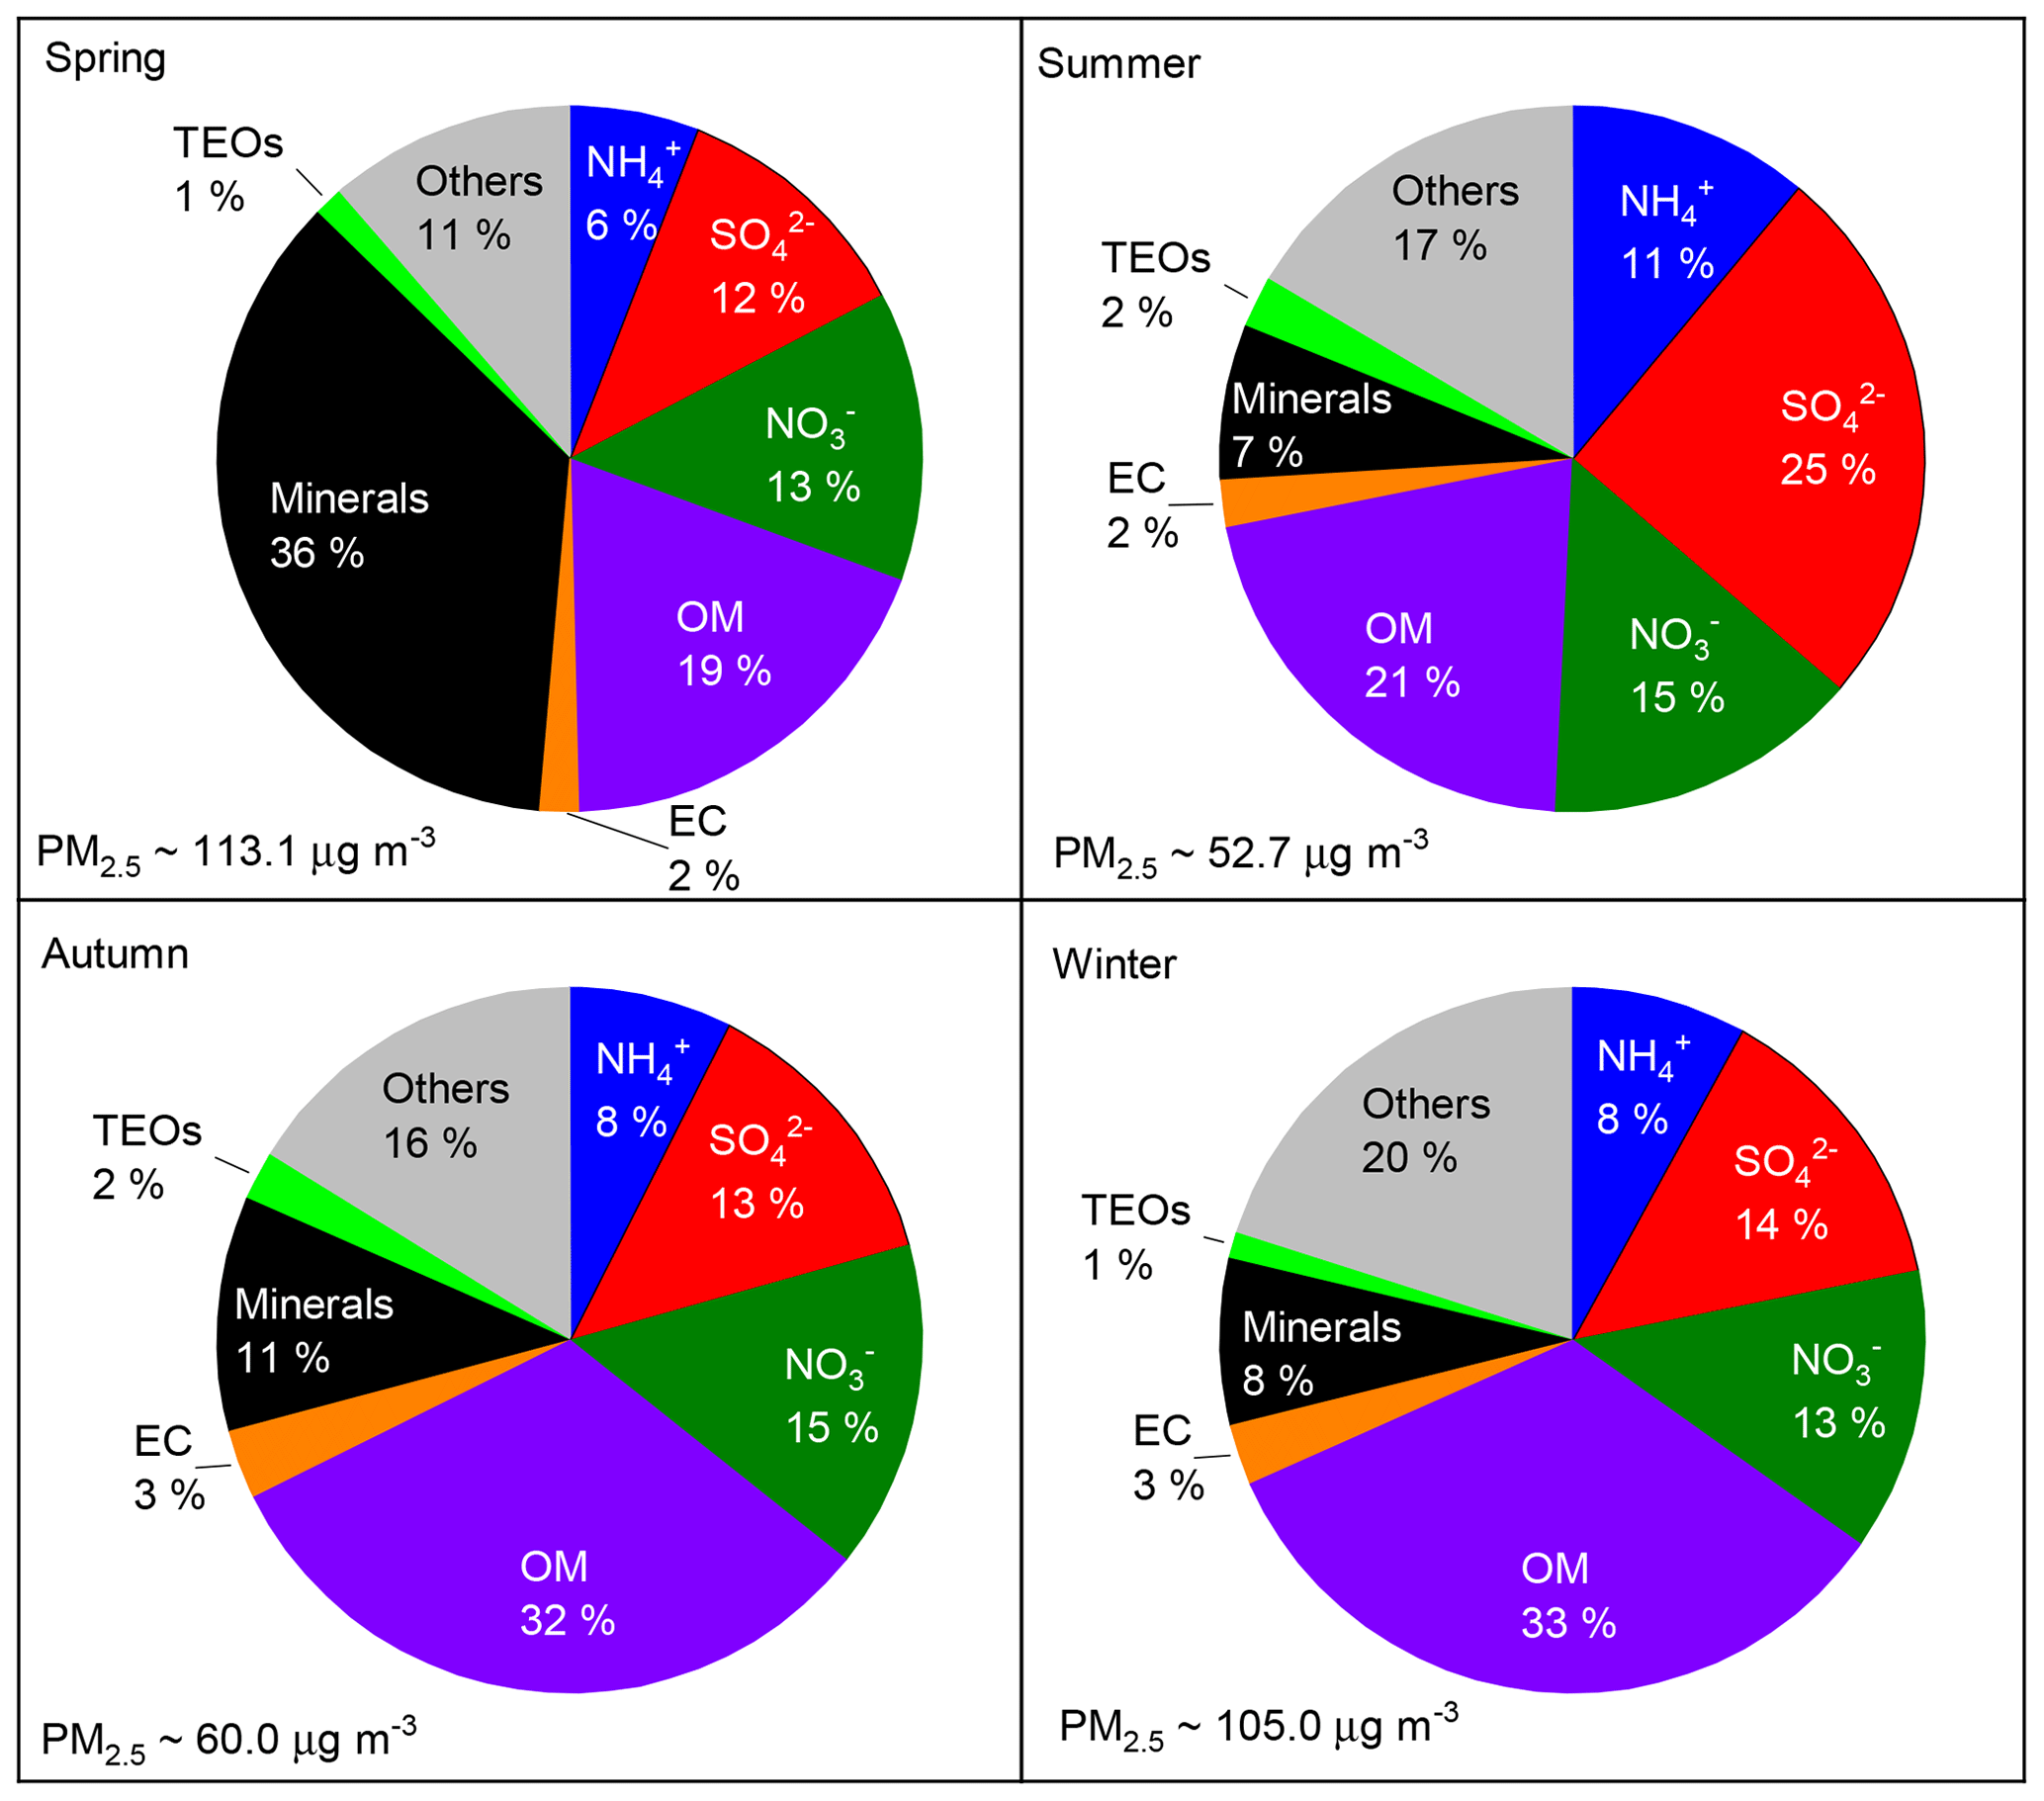
Figure 4Seasonal variations in PM2.5 and its eight major components from 1 March 2012 to 28 February 2013.
3.2 Influence of various parameters on sulfate formation
To further explore the parameters that influenced sulfate formation, SORs were plotted against RH and the concentrations of O3, NO2, and Fe (total Fe, including both water-soluble and water-insoluble Fe), which is a major tracer of transition metals (Figs. 5 and 6).
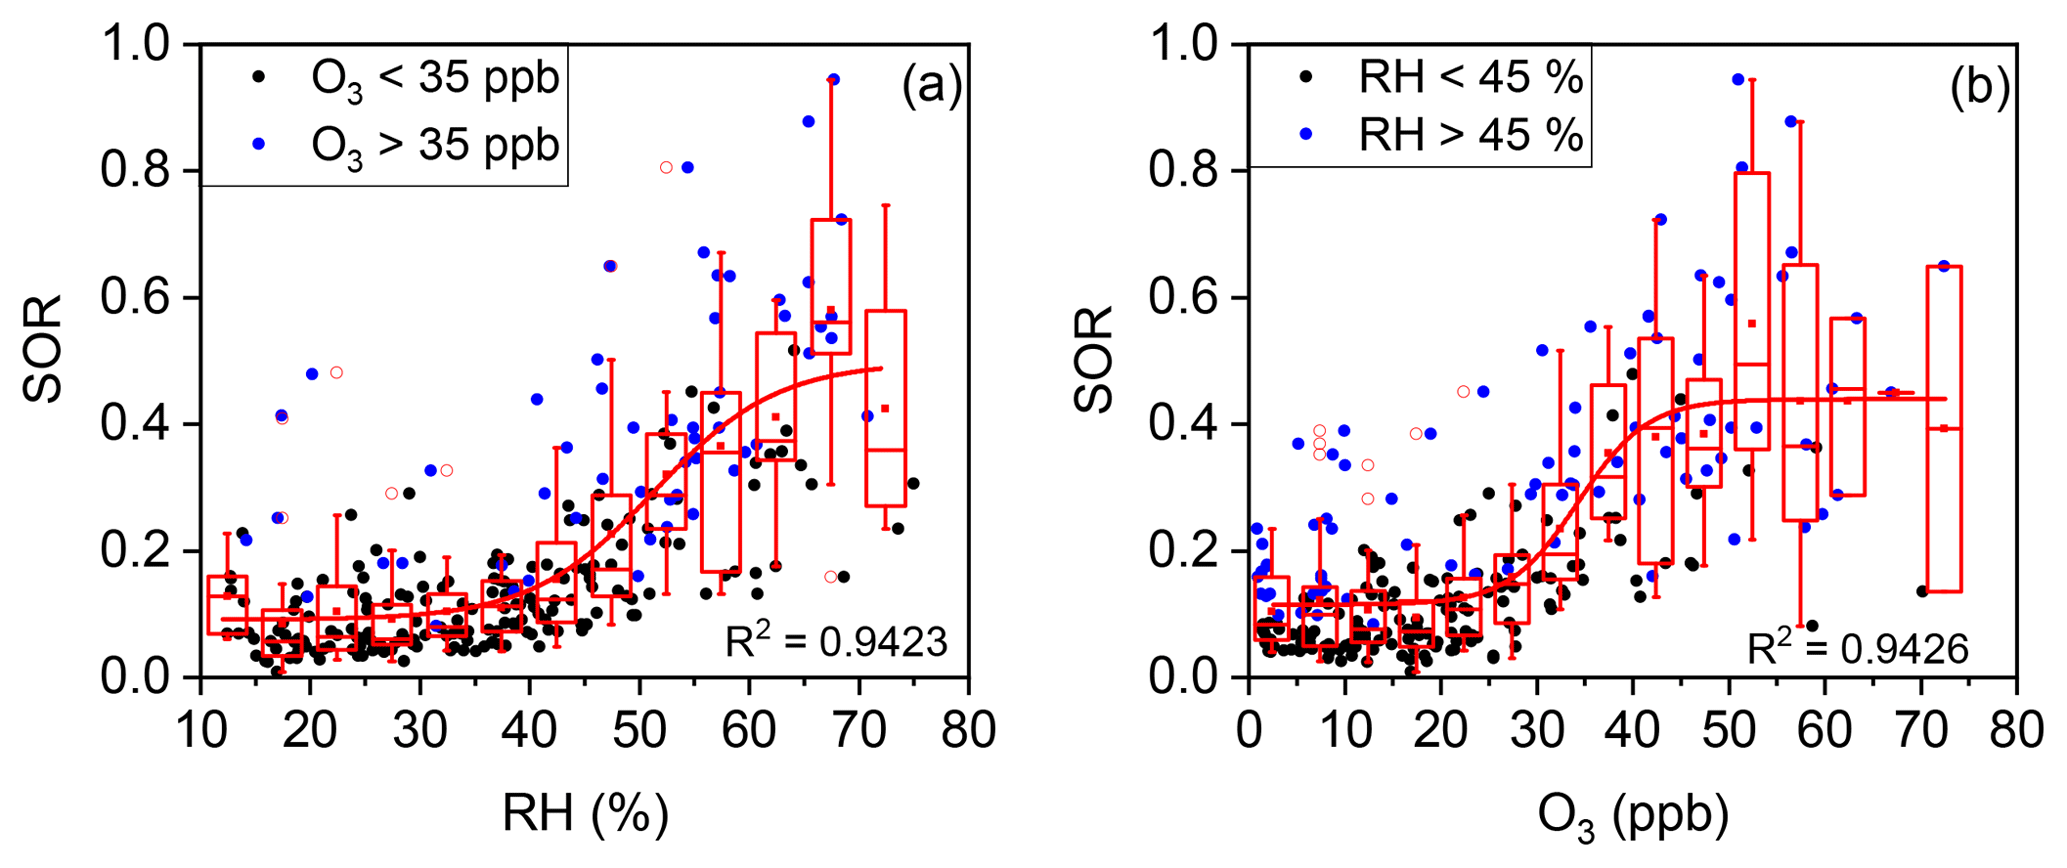
Figure 5(a) Plot of the SOR against RH grouped by O3 concentration. The solid blue circles represent O3>35 ppb and the solid black circles represent O3<35 ppb. (b) Plot of the SOR against O3 grouped by RH. The solid blue circles represent RH >45 % and the solid black circles represent RH <45 %. The boxes represent, from top to bottom, the 75th, 50th, and 25th percentiles in each bin (ΔRH =5 %; ΔO3=5 ppb). The whiskers, solid red squares, and open red circles represent 1.5 times the IQR, mean values, and outlier data points, respectively. The red lines are best fits to mean values based on a sigmoid function. Data for days with rain or snow were excluded from these plots.
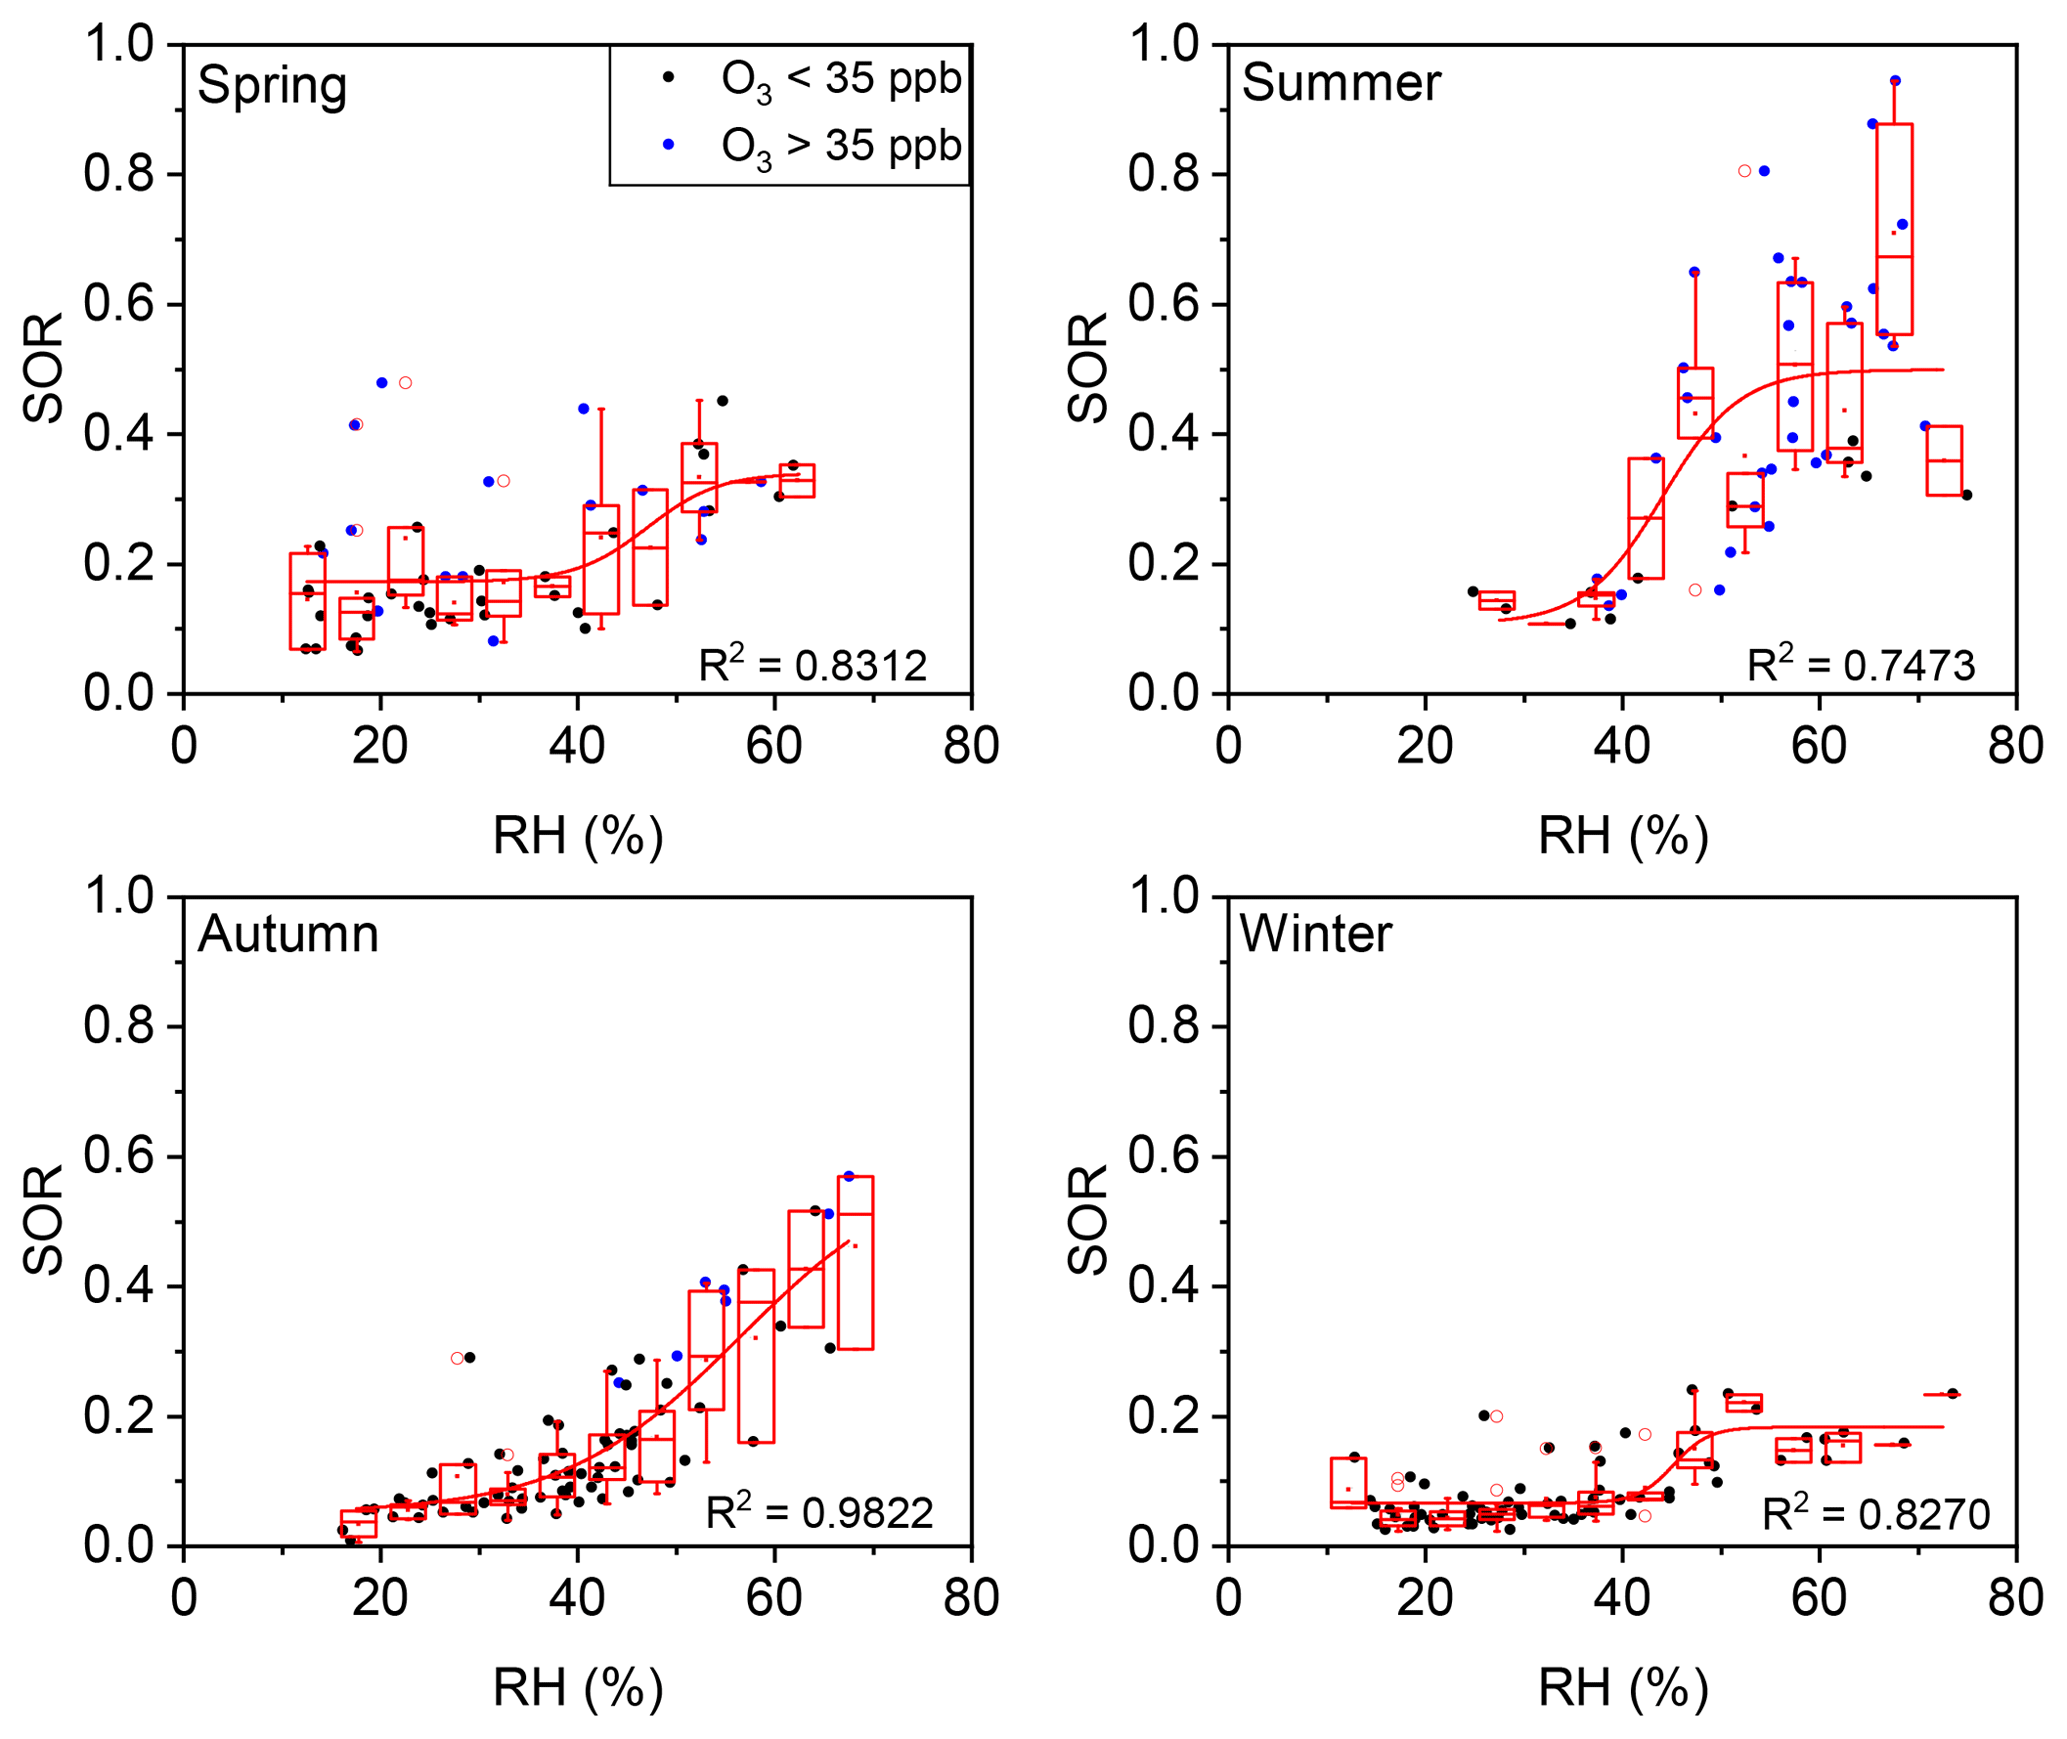
Figure 6Plot of SOR against RH grouped by O3 concentration in four seasons. The solid blue circles represent O3>35 ppb and the solid black circles represent O3<35 ppb. The boxes represent, from top to bottom, the 75th, 50th, and 25th percentiles in each bin (ΔRH =5 %). The whiskers, solid red squares, and open red circles represent 1.5 times the IQR, mean values, and outlier data points, respectively. The red lines are best fits to mean values based on a sigmoid function. Data for days with rain or snow were excluded from these plots.
As shown in Fig. 5a, an RH threshold of ∼45 % was critical for efficient SO2 oxidation (i.e. a high SOR). Such a threshold effect was thought to be reasonable given that AWC increases sharply when RH was above a threshold of 45 %, at which the aerosol undergoes a phase transition from a (semi-)solid particle to a droplet (Pan et al., 2009; Russell and Ming, 2002). Further correlation analysis between SOR and AWC further supports that the multiphase reactions are responsible for sulfate formation (Fig. S3). Our observation of a daily average RH threshold of ∼45 % is in line with previous reports of 40 %–50 % (Liu et al., 2015; Quan et al., 2015; Xu et al., 2017; Yang et al., 2015; G. J. Zheng et al., 2015) but is slightly lower than the in situ phase transition threshold RH of 50 %–60 % previously observed in Beijing (Y. C. Liu et al., 2017). Correlation analysis of SOR and RH (or AWC) has often been conducted in previous studies. For example, Wang et al. (2005) found a weak positive correlation of SORs with RH (R=0.38), while Sun et al. (2006) found a strong positive correlation (R=0.96). However, the analysis in the present work and those of a few previous studies revealed that the relationship between the SOR and RH is nonlinear (Sun et al., 2013, 2014; G. J. Zheng et al., 2015). In fact, the RH threshold suggests that high RH (or AWC) is a prerequisite for fast sulfate formation via multiphase reactions, which are known to account for the majority of sulfate accumulation.
From the large scattering of data points around the fit line in Fig. 5a, it might be inferred that RH was not the only prerequisite for fast SO2-to-sulfate conversion. As shown in Fig. 5b, a significant increase in the SOR was also observed at an O3 concentration threshold of ∼35 ppb. High O3 concentrations (i.e. >35 ppb) were accompanied by high SOR values of ∼0.4 (right-hand side of Fig. 5b). Correlation analyses of SORs with O3 have been conducted but inconsistent results were reported. Wang et al. (2005) found a weak positive correlation between SORs and O3 (R=0.47) for continuous observations in Beijing during 2001–2003. However, Liu et al. (2015) found a weak negative correlation between SORs and O3 (, p=0.01) during a haze episode in September 2011. Zhang et al. (2018) found no correlation between SORs and O3 during winter haze days in 2015. Quan et al. (2015) found that the SOR decreased with O3 when O3 concentrations were lower than 15 ppb but increased with O3 when O3 concentrations were higher than 15 ppb, for observations made during autumn and winter 2012. In the present study, our observations revealed that the relationship between the SOR and O3 concentration, like RH, was nonlinear and that a high O3 concentration was another prerequisite for fast sulfate formation. Such a conclusion was a surprise first, since O3 oxidation was not thought to be a major route for SO2-to-sulfate conversion (He et al., 2018; Sievering et al., 2004). However, as a primary precursor to OH radicals and H2O2 (via HO2) (Lelieveld et al., 2016; Lu et al., 2017), high O3 concentrations (e.g. >35 ppb) correspond to a high concentration of oxidants, which favours multiphase sulfate formation and thus a high SOR, whereas low O3 concentrations suggest a lack of available oxidants for multiphase SO2-to-sulfate conversion and thus a low SOR. In addition, the simultaneous occurrence of low SORs and low O3 concentrations had a secondary cause. Low O3 concentrations in the Beijing urban area were often due to the titration of O3 by NO (Li et al., 2016), which accumulated together with SO2 (Fig. S4). The accumulation of SO2, which “diluted” the SOR (Eq. 1), was thus naturally accompanied by the titration of O3. The L-shaped dependence of the SOR on several other primary pollutants, such as EC, NO, and Se (Fig. S5), further confirmed this secondary cause. Therefore, the accumulation of primary pollutants might also help to explain the low SOR values of ∼0.1 on the left-hand side of Fig. 5b, in addition to the lack of available oxidants for multiphase SO2-to-sulfate conversion.
The large scattering of data points around the fit line in Fig. 5b suggests that O3 concentration, like RH, was not the only prerequisite for fast SO2-to-sulfate conversion. The dependence of the SOR on RH was separated into low (<35 ppb) and high (>35 ppb) O3 groups (solid black circles and solid blue circles, respectively, in Fig. 5a). SOR values above the fit line are found mostly for the high O3 group. After the dependence of the SOR on O3 concentration was separated into low (<45 %) and high (>45 %) RH groups (solid black circles and solid blue circles, respectively, in Fig. 5b), a similar pattern was found for the high RH group. In other words, fast multiphase SO2-to-sulfate conversion could only occur when both O3 and RH exceeded their respective thresholds simultaneously.
The seasonal variations of such thresholds of RH and O3 were further discussed. As show in Fig. 6, the RH threshold was roughly around 45 % during all four seasons in Beijing, while the threshold of O3 varied among seasons (Fig. 7). A turning point of 25–40 ppb was observed for fast SOR increase in spring, summer, and autumn, while the turning point is not clear due to lack of high O3 data in winter. The variation of O3 threshold value might be due to the shift of O3–H2O2 relationship which might be modified by temperature, etc. in different seasons. Despite of the variation of thresholds of RH and O3 in different seasons or even in different sampling locations (not discussed here), the thresholds of RH and O3 for fast sulfate formation further found in our study have its implications on the sulfate formation mechanism (see below).
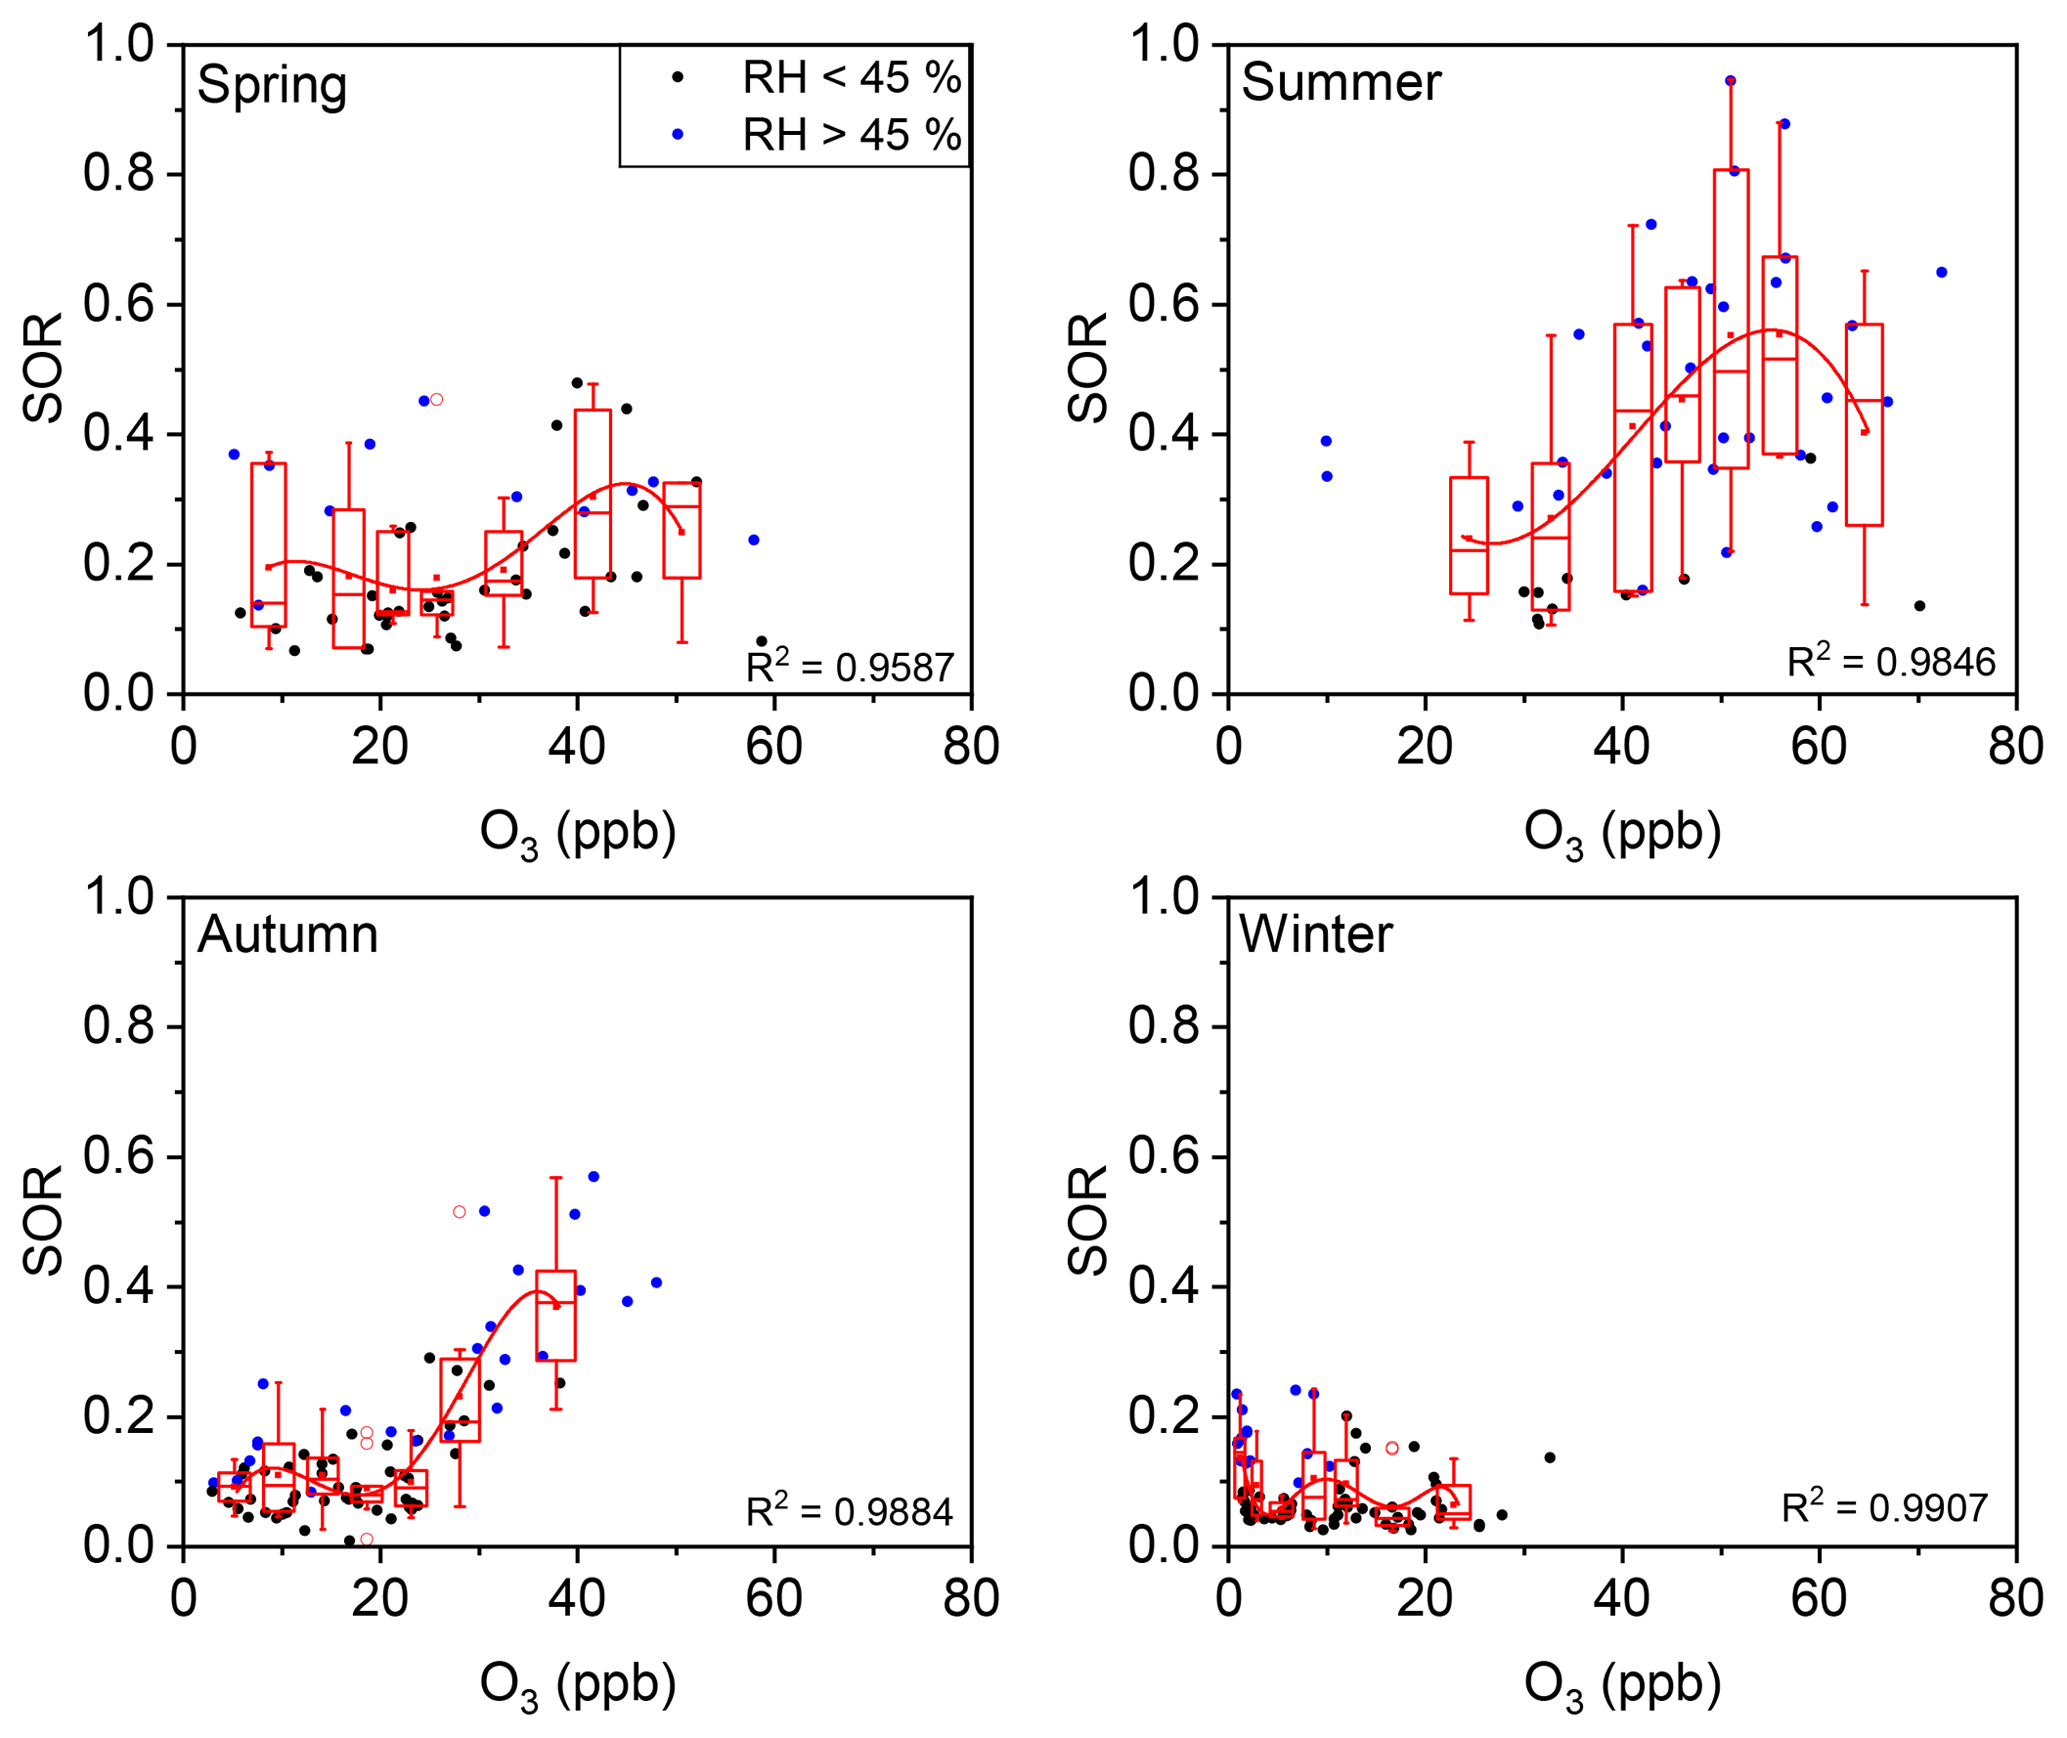
Figure 7Plot of the SOR against O3 grouped by RH. The solid blue circles represent RH >45 % and the solid black circles represent RH <45 %. The boxes represent, from top to bottom, the 75th, 50th, and 25th percentiles in each bin. The bin widths were set such that there was an approximately equal number of data points in each bin. The whiskers, solid red squares, and open red circles represent 1.5 times the IQR, mean values, and outlier data points, respectively. The red lines are best fits to mean values based on polynomial functions. Data for days with rain or snow were excluded from these plots.
The SOR was further plotted against Fe and NO2. No clear dependence of the SOR on concentrations of Fe or NO2 was found (Fig. 8a and b). Possible reasons and implications of this result will be discussed in the following section.

Figure 8Plots of SORs against (a) Fe and (b) NO2. Plots of Fe against (c) RH and (d) O3. Data for days with rain or snow were excluded from these plots.
3.3 Implications for sulfate formation mechanisms
Our observations of the factors that influence sulfate formation have implications for sulfate formation routes and its variations among seasons and pollution conditions.
In retrospect, thresholds in RH and O3 concentrations were found to be critical to the SOR, suggesting that AWC and liquid-phase oxidant were two prerequisites for fast multiphase SO2-to-sulfate conversion. H2O2 and O3 are the two liquid-phase oxidants which are responsible for sulfate formation. The O3 oxidation route was proposed to not be important in high aerosol acidity areas, such as Beijing (Guo et al., 2017; Sievering et al., 2004). A recent study on aerosol pH in Beijing showed that the PM2.5 was acidic (RH >30 %) (Ding et al., 2019), confirming a minor contribution from O3 oxidation. H2O2 was then the only possible oxidant responsible for sulfate formation. Although direct measurements of aqueous H2O2 were not performed in this study, the H2O2 concentrations in Beijing reported by Fu (2014) were found to be positively correlated with temperature. By assuming the reported H2O2–temperature relationship is applicable to our measurements, a proxy H2O2 concentration was then estimated. As shown in Fig. S6, maximum concentration of H2O2 in summer is expected and confirmed, which is in line with the fastest sulfate formation in summer all over the measurement year. SOR was further plotted against H2O2 and positive correlation was found between them (Fig. S7). In addition, coincident increases in the concentration of H2O2 and PM2.5 in winter of Beijing also led to an important role of the H2O2 oxidation route in sulfate formation (Ye et al., 2018). Based on the above discussions, we propose that H2O2 might be the major oxidant for sulfate formation in Beijing.
The plot of SORs against Fe, the dominant transition metal species, shows no clear dependence (Figs. 8a and S8). Similarly, the plot of SORs against NO2 shows no clear dependence either (Fig. 8b). If Fe acted as a catalyst, its concentration might not be directly proportional to SORs. Therefore, such a pattern does not safely exclude TMIs + O2 as a major route for sulfate formation. Several laboratory studies excluded NO2 as a direct oxidant in SO2-to-sulfate conversion. For example, Zhao et al. (2018) tested the oxidation of SO2 by NO2 in an N2 atmosphere and concluded that NO2 is not an important oxidant, since NO2 was more likely to undergo disproportionation (Li et al., 2018). However, Yu et al. (2018) further explored this reaction, and found that the reaction rate was 2–3 orders of magnitude greater in an O2+N2 atmosphere, indicating potentially important roles of NO2+O2 oxidation in sulfate formation (He et al., 2014; Ma et al., 2018). As with Fe, if NO2 acted as a catalyst, its concentration might not be directly proportional to that of sulfate. Therefore, such a pattern does not safely exclude NO2+O2 as a major route for sulfate formation either. Although direct aerosol pH measurement is not available here, previous studies have reported a mean aerosol pH value of 4.2 with a low limit of 3.0 in Beijing (Ding et al., 2019; M. Liu et al., 2017), which suggests that several routes of sulfate formation, including NO2+O2, TMIs + O2, O3 oxidation, etc., are suppressed. Hence, we carefully propose here that neither TMIs + O2 nor NO2+O2 seem to be a major route for sulfate formation.
On one hand, a direct measurement of aerosol pH is also urgently needed in the future to examine our proposal here; on the other hand, our proposal here has further implication on the understanding of sulfate formation. Previously, aerosol surface area and concentrations of Fe, Mn, and NO2 were used in model evaluations of catalytic sulfate formation in the boundary layer (Y. Wang et al., 2014; B. Zheng et al., 2015). However, our proposals here suggest that a careful reassessment of such calculations is required. In addition, model calculations have often suggested important contributions of in-cloud processes to sulfate accumulation near the ground (Barth et al., 2000), although few observational constraints are available for confirmation of these model results (Harris et al., 2014; Shen et al., 2012). The O3 concentration and RH prerequisites found in the present work might indicate a major role of in situ sulfate formation in the boundary layer, via multiphase reactions with H2O2 as the main oxidant, rather than in-cloud processes and intrusion from the free troposphere.
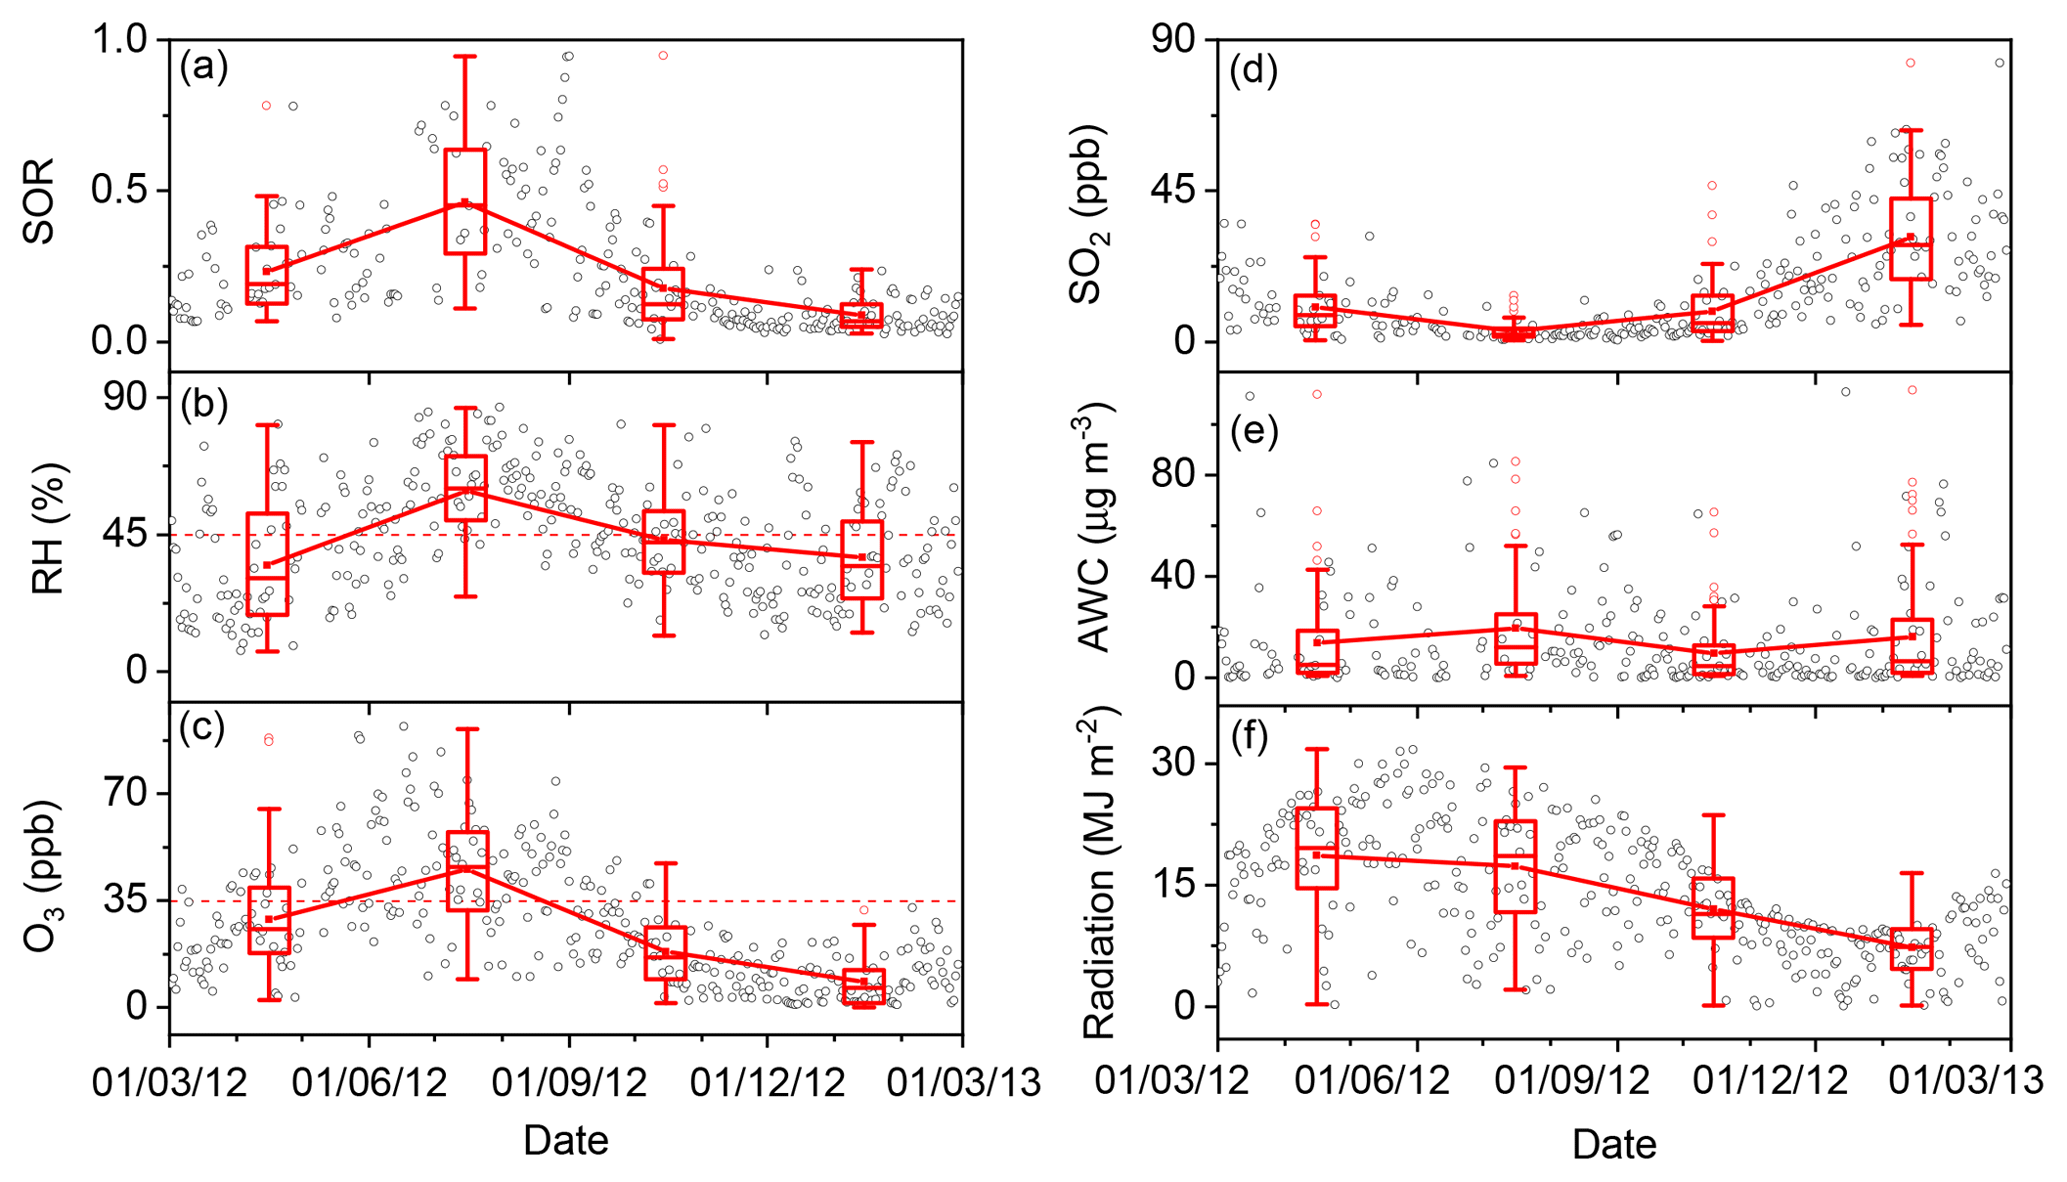
Figure 9Time series of (a) SORs, (b) RH, (c) O3, (d) SO2, (e) aerosol water content (AWC), and (f) solar radiation from 1 March 2012 to 28 February 2013 (open black circles). The boxes represent, from top to bottom, the 75th, 50th, and 25th percentiles for each season. The whiskers, solid red squares, and open red circles represent 1.5 times the IQR, seasonal mean values, and outlier data points, respectively. The horizontal dashed lines in panels (b) and (c) represent thresholds of RH =45 % and O3=35 ppb, respectively.
As the two prerequisites showed strong seasonal and pollution-level variations over the measurement year, the SOR exhibited corresponding variations. As shown in Fig. 9, SORs displayed clear seasonal variations, with the highest value (±1 SD) of 0.46 (±0.22) in summer, followed by spring (0.23±0.14), autumn (0.18±0.15), and winter (0.09±0.05). The highest SOR (i.e. fastest SO2-to-sulfate conversion rate) was found in summer, which is not surprising because the ambient conditions in summer were conducive SO2-to-sulfate conversion (Wang et al., 2005). RH and O3 concentrations in summer were not only the highest in the year but on average were also both higher than their thresholds of 45 % and 35 ppb, respectively, which was unique among the four seasons. In summer, the median and mean (±1 SD) RH levels were 57.4 % and 57.6 (±13.6) %, respectively, and the median and mean O3 concentrations were 46.9 ppb and 46.0 (±18.3) ppb. It should be noted that the median and mean SO2 concentrations were 2.6 and 4.0 (±3.7) ppb, respectively, which were the lowest in the year. Despite the low concentrations of SO2, there were considerable sulfate concentrations (Figs. 2 and 9), which can be accounted for by fast SO2-to-sulfate conversion. Although the rapid accumulation of secondary sulfate during winter haze days in Beijing has been widely reported (Y. S. Wang et al., 2014; G. J. Zheng et al., 2015), the lowest SOR was observed during winter in the present study (Fig. 9a), which is consistent with previous observations (Wang et al., 2005). On winter haze days, RH values of up to 73.6 % and PM2.5 mass loadings of up to 375.3 µg m−3 were observed. Therefore, AWC was not the limiting factor in SO2-to-sulfate conversion (Fig. 9b and e). The SO2-to-sulfate conversion rate in winter could have been limited by the reduced concentration of oxidants (Fig. 9c) as a result of both high emissions of the primary pollutant NO (Fig. S9) and low solar radiation levels (Fig. 9f). Sulfate concentrations in winter were comparable to those in summer, which might have been driven by high SO2 concentrations in winter (Fig. 9d), despite slow SO2-to-sulfate conversion. The lower boundary layer height in winter relative to other seasons would also have encouraged the accumulation of both PM2.5 and its components, including sulfate (Gao et al., 2015; Zhang et al., 2015). The SORs in spring and autumn were comparable and moderate, possibly representing a transition in conditions between summer and winter.
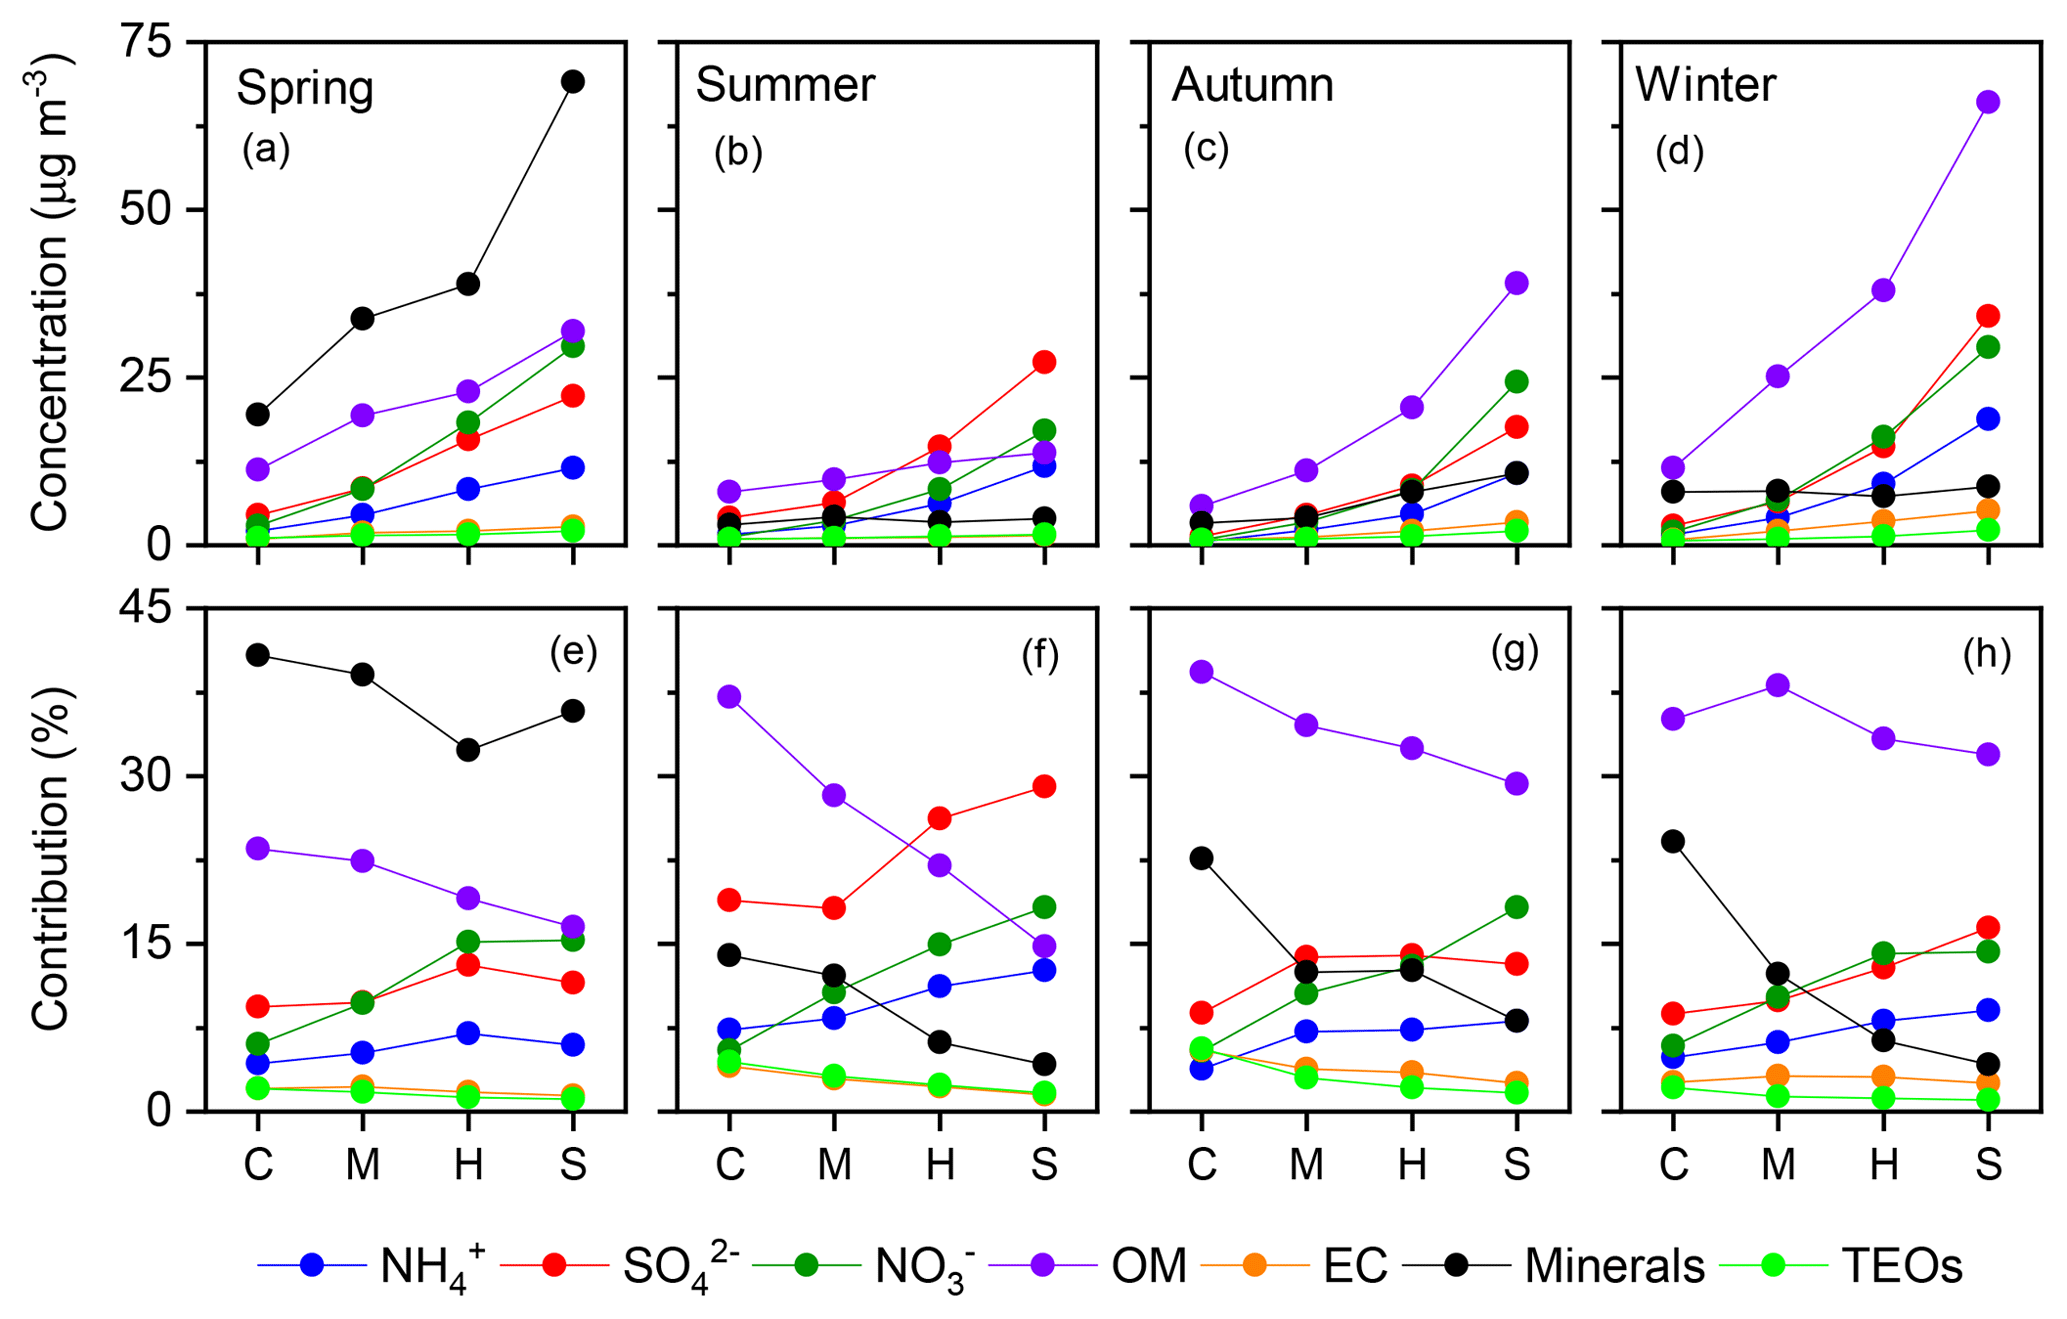
Figure 10Variations in the mean concentrations (upper panels) and contributions (lower panels) of the seven major known components of PM2.5 with pollution levels in each season. C, clean; M, moderate pollution; H, heavy pollution; S, severe pollution.
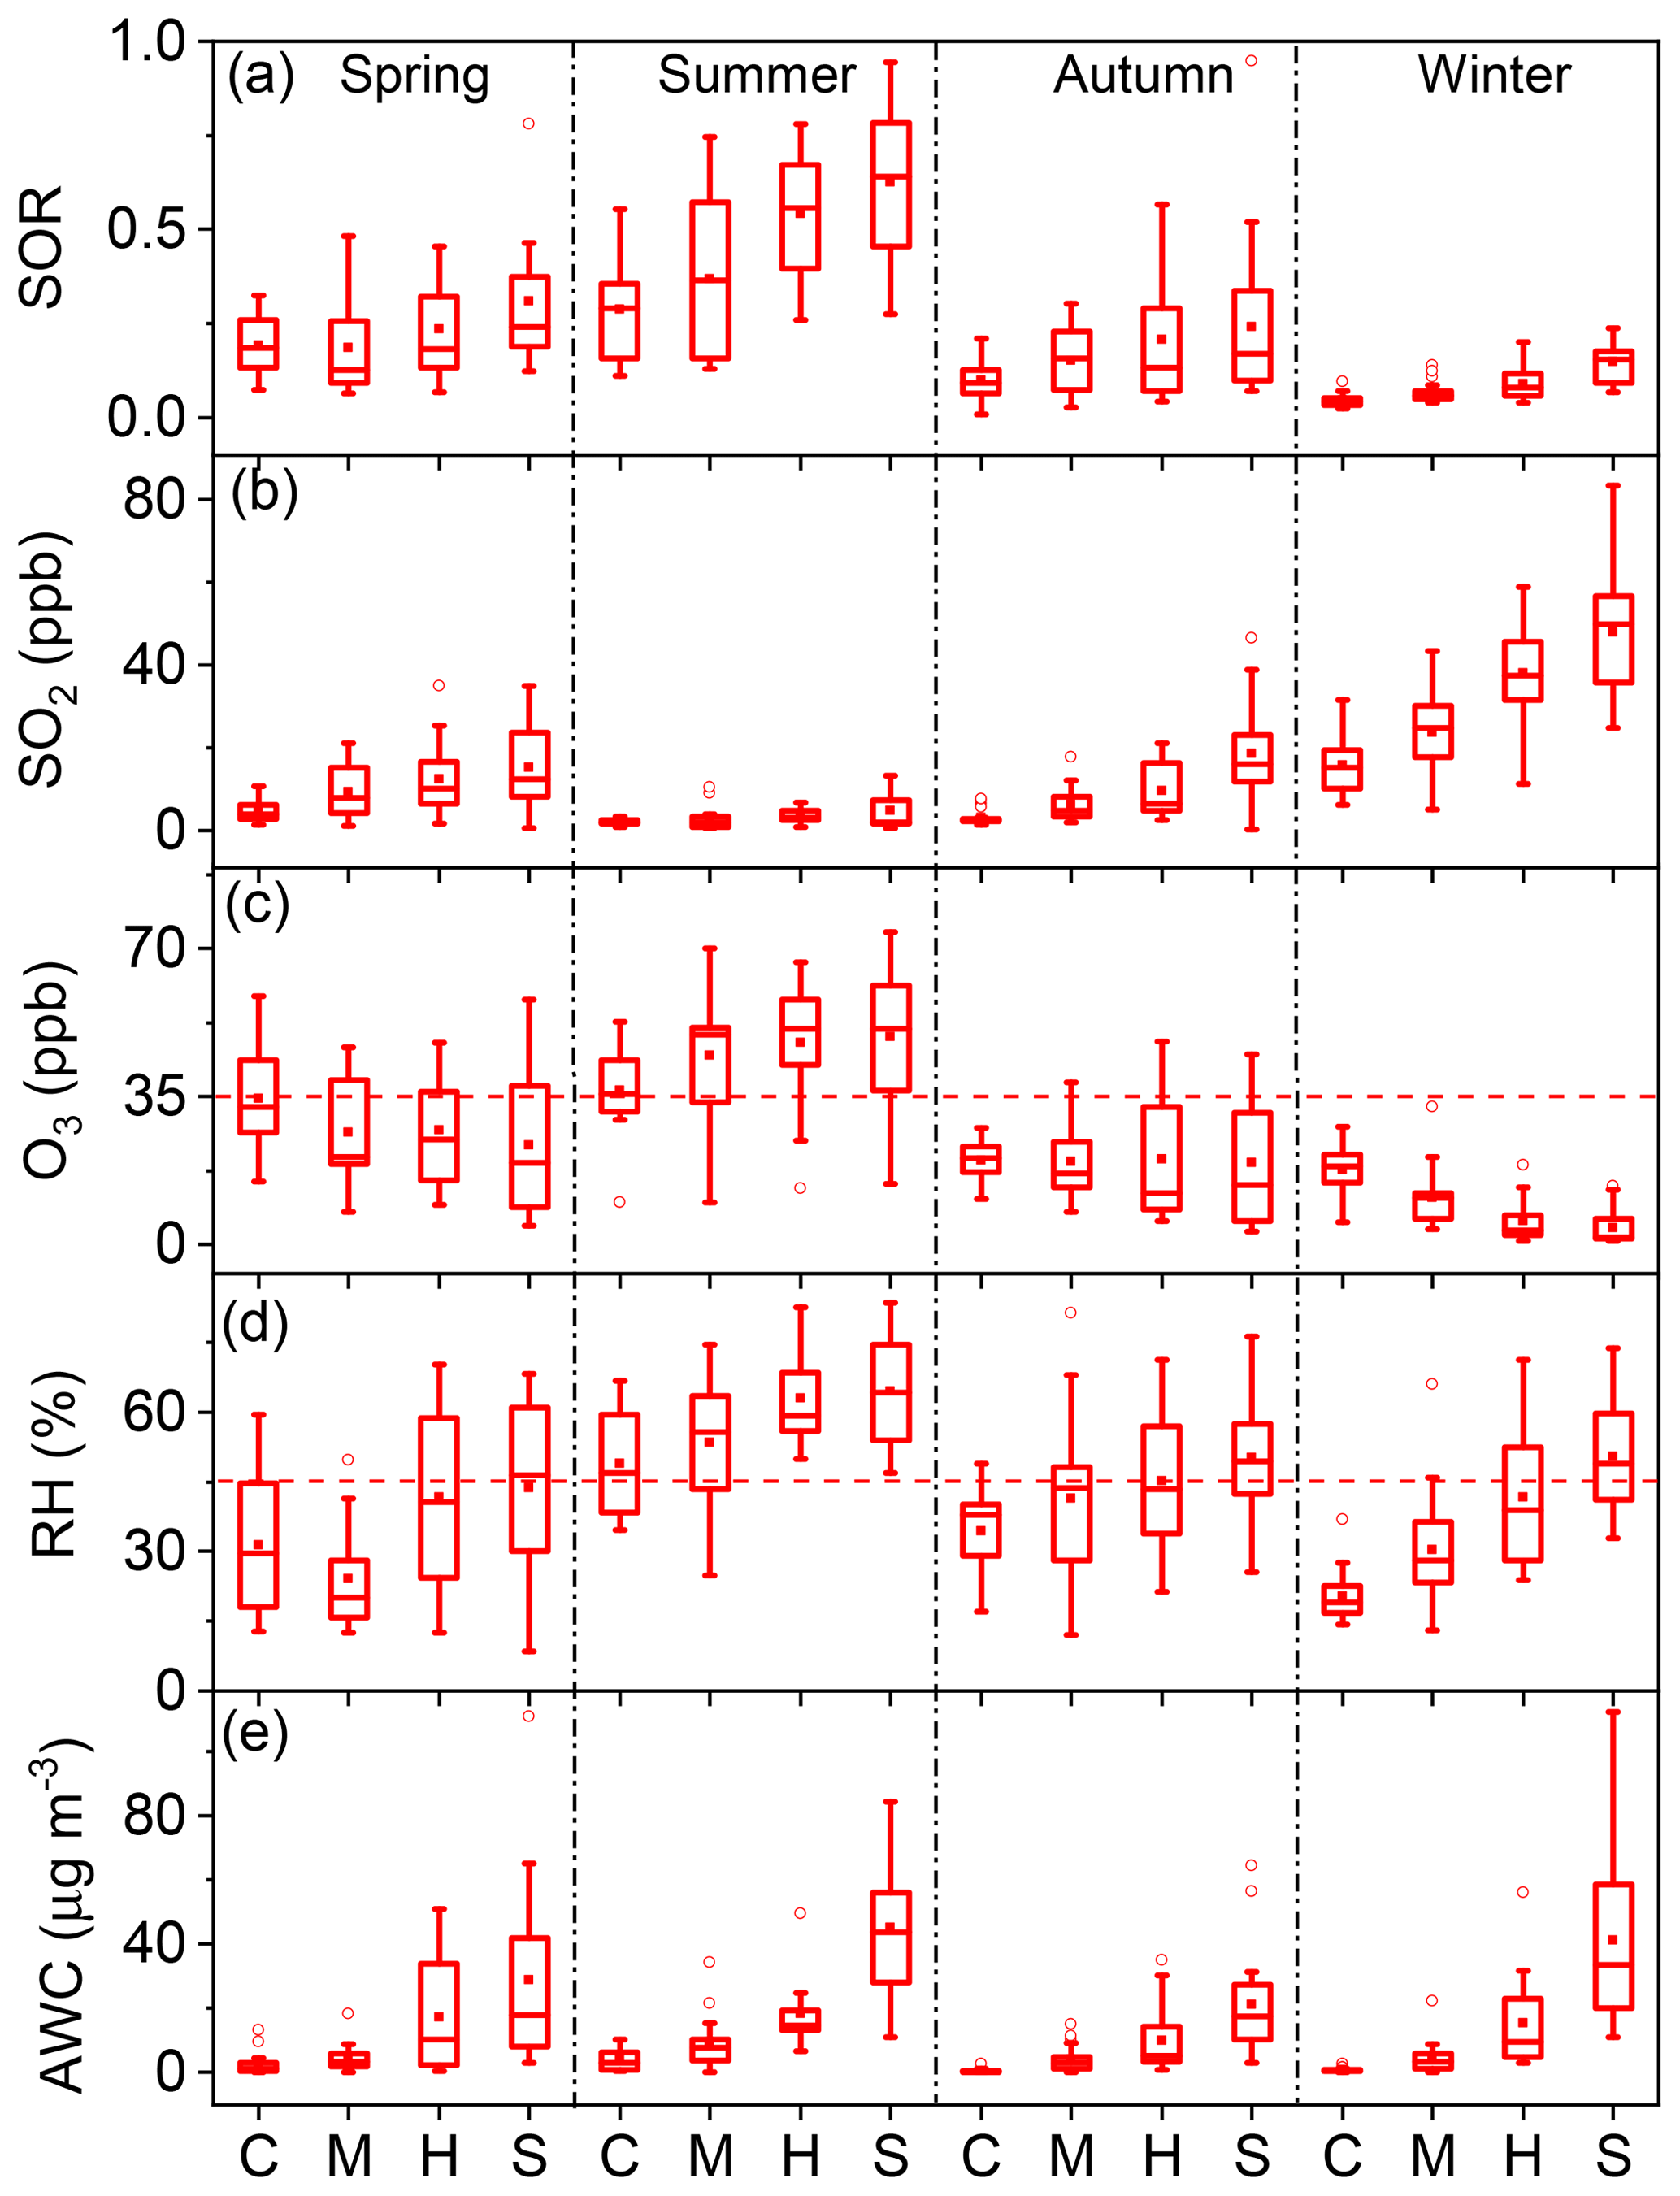
Figure 11Variations in (a) SORs, (b) SO2, (c) O3, (d) RH, and (e) AWC with pollution levels in each season. C, clean; M, moderate pollution; H, heavy pollution; S, severe pollution. The boxes represent, from top to bottom, the 75th, 50th, and 25th percentiles for each pollution level. The whiskers, solid red squares, and open red circles represent 1.5 times the IQR, mean values, and outlier data points, respectively. The horizontal dashed lines in panels (c) and (d) represent thresholds of O3=35 ppb and RH =45 %, respectively.
For each season, four pollution scenarios were classified according to PM2.5 level. The lowest 25 %, 25 %–50 %, 50 %–75 %, and highest 25 % of pollution levels were defined as “clean”, “moderate pollution”, “heavy pollution”, and “severe pollution”, respectively. The relative contributions of the seven major known components of PM2.5 among the four pollution scenarios are shown in Fig. 10. In all four seasons, the relative contribution of SNA increased with PM2.5 loading. This phenomenon has been reported in previous studies, but data availability was limited in autumn (Xu et al., 2017) and winter (G. J. Zheng et al., 2015). The SOR increased consistently in all four seasons as pollution accumulated, where both the highest value and strongest variability were observed in summer (Fig. 11a). Although SO2 should have reduced the SOR (Eq. 1), concurrent increases in primary SO2 and SORs were observed (Fig. 11a and b), indicating a significant increase in the SO2-to-sulfate conversion rate with PM2.5 loading, which offset the “dilution” effect (Eq. 1). Such variations in sulfate formation with pollution levels can be accounted for by the corresponding variations in both O3 concentrations and RH (Fig. 11c and d). In all four seasons, RH increased consistently as pollution accumulated (Fig. 11d). O3 concentrations decreased consistently as pollution evolved in all of the seasons except for summer (Fig. 11c). The distinct variations in O3 during summer, imply strong photochemistry and high concentrations of OH, which might result in a non-negligible contribution of gas-phase reactions to the formation of sulfate. However, gas-phase reactions alone could not account for the rate of sulfate formation either in Beijing or globally (Finlayson-Pitts and Pitts Jr., 2000; He et al., 2018), due to the relatively slow reaction of SO2 with OH. For example, the lifetime of SO2 with respect to OH oxidation is about 3–4 d, assuming a 24 h average OH concentration of 1×10⁶ molecules cm−3 and a pseudo-secondary-order rate constant of 10−12 cm3 molecule−1 s−1 (Brothers et al., 2010). However, the overall oxidation lifetime of SO2 is on the order of hours (Berglen et al., 2004; He et al., 2018). Overall, the increase in SO2-to-sulfate conversion with PM2.5 loading can be attributed to the self-catalytic nature of the multiphase formation of sulfate; i.e. both RH and PM2.5 increased continuously with the accumulation of PM2.5, resulting in a rapid rise in AWC and providing greater reaction volume for further sulfate formation. Therefore, the increases in RH and PM2.5 could have compensated for the low concentration of oxidants, resulting in fast sulfate formation as pollution evolved. Particularly in summer, not only did both RH and O3 concentrations increase as pollution evolved, but both RH and O3 concentrations were generally above their respective thresholds at all pollution levels (dashed lines in Fig. 11c and d). This explains our observations of both the highest values and strongest dependence on pollution level for SORs in summer.
In this study, the annual mean concentration of PM2.5 in Beijing during 2012–2013 was 84.1 (±63.1) µg m−3, with clear seasonal and pollution-level variations in its chemical components, highlighting the contribution of SNA formation to the accumulation of PM2.5 in all seasons. RH and O3 concentrations were identified as two prerequisites for fast SO2-to-sulfate conversion. RH above a threshold of ∼45 % greatly accelerated the conversion rate. A similar effect was also found for O3 at a concentration threshold of ∼35 ppb. Such dependence has interesting implications. First, they indicate a major role of the H2O2 route in sulfate formation, which might further indicate a major role of in situ sulfate production in the boundary layer, rather than in-cloud processes and intrusion from the free troposphere. Second, the observed dependence was also able to account for the seasonal and pollution-level variations in SO2-to-sulfate conversion rates. Both the highest value and strongest variability of SOR were observed in summer, which might be attributed to the highest values of O3 concentrations and RH in summer. SO2-to-sulfate conversion accelerated as pollution accumulated, which was primarily attributed to a shift from gas-phase oxidation to the multiphase oxidation route, which is self-catalytic in nature. The increase in RH was able to offset the low concentration of oxidants under heavily polluted conditions and resulted in increasingly fast SO2-to-sulfate conversion as pollution accumulated. While our simultaneous observations of the SOR and concentrations of Fe and NO2 could not exclude TMIs + O2 and NO2-based reactions, a reassessment of the relationships between sulfate formation, aerosol surface area, and the concentrations of Fe and NO2 is necessary. Future quantitative studies of the relative contributions of different sulfate formation routes should include additional measurements, namely NH3 for the proxy calculation of pH values, and H2O2 to confirm its contribution under different conditions.
The data of stationary measurements are available upon request. Radiation data can be applied through the National Meteorological Information Center (http://data.cma.cn/, last access: 2 October 2019).
The supplement related to this article is available online at: https://doi.org/10.5194/acp-19-12295-2019-supplement.
TZ designed the study. YF, CY, and TZ prepared the manuscript with input from all co-authors. YF and JW collected and weighed the PM2.5 filter samples and carried out the analysis of the components of PM2.5. FX carried out the measurement of water-soluble Fe. YW and MH provided the data for gaseous pollutants, temperature, and RH. WL provided the solar radiation data.
The authors declare that they have no conflict of interest.
This article is part of the special issue “Regional transport and transformation of air pollution in eastern China”. It is not associated with a conference.
We also thank Robert Woodward- Massey for his kind help in English writing.
This research has been supported by the National Natural Science Foundation Committee of China (grant nos. 91544000, 41121004, and 91744206).
This paper was edited by Jianmin Chen and reviewed by three anonymous referees.
Alexander, B., Park, R. J., Jacob, D. J., Li, Q. B., Yantosca, R. M., Savarino, J., Lee, C. C. W., and Thiemens, M. H.: Sulfate formation in sea-salt aerosols: Constraints from oxygen isotopes, J. Geophys. Res., 110, D10307, https://doi.org/10.1029/2004JD005659, 2005.
Barth, M. C., Rasch, P. J., Kiehl, J. T., Benkovitz, C. M., and Schwartz, S. E.: Sulfur chemistry in the National Center for Atmospheric Research Community Climate Model: Description, evaluation, features, and sensitivity to aqueous chemistry, J. Geophys. Res.-Atmos., 105, 1387–1415, https://doi.org/10.1029/1999jd900773, 2000.
Berglen, T. F., Berntsen, T. K., Isaksen, I. S. A., and Sundet, J. K.: A global model of the coupled sulfur/oxidant chemistry in the troposphere: The sulfur cycle, J. Geophys. Res. Atmos., 109, D19310, https://doi.org/10.1029/2003jd003948, 2004.
Brothers, L. A., Dominguez, G., Abramian, A., Corbin, A., Bluen, B., and Thiemens, M. H.: Optimized low-level liquid scintillation spectroscopy of S-35 for atmospheric and biogeochemical chemistry applications, P. Natl. Acad. Sci. USA, 107, 5311–5316, https://doi.org/10.1073/pnas.0901168107, 2010.
Cheng, Y. F., Zheng, G. J., Wei, C., Mu, Q., Zheng, B., Wang, Z. B., Gao, M., Zhang, Q., He, K. B., Carmichael, G., Poschl, U., and Su, H.: Reactive nitrogen chemistry in aerosol water as a source of sulfate during haze events in China, Sci. Adv., 2, e1601530, https://doi.org/10.1126/sciadv.1601530, 2016.
Deguillaume, L., Leriche, M., Desboeufs, K., Mailhot, G., George, C., and Chaumerliac, N.: Transition metals in atmospheric liquid phases: Sources, reactivity, and sensitive parameters, Chem. Rev., 105, 3388–3431, https://doi.org/10.1002/chin.200549218, 2005.
Ding, J., Zhao, P., Su, J., Dong, Q., Du, X., and Zhang, Y.: Aerosol pH and its driving factors in Beijing, Atmos. Chem. Phys., 19, 7939–7954, https://doi.org/10.5194/acp-19-7939-2019, 2019.
Ervens, B.: Modeling the processing of aerosol and trace gases in clouds and fogs, Chem. Rev., 115, 4175–4198, https://doi.org/10.1021/cr5005887, 2015.
Finlayson-Pitts, B. J. and Pitts Jr., J. N.: Chemistry of the upper and lower atmosphere: Theory, experiments, and applications, Academic Press, San Diego, Califoria, 2000.
Fu, A. Y.: Study on peroxide concentration and its influence factors in the urban atmosphere, Master, College of Environmental and Resource Sciences, Zhejiang University, Hangzhou, China, 2014 (in Chinese).
Gao, Y., Zhang, M., Liu, Z., Wang, L., Wang, P., Xia, X., Tao, M., and Zhu, L.: Modeling the feedback between aerosol and meteorological variables in the atmospheric boundary layer during a severe fog–haze event over the North China Plain, Atmos. Chem. Phys., 15, 4279–4295, https://doi.org/10.5194/acp-15-4279-2015, 2015.
Gleason, J. F., Sinha, A., and Howard, C. J.: Kinetics of the gas phase reaction HOSO2 + O2 - HO2 + SO3, J. Phys. Chem., 91, 719–724, https://doi.org/10.1021/j100287a045, 1987.
Guo, H., Weber, R. J., and Nenes, A.: High levels of ammonia do not raise fine particle pH sufficiently to yield nitrogen oxide-dominated sulfate production, Sci. Rep., 7, 12109, https://doi.org/10.1038/s41598-017-11704-0, 2017.
Han, L., Cheng, S., Zhuang, G., Ning, H., Wang, H., Wei, W., and Zhao, X.: The changes and long-range transport of PM2.5 in Beijing in the past decade, Atmos. Environ., 110, 186–195, https://doi.org/10.1016/j.atmosenv.2015.03.013, 2015.
Harris, E., Sinha, B., van Pinxteren, D., Tilgner, A., Fomba, K. W., Schneider, J., Roth, A., Gnauk, T., Fahlbusch, B., Mertes, S., Lee, T., Collett, J., Foley, S., Borrmann, S., Hoppe, P., and Herrmann, H.: Enhanced role of transition metal ion catalysis during in-cloud oxidation of SO2, Science, 340, 727–730, https://doi.org/10.1126/science.1230911, 2013.
Harris, E., Sinha, B., van Pinxteren, D., Schneider, J., Poulain, L., Collett, J., D'Anna, B., Fahlbusch, B., Foley, S., Fomba, K. W., George, C., Gnauk, T., Henning, S., Lee, T., Mertes, S., Roth, A., Stratmann, F., Borrmann, S., Hoppe, P., and Herrmann, H.: In-cloud sulfate addition to single particles resolved with sulfur isotope analysis during HCCT-2010, Atmos. Chem. Phys., 14, 4219–4235, https://doi.org/10.5194/acp-14-4219-2014, 2014.
He, H., Wang, Y., Ma, Q., Ma, J., Chu, B., Ji, D., Tang, G., Liu, C., Zhang, H., and Hao, J.: Mineral dust and NOx promote the conversion of SO2 to sulfate in heavy pollution days, Sci. Rep., 4, 4172, https://doi.org/10.1038/srep04172, 2014.
He, P., Alexander, B., Geng, L., Chi, X., Fan, S., Zhan, H., Kang, H., Zheng, G., Cheng, Y., Su, H., Liu, C., and Xie, Z.: Isotopic constraints on heterogeneous sulfate production in Beijing haze, Atmos. Chem. Phys., 18, 5515–5528, https://doi.org/10.5194/acp-18-5515-2018, 2018.
Hu, M., Guo, S., Peng, J.-F., and Wu, Z.-J.: Insight into characteristics and sources of PM2.5 in the Beijing-Tianjin-Hebei region, China, Natl. Sci. Rev., 2, 257–258, https://doi.org/10.1093/nsr/nwv003, 2015.
Huang, R. J., Zhang, Y. L., Bozzetti, C., Ho, K. F., Cao, J. J., Han, Y. M., Daellenbach, K. R., Slowik, J. G., Platt, S. M., Canonaco, F., Zotter, P., Wolf, R., Pieber, S. M., Bruns, E. A., Crippa, M., Ciarelli, G., Piazzalunga, A., Schwikowski, M., Abbaszade, G., Schnelle-Kreis, J., Zimmermann, R., An, Z. S., Szidat, S., Baltensperger, U., El Haddad, I., and Prevot, A. S. H.: High secondary aerosol contribution to particulate pollution during haze events in China, Nature, 514, 218–222, https://doi.org/10.1038/nature13774, 2014.
Lelieveld, J., Gromov, S., Pozzer, A., and Taraborrelli, D.: Global tropospheric hydroxyl distribution, budget and reactivity, Atmos. Chem. Phys., 16, 12477–12493, https://doi.org/10.5194/acp-16-12477-2016, 2016.
Li, L., Hoffmann, M. R., and Colussi, A. J.: The role of nitrogen dioxide in the production of sulfate during Chinese haze-aerosol episodes, Environ. Sci. Technol., 52, 2686–2693, https://doi.org/10.1021/acs.est.7b05222, 2018.
Li, Y., Ye, C., Liu, J., Zhu, Y., Wang, J., Tan, Z., Lin, W., Zeng, L., and Zhu, T.: Observation of regional air pollutant transport between the megacity Beijing and the North China Plain, Atmos. Chem. Phys., 16, 14265–14283, https://doi.org/10.5194/acp-16-14265-2016, 2016.
Liang, P., Zhu, T., Fang, Y., Li, Y., Han, Y., Wu, Y., Hu, M., and Wang, J.: The role of meteorological conditions and pollution control strategies in reducing air pollution in Beijing during APEC 2014 and Victory Parade 2015, Atmos. Chem. Phys., 17, 13921–13940, https://doi.org/10.5194/acp-17-13921-2017, 2017.
Liu, M., Song, Y., Zhou, T., Xu, Z., Yan, C., Zheng, M., Wu, Z., Hu, M., Wu, Y., and Zhu, T.: Fine particle pH during severe haze episodes in northern China, Geophys. Res. Lett., 44, 5213–5221, https://doi.org/10.1002/2017GL073210, 2017.
Liu, X., Sun, K., Qu, Y., Hu, M., Sun, Y., Zhang, F., and Zhang, Y.: Secondary formation of sulfate and nitrate during a haze episode in megacity Beijing, China, Aerosol Air Qual. Res., 15, 2246–2257, https://doi.org/10.4209/aaqr.2014.12.0321, 2015.
Liu, Y. C., Wu, Z. J., Wang, Y., Xiao, Y., Gu, F. T., Zheng, J., Tan, T. Y., Shang, D. J., Wu, Y. S., Zeng, L. M., Hu, M., Bateman, A. P., and Martin, S. T.: Submicrometer particles are in the liquid state during heavy haze episodes in the urban atmosphere of Beijing, China, Environ. Sci. Tech. Let., 4, 427–432, https://doi.org/10.1021/acs.estlett.7b00352, 2017.
Lu, X., Chen, N., Wang, Y., Cao, W., Zhu, B., Yao, T., Fung, J. C. H., and Lau, A. K. H.: Radical budget and ozone chemistry during autumn in the atmosphere of an urban aite in central China: ROx budgets and O3 in central China, J. Geophys. Res.-Atmos., 122, 3672–3685, https://doi.org/10.1002/2016JD025676, 2017.
Lv, B., Zhang, B., and Bai, Y.: A systematic analysis of PM2.5 in Beijing and its sources from 2000 to 2012, Atmos. Environ., 124, 98–108, https://doi.org/10.1016/j.atmosenv.2015.09.031, 2016.
Ma, J., Chu, B., Liu, J., Liu, Y., Zhang, H., and He, H.: NOx promotion of SO2 conversion to sulfate: An important mechanism for the occurrence of heavy haze during winter in Beijing, Environ. Pollut., 233, 662–669, https://doi.org/10.1016/j.envpol.2017.10.103, 2018.
Pan, X. L., Yan, P., Tang, J., Ma, J. Z., Wang, Z. F., Gbaguidi, A., and Sun, Y. L.: Observational study of influence of aerosol hygroscopic growth on scattering coefficient over rural area near Beijing mega-city, Atmos. Chem. Phys., 9, 7519–7530, https://doi.org/10.5194/acp-9-7519-2009, 2009.
Quan, J., Liu, Q., Li, X., Gao, Y., Jia, X., Sheng, J., and Liu, Y.: Effect of heterogeneous aqueous reactions on the secondary formation of inorganic aerosols during haze events, Atmos. Environ., 122, 306–312, https://doi.org/10.1016/j.atmosenv.2015.09.068, 2015.
Quan, J. N., Tie, X. X., Zhang, Q., Liu, Q., Li, X., Gao, Y., and Zhao, D. L.: Characteristics of heavy aerosol pollution during the 2012–2013 winter in Beijing, China, Atmos. Environ., 88, 83–89, https://doi.org/10.1016/j.atmosenv.2014.01.058, 2014.
Russell, L. M. and Ming, Y.: Deliquescence of small particles, J. Chem. Phys., 116, 311–321, https://doi.org/10.1063/1.1420727, 2002.
Sarwar, G., Simon, H., Fahey, K., Mathur, R., Goliff, W. S., and Stockwell, W. R.: Impact of sulfur dioxide oxidation by Stabilized Criegee Intermediate on sulfate, Atmos. Environ., 85, 204–214, https://doi.org/10.1016/j.atmosenv.2013.12.013, 2014.
Seinfeld, J. H. and Pandis, S. N.: Atmospheric chemistry and physics: From air pollution to climate change, 2nd Edn., John Wiley & Sons, New Jersey, 2006.
Shen, X. H., Lee, T. Y., Guo, J., Wang, X. F., Li, P. H., Xu, P. J., Wang, Y., Ren, Y., Wang, W., Wang, T., Li, Y., Cam, S. A., and Collett, J. L.: Aqueous phase sulfate production in clouds in eastern China, Atmos. Environ., 62, 502–511, https://doi.org/10.1016/j.atmosenv.2012.07.079, 2012.
Sievering, H., Cainey, J., Harvey, M., Mcgregor, J., Nichol, S., and Quinn, P.: Aerosol non-sea-salt sulfate in the remote marine boundary layer under clear-sky and normal cloudiness conditions: Ocean-derived biogenic alkalinity enhances sea-salt sulfate production by ozone oxidation, J. Geophys. Res.-Atmos., 109, 19317, https://doi.org/10.1029/2003jd004315, 2004.
Sun, Y., Wang, Z., Fu, P., Jiang, Q., Yang, T., Li, J., and Ge, X.: The impact of relative humidity on aerosol composition and evolution processes during wintertime in Beijing, China, Atmos. Environ., 77, 927–934, https://doi.org/10.1016/j.atmosenv.2013.06.019, 2013.
Sun, Y. L., Zhuang, G. S., Tang, A. H., Wang, Y., and An, Z. S.: Chemical characteristics of PM2.5 and PM10 in haze-fog episodes in Beijing, Environ. Sci. Technol., 40, 3148–3155, https://doi.org/10.1021/es051533g, 2006.
Sun, Y. L., Jiang, Q., Wang, Z. F., Fu, P. Q., Li, J., Yang, T., and Yin, Y.: Investigation of the sources and evolution processes of severe haze pollution in Beijing in January 2013, J. Geophys. Res.-Atmos., 119, 4380–4398, https://doi.org/10.1002/2014JD021641, 2014.
Vereecken, L., Harder, H., and Novelli, A.: The reaction of Criegee intermediates with NO, RO2, and SO2, and their fate in the atmosphere, Phys. Chem. Chem. Phys., 14, 14682, https://doi.org/10.1039/c2cp42300f, 2012.
Wang, G. H., Zhang, R. Y., Gomez, M. E., Yang, L. X., Zamora, M. L., Hu, M., Lin, Y., Peng, J. F., Guo, S., Meng, J. J., Li, J. J., Cheng, C. L., Hu, T. F., Ren, Y. Q., Wang, Y. S., Gao, J., Cao, J. J., An, Z. S., Zhou, W. J., Li, G. H., Wang, J. Y., Tian, P. F., Marrero-Ortiz, W., Secrest, J., Du, Z. F., Zheng, J., Shang, D. J., Zeng, L. M., Shao, M., Wang, W. G., Huang, Y., Wang, Y., Zhu, Y. J., Li, Y. X., Hu, J. X., Pan, B., Cai, L., Cheng, Y. T., Ji, Y. M., Zhang, F., Rosenfeld, D., Liss, P. S., Duce, R. A., Kolb, C. E., and Molina, M. J.: Persistent sulfate formation from London Fog to Chinese haze, P. Natl. Acad. Sci. USA, 113, 13630–13635, https://doi.org/10.1073/pnas.1616540113, 2016.
Wang, Y., Zhuang, G., Tang, A., Yuan, H., Sun, Y., Chen, S., and Zheng, A.: The ion chemistry and the source of PM2.5 aerosol in Beijing, Atmos. Environ., 39, 3771–3784, https://doi.org/10.1016/j.atmosenv.2005.03.013, 2005.
Wang, Y., Zhang, Q., Jiang, J., Zhou, W., Wang, B., He, K., Duan, F., Zhang, Q., Philip, S., and Xie, Y.: Enhanced sulfate formation during China's severe winter haze episode in January 2013 missing from current models, J. Geophys. Res.-Atmos., 119, 10425–10440, https://doi.org/10.1002/2013JD021426, 2014.
Wang, Y. S., Yao, L., Wang, L. L., Liu, Z. R., Ji, D. S., Tang, G. Q., Zhang, J. K., Sun, Y., Hu, B., and Xin, J. Y.: Mechanism for the formation of the January 2013 heavy haze pollution episode over central and eastern China, Sci. China Earth Sci., 57, 14–25, https://doi.org/10.1007/s11430-013-4773-4, 2014b.
Warneck, P.: The oxidation of sulfur(IV) by reaction with iron(III): a critical review and data analysis, Phys. Chem. Chem. Phys., 20, 4020–4037, https://doi.org/10.1039/c7cp07584g, 2018.
Xie, Y., Ding, A., Nie, W., Mao, H., Qi, X., Huang, X., Xu, Z., Kerminen, V. M., Petäjä, T., and Chi, X.: Enhanced sulfate formation by nitrogen dioxide: Implications from in-situ observations at the SORPES Station, J. Geophys. Res.-Atmos., 120, 12679–12694, https://doi.org/10.1002/2015JD023607, 2015.
Xu, F., Qiu, X., Hu, X., Shang, Y., Pardo, M., Fang, Y., Wang, J., Rudich, Y., and Zhu, T.: Effects on IL-1β signaling activation induced by water and organic extracts of fine particulate matter (PM2.5) in vitro, Environ. Pollut., 237, 592–600, https://doi.org/10.1016/j.envpol.2018.02.086, 2018.
Xu, L., Duan, F., He, K., Ma, Y., Zhu, L., Zheng, Y., Huang, T., Kimoto, T., Ma, T., Li, H., Ye, S., Yang, S., Sun, Z., and Xu, B.: Characteristics of the secondary water-soluble ions in a typical autumn haze in Beijing, Environ. Pollut., 227, 296–305, https://doi.org/10.1016/j.envpol.2017.04.076, 2017.
Yang, Y. R., Liu, X. G., Qu, Y., An, J. L., Jiang, R., Zhang, Y. H., Sun, Y. L., Wu, Z. J., Zhang, F., Xu, W. Q., and Ma, Q. X.: Characteristics and formation mechanism of continuous hazes in China: a case study during the autumn of 2014 in the North China Plain, Atmos. Chem. Phys., 15, 8165–8178, https://doi.org/10.5194/acp-15-8165-2015, 2015.
Ye, C., Liu, P., Ma, Z., Xue, C., Zhang, C., Zhang, Y., Liu, J., Liu, C., Sun, X., and Mu, Y.: High H2O2 concentrations observed during haze periods in wintertime of Beijing: Importance of H2O2-oxidation in sulfate formation, Environ. Sci. Tech. Let., 5, 757–763, https://doi.org/10.1021/acs.estlett.8b00579, 2018.
Yu, T., Zhao, D., Song, X., and Zhu, T.: NO2-initiated multiphase oxidation of SO2 by O2 on CaCO3 particles, Atmos. Chem. Phys., 18, 6679–6689, https://doi.org/10.5194/acp-18-6679-2018, 2018.
Zhang, Q., Quan, J. N., Tie, X. X., Li, X., Liu, Q., Gao, Y., and Zhao, D. L.: Effects of meteorology and secondary particle formation on visibility during heavy haze events in Beijing, China, Sci. Total. Environ., 502, 578–584, https://doi.org/10.1016/j.scitotenv.2014.09.079, 2015.
Zhang, R., Jing, J., Tao, J., Hsu, S.-C., Wang, G., Cao, J., Lee, C. S. L., Zhu, L., Chen, Z., Zhao, Y., and Shen, Z.: Chemical characterization and source apportionment of PM2.5 in Beijing: seasonal perspective, Atmos. Chem. Phys., 13, 7053–7074, https://doi.org/10.5194/acp-13-7053-2013, 2013.
Zhang, R., Sun, X. S., Shi, A. J., Huang, Y. H., Yan, J., Nie, T., Yan, X., and Li, X.: Secondary inorganic aerosols formation during haze episodes at an urban site in Beijing, China, Atmos. Environ., 177, 275–282, https://doi.org/10.1016/j.atmosenv.2017.12.031, 2018.
Zhang, X. Y., Gong, S. L., Shen, Z. X., Mei, F. M., Xi, X. X., Liu, L. C., Zhou, Z. J., Wang, D., Wang, Y. Q., and Cheng, Y.: Characterization of soil dust aerosol in China and its transport and distribution during 2001 ACE-Asia: 1. Network observations, J. Geophys. Res., 108, 4261, https://doi.org/10.1029/2002jd002632, 2003.
Zhao, D., Song, X., Zhu, T., Zhang, Z., Liu, Y., and Shang, J.: Multiphase oxidation of SO2 by NO2 on CaCO3 particles, Atmos. Chem. Phys., 18, 2481–2493, https://doi.org/10.5194/acp-18-2481-2018, 2018.
Zheng, B., Zhang, Q., Zhang, Y., He, K. B., Wang, K., Zheng, G. J., Duan, F. K., Ma, Y. L., and Kimoto, T.: Heterogeneous chemistry: a mechanism missing in current models to explain secondary inorganic aerosol formation during the January 2013 haze episode in North China, Atmos. Chem. Phys., 15, 2031–2049, https://doi.org/10.5194/acp-15-2031-2015, 2015.
Zheng, G. J., Duan, F. K., Su, H., Ma, Y. L., Cheng, Y., Zheng, B., Zhang, Q., Huang, T., Kimoto, T., Chang, D., Pöschl, U., Cheng, Y. F., and He, K. B.: Exploring the severe winter haze in Beijing: the impact of synoptic weather, regional transport and heterogeneous reactions, Atmos. Chem. Phys., 15, 2969–2983, https://doi.org/10.5194/acp-15-2969-2015, 2015.
Zheng, M., Salmon, L. G., Schauer, J. J., Zeng, L. M., Kiang, C. S., Zhang, Y. H., and Cass, G. R.: Seasonal trends in PM2.5 source contributions in Beijing, China, Atmos. Environ., 39, 3967–3976, https://doi.org/10.1016/j.atmosenv.2005.03.036, 2005.
Zhu, T., Shang, J., and Zhao, D. F.: The roles of heterogeneous chemical processes in the formation of an air pollution complex and gray haze, Sci. China Chem., 54, 145–153, https://doi.org/10.1007/s11426-010-4181-y, 2011.
Zhuang, G. S., Guo, J. H., Yuan, H., and Zhao, C. Y.: The compositions, sources, and size distribution of the dust storm from China in spring of 2000 and its impact on the global environment, Chinese Sci. Bull., 46, 895–901, https://doi.org/10.1007/BF02900460, 2001.