the Creative Commons Attribution 4.0 License.
the Creative Commons Attribution 4.0 License.
 | 02 Oct 2019
Substantial ozone enhancement over the North China Plain from increased biogenic emissions due to heat waves and land cover in summer 2017
Mingchen Ma
Shaoqing Zhang
L. Ruby Leung
Shuxiao Wang
Xing Chang
Tianqi Zhang
Lifang Sheng
Xiaohong Yao
Huiwang Gao
In the summer of 2017, heavy ozone pollution swamped most of the North China Plain (NCP), with the maximum regional average of daily maximum 8 h ozone concentration (MDA8) reaching almost 120 ppbv. In light of the continuing reduction of anthropogenic emissions in China, the underlying mechanisms for the occurrences of these regional extreme ozone episodes are elucidated from two perspectives: meteorology and biogenic emissions. The significant positive correlation between MDA8 ozone and temperature, which is amplified during heat waves concomitant with stagnant air and no precipitation, supports the crucial role of meteorology in driving high ozone concentrations. We also find that biogenic emissions are enhanced due to factors previously not considered. During the heavy ozone pollution episodes in June 2017, biogenic emissions driven by high vapor pressure deficit (VPD), land cover change and urban landscape yield an extra mean MDA8 ozone of 3.08, 2.79 and 4.74 ppbv, respectively, over the NCP, which together contribute as much to MDA8 ozone as biogenic emissions simulated using the land cover of 2003 and ignoring VPD and urban landscape. In Beijing, the biogenic emission increase due to urban landscape has a comparable effect on MDA8 ozone to the combined effect of high VPD and land cover change between 2003 and 2016. In light of the large effect of urban landscape on biogenic emission and the subsequent ozone formation, the types of trees may be cautiously selected to take into account of the biogenic volatile organic compound (BVOC) emission during the afforestation of cities. This study highlights the vital contributions of heat waves, land cover change and urbanization to the occurrence of extreme ozone episodes, with significant implications for ozone pollution control in a future when heat wave frequency and intensity are projected to increase under global warming.
- Article
(7954 KB) -
Supplement
(975 KB) - BibTeX
- EndNote


In recent decades, China has been facing severe air pollution issues, particularly for the winter PM2.5 and summer ozone (Zheng et al., 2015; Cheng et al., 2016; Zhao et al., 2016). It has been noted that the mean concentration of PM2.5 has generally decreased in the past few years, but the concentration of ozone shows an increasing trend (Li et al., 2017b, 2019; Wang et al., 2017; Chen et al., 2018a), suggesting a greater urgency for ozone pollution control. For instance, Li et al. (2017b) revealed an increase in annual mean ozone in 2016 of 11 µg m−3 compared to 2014 in China. Lu et al. (2018) found a 3.7 %–6.2 % increase per year in the mean ozone concentration over 74 cities in China from 2013 to 2017. Since ozone is harmful to both human health (Soriano et al., 2017) and vegetation (Emberson et al., 2009; Avnery et al., 2011), it is vital to investigate the possible mechanisms related to high ozone concentrations. Based on ozone observations from 2013 to 2017, the North China Plain (NCP, an area about 400 000 km2 in size, with Beijing located on its northeast edge; 35–42∘ N, 112–119∘ E), is identified as the area with the most severe ozone pollution in China compared to other regions such as the Yangtze River Delta and Pearl River Delta, possibly linked to the stimulation effect from enhanced hydroperoxy radicals (HO2) due to a reduction in aerosol sink resulting from the decrease in PM2.5 during this period (Li et al., 2019). Chen et al. (2019) investigated the impact of meteorological factors such as temperature, wind speed and solar radiation on ozone pollution from 2006 to 2016 and noted that the severe ozone events in June 2017 around Beijing stand out and suggested a possible connection with the abnormal meteorological conditions. These studies motivated a need for a better understanding of the high-ozone problem over the NCP.
Tropospheric ozone is closely related to both anthropogenic emissions and biogenic emissions, including volatile organic compounds (VOCs) and nitrogen oxides (NOx) (Sillman, 1995, 1999; Tonnesen and Dennis, 2000; Xing et al., 2011; Fu et al., 2012). In the past few years (i.e., 2012–2017), anthropogenic emissions such as NOX continued to decrease (Liu et al., 2016) and anthropogenic VOCs changed little (Zhao et al., 2018; Zheng et al., 2018; Li et al., 2019). Biogenic VOC (BVOC) was reported to enhance hourly ozone by 3–5 ppbv in the NCP, especially in areas north of Beijing, based on a 2 d simulation from 31 July to 1 August 1999 (Wang et al., 2008). The annual BVOC emission in this area increased by 1 %–1.5 % per year from 1979 to 2012 (Stavrakou et al., 2014) due to changes in land use and climate. Broadleaf trees in general have a higher emission rate of BVOC than grass, shrubs and crops (Guenther et al., 2012). A dramatic increase in forest (trees) coverage is evident in the last 20 years over the NCP (Chen et al., 2018b), partly attributable to the “Three-north Forest Protection Project”. For example, trees planted before the 2008 Olympic Games doubled the BVOC emissions in Beijing from 2005 to 2010 (Ghirardo et al., 2016). Urban landscape may even emit more BVOC than natural forest because of favorable conditions such as lower tree densities and better light illumination (Ren et al., 2017). Ren et al. (2017) found that BVOC emitted by urban landscape accounted for 15 % of total BVOC emissions in Beijing in 2015. Over highly polluted urban areas of the NCP, ozone production is highly sensitive to VOC emissions (Liu et al., 2012; Han et al., 2018). Therefore, elevated BVOC emissions can greatly enhance ozone formation in the NCP.
Besides emissions, tropospheric ozone is also closely related to meteorological conditions, such as heat waves (Gao et al., 2013; Fiore et al., 2015; Otero et al., 2016), low wind speed and stagnant weather (Jacob and Winner, 2009; Sun et al., 2017; Zhang et al., 2018). Weather conditions concomitant with heat waves, including high temperature, low wind speed and little cloud coverage, may enhance ozone production (Jaffe and Zhang, 2017; Pu et al., 2017; Sun et al., 2019). At the same time, such meteorological conditions also promote emissions of BVOC and ozone formation (Zhang and Wang, 2016). Using a global model, Fu and Liao (2014) suggested a slight to moderate increase in biogenic isoprene west and north of Beijing due to land cover and land use alone and an even more obvious increase when meteorological changes are considered. In the summer of 2017, heat waves swept over the majority of the NCP, providing an excellent opportunity to investigate how the heat wave may have modulated BVOC emissions and subsequent severe ozone events in the NCP. Observation data and modeling are used to delineate various factors contributing to enhanced biogenic emissions and elevated ozone concentrations. More details of the data and model are provided in the “Methods” section.
Data and model configuration
The distribution of observed data is shown in Fig. 1. For instance, the meteorological observations used in this study such as daily maximum temperature, daily mean wind speed and daily total precipitation were obtained from the China Meteorological Data Service Center (CMA, http://data.cma.cn, last access: 23 September 2019), shown as blue dots in Fig. 1. Observed surface ozone data are obtained from the China National Environmental Monitoring Centre (http://www.pm25.in, last access: 23 September 2019), shown as red dots in Fig. 1. Meteorological Assimilation Data Ingest System (MADIS) hourly 2 m temperature, specific humidity, 10 m wind speed and direction are available from MADIS (https://madis.ncep.noaa.gov, last access: 23 September 2019), shown as hexagons in Fig. 1.
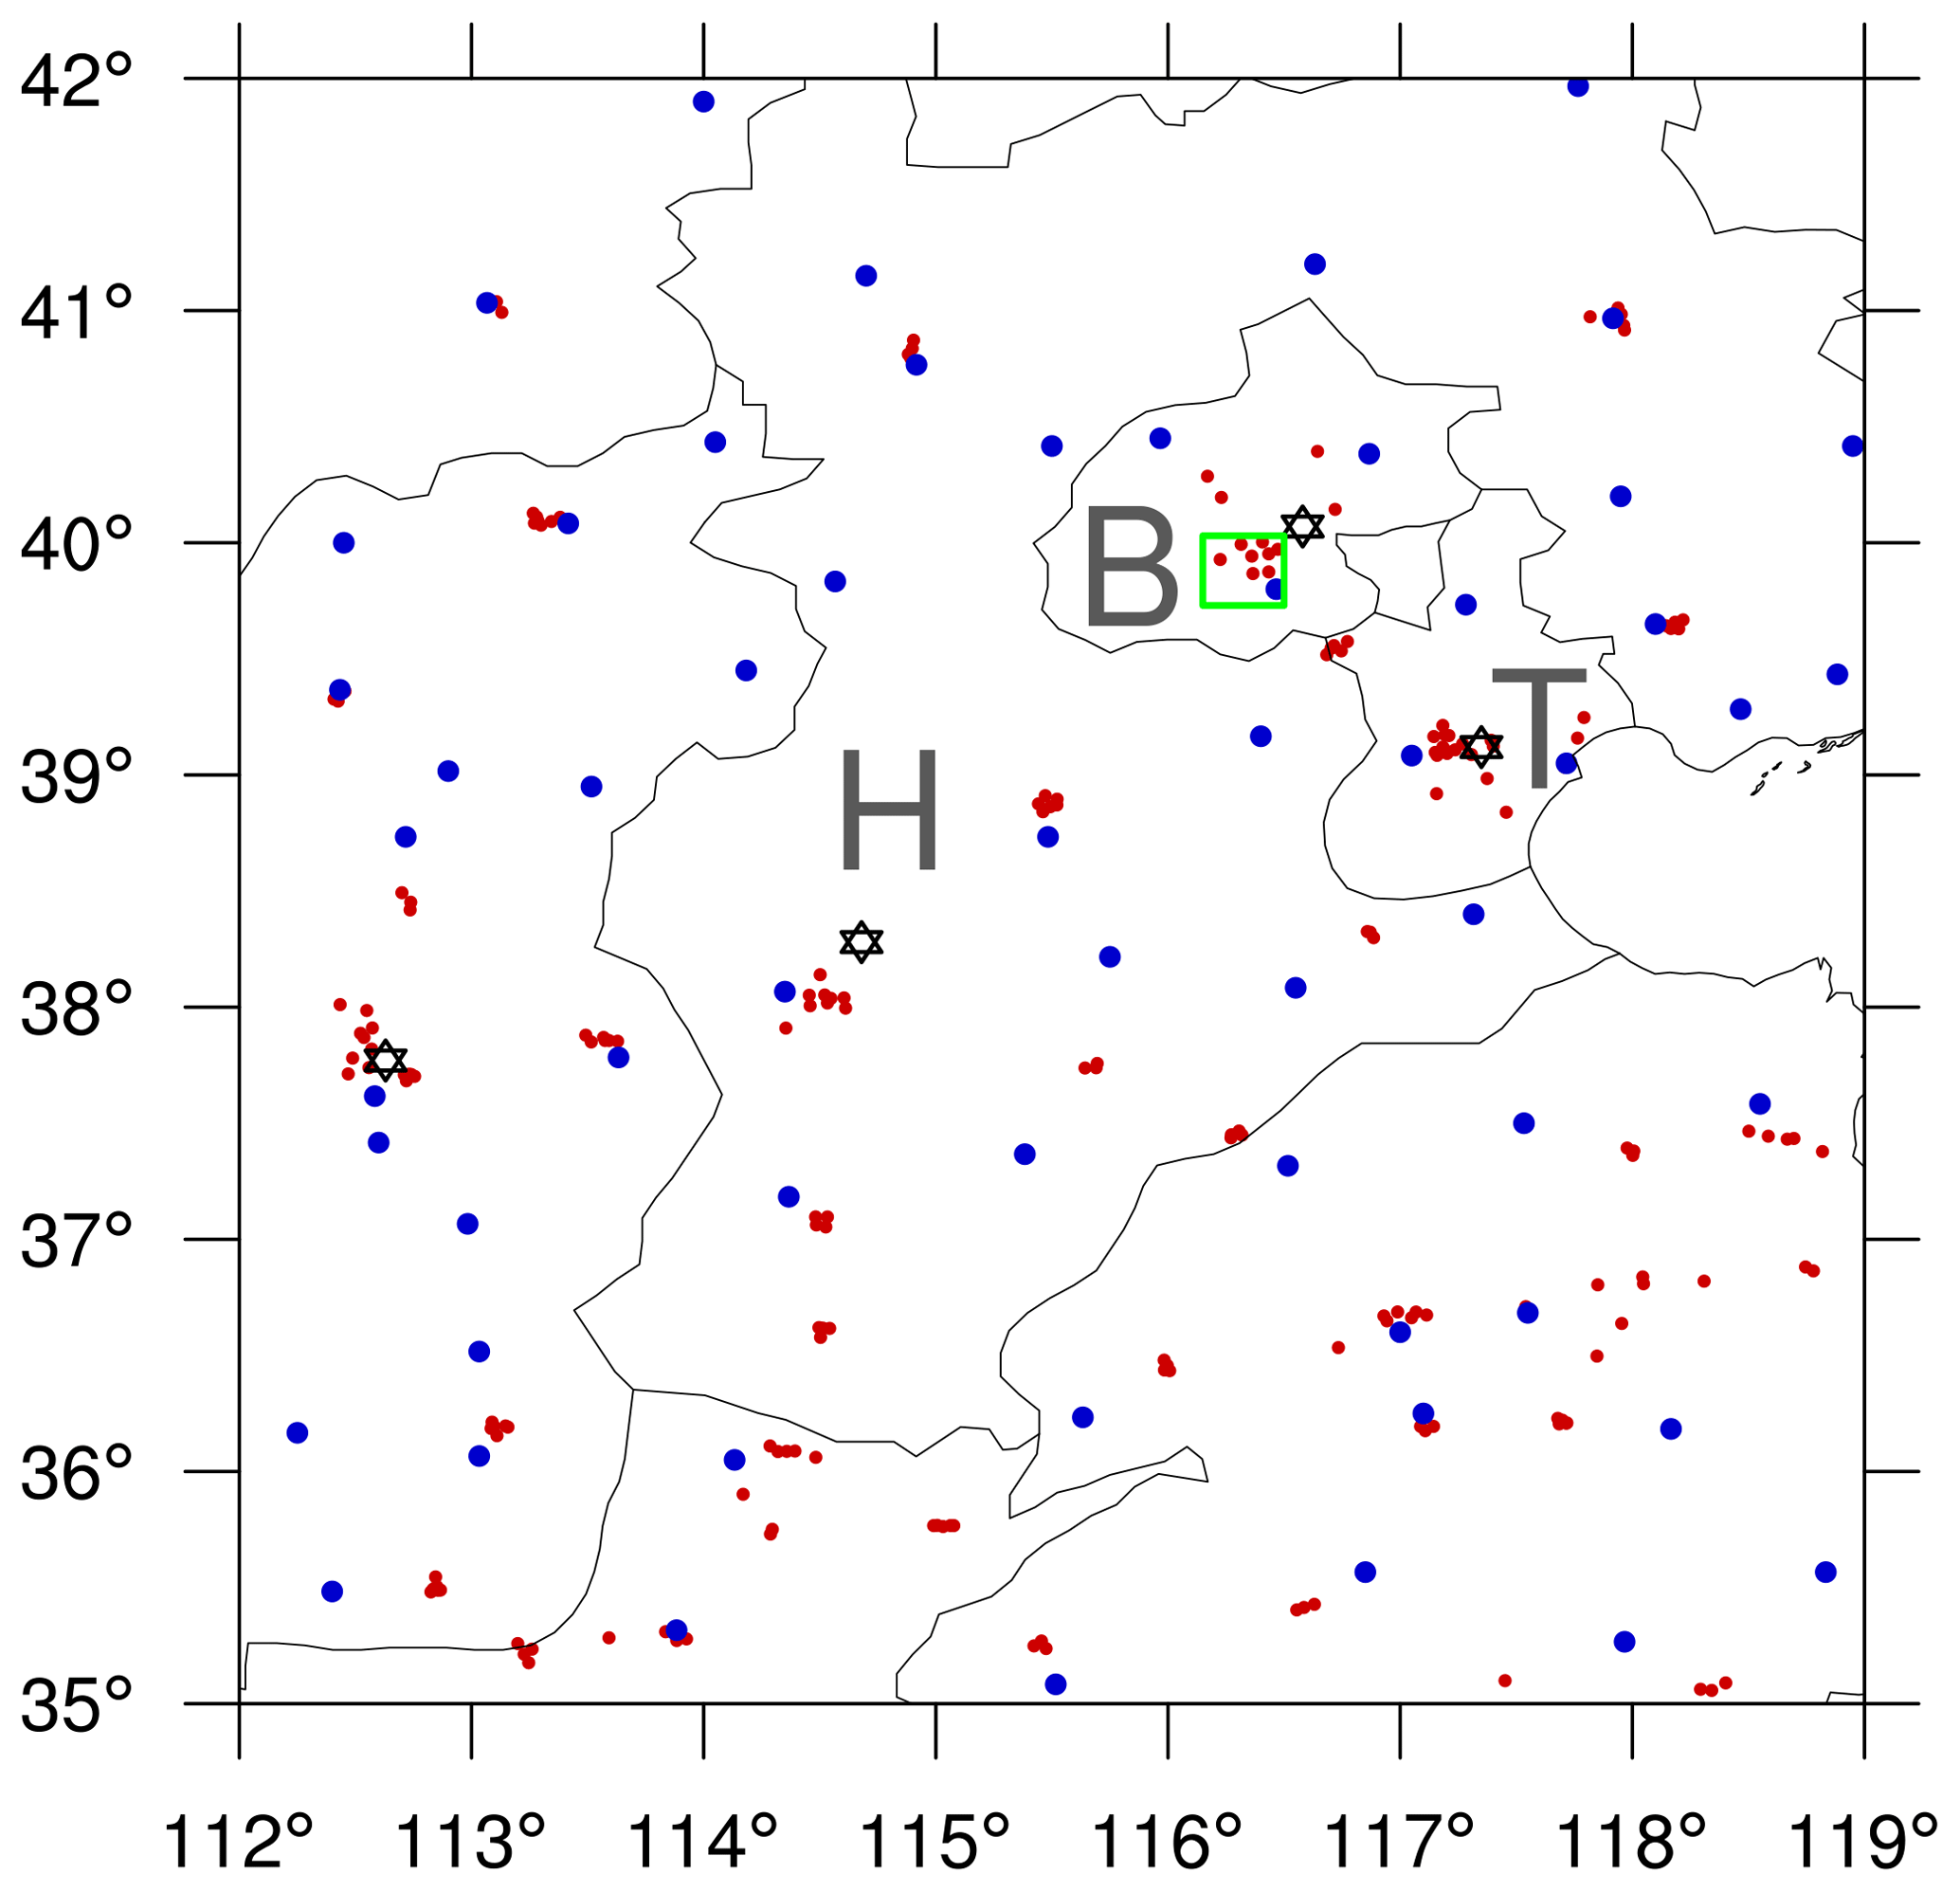
Figure 1Distribution of observational sites over the NCP. Blue dots: daily maximum temperature daily mean wind speed at 10 m and daily total precipitation from the China Meteorological Administration (CMA); red dots: ozone monitoring sites from the China National Environmental Monitoring Centre; black hexagon: hourly temperature at 2 m (T2), specific humidity at 2 m (Q2), wind speed (WS10) and direction (WD10) at 10 m from MADIS; green box: urban area of Beijing. B, H and T represent Beijing, Hebei Province and Tianjin, respectively.
For modeling the meteorological conditions, WRF V3.8.1 is used in this study. The domain is centered at 34∘ N, 110∘ E, with a total of 34 vertical layers and top pressure at 50 hPa. The spatial resolution is 36 km. The physics parameterizations used in this study are the same as in our previous studies (Gao et al., 2017; Zhang et al., 2019), including the Morrison double moment microphysics (Morrison et al., 2009), the Rapid Radiative Transfer Model for General Circulation Models (RRTMG) longwave and shortwave radiation (Iacono et al., 2008; Morcrette et al., 2008), the unified Noah land surface model (Chen and Dudhia, 2001), the Mellor–Yamada–Janjic planetary boundary layer (PBL) scheme (Janjić, 1990, 1994; Mellor and Yamada, 1982), and the Grell–Freitas cumulus scheme (Grell and Freitas, 2014). The initial and boundary conditions were generated from the NCEP Climate Forecast System Reanalysis (CFSR) version 2 (Saha et al., 2013), with a spatial resolution of .
For modeling atmospheric chemistry, the widely used Community Multi-scale Air Quality (CMAQ) model (Byun and Ching, 1999; Byun and Schere, 2006), with the latest version 5.2, was used in this study. The major gas phase chemistry was represented by Carbon Bond version 6 (CB6) and Aerosol Module Version 6 (AERO6) aerosol module. Initial and boundary conditions were from the Model for Ozone and Related chemical Tracers, version 4 (MOZART-4) (Emmons et al., 2010). A dynamical downscaling tool was developed in this study to link the Mozart output to CMAQ, based upon the package of Mozart to WRF-Chem (mozbc: https://www2.acom.ucar.edu/wrf-chem/wrf-chem-tools-community; last access: 23 September 2019). With this tool, the default clean air profile provided by the CMAQ 5.2 package was replaced by more realistic boundary variations at both the surface and different vertical levels. A continuous run from 1 June to 4 July was performed, with the first week discarded as spinup.
The anthropogenic emissions of air pollutants in China were estimated by Tsinghua University, detailed in previous studies (Wang et al., 2014; Zhao et al., 2013, 2017, 2018) and updated based on the Multiresolution Emission Inventory for China (MEIC, ; http://www.meicmodel.org/, last access: 23 September 2019) (Li et al., 2017a).
The biogenic emissions were calculated by the Model of Emissions of Gases and Aerosols from Nature version 2.1 (MEGAN; Guenther et al., 2006, 2012). MEGAN input data includes three components: plant functional type (PFT), leaf area index (LAI) and emission factors (EFs). There is a total of 19 emission species including isoprene and terpenes derived from more than 100 emission compounds. For each of the 19 species, the emission rates Fi (µg m−2 h−1) for a certain grid are defined in Eq. (1), with i denoting the species.
where εi,j and χj are the emission factor and fractional coverage of plant functional type (j) in each grid, respectively. γi is the emission activity defined based on light (denoted as L), temperature (T), leaf age (LA), soil moisture (SM), leaf area index (LAI) and CO2 inhibition (denoted as CI), following Eq. (2).
where CCE is the canopy environment coefficient and 0.57 was used following Guenther et al. (2012).
Compared with the previous version 2.0 with only four PFTs, there are 16 types of PFTs represented in the new MEGAN version (Guenther et al., 2006, 2012), allowing for more accurate estimations of PFT-differentiated emission factors. PFT and LAI data were from the MODIS MCD12Q1 (Friedl et al., 2010) and MCD15A2H datasets (Myneni et al., 2015), respectively. The eight vegetation types in MODIS were apportioned to the 16 PFT types in MEGAN 2.1 based on the temperature zone. For example, MODIS has only one type of broadleaf deciduous trees, while MEGAN 2.1 has three: broadleaf deciduous tropical, temperate and boreal trees. The broadleaf deciduous trees in MODIS are mapped onto the three MEGAN types based on the latitudinal boundaries of the tropical, temperate and boreal zones, with detailed mapping information provided in Table S4 in the Supplement. Monthly mean LAIs were used in this study. The meteorological conditions used to generate biogenic emission in MEGAN were provided by the WRF simulation.
3.1 Observed ozone features
The Technical Regulation on Ambient Air Quality Index (HJ633-2012) defines six classes of ozone-related pollution based on the daily maximum 8 h ozone concentration (MDA8). Classes I and II are clean conditions (MDA8 less than 82 ppbv), class III (82–110 ppbv) indicates slight pollution, class IV (110–135 ppbv) represents medium pollution, and classes V and VI are severe pollution conditions with MDA8 higher than 135 ppbv. Utilizing the observed MDA8 from the China National Environmental Monitoring Centre (http://www.pm25.in, last access: 23 September 2019), we first analyze the severe ozone pollution events, considering their large impact on human health. The observed MDA8 was interpolated to a grid. Figure 2 shows the number of severe ozone pollution days (MDA8 greater than 110 ppbv) during the summer of 2014–2017. The number of severe ozone pollution days in 2017 is larger than 9 in most areas, which is substantially higher than that of the other 3 years when most areas have fewer than 6 d. Frequent occurrence of severe ozone pollution happens in southern Beijing and south of Hebei Province (the area marked with letter H in Fig. 1).

Figure 2The number of severe ozone pollution days (MDA8 greater than 110 ppbv) during the summer of 2014–2017 over the NCP.
3.2 Meteorological factors modulating the high-ozone events
Correlation between MDA8 ozone and daily maximum 2 m temperature (Fig. 3) shows statistically significant values for all 4 years, confirming the significant impact of temperature on ozone. However, the correlation in 2017 is obviously higher than in the other 3 years, and the regression slope of 4.21 ppbv ∘C−1 is about 1.07 to 1.84 ppbv ∘C−1 higher than in the other 3 years, demonstrating the larger impact of temperature in 2017. Both the higher correlation (0.74) and the larger slope in 2017 are contributed mainly by days with ozone above the top 10 % (104 ppbv), which are related to the long-lasting high-ozone periods (see Table S1 and Fig. S1 in the Supplement) during 14–21 June and 26 June–3 July. Removing data above the top 10 % brings the correlation (0.63) and slope closer to those of the other 3 years (Fig. S2). Furthermore, the mean temperature in 2017 is not statistically different from that of the other 3 years, suggesting that the higher temperature period has disproportionate effects on ozone. Jaffe and Zhang (2017) also found a larger regression slope between ozone and temperature during the abnormally warm month of June 2015 in the western US compared to the previous 5 years with more normal temperatures.

Figure 3The correlation between summer MDA8 ozone and daily maximum 2 m temperature (Tmax) for 2014–2017 over the NCP. Regional mean was calculated from the observational sites over the NCP, so each data point corresponds to a regional mean value of MDA8.
To further delve into the meteorological factors modulating the ozone variations in the summer of 2014–2017, the time series of summer MDA8 ozone is shown in Fig. 4, along with daily maximum temperature, wind speed and daily total precipitation. From Fig. 4d, the two long-lasting ozone episodic events (event 1: 14–21 June; event 2: 26 June–3 July) occur during heat waves concomitant with stagnant (calm or low wind speed), dry (little or no precipitation) air and strong solar radiation (not shown), conducive to ozone formation and accumulation. During the first 3 d of these two high-ozone episodic events, the regional mean daily maximum temperature is 32.3 ∘C, accounting for the 90th percentile relative to a 30-year period during 1987–2016. Moreover, almost half of the stations with at least 3 continuous days exceeding their respective 95th percentile from 1987 to 2016, satisfying the definitions of heat waves. This feature during the heat wave period was illuminated in Table S2 as well, showing that among all the observational stations with MDA8 ozone exceeding 110 ppbv, 87 % (62 %) and 96 % (81 %) occur with daily precipitation less than 1 mm (daily precipitation less than 1 mm and daily mean wind speed lower than 3 m s−1). Long-lasting hot and stagnant weather conditions were not clearly observed during 2014–2016 (Fig. 4a–c).
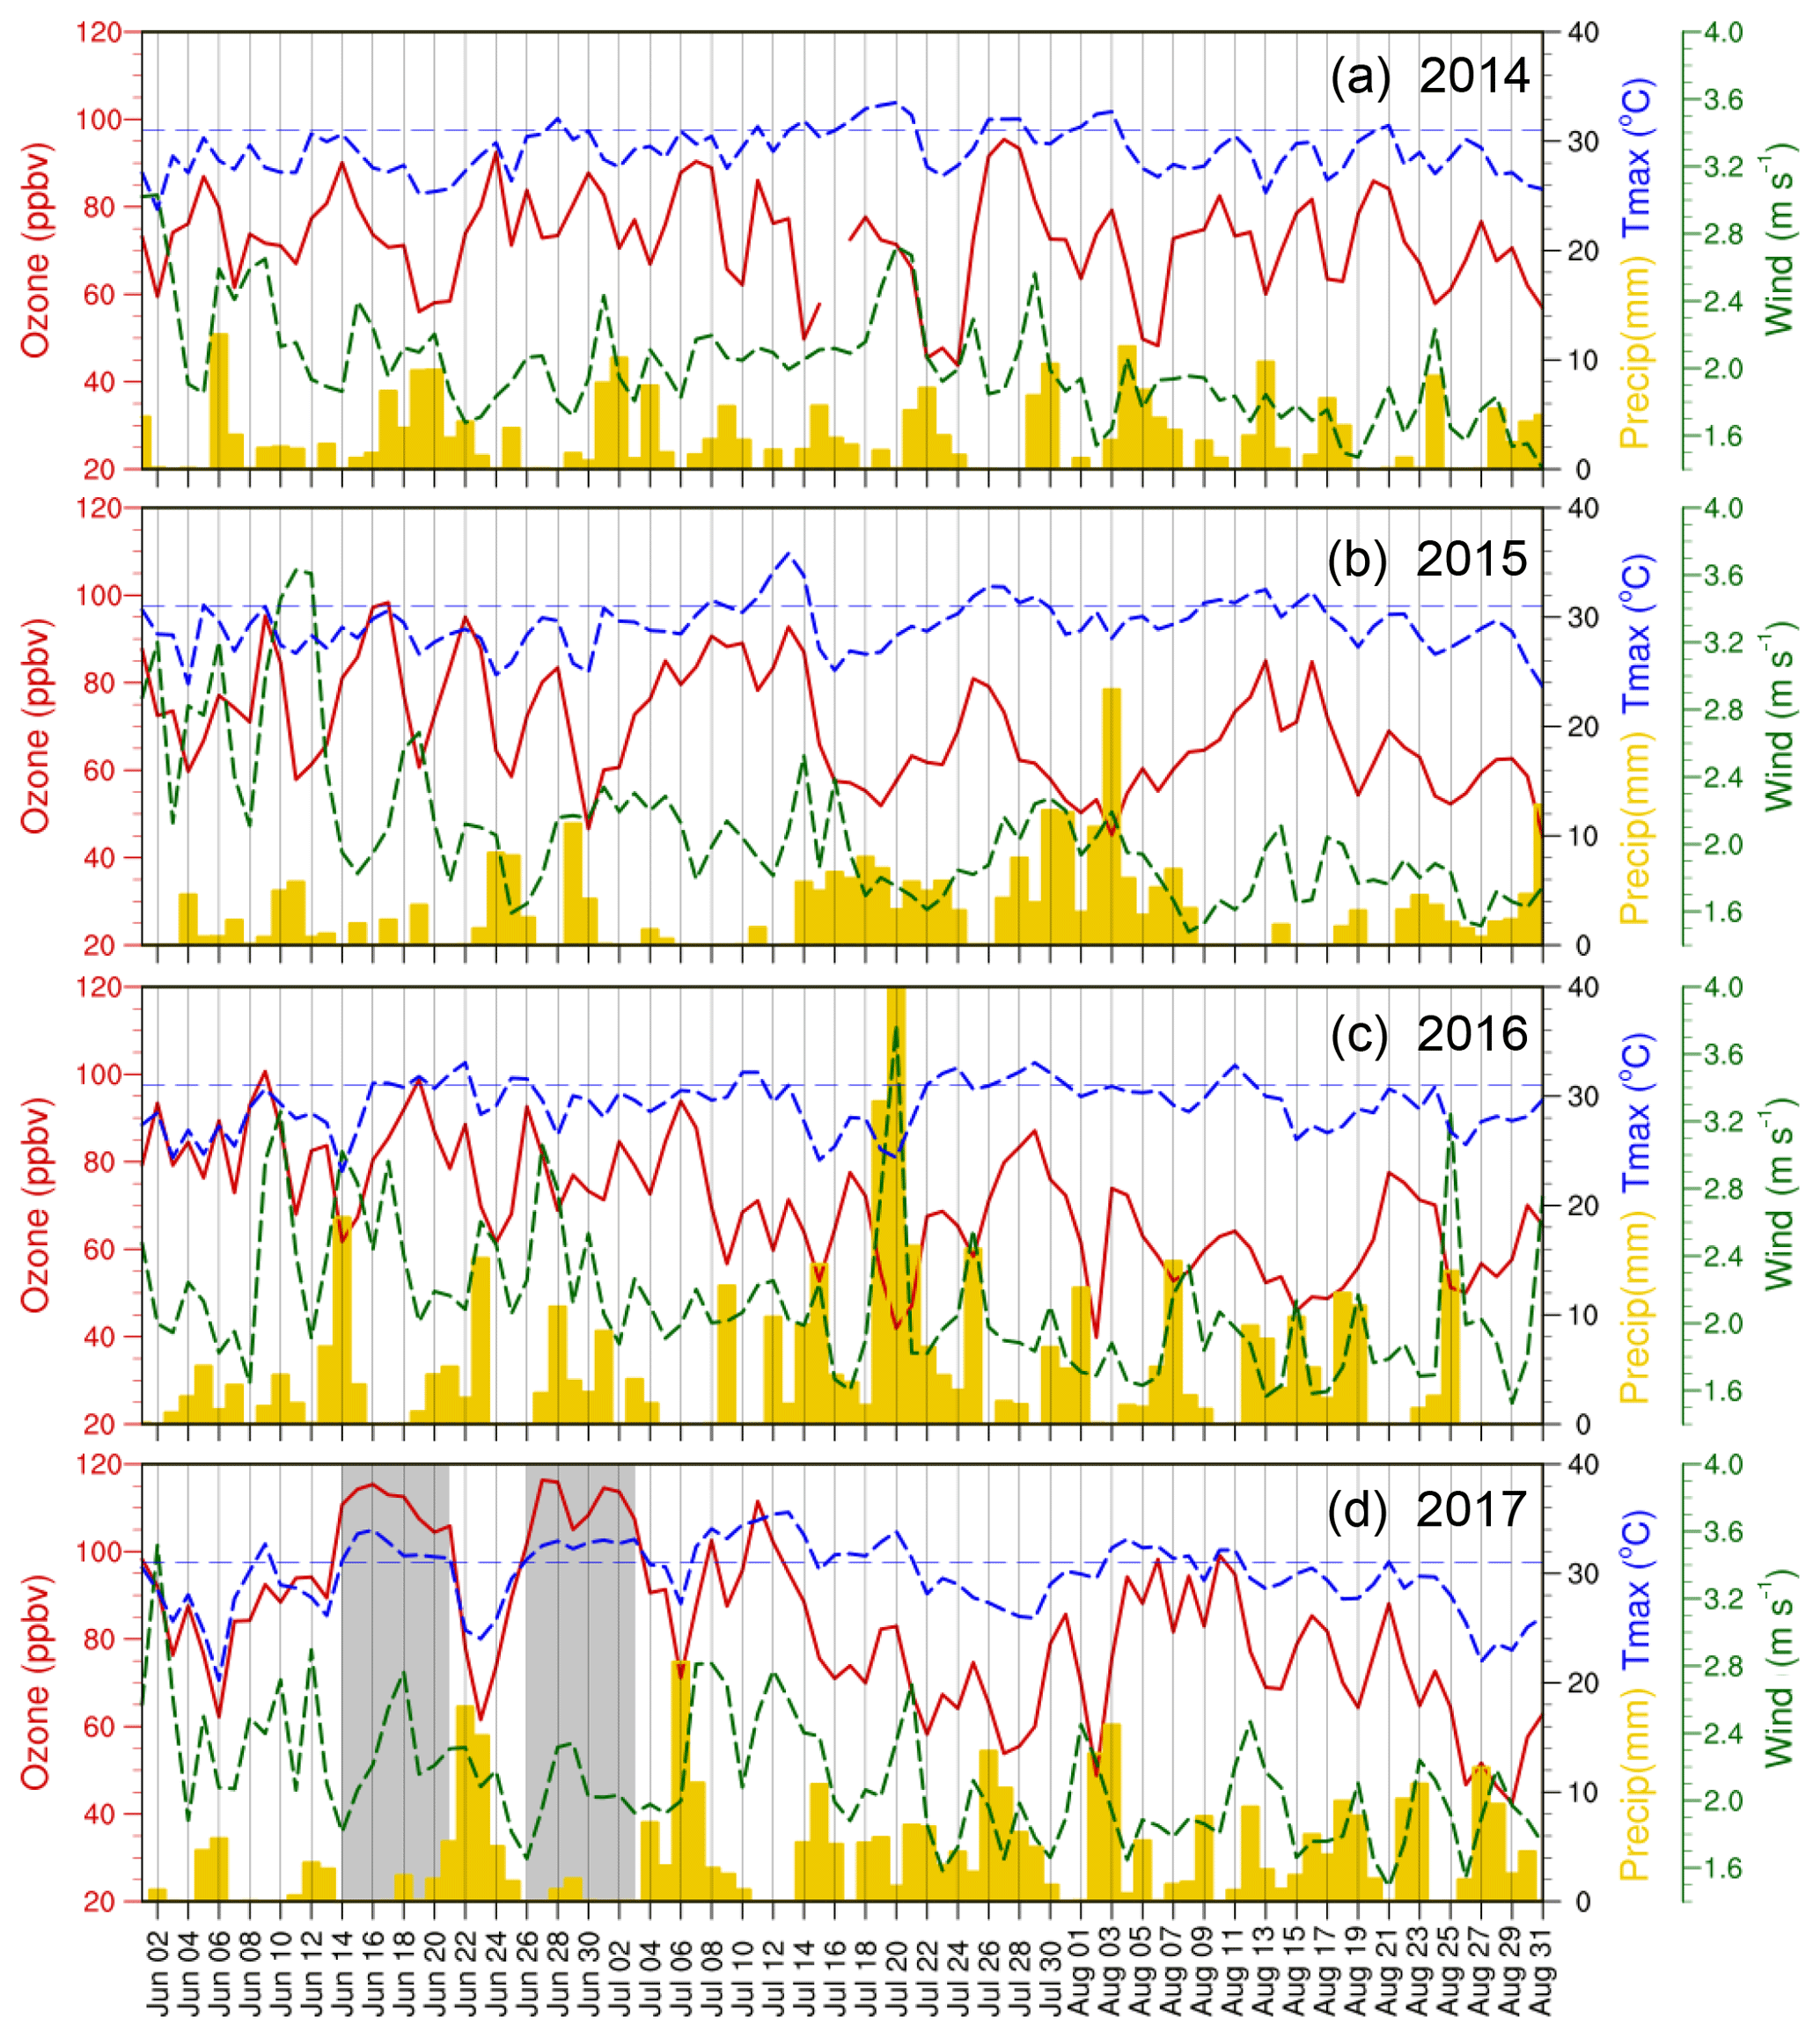
Figure 4Time series of observed MDA8 ozone (red lines; based on sites from the China National Environmental Monitoring Centre; red points in Fig. 1), daily maximum temperature at 2 m (blue lines), daily mean wind speed at 10 m (green lines) and daily total precipitation (yellow bars) over the NCP (based on sites from CMA; blue dots in Fig. 1) during the summer from 2014 to 2017. The regional precipitation was set to zero for a certain day if less than 15 % (9 sites) of the total sites (58 sites) with daily total precipitation greater than 1 mm. The horizontal blue dashed lines in each panel denote 31 ∘C.

Figure 5The correlation between summer MDA8 ozone and daily maximum VPD during 2014–2017 over the NCP. Regional mean was calculated from the observational sites over the NCP, so each data point corresponds to a regional mean value of MDA8.
3.3 Effect of land use and biogenic emission on ozone
Biogenic emissions contribute importantly to ozone formation. The MEGAN model has been widely used to simulate biogenic emissions in air quality modeling studies (Guenther et al., 2012), but recent research suggested that biogenic emissions may be underestimated in the model for several reasons:
- a.
water-stressed impact on biogenic emissions. Zhang and Wang (2016) found that two high-ozone events in the US were associated with excess isoprene release due to dry and hot weather conditions that induced water stress in plants. The increased vapor pressure deficit (VPD; the pressure difference between saturation vapor and ambient vapor) drives the release of more isoprene, but the VPD effect on biogenic emissions has not been taken into consideration in MEGAN 2.1, so the subsequent influence of biogenic emissions on ozone may be largely underestimated. Zhang and Wang (2016) suggested a doubling of daily biogenic isoprene when the daily VPD reaches 1.7 kPa or greater. It should be noted that this parameterization was based upon the observed information over the US; more tests may be needed in future when applying it to areas besides the US. The monthly mean VPD spatial distribution in June 2017 (Fig. S3) as well as the high correlation between observed MDA8 ozone and VPD (Fig. 5; with time series shown in Fig. S4) suggest enhanced isoprene emission in the NCP, so we will test this VPD mechanism using model simulations. Please note that in the latest version MEGAN 3 (Jiang et al., 2018), a new approach was developed to quantify the drought effect on the isoprene emissions based on both photosynthesis and water stress, yielding a general reduction of monthly mean isoprene emission across the globe, including northern China. The impact of changes in isoprene emissions, based on the new method, on ozone formation deserves further evaluation in future.
- b.
Effect of changes in land cover on biogenic emissions. As reflected by the much higher emission factor, biogenic isoprene emission is enhanced in broadleaf forest relative to other land cover types such as needleleaf forest, shrub, grass or crop (Table 2 in Guenther et al., 2012). In the NCP, broadleaf tree is the dominant land cover type, and its coverage has been increasing dramatically since the 1970s, primarily as a result of the Three-north Protection Forest System project. For example, based on Moderate Resolution Imagine Spectroradiometer (MODIS) land use data (Friedl et al., 2010), the coverage of broadleaf deciduous temperate trees nearly doubled from 2003 to 2016 over the NCP (Fig. 6a–c). This has resulted in a substantial increase in isoprene emissions between 2003 and 2016 (Fig. 6), particularly north of Beijing, Hebei and Tianjin, where the increase is more than 200 %. Combining point (a) described above, the underestimation of biogenic emission due to changes in land cover may be exaggerated in years with high temperatures and high VPD. It is vital to quantify the effect of land cover changes on biogenic emissions such as isoprene and the subsequent impact on ozone formation.
- c.
Impact of urban landscape on biogenic emission. The land use type cataloged in the MODIS MCD12Q1 product (Friedl et al., 2010) does not take into consideration urban green spaces, which may lead to a 15 % underestimation of total BVOC emissions in 2015 over Beijing (Ren et al., 2017). Generally, urban ozone production is highly sensitive to VOC emissions (Xing et al., 2011; Liu et al., 2012). Bell and Ellis (2004) found a doubling of ozone in urban areas relative to rural areas for the same percentage increase in biogenic emissions. The impact of biogenic emission from urban landscape on urban ozone formation has not been considered in previous studies. For a sensitivity analysis, we added a 15 % increase in the total BVOC emissions in Beijing to investigate their impact on urban ozone formation. These emissions were distributed evenly in the urban core area of Beijing as the increase in biogenic emissions from urban landscape were only available for Beijing.

Figure 6Spatial distribution of broadleaf deciduous trees in 2003 (a), 2016 (b) and their differences (2016–2003; c) and the biogenic isoprene emissions during the heat wave periods (14–21 June; 26 June–3 July 2017) based on the land cover in 2003 (d), 2016 (e) and their differences (2016–2003; f).
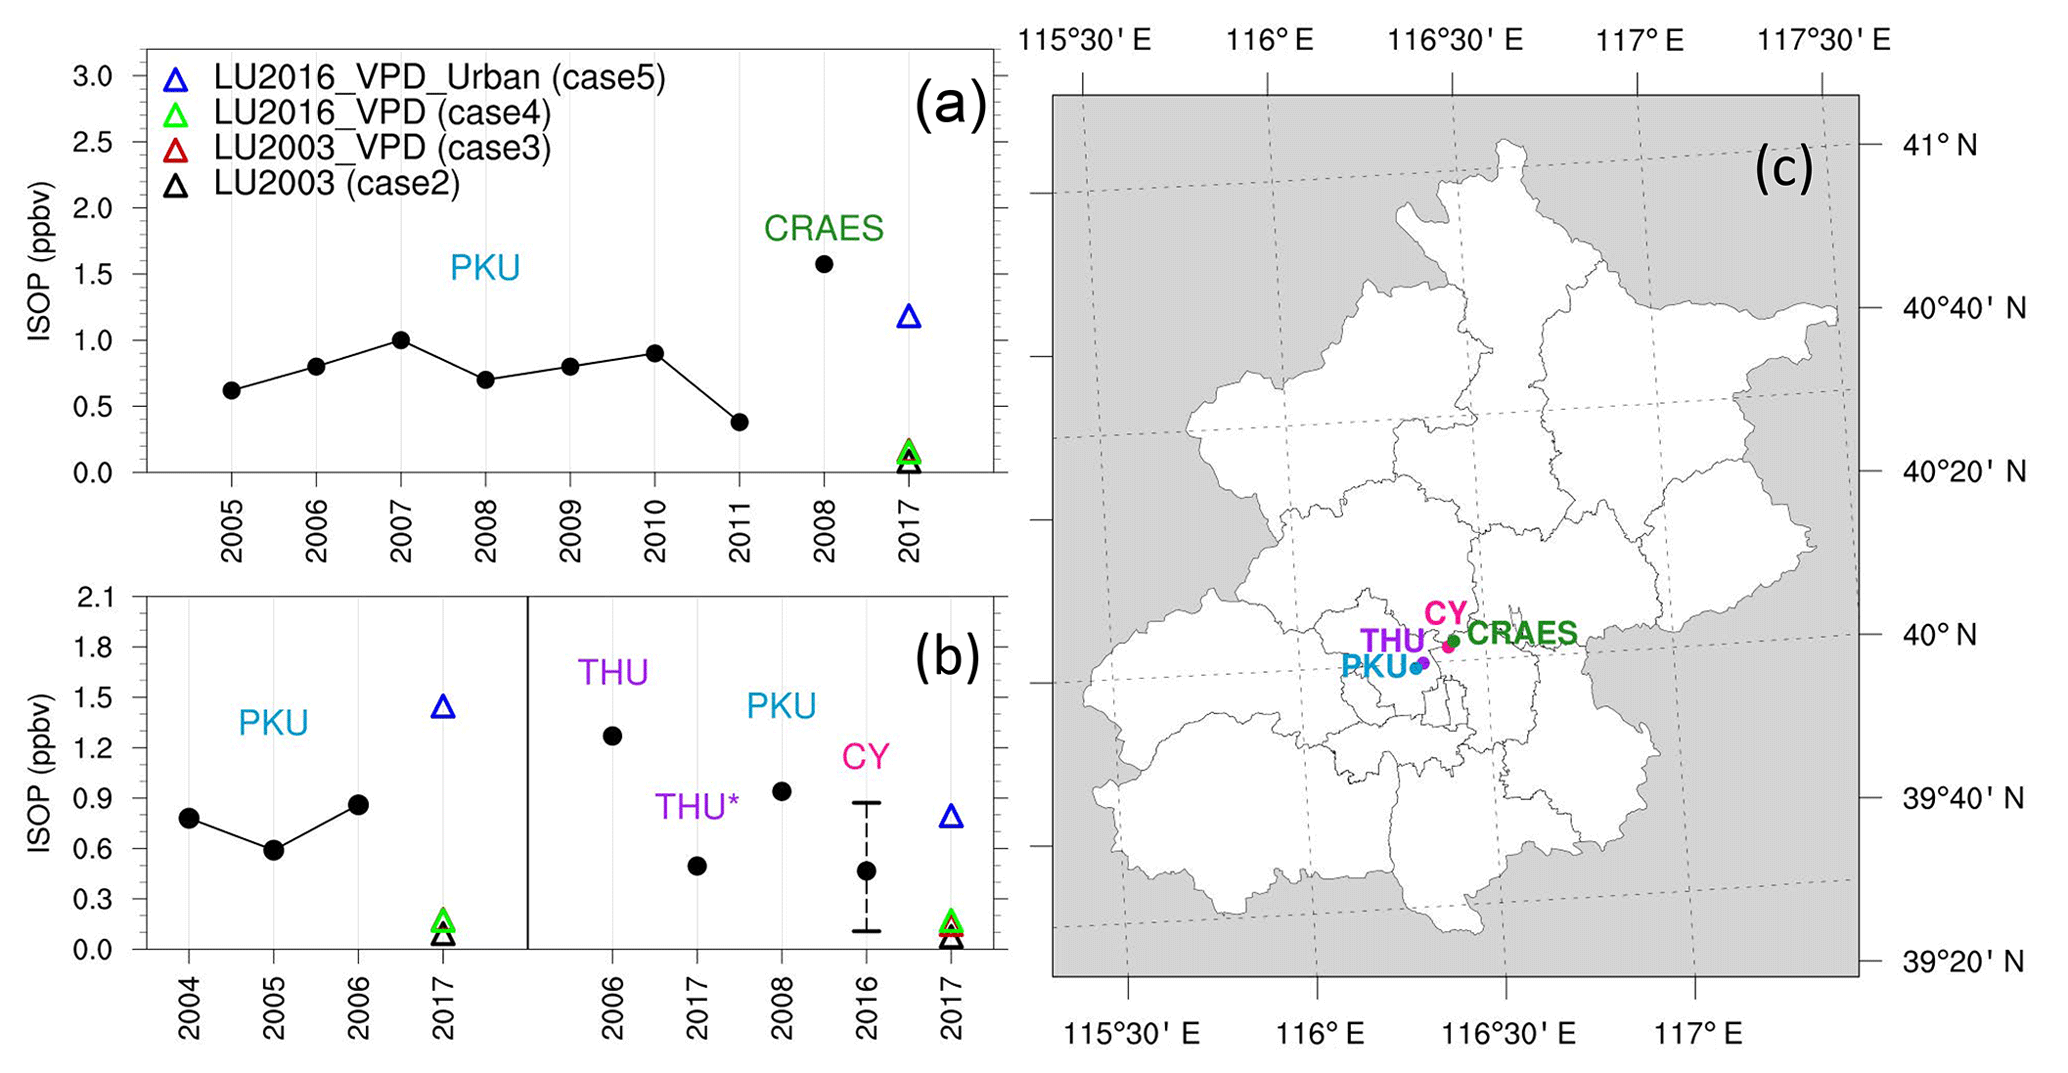
Figure 7The comparison of isoprene concentrations between model simulations and observations in Beijing. The black dots represent the observed data from various contributions to the literature, whereas the hollow triangles (in black, red, green and blue) represent the model simulations for the four cases described above (cases 2–5). For each observational dataset, the corresponding reference number is given after the site name in (a) and (b), with site locations shown in (c). One exception is the unpublished work in THU* which is from the observations using a proton-transfer reaction time-of-flight mass spectrometer (PTR-ToF-MS) conducted by Tsinghua University (paper in preparation). Please note that no observation period matches our simulation time exactly, making the comparison more qualitative rather than quantitative. However, the model evaluation did match the respective location and time (i.e., daytime or selected hour) among different observations. The model simulation period used in the comparison is from 8 June to 4 July 2017. For observations, in (a), the dots represent the mean isoprene concentrations during daytime in August from 2005 to 2011 at Peking University (PKU; Zhang et al., 2014; left side of a) and from 16 July to 18 August 2008 at the Chinese Research Academy of Environmental Science (CRAES; Yang et al., 2018; right side of a). In (b), the dots on the left represent the mean isoprene concentration from 08:00 and 16:00 (local standard time) in August from 2004 to 2006 (with detailed measurement time shown in Table 1 of Shao et al., 2009) in PKU. The observational data on the right side of (b) are on a daily mean scale during a certain period (with one site of CY showing minimal and maximal daily mean values during the period) from four sources. The two leftmost dots are located at the campus of Tsinghua University (THU), with one from 15 to 20 August 2006 (Duan et al., 2008) and the other from 14 July to 5 August 2017 (paper in preparation as explained above). The third dot represents data measured at PKU from 24 July to 27 August 2008 (Liu et al., 2015), and the fourth dot indicates data observed at Chaoyang District (CY; Gu et al., 2019).
To elucidate the mechanism modulating the ozone events discussed above, the regional meteorology and air quality model WRF/CMAQ was used to conduct simulations from 8 June to 4 July 2017. The WRF simulations generally meet the benchmark standard for meteorological variables (Table S3). For air quality simulations, five scenarios were designed, with biogenic emissions ignored in the base case. Compared to the base case, case 2 adds biogenic emission associated with the land cover of 2003 and cases 3, 4 and 5 are the same as case 2 except for the inclusion of the VPD effect, both VPD and land cover of 2016, and VPD and land cover of 2016 combined with the effect of urban green spaces, respectively. To validate the reasonableness of adding the biogenic emission, we first evaluate the simulated isoprene concentration, one of the most important species closely related to ozone formation, from WRF/CMAQ among different cases. Since there is a lack of observed ambient isoprene concentration during this study period, the data available (mostly over Beijing) from the literature were retrieved and used as cross comparison with the model results (Fig. 7). From Fig. 7a, b, the observed mean isoprene concentration ranges from 0.4 to 1.6 ppbv at various sites of Beijing. By taking into consideration isoprene emissions from VPD, land cover of 2016 and urban green spaces (case 5) the model simulations yield the best performance, with isoprene concentration of 0.8 ppbv to 1.4 ppbv. However, the other cases (with isoprene concentrations of 0.1 ppbv to 0.2 ppbv) substantially underestimate the isoprene concentrations. Therefore, the isoprene emissions from urban green spaces (comparing case 5 and case 4) in Beijing play a vital role in the isoprene concentrations, which subsequently affect the ozone formation which will be further evaluated and discussed below.
Since the effect of urban landscape was only applied to Beijing in case 5, we use case 4 (combination of VPD and land cover change effects) (referred to as B_MDA8) as the reference. Therefore, we first compare MDA8 ozone in case 4 with observations. To facilitate the comparison, observational data were interpolated to the model grids, and reasonable performance is achieved with an MFB/MFE (mean fractional bias and mean fractional error) of −7 %/16 % (Fig. 8). Considering the mean bias likely attributed to the factors such as emission uncertainty or model inherent biases, a bias correction was applied to each case by adding 7 % of mean observed MDA8 ozone from 8 June to 4 July 2017.

Figure 8MDA8 ozone evaluation over the NCP from 8 June to 4 July in 2017. NMB, NME, MFB and MFE represent normalized mean bias, normalized mean error, mean fractional bias and mean fractional error, respectively.
Zooming into the two ozone episodic events (14–21 June, 26 June–3 July), the mean MDA8 values of case 4 are 98.02, 108.89, 95.75 and 98.98 ppbv for the NCP, Beijing, Hebei and Tianjin, respectively, during the heat wave periods (14–21 June 2017; 26 June–3 July 2017), whereas the MDA8 ozone value for the case (case 1) without biogenic emission are 87.15, 93.06, 84.78 and 89.65 ppbv for the corresponding region. The ozone increment from case 2 to case 5 (as well as observations; magenta stars in Fig. 9a) relative to case 1 is shown in Fig. 9a for these regions. Including biogenic emission based on the land cover of 2003 (case 2) yields an extra mean MDA8 ozone of 7.84 ppbv (8 % of B_MDA8), 9.96 ppbv (9 % of B_MDA8), 7.86 ppbv (8 % of B_MDA8) and 6.99 ppbv (7 % of B_MDA8) for the NCP, Beijing, Hebei and Tianjin, respectively (yellow bars in Fig. 9a), compared to case 1. Including the VPD effect (case 3) adds an extra mean MDA8 of 1.71 ppbv in the NCP compared to case 2, and the enhancement is highest in Beijing (3.08 ppbv) (green bars in Fig. 9a). Additional MDA8 ozone enhancement is simulated by including the effect of land cover change (increase in natural broadleaf forest; Fig. 6a–c; case 4), i.e., an extra MDA8 of 1.32 ppbv in the NCP relative to case 3, with the highest contribution of 2.79 ppbv in Beijing (blue bars in Fig. 9a). The urban landscape (case 5) in Beijing yields an extra 4.74 ppbv or 4 % of MDA8 compared to case 4, almost doubling the effect of VPD and land cover change in Beijing. The larger percentage increase in MDA8 ozone (41 % from Fig. 9a, which is shown in Fig. 9b as well) due to urban landscape relative to the prescribed 15 % increase in BVOC emission in Beijing supports the notion of an amplified MDA8 ozone response in urban areas because of the high sensitivity of ozone to VOC emissions, which well matches observational data (magenta star).
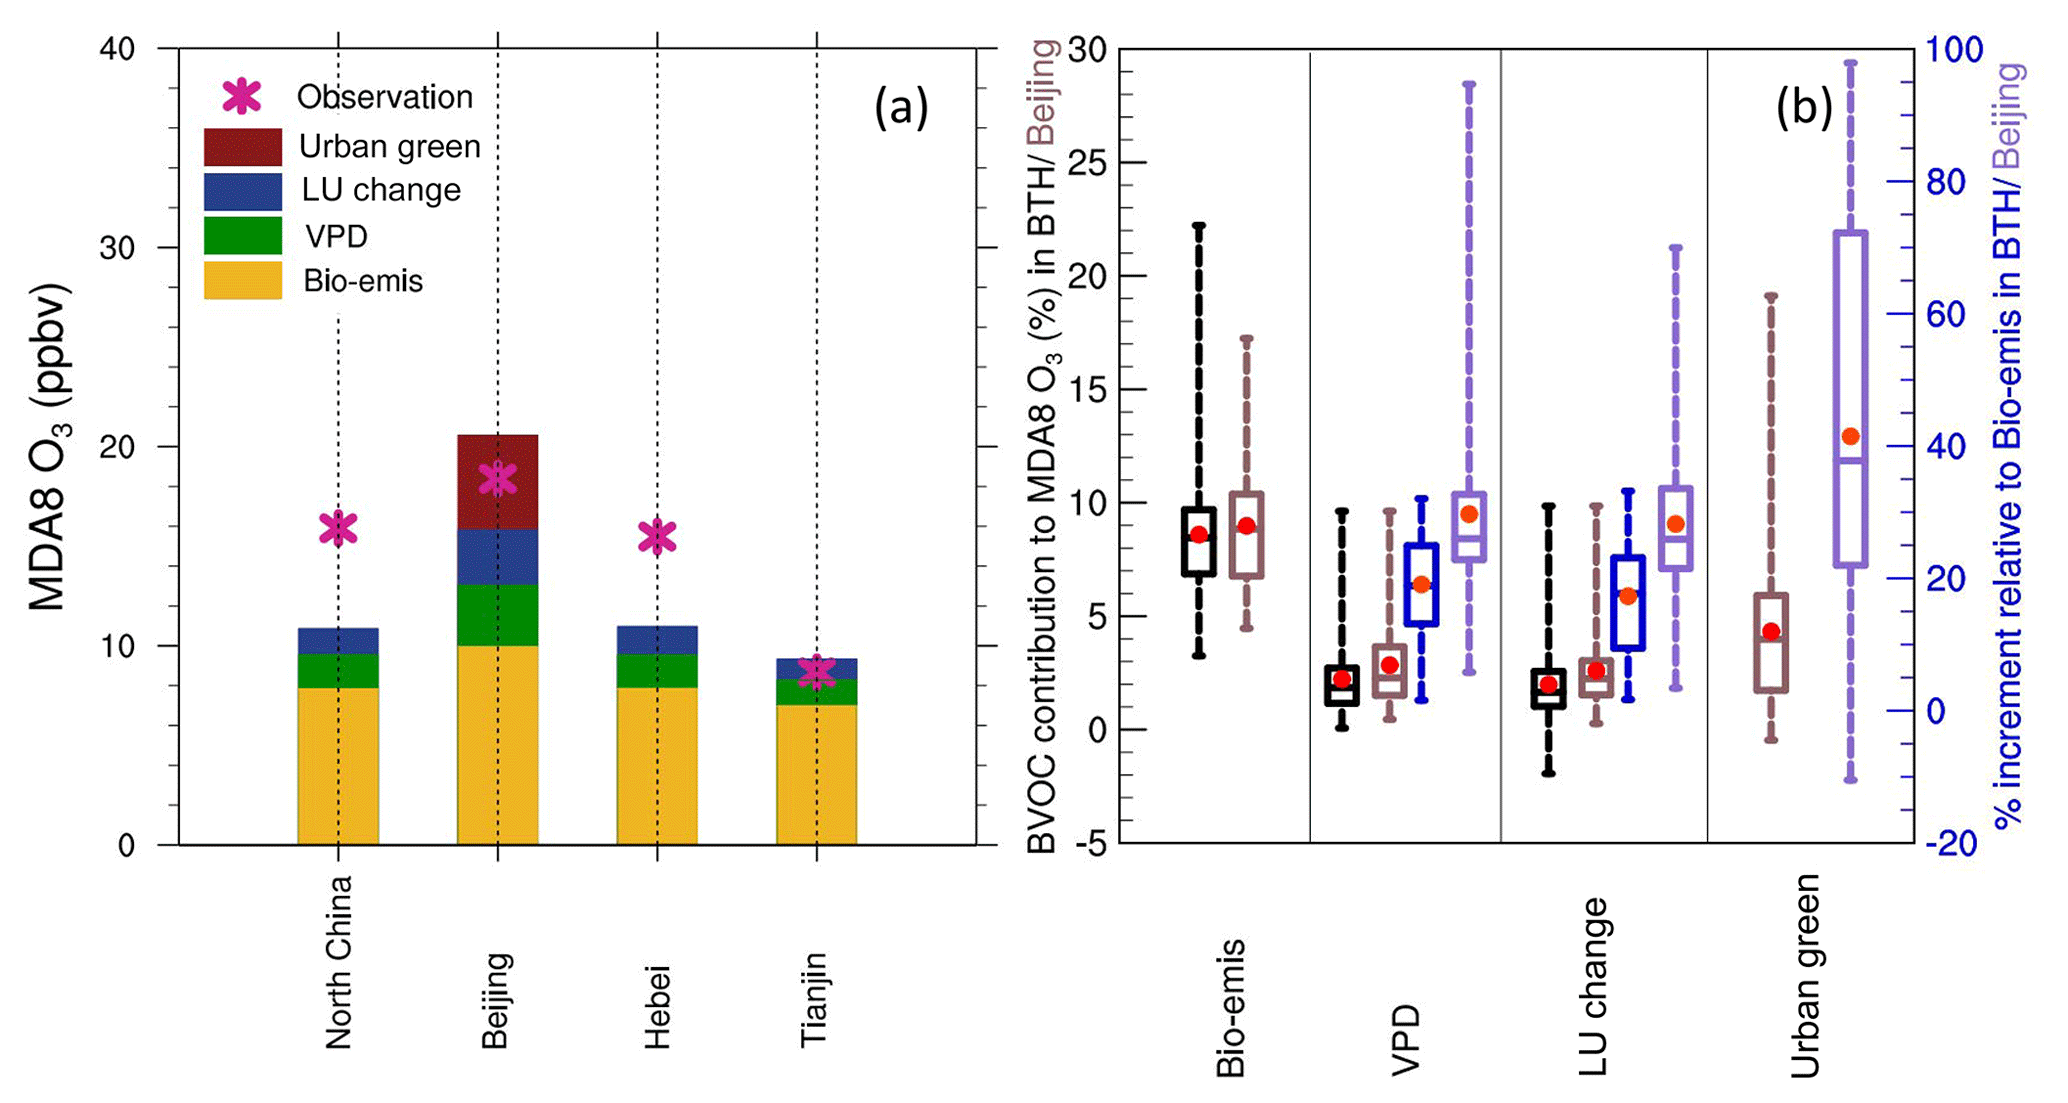
Figure 9Biogenic contribution to MDA8 ozone during the heat wave periods (14–21 June; 26 June–3 July), shown by the individual (a) and percentage contribution (b) of standard biogenic emissions (Bio-emis) using MEGAN 2.1 with the land cover of 2003 (Bio-emis), VPD effect, land cover (LC) change and urban green spaces. The color bars (a) represent the simulated contributions of biogenic emissions (yellow), VPD (green), land use changes (blue) and urban green (red) to the MDA8 ozone concentrations in the NCP, Beijing, Hebei and Tianjin, respectively. The magenta stars in (a) represent the observed biogenic emissions calculated by subtracting the contribution to MDA8 ozone simulated in the base case from the observed total MDA8 ozone. The box-and-whisker plot shows the contribution of biogenic emissions, VPD, land cover change and urban green spaces to the total MDA8 ozone in BTH (black) and Beijing (brown) (y axis on the left), and the percentage increment (right y axis) of VPD, land cover change, and urban green relative to MDA8 induced by Bio-emis for BTH (blue) and Beijing (purple). Please note that urban green spaces are only available for Beijing. The top and bottom edges of the boxes represent the 75 and 25 percentiles, with the centered line and red dot showing the median and mean, respectively.
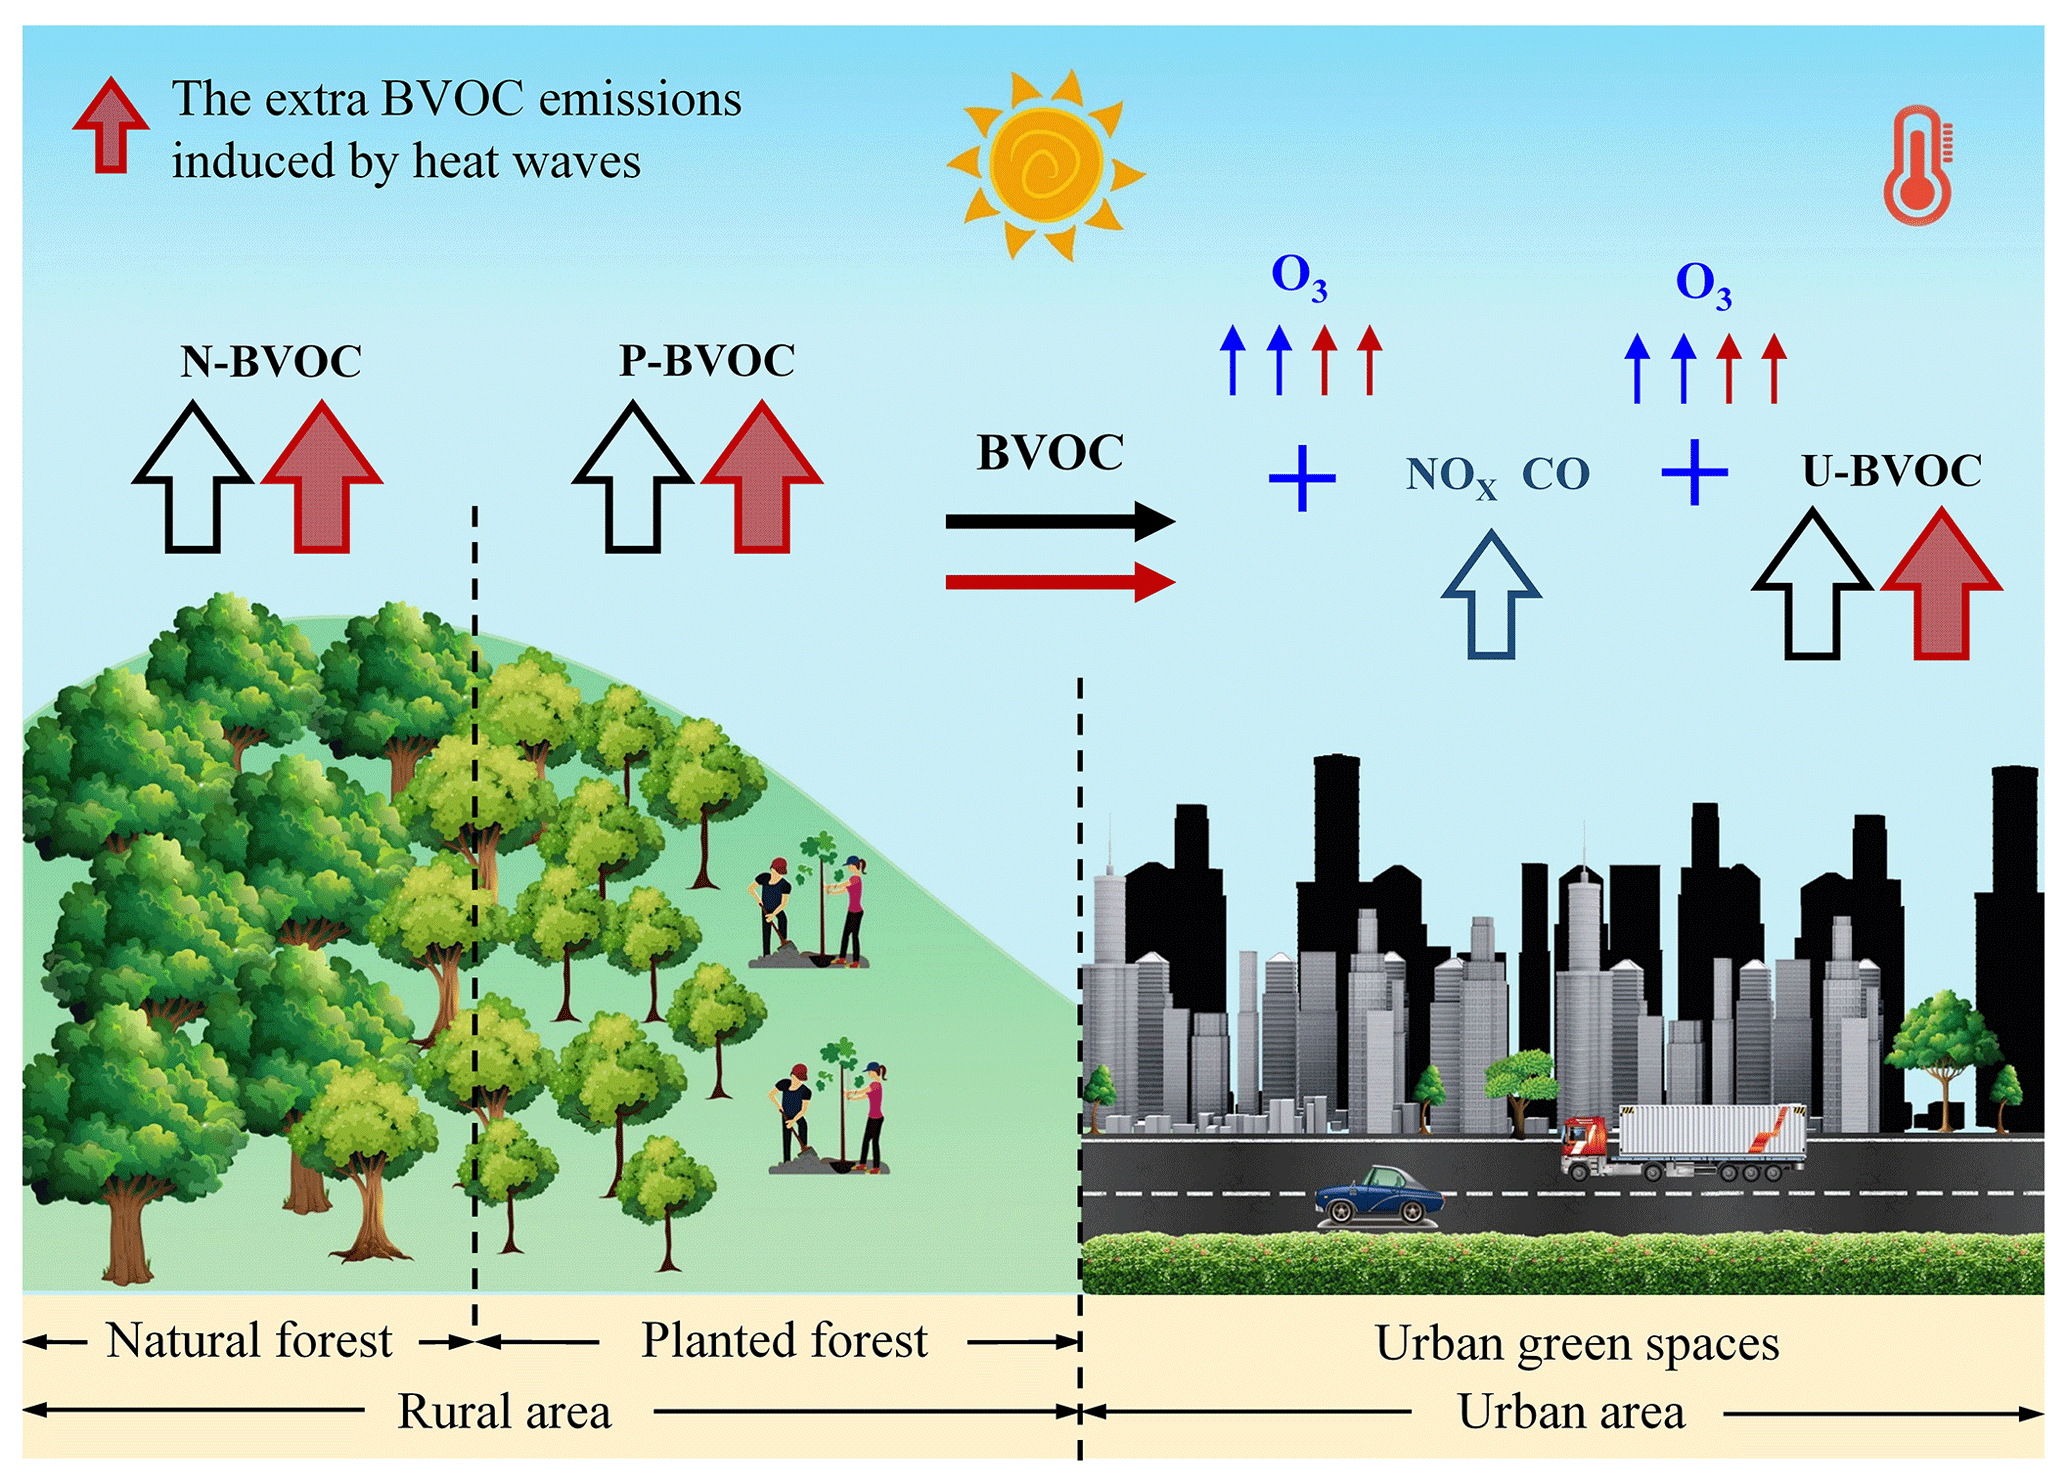
Figure 10A schematic diagram of the impact of biogenic emission on ozone formation. N-BVOC refers to natural biogenic emission, P-BVOC refers to the biogenic emission from planted forest and in this study represents the increase in forest coverage. U-BVOC refers to urban BVOC generated from urban green spaces. The red thick upward arrows indicate that extra VOCs may be induced by the heat waves.
To further illustrate the contributions of BVOC to MDA8, Fig. 9b shows the contribution of biogenic emissions (Bio_emis, based on land cover of 2003), VPD, land cover change and urban landscape (or urban green) to MDA8 as a fraction of the MDA8 of B_MDA8 (left y axis in Fig. 9b) and as a percentage increment relative to the MDA8 contributed by biogenic emissions in case 2 (right y axis in Fig. 9b) in BTH (Beijing, Tianjin, Hebei; with letters B, T and H marked in Fig. 1) and Beijing. For BTH, the mean contribution to B_MDA8 is 9 %, 2 % and 2 % for Bio_emis, VPD and land cover change (red dots in the black bars in Fig. 9b), respectively, with maximum contributions of 22 %, 10 % and 10 %. For Beijing, the contributions of Bio_emis, VPD, land cover change and urban landscape are 9 %, 3 %, 3 % and 4 %, respectively (red dots in the brown bars in Fig. 9b). Urban landscape (19 %) contributes more than Bio_emis (17 %) in the urban area of Beijing in terms of the maximal contribution (maximum value of the brown box in Fig. 9b). Compared with Bio_emis, the mean increments are 19 % and 17 % for VPD and land cover change (red dots in the blue bars in Fig. 9b). For Beijing, the mean additional enhancements are 30 %, 28 % and 41 % for VPD, land cover change and urban landscape relative to Bio_emis (red dots in the purple bars in Fig. 9b), with a combined increment of 99 % compared to the MDA8 ozone contributed by biogenic emission based on the land cover of 2003. Although only grid cells with both simulations and observations available are used in Fig. 9b, the results are similar if all model grids points are used (not shown).
In order to demonstrate whether changes in land cover and VPD play any role during normal ozone conditions, we conducted another sets of simulations (the same as cases 2–4 discussed above) from 8 June to mid-July in 2016, a similar period as in 2017. The mean MDA8 ozone concentrations over the NCP during this entire period in 2017 for case 2 is 79.03 ppbv, and statistical significant enhancement (1.34 ppbv) was achieved in case 3. In comparison to case 3, the land cover change in case 4 shows a statistically significant increase as well (1.13 ppbv). As expected, looking at the entire period in 2016 (8 June–4 July), a statistically significant (and even higher in comparison to 2016) increase was achieved in case 3 (1.55 ppbv) compared to case 2 (90.11 ppbv) and case 4 (1.23 ppbv) compared to case 3. Therefore, the land cover and VPD may be applied in both episodic events and conditions with normal ozone concentrations.
Herein the mechanisms for ozone enhancement are summarized in the schematic of Fig. 10. Both natural and anthropogenic emissions contribute to ozone formation. Because of the Three-north Protection Forest System project, natural forest north of Beijing has more than tripled in area coverage compared to 2003, leading to an increasing trend in biogenic emissions. Under heat wave conditions, biogenic emissions may be further enhanced through the effect of VPD in addition to the effect of temperature. For urban areas, even more biogenic emissions may be emitted from urban landscapes. All these mechanisms for increasing biogenic emissions could enhance ozone formation, particularly over urban areas such as Beijing.
The mechanisms contributing to the severe ozone pollution events in the summer of 2017 in the NCP were investigated. Two severe tropospheric ozone pollution events occurred in the NCP during the periods of 14 to 21 June and 26 June to 3 July. We provided support for the roles of the observed meteorological conditions including high temperature and stagnant dry weather, which favor high ozone concentrations. More importantly, the influence of biogenic emissions on ozone formation was investigated in more detail by incorporating important biogenic emission factors that are typically ignored in regional model simulations. Biogenic emissions based on the land cover of 2003 yields an extra mean MDA8 ozone of 7.84 ppbv for the NCP. Including the VPD effect and land cover change adds 1.71 and 1.32 ppbv of ozone in the NCP. These contributions are even larger in Beijing, with VPD adding 3.08 ppbv and land cover change adding 2.79 ppbv. Most notably, biogenic emissions from urban landscape (i.e., green spaces) have so far not been considered in ozone regional modeling studies to our knowledge. By adding this source in the urban area of Beijing, substantial ozone enhancement was simulated, bringing the WRF/CMAQ simulation of MDA8 closer to observations. The urban landscape in Beijing yields an extra 4.74 ppbv of MDA8, comparable to the combined effect of VPD and land cover change in Beijing. Together, the combined effect of VPD, land cover change and urban landscape doubles the effect of biogenic emission calculated based on the land cover of 2003 and not including the VPD and urban landscape effects. Please note that although the urban isoprene emission from landscape in Beijing only accounts for 15 % (Ren et al., 2017), the location of the emissions may play a much larger role in contributing to the urban isoprene concentration. As was shown in Fig. 6, most of the isoprene emissions from the forest in Beijing are located in the rural area, which is relatively far from the urban area. Considering the short lifetime of isoprene, it may not be as efficient as the urban isoprene emission resulting from urban landscape directly in modulating the isoprene concentrations. Therefore, the urban isoprene emission may play a much more significant role in urban photochemical reactions compared to the isoprene emissions from the forest over the rural areas.
The BVOC emissions from urban green spaces are projected to increase by more than twice in 2050 due to urban area expansion (Ren et al., 2017). Together with the more frequent heat waves projected for the future (Gao et al., 2012; Zhang et al., 2018), the impact of biogenic emissions on ozone pollution in the NCP will likely play an increasingly important role in ozone pollution and should be taken into considerations in future air quality management plans to address issues of air quality and health. The effect of urban green spaces was only considered in Beijing in this study as we lack the data to parameterize this effect in other regions. Considering the substantial effect of urban green spaces on urban ozone formation, it is vital to evaluate similar effects in other cities where ozone pollution is a concern.
The observational or reanalysis data are available from the website provided in the paper and the WRF-CMAQ and MEGAN model output can be accessed by contacting Yang Gao (yanggao@ouc.edu.cn).
The supplement related to this article is available online at: https://doi.org/10.5194/acp-19-12195-2019-supplement.
YG came up with the original idea, and YG, YW and CL designed the research. MM conducted all the analysis; SZ, LRL, SW, BZ, XC, HS, TZ, LS, XY and HW wrote the paper.
The authors declare that they have no conflict of interest.
This research was supported by grants from the National Key Project of MOST (2017YFC1404101), National Natural Science Foundation of China (41705124, 21625701, 41722501, 91544212), Shandong Provincial Natural Science Foundation, China (ZR2017MD026) and Fundamental Research Funds for the Central Universities (201941006, 201712006). Y. Wang was supported by the National Science Foundation Atmospheric Chemistry Program. PNNL is operated for DOE by Battelle Memorial Institute under contract DE-AC05-76RL01830.
This research was supported by grants from the National Key Project of MOST (2017YFC1404101), National Natural Science Foundation of China (41705124, 21625701, 41722501, 91544212), Shandong Provincial Natural Science Foundation, China (ZR2017MD026) and Fundamental Research Funds for the Central Universities (201941006, 201712006).
This paper was edited by Alex B. Guenther and reviewed by two anonymous referees.
Avnery, S., Mauzerall, D. L., Liu, J. F., and Horowitz, L. W.: Global crop yield reductions due to surface ozone exposure: 1. Year 2000 crop production losses and economic damage, Atmos. Environ., 45, 2284–2296, https://doi.org/10.1016/j.atmosenv.2010.11.045, 2011.
Bell, M. and Ellis, H.: Sensitivity analysis of tropospheric ozone to modified biogenic emissions for the Mid-Atlantic region, Atmos. Environ., 38, 1879–1889, 2004.
Byun, D. and Ching, J. K. S.: Science Algorithms of the EPA Models-3 CommunityMultiscale Air Quality (CMAQ) Modeling System., U. S. Environmental Protection Agency, Office of Research and Development, EPA, Washington, DC, 1999.
Byun, D. and Schere, K. L.: Review of the governing equations, computational algorithms, and other components of the models-3 Community Multiscale Air Quality (CMAQ) modeling system, Appl. Mech. Rev., 59, 51–77, https://doi.org/10.1115/1.2128636, 2006.
Chen, F. and Dudhia, J.: Coupling an advanced land surface-hydrology model with the Penn State-NCAR MM5 modeling system. Part I: Model implementation and sensitivity, Mon. Weather Rev., 129, 569–585, https://doi.org/10.1175/1520-0493(2001)129<0569:caalsh>2.0.co;2, 2001.
Chen, L., Guo, B., Huang, J. S., He, J., Wang, H. F., Zhang, S. Y., and Chen, S. X.: Assessing air-quality in Beijing-Tianjin-Hebei region: The method and mixed tales of PM2.5 and O3, Atmos. Environ., 193, 290–301, 2018a.
Chen, W. H., Guenther, A. B., Wang, X. M., Chen, Y. H., Gu, D. S., Chang, M., Zhou, S. Z., Wu, L. L., and Zhang, Y. Q.: Regional to global biogenic isoprene emission responses to changes in vegetation from 2000 to 2015, J. Geophys. Res.-Atmos., 123, 3757–3771, https://doi.org/10.1002/2017jd027934, 2018b.
Chen, Z., Zhuang, Y., Xie, X., Chen, D., Cheng, N., Yang, L., and Li, R.: Understanding long-term variations of meteorological influences on ground ozone concentrations in Beijing during 2006-2016, Environ. Pollut., 245, 29–37, https://doi.org/10.1016/j.envpol.2018.10.117, 2019.
Cheng, Y. F., Zheng, G. J., Wei, C., Mu, Q., Zheng, B., Wang, Z. B., Gao, M., Zhang, Q., He, K. B., Carmichael, G., Poschl, U., and Su, H.: Reactive nitrogen chemistry in aerosol water as a source of sulfate during haze events in China, Sci. Adv., 2, https://doi.org/10.1126/sciadv.1601530, 2016.
Duan, J. C., Tan, J. H., Yang, L., Wu, S., and Hao, J. M.: Concentration, sources and ozone formation potential of volatile organic compounds (VOCs) during ozone episode in Beijing, Atmos. Res., 88, 25–35, 2008.
Emberson, L. D., Buker, P., Ashmore, M. R., Mills, G., Jackson, L. S., Agrawal, M., Atikuzzaman, M. D., Cinderby, S., Engardt, M., Jamir, C., Kobayashi, K., Oanh, N. T. K., Quadir, Q. F., and Wahid, A.: A comparison of North American and Asian exposure-response data for ozone effects on crop yields, Atmos. Environ., 43, 1945–1953, https://doi.org/10.1016/j.atmosenv.2009.01.005, 2009.
Emmons, L. K., Walters, S., Hess, P. G., Lamarque, J.-F., Pfister, G. G., Fillmore, D., Granier, C., Guenther, A., Kinnison, D., Laepple, T., Orlando, J., Tie, X., Tyndall, G., Wiedinmyer, C., Baughcum, S. L., and Kloster, S.: Description and evaluation of the Model for Ozone and Related chemical Tracers, version 4 (MOZART-4), Geosci. Model Dev., 3, 43–67, https://doi.org/10.5194/gmd-3-43-2010, 2010.
Fiore, A. M., Naik, V., and Leibensperger, E. M.: Air quality and climate connections, J. Air Waste Manage., 65, 645–685, https://doi.org/10.1080/10962247.2015.1040526, 2015.
Friedl, M. A., Sulla-Menashe, D., Tan, B., Schneider, A., Ramankutty, N., Sibley, A., and Huang, X. M.: MODIS Collection 5 global land cover: Algorithm refinements and characterization of new datasets, Remote Sens. Environ., 114, 168–182, 2010.
Fu, J. S., Dong, X., Gao, Y., Wong, D. C., and Lam, Y. F.: Sensitivity and linearity analysis of ozone in East Asia: The effects of domestic emission and intercontinental transport, J. Air Waste Manage., 62, 1102–1114, 2012.
Fu, Y. and Liao, H.: Impacts of land use and land cover changes on biogenic emissions of volatile organic compounds in China from the late 1980s to the mid-2000s: Implications for tropospheric ozone and secondary organic aerosol, Tellus B, 66, 24987, https://doi.org/10.3402/tellusb.v66.24987, 2014.
Gao, Y., Fu, J. S., Drake, J. B., Liu, Y., and Lamarque, J. F.: Projected changes of extreme weather events in the eastern United States based on a high resolution climate modeling system, Environ. Res. Lett., 7, https://doi.org/10.1088/1748-9326/7/4/044025, 2012.
Gao, Y., Fu, J. S., Drake, J. B., Lamarque, J.-F., and Liu, Y.: The impact of emission and climate change on ozone in the United States under representative concentration pathways (RCPs), Atmos. Chem. Phys., 13, 9607–9621, https://doi.org/10.5194/acp-13-9607-2013, 2013.
Gao, Y., Leung, L. R., Zhao, C., and Hagos, S.: Sensitivity of US summer precipitation to model resolution and convective parameterizations across gray zone resolutions, J. Geophys. Res.-Atmos., 122, 2714–2733, 2017.
Ghirardo, A., Xie, J., Zheng, X., Wang, Y., Grote, R., Block, K., Wildt, J., Mentel, T., Kiendler-Scharr, A., Hallquist, M., Butterbach-Bahl, K., and Schnitzler, J.-P.: Urban stress-induced biogenic VOC emissions and SOA-forming potentials in Beijing, Atmos. Chem. Phys., 16, 2901–2920, https://doi.org/10.5194/acp-16-2901-2016, 2016.
Grell, G. A. and Freitas, S. R.: A scale and aerosol aware stochastic convective parameterization for weather and air quality modeling, Atmos. Chem. Phys., 14, 5233–5250, https://doi.org/10.5194/acp-14-5233-2014, 2014.
Gu, Y. Y., Li, Q. Q., Wei, D., Gao, L. R., Tan, L., Su, G. J., Liu, G. R., Liu, W. B., Li, C. Q., and Wang, Q. L.: Emission characteristics of 99 NMVOCs in different seasonal days and the relationship with air quality parameters in Beijing, China, Ecotox. Environ. Safe., 169, 797–806, 2019.
Guenther, A., Karl, T., Harley, P., Wiedinmyer, C., Palmer, P. I., and Geron, C.: Estimates of global terrestrial isoprene emissions using MEGAN (Model of Emissions of Gases and Aerosols from Nature), Atmos. Chem. Phys., 6, 3181–3210, https://doi.org/10.5194/acp-6-3181-2006, 2006.
Guenther, A. B., Jiang, X., Heald, C. L., Sakulyanontvittaya, T., Duhl, T., Emmons, L. K., and Wang, X.: The Model of Emissions of Gases and Aerosols from Nature version 2.1 (MEGAN2.1): an extended and updated framework for modeling biogenic emissions, Geosci. Model Dev., 5, 1471–1492, https://doi.org/10.5194/gmd-5-1471-2012, 2012.
Han, X., Zhu, L., Wang, S., Meng, X., Zhang, M., and Hu, J.: Modeling study of impacts on surface ozone of regional transport and emissions reductions over North China Plain in summer 2015, Atmos. Chem. Phys., 18, 12207–12221, https://doi.org/10.5194/acp-18-12207-2018, 2018.
Iacono, M. J., Delamere, J. S., Mlawer, E. J., Shephard, M. W., Clough, S. A., and Collins, W. D.: Radiative forcing by long-lived greenhouse gases: Calculations with the AER radiative transfer models, J. Geophys. Res.-Atmos., 113, D13103, https://doi.org/10.1029/2008jd009944, 2008.
Jacob, D. J. and Winner, D. A.: Effect of climate change on air quality, Atmos. Environ., 43, 51–63, https://doi.org/10.1016/j.atmosenv.2008.09.051, 2009.
Jaffe, D. A. and Zhang, L.: Meteorological anomalies lead to elevated O3 in the western U. S. in June 2015, Geophys. Res. Lett., 44, 1990–1997, 2017.
Janjić, Z. I.: The step-mountain coordinate: Physical package, Mon. Weather Rev., 118, 1429–1443, https://doi.org/10.1175/1520-0493(1990)118<1429:tsmcpp>2.0.co;2, 1990.
Janjić, Z. I.: The Step-Mountain Eta Coordinate Model: Further developments of the convection, viscous sublayer, and turbulence closure schemes, Mon. Weather Rev., 122, 927–945, https://doi.org/10.1175/1520-0493(1994)122<0927:TSMECM>2.0.CO;2, 1994.
Jiang, X. Y., Guenther, A., Potosnak, M., Geron, C., Seco, R., Karl, T., Kim, S., Gu, L. H., and Pallardy, S.: Isoprene emission response to drought and the impact on global atmospheric chemistry, Atmos. Environ., 185, 272–273, 2018.
Li, K., Jacob, D. J., Liao, H., Shen, L., Zhang, Q., and Bates, K. H.: Anthropogenic drivers of 2013-2017 trends in summer surface ozone in China, P. Natl. Acad. Sci. USA, https://doi.org/10.1073/pnas.1812168116, 2019.
Li, M., Zhang, Q., Kurokawa, J.-I., Woo, J.-H., He, K., Lu, Z., Ohara, T., Song, Y., Streets, D. G., Carmichael, G. R., Cheng, Y., Hong, C., Huo, H., Jiang, X., Kang, S., Liu, F., Su, H., and Zheng, B.: MIX: a mosaic Asian anthropogenic emission inventory under the international collaboration framework of the MICS-Asia and HTAP, Atmos. Chem. Phys., 17, 935–963, https://doi.org/10.5194/acp-17-935-2017, 2017a.
Li, R., Cui, L. L., Li, J. L., Zhao, A., Fu, H. B., Wu, Y., Zhang, L. W., Kong, L. D., and Chen, J. M.: Spatial and temporal variation of particulate matter and gaseous pollutants in China during 2014–2016, Atmos. Environ., 161, 235–246, https://doi.org/10.1016/j.atmosenv.2017.05.008, 2017b.
Liu, F., Zhang, Q., Ronald. J. V., Zheng, B., Tong, D., Yan, L., Zheng, Y. X., and He, K. B.: Recent reduction in NOx emissions over China: Synthesis of satellite observations and emission inventories, Environ. Res. Lett., 11, 114002, https://doi.org/10.1088/1748-9326/11/11/114002, 2016.
Liu, Y., Yuan, B., Li, X., Shao, M., Lu, S., Li, Y., Chang, C.-C., Wang, Z., Hu, W., Huang, X., He, L., Zeng, L., Hu, M., and Zhu, T.: Impact of pollution controls in Beijing on atmospheric oxygenated volatile organic compounds (OVOCs) during the 2008 Olympic Games: observation and modeling implications, Atmos. Chem. Phys., 15, 3045–3062, https://doi.org/10.5194/acp-15-3045-2015, 2015.
Liu, Z., Wang, Y., Gu, D., Zhao, C., Huey, L. G., Stickel, R., Liao, J., Shao, M., Zhu, T., Zeng, L., Amoroso, A., Costabile, F., Chang, C.-C., and Liu, S.-C.: Summertime photochemistry during CAREBeijing-2007: ROx budgets and O3 formation, Atmos. Chem. Phys., 12, 7737–7752, https://doi.org/10.5194/acp-12-7737-2012, 2012.
Lu, X., Hong, J. Y., Zhang, L., Cooper, O. R., Schultz, M. G., Xu, X. B., Wang, T., Gao, M., Zhao, Y. H., and Zhang, Y. H.: Severe surface ozone pollution in China: A global perspective, Environ. Sci. Tech. Let., 5, 487–494, 2018.
Mellor, G. L. and Yamada, T.: Development of a turbulence closure model for geophysical fluid problems, Rev. Geophys., 20, 851–875, 1982.
Morcrette, J. J., Barker, H. W., Cole, J. N. S., Iacono, M. J., and Pincus, R.: Impact of a new radiation pckage, McRad, in the ECMWF Integrated Forecasting System, Mon. Weather Rev., 136, 4773–4798, https://doi.org/10.1175/2008mwr2363.1, 2008.
Morrison, H., Thompson, G., and Tatarskii, V.: Impact of cloud microphysics on the development of trailing stratiform precipitation in a simulated squall line: Comparison of one- and two-moment schemes, Mon. Weather Rev., 137, 991–1007, https://doi.org/10.1175/2008MWR2556.1, 2009.
Myneni, R., Knyazikhin, Y., and Park, T.: MCD15A2H MODIS/Terra+Aqua Leaf Area Index/FPAR 8-day L4 Global 500m SIN Grid V006, in, NASA EOSDIS Land Processes DAAC, https://doi.org/10.5067/MODIS/MCD15A2H.006, 2015.
Otero, N., Sillmann, J., Schnell, J. L., Rust, H. W., and Butler, T.: Synoptic and meteorological drivers of extreme ozone concentrations over Europe, Environ. Res. Lett., 11, 024005, https://doi.org/10.1088/1748-9326/11/11/114002, 2016.
Pu, X., Wang, T. J., Huang, X., Melas, D., Zanis, P., Papanastasiou, D. K., and Poupkou, A.: Enhanced surface ozone during the heat wave of 2013 in Yangtze River Delta region, China, Sci. Total Environ., 603, 807–816, 2017.
Ren, Y., Qu, Z. L., Du, Y. Y., Xu, R. H., Ma, D. P., Yang, G. F., Shi, Y., Fan, X., Tani, A., Guo, P. P., Ge, Y., and Chang, J.: Air quality and health effects of biogenic volatile organic compounds emissions from urban green spaces and the mitigation strategies, Environ. Pollut., 230, 849–861, 2017.
Saha, S., Moorthi, S., Wu, X. R., et al.: The NCEP Climate Forecast System version 2, J. Climate, 27, 2185–2208, https://doi.org/10.1175/JCLI-D-12-00823.1, 2013.
Shao, M., Lu, S. H., Liu, Y., Xie, X., Chang, C. C., Huang, S., and Chen, Z. M.: Volatile organic compounds measured in summer in Beijing and their role in ground-level ozone formation, J. Geophys. Res.-Atmos., 114, 1–13, https://doi.org/10.1029/2008JD010863, 2009.
Sillman, S.: The use of NOy, H2O2, and HNO3 as indicators for ozone-NOx-hydrocarbon sensitivity in urban locations, J. Geophys. Res.-Atmos., 100, 14175–14188, 1995.
Sillman, S.: The relation between ozone, NOx and hydrocarbons in urban and polluted rural environments, Atmos. Environ., 33, 1821–1845, 1999.
Soriano, J. B., Abajobir, A. A., Abate, K. H., et al.: Global, regional, and national deaths, prevalence, disability-adjusted life years, and years lived with disability for chronic obstructive pulmonary disease and asthma, 1990-2015: a systematic analysis for the Global Burden of Disease Study 2015, Lancet Resp. Med., 5, 691–706, https://doi.org/10.1016/S2213-2600(17)30293-X, 2017.
Stavrakou, T., Müller, J.-F., Bauwens, M., De Smedt, I., Van Roozendael, M., Guenther, A., Wild, M., and Xia, X.: Isoprene emissions over Asia 1979–2012: impact of climate and land-use changes, Atmos. Chem. Phys., 14, 4587–4605, https://doi.org/10.5194/acp-14-4587-2014, 2014.
Sun, L., Xue, L., Wang, Y., Li, L., Lin, J., Ni, R., Yan, Y., Chen, L., Li, J., Zhang, Q., and Wang, W.: Impacts of meteorology and emissions on summertime surface ozone increases over central eastern China between 2003 and 2015, Atmos. Chem. Phys., 19, 1455–1469, https://doi.org/10.5194/acp-19-1455-2019, 2019.
Sun, W. X., Hess, P., and Liu, C. J.: The impact of meteorological persistence on the distribution and extremes of ozone, Geophys. Res. Lett., 44, 1545–1553, https://doi.org/10.1002/2016gl071731, 2017.
Tonnesen, G. S. and Dennis, R. L.: Analysis of radical propagation efficiency to assess ozone sensitivity to hydrocarbons and NOx 1. Local indicators of instantaneous odd oxygen production sensitivity, J. Geophys. Res.-Atmos., 105, 9213–9225, 2000.
Wang, J. D., Zhao, B., Wang, S. X., et al.: Particulate matter pollution over China and the effects of control policies, Sci. Total Environ., 426, 584–585, 2017.
Wang, Q. G., Han, Z. W., Wang, T. J., and Zhang, R. J.: Impacts of biogenic emissions of VOC and NOx on tropospheric ozone during summertime in eastern China, Sci. Total Environ., 395, 41–49, https://doi.org/10.1016/j.scitotenv.2008.01.059, 2008.
Wang, S. X., Zhao, B., Cai, S. Y., Klimont, Z., Nielsen, C. P., Morikawa, T., Woo, J. H., Kim, Y., Fu, X., Xu, J. Y., Hao, J. M., and He, K. B.: Emission trends and mitigation options for air pollutants in East Asia, Atmos. Chem. Phys., 14, 6571–6603, https://doi.org/10.5194/acp-14-6571-2014, 2014.
Xing, J., Wang, S. X., Jang, C., Zhu, Y., and Hao, J. M.: Nonlinear response of ozone to precursor emission changes in China: a modeling study using response surface methodology, Atmos. Chem. Phys., 11, 5027–5044, https://doi.org/10.5194/acp-11-5027-2011, 2011.
Yang, X., Xue, L. K., Wang, T., Wang, X. F., Gao, J., Lee, S. C., Blake, D. R., Chai, F. H., and Wang, W. X.: Observations and explicit modeling of summertime carbonyl formation in Beijing: Identification of key precursor species and their Impact on atmospheric oxidation chemistry, J. Geophys. Res.-Atmos., 123, 1426–1440, 2018.
Zhang, G., Gao, Y., Cai, W., Leung, L. R., Wang, S., Zhao, B., Wang, M., Shan, H., Yao, X., and Gao, H.: Seesaw haze pollution in North China modulated by the sub-seasonal variability of atmospheric circulation, Atmos. Chem. Phys., 19, 565–576, https://doi.org/10.5194/acp-19-565-2019, 2019.
Zhang, J., Gao, Y., Luo, K., Leung, L. R., Zhang, Y., Wang, K., and Fan, J.: Impacts of compound extreme weather events on ozone in the present and future, Atmos. Chem. Phys., 18, 9861–9877, https://doi.org/10.5194/acp-18-9861-2018, 2018.
Zhang, Q., Yuan, B., Shao, M., Wang, X., Lu, S., Lu, K., Wang, M., Chen, L., Chang, C.-C., and Liu, S. C.: Variations of ground-level O3 and its precursors in Beijing in summertime between 2005 and 2011, Atmos. Chem. Phys., 14, 6089–6101, https://doi.org/10.5194/acp-14-6089-2014, 2014.
Zhang, Y. Z. and Wang, Y. H.: Climate-driven ground-level ozone extreme in the fall over the Southeast United States, P. Natl. Acad. Sci. USA, 113, 10025–10030, https://doi.org/10.1073/pnas.1602563113, 2016.
Zhao, B., Wang, S. X., Liu, H., Xu, J. Y., Fu, K., Klimont, Z., Hao, J. M., He, K. B., Cofala, J., and Amann, M.: NOx emissions in China: historical trends and future perspectives, Atmos. Chem. Phys., 13, 9869–9897, https://doi.org/10.5194/acp-13-9869-2013, 2013.
Zhao, B., Wu, W., Wang, S., Xing, J., Chang, X., Liou, K.-N., Jiang, J. H., Gu, Y., Jang, C., Fu, J. S., Zhu, Y., Wang, J., Lin, Y., and Hao, J.: A modeling study of the nonlinear response of fine particles to air pollutant emissions in the Beijing–Tianjin–Hebei region, Atmos. Chem. Phys., 17, 12031–12050, https://doi.org/10.5194/acp-17-12031-2017, 2017.
Zhao, B., Zheng, H. T., Wang, S. X., Smith, K. R., Lu, X., Aunan, K., Gu, Y., Wang, Y., Ding, D., Xing, J., Fu, X., Yang, X. D., Liou, K. N., and Hao, J. M.: Change in household fuels dominates the decrease in PM2.5 exposure and premature mortality in China in 2005–2015, P. Natl. Acad. Sci. USA, 115, 12401–12406, 2018.
Zhao, S. P., Yu, Y., Yin, D. Y., He, J. J., Liu, N., Qu, J. J., and Xiao, J. H.: Annual and diurnal variations of gaseous and particulate pollutants in 31 provincial capital cities based on in situ air quality monitoring data from China National Environmental Monitoring Center, Environ. Int., 86, 92–106, https://doi.org/10.1016/j.envint.2015.11.003, 2016.
Zheng, B., Tong, D., Li, M., Liu, F., Hong, C., Geng, G., Li, H., Li, X., Peng, L., Qi, J., Yan, L., Zhang, Y., Zhao, H., Zheng, Y., He, K., and Zhang, Q.: Trends in China's anthropogenic emissions since 2010 as the consequence of clean air actions, Atmos. Chem. Phys., 18, 14095–14111, https://doi.org/10.5194/acp-18-14095-2018, 2018.
Zheng, G. J., Duan, F. K., Su, H., Ma, Y. L., Cheng, Y., Zheng, B., Zhang, Q., Huang, T., Kimoto, T., Chang, D., Pöschl, U., Cheng, Y. F., and He, K. B.: Exploring the severe winter haze in Beijing: the impact of synoptic weather, regional transport and heterogeneous reactions, Atmos. Chem. Phys., 15, 2969–2983, https://doi.org/10.5194/acp-15-2969-2015, 2015.