the Creative Commons Attribution 4.0 License.
the Creative Commons Attribution 4.0 License.
 | 17 Sep 2019
Characterization of aerosol hygroscopicity using Raman lidar measurements at the EARLINET station of Payerne
Francisco Navas-Guzmán
Giovanni Martucci
Martine Collaud Coen
María José Granados-Muñoz
Maxime Hervo
Michael Sicard
Alexander Haefele
This study focuses on the analysis of aerosol hygroscopicity using remote sensing techniques. Continuous observations of aerosol backscatter coefficient (βaer), temperature (T) and water vapor mixing ratio (r) have been performed by means of a Raman lidar system at the aerological station of MeteoSwiss at Payerne (Switzerland) since 2008. These measurements allow us to monitor in a continuous way any change in aerosol properties as a function of the relative humidity (RH). These changes can be observed either in time at a constant altitude or in altitude at a constant time. The accuracy and precision of RH measurements from the lidar have been evaluated using the radiosonde (RS) technique as a reference. A total of 172 RS profiles were used in this intercomparison, which revealed a bias smaller than 4 % RH and a standard deviation smaller than 10 % RH between both techniques in the whole (in lower) troposphere at nighttime (at daytime), indicating the good performance of the lidar for characterizing RH. A methodology to identify situations favorable to studying aerosol hygroscopicity has been established, and the aerosol hygroscopicity has been characterized by means of the backscatter enhancement factor (fβ). Two case studies, corresponding to different types of aerosol, are used to illustrate the potential of this methodology.
The first case corresponds to a mixture of rural aerosol and smoke particles (smoke mixture), which showed a higher hygroscopicity ( and in the RH range 73 %–97 %) than the second case, in which mineral dust was present ( and in the RH range 68 %–84 %).
The higher sensitivity of the shortest wavelength to hygroscopic growth was qualitatively reproduced using Mie simulations. In addition, a good agreement was found between the hygroscopic analysis done in the vertical and in time for Case I, where the latter also allowed us to observe the hydration and dehydration of the smoke mixture. Finally, the impact of aerosol hygroscopicity on the Earth's radiative balance has been evaluated using the GAME (Global Atmospheric Model) radiative transfer model. The model showed an impact with an increase in absolute value of 2.4 W m−2 at the surface with respect to the dry conditions for the hygroscopic layer of Case I (smoke mixture).


Atmospheric aerosol particles scatter and absorb solar radiation and therefore have an impact on the Earth's radiative budget (direct effect). In addition, aerosol particles can act as cloud condensation nuclei (CCN) and modify cloud microphysical properties, also altering the global radiative budget (indirect effects) in this way (Haywood and Boucher, 2000). The uncertainty in assessing total anthropogenic greenhouse gas and aerosol impacts on climate must be substantially reduced from its current level to allow meaningful predictions of future climate. This uncertainty is currently dominated by the aerosol component (Bindoff et al., 2013). Evaluation of aerosol effects on climate must take into account high spatial and temporal variation of aerosol concentrations and properties as well as the aerosol interactions with clouds and its influence on precipitation. During the last years a huge effort was made to characterize vertically resolved profiles of optical and microphysical properties for different kinds of particles. Raman lidars (light detection and ranging) have proven to be an essential tool to obtain profiles of these properties without modifying the environmental conditions (Ansmann et al., 1992; Navas-Guzmán et al., 2013; Granados-Muñoz et al., 2014). Networks like EARLINET (European Aerosol Research Lidar Network) have contributed to create a quantitative, comprehensive, and statistically significant database for the horizontal, vertical, and temporal distribution of aerosols on a continental scale (Bösenberg et al., 2003; Pappalardo et al., 2014; Sicard et al., 2015).
However, despite the big effort of the scientific community to characterize aerosol effects, there are some processes that are not well understood yet. For example, an important factor that can modify the role of aerosols in the global energy budget is RH. Under high RH conditions, aerosol particles may uptake water, changing their size and chemical composition (hygroscopic growth). This hygroscopic growth affects the direct scattering of radiation and especially the indirect effects, as the ability of aerosol to act as CCN is directly related to their affinity for water vapor (Hänel, 1976; Feingold and Morley, 2003; Zieger et al., 2013). Thus, understanding aerosol hygroscopic growth is of high importance to quantify the influence of atmospheric aerosol in climate models or for comparisons of remote sensing with in situ measurements which are often performed under dry conditions (Zieger et al., 2010).
Several studies have addressed the characterization of aerosol hygroscopicity using in situ measurements over the last years. Techniques such as with the Humidified Tandem Differential Mobility Analyzer (HT-DMA) (e.g., Swietlicki et al., 2008) or humidified tandem nephelometers have been extensively used to quantify the change in particle diameter or aerosol optical properties due to water uptake (Pilat and Charlson, 1966; Fierz-Schmidhauser et al., 2010; Zieger et al., 2013). However, despite the great contribution that these techniques can provide to the understanding of the aerosol hygroscopic processes, they also present some shortcomings. For example, most in situ techniques are limited by the fact that they modify the ambient conditions and are also subject to particle losses in the sampling lines, thereby altering the real atmospheric aerosol properties (Bedoya-Velásquez et al., 2018). In addition, they present larger errors in the characterization of the aerosol hygroscopicity for high RH (conditions close to saturation), especially when the aerosol is more hygroscopic (Titos et al., 2016).
In this sense, remote sensing techniques could overcome these difficulties since they can provide vertically resolved measurements without modifying the aerosol sample. In addition, they are also able to measure under RH close to saturation, that is, where particles are more affected by hygroscopic growth (Feingold and Morley, 2003). However, the number of aerosol hygroscopic studies using remote sensing is modest, and most of them were limited to specific field campaigns. The main limitation to addressing these studies comes from the difficulty in obtaining RH profiles with high vertical and temporal resolution. Most of the studies carried out so far have used sensors to measure RH onboard RSs or aircrafts or in meteorological towers in combination with the aerosol measurements from lidars to investigate the aerosol hygroscopicity (Wulfmeyer and Feingold, 2000; Veselovskii et al., 2009; Granados-Muñoz et al., 2015; Haeffelin et al., 2016; Lv et al., 2017; Zhao et al., 2017; Fernández et al., 2018). Recently, the combination of T profiles from microwave radiometers (MWRs) and r profiles from Raman lidar has been used to retrieve RH profiles (Navas-Guzmán et al., 2014) and applied to aerosol hygroscopic studies (Bedoya-Velásquez et al., 2018). However, although this synergy of instrumentation can be a good solution for many stations, the uncertainties coming from MWR T profiles can be problematic due to their lower spatial resolution (Navas-Guzmán et al., 2016). In addition, most of the r measurements from the Raman lidar system are limited to nighttime observations, due to the low signal-to-noise ratio (SNR) of the Raman channels during daytime.
In the present study we show the capability of the RAman Lidar for Meteorological Observations (RALMO) operated at the aerological station of MeteoSwiss at Payerne (Switzerland) to monitor aerosol hygroscopicity based on its continuous aerosol and RH measurements. The methodology needed for this characterization is introduced and applied to two case studies in which different aerosol types were present.
Data from collocated remote sensing and in situ sensors were acquired at the aerological station of MeteoSwiss at Payerne (Switzerland, 46.82∘ N, 6.95∘ E; 491 m above sea level (a.s.l.)). The station is located in a rural area on the Swiss Plateau, between the Jura mountains (25 km to the northwest) and the Alpine foothills (20 km to the southeast). The site is not significantly affected by industrial pollution and the region is characterized by a mid-latitude continental climate.
Aerosol vertical information is mainly obtained from lidar systems installed at the station. RALMO is the main tool of this study and was developed by the Swiss Federal Institute of Technology (EPFL) in collaboration with MeteoSwiss and has been operated at MeteoSwiss Payerne since August 2008. The instrument is dedicated to operational meteorology, model validation, climatological studies as well as ground truthing of satellite data. The lidar was specially designed to satisfy the requirements for operational monitoring of the atmosphere and to create a durable and homogeneous dataset to be used for climatology studies (Dinoev et al., 2013). The lidar system uses a Nd:YAG laser source which emits pulses of 8 ns duration at a wavelength of 355 nm and with a repetition rate of 30 Hz. The mean energy per pulse at 355 nm is around 400 mJ. Before being emitted into the atmosphere the beam is expanded to a diameter of 14 cm which reduces the beam divergence (to 0.1 mrad) and ensures eye safety. The receiving system consists of four telescopes with 30 cm parabolic mirrors which are arranged symmetrically around the vertically mounted beam expander to receive the backscattered photons. The total aperture of this telescope system is equivalent to a telescope with a single mirror of 60 cm diameter, and it has a field of view of 0.2 mrad. This narrow field of view combined with the narrow-band receiver and high pulse energy allows daytime operation. Optical fibers connect the telescope mirrors with two grating polychromators which allow us to isolate the rotational–vibrational Raman signals of nitrogen and water vapor (wavelengths of 386.7 and 407.5 nm, respectively) as well as the elastic signal and four portions of the pure-rotational Raman spectrum around 355 nm for T, aerosol backscatter and extinction measurements. The optical signals are finally detected by photomultipliers and acquired by a transient recorder (Brocard et al., 2013). A detailed description of the different parts of this lidar system can be found in Dinoev et al. (2013). RALMO was incorporated into EARLINET in 2008.
In order to gain more spectral information in the profiles of aerosol properties, data from a co-located ceilometer have been used in this study. The CHM15k ceilometer from the Lufft company operated at Payerne is a lidar cloud height sensor based on a single wavelength backscattering technique. Its Nd:YAG narrow-beam microchip laser operates at 1064 nm. Cloud layers can be detected in a range of up to 15 km. In addition to the cloud base information, we derive βaer at 1064 nm from the elastic signal using the Klett inversion technique (Klett, 1981).
RS measurements were also used in this study to assess the T, r and RH profiles retrieved from RALMO. The SRS-C50 sondes were flown operationally at Payerne and launched twice a day at 11:00 and 23:00 UTC. The sondes were launched and transported through the troposphere and stratosphere by a balloon inflated with hydrogen and reaching on average 35 km. The vertical resolution of the measured profiles of T and humidity is about 6 m. The sensors of these RSs include copper–constantan thermocouples for T, a full-range water hypsometer for pressure and a sensor with a hygristor for RH. The accuracy of these three parameters in the troposphere is 0.1 K for T, 2 hPa (accuracy decreases with height) for pressure and 5 % to 10 % for RH.
Sun-photometer measurements have also been included in this study to complement the aerosol information. MeteoSwiss operates four Precision Filter Radiometers (PFRs) that were installed in the framework of the international GAW-PFR (Global Atmosphere Watch – Precision Filter Radiometer) program of the World Meteorological Organization (WMO). They measure the direct solar irradiance at the four wavelengths (368, 412, 500 and 862 nm) used in the GAW-PFR network as well as nine additional wavelengths (305, 311, 318, 332, 450, 610, 675, 718, 778, 817, 946 and 1024 nm). Integrated water vapor (IWV) is obtained from the measurements at 718, 817 and 946 nm. The aerosol optical depths (AODs) have been calculated based on the solar irradiance at the different wavelengths using the GAW-PFR algorithms (McArthur et al., 2003). In addition, the AOD Ångström exponent (AE) is used in this study as a qualitative indicator of the relative dominance of fine- and coarse-mode aerosols. Values of AE larger than 1.5 are indicative of a higher fine-mode fraction (Nyeki et al., 2012).
In situ observations at ground level were also used to complement the column aerosol information obtained from remote sensing. These in situ measurements at Payerne are carried out by EMPA in the framework of the Nabel (National Air Pollution Monitoring Network) monitoring program. Aerosol absorption coefficients at seven wavelengths (from 370 to 950 nm) were obtained from aethalometer measurements (AE31 model). Light absorption measurements at ultraviolet, visible and infrared wavelengths can be used to quantitatively assess the aerosol source contribution (Collaud Coen et al., 2004; Sandradewi et al., 2008; Segura et al., 2014). In addition, concentrations of PM10 and PM2.5 (ambient air levels of atmospheric particulate matter finer than 10 and 2.5 microns) were obtained from an aerosol spectrometer (Fidas 200). These measurements were used to characterize the size of the particles that arrived at our station.
3.1 Retrievals of RH and aerosol property profiles
As mentioned in the introduction, the main practical limitation to studying the effect of hygroscopicity on optical and microphysical aerosol properties is the lack of simultaneously and continuously available aerosol and RH measurements with a good vertical and temporal resolution. RALMO can overcome this limitation thanks to its capability to perform continuous measurements of T, water vapor and aerosol profiles during day and night. In this section the methodology to retrieve these atmospheric parameters from the lidar signals is described.
T measurements are made using the pure-rotational Raman (PRR) technique (Vaughan et al., 1993). An atmospheric T profile can be derived from the analysis of the intensities of lines with low and high quantum numbers that have opposite T derivatives. A detailed description of the T inversion technique applied to our system can be found in Martucci et al. (2019).
r is defined as the ratio of the mass of water vapor to the mass of dry air in a sample of the atmosphere (Goldsmith et al., 1998). Profiles of r can be obtained from Raman lidar measurements as the ratio of rotational–vibrational Raman scattering intensities from water vapor and nitrogen molecules (Whiteman, 2003a, b; Brocard et al., 2013; Navas-Guzmán et al., 2014). It can be expressed as follows:
where C is the lidar calibration coefficient that takes into account the fractional volume of nitrogen in the atmosphere (0.78), the instrumental transmission and detection efficiencies at the wavelengths of the Raman returns and the range-independent Raman backscatter cross section for nitrogen and water vapor. The calibration coefficient must be determined for each specific lidar. In the case of RALMO, C is obtained by combining absolute calibration with co-located radiosounding, with relative calibration using the solar background (Martucci et al., 2018). and are the Raman lidar signals for water vapor and nitrogen, respectively, after being corrected for saturation and background. The exponential term is the difference in the atmospheric transmission between the surface and the altitude z for nitrogen (386.7 nm) and water vapor (407.5 nm). The molecular extinction is calculated considering the US Standard Atmosphere. For normal conditions at Payerne the effect of differential extinction due to aerosols between these two wavelengths is small and is neglected (Dinoev et al., 2013). However, when this differential extinction is not negligible, Muñoz-Porcar et al. (2018) showed that it can accurately be calculated using a radiative transfer model with a relatively simple parametrization.
RH profiles are obtained by combining T and r. RH is defined as the ratio of the actual amount of water vapor in the air compared to the equilibrium amount (saturation) at that T (Yau and Rogers, 1996), and it can be calculated as
where e(z) is the water vapor pressure, while ew(z) refers to the saturation pressure. The water vapor pressure is related to r as follows:
where p(z) is the air pressure profile which can be estimated from RSs or assuming a US standard atmosphere. In our case, and thanks to the availability of operational RS measurements in our station, the closest RS in time is used to calculate the pressure profile. For saturation pressure we use the following expression:
where the constants MA and MB are 17.84 (17.08) and 245.4 (234.2), respectively, for T below (above) 273 K (List, 1951).
Aerosol vertical information is also retrieved from RALMO measurements. The backscattered radiation from aerosols and molecules due to Mie and Rayleigh scattering, respectively, has the same wavelength as the laser and is referred to as the elastic signal, SEl(z). Stokes and anti-Stokes portions of the PRR spectrum with opposite T dependence are summed, giving in good approximation a T-independent inelastic signal SPRR(z). βaer is derived from the ratio between the elastic and inelastic signals as follows:
where k is the calibration constant and βmol is the molecular backscatter coefficient. βmol is calculated using a measured atmospheric density, while the k constant is estimated assuming a molecular behavior of the atmosphere in the far range (upper troposphere).
3.2 Selection of aerosol hygroscopic cases
Continuous measurements of aerosol and RH profiles from RALMO lidar allow us to monitor any change in aerosol properties that could occur as a result of the water uptake by particles under high RH (aerosol hygroscopic growth). However, to ensure that the changes in the aerosol properties are due to hygroscopic growth and not to changes in the load or composition of the aerosol, certain requirements must be fulfilled.
As a first condition an increase in βaer should occur simultaneously with an increase in RH. This condition could be observed in the vertical for a certain aerosol layer (vertical hygroscopic growth), but it could also be found as a function of time at a constant altitude. It is worth remarking that RALMO is one of the few remote sensing instruments in the world that is able to monitor those processes as a function of time and height. Cases fulfilling the previous condition were selected as potential cases of hygroscopic growth. After that, we needed to ensure a high degree of homogeneity in the investigated aerosol layer. For that, a second requirement to be fulfilled is that the origin of the air masses, in the region where the presence of hygroscopicity is assessed, is independent of altitude (in the case of vertical hygroscopic growth). To guarantee that, we have used backward trajectory analysis from the HYSPLIT model (Hybrid Single-Particle Lagrangian Integrated Trajectory) (Draxler and Rolph, 2003). As a final condition to ensure good mixing within the layer, we used the profiles of r and potential temperature (θ) obtained from RALMO measurements. Slow-varying or constant values of these two parameters are indicative of well-mixed conditions across the aerosol layer.
Similar criteria to assess the homogeneity of an aerosol layer were required in previous studies using remote sensing (Veselovskii et al., 2009; Granados-Muñoz et al., 2015; Bedoya-Velásquez et al., 2018). However, this is the first time that the profiles of r and θ are obtained from the same instrument as the aerosol measurements. It presents a clear advantage since all the parameters are measured for the same atmospheric column, as opposed to studies using RSs or MWR.
Another novelty of this study is the capability to monitor aerosol hygroscopic growth in time at different altitudes in the troposphere. For this temporal analysis we used the r measurements to ensure that changes in aerosol properties in time are only due to hygroscopic processes. In the absence of condensation and evaporation processes r can be considered an atmospheric tracer and we assume that air parcels with the same r have in good approximation the same origin and hence the same aerosol load and composition. In addition, wind measurements from a collocated wind profiler are used to corroborate that the wind direction was the same during the analyzed period.
Once all the previous requirements have been fulfilled, the aerosol hygroscopicity is characterized by means of the fβ. This parameter is defined as
where ζ(RH) represents an aerosol property at a certain RH. RHref is the so-called reference RH, and it is chosen as the lowest value of RH in the analyzed layer or time interval. In this study, fβ has been calculated for βaer.
In order to be able to compare our results with other studies in which RHref or the RH range could be different, the humidograms (RH versus the fβ) are parameterized using fitting equations (e.g., Titos et al., 2016). In this study we use the one-parameter equation introduced by Hänel (1976), which has been used in other hygroscopic studies using remote sensing (Granados-Muñoz et al., 2015; Bedoya-Velásquez et al., 2018). The general form of the Hänel equation is expressed as
where γ is an indicator of the aerosol hygroscopicity. Larger values of γ indicate higher hygroscopicity.
Since data quality is critical, a validation with respect to the RS technique has been carried out, which we consider the reference. As was indicated in Sect. 2, operational RSs are launched twice per day at the aerological station of Payerne. The availability of simultaneous lidar and RS measurements at our station allowed us to minimize the differences due to spatio-temporal inhomogeneities.
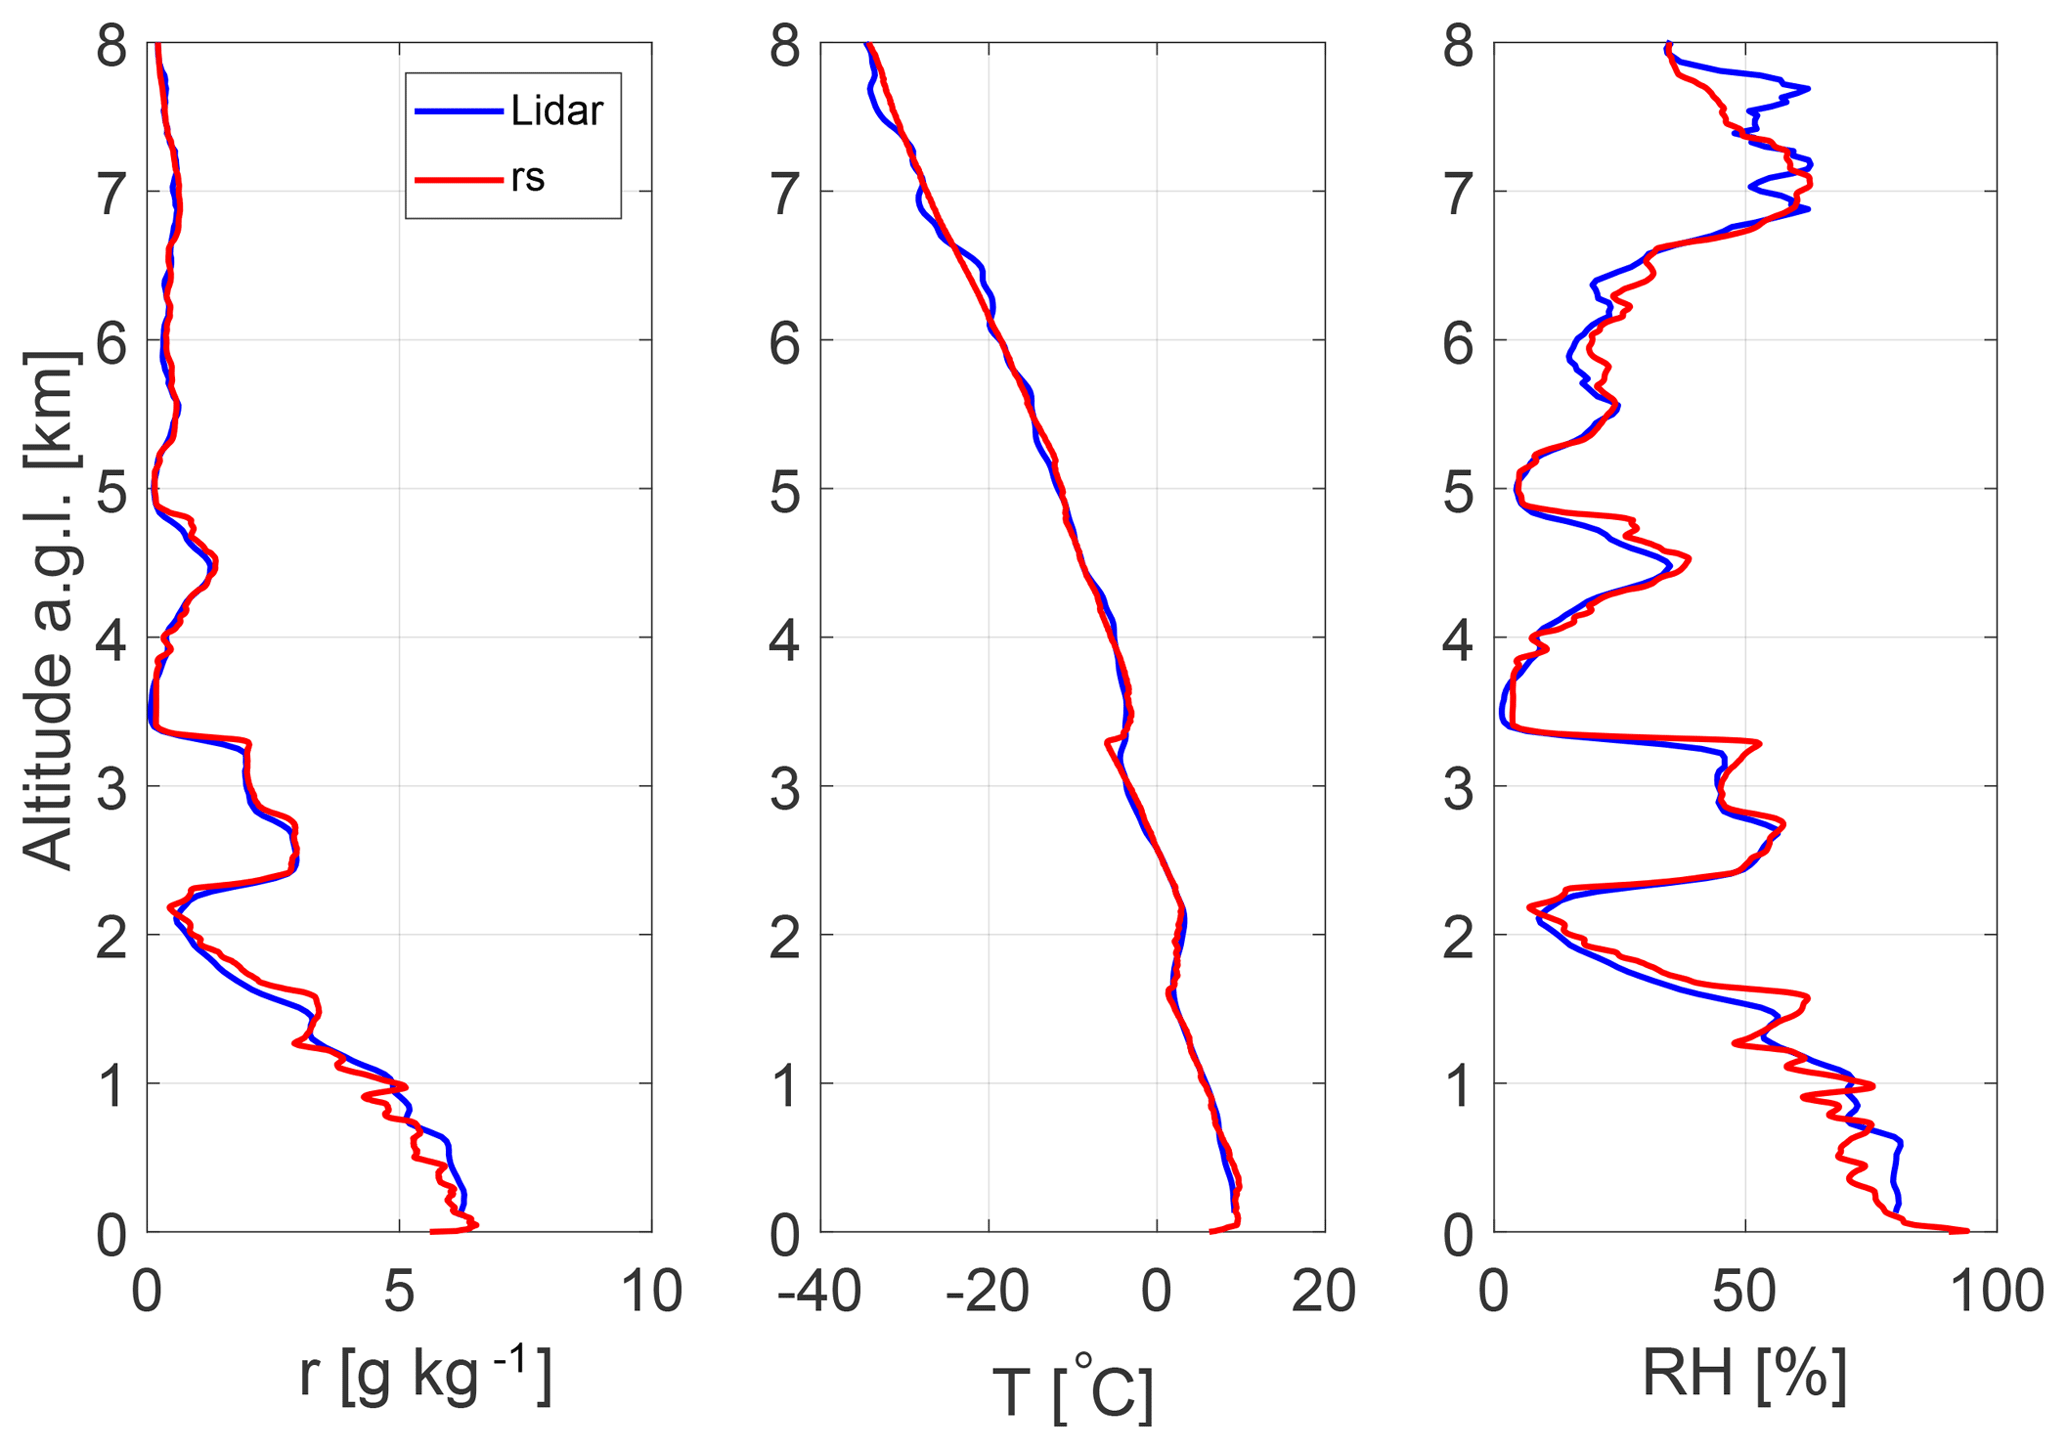
Figure 1Mixing ratio (r), temperature (T) and relative humidity (RH) profiles from lidar (blue lines) and operational RS (red line) at 23:00 UTC on 20 September 2017.
Figure 1 shows the r, T and RH profiles obtained from RALMO lidar and RS at nighttime (23:00 UTC) on 20 September 2017. A very good agreement can be observed from this figure for the three atmospheric parameters. We can see that RALMO provided very accurate results even for altitude ranges where strong gradients were observed, as for the wet layer located above 2 km above ground level (a.g.l.) or for the T inversion observed at 1.7 km (a.g.l.). The mean and standard deviation for the whole profile (from ground to 8 km (a.g.l.)) of the relative differences in r were , while the mean and standard deviation of T and RH differences were K and RH, respectively. This example shows the potential of RALMO to provide accurate measurements with a good spatial resolution. In order to evaluate the accuracy and the precision of RALMO retrievals, a statistical analysis of lidar and RS differences was carried out. A total of 172 RS were used in this intercomparison during daytime and nighttime for the period from July to December of 2017. The T validation of RALMO lidar is discussed in more depth in a separate paper (Martucci et al., 2019). Here we would only like to discuss the statistics for this 6-month period.
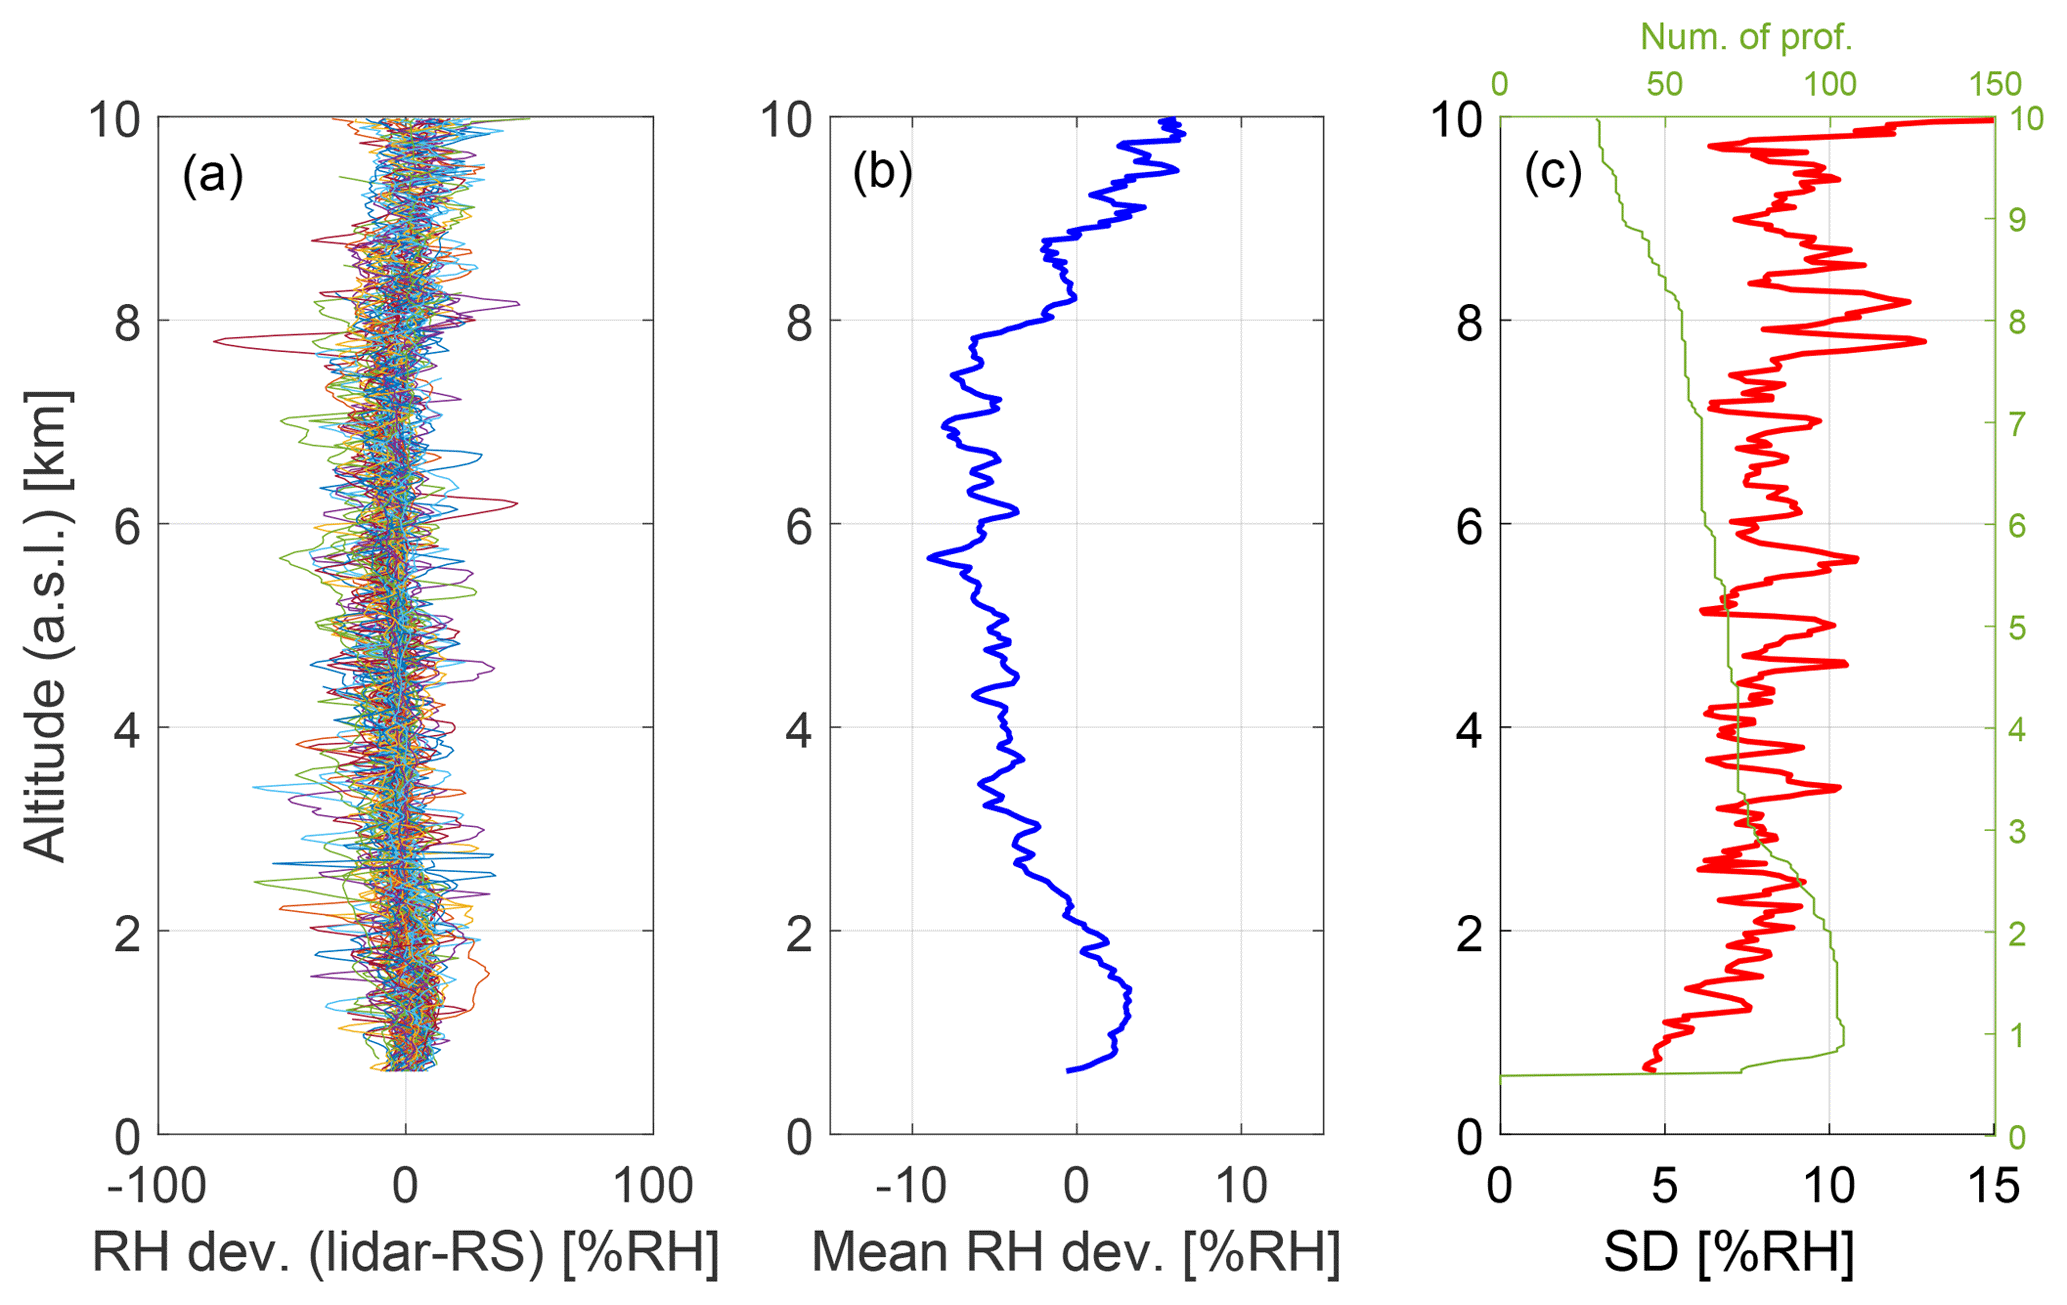
Figure 2RH validation between RALMO lidar and RS at 23:00 UTC for the period from July to December 2017. (a) Profiles of RH deviation between lidar and RS. (b) Mean RH deviation (lidar–RS). (c) Standard RH deviation profile (red line) and number of profiles used at each altitude for these statistics (green line).
For nighttime measurements (23:00 UTC), a total of 100 RS were used to compare with lidar and the mean T deviation profile evidenced a small bias of 0.05±0.06 K in the first 5 km and 0.15±0.15 K above that altitude. The standard deviation profile also confirmed the excellent performance of RALMO in retrieving T, with standard deviations below 1 K in the full troposphere (mean values of 0.6±0.1 K below 5 km (a.g.l.) and 1.00±0.16 K above). For daytime measurements (11:00 UTC), 72 pairs of profiles were used. The mean T deviations between lidar and RS for daytime measurements were K in the lower troposphere (0–5 km a.g.l.) and in the upper troposphere (5–10 km a.g.l.). The T standard deviations were 0.8±0.2 and 2.4±0.8 for the same two altitude ranges. These results also prove the good performance of RALMO during daytime, although they show larger discrepancies than during nighttime, especially in the upper troposphere (from 5 to 10 km). The reliability and the high quality of the T profiles obtained by RALMO are key aspects for addressing aerosol hygroscopic studies, since this is the most difficult to obtain of the atmospheric parameters using remote sensing techniques.
Figure 2 presents the same statistics as in the previous discussion but for RH measurements. As was explained in Sect. 3, RH profiles from lidar were obtained from the combination of r and T measurements. Figure 2a shows all RH deviation profiles between lidar and RS, while Fig. 2b presents the mean RH deviation profile. This plot reveals a small bias between both instruments that ranges from positive values (+3 % RH at 1.4 km a.s.l.) to negative ones (−9 % RH at 5.6 km a.s.l.). Above 9 km (a.s.l.) the bias again becomes positive, reaching a maximum value of +6 % RH. The mean bias and standard deviation along the region from ground to 2.1 km a.s.l. is % RH, while it increases to % RH in the range 2.1–9 km. We can affirm that the shape observed in the RH bias between both instruments is mainly coming from the r measurements since the T statistics showed a negligible bias in the whole column (with almost zero bias, not shown). It is due to larger inhomogeneities in r in time and in space which produce larger discrepancies between lidar and RS observations. Regarding the standard deviations observed for this parameter (Fig. 2c), we can observe that it increases with altitude in the lower troposphere (from 4.4 % RH at ground to 8 % RH at 2 km a.s.l.). Above this altitude the standard deviation values oscillate around a quite constant value in altitude. The mean RH standard deviation in the lower troposphere (from ground to 2.1 km) was 6.5 %±1.3 % RH, while it was 8.5 %±1.5 % RH above this altitude. The RH comparison for daytime measurements (not shown here) also presented a small bias between lidar and RS, with a mean value of RH in the range from ground to 5 km a.s.l. The mean standard deviations obtained for the same altitude range were slightly larger than during nighttime, with a mean value of 9 %±3 % RH.
Above 5 km (a.s.l.) and during daytime the SNR of RALMO is smaller compared to nighttime measurements due to the solar background; for this reason the RH profiles were not calculated above this altitude in order to avoid large uncertainties. In any case we would like to highlight the good quality of RALMO RH information. The high quality of the RH measurements shown in this intercomparison is a key aspect to be able to address the aerosol hygroscopic studies, as will be shown in the next sections.
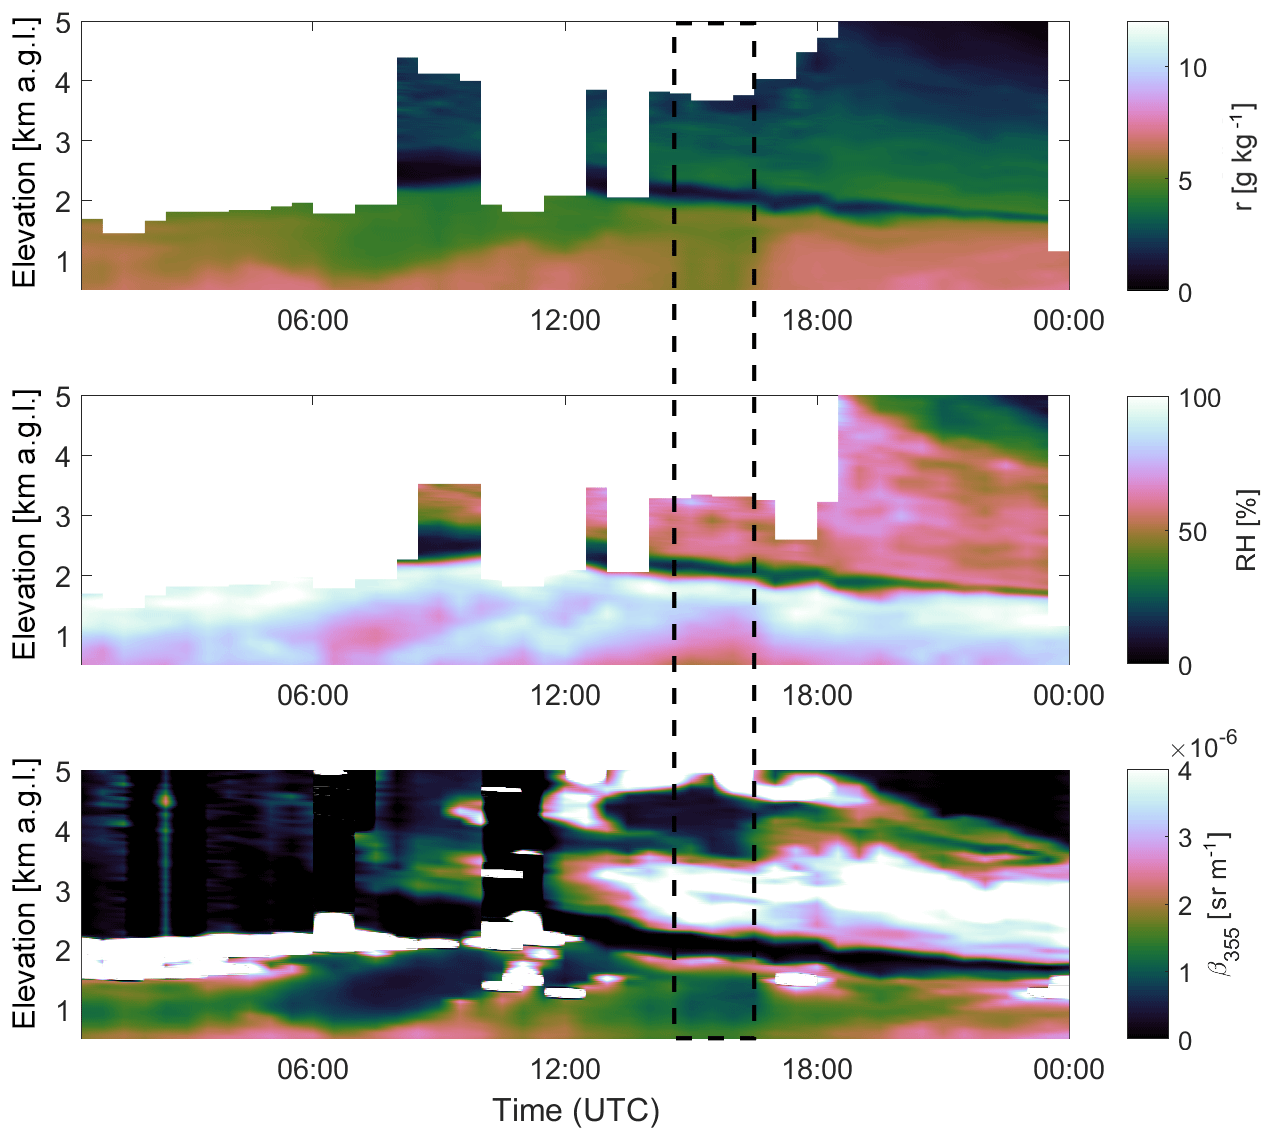
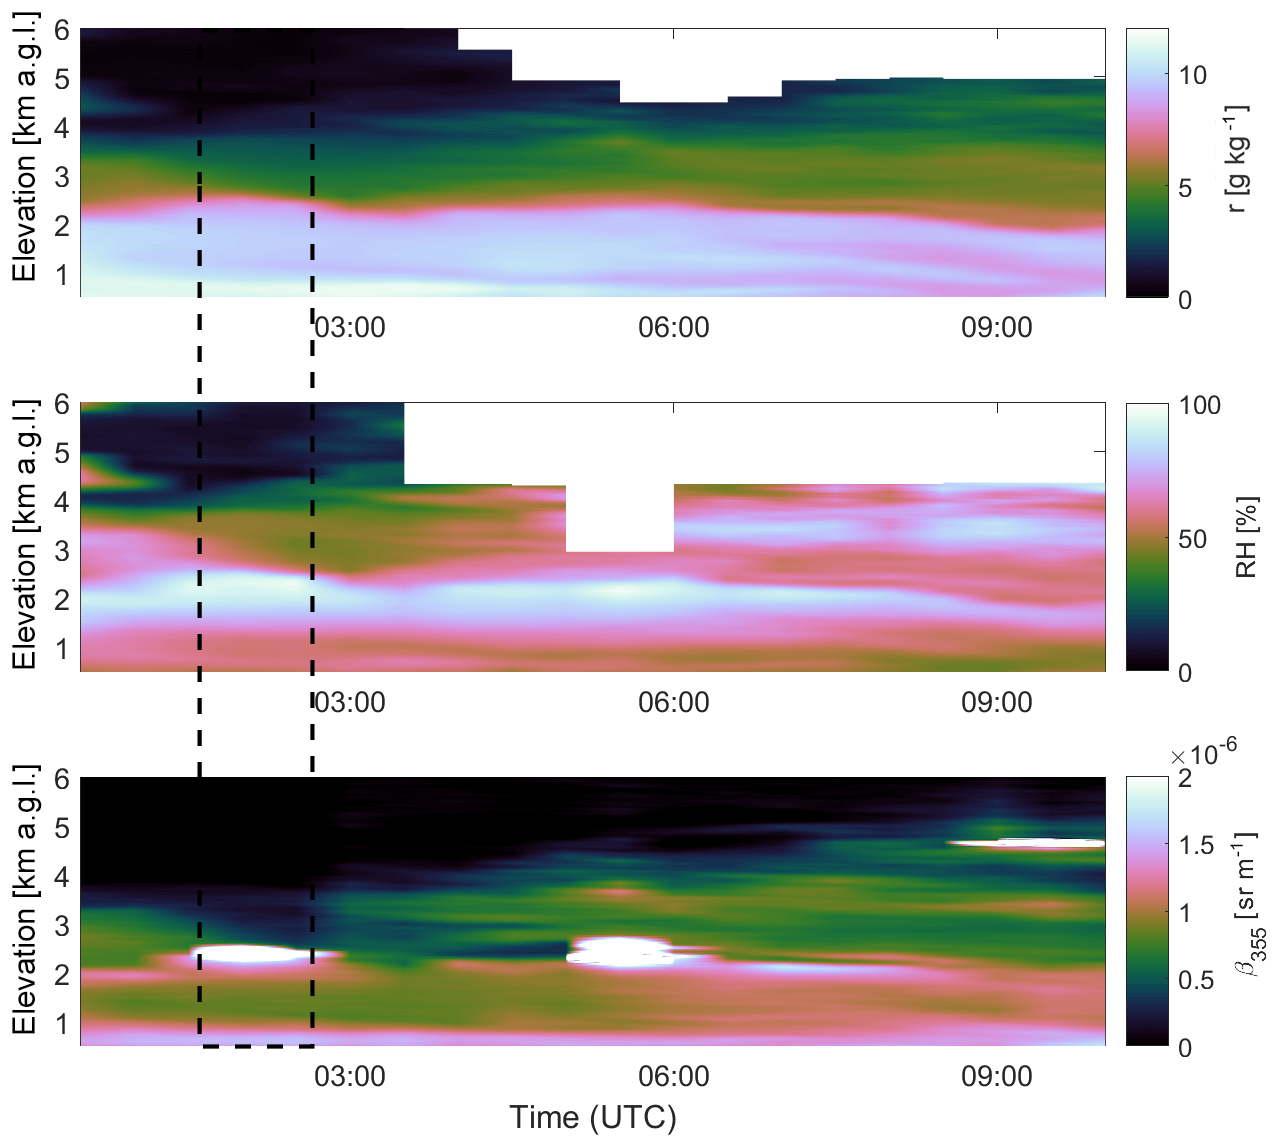
Figure 3Temporal evolution of vertical profiles of r, RH and βaer at 355 nm from RALMO lidar on 7 September 2017.
Two case studies are presented in which the hygroscopicity of different types of aerosol is characterized. The two case studies took place during summer 2017 and feature smoke particles and mineral dust.
5.1 Case I: hygroscopic growth of smoke mixture
Case I corresponds to 7 September 2017. The temporal evolution of r, RH and βaer at 355 nm in the lower troposphere (0–5 km a.s.l.) is shown in Fig. 3 for this day. According to the aerosol measurements (lowest panel), low clouds were present at around 1.6 km (a.g.l.) during the first part of the day (until 12:00 UTC). After that, two clear aerosol layers can be identified, the atmospheric boundary layer (ABL) and a strong lofted aerosol layer located between 2 and 4 km (a.g.l.) which appeared in the afternoon. A usual convective boundary layer development was observed during the day, with maximum height occurring at around 14:00 UTC. It is interesting to remark how within the ABL the intensity of the aerosol backscatter signal was stronger at the top of this layer even when a strong mixing was expected at the central hours of the day (between 13:00 and 17:00 UTC). However, a larger homogeneity was observed for the same layer in the r measurements (Fig. 3, upper panel), indicating that the convective processes were strong enough to produce a well-mixed ABL in that time interval. The third element that can help to understand the observed variations in the backscatter signals is the RH measurements (central panel). From that plot, we can observe how the intensification observed in βaer is well correlated with the values observed for RH, with the highest values of both properties at the top of the ABL. This kind of behavior could be due to aerosol hygroscopic processes, and a detailed analysis is presented in the following paragraphs.
According to the NAAPS (Navy Aerosol Analysis and Prediction System) (Christensen, 1997) model, 7 September 2017 at 18:00 UTC is characterized by the presence of smoke above the measurement station (Fig. 4a). This model predicted smoke surface concentrations (blue color map) between 4 and 8 µg m−3 at Payerne. The HYSPLIT back-trajectory analysis indicated that the air masses above our station in the lower layers of the troposphere had their origin in North America (Fig. 4b). The VIIRS (Visible Infrared Imaging Radiometer Suite) fire and thermal anomalies product available from the joint NASA/NOAA Suomi-National Polar orbiting Partnership (S-NPP) satellite (Fig. 4c) showed that in the studied period (from 25 August to 3 September 2017) several intensive hotspots were found along the calculated air mass trajectories, especially in some areas of the northwest of the United States and in the central part of Canada. In addition, carbon monoxide (CO) observations from the Atmospheric Infrared Sounder (AIRS) onboard the Aqua satellite monitored a plume (not shown here) with a high concentration of CO that moved from North America to Europe during that period, reaching the eastern part of Europe on 6 September 2017. Over Payerne, the total column CO concentrations observed with AIRS were in the range of 100 and 130 parts per billion by volume (ppbv) during 7 and 8 September, which are considerably higher than the mean concentration observed in the previous month (70–80 ppbv). CO is considered a good tracer of smoke particles since it is generated in the incomplete combustion of biomass.
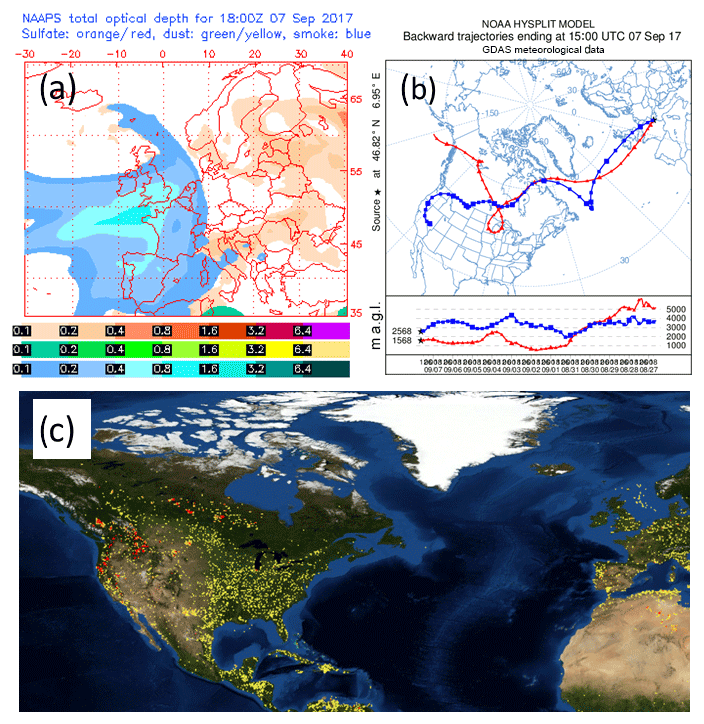
Figure 4(a) NAAPS total optical depth from sulfate (orange/red scale), dust (green/yellow scale) and smoke (blue scale) at 18:00 UTC on 7 September 2017. (b) Backward trajectories from the NOAA HYSPLIT model ending at 15:00 UTC, 7 September 2017, calculated for the altitudes 2500 and 3500 m a.s.l. (c) Fire map from the VIIRS instrument for the period from 25 August to 3 September 2017 (source: https://firms.modaps.eosdis.nasa.gov/, last access: 12 October 2018).
In situ measurements carried out at Payerne station showed some changes in the aerosol properties that could be characteristics of smoke particles (Fig. 5). An increase in the PM2.5 mass concentration was observed in the period from 6 to 8 September, with values changing from 1 µg m−3 (12:00 UTC on 6 September) to 9.9 µg m−3 (20:00 UTC on 8 September), indicating an increase in the concentration of small particles at the surface. The PM2.5 concentration reached during that evening was clearly above the mean summer value (5.2 µg m−3). The PM2.5 increase occurred at the same time as an increase in the absorption coefficient at different wavelengths observed by an aethalometer. The absorption Ångström exponent (AAE), which represents the wavelength dependence of absorption and depends on the composition of absorbing aerosols, showed relatively low values (between 1.1 and 1.3 for most of the measurements) which can be characteristics of biomass-burning particles (Schmeisser et al., 2017). Therefore, model predictions and satellite and in situ observations agreed and point to a mixture of local aerosol and smoke particles from biomass burning in the atmospheric column over Payerne.
Vertical information of aerosol, T and r was obtained using the RALMO lidar and ceilometer measurements on 7 September 2017. Figure 6 shows the profiles of βaer at 355 and 1064 nm, RH and the auxiliary information of θ and r for the time interval 15:00–15:30 UTC. From this figure, a marked increase in βaer with altitude was observed for the altitude range between 1.7 and 2.3 km (a.s.l.). Simultaneously to this increase, we observed an increase in RH with values increasing from 73 % (bottom of the layer) to 97 % (top of the layer). The profiles of θ and r (Fig. 6c) were used as indicators of a good mixing as explained in Sect. 3.2. These profiles show quite constant values for both properties within the layer (300.6±0.5 K and 5.3±0.1 g kg−1, respectively), indicating that the layer was well mixed.
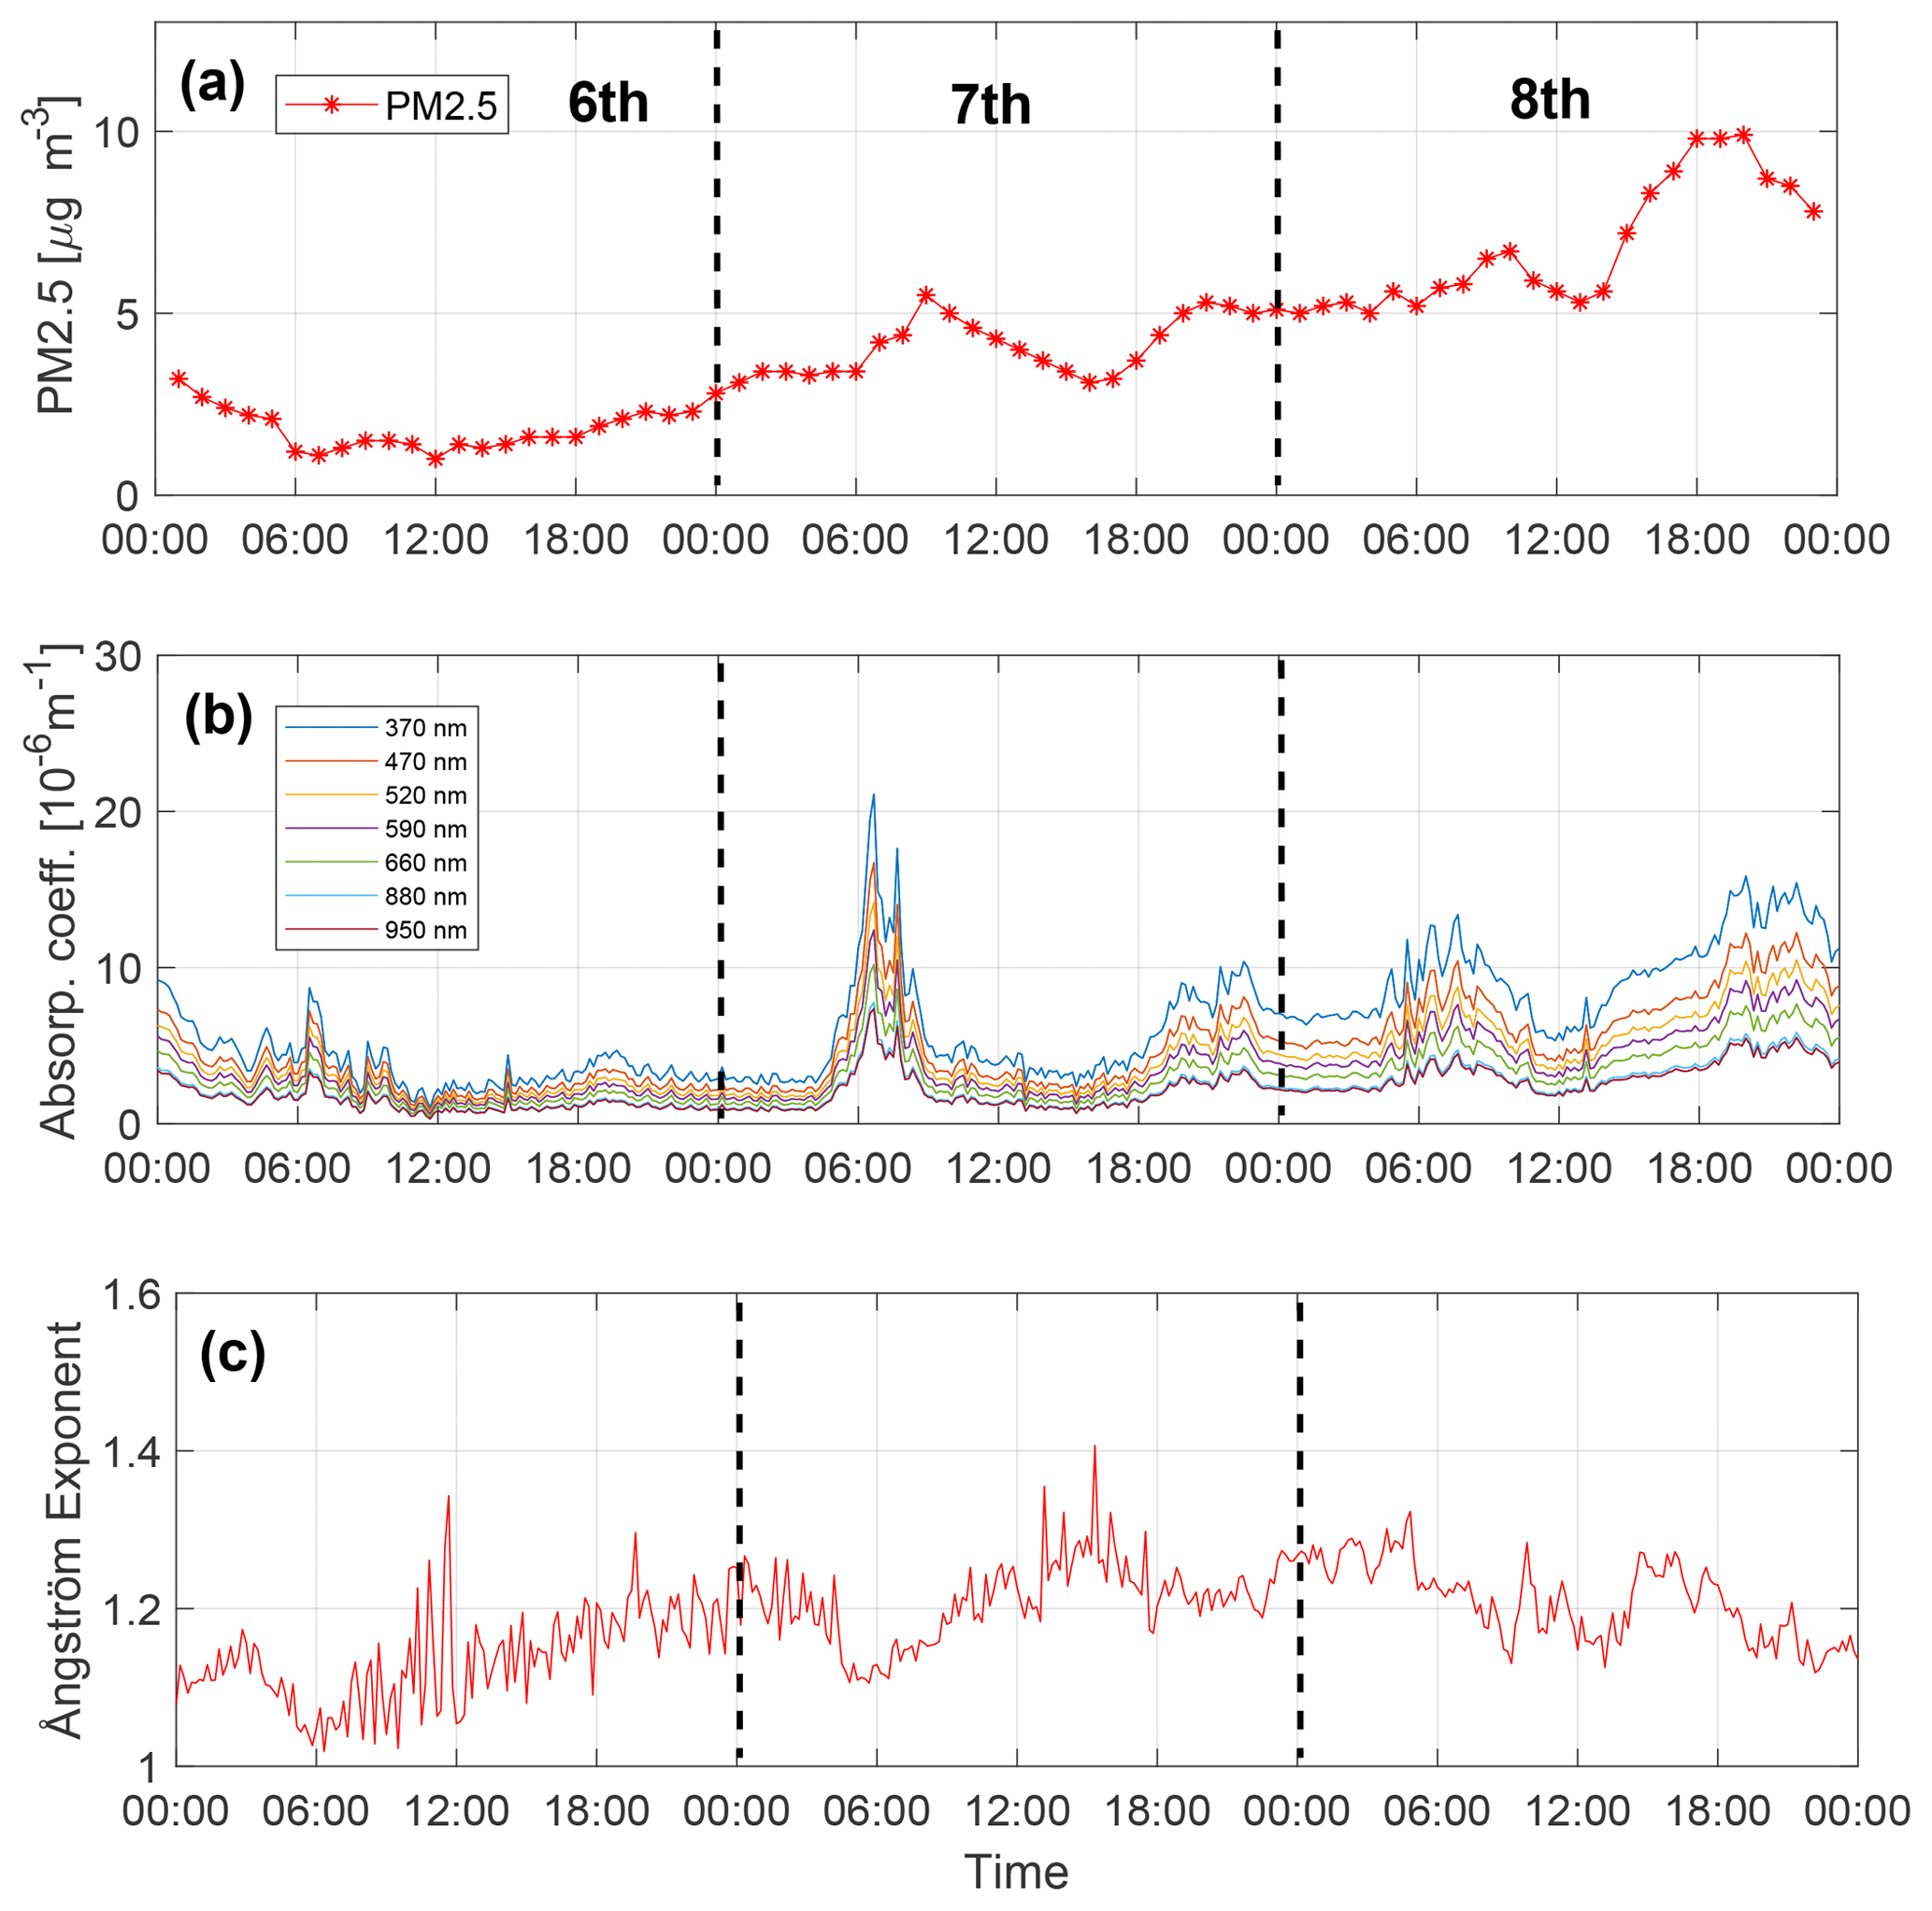
Figure 5(a) Surface PM2.5 concentrations at Payerne from 6 to 8 September 2017. (b) Absorption coefficient at seven wavelengths and (c) absorption Angstrom exponent from aethalometer measurements.
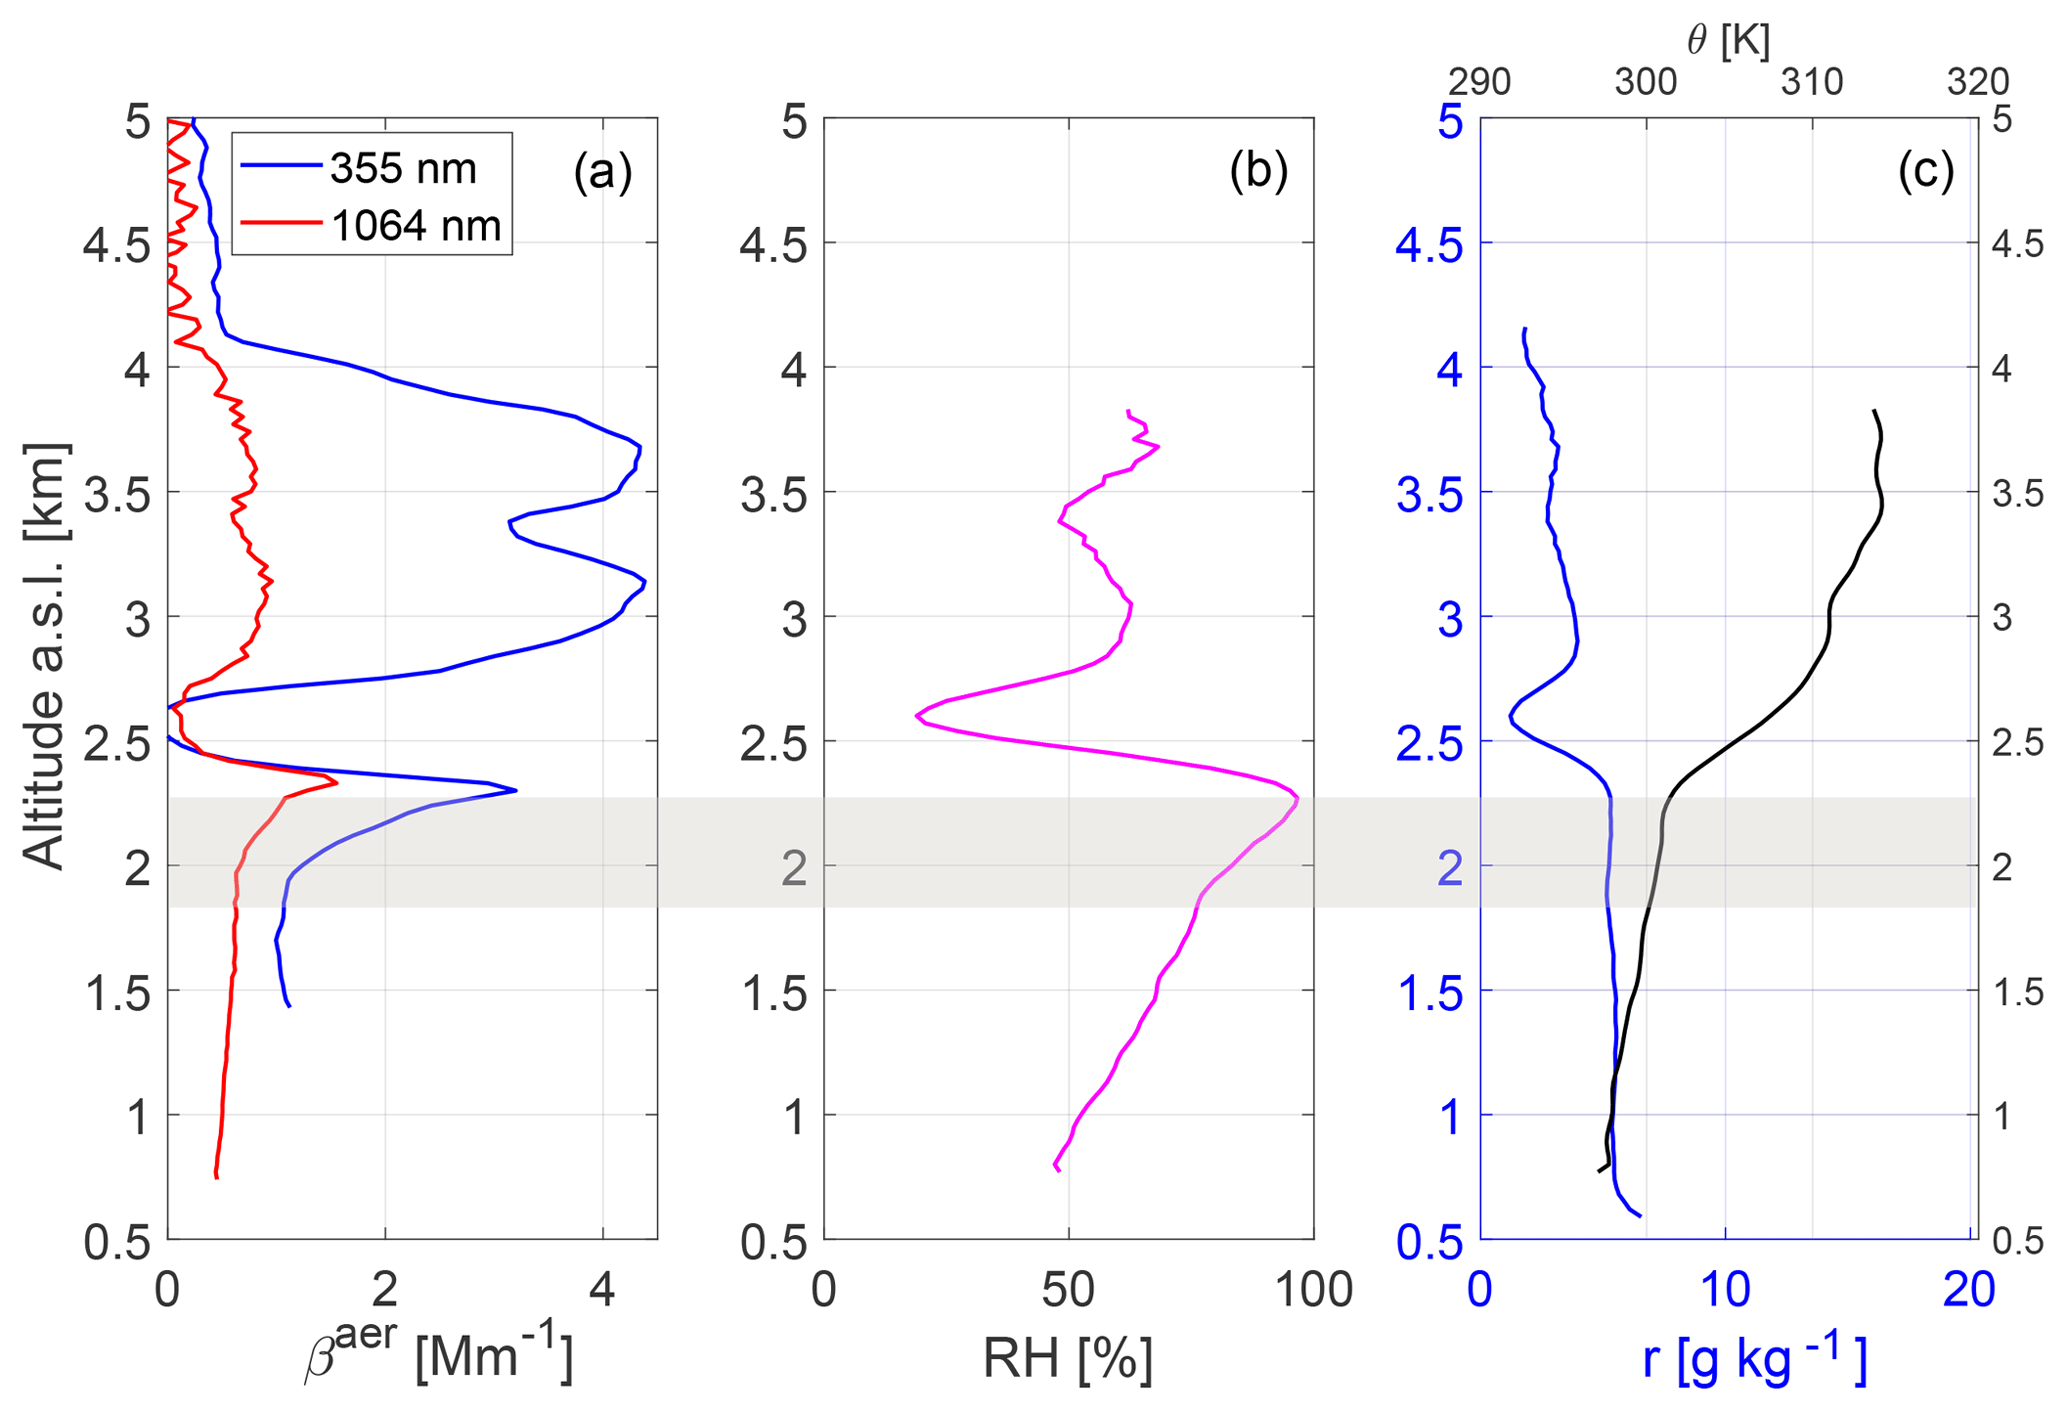
Figure 6Vertical profiles of (a) βaer at 355 and 1064 nm, (b) RH and (c) θ and r for the time interval 15:00–15:30 UTC on 7 September 2017. The grey shaded area indicates the layer in which aerosol hygroscopic growth occurred.
Following the methodology presented in Sect. 3.2, fβ at 355 and 1064 nm were obtained for the investigated layer from the combination of βaer and RH measurements. Figure 7 shows the dependency of fβ(RH) with RH, called a humidogram. The reference RH for this case was 73 %, which corresponds to the lowest value in the layer. From this figure, we can observe how β355 increased by a factor of 2.8 (fβ(97 %)=2.8), while humidity increased from 73 % to 97 % (blue points). Lower values of fβ are observed at 1064 nm (red points). In the infrared β increased by a factor of 1.8 with respect to its value at RHref (73 %), indicating a lower sensitivity of this wavelength to the aerosol hygroscopic growth. Hänel hygroscopic parameters (γ) obtained using the fitting equation (Eq. 7) were calculated (solid lines) in order to make our measurements comparable with other studies. This parameter is proportional to the aerosol hygroscopicity, and it had values of 0.48±0.08 at 355 nm and 0.29±0.08 at 1064 nm. Independent vertical profiles obtained from the measurements of the previous 30 min time interval (from 14:30 to 15:00 UTC) were also analyzed in order to check the consistency of our results (figure not shown here). For that period, a simultaneous increase in βaer and RH was also observed in the altitude range 1.5–2.2 km. Although the RH range observed for this time interval (70 %–93 %) was slightly different from the one shown in Fig. 6, γ showed consistent results, within the associated uncertainties, for both time intervals ( and ). A similar value of the hygroscopic parameter at 355 nm (γ355=0.40) is reported by Bedoya-Velásquez et al. (2018) and associated with the presence of smoke particles. In that study a combination of lidar and MWR measurements was used for the aerosol hygroscopic analysis. However, the spectral dependency found in our case is not what has been reported in other studies. Higher values for longer wavelengths (between 355 and 532 nm) were found in γ in other studies for smoke particles and also for anthropogenic particles using remote sensing (Bedoya-Velásquez et al., 2018; Lv et al., 2017). Haarig et al. (2017) also reported this higher hygroscopicity at 1064 nm but for marine particles. In situ studies also showed higher values for longer wavelengths, although over a shorter range (450–700 nm) and for marine particles (Kotchenruther et al., 1999; Zieger et al., 2013).
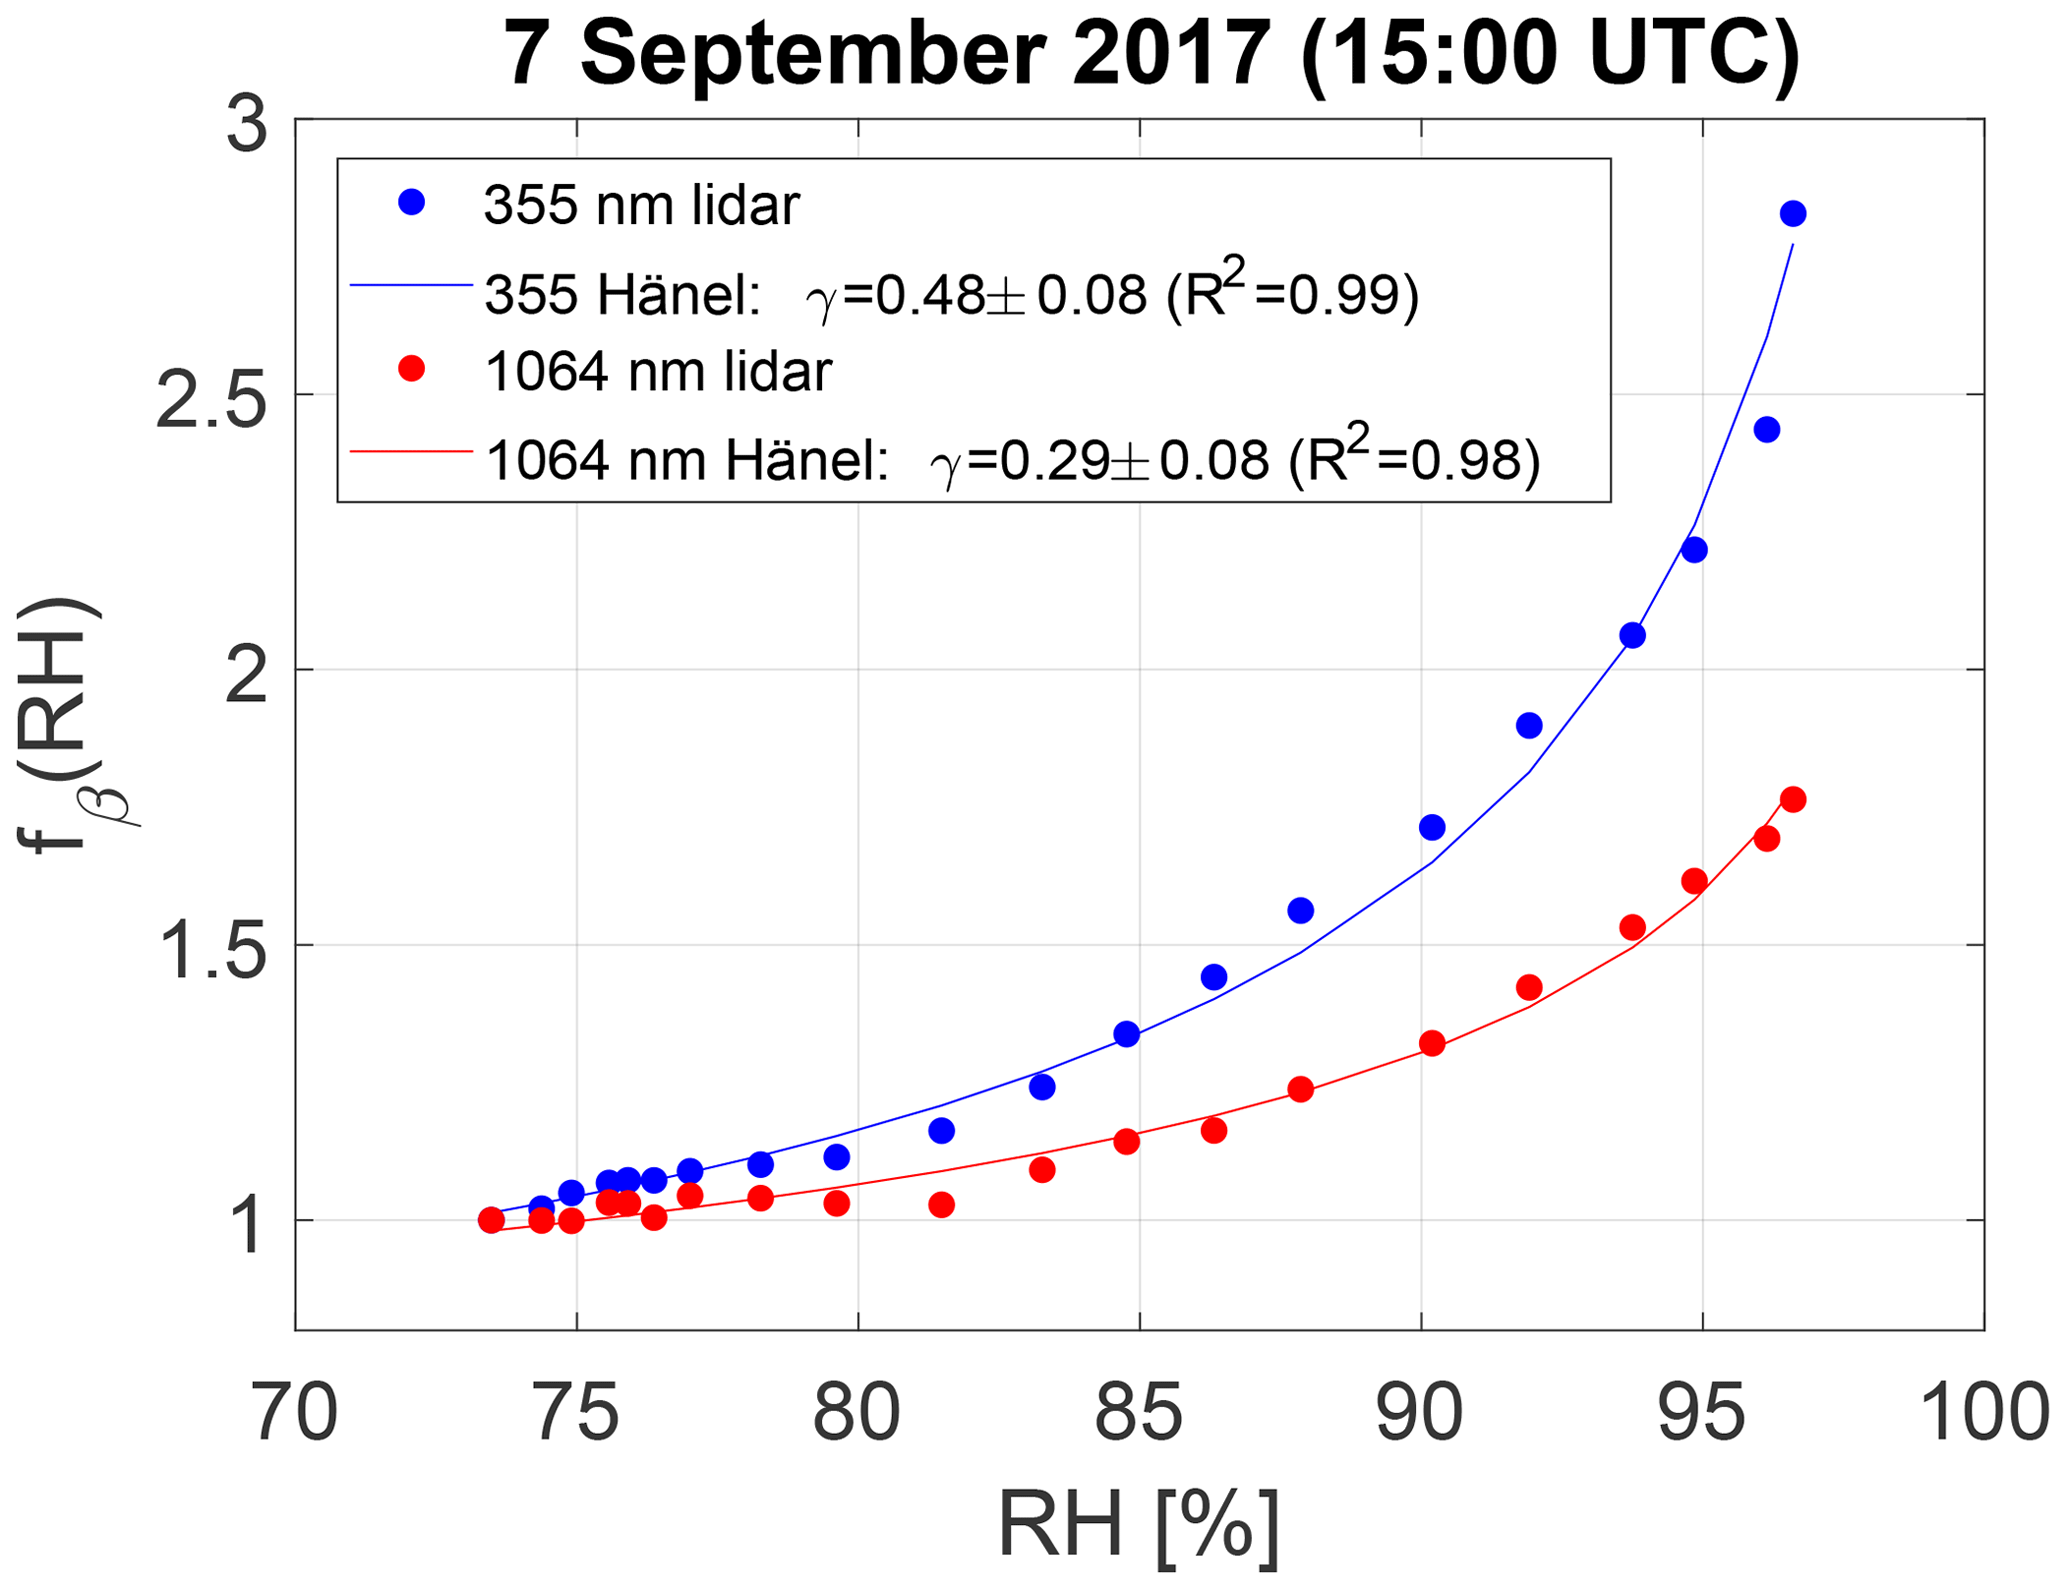
Figure 7fβ at 355 and 1064 nm retrieved from the lidar profiles (layer: 1.7–2.3 km a.s.l.) at the time interval 15:00–15:30 UTC on 7 September 2017.
We performed Mie simulations in order to understand whether the spectral dependency observed in our study could be realistic or not. βaer at the lidar wavelengths (355, 532 and 1064 nm) as a function of RH were computed using a Mie code (Bond et al., 2006; Mätzler, 2002). For these simulations some inputs such as the aerosol growth factor (1.6, which is typical for hygroscopic aerosol) and the refractive index () were assumed. Figure 8 shows the fβ calculated from the Mie calculation as a function of RH for different wavelengths and particle sizes. Monomodal distributions were used assuming different diameters for the dry particles and a geometric standard deviation of 1.5. From this figure we can observe that the backscatter is very sensitive to wavelength and particle size as expected, whose relationship is characterized in scattering theory by the size parameter (, where D is the particle diameter. A Mie scattering regime is expected for x≈1. A stronger increase in the backscattered radiation at the shortest wavelengths is expected for small particles (Ddry=200 nm) when RH increases according to these simulations (Fig. 8a). These results indicate that even a decrease in βaer at 1064 nm could be expected when the size particles increase due to hygroscopic growth. Figure 8b shows the humidogram for a dry particle diameter of 400 nm. A different spectral dependency is observed for this case, with slightly higher fβ at 532 nm than at 355 nm and lower at 1064 nm. These results agree with our observations and also explain the different spectral dependency observed in other studies for smoke and anthropogenic particles that could have similar sizes (small particles) to what is simulated here. Panels c and d in Fig. 8 show that for the biggest dry particle diameters (600 and 800 nm) the spectral dependency of fβ is inverted with respect to small particles with larger fβ values at the longest wavelengths. This spectral dependency agrees with the observations in Haarig et al. (2017) for marine particles which are considered much bigger particles than smoke particles. However, we must also point out that for many cases, larger particles in the atmosphere are further away from the ideal case of a sphere considered in Mie theory. Hence, this type of comparison should be considered with caution.

Figure 8fβ calculated from Mie simulations at 355, 532 and 1064 nm and for different particle diameters. The size parameter (x) has been indicated for each configuration of wavelength and size particle.
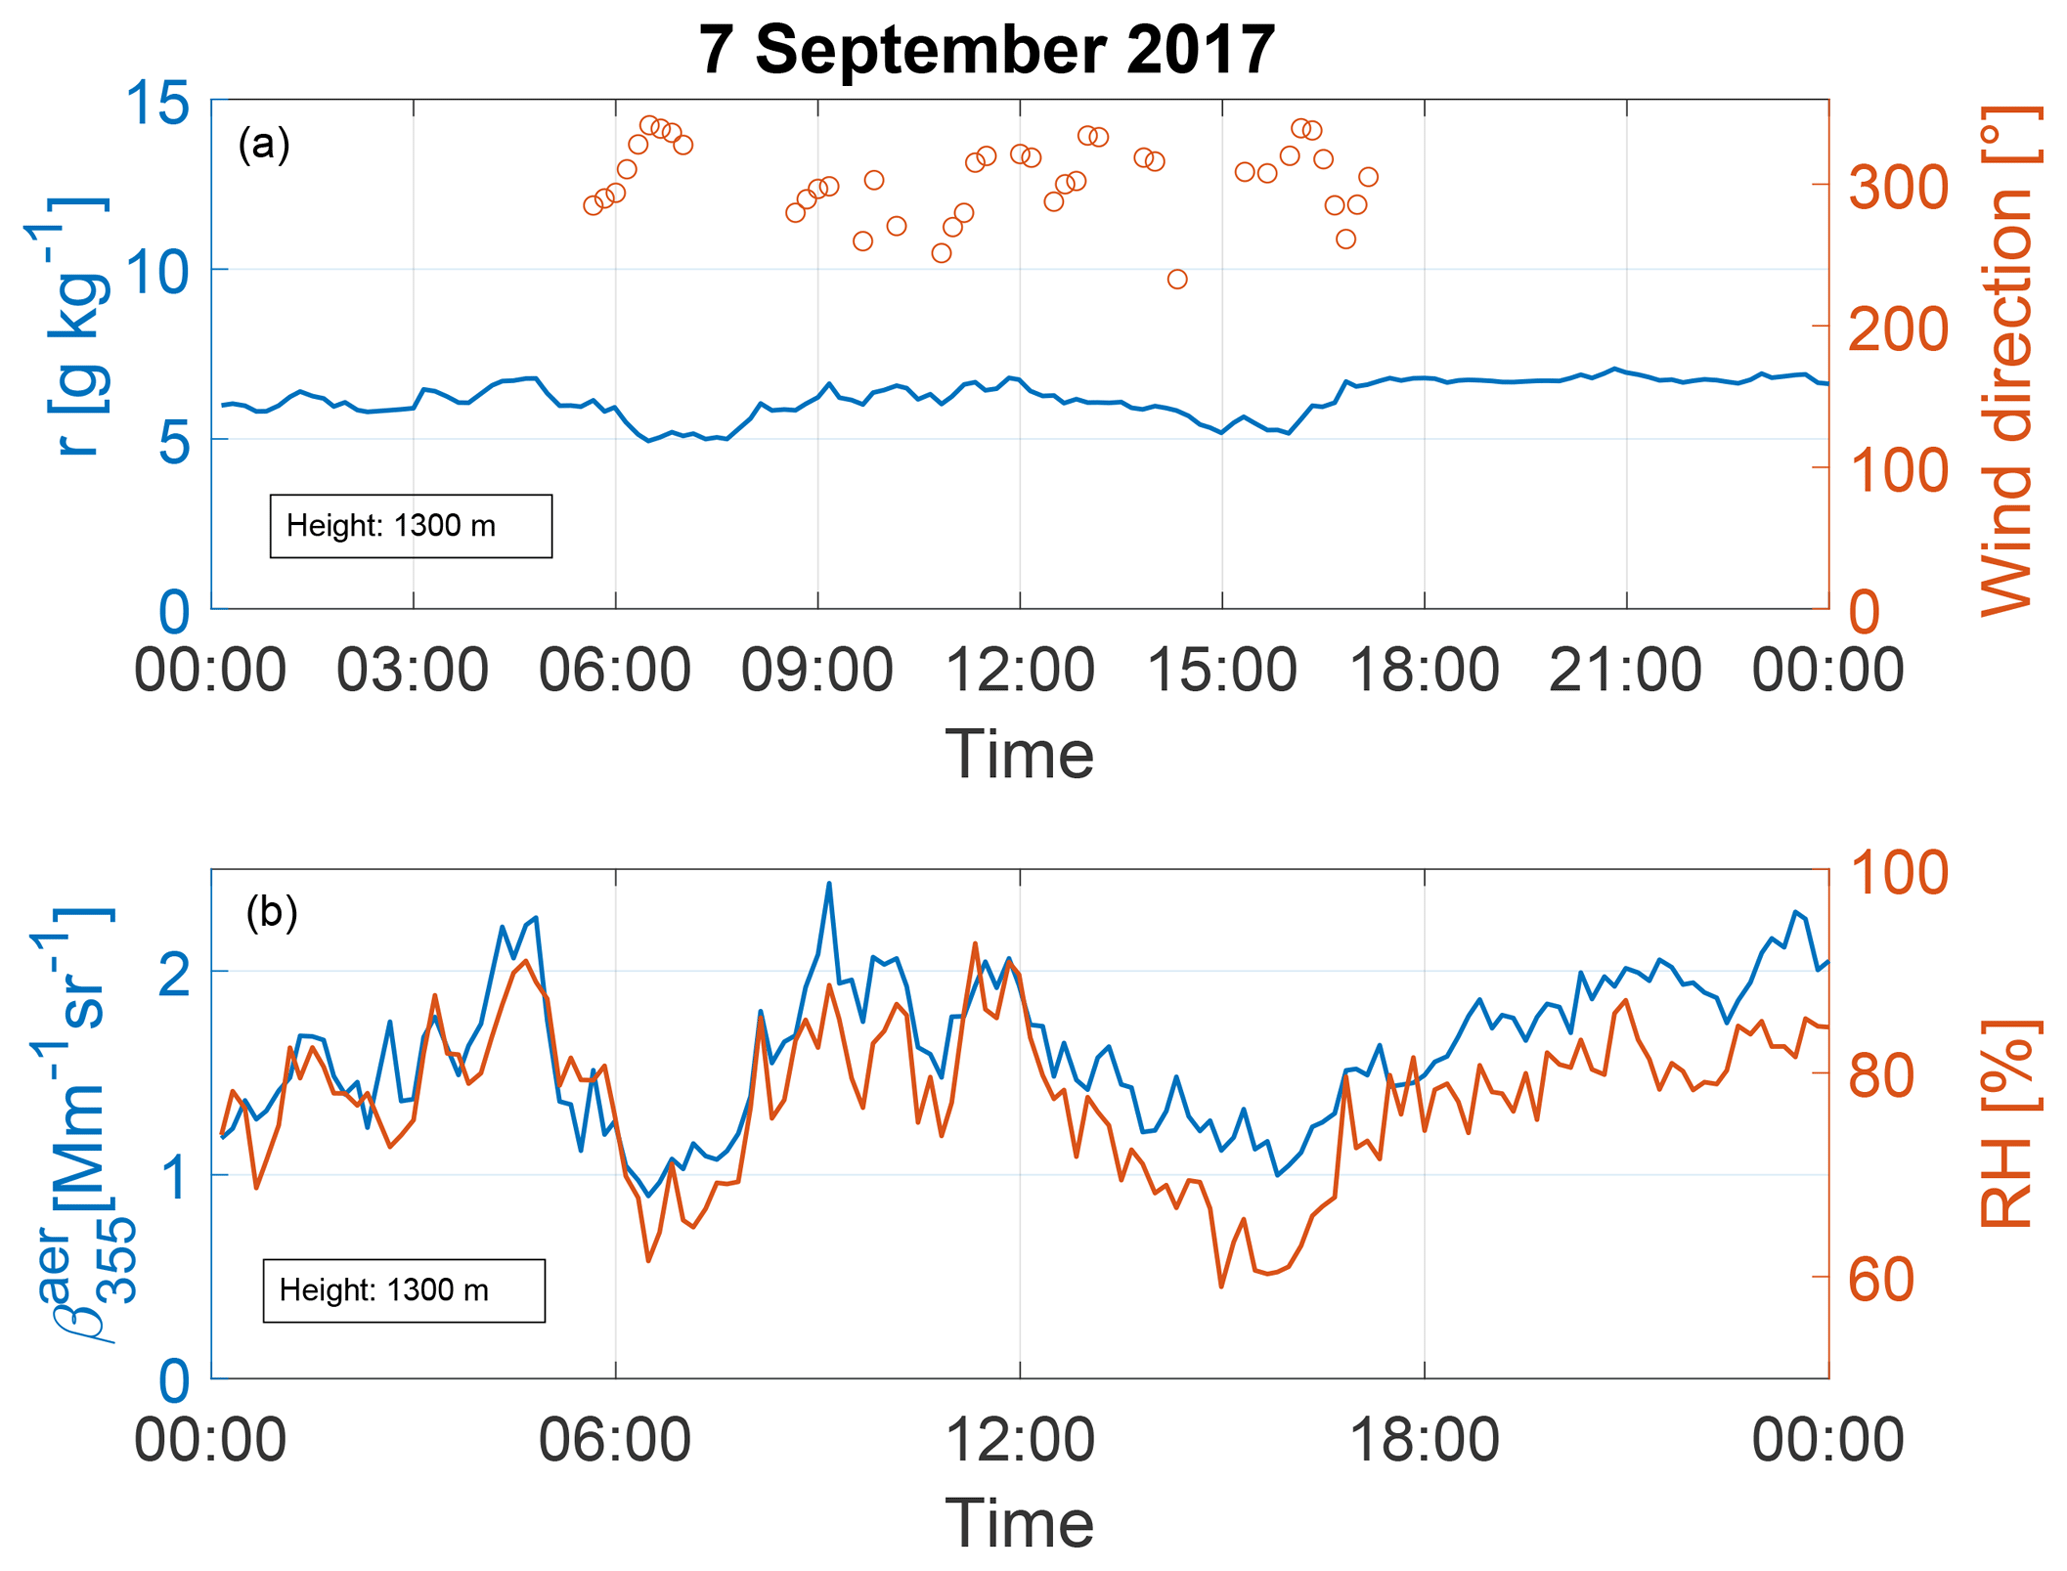
Figure 9Evolution of r and wind direction (a) and and RH (b) at 1.3 km (a.s.l.) on 7 September 2017.
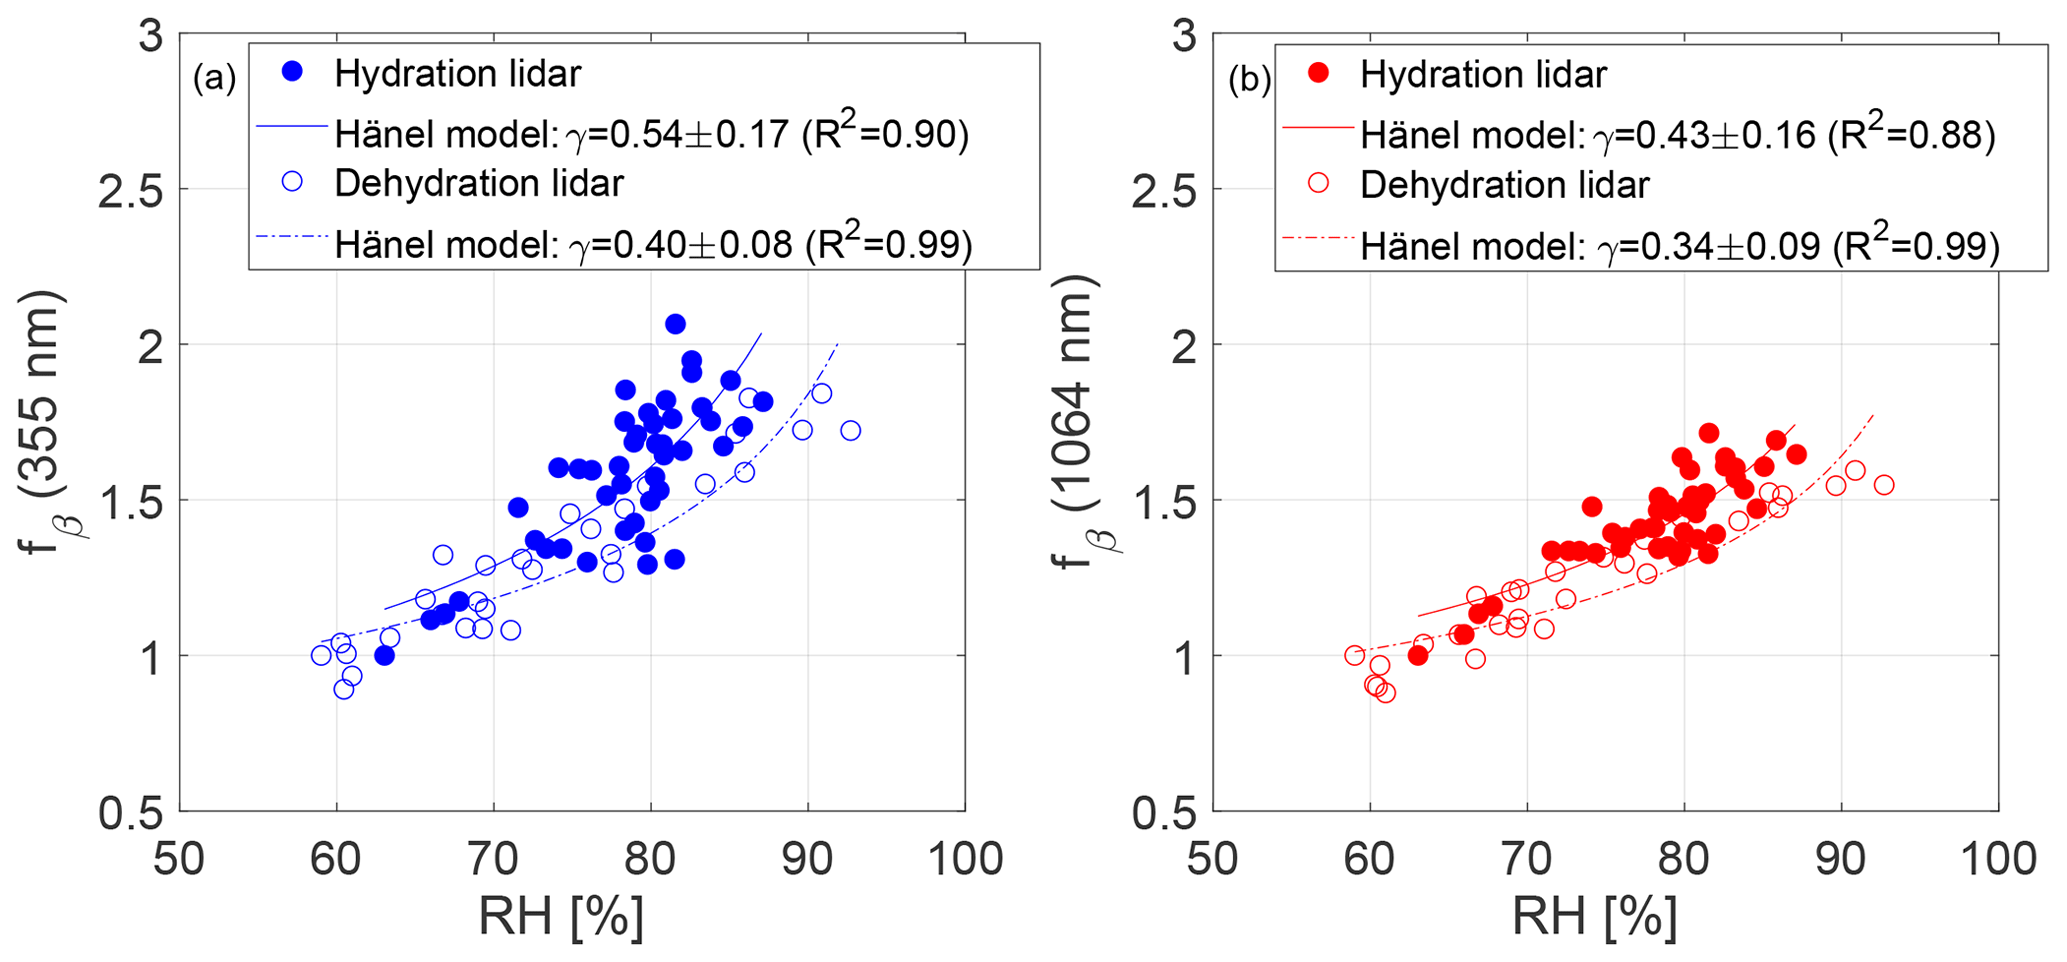
Figure 10Humidograms at 355 nm (a) and 1064 nm (b) retrieved from continuous measurements for hydration and dehydration processes on 7 September 2017.
Continuous aerosol and RH measurements from RALMO lidar also allow us to monitor aerosol hygroscopic processes occurring in time. Figure 9 shows the evolution of r, wind direction, βaer at 355 nm and RH at 1.3 km (a.s.l.) on 7 September 2017. As was indicated in Sect. 3.2, water vapor is considered a good tracer in the atmosphere, and constant values of r mean the air parcels have very similar origins. In this case, we can observe that r was quite constant (6.7±0.3 g kg−1, Fig. 9, top) during the evening (from 16:00 to 23:30 UTC), fulfilling the previous criterion. In addition, a simultaneous increase in βaer and RH was observed for the indicated period and altitude (Fig. 9, bottom). RH changed from 63 % in late afternoon to reach values close to 90 % at midnight.
In order to quantify the aerosol hygroscopic effect that took place in time, fβ was calculated for these measurements (Fig. 10a, blue filled circles). The initial value of (at RHref=63 %) increased by a factor of 2 when RH reached the maximum values of the evening. The Hänel parameterization was used for this dataset, providing a hygroscopic parameter of 0.54±0.17 which is in good agreement with the values observed in the atmospheric column in the afternoon of this day. In addition to this hydration process (water uptake) we could also observe the dehydration (evaporation) that occurred within this aerosol layer during the afternoon of this day (from 11:00 to 16:00 UTC, Fig. 9). In this period, r and the wind direction measurements were stable (6.0±0.5 g kg−1 and , respectively), evidence that the air mass did not change. A decrease in took place at the same time when RH decreased from 93 % to 59 %. The humidogram obtained for this dehydration process (Fig. 10a, blue open circles) also showed fβ values very close to the ones calculated in the later period and a hygroscopic parameter from the Hänel parametrization of 0.40±0.08. The same behavior was observed for β1064 from the ceilometer measurements along this day, with hygroscopic parameter values of 0.41±0.16 and 0.34±0.09 for hydration and dehydration processes, respectively, showing again lower values than at the ultraviolet channel. We would like to remark on the good agreement found in the aerosol hygroscopicity of this case using a vertical analysis and a temporal analysis.
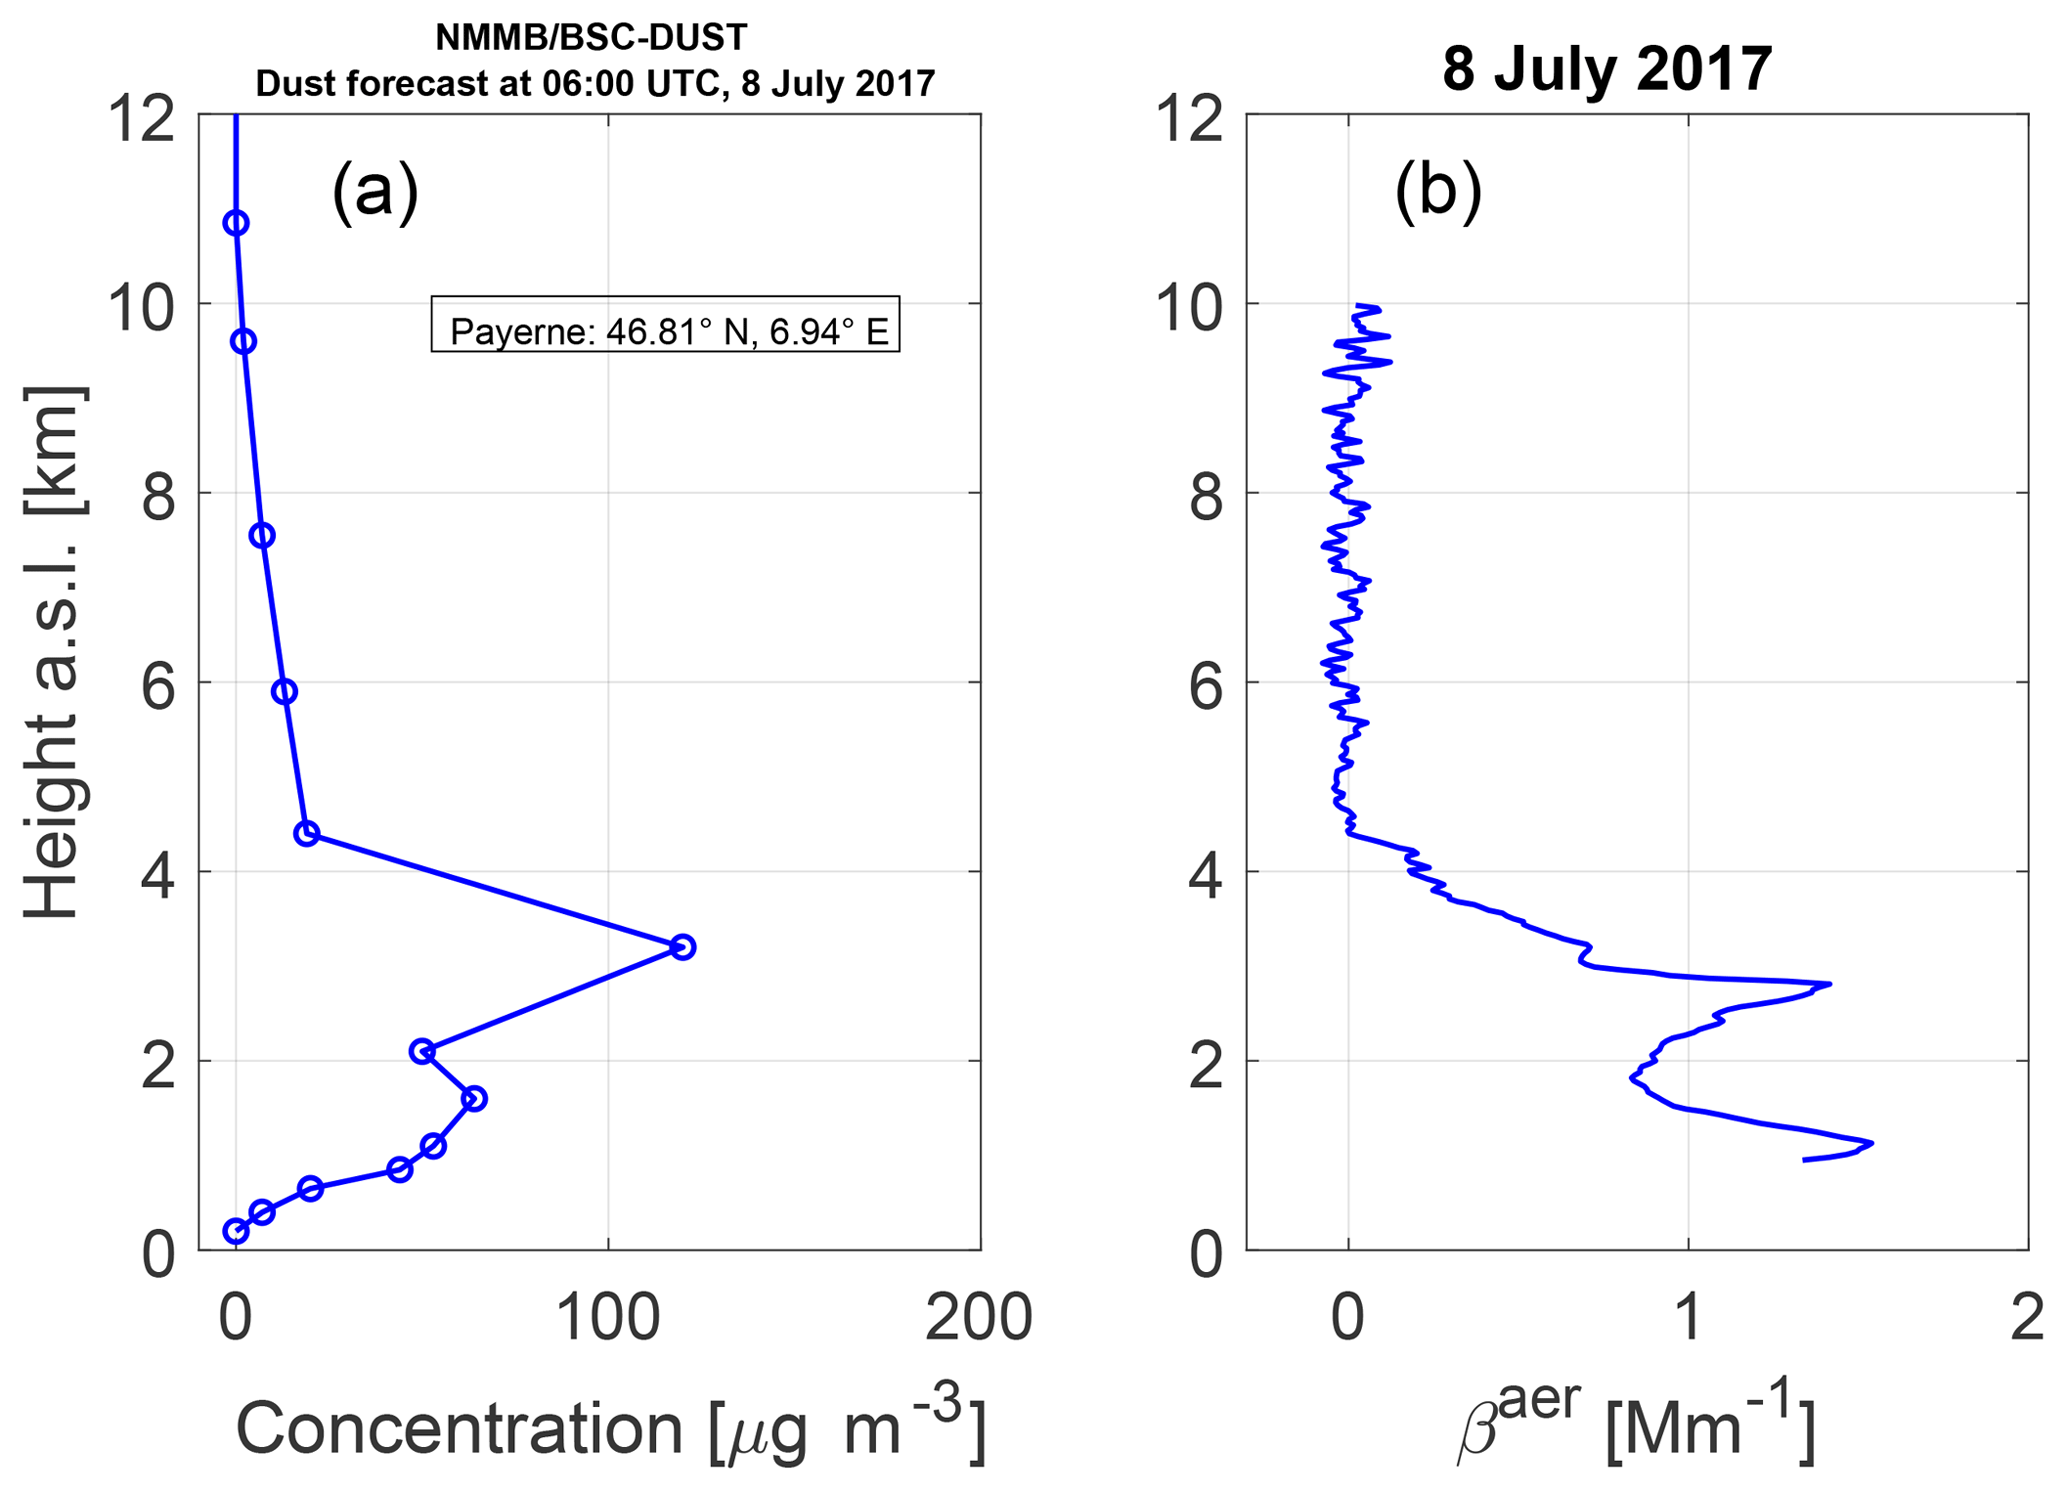
Figure 12(a) Dust concentration profile from NMMB/BSC model forecast at 06:00 UTC on 8 July 2017 (adapted from http://www.bsc.es/ess/bsc-dust-daily-forecast, last access: 15 September 2018). (b) Vertical profile of βaer at 355 nm from RALMO lidar for the time interval from 01:00 to 01:30 UTC on 8 July 2017.
5.2 Case II: hygroscopic growth of mineral dust particles
The second case took place on 8 July 2017. Figure 11 shows the evolution of r, RH and βaer at 355 nm from RALMO during the morning of this day. From the aerosol measurements (lowest panel) the presence of particles at high altitudes is evident, reaching almost 6 km (a.s.l.) in the late morning (around 09:00 UTC). For this day, the NMMB/BSC (Non-hydrostatic Multiscale Model/Barcelona Supercomputing Center) Dust model (Pérez et al., 2011) predicted dust particles over the western part of Europe, including Switzerland. A dust concentration profile calculated using this model for the EARLINET station of Payerne (Fig. 12a) showed higher concentration of mineral dust in the lower troposphere with a profile very similar to what was observed with our Raman lidar (Fig. 12b). Back-trajectory analysis from the HYSPLIT model (not shown here) indicated that the observed air masses had their origin in northern Africa. Remote and in situ measurements carried out at our station also confirmed features typical of this kind of particle. The AOD Angstrom exponent obtained from the PFR sun-photometer measurements presented low values (between 0.5 and 0.6) throughout the morning, indicating the presence of coarse particles in the atmospheric column. In situ measurements also showed a strong increase in the PM10 concentration at the surface during this day, with values ranging from 14 µg m−3 at 03:00 UTC to 37.4 µg m−3 at 15:00 UTC. The annual mean PM10 concentration in 2017 was 12 µg m−3, which is much lower than the values observed during this event.
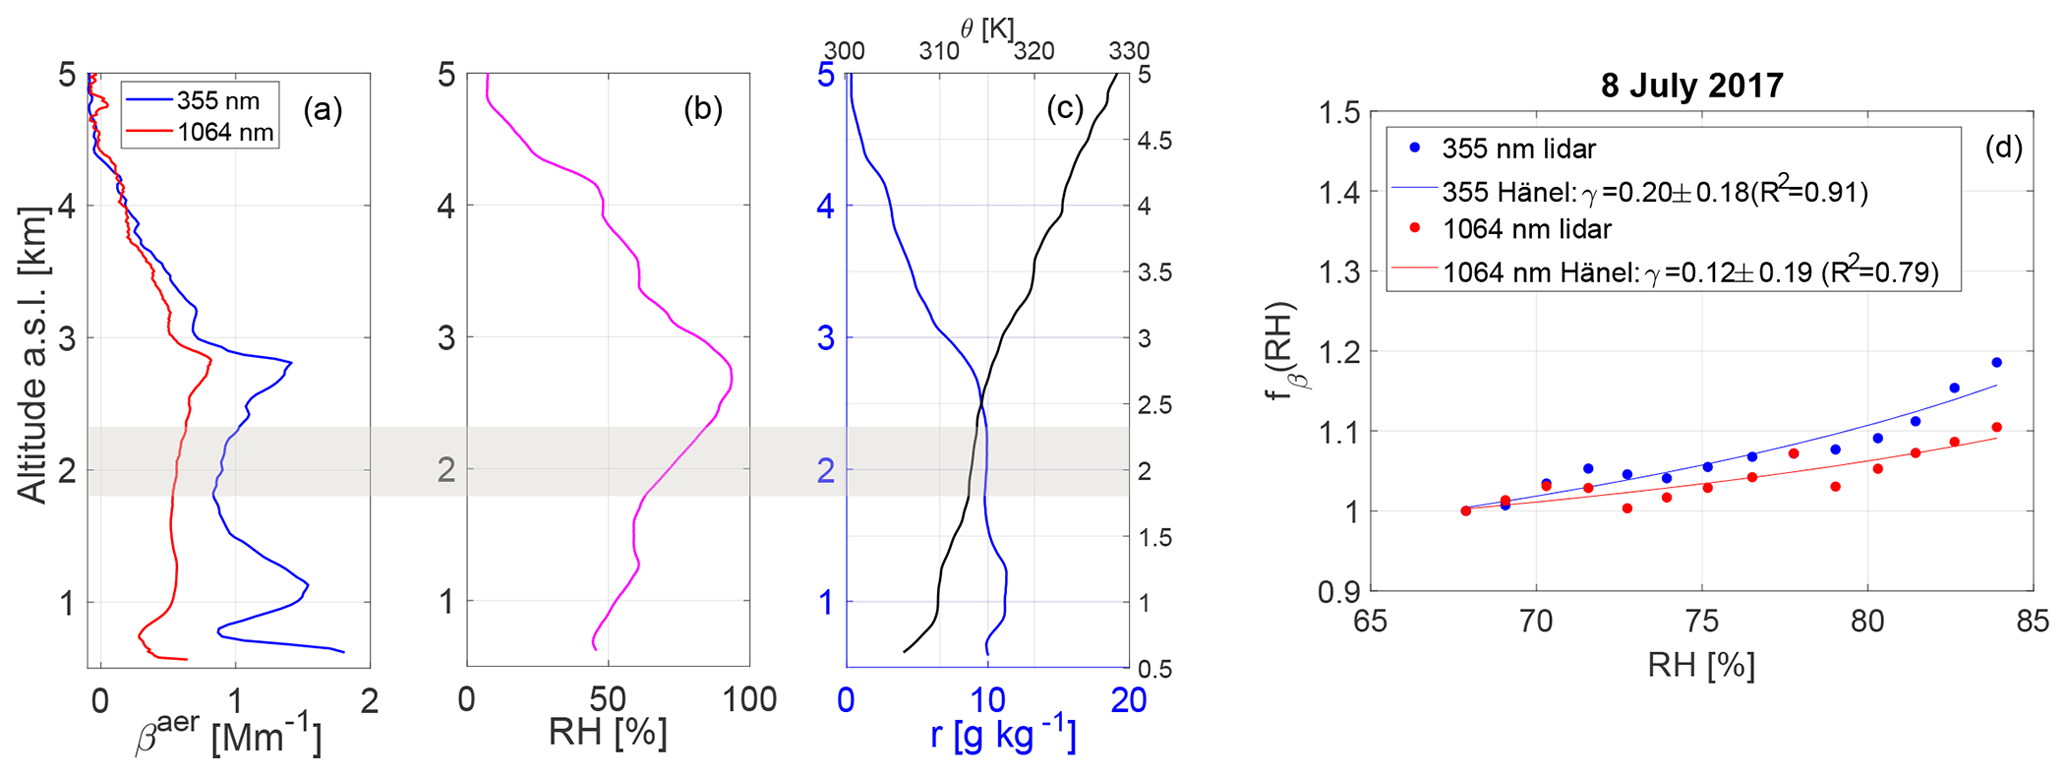
Figure 13Lidar vertical profiles of (a) βaer at 355 and 1064 nm, (b) RH and (c) θ and r obtained between 01:00 and 01:30 on 8 July 2017. (d) fβ at 355 and 1064 nm retrieved for those profiles.
Once the aerosol was well identified using models and measurements, we analyzed the vertical profiles obtained from the lidar (Fig. 13a–c). We observed a simultaneous increase in βaer from the lidar systems with RH at the altitude range between 1.9 and 2.3 km (a.s.l.). For that range, r and θ showed quite constant values, evidence of a well-mixed layer. The dependence of fβ at 355 and 1064 nm with RH is shown in the resultant humidogram in Fig. 13d. Although there was an intensification of the backscatter in both wavelengths ( and with RHref=68 %), it was much lower compared to Case I. The hygroscopic parameter obtained from the Hänel parametrization confirmed this behavior, with values of 0.20±0.18 and 0.12±0.19 at 355 and 1064 nm, respectively. These values are similar to the ones observed by Lv et al. (2017) also under the presence of mineral dust (γ355=0.12 and γ532=0.24). As in Case I, we found the opposite spectral dependency compared to Lv et al. (2017). However, we considered a wider spectral range.
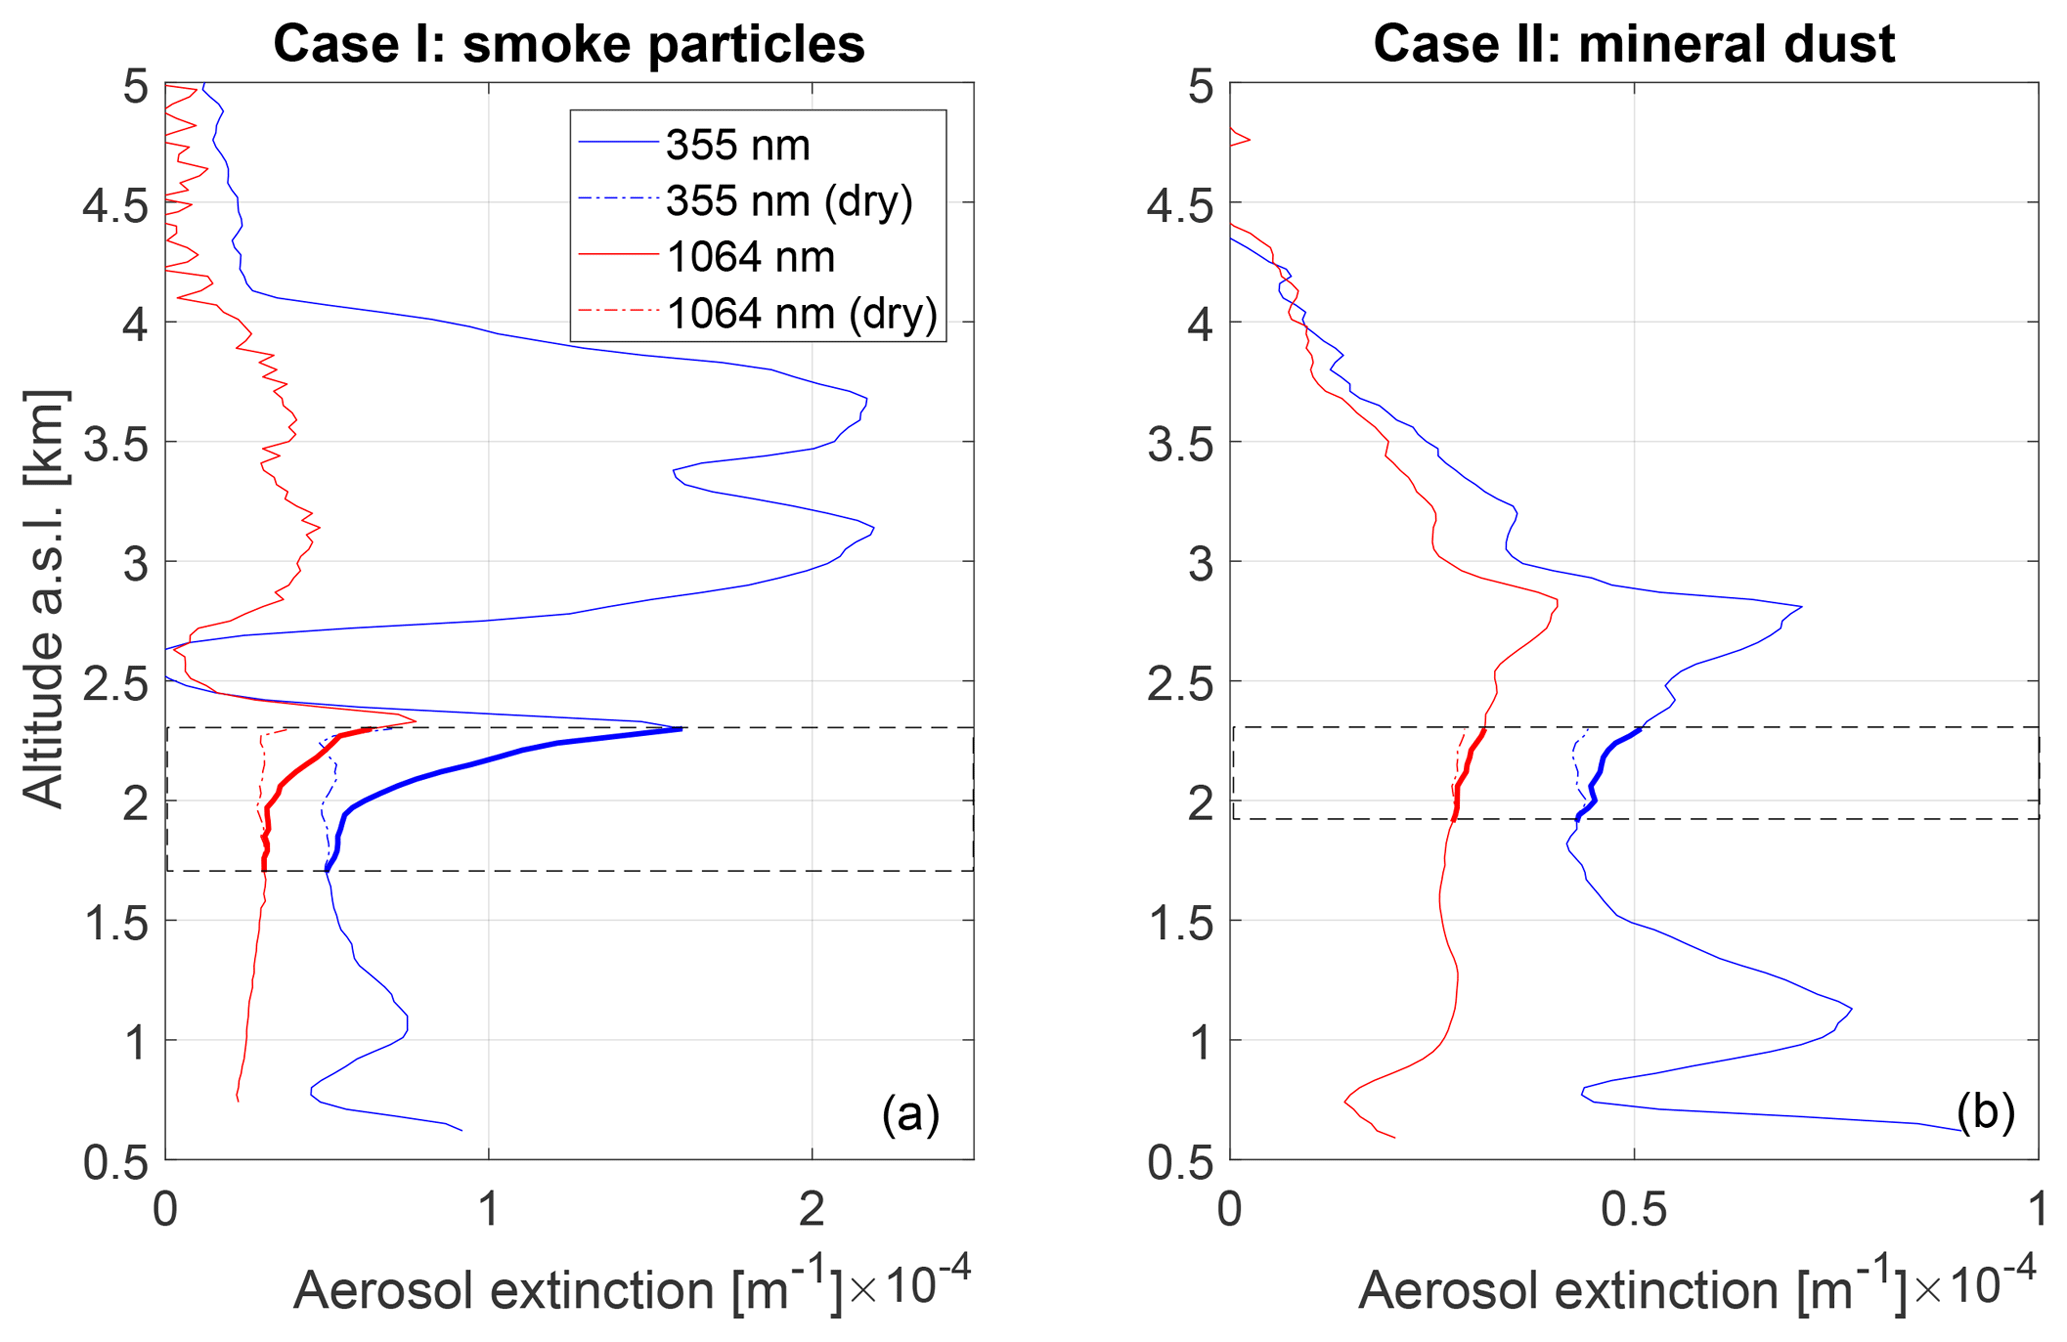
Figure 14Aerosol extinction profiles at 355 and 1064 nm considering wet (ambient) and dry conditions (in the layer with aerosol hygroscopicity, colored dashed lines) for Case I (a) and Case II (b). Horizontal dashed black lines indicate the layer for each case in which hygroscopic growth occurred.
Because of the changes in aerosol optical and microphysical properties due to water uptake, aerosol radiative properties are modified in the case of hygroscopic growth. As stated before, aerosol backscatter and extinction coefficients increase under high RH conditions, which in turn leads to an increase in the AOD. To compute the AOD, the βaer profiles at 355 nm were converted to extinction using a generic lidar ratio of 50 sr. Although the choice of LR could affect the AOD, the relative contribution due to aerosol hygroscopicity would remain almost constant. In order to calculate ΔAOD, the increment of AOD due to hygroscopic growth, we obtain a so-called “dry” aerosol extinction profile by using the Hänel parameterization and assuming that RH in the analyzed layer is equal to RHref for each case. The “dry” profiles obtained are included in Fig. 14. AODs for the dry and wet cases, as well as ΔAOD, are summarized in Table 1.
Table 1Column AOD and ARE for both dry and wet conditions and their difference. All relative values are given with respect to the dry conditions.

* Indicates values within the ABL (between the surface and 2.5 km).
For the two cases analyzed here, the increase in AOD at 355 nm related to the hygroscopic growth in the analyzed layers is ΔAOD = 0.017 (with ΔAOD = AOD − AODdry) for Case I and ΔAOD = 0.001 for Case II. In relative terms, this results in an increase in the total AOD of 4.7 % (15.6 % if we consider only AOD in the ABL where the hygroscopic layer is located) due to hygroscopic growth for Case I and 0.6 % for Case II. As expected, ΔAOD is much larger in Case I since smoke particles are more hygroscopic (γ355=0.48) than mineral dust (γ355=0.20). It is worth noting the significant effect of the hygroscopic growth on the ABL AOD, which increases by nearly 16 %.
Simulations with a radiative transfer model can give us an estimate of the impact that this change in AOD has on the aerosol radiative effect (ARE). In this case, we use GAME (Global Atmospheric ModEl, Dubuisson et al., 1996, 2005). GAME is a modular radiative transfer model that allows calculation of upward and downward radiative fluxes at different vertical levels with high resolution by using the discrete ordinates method (Stamnes et al., 1988). Details about the model parameterization can be found in Sicard et al. (2014) and Granados-Muñoz et al. (2019). In our case, the variations in the ARE (ΔARE) in the shortwave spectral range are exclusively related to the variations in AOD and the AE due to hygroscopic growth, whereas the other aerosol properties are assumed to remain constant. The calculation was done for a solar zenith of 30∘ corresponding to Case I, which presented stronger hygroscopicity and occurred at daytime (15:00 UTC). The changes in AOD produce a net increase (in absolute and relative values) in the aerosol radiative effect at the surface with respect to the “dry” profiles equal to 2.4 W m−2 (5.2 %) and 0.1 W m−2 (0.4 %) in Case I and Case II, respectively. The interpretation of these results needs to be done carefully. Even though radiative transfer models do not provide an estimation of the ARE uncertainties, a sensitivity test performed in Granados-Muñoz et al. (2019) showed that an uncertainty in the AOD of 0.05 can lead to uncertainties in the ARE of up to 30 %. The values of ΔARE obtained here are certainly within these uncertainty limits, and an accurate quantitative estimation of the hygroscopicity contribution to the ARE is quite complex. However, it is necessary to highlight that our focus here is on the relative contribution of hygroscopic aerosol to the ARE when compared to dry conditions. As expected, the effect observed in our simulations is more noticeable in the case of particles with stronger hygroscopic properties, such as the smoke mixture in Case I.
We also note that the relative increases in AOD (4.7 %) and ARE (5.2 %) are similar. For the mineral dust event the effect is almost negligible (ΔARE = 0.4 %). Variations of the ARE observed in previous studies can reach up to 7 W m−2 (Stock et al., 2011); however, a comparison with our data is not straightforward since these variations are highly dependent on the aerosol load and the aerosol type present in the atmosphere. In Case I, although the hygroscopic growth affects only a thin layer (only 600 m width) and the γ values are relatively low (0.48), the aerosol hygroscopic growth effect on the ARE is still quite noticeable. These results show that in more favorable conditions, namely thicker layers where the hygroscopic effect occurs and particles with stronger hygroscopic properties, the aerosol hygroscopic effect on the optical and radiative properties could be quite considerable. Therefore, we can conclude that including aerosol hygroscopic properties in climate model calculations is key for improving the accuracy of aerosol forcing estimates.
The present study demonstrates the capability of a Raman lidar to detect aerosol hygroscopic processes. Continuous measurements of water vapor, T and aerosol profiles have been performed by RALMO lidar almost continuously since 2008 at the aerological station of MeteoSwiss in Payerne (Switzerland). These measurements allow us to monitor any change in aerosol properties that could occur as a result of water uptake by particles under high RH (aerosol hygroscopic growth). To ensure that the changes in aerosol are only due to hygroscopic growth, several criteria were established. As a first condition an increase in βaer should occur simultaneously with an increase in RH. In addition, a high degree of homogeneity is required in the investigated layer. For that, back-trajectory analysis is used to verify that the origin of the air mass is independent of the altitude and low-varying or constant values of r and θ are required as a proxy for well-mixed conditions throughout the aerosol layer.
The accuracy and the precision of RALMO T and RH profiles were assessed using collocated RS profiles. A total of 172 profiles were used in this intercomparison during daytime and nighttime for the period from July to December of 2017. The mean T deviations calculated from nighttime (daytime) measurements revealed almost no bias between both techniques in the whole troposphere, with mean T deviations of 0.05±0.06 K ( K) in the first 5 km and 0.15±0.15 K ( K) above that altitude. The standard deviations also confirmed the excellent performance of RALMO, with values below 1 K throughout the troposphere during nighttime and slightly larger values during daytime (0.8±0.2 K from ground to 5 km and 2.4±0.8 K from 5 to 10 km).
Lidar profiles of RH were obtained by combining r and T measurements. Small RH biases were observed between both techniques during nighttime in the troposphere (from ground to 9 km a.s.l.), with values ranging between 3 % RH at 1.4 km (a.s.l.) and −9 % RH at 5.6 km (a.s.l.). The standard deviation of RH deviations also showed the good precision of the lidar measurements, with values always lower than 9 % RH. The performance of RALMO in terms of RH during daytime in the lower troposphere (from ground to 5 km) was very similar to the ones obtained during nighttime. However, above 5 km the errors were much larger due to the solar background radiation, and RH profiles were not calculated to avoid these large uncertainties. The good quality of the RH measurements found in this intercomparison is a key aspect to be able to address the aerosol hygroscopic studies.
The methodology presented here was applied to two case studies. In situ and satellite measurements in addition to models indicate that Case I (7 September 2017) was characterized by a mixture of local aerosol and smoke particles from fires in North America. fβ was found to be 2.8 at 355 nm and 1.8 at 1064 nm when RH increased from 73 % to 97 % in the investigated layer. The Hänel hygroscopic parameter which is proportional to the aerosol hygroscopicity took values of 0.48±0.08 at 355 nm and 0.29±0.08 at 1064 nm in this case. Independent vertical profiles obtained for a previous time interval showed the consistency of our results. Other remote sensing studies have shown a larger sensitivity to hygroscopic growth for longer wavelengths for this type of particle, in contrast to our results. However, those studies were carried out in a shorter wavelength range (355–532 nm). Haarig et al. (2017) also observed a higher hygroscopicity at 1064 nm than at 355 nm but for marine particles which are larger and much more hygroscopic than in our case. Mie simulations carried out in this study revealed that the spectral dependency of fβ can change strongly depending on the particle size and the wavelength of the incident radiation, supporting our results as well as the study of Haarig et al. (2017).
Continuous aerosol and RH measurements from RALMO also allowed monitoring of aerosol hygroscopic processes as a function of time for this first case. The evolution of β and RH at 1.3 km (a.s.l.) on 7 September 2017 showed two periods in which there was a simultaneous decrease in both parameters (dehydration process) followed by a simultaneous increase (hydration process). The Hänel hygroscopic parameters calculated from the humidogram (fβ vs. RH) for both periods took values of 0.54±0.17 (0.43±0.16) and 0.40±0.08 (0.34±0.09) at 355 nm (1064 nm) for the hydration and dehydration processes, respectively, which are in good agreement with the results obtained in the spatial (vertical) analysis.
The aerosol hygroscopicity of a second case (8 July 2017), characterized by the presence of dust particles, was also analyzed in this study. The spatial analysis of the lidar measurements also revealed hygroscopic growth for these particles but with a very different behavior. A much lower hygroscopicity than for the previous case (smoke mixture) was observed with β increasing only 1.2 and 1.1 times at 355 and 1064 nm, respectively, when RH increased from 68 % to 84 %. The hygroscopic parameters obtained from the humidogram were 0.20±0.18 and 0.12±0.19 at 355 and 1064 nm, respectively, showing a good agreement with values observed in other studies for mineral dust. The lower spectral sensitivity to the aerosol hygroscopicity found for this type of particle was also remarkable.
Finally, the impact of aerosol hygroscopicity on the Earth's radiative balance was evaluated for the two presented cases using a radiative transfer model (GAME). The aerosol hygroscopic growth in the investigated layers produced an increase in AOD at 355 nm of 0.017 (4.7 %) for the case with presence of smoke particles and 0.001 (0.6 %) for the case with mineral dust. These changes in AOD produced a net increase in absolute (and relative) values of the radiative effect at the surface of 2.4 W m−2 (5.2 %) and 0.1 W m−2 (0.4 %) in Case I and Case II, respectively. The results were significant for the case with presence of smoke particles (more hygroscopic) despite the aerosol load of the investigated layer not having been very high. Therefore, we conclude that the effect of aerosol hygroscopicity on optical and radiative properties is important and has to be considered in climate model calculations to improve aerosol forcing estimates.
In future work we want to exploit the large dataset (10 years) of simultaneous aerosol and RH profiles from this Raman lidar to carry out a statistical analysis of aerosol hygroscopic properties.
Data used in this paper are available upon request from the corresponding author (francisco.navas@meteoswiss.ch).
FNG designed the experiment, analyzed the data and wrote the manuscript, GM worked on the T retrievals, MH and MCC performed the Mie simulations, AH is responsible for the lidar measurements and participated in the numerous scientific discussions, and MJGR and MS performed the calculations with the radiative transfer model (GAME). All the authors provided comments on the manuscript.
The authors declare that they have no conflict of interest.
This article is part of the special issue “EARLINET aerosol profiling: contributions to atmospheric and climate research”. It is not associated with a conference.
We thank the EMPA and the Swiss Federal Office for the Environment (FOEN) for providing the data of the in situ measurements carried out at Payerne within the Nabel monitoring program. We also acknowledge the financial support by the European Union's Horizon 2020 research and innovation program through project ACTRIS-2 (grant agreement no. 654109). The radiative transfer simulations performed with GAME are supported by the European Union GRASP-ACE MSCA-RISE Action (grant agreement no. 778349); the Spanish Ministry of Economy and Competitiveness (ref. TEC2015-63832-P) and EFRD (European Fund for Regional Development); the Spanish Ministry of Science, Innovation and Universities (ref. CGL2017-90884-REDT); and the Unity of Excellence Maria de Maeztu (ref. MDM-2016-0600) financed by the Spanish Agencia Estatal de Investigación. This work was also supported by the Juan de la Cierva-Formación program (grant FJCI-2015-23904). The authors also gratefully acknowledge Philippe Dubuisson (Laboratoire d'Optique Atmosphérique, Université de Lille, France) for the use of the GAME model.
This work has been supported by the Swiss National Science Foundation (project no. PZ00P2 168114).
This paper was edited by Eduardo Landulfo and reviewed by two anonymous referees.
Ansmann, A., Riebesell, M., Wandinger, U., Weitkamp, C., Voss, E., Lahmann, W., and Michaelis, W.: Combined Raman elastic-backscatter lidar for vertical profiling of moisture, aerosol extinction, backscatter, and lidar ratio, Appl. Phys. B, 55, 18–28, 1992. a
Bedoya-Velásquez, A. E., Navas-Guzmán, F., Granados-Muñoz, M. J., Titos, G., Román, R., Casquero-Vera, J. A., Ortiz-Amezcua, P., Benavent-Oltra, J. A., de Arruda Moreira, G., Montilla-Rosero, E., Hoyos, C. D., Artiñano, B., Coz, E., Olmo-Reyes, F. J., Alados-Arboledas, L., and Guerrero-Rascado, J. L.: Hygroscopic growth study in the framework of EARLINET during the SLOPE I campaign: synergy of remote sensing and in situ instrumentation, Atmos. Chem. Phys., 18, 7001–7017, https://doi.org/10.5194/acp-18-7001-2018, 2018. a, b, c, d, e, f
Bindoff, N., Stott, P., AchutaRao, K., Allen, M., Gillett, N., Gutzler, D., Hansingo, K., Hegerl, G., Hu, Y., Jain, S., Mokhov, I., Overland, J., Perlwitz, J., Sebbari, R., and Zhang, X.: Detection and Attribution of Climate Change: from Global to Regional, in: Climate Change 2013: The Physical Science Basis. Contribution of Working Group I to the Fifth Assessment Report of the Intergovernmental Panel on Climate Change, edited by: Stocker, T. F., Qin, D., Plattner, G.-K., Tignor, M., Allen, S. K., Boschung, J., Nauels, A., Xia, Y., Bex, V., and Midgley, P. M., Cambridge University Press, Cambridge, UK, New York, NY, USA, 867–952, 2013. a
Bond, T. C., Habib, G., and Bergstrom, R. W.: Limitations in the enhancement of visible light absorption due to mixing state, J. Geophys. Res.-Atmos., 111, D20211, https://doi.org/10.1029/2006JD007315, 2006. a
Bösenberg, J., Matthias, V., Linné, H., Comerón Tejero, A., Rocadenbosch Burillo, F., Pérez López, C., and Baldasano Recio, J. M.: EARLINET: A European Aerosol Research Lidar Network to establish an aerosol climatology, Report. Max-Planck-Institut fur Meteorologie, 1–191, 2003. a
Brocard, E., Philipona, R., Haefele, A., Romanens, G., Mueller, A., Ruffieux, D., Simeonov, V., and Calpini, B.: Raman Lidar for Meteorological Observations, RALMO – Part 2: Validation of water vapor measurements, Atmos. Meas. Tech., 6, 1347–1358, https://doi.org/10.5194/amt-6-1347-2013, 2013. a, b
Christensen, J. H.: The Danish Eulerian hemispheric model – A three-dimensional air pollution model used for the Arctic, Atmos. Environ., 31, 4169–4191, 1997. a
Collaud Coen, M., Weingartner, E., Schaub, D., Hueglin, C., Corrigan, C., Henning, S., Schwikowski, M., and Baltensperger, U.: Saharan dust events at the Jungfraujoch: detection by wavelength dependence of the single scattering albedo and first climatology analysis, Atmos. Chem. Phys., 4, 2465–2480, https://doi.org/10.5194/acp-4-2465-2004, 2004. a
Dinoev, T., Simeonov, V., Arshinov, Y., Bobrovnikov, S., Ristori, P., Calpini, B., Parlange, M., and van den Bergh, H.: Raman Lidar for Meteorological Observations, RALMO – Part 1: Instrument description, Atmos. Meas. Tech., 6, 1329–1346, https://doi.org/10.5194/amt-6-1329-2013, 2013. a, b, c
Draxler, R. R. and Rolph, G. D.: HYSPLIT (HYbrid Single-Particle Lagrangian Integrated Trajectory) model,NOAA Air Resources Laboratory, Silver Spring, available at: http://ready.arl.noaa.gov/HYSPLIT.php (last access: 22 November 2018), 2003. a
Dubuisson, P., Buriez, J., and Fouquart, Y.: High spectral resolution solar radiative transfer in absorbing and scattering media: Application to the satellite simulation, J. Quant. Spectrosc. Ra., 55, 103–126, 1996. a
Dubuisson, P., Giraud, V., Chomette, O., Chepfer, H., and Pelon, J.: Fast radiative transfer modeling for infrared imaging radiometry, J. Quant. Spectrosc. Ra., 95, 201–220, 2005. a
Feingold, G. and Morley, B.: Aerosol hygroscopic properties as measured by lidar and comparison with in situ measurements, J. Geophys. Res.-Atmos., 108, 4327, https://doi.org/10.1029/2002JD002842, 2003. a, b
Fernández, A., Molero, F., Becerril-Valle, M., Coz, E., Salvador, P., Artíñano, B., and Pujadas, M.: Application of remote sensing techniques to study aerosol water vapour uptake in a real atmosphere, Atmos, Res,, 202, 112–127, 2018. a
Fierz-Schmidhauser, R., Zieger, P., Gysel, M., Kammermann, L., DeCarlo, P. F., Baltensperger, U., and Weingartner, E.: Measured and predicted aerosol light scattering enhancement factors at the high alpine site Jungfraujoch, Atmos. Chem. Phys., 10, 2319–2333, https://doi.org/10.5194/acp-10-2319-2010, 2010. a
Goldsmith, J., Blair, F. H., Bisson, S. E., and Turner, D. D.: Turn-key Raman lidar for profiling atmospheric water vapor, clouds, and aerosols, Appl. Opt., 37, 4979–4990, 1998. a
Granados-Muñoz, M., Guerrero-Rascado, J., Bravo-Aranda, J., Navas-Guzmán, F., Valenzuela, A., Lyamani, H., Chaikovsky, A., Wandinger, U., Ansmann, A., Dubovik, O., Grudo, J. O. and Alados-Arboledas, L.: Retrieving aerosol microphysical properties by Lidar-Radiometer Inversion Code (LIRIC) for different aerosol types, J. Geophys. Res.-Atmos., 119, 4836–4858, 2014. a
Granados-Muñoz, M. J., Navas-Guzmán, F., Bravo-Aranda, J. A., Guerrero-Rascado, J. L., Lyamani, H., Valenzuela, A., Titos, G., Fernández-Gálvez, J., and Alados-Arboledas, L.: Hygroscopic growth of atmospheric aerosol particles based on active remote sensing and radiosounding measurements: selected cases in southeastern Spain, Atmos. Meas. Tech., 8, 705–718, https://doi.org/10.5194/amt-8-705-2015, 2015. a, b, c
Granados-Muñoz, M. J., Sicard, M., Román, R., Benavent-Oltra, J. A., Barragán, R., Brogniez, G., Denjean, C., Mallet, M., Formenti, P., Torres, B., and Alados-Arboledas, L.: Impact of mineral dust on shortwave and longwave radiation: evaluation of different vertically resolved parameterizations in 1-D radiative transfer computations , Atmos. Chem. Phys., 19, 523–542, https://doi.org/10.5194/acp-19-523-2019, 2019. a, b
Haarig, M., Ansmann, A., Gasteiger, J., Kandler, K., Althausen, D., Baars, H., Radenz, M., and Farrell, D. A.: Dry versus wet marine particle optical properties: RH dependence of depolarization ratio, backscatter, and extinction from multiwavelength lidar measurements during SALTRACE, Atmos. Chem. Phys., 17, 14199–14217, https://doi.org/10.5194/acp-17-14199-2017, 2017. a, b, c, d
Haeffelin, M., Laffineur, Q., Bravo-Aranda, J.-A., Drouin, M.-A., Casquero-Vera, J.-A., Dupont, J.-C., and De Backer, H.: Radiation fog formation alerts using attenuated backscatter power from automatic lidars and ceilometers, Atmos. Meas. Tech., 9, 5347–5365, https://doi.org/10.5194/amt-9-5347-2016, 2016. a
Hänel, G.: The properties of atmospheric aerosol particles as functions of the relative humidity at thermodynamic equilibrium with the surrounding moist air, Elsevier, Adv. Geophys., 19, 73–188, 1976. a, b
Haywood, J. and Boucher, O.: Estimates of the direct and indirect radiative forcing due to tropospheric aerosols: A review, Rev. Geophys., 38, 513–543, 2000. a
Klett, J. D.: Stable analytical inversion solution for processing lidar returns, Appl. Ot., 20, 211–220, 1981. a
Kotchenruther, R. A., Hobbs, P. V., and Hegg, D. A.: Humidification factors for atmospheric aerosols off the mid-Atlantic coast of the United States, J. Geophys. Res.-Atmos., 104, 2239–2251, 1999. a
List, R.: Smithsonian Meteorological Tables, 6th rev. edn., Washington, DC, 1951. a
Lv, M., Liu, D., Li, Z., Mao, J., Sun, Y., Wang, Z., Wang, Y., and Xie, C.: Hygroscopic growth of atmospheric aerosol particles based on lidar, radiosonde, and in situ measurements: case studies from the Xinzhou field campaign, J. Quant. Spectrosc. Ra., 188, 60–70, 2017. a, b, c, d
Martucci, G., Voirin, J., Simeonov, V., Renaud, L., and Haefele, A.: A novel automatic calibration system for water vapor Raman LIDAR, in: EPJ Web of Conferences, EDP Sciences, 176, 05008, https://doi.org/10.1051/epjconf/201817605008, 2018. a
Martucci, G., Navas-Guzmán, F., Simeonov, V., Ludovic, R., and Haefele, A.: Validation of one-year of temperature data by the RAman Lidar for Meteorological Observations (RALMO) at Payerne, Atmos. Meas. Tech., in preparation, 2019. a, b
Mätzler, C.: MATLAB Functions for Mie Scattering and Absorption-Research Report No 2002-08, Institut für Angewandte Physik, Bern, 2002. a
McArthur, L., Halliwell, D. H., Niebergall, O. J., O'Neill, N. T., Slusser, J. R., and Wehrli, C.: Field comparison of network Sun photometers, J. Geophys. Res.-Atmos., 108, 4596, https://doi.org/10.1029/2002JD002964, 2003. a
Muñoz-Porcar, C., Comerón, A., Sicard, M., Barragan, R., Garcia-Vizcaino, D., Rodríguez-Gómez, A., Rocadenbosch, F., and Granados-Muñoz, M. J.: Calibration of Raman Lidar Water Vapor Mixing Ratio Measurements Using Zenithal Measurements of Diffuse Sunlight and a Radiative Transfer Model, IEEE T. Geosci. Remote, 7405–7414, 2018. a
Navas-Guzmán, F., Bravo-Aranda, J. A., Guerrero-Rascado, J. L., Granados-Muñoz, M. J., and Alados-Arboledas, L.: Statistical analysis of aerosol optical properties retrieved by Raman lidar over Southeastern Spain, Tellus B, 65, 21234, https://doi.org/10.3402/tellusb.v65i0.21234, 2013. a
Navas-Guzmán, F., Fernández-Gálvez, J., Granados-Muñoz, M. J., Guerrero-Rascado, J. L., Bravo-Aranda, J. A., and Alados-Arboledas, L.: Tropospheric water vapour and relative humidity profiles from lidar and microwave radiometry, Atmos. Meas. Tech., 7, 1201–1211, https://doi.org/10.5194/amt-7-1201-2014, 2014. a, b
Navas-Guzmán, F., Kämpfer, N., and Haefele, A.: Validation of brightness and physical temperature from two scanning microwave radiometers in the 60 GHz O2 band using radiosonde measurements, Atmos. Meas. Tech., 9, 4587–4600, https://doi.org/10.5194/amt-9-4587-2016, 2016. a
Nyeki, S., Halios, C., Baum, W., Eleftheriadis, K., Flentje, H., Gröbner, J., Vuilleumier, L., and Wehrli, C.: Ground-based aerosol optical depth trends at three high-altitude sites in Switzerland and southern Germany from 1995 to 2010, J. Geophys. Res.-Atmos., 117, D18202, https://doi.org/10.1029/2012JD017493, 2012. a
Pappalardo, G., Amodeo, A., Apituley, A., Comeron, A., Freudenthaler, V., Linné, H., Ansmann, A., Bösenberg, J., D'Amico, G., Mattis, I., Mona, L., Wandinger, U., Amiridis, V., Alados-Arboledas, L., Nicolae, D., and Wiegner, M.: EARLINET: towards an advanced sustainable European aerosol lidar network, Atmos. Meas. Tech., 7, 2389–2409, https://doi.org/10.5194/amt-7-2389-2014, 2014. a
Pérez, C., Haustein, K., Janjic, Z., Jorba, O., Huneeus, N., Baldasano, J. M., Black, T., Basart, S., Nickovic, S., Miller, R. L., Perlwitz, J. P., Schulz, M., and Thomson, M.: Atmospheric dust modeling from meso to global scales with the online NMMB/BSC-Dust model – Part 1: Model description, annual simulations and evaluation, Atmos. Chem. Phys., 11, 13001–13027, https://doi.org/10.5194/acp-11-13001-2011, 2011. a
Pilat, M. J. and Charlson, R. J.: Theoretical and optical studies of humidity effects on the size distribution of a hygroscopic aerosol, J. Rech. Atmos, 2, 166–170, 1966. a
Sandradewi, J., Prévôt, A. S., Szidat, S., Perron, N., Alfarra, M. R., Lanz, V. A., Weingartner, E., and Baltensperger, U.: Using aerosol light absorption measurements for the quantitative determination of wood burning and traffic emission contributions to particulate matter, Environ. Sci. technol., 42, 3316–3323, 2008. a
Schmeisser, L., Andrews, E., Ogren, J. A., Sheridan, P., Jefferson, A., Sharma, S., Kim, J. E., Sherman, J. P., Sorribas, M., Kalapov, I., Arsov, T., Angelov, C., Mayol-Bracero, O. L., Labuschagne, C., Kim, S.-W., Hoffer, A., Lin, N.-H., Chia, H.-P., Bergin, M., Sun, J., Liu, P., and Wu, H.: Classifying aerosol type using in situ surface spectral aerosol optical properties, Atmos. Chem. Phys., 17, 12097–12120, https://doi.org/10.5194/acp-17-12097-2017, 2017. a
Segura, S., Estellés, V., Titos, G., Lyamani, H., Utrillas, M. P., Zotter, P., Prévôt, A. S. H., Močnik, G., Alados-Arboledas, L., and Martínez-Lozano, J. A.: Determination and analysis of in situ spectral aerosol optical properties by a multi-instrumental approach, Atmos. Meas. Tech., 7, 2373–2387, https://doi.org/10.5194/amt-7-2373-2014, 2014. a
Sicard, M., Bertolín, S., Mallet, M., Dubuisson, P., and Comerón, A.: Estimation of mineral dust long-wave radiative forcing: sensitivity study to particle properties and application to real cases in the region of Barcelona, Atmos. Chem. Phys., 14, 9213–9231, https://doi.org/10.5194/acp-14-9213-2014, 2014. a
Sicard, M., D'Amico, G., Comerón, A., Mona, L., Alados-Arboledas, L., Amodeo, A., Baars, H., Baldasano, J. M., Belegante, L., Binietoglou, I., Bravo-Aranda, J. A., Fernández, A. J., Fréville, P., García-Vizcaíno, D., Giunta, A., Granados-Muñoz, M. J., Guerrero-Rascado, J. L., Hadjimitsis, D., Haefele, A., Hervo, M., Iarlori, M., Kokkalis, P., Lange, D., Mamouri, R. E., Mattis, I., Molero, F., Montoux, N., Muñoz, A., Muñoz Porcar, C., Navas-Guzmán, F., Nicolae, D., Nisantzi, A., Papagiannopoulos, N., Papayannis, A., Pereira, S., Preißler, J., Pujadas, M., Rizi, V., Rocadenbosch, F., Sellegri, K., Simeonov, V., Tsaknakis, G., Wagner, F., and Pappalardo, G.: EARLINET: potential operationality of a research network, Atmos. Meas. Tech., 8, 4587–4613, https://doi.org/10.5194/amt-8-4587-2015, 2015. a
Stamnes, K., Tsay, S.-C., Wiscombe, W., and Jayaweera, K.: Numerically stable algorithm for discrete-ordinate-method radiative transfer in multiple scattering and emitting layered media, Appl. Opt., 27, 2502–2509, 1988. a
Stock, M., Cheng, Y. F., Birmili, W., Massling, A., Wehner, B., Müller, T., Leinert, S., Kalivitis, N., Mihalopoulos, N., and Wiedensohler, A.: Hygroscopic properties of atmospheric aerosol particles over the Eastern Mediterranean: implications for regional direct radiative forcing under clean and polluted conditions, Atmos. Chem. Phys., 11, 4251–4271, https://doi.org/10.5194/acp-11-4251-2011, 2011. a
Swietlicki, E., Hansson, H.-C., Hämeri, K., Svenningsson, B., Massling, A., McFiggans, G., McMurry, P., Petäjä, T., Tunved, P., Gysel, M., Topping, D., Weingartner, E., Baltensperger, U., Rissler, J., Wiedensohler, A., and Kulmala, M.: Hygroscopic properties of submicrometer atmospheric aerosol particles measured with H-TDMA instruments in various environments – a review, Tellus B, 60, 432–469, 2008. a
Titos, G., Cazorla, A., Zieger, P., Andrews, E., Lyamani, H., Granados-Muñoz, M. J., Olmo, F., and Alados-Arboledas, L.: Effect of hygroscopic growth on the aerosol light-scattering coefficient: A review of measurements, techniques and error sources, Atmos. Environ., 141, 494–507, 2016. a, b
Vaughan, G., Wareing, D., Pepler, S., Thomas, L., and Mitev, V.: Atmospheric temperature measurements made by rotational Raman scattering, Appl. Opt., 32, 2758–2764, 1993. a
Veselovskii, I., Whiteman, D., Kolgotin, A., Andrews, E., and Korenskii, M.: Demonstration of aerosol property profiling by multiwavelength lidar under varying relative humidity conditions, J. Atmos. Ocean. Tech., 26, 1543–1557, 2009. a, b
Whiteman, D. N.: Examination of the traditional Raman lidar technique. I. Evaluating the temperature-dependent lidar equations, Appl. Opt., 42, 2571–2592, 2003a. a
Whiteman, D. N.: Examination of the traditional Raman lidar technique. II. Evaluating the ratios for water vapor and aerosols, Appl. Opt., 42, 2593–2608, 2003b. a
Wulfmeyer, V. and Feingold, G.: On the relationship between relative humidity and particle backscattering coefficient in the marine boundary layer determined with differential absorption lidar, J. Geophys. Res.-Atmos., 105, 4729–4741, 2000. a
Yau, M. K. and Rogers, R.: A short course in cloud physics, Elsevier, 1996. a
Zhao, G., Zhao, C., Kuang, Y., Tao, J., Tan, W., Bian, Y., Li, J., and Li, C.: Impact of aerosol hygroscopic growth on retrieving aerosol extinction coefficient profiles from elastic-backscatter lidar signals, Atmos. Chem. Phys., 17, 12133–12143, https://doi.org/10.5194/acp-17-12133-2017, 2017. a
Zieger, P., Fierz-Schmidhauser, R., Gysel, M., Ström, J., Henne, S., Yttri, K. E., Baltensperger, U., and Weingartner, E.: Effects of relative humidity on aerosol light scattering in the Arctic, Atmos. Chem. Phys., 10, 3875–3890, https://doi.org/10.5194/acp-10-3875-2010, 2010. a
Zieger, P., Fierz-Schmidhauser, R., Weingartner, E., and Baltensperger, U.: Effects of relative humidity on aerosol light scattering: results from different European sites, Atmos. Chem. Phys., 13, 10609–10631, https://doi.org/10.5194/acp-13-10609-2013, 2013. a, b, c
- Abstract
- Introduction
- Experimental site and instrumentation
- Methodology
- Validation of lidar measurements versus operational RSs
- Study of aerosol hygroscopicity
- Evaluation of the effect of aerosol hygroscopicity on the Earth's radiative balance
- Conclusions
- Data availability
- Author contributions
- Competing interests
- Special issue statement
- Acknowledgements
- Financial support
- Review statement
- References