the Creative Commons Attribution 4.0 License.
the Creative Commons Attribution 4.0 License.
 | 09 Sep 2019
Retrieval of ice-nucleating particle concentrations from lidar observations and comparison with UAV in situ measurements
Matthias Tesche
Athanasios Nenes
Albert Ansmann
Jann Schrod
Dimitra Mamali
Alexandra Tsekeri
Michael Pikridas
Holger Baars
Ronny Engelmann
Kalliopi-Artemis Voudouri
Stavros Solomos
Jean Sciare
Silke Groß
Florian Ewald
Vassilis Amiridis
Aerosols that are efficient ice-nucleating particles (INPs) are crucial for the formation of cloud ice via heterogeneous nucleation in the atmosphere. The distribution of INPs on a large spatial scale and as a function of height determines their impact on clouds and climate. However, in situ measurements of INPs provide sparse coverage over space and time. A promising approach to address this gap is to retrieve INP concentration profiles by combining particle concentration profiles derived by lidar measurements with INP efficiency parameterizations for different freezing mechanisms (immersion freezing, deposition nucleation). Here, we assess the feasibility of this new method for both ground-based and spaceborne lidar measurements, using in situ observations collected with unmanned aerial vehicles (UAVs) and subsequently analyzed with the FRIDGE (FRankfurt Ice nucleation Deposition freezinG Experiment) INP counter from an experimental campaign at Cyprus in April 2016. Analyzing five case studies we calculated the cloud-relevant particle number concentrations using lidar measurements (n250,dry with an uncertainty of 20 % to 40 % and Sdry with an uncertainty of 30 % to 50 %), and we assessed the suitability of the different INP parameterizations with respect to the temperature range and the type of particles considered. Specifically, our analysis suggests that our calculations using the parameterization of Ullrich et al. (2017) (applicable for the temperature range −50 to −33 ∘C) agree within 1 order of magnitude with the in situ observations of nINP; thus, the parameterization of Ullrich et al. (2017) can efficiently address the deposition nucleation pathway in dust-dominated environments. Additionally, our calculations using the combination of the parameterizations of DeMott et al. (2015, 2010) (applicable for the temperature range −35 to −9 ∘C) agree within 2 orders of magnitude with the in situ observations of INP concentrations (nINP) and can thus efficiently address the immersion/condensation pathway of dust and nondust particles. The same conclusion is derived from the compilation of the parameterizations of DeMott et al. (2015) for dust and Ullrich et al. (2017) for soot.
Furthermore, we applied this methodology to estimate the INP concentration profiles before and after a cloud formation, indicating the seeding role of the particles and their subsequent impact on cloud formation and characteristics. More synergistic datasets are expected to become available in the future from EARLINET (European Aerosol Research Lidar Network) and in the frame of the European ACTRIS-RI (Aerosols, Clouds, and Trace gases Research Infrastructure).
Our analysis shows that the developed techniques, when applied on CALIPSO (Cloud-Aerosol Lidar and Infrared Pathfinder Satellite Observations) spaceborne lidar observations, are in agreement with the in situ measurements. This study gives us confidence for the production of global 3-D products of cloud-relevant particle number concentrations (n250,dry, Sdry and nINP) using the CALIPSO 13-year dataset. This could provide valuable insight into the global height-resolved distribution of INP concentrations related to mineral dust, as well as possibly other aerosol types.
Please read the corrigendum first before continuing.
-
Notice on corrigendum
The requested paper has a corresponding corrigendum published. Please read the corrigendum first before downloading the article.
-
Article
(11610 KB)
-
The requested paper has a corresponding corrigendum published. Please read the corrigendum first before downloading the article.
- Article
(11610 KB) - Corrigendum
- BibTeX
- EndNote


The interaction of aerosol particles with clouds and the related climatic effects have been in the focus of atmospheric research for several decades. Aerosols can act as cloud condensation nuclei (CCN) in liquid water clouds and as ice-nucleating particles (INPs) in mixed-phase and ice clouds. Changes in their concentration affect cloud extent, lifetime, particle size and radiative properties (Lohmann and Feichter, 2005; Tao et al., 2012; Altaratz et al., 2014; Rosenfeld et al., 2014). As important these interactions are, they are the source of the highest uncertainty in assessing the anthropogenic climate change (IPCC Fifth Assessment Report, Seinfeld et al., 2016).
All clouds producing ice require, for temperatures above 35 ∘C, the presence of INPs. Compared to CCN, INPs are rare (about one particle in a million acts as an INP; Nenes et al., 2014) and become increasingly sparse with increasing temperature (Pruppacher and Klett, 1997; Kanji et al., 2017).
Aerosol species which are identified in the past as potentially important INPs are mineral dust, biological species (pollen, bacteria, fungal spores and plankton), carbonaceous combustion products, soot, volcanic ash and sea spray (Murray et al., 2012; DeMott et al., 2015b). From these aerosol types, mineral dust and soot are efficient INPs at temperatures below −15 to −20 ∘C (dust) and −40 ∘C (soot), and they have been studied extensively for their INP properties in field experiments and laboratory studies (Twohy et al., 2009, 2017; Kamphus et al., 2010; Hoose and Möhler, 2012; Murray et al., 2012; Sullivan et al., 2016; Ullrich et al., 2017). Biological particles are one of the most active INP species; however, their abundance is likely low on a global scale, particularly when compared to other aerosol types such as mineral dust (Morris et al., 2014). It has been suggested that soil and clay particles may act as carriers of biological nanoscale INPs (e.g., proteins), which could potentially contribute to a global/local source of INPs (Schnell and Vali, 1976; O'Sullivan et al., 2014, 2015, 2016). Finally, marine aerosols (with possible influence of a biological microlayer close to the surface) are also important INPs in areas where the influence of mineral dust is less pronounced (e.g., Southern Ocean; Wilson et al., 2015; Vergara-Temprado et al., 2017).
There is a variety of pathways for heterogeneous ice nucleation: contact freezing, immersion freezing, condensation freezing and deposition nucleation (Vali et al., 2015). Individual ice nucleation pathways dominate at characteristic temperatures and supersaturation ranges. Observational studies have shown that immersion freezing dominates at temperatures higher than −30 ∘C, while deposition nucleation dominates below −35 ∘C (Ansmann et al., 2008, 2009; Westbrook et al., 2011; de Boer et al., 2011). The factors that regulate the efficiency of heterogeneous ice nucleation are qualitatively understood, but no general theory of heterogeneous ice nucleation exists yet. It has been shown that, in regions not influenced by sea salt aerosol, INP concentrations are strongly correlated with the number of aerosol particles with dry radius greater than 250 nm (n250,dry) which form the reservoir of favorable INPs (DeMott et al., 2010, 2015). However, we have limited knowledge on how the ice nuclei activity of these particles together with their spatial and vertical distributions depend on cloud nucleation conditions (i.e., temperature (T) and supersaturation over water (ssw) and ice (ssi)). Furthermore, field measurements of INP concentrations are very localized in space and time, whilst there are large regions without any data at all (Murray et al., 2012). The lack of data inhibits our quantitative understanding of aerosol–cloud interactions and requires new strategies for obtaining datasets (Seinfeld et al., 2016; Bühl et al., 2016).
Active remote sensing with aerosol lidar and cloud radar provides valuable data for studying aerosol–cloud interaction since it enables observations with high vertical and temporal resolution over long time periods (Ansmann et al., 2005; Illingworth et al., 2007; Seifert et al., 2010; de Boer et al., 2011; Kanitz et al., 2011; Bühl et al., 2016). Lidar measurements can provide profiles of n250,dry (the number of aerosol particles with dry radius greater than 250 nm) and Sdry (the aerosol particle dry surface area concentration) related to mineral dust, continental pollution and marine aerosol, as described in Mamouri and Ansmann (2015, 2016). Their methodology uses lidar-derived optical parameters (i.e., the particle backscatter coefficient, lidar ratio and particle depolarization ratio) to separate the contribution of mineral dust in the lidar profiles (Tesche et al., 2009) and subsequently applies sun-photometer-based parameterizations to transform the optical property profiles into profiles of aerosol mass, number and surface area concentration (Ansmann et al., 2012; Mamouri and Ansmann, 2015, 2016). The latter can then be used as input to INP parameterizations that have been obtained from laboratory and field measurements (e.g., DeMott et al., 2010, 2015; Niemand et al., 2012; Steinke et al., 2015; Ullrich et al., 2017) to derive profiles of INP concentrations (nINP).
The INP retrieval calculated from the lidar measurements provides a promising insight into atmospheric INP concentrations. To date, there has been no other evaluation of the lidar-derived profiles of n250,dry, Sdry and nINP by means of independent in situ observations apart from one dust case in Schrod et al. (2017). The study presented here compares n250,dry and nINP as inferred from spaceborne and ground-based lidar observations to findings from airborne in situ measurements using data from the joint experiment INUIT-BACCHUS-ACTRIS (Ice Nuclei Research Unit – Impact of Biogenic versus Anthropogenic emissions on Clouds and Climate: towards a Holistic UnderStanding – Aerosols, Clouds, and Trace gases Research Infrastructure) held in April 2016 in Cyprus (Schrod et al., 2017; Mamali et al., 2018). The paper starts with a review of the different INP parameterizations for mineral dust, soot and continental aerosols in Sect. 2. Section 3 describes the instruments used in this study and the methodology to retrieve INP concentrations from lidar measurements. The results of the intercomparison between the lidar-derived and unmanned aerial vehicle (UAV)-measured n250,dry and nINP profiles are presented and discussed in Sect. 4 before the paper closes with a summary in Sect. 5.
Ullrich et al. (2017)DeMott et al. (2015)Ullrich et al. (2017)Steinke et al. (2015)Ullrich et al. (2017)Ullrich et al. (2017)DeMott et al. (2010)Table 1Overview of INP parameterizations used in this study together with the freezing mode and the temperature range for which they have been developed. The parameterizations of D15 and U17-imm have been extrapolated to the temperature range from −36 to −1 ∘C. In the equations, n250,dry is in particles per cubic centimeters (cm−3), nINP in particles per liter (L−1), T(z) in Kelvin (K) and P in hectopascals (hPa). p0 and T0 stand for standard pressure and temperature.
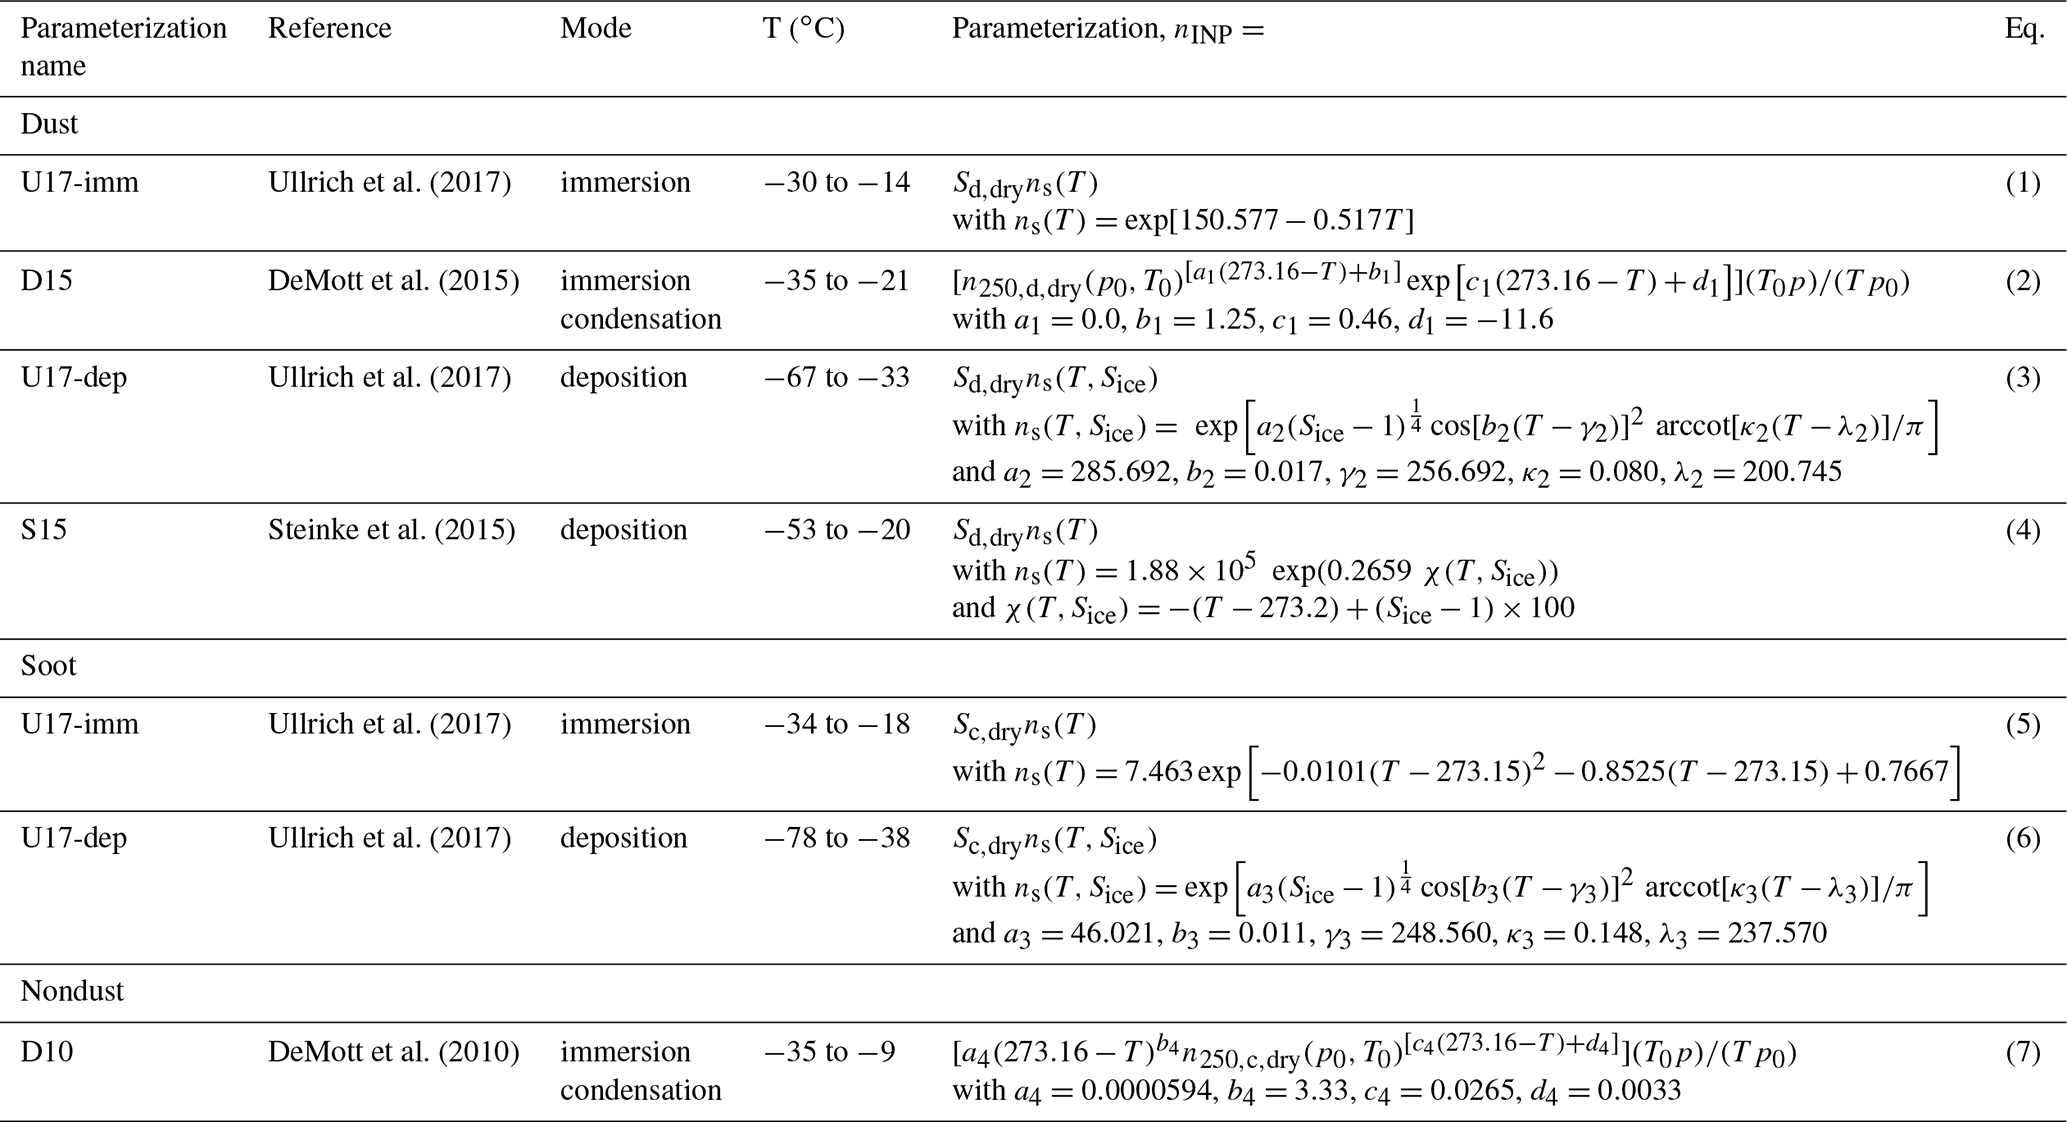
A variety of parameterizations has been proposed to obtain nINP from aerosol concentration measurements. In particular, a global aerosol type-independent nINP parameterization was introduced by DeMott et al. (2010), dust-specific nINP parameterizations were introduced by Niemand et al. (2012); DeMott et al. (2015); Steinke et al. (2015); Ullrich et al. (2017), and soot-specific nINP parameterizations were proposed by Murray et al. (2012) and Ullrich et al. (2017). The aforementioned parameterizations address immersion freezing at or above water saturation and deposition nucleation for ice saturation ratios ranging from unity up to the homogeneous freezing threshold and water saturation. Table 1 provides an overview of the temperature ranges and the freezing mechanisms for which these parameterizations are applicable.
Regarding immersion freezing, the aerosols that are activated to droplets can contribute to ice formation. In turn, the ability of a particle to be activated as a cloud droplet mainly depends on the cloud supersaturation, its diameter, the water adsorption characteristics and the composition of soluble coatings (Levin et al., 2005; Kumar et al., 2011a, b; Garimella et al., 2014; Bègue et al., 2015). Kumar et al. (2011b) showed that all dry-generated dust samples with radius >50 nm are activated to CCN at a water supersaturation (ssw) of 0.5 %, while the activation radius increases to >250 nm when water supersaturation decreases to ssw≈0.1 %. This is the minimum level of ssw required to activate INP for immersion freezing.
For immersion freezing of dust particles, the parameterization of Ullrich et al. (2017) (U17-imm) (Table 1; Eq. 1) is based on heterogeneous ice nucleation experiments at the cloud chamber AIDA (Aerosol Interaction and Dynamics in the Atmosphere) of the Karlsruhe Institute of Technology. The desert dust ground samples used in this study originated from different desert dust locations around the world (Saharan, Taklamakan Desert, Canary Islands, Israel). The parameterization quantifies the desert dust ice nucleation efficiency as a function of ice-nucleation-active surface-site density ns(T) and dust dry surface area concentration Sd,dry. If the CCN activated fraction is less than 50 %, Eq. (1) for U17-imm needs to be scaled to be representative for the CCN activated Sdry (Ullrich et al., 2017). In this work, we apply the U17-imm parameterization taking into consideration the total Sdry.
Additionally, the parameterization of DeMott et al. (2015) (D15) (Table 1; Eq. 2) addresses the immersion and condensation freezing activity of natural mineral dust particles based on laboratory studies using the continuous flow diffusion chamber (CFDC) of the Colorado State University (CSU) and field data from atmospheric measurements in Saharan dust layers. D15 quantifies nINP as a function of temperature and the total number concentration of dust particles with dry radii larger than 250 nm (). We note here that the ambient values of measured nINP(p,T) need to be transferred in standard (std) pressure and temperature conditions () before the use of (Eq. 2).
For the deposition nucleation of dust particles, the parameterizations of Steinke et al. (2015) and Ullrich et al. (2017) (S15 and U17-dep, respectively) quantify the ice nucleation efficiency as a function of Sd,dry and ns(T,Sice) with Sice the ice saturation ratio. Both were based on AIDA laboratory studies, but they used different dust samples. U17-dep (Table 1; Eq. 3) was based on ground desert dust samples from the Sahara, Taklamakan Desert, Canary Islands and Israel, while S15 (Table 1; Eq. 4) was based on dust samples from Arizona, which were treated (washed, milled, treated with acid) and are much more ice active than natural desert dust particles on average. Although S15 parameterization was based on treated dust samples which usually show an enhanced freezing efficiency, it is used in the NMME-DREAM model (Nonhydrostatic Mesoscale Model on E grid, Janjic et al., 2001; Dust REgional Atmospheric Model, Nickovic et al., 2001; Pérez et al., 2006) for INP concentration estimations (Nickovic et al., 2016). For this reason, it is included in this work.
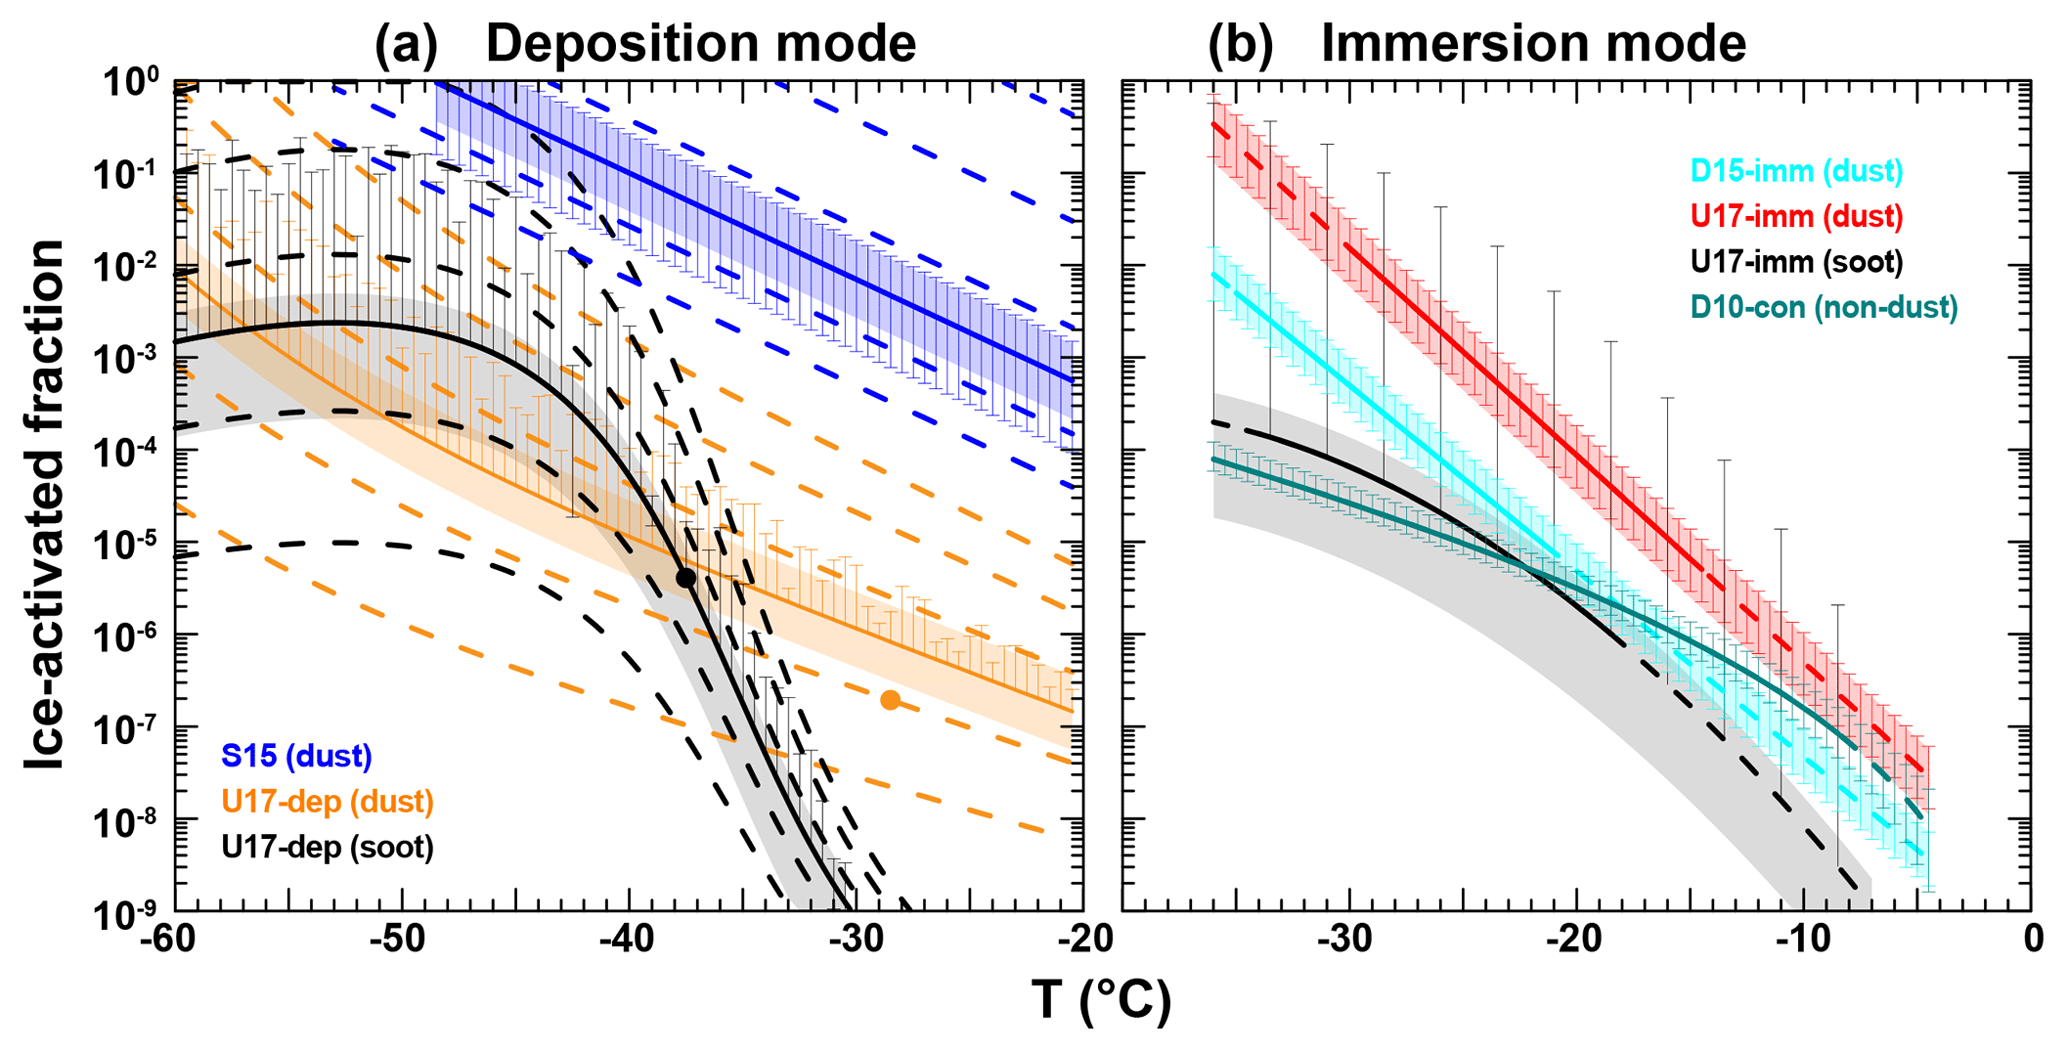
Figure 1Fraction of ice-activated particles for the deposition nucleation (a) and immersion freezing (b) parameterizations used in this study. The particle concentrations used are derived assuming an extinction coefficient of 50 Mm−1 for each of the different aerosol types (dust, continental, soot). The shaded areas take into account a range of the extinction coefficient from 10 Mm−1 (lower limit) to 200 Mm−1 (upper limit). The error bars mark the error of the respective parameterizations from error propagation using the uncertainties provided in Table 2. Negative error bars that exceed the scale are not shown. In the deposition mode (a), the bold lines correspond to ice supersaturation of 1.15 and the dashed lines to ice supersaturation of 1.05, 1.1, 1.2, 1.3 and 1.4. The black and orange dots indicate the maximum temperatures for which the parameterizations have been developed. In the immersion mode (b), the parameterizations are extrapolated over the immersion freezing temperature range (dashed lines).
For the ice activation of soot particles, Ullrich et al. (2017) introduced two parameterizations, one for immersion freezing (Table 1; Eq. 5) and a second one for deposition nucleation (Table 1; Eq. 6). Both were based on experiments at the AIDA chamber with soot samples generated from four different devices and quantify the soot ice nucleation efficiency as a function of Sdry and ns(T) (for immersion) and ns(T,Sice) (for deposition).
Finally, the global type-independent nINP parameterization of DeMott et al. (2010) (Table 1; Eq. 7) was based on field data collected during nine field campaigns (in Colorado, eastern Canada, the Amazon, Alaska, and the Pacific basin) and analyzed with the CFDC instrument of the CSU. As the majority of the samples used for D10 were nondesert continental aerosols, this INP parameterization has been considered to be suitable for addressing the immersion and condensation freezing activity of mixtures of anthropogenic haze, biomass burning smoke, biological particles, soil and road dust (Mamouri and Ansmann, 2016). From here on these mixtures are addressed as continental aerosols.
The n250,dry and Sdry used in all the aforementioned parameterizations are calculated from the lidar extinction profiles as described in Sect. 3.2 and shown in Figs. A1 and A2 in the Appendix.
Figure 1 provides an indication of the relative differences of the observed nINP in nature for immersion (right) and deposition (left) modes and in relation to the different aerosol compositions by showing a summary of the different nINP parameterizations. Specifically, the plot shows the fraction of the ice-activated particles () for desert dust (dark blue, orange, red, light blue), continental (green) and soot (black). The particle concentrations used here are derived assuming an extinction coefficient of 50 Mm−1 for each of the different aerosol types (dust, continental, soot). The shaded areas take into account a range of the extinction coefficient from 10 Mm−1 (lower limit) to 200 Mm−1 (upper limit). The error bars mark the cumulative error in fi that results from the uncertainty in the lidar observations and their conversion to mass concentration as well as from the errors in the respective parameterizations. An overview of the typical values and the uncertainties used for the error estimation in this study is provided in Table 2. The deposition nucleation estimations in the left panel of Fig. 1 are provided for ssi=1.15 (solid lines) and ss (dashed lines) to give a perspective on the range of possible values. Note here that although the immersion parameterizations were obtained using measurements at the temperature ranges of [−30, −14] ∘C (U17-imm, dust), [−35, −21] ∘C (D15, dust), [−34, −18] ∘C (U17-imm, soot) and [−35, −9] ∘C (D10, continental), they are extrapolated herein to extend over the immersion freezing temperature range (dashed part of the lines in the immersion mode chart).
Figure 1a shows that, for deposition mode, the dust ice-activated fractions from S15 are several orders of magnitude higher than those of U17-imm (e.g., 4 orders of magnitude at −40 ∘C and ssi=1.15 %). Furthermore, the deposition ice-activation fractions of dust and soot (from U17-dep) differ significantly, with soot being more active than dust for T<-38 ∘C (up to 2 orders of magnitude) and dust being more active than soot for ∘C (up to 4 orders of magnitude).
Figure 1a shows that, for immersion mode, the dust ice-activated fractions obtained from D15 are 1 order of magnitude lower than those calculated with U17-imm.
Laboratory ice nucleation measurements and corresponding instrument intercomparisons have shown that at a single temperature differences between 2 and 4 orders of magnitude are observed as a result of the natural variability of the INP active fraction (DeMott et al., 2010, 2017) or the use of different INP counters (Burkert-Kohn et al., 2017). Hereon, we consider D15 and U17-imm as the lower and upper bounds of the immersed nINP estimations for dust INP populations. Figure 1b illustrates the dust activation increase of up to 6 orders of magnitude within the mixed-phase temperature regime (−15 to −35 ∘C). For a 5 ∘C decrease, nd,INP increases by about 1 order of magnitude. Moreover, we see that at ∘C the immersion freezing desert dust ice activation (D15) is higher than the continental one (D10), while this changes at ∘C. On the contrary, soot (U17-imm) always has a lower fi than dust (from either D15 or U17-imm). The ice-activated fractions of continental (D10) and soot (U17-imm) aerosols have a relative difference that is always less than 60 % at ∘C. At higher temperatures they diverge with continental fi to exceed the soot one by 1 order of magnitude at ∘C.
Additionally, Fig. 1 provides an indication of the error induced at the lidar-estimated nINP due to errors in the selected values of T and ssi. The right panel shows that, for immersion mode, a 5 ∘C error in the assumed T can introduce an error of 1 order of magnitude in the dust-related nINP estimations (U17-imm and D15) and 1∕2 order of magnitude in the nondust-related estimations of D10. The same error (1∕2 order of magnitude) is induced in the U17-imm(soot) (for ∘C). For deposition mode, a 5 ∘C error in the assumed T can introduce an error of 1∕2 order of magnitude in the dust-related nINP estimations (U17-dep(dust) and S15). For the U17-dep(soot) estimates, and at ∘C, the error in the assumed T has a significant impact in the nINP product (e.g., 1 order of magnitude between and −40 ∘C). On the contrary, at ∘C, the error in the assumed T has less impact in the final nINP product (between 100 % and 200 % for 5 ∘C T error).
Regarding the deposition nucleation, a large variability of the onset saturation ratio is observed in laboratory experiments of different studies, with ssi varying for example at −40 ∘C between 1 and 1.5 (Hoose and Möhler, 2012). In Fig. 1a, we see the effect of the ssi on the estimated nINP. In S15, nINP values increase by 1 order of magnitude for a 0.1 increase in the ssi. In U17-dep(dust), a 3-orders-of-magnitude nINP range is observed at −30 ∘C for ssi between 1.05 and 1.4. The range is wider at lower temperatures (4 orders at −50 ∘C). In U17-dep(soot) a 4-orders-of-magnitude nINP range is observed at ∘C for ssi between 1.05 and 1.3. This variability provides an indication of the error induced in the lidar-estimated nINP product due to the error in the selected ssi. In the nINP profiles presented in Fig. 11, ssi=1.15 is assumed (bold line here).
The INUIT-BACCHUS-ACTRIS campaign in April 2016 was organized within the framework of the projects Ice Nuclei Research Unit (INUIT; https://www.ice-nuclei.de/the-inuit-project/, last access: 8 August 2019); Impact of Biogenic versus Anthropogenic emissions on Clouds and Climate: towards a Holistic UnderStanding (BACCHUS; http://www.bacchus-env.eu/, last access: 8 August 2019); and Aerosols, Clouds, and Trace gases Research Infrastructure (ACTRIS; https://www.actris.eu/, last access: 8 August 2019) and focused on aerosols, clouds and ice nucleation within dust-laden air over the Eastern Mediterranean. Although dust was the main component observed, other aerosol types were present as well such as soot and continental aerosols.
The atmospheric measurements conducted during the campaign included remote sensing with aerosol lidar and sun photometers as well as in situ particle sampling with two UAVs. The UAV provided observations of the INP abundance in the lower troposphere and they were operated from the airfield of the Cyprus Institute at Orounda (35∘05′42′′ N, 33∘04′53′′ E; 327 m a.s.l.; about 21 km west of Nicosia) (Schrod et al., 2017). An Aerosol Robotic Network (AERONET, Holben et al., 1998) sun photometer was located at the Cyprus Atmospheric Observatory of Agia Marina Xyliatou (35∘02′19′′ N, 33∘03′28′′ E; 532 m a.s.l.; 7 km west of the UAV airfield). Continuous ground-based lidar observations were performed at Nicosia (35∘08′26′′ N, 33∘22′52′′ E; 181 m a.s.l.) with the EARLINET (European Aerosol Research Lidar Network) PollyXT multiwavelength Raman lidar of the National Observatory of Athens (NOA). For the second half of the campaign the lidar observations were complemented at Nicosia by a sun/lunar photometer which was used to check the homogeneity of the aerosol loading between the different sites of Nicosia and Agia Marina.
3.1 Lidar measurements
The EARLINET PollyXT-NOA lidar measurements at 532 nm are used in this study for the derivation of particle optical properties and mass concentration profiles. Quicklooks of all PollyXT measurements can be found on the web page of PollyNet (Raman and polarization lidar network, http://polly.tropos.de, last access: 8 August 2019). PollyXT operates using a Nd:YAG laser that emits light at 355, 532 and 1064 nm. The receiver features 12 channels that enable measurements of elastically (three channels) and Raman scattered light (387 and 607 channels for aerosols, 407 for water vapor) as well the depolarization of the incoming light at 355 and 532 nm. It also performs near-range measurements of two elastic and two Raman channels. More details about the instrument and its measurements are provided in Engelmann et al. (2016) and Baars et al. (2016). In brief, the nighttime backscatter (βp) and extinction (αp) coefficient profiles at 532 nm are derived using the Raman method proposed by Ansmann et al. (1992). The volume and particle depolarization ratio profiles are derived using the methodologies described in Freudenthaler et al. (2009) and Freudenthaler (2016). The daytime backscatter and extinction coefficient profiles are derived using the Klett–Fernald method (Klett, 1981; Fernald, 1984), assuming a constant value for the lidar ratio (LR). The daytime Klett profiles in Sect. 4.1 were derived using a lidar ratio of 50 sr on 15 April and of 40 sr on 5, 9, 21 and 22 April as well as a vertical smoothing length using a sliding average of 232.5 m. The integrated extinction coefficient profiles calculated with these LRs agree well with the collocated AERONET aerosol optical depth (AOD) observations. The LR values also are in agreement with the nighttime Raman measurements indicating mixtures of dust and anthropogenic/continental particles at heights between 1 and 3 km. The 2-D backscatter coefficient curtain for Fig. 4 is calculated with the methodology described by Baars et al. (2017).
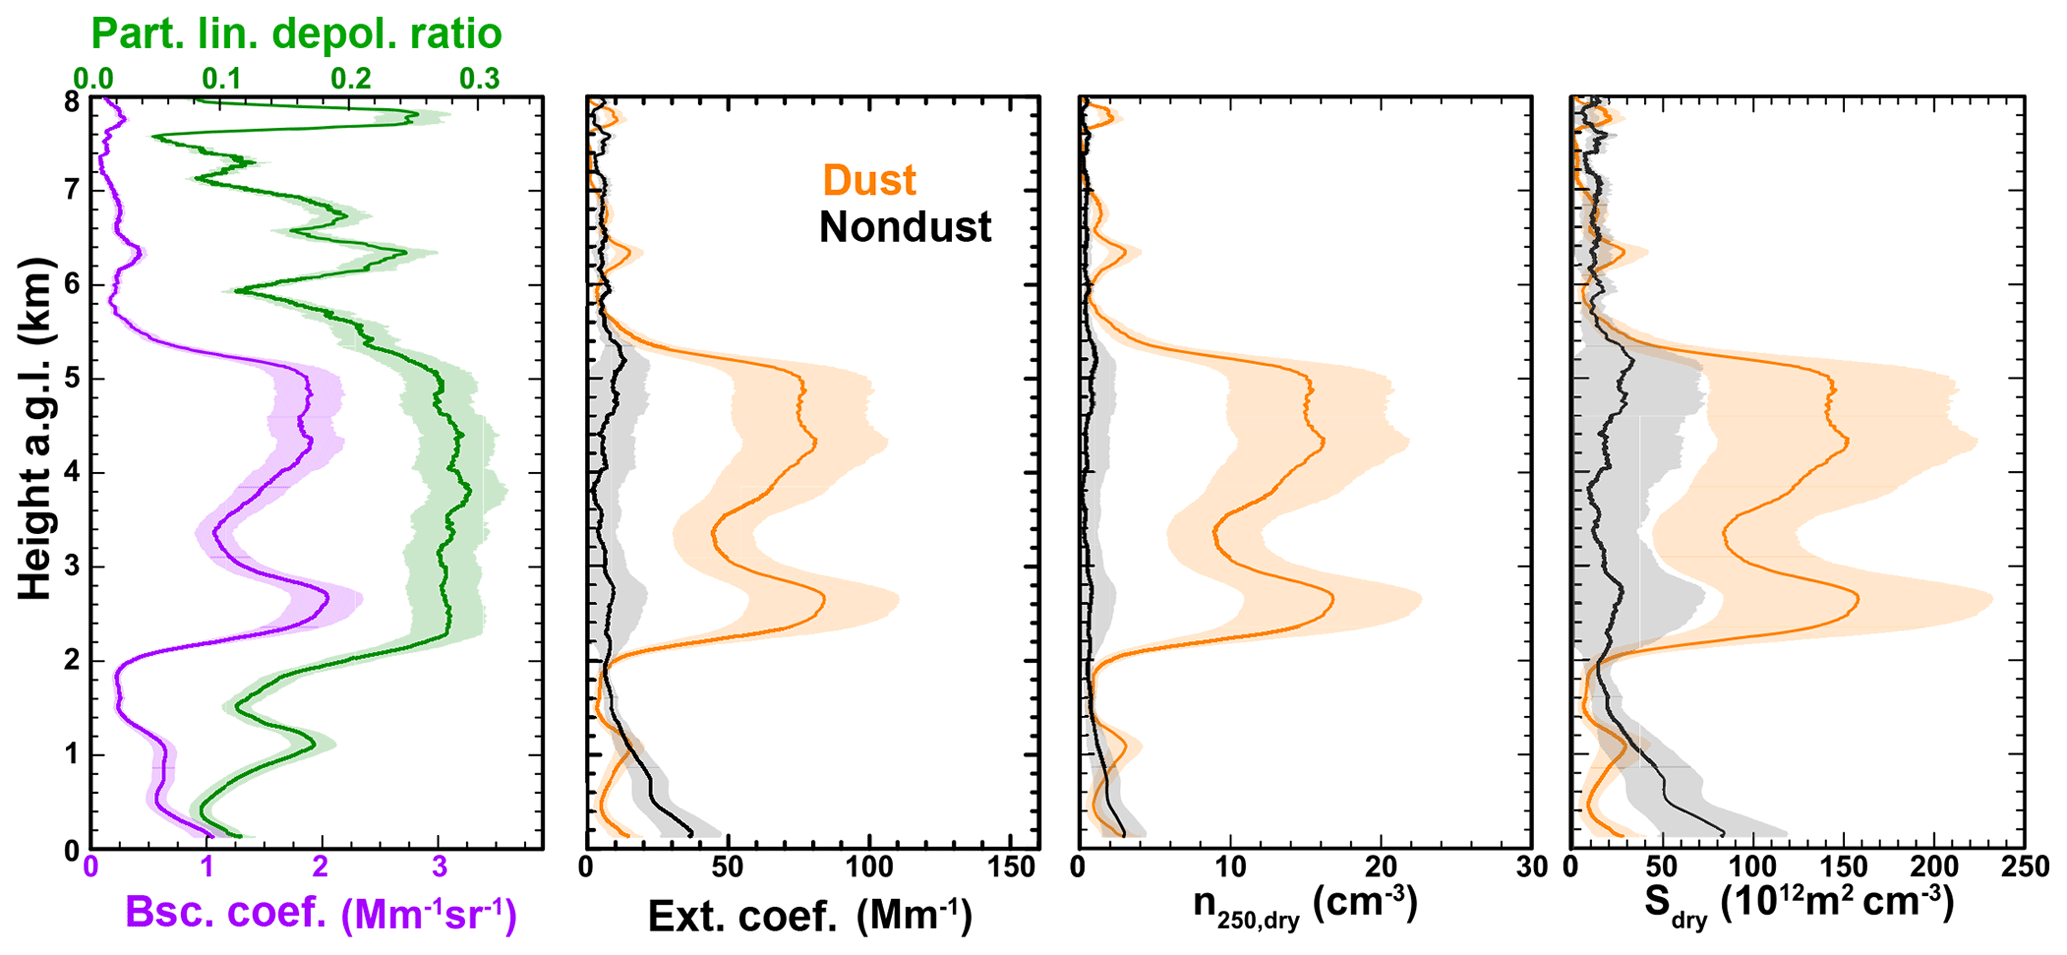
Figure 2PollyXT profiles of the total particle backscatter coefficient (purple) and particle linear depolarization ratio (green) measured between 01:00 and 02:00 UTC on 21 April 2016. The extinction coefficient as well as the number and surface concentration of particles with a dry radius larger than 250 nm related to mineral dust (orange) and nondust aerosol (black) was obtained following the methodology described in Sect. 3.2.
In this work we also use spaceborne observations from the Cloud-Aerosol Lidar with Orthogonal Polarization (CALIOP) on board the Cloud-Aerosol Lidar and Infrared Pathfinder Satellite Observations (CALIPSO) satellite (Winker et al., 2009). During the campaign period CALIPSO passed over Nicosia at a distance of 5 km on 5 and 21 April 2016. Here, we use the CALIPSO L2 version 4 (V4) aerosol profile products of 21 April 2016 and consider only quality-assured retrievals (Marinou et al., 2017; Tackett et al., 2018).
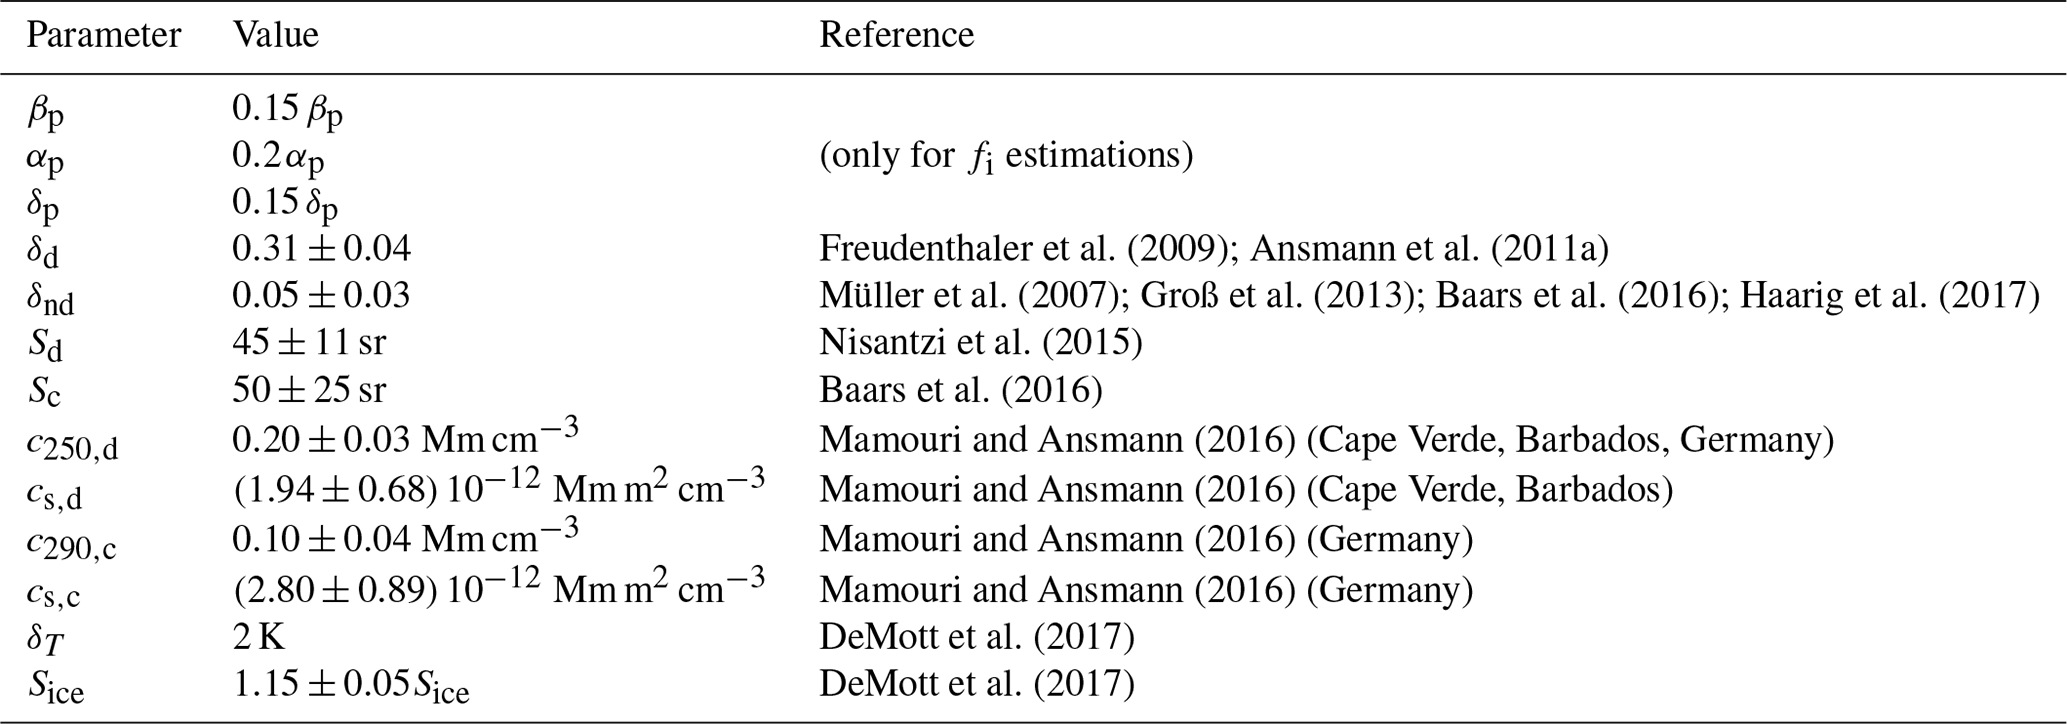
Freudenthaler et al. (2009); Ansmann et al. (2011a)Müller et al. (2007); Groß et al. (2013); Baars et al. (2016); Haarig et al. (2017)Nisantzi et al. (2015)Baars et al. (2016)Mamouri and Ansmann (2016)Mamouri and Ansmann (2016)Mamouri and Ansmann (2016)Mamouri and Ansmann (2016)DeMott et al. (2017)DeMott et al. (2017)Table 2Values and typical uncertainties used for the estimation of fi, αd, αc, Sd,dry, Sc,dry, , and nINP.
3.2 INP retrieval from lidar measurements
We calculated the nINP profiles from the lidar measurements by first separating the lidar backscatter profile into its dust and nondust components using the aerosol-type separation technique introduced by Shimizu et al. (2004) and Tesche et al. (2009). For this method we consider a dust particle linear depolarization ratio of (Freudenthaler et al., 2009; Ansmann et al., 2011a) and a nondust particle linear depolarization ratio of (Müller et al., 2007; Groß et al., 2013; Baars et al., 2016; Haarig et al., 2017). The observed particle linear depolarization ratio in between these marginal values is therefore attributed to a mixture of the two aerosol types. The dust extinction coefficient (αd) is calculated using the mean LR of 45±11 sr for dust transported to Cyprus (Nisantzi et al., 2015). For the nondust component, the extinction coefficient (αc) is calculated using a LR of 50±25 sr which is representative for nondesert continental mixtures (Mamouri and Ansmann, 2014; Baars et al., 2016; Kim et al., 2018). The profiles of , Sd,dry, and Sc,dry are calculated from the extinction coefficient profiles using the POLIPHON algorithm (POlarization-LIdar PHOtometer Networking) and AERONET-based parameterizations proposed by Mamouri and Ansmann (2015, 2016). Table 3 provides an overview of the corresponding formulas used for the calculations. Weinzierl et al. (2009) showed that for dust environments the AERONET-derived values of Sdry are about 95 % of the total particle surface area concentration (including particles with radius <50 nm). This assumption has been validated against airborne in situ observations of the particle size distribution during the Saharan Mineral Dust Experiment (SAMUM; Ansmann et al., 2011b) in Morocco. The correlation drops to for urban environments based on ground-based in situ measurements of particle size distributions at the urban site of Leipzig (Mamouri and Ansmann, 2016).
The uncertainty in the products (considering the initial errors provided in Table 2) are as follows: the estimated uncertainty is 30 % in well-detected dessert dust layers (δd=0.3), 37 % in less pronounced aerosol layers (δd=0.2) and exceeds 94 % in aerosol layers with low dust contribution (δd<0.1). The uncertainty of the estimated Sd,dry values is 38 % in well-detected dessert dust layers, 44 % in less pronounced aerosol layers and exceeds 97 % in aerosol layers with low dust contribution. The overall uncertainties of the combined (dust and continental) n250,dry and Sdry values are between 20 % and 40 % and between 30 % and 50 % respectively. The steps of the procedure for obtaining the profile of n250,dry and Sc,dry, as described here, are illustrated in an example in Fig. 2. In this example, we use the PollyXT measurements at Nicosia between 01:00 and 02:00 UTC on 21 April 2016.
In the final step, the nINP profiles are estimated using the ice nuclei parameterizations presented in Sect. 2 (Eqs. 1–7). For these calculations we are using collocated modeled profiles of the pressure, temperature and humidity fields. Specifically, for the PollyXT-based nINP calculations we use hourly outputs from the Weather Research and Forecasting atmospheric model (WRF; Skamarock et al., 2008) which is operational at the National Observatory of Athens at a mesoscale resolution of 12 km×12 km and 31 vertical levels (Solomos et al., 2015, 2018). Initial and boundary conditions for the atmospheric fields and the sea surface temperature are taken from the National Centers for Environmental Prediction (NCEP) global reanalysis at resolution. For the CALIPSO-based nINP calculations we use the track-collocated meteorological profiles from the MERRA-2 model (Modern-Era Retrospective analysis for Research and Applications, version 2) which are included in the CALIPSO V4 product (Kar et al., 2018).
3.3 UAV in situ measurements
Two fixed-wing UAVs, the Cruiser and the Skywalker, performed aerosol measurements up to altitudes of 2.5 km a.g.l. (2.85 km a.s.l.). Both UAVs were used to collect INP samples onto silicon wafers using electrostatic precipitation. The Cruiser can carry a payload of up to 10 kg, and it was equipped with the multi-INP sampler PEAC (programmable electrostatic aerosol collector) (Schrod et al., 2016). Skywalker X8 (a light UAV that can carry a payload of 2 kg) was equipped with a custom-built, lightweight version of a single-sampler PEAC (Schrod et al., 2017). In total, 42 UAV INP flights were performed to collect 52 samples during 19 measurement days: 7 Cruiser flights with a total of 17 samples during 6 d and 35 Skywalker flights with a total of 35 samples during 16 d.
The INP samples were subsequently analyzed with the FRIDGE (FRankfurt Ice nucleation Deposition freezinG Experiment) INP counter (Schrod et al., 2016, 2017). FRIDGE is an isostatic diffusion chamber. The typical operation of FRIDGE allows for measurements at temperatures down to −30 ∘C and relative humidity with respect to water (RHw) up to water supersaturation. FRIDGE was originally designed to address the condensation and deposition freezing ice nucleation modes at water saturation and below. However, because condensation already begins at subsaturation, its measurements at a RHw between 95 % and 100 % encompass ice nucleation by deposition nucleation plus condensation/immersion freezing, which cannot be distinguished by this measurement technique. Recent measurements during a large-scale intercomparison experiment with controlled laboratory settings showed that the method compares well to other INP counters for various aerosol types (DeMott et al., 2018). However, sometimes FRIDGE measurements are on the lower end of observations when compared to instruments that encompass pure immersion freezing. The INP samples collected on 5, 15 and 21 April 2016 were used for comparison with the lidar-derived nINP. The samples were analyzed at −20, −25 and −30 ∘C and at a RHw of 95 %, 97 %, 99 % and 101 % with respect to water, or equivalently 115 % to 135 % with respect to ice (RHice) (Schrod et al., 2017). Hereon, the samples analyzed at a RHw<100 % are used as a reference for the deposition mode parameterizations, and the samples analyzed at a RHw of 101 % are used as a reference for the immersion/condensation parameterizations. The errors of the INP measurements were estimated to be ∼20 % considering the statistical reproducibility of an individual sample, for the samples analyzed for the experiment.
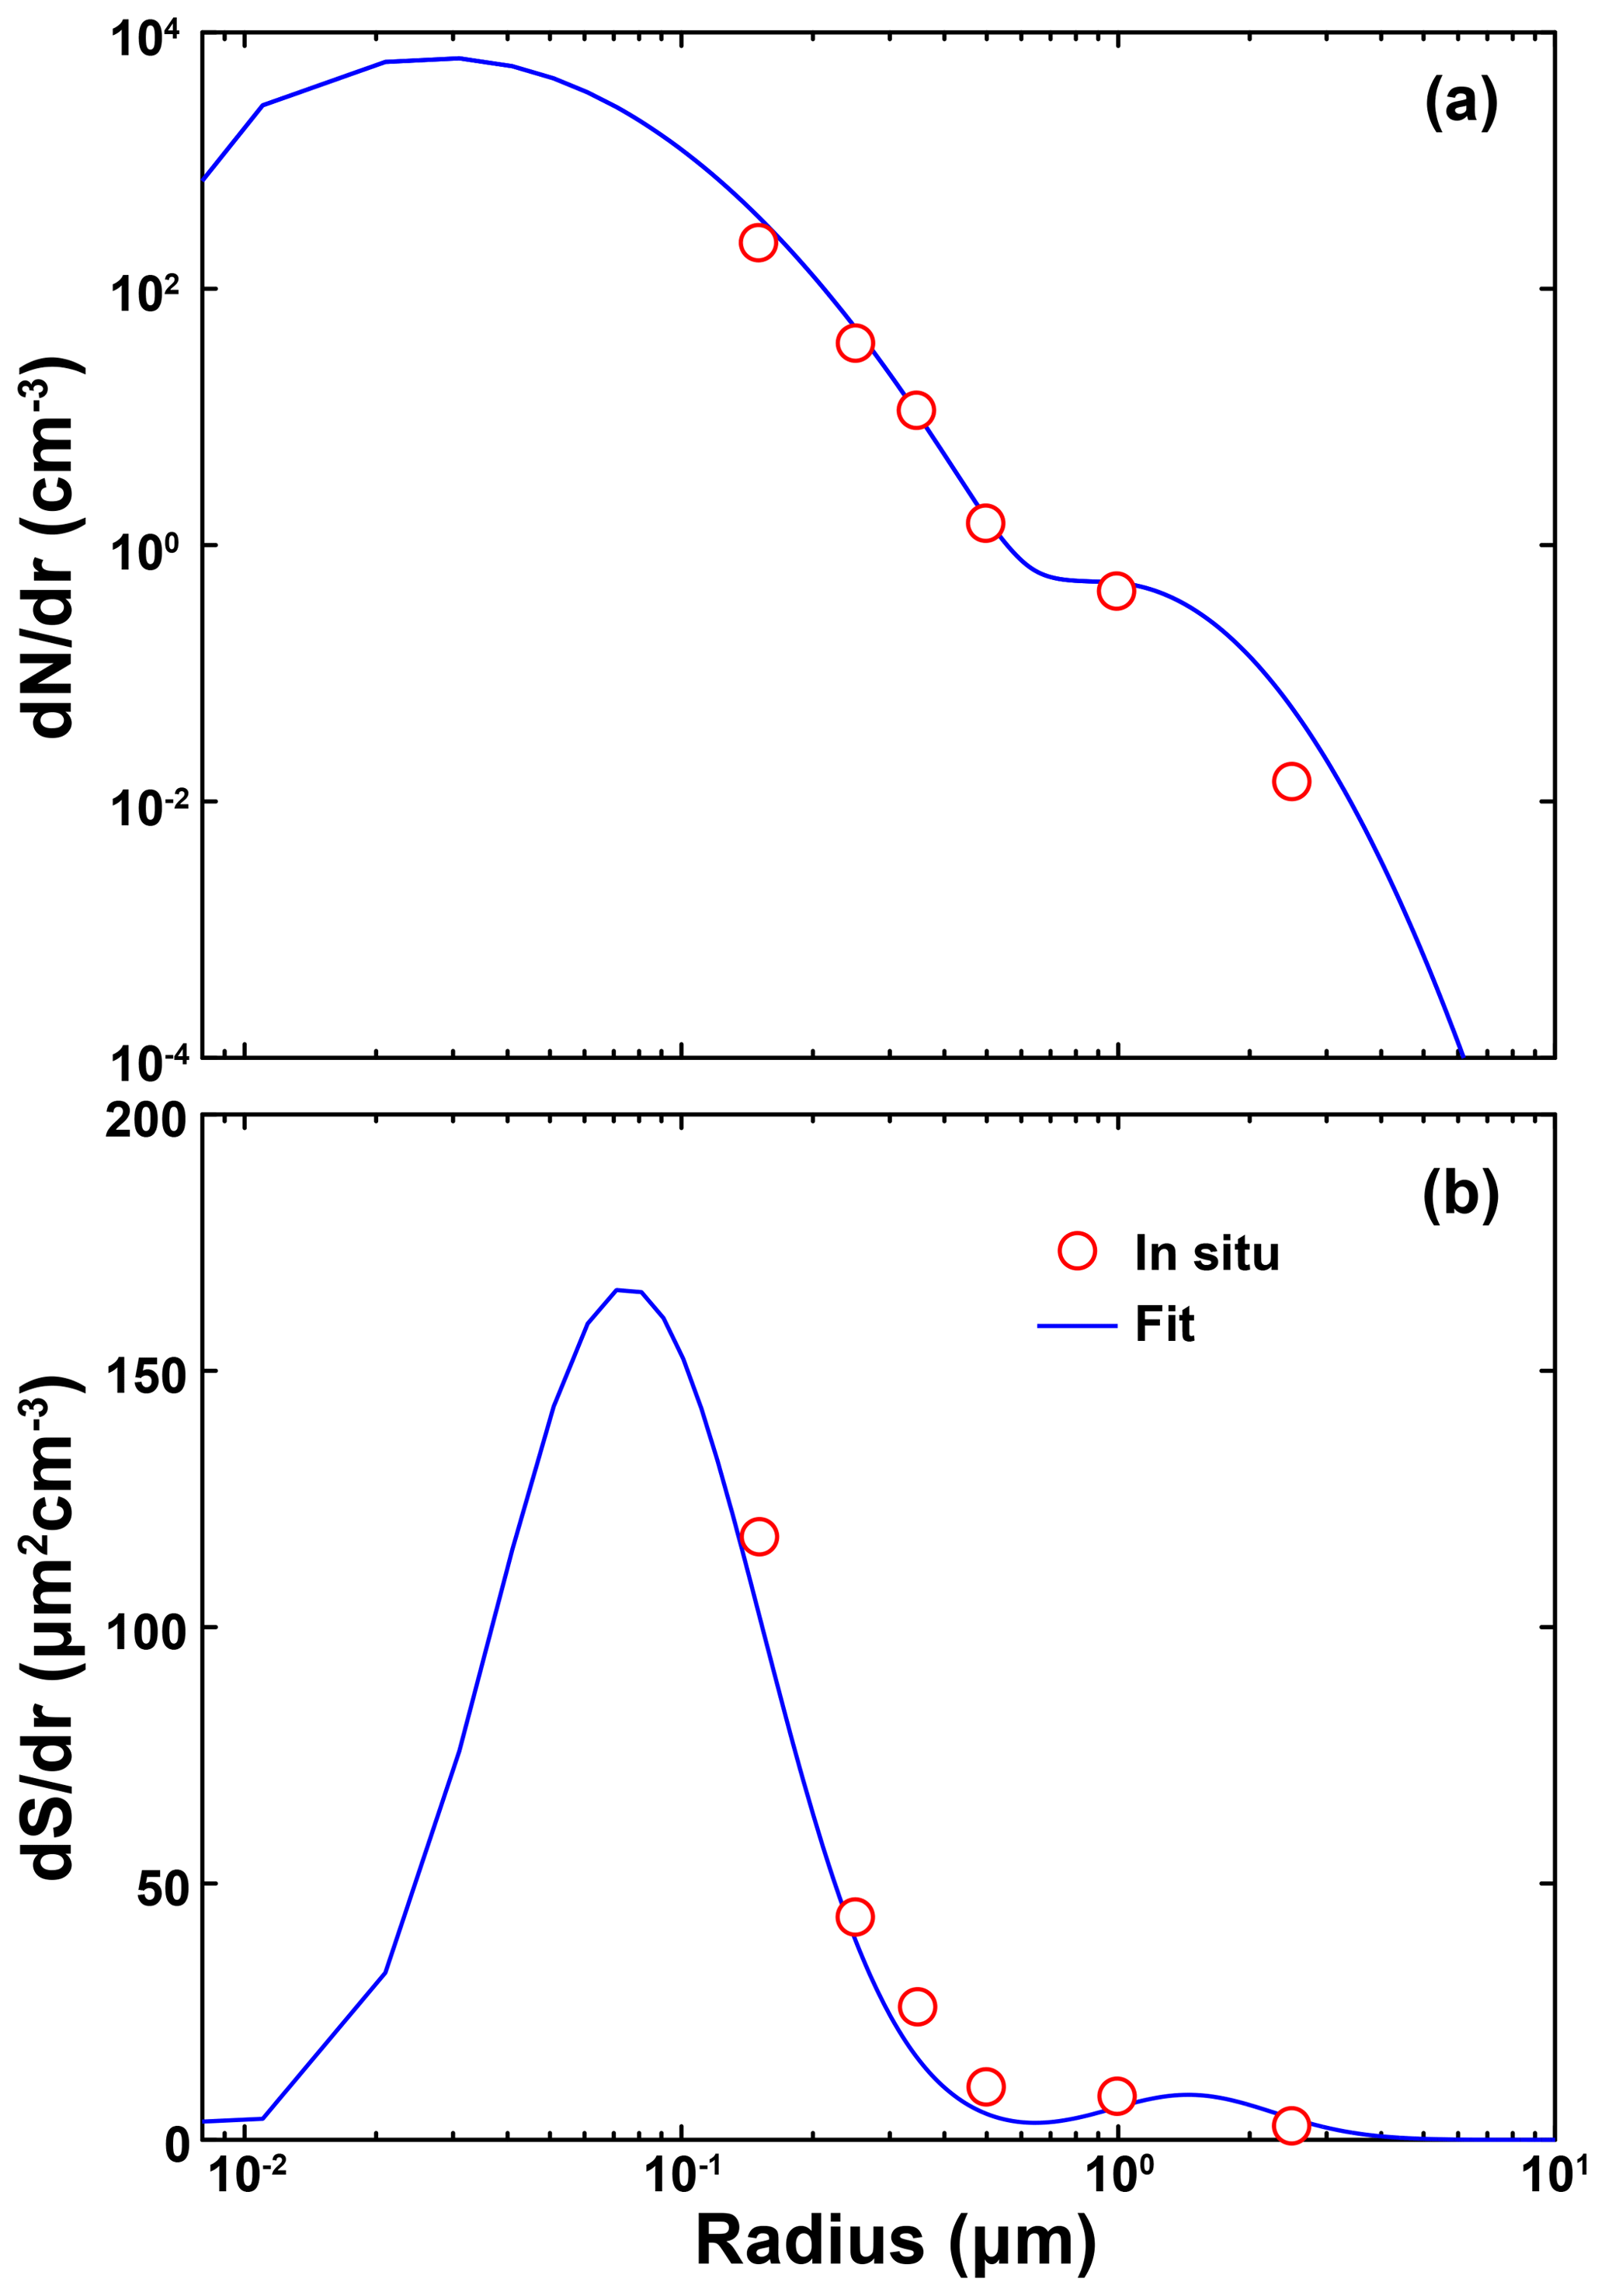
Figure 3(a) The number size distribution used for the estimation of the corrected n250,dry (number concentration of particles with radius larger than 250 nm) and (b) the corresponding surface size distribution used for the estimation of the corrected Sdry (surface concentration of all particles). In situ measurements are denoted by red circles while the blue lines give the bimodal lognormal fit on the measurements. The example refers to the UAV-OPC data acquired at 1.2 km at 10:45 UTC on 5 April 2016 (see Fig. 7).
Cruiser was additionally equipped with an optical particle counter (OPC, Met One Instruments, Model 212 Profiler) that measures the aerosol particle number concentration with 1 Hz resolution in eight channels ranging from 0.15 to 5 µm in radius (Mamali et al., 2018). The inlet of the OPC was preheated to keep the relative humidity below 50 % to minimize the influence of water absorption. The Cruiser-OPC measurements on 5, 9, 15 and 22 April 2016 were used to calculate the n250,dry profiles discussed in Sect. 4.1.
The measurements from the OPC on board the Cruiser UAV were validated at the ground, using a similar OPC and a differential mobility analyzer (DMA). The first comparison showed underestimation for the bin with radius 1.5 µm to 2.5 µm and for the last bin with radius more than 5 µm. The second comparison showed that the OPC underestimates by less than 10 % the number concentration of particles with radius between 0.15 µm and 0.5 µm (Burkart et al., 2010). Moreover, there are no data provided for particles with radius less than 0.15 µm. In order to correct for this undersampling we fit a bimodal number size distribution on the in situ data and derive a corrected n250,dry and Sdry. An example of this correction is shown in Fig. 3 for the number and surface size distributions measured at 1.2 km on 5 April 2016. For the cases discussed herein we found that the corrected n250,dry in situ values were ∼20 % higher than the raw measurements.
3.4 Spaceborne cloud observations
A-Train spaceborne cloud observations are complementarily used to provide us the 3-D distribution and characteristics of the clouds formed in the presence of the calculated nINP. For the spatial distribution of the clouds formed during 21 April 2016, the true color observations from the MODIS instrument (Moderate Resolution Imaging Spectroradiometer) on board Aqua satellite are used (available from NASA at https://worldview.earthdata.nasa.gov/, last access: 8 August 2019). To get a better insight into the vertical cloud structure, we use outputs from the synergistic radar–lidar retrieval DARDAR (raDAR/liDAR; Delanoë and Hogan, 2008). The DARDAR retrieval (initiated by LATMOS and the University of Reading) uses collocated CloudSat, CALIPSO, and MODIS measurements and provides a cloud classification product (DARDAR-MASK; Ceccaldi et al., 2013) and ice cloud retrieval products (DARDAR-Cloud; Delanoë et al., 2014) on a 60 m vertical and 1.1 km horizontal resolution (available at http://www.icare.univ-lille1.fr/projects/dardar, last access: 8 August 2019). In this work, we use the DARDAR-MASK product for cloud classification, and we utilize the DARDAR-Cloud product to derive an estimation of the ice crystal number concentration (nice) of the scene. With increasing maximum diameter (Dmax), the ice crystals become more complex and their effective density decreases (Heymsfield et al., 2010). The DARDAR algorithm describes this relationship using a combination of in situ measurements by Brown and Francis (1995) for low-density aggregates (Dmax>300 µm) and by Mitchell (1996) for hexagonal columns (Dmax<300 µm). We derive the nice (DARDAR-Nice) following the approach presented by Sourdeval et al. (2018) on the DARDAR-Cloud parameters of the ice water content (IWC) and the normalization factor of the modified gamma size distribution (). The direct propagation of uncertainties for IWC and provided by DARDAR-Cloud gives an estimate for the relative uncertainty in nice from about 25 % in lidar–radar conditions to 50 % in lidar-only or radar-only conditions (Sourdeval et al., 2018). This estimation accounts for instrumental errors and uncertainties associated with the a priori profiles used in DARDAR-Cloud. In cases with high homogeneous nucleation rates or dominant aggregation processes, Ni can be underestimated (respective overestimated) by an additional 50 % due to deviations from the assumed particle size distribution. Due to further assumptions within DARDAR-Cloud (e.g., a fixed mass-dimensional relationship), additional uncertainties can increase the error of the retrieved nice. In Sect. 4.3, the retrieved nice is only used as a hint to estimate the order of magnitude of the true nice.
We present here the comparison between the UAV-OPC observations and the lidar-derived n250 profiles (Sect. 4.1). The measurements used for this comparison corresponds to one intense dust event, where the UAV measurements were conducted under cloudy conditions (9 April), and three moderate events with dust and continental mixtures, where the UAV flights were conducted under cloud-free conditions (5, 15 and 22 April). Subsequently, we present the comparison between the UAV-INP measurements and the lidar-derived nINP during 3 d with moderate dust load conditions (Sect. 4.2). From a total of six INP samples, one sample is collected during 21 April in the presence of a pure-dust event under cloudy conditions, and the remaining five samples are collected during 5 and 15 April inside dust and continental aerosol layers under cloud-free conditions. A brief description of the aerosol conditions of the measurements used is provided herein.
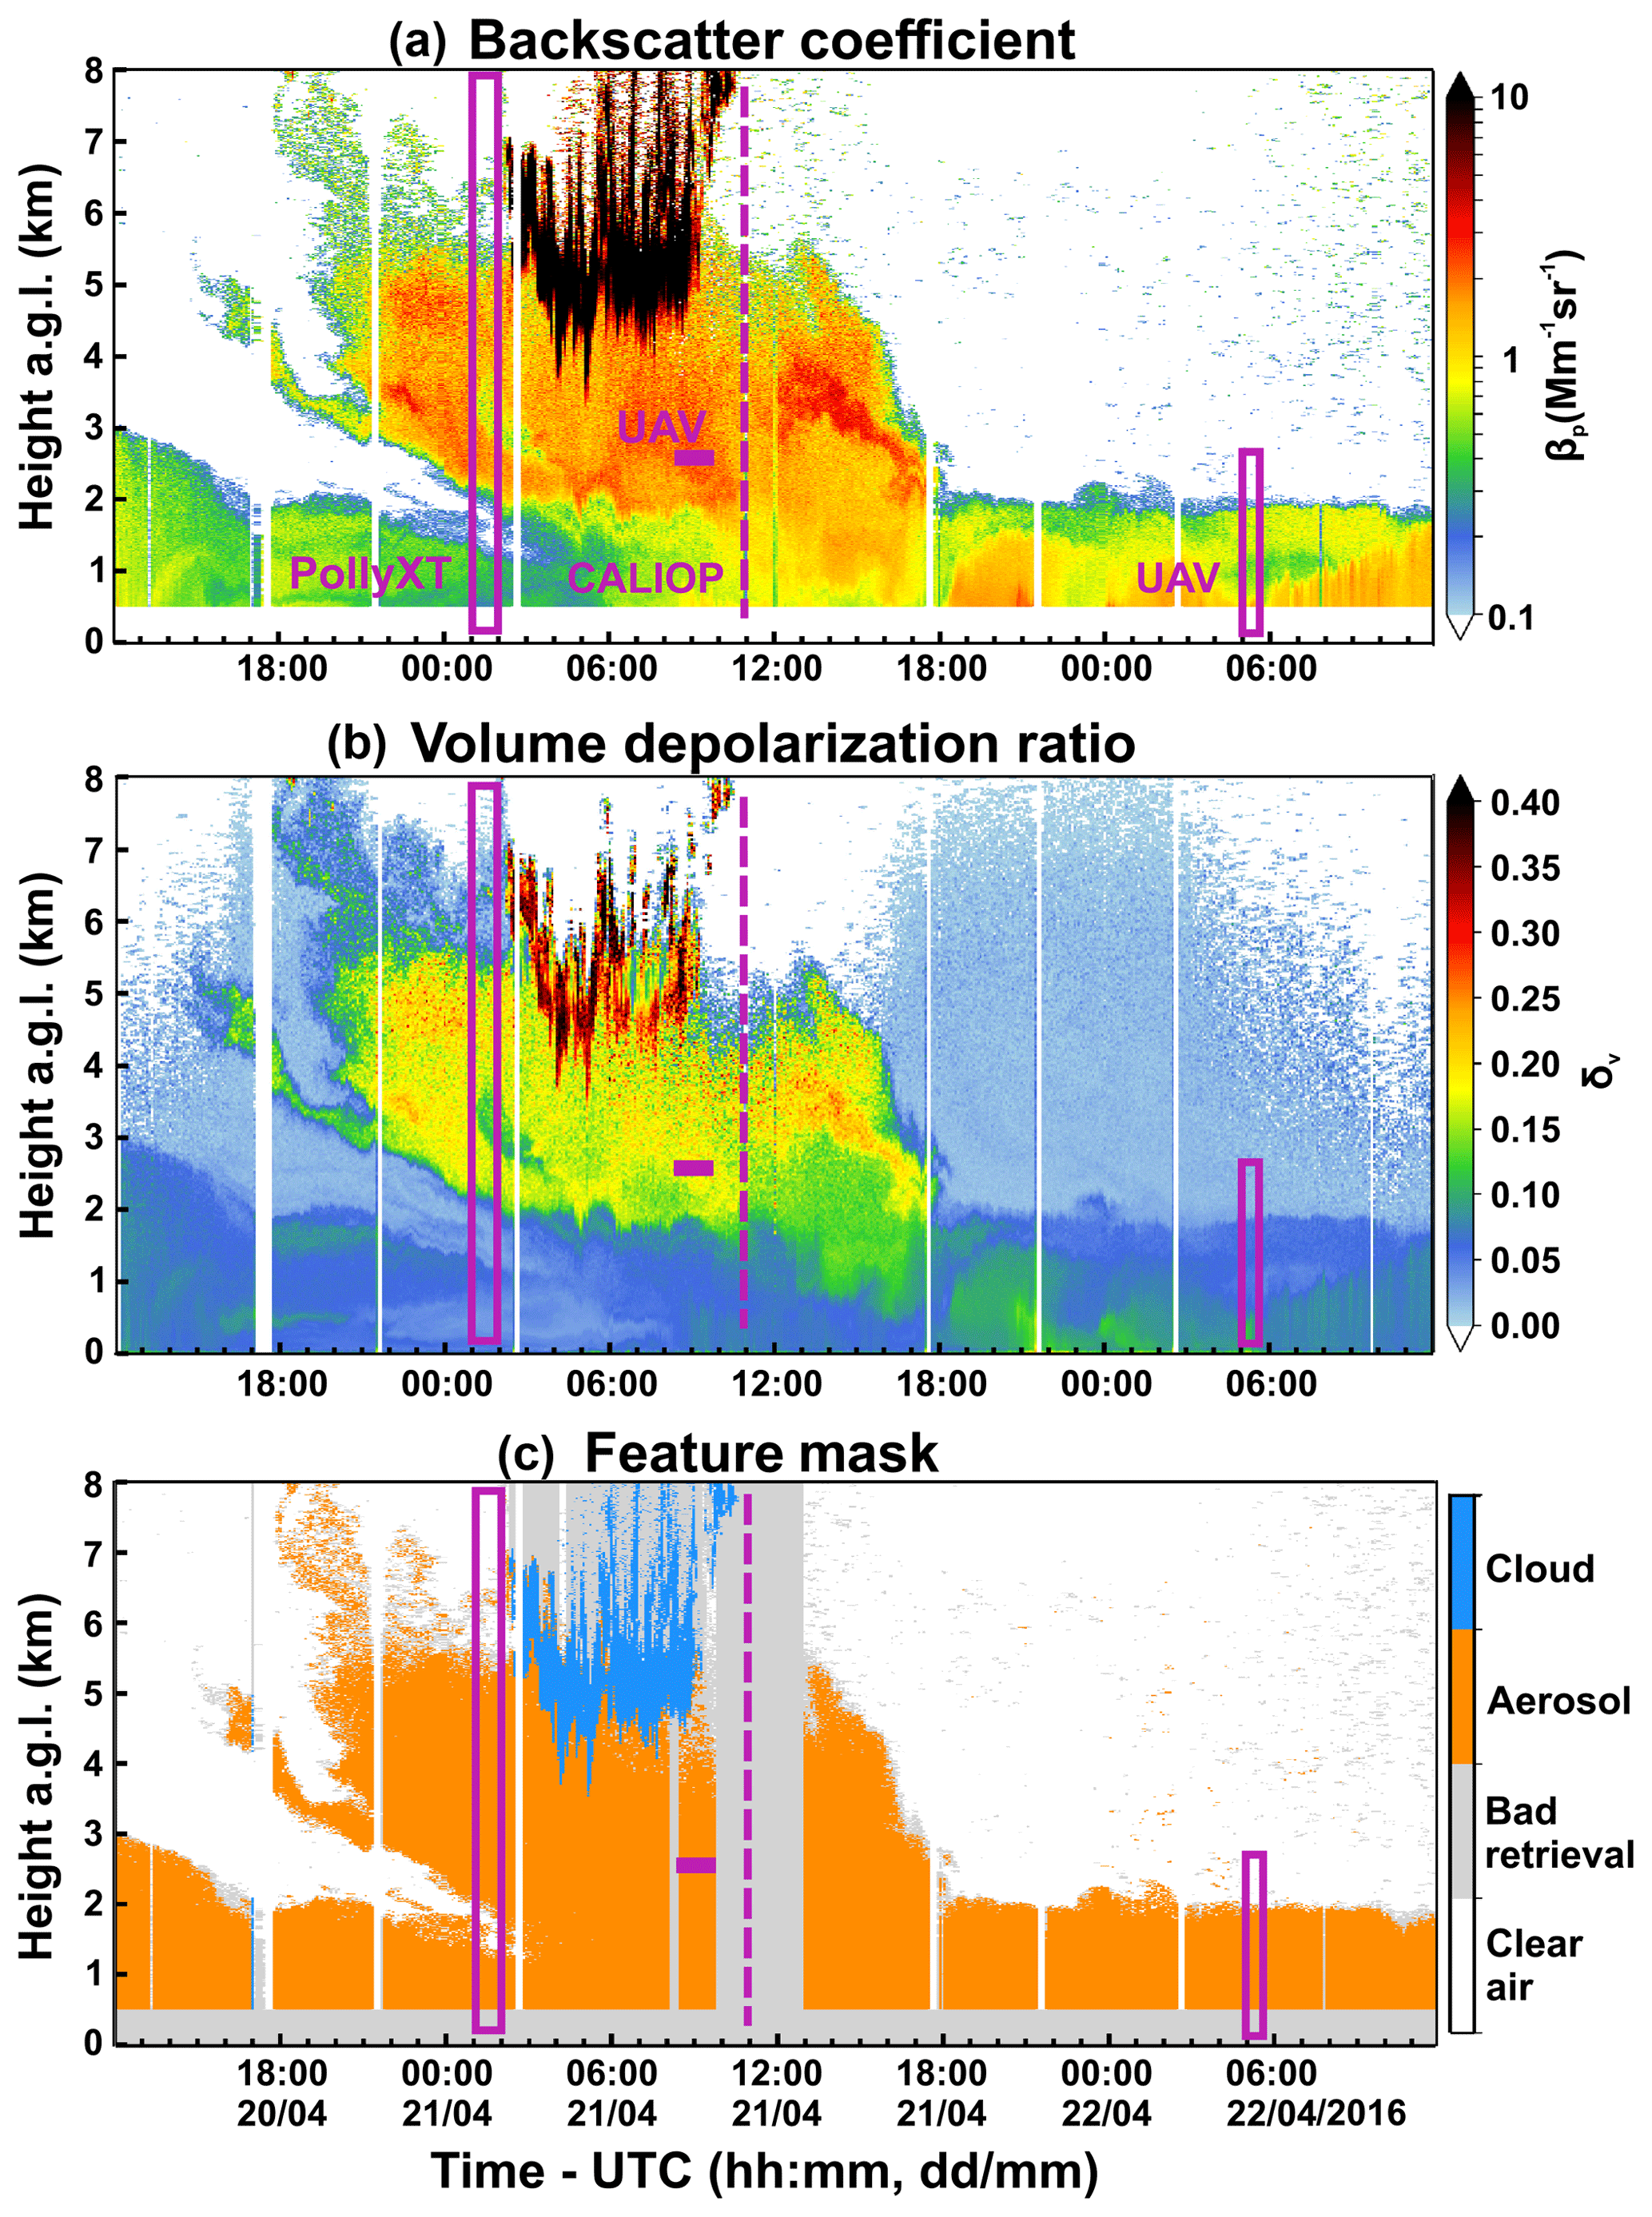
Figure 4Time–height PollyXT observations between 12:00 UTC on 20 April 2016 and 12:00 UTC on 22 April 2016 of the backscatter coefficient at 1064 nm (a), the volume linear depolarization ratio at 532 nm (b) and the feature mask (c). The magenta markers refer to the analyzed periods of PollyXT (left box: 01:00–02:00 UTC on 21 April 2016), CALIOP (dashed line: 11:01 UTC on 21 April 2016) and UAV (horizontal bar: INP sampling between 08:30 and 09:40 UTC on 21 April 2016; right box: OPC measurements between 05:00 and 05:30 UTC on 22 April 2016) that are being referred to in this study. The bad retrievals in the feature mask refer to observations affected by (i) total attenuation due to clouds, (ii) low signal-to-noise ratio and (iii) incomplete overlap.
On 5 April 2016, a homogeneous elevated dust layer was observed above the lidar station at 1.0–1.8 km from 00:00 to 08:00 UTC, which was later on mixed into the developing planetary boundary layer (PBL). In the next hours (until 12:00 UTC), only moderate variability was observed above the station (in the lidar backscatter coefficient and δp curtains – not shown). The UAV samples were collected between 11:37 and 11:57 UTC at 30 km west of the lidar site with westerly winds prevailing. Constant δp of around 0.15 between 0.5 and 2.5 km supports the qualitative homogeneity between the two observation sites during this time period.
On 9 April 2016, a thick pure-dust layer (with δp≈0.3) was observed above the lidar station, as part of a major dust event above Cyprus between 8 and 11 April 2016. The mean AOD at Nicosia was 0.83 (at 500 nm) with a corresponding mean Ångström exponent of 0.17 (at 440–870 nm). During the event, ice and water clouds were frequently formed at the top of the dust layer (mainly between 3 and 6 km). The DREAM model and backward trajectory analysis revealed that this event originated from the central Sahara, with the dust particles being advected by a southwesterly flow directly towards Cyprus, reaching the island after 1 d (Schrod et al., 2017). The UAV samples were collected between 08:12 and 08:23 UTC inside the dust layer, and these observations were compared with the lidar-derived profiles at 06:50–06:59 UTC (a closer-in-time collocation between the lidar observations and the UAV measurements is not possible due to clouds with a cloud base at 4 km later on). The OPC concentrations collected that day were the highest observed during the period of the INUIT-BACCHUS-ACTRIS experiment.
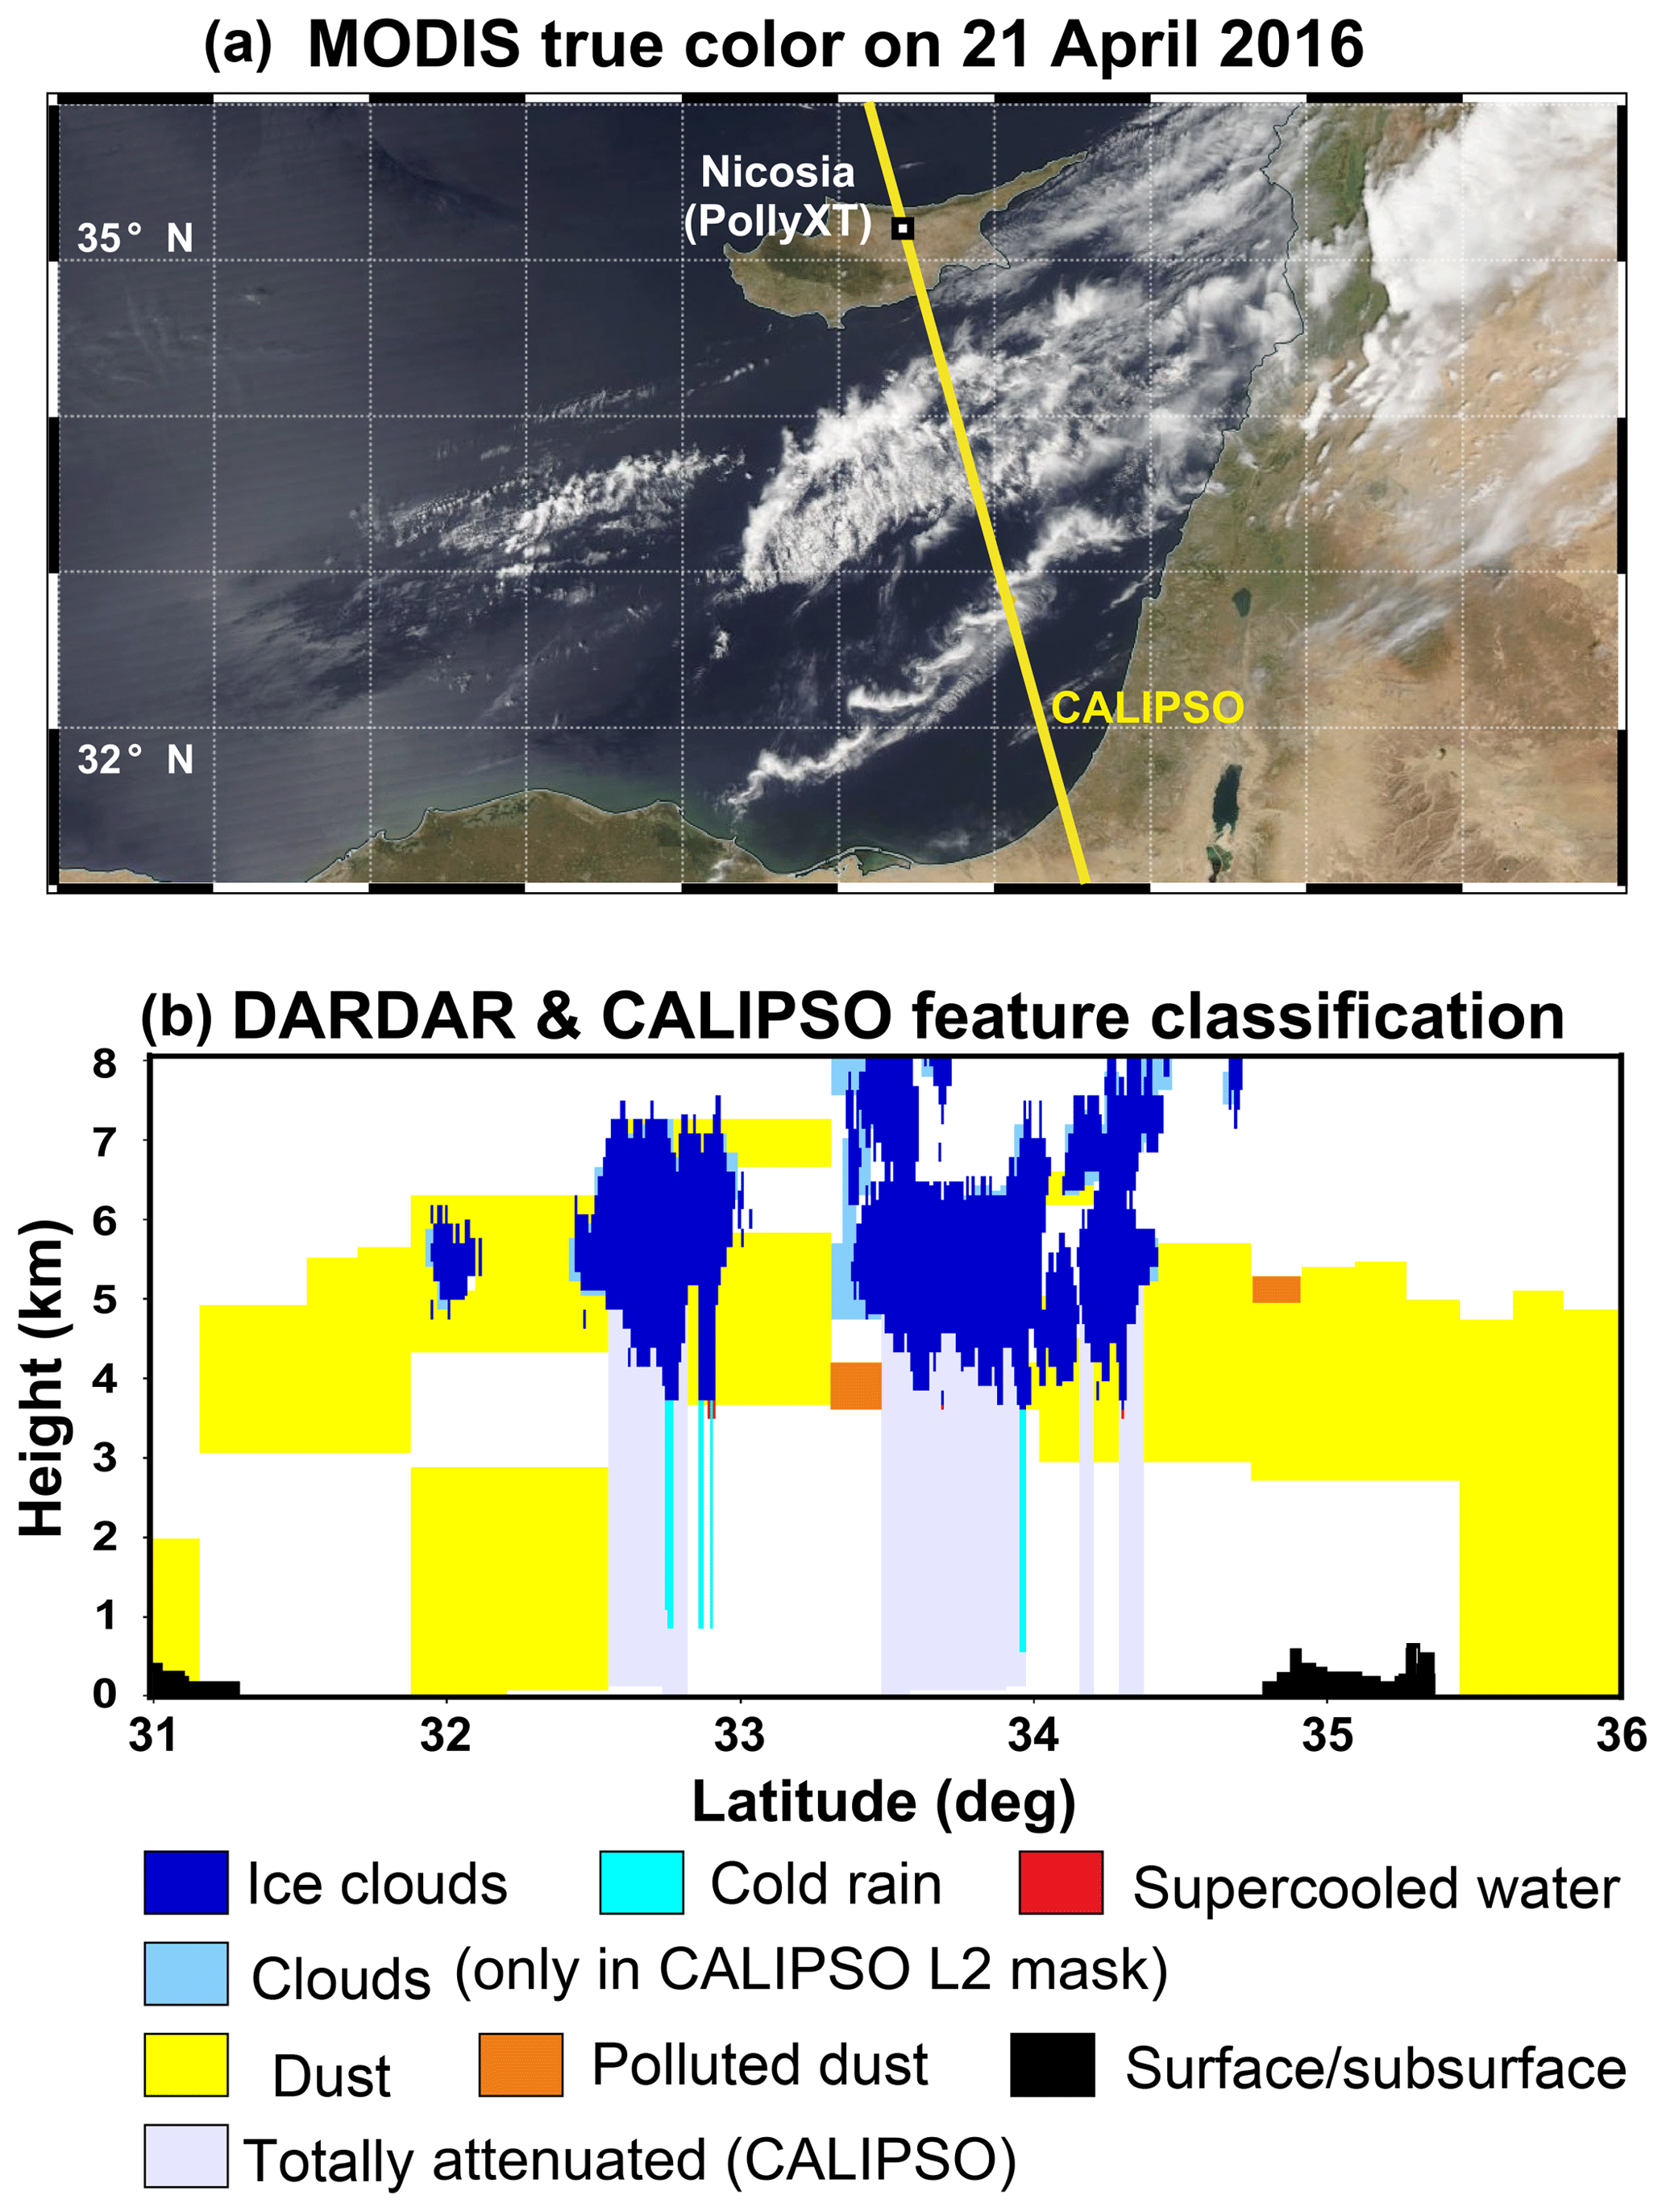
Figure 5A-Train observations on 21 April 2016 at 11:00 UTC of MODIS-Aqua true color from NASA Worldview Snapshots (a) and DARDAR and CALIPSO feature classification (b).
On 15 April 2016 a persistent elevated dust layer was observed above Nicosia. Backward trajectory analysis (not shown) revealed that this dust event originated from Algeria and that the dust plume was transported over Greece and Turkey before reaching Cyprus. Cruiser UAVs collected samples between 06:54 and 08:45 UTC (during the boundary layer development). At that time, a pure-dust layer (δp≈0.3) was present between 2.5 and 3.8 km height. Below 2.0 km the dust was mixed with continental spherical particles from the residual layer with δp decreasing with height (reaching ∼0.1 at 0.6 km). During the 2 h flight, the scene above the station changed considerably, with a 31 % increase in the aerosol optical thickness (from 0.33 to 0.48) and 16 % decrease in the Ångström exponent (from 0.31 to 0.26). The UAV measurements that day reached heights of up to 2.2 km, thus capturing only the mixed bottom layer and the lower part of the elevated dust layer. For the comparison with the lidar-derived concentrations, only the UAV measurements inside the lower part of the elevated dust layer (1.7–2.2 km) are used.

Figure 6Profiles of the surface (a, b) and number concentrations (c, d) of mineral dust (a, c) and continental particles (b, d) with a dry radius larger than 250 nm derived from measurements with PollyXT between 01:00 and 02:00 UTC on 21 April 2016 (red) and retrieved from averaging 160 km of CALIOP measurements centered around an overpass at a distance of 5 km from Nicosia at 11:01 UTC on 21 April 2016 (blue).
The pure-dust event on 20 to 21 April 2016 is considered the golden case of our dataset, as it has been observed simultaneously with the PollyXT lidar, the UAVs and the A-Train satellites. Additionally, it is the only pure-dust event of our dataset where we have simultaneously good lidar observations and in situ INP measurements. Figure 4 provides an overview of the times and heights of the PollyXT measurements, along with the CALIPSO overpass and UAV measurement times, between 20 and 22 April 2016. During that period atmospheric conditions supported the transport of dust from the Saharan desert and the Arabian Peninsula to the Eastern Mediterranean () (Floutsi, 2018). The elevated dust plume arrived over the lidar site at 4–5 km height (∼15:00 UTC on 20 April 2016), quickly widened to stretch from 2 to 8 km height with the top of the main plume at 5 km height, and disappeared at 18:00 UTC on 21 April. On that day, ice clouds were formed within the dust plume and were present between 02:00 and 10:45 UTC above Nicosia. As shown in the figure, UAV flights were performed inside the dust layer on 21 April 2016 (OPC measurements and INP sampling). The event was captured from the A-Train satellites at 11:01 UTC (CALIPSO overpass time). Figure 5 provides an overview of the aerosol and clouds above the area, with the MODIS true color image (upper panel) and the combined DARDAR and CALIPSO L2 feature mask (lower panel). Dust is observed above the broader region at altitudes up to 6 km, and ice clouds are formed inside the dust layer south of Cyprus at altitudes greater than 4 km (T<0 ∘C). The ice clouds are detected and characterized at 1 km horizontal resolution (DARDAR-MASK product), while the dust plume is detected at 20 and 80 km horizontal resolution (CALIPSO L2 product).
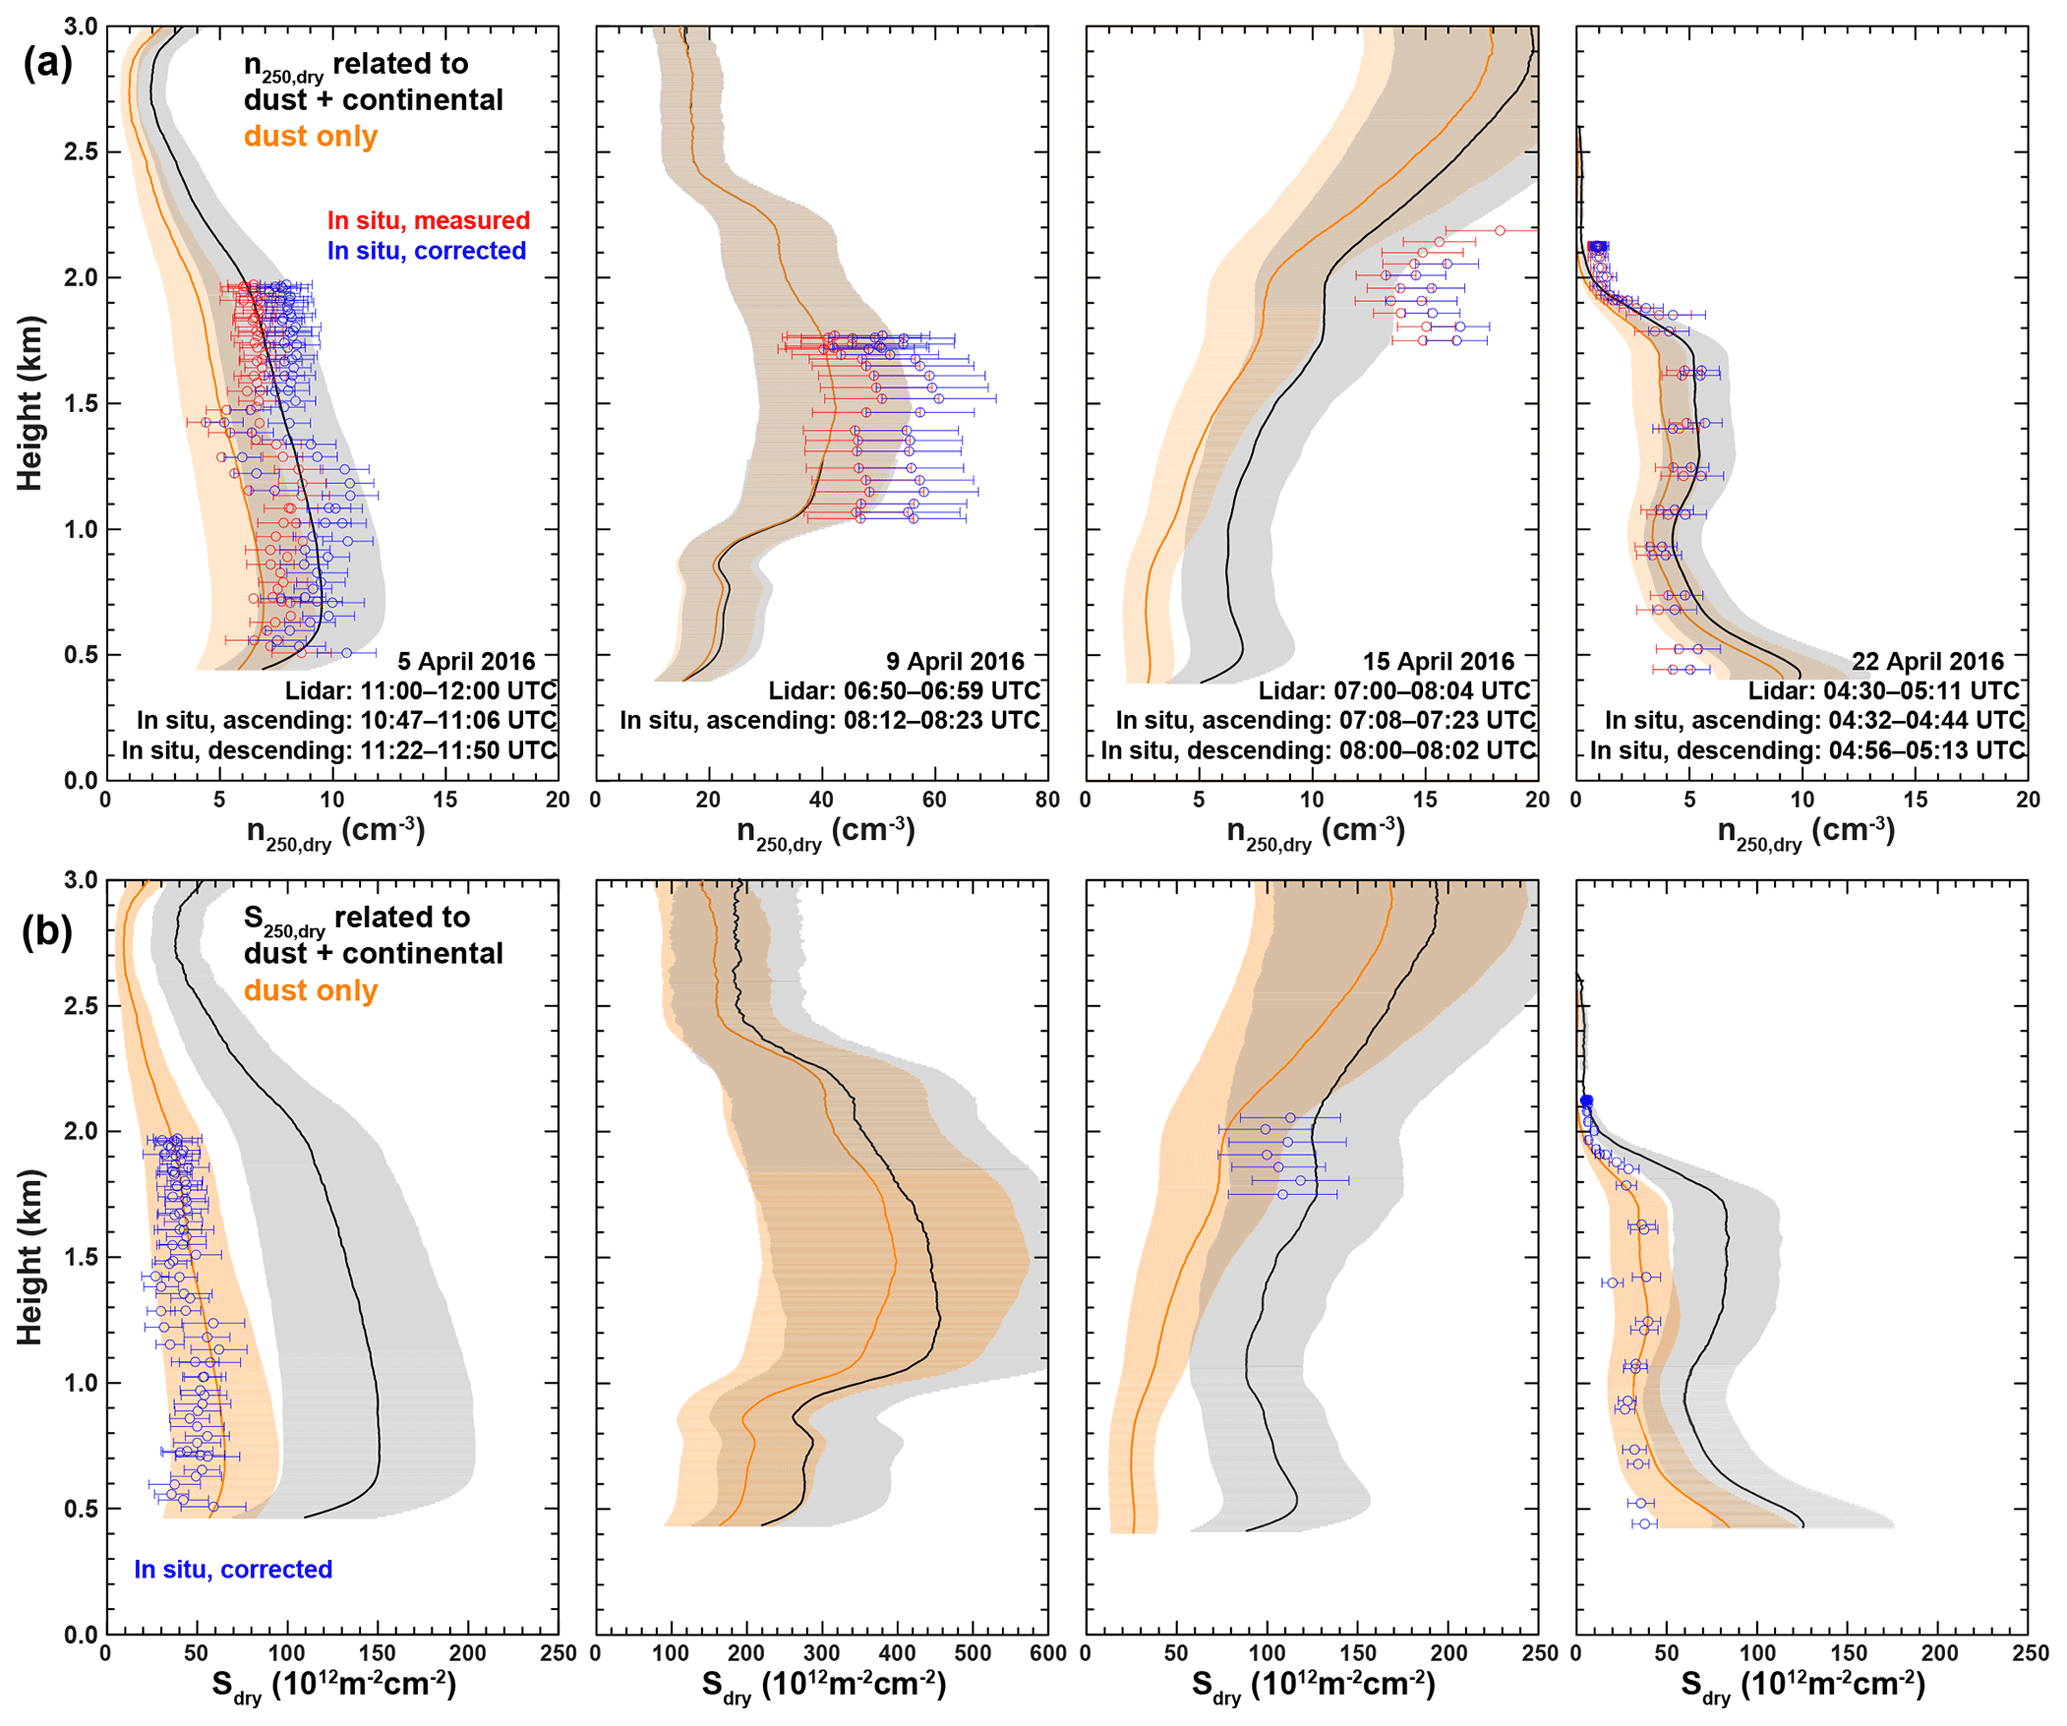
Figure 7Profiles of n250,dry (upper panel) and Sdry (lower panel) obtained from PollyXT and in situ measurements (UAV uncorrected data in red, UAV corrected data in blue) on 5, 9, 15 and 22 April 2016. The lidar-derived profiles refer to dust-only concentrations (orange), as well as the combination of dust and continental pollution concentrations (black).
On 22 April 2016 a transported plume was detected between 03:00 and 10:00 UTC, at altitudes of 1 to 2 km above Cyprus. The layer consisted of a mixture of dust with pollution aerosol and is characterized by a homogeneous particle linear depolarization ratio of . UAV flights (OPC and INP sampling) were performed in the mixed layer during that day between 04:32 and 05:13 UTC (Fig. 4).
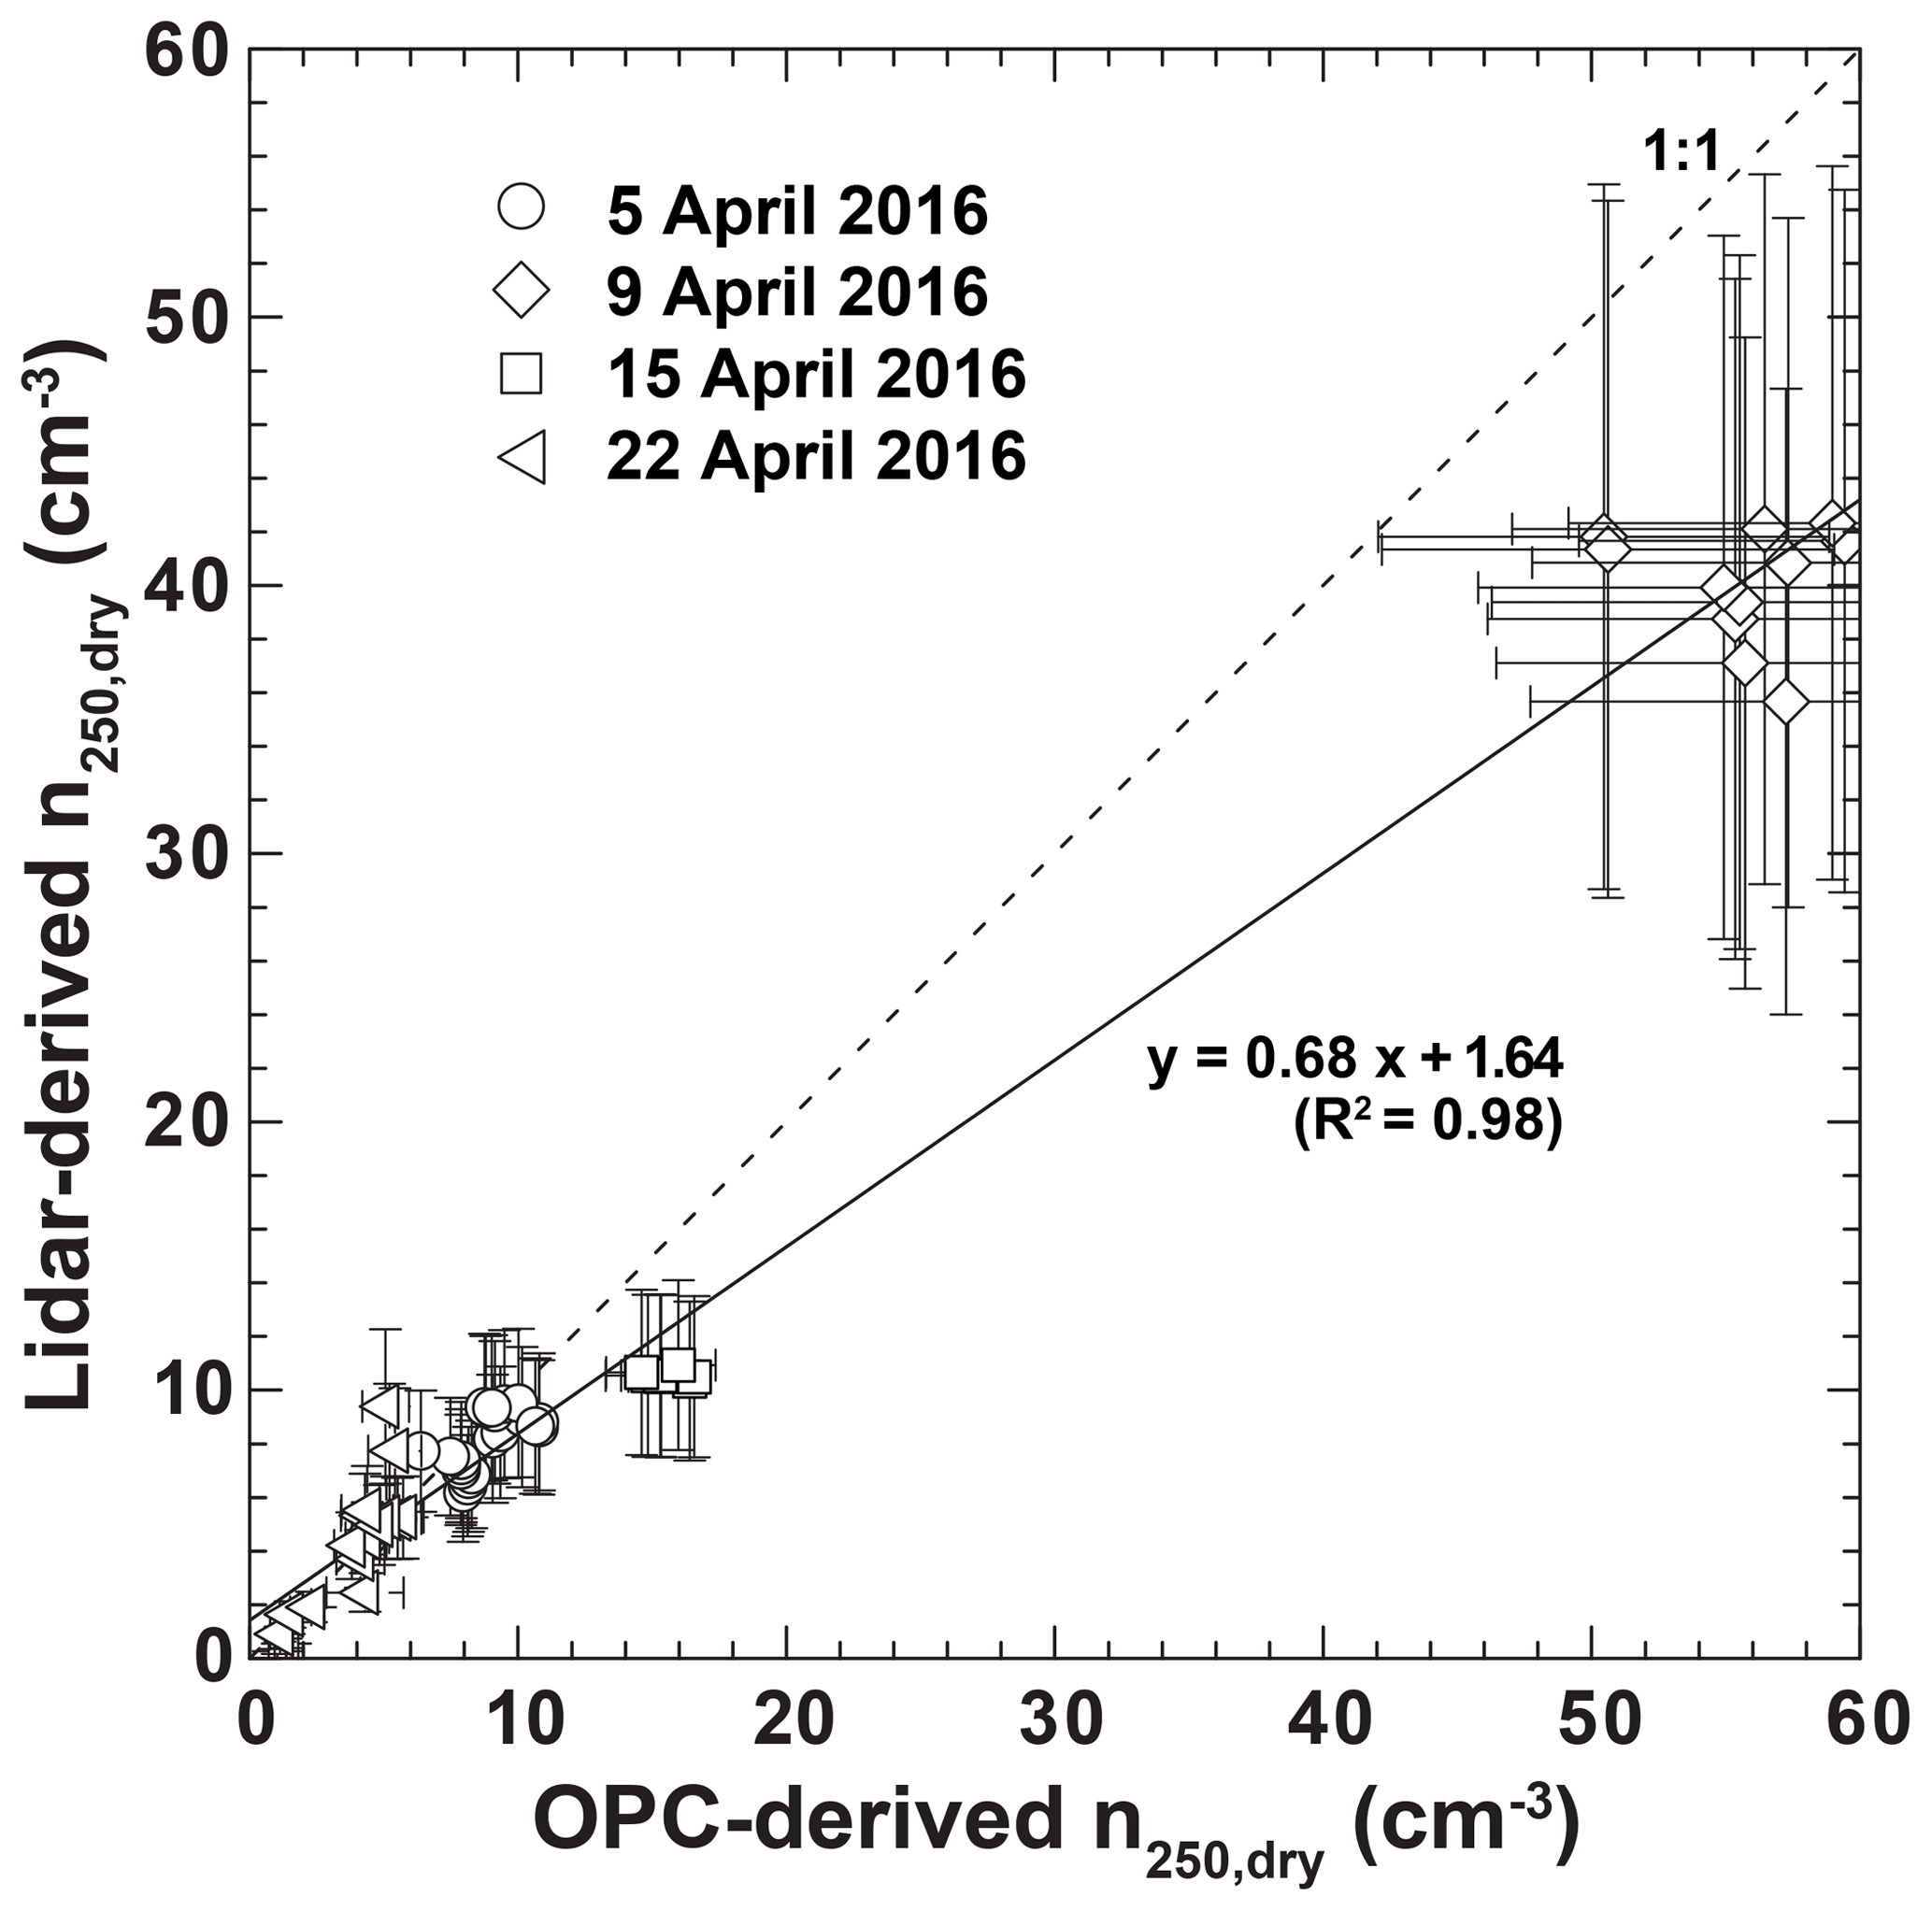
Figure 8Correlation plot of n250,dry obtained from drone-based OPC measurements and inferred from lidar observations (values for a mixture of mineral dust and continental pollution, black in Fig. 7) during coordinated activities on 5, 9, 15 and 22 April 2016. The solid line marks the linear regression with the corresponding function and squared correlation coefficient given in the plot. The 1:1 line is given as a dashed line.
All in situ samples were collected at a location about 28 km to the west of the lidar site; thus the atmospheric homogeneity of the two areas had to be considered to select suitable measurement times for the comparisons. For this analysis we used the sun-photometer measurements at Agia Marina and Nicosia, backward trajectories, model fields and MODIS measurements. This was especially necessary for the case on 21 April when clouds were formed at the top of the dust layer. During that day, the CALIPSO-derived nINP at 11:01 UTC were compared to UAV-measured ones acquired approximately 1.5 h earlier (between 08:30 and 09:40 UTC). The space and time homogeneity of the CALIPSO-derived sdry and n250,dry profiles (acquired shortly after the end of the cloudy period) is confirmed by the respective estimates from the PollyXT measurements during 01:00 to 02:00 UTC (before the beginning of the cloud formation) as shown in Fig. 6. The different measurement times of the ground-based and spaceborne lidars are marked in Fig. 4. For the CALIPSO profiles, along-track observations ±80 km away from the lidar station are used. During that time, the dust plume declined by approximately 300 m. Nevertheless, CALIPSO- and PollyXT-retrieved profiles are in agreement within their error bars within the dense dust plume. Aerosol conditions were less homogeneous above and below this layer (see Fig. 4), causing stronger differences between the profiles of the four parameters from the two instruments. The comparison between the CALIPSO-derived nINP and the UAV measurements from this case is discussed in Sect. 4.2 (see Fig. 9).
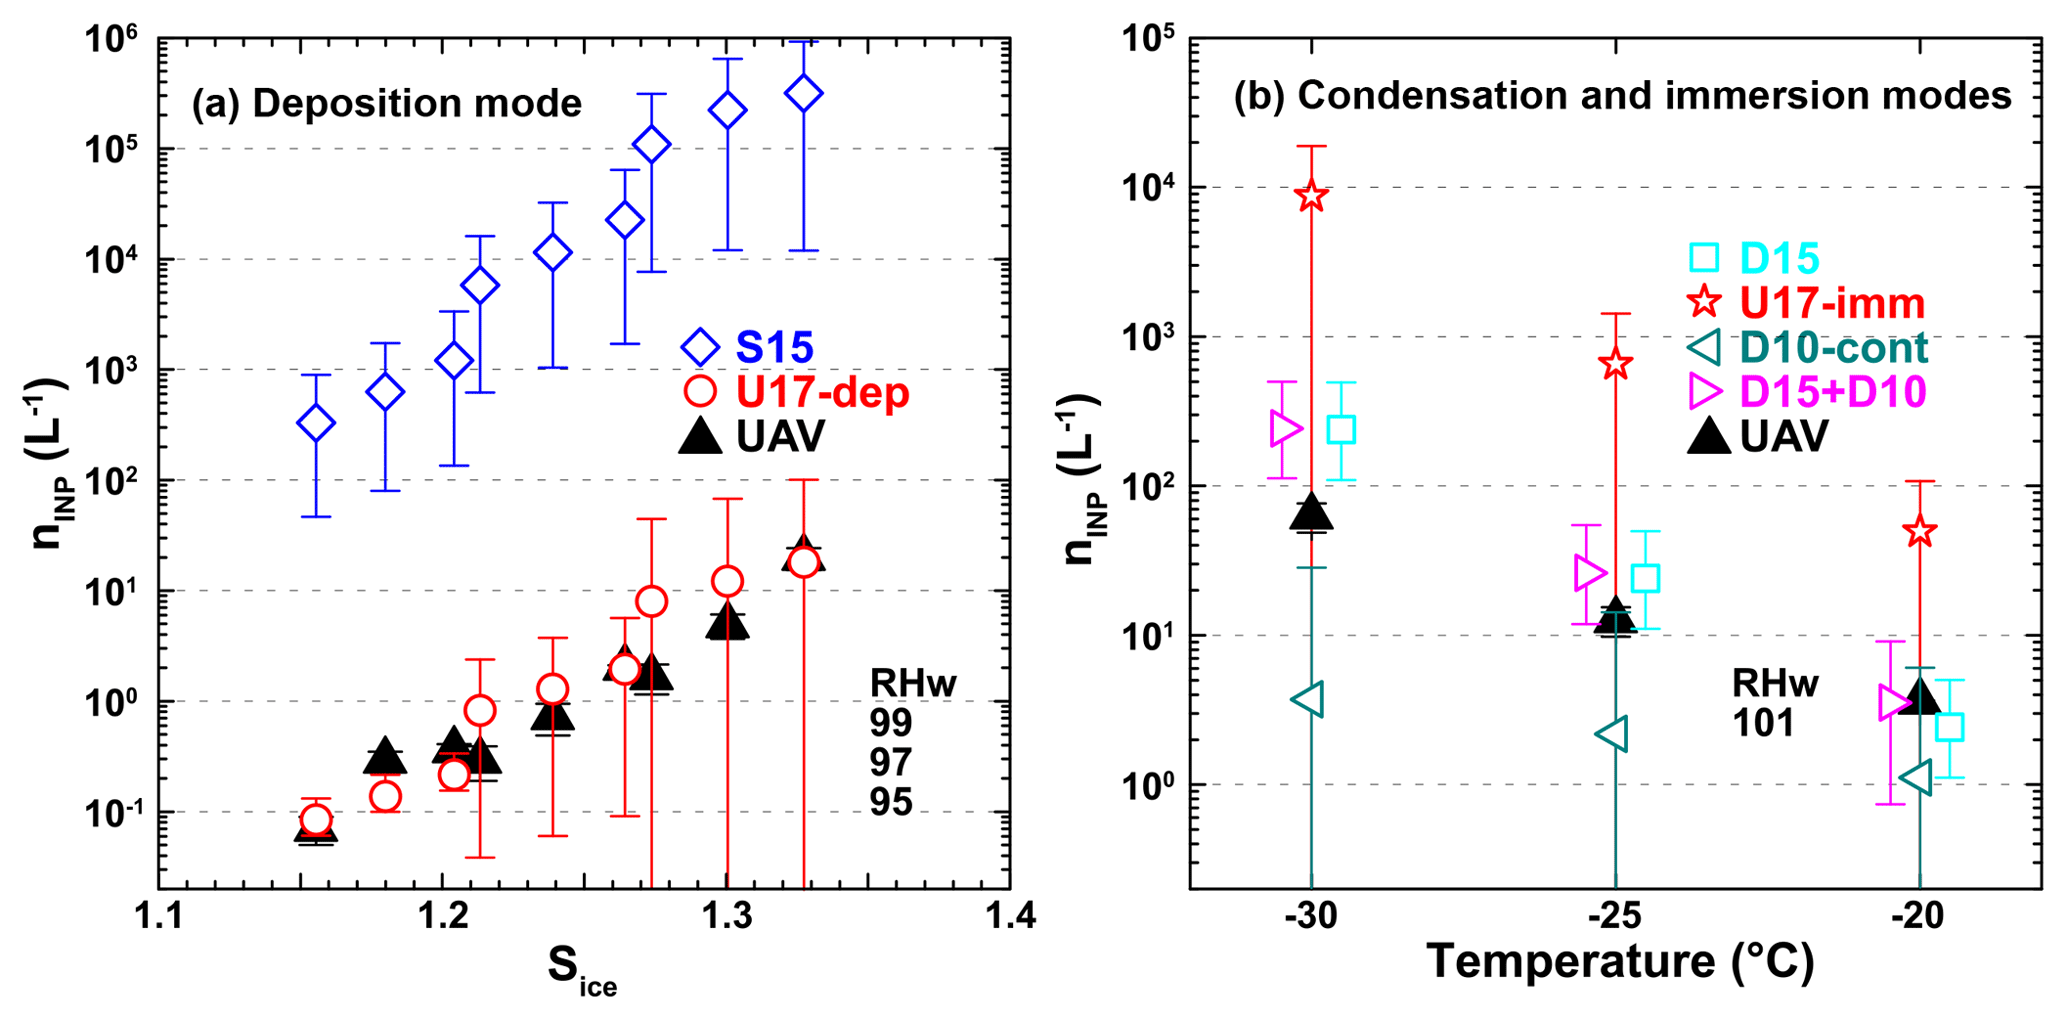
Figure 9INP concentrations (nINP) estimated from the CALIPSO lidar measurements on 21 April 2016 presented in Fig. 6 (colored symbols) and the UAV-FRIDGE measurements (black triangles) for (a) deposition freezing (as a function of saturation over ice) and (b) condensation and immersion freezing (as a function of temperature). Data in (a) are obtained for values of relative humidity over water of 95 %, 97 % and 99 %, leading to three values of Sice for each analyzed temperature. A relative humidity over water of 101 % is used to obtain the values presented in (b).
Table 3Overview of the AERONET-based parameterizations used in this study for the conversion of the measured optical aerosol properties (αd, αc) into the microphysical properties (, Sd,dry, and Sc,dry). The parameterizations were introduced in Mamouri and Ansmann (2016). In the equations, α is in per megameter (Mm−1), c250 in Mm cm−3, cs in Mm m2 cm−3, n250,dry in cm−3 and Sdry in m2 cm−3. For the values of the conversion parameters (c250,d, cs,d, c250,c and cs,c) see Table 2.

4.1 Evaluation of the n250,dry retrieval
For the assessment of the lidar-based n250 retrieval we used the OPC measurements on 5, 9, 15 and 22 April. The profiles of n250,dry retrieved from PollyXT observations and in situ measurements are shown in Fig. 7a. The lidar dust-only profiles (orange lines) are calculated from the dust extinction profiles and Eq. (8) (Table 3). The remaining nondust component is considered continental with provided by Eq. (10) (Table 3). The total n250,dry profiles (Fig. 7a, black lines) are the summation of and . The red dots correspond to the uncorrected UAV n250,dry measurements. The blue dots correspond to the corrected UAV n250,dry measurements (as described in Sect. 3.3). We use only the respective height ranges at which homogeneous aerosol conditions allow for a comparison of the UAV- and lidar-derived estimates. These measurements correspond to heights above 0.5 km on 5 April, above the PBL on 9 and 15 April (>1 and >2 km respectively), and above the nocturnal boundary layer on 22 April (>0.7 km). It seems that the distance has little impact on the lidar-derived and the in situ-measured n250,dry presented in Fig. 7, with most of the in situ-derived n250,dry being well within the error bars of the lidar retrieval when considering the contributions of both mineral dust and continental pollution. On 9 April we observed the highest differences between the lidar-derived and in situ-measured n250,dry, which may be attributed to the ∼1 h time difference between the in situ sampling and the lidar retrieval (limitation due to mid-level clouds as discussed already). Nevertheless, the case is included here, as it represent the strongest dust event observed during the campaign. Overall, the values of n250,dry varied between 1 and 50 cm−1.
Figure 8 provides a quantitative comparison of the observations presented in Fig. 7 for lidar retrievals of n250,dry considering both mineral dust and continental pollution and the corresponding in situ measurements at the same height levels. Again, we see that the results agree well within the error bars of the lidar retrieval with R2=0.98. The uncertainties of the UAV-derived n250,dry values presented in Figs. 7 and 8 correspond to the standard deviation of the 30 s average (OPC initial resolution of 1 s). The error in the OPC data due to the assumption of the refractive index and the shape of the particles used for the derivation of the particle size distribution from the OPC measurements were not taken into account in this study. Nevertheless, it is not expected to be high because the refractive index used is characteristic for dust particles (n=1.59). We have to keep in mind the effect of a possible inhomogeneity between the two stations. In view of all uncertainty sources, the lidar- and UAV-derived n250,dry are in good agreement. In terms of absolute values, the lidar-derived n250,dry are slightly lower than the UAV-derived ones. We conclude that lidar measurements are capable of providing reliable spatiotemporal distributions of n250,dry in cases with dust and continental aerosol presence with an uncertainty of 20 to 40 %.
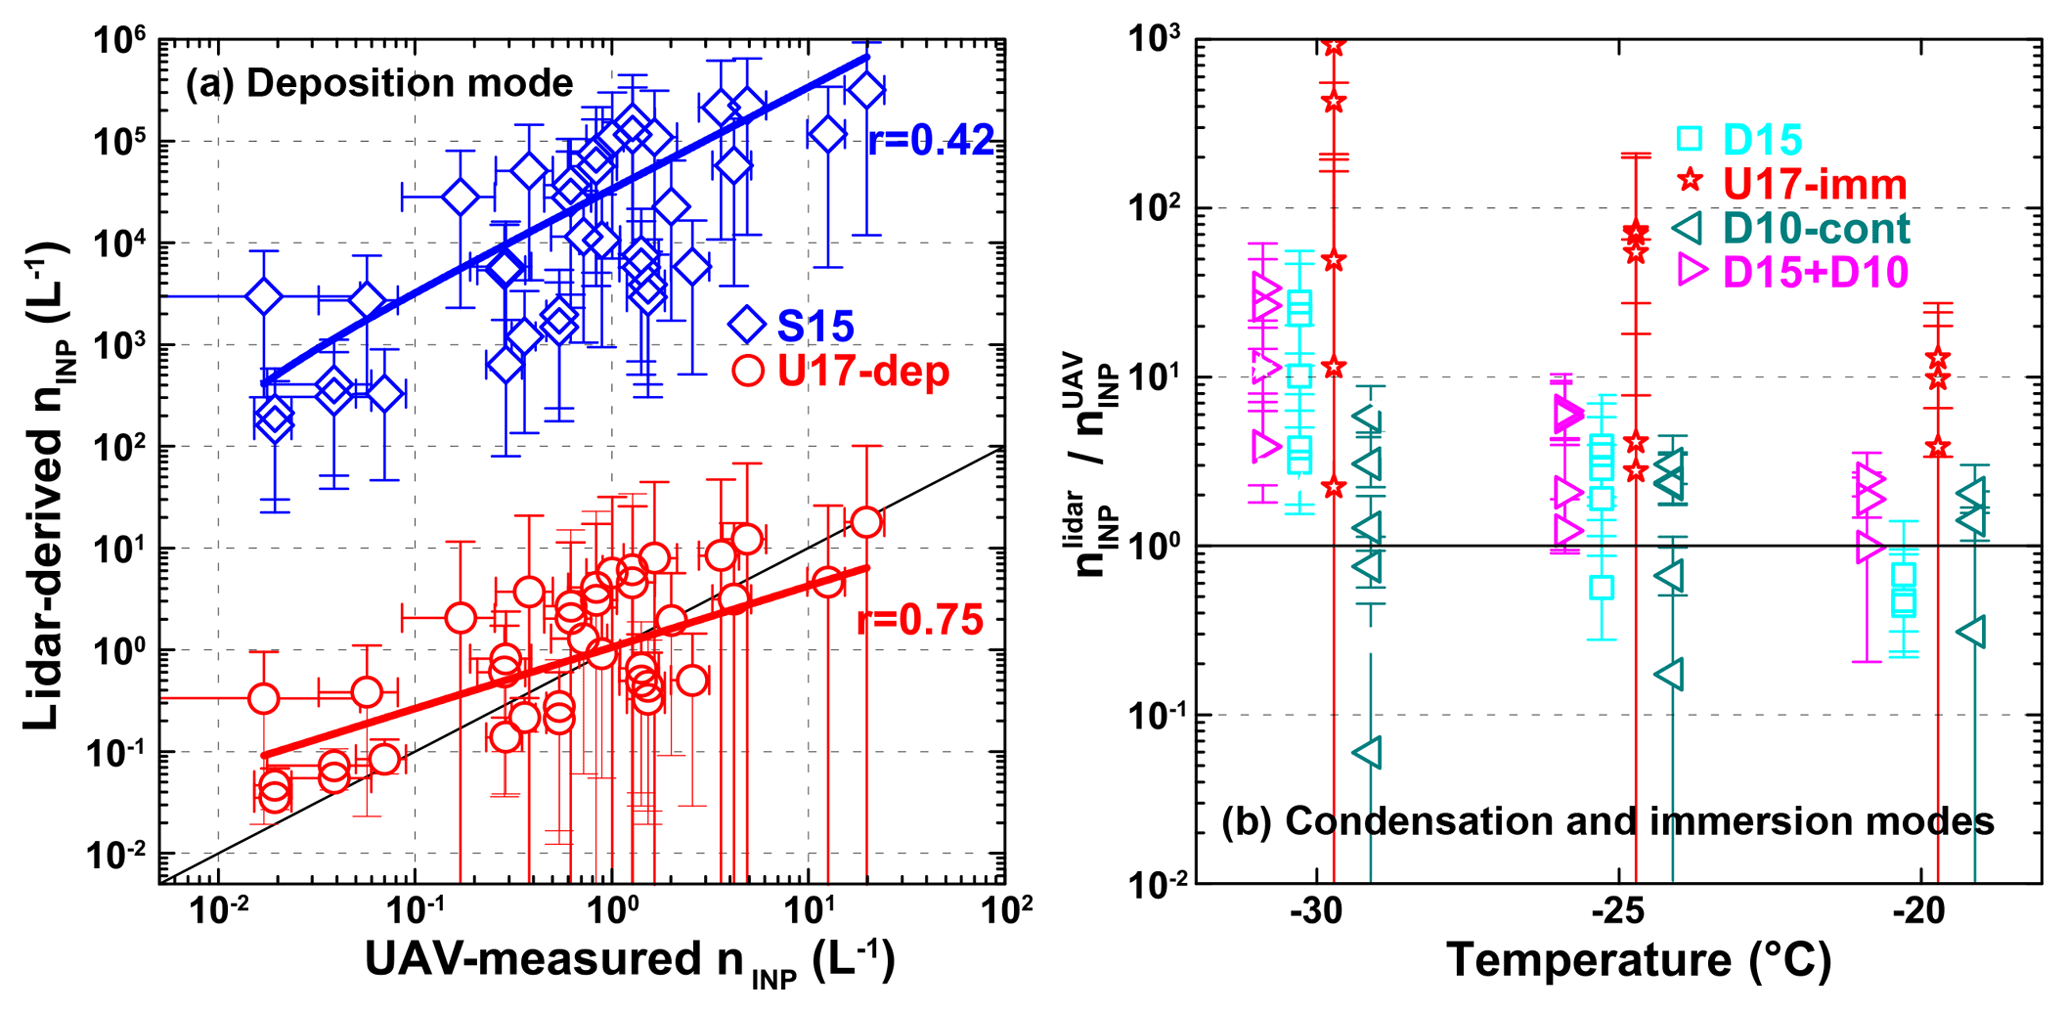
Figure 10Comparison of INP concentrations derived from the CALIPSO and PollyXT lidar observations and UAV-FRIDGE measurements for (a) deposition freezing and (b) condensation and immersion freezing for cases with dust and continental presence. Colors and symbols refer to the used parameterization. Lines in (a) and (b) mark the 1:1 line. Numbers in (a) give the Pearson r of the linear fits.
The profiles of Sdry retrieved from PollyXT observations and in situ measurements are shown in Fig. 7b. The dust-only profiles (orange lines) are calculated from the dust extinction profiles and Eq. (9) (Table 3). The remaining nondust component is considered continental with provided by Eq. (11) (Table 3). The total Sdry profiles (Fig. 7b, black lines) are the summation of Sd,dry and Sc,dry. These profiles are compared to the total Sdry derived from the corrected in situ number size distribution (e.g., Fig. 3b). We see that the latter agree well within the uncertainty of the lidar-derived Sd,dry (orange line) but do not agree well when both mineral dust and continental pollution are considered (black line). This is mainly due to the sampling cutoff of the OPC instrument for particles with radius smaller than 150 nm, which are mainly composed of polluted continental particles. The effect is not seen in the corrected n250, since the size ranges considered there are larger than 250 nm.
4.2 Evaluation of the nINP retrieval
For the assessment of the lidar-based nINP retrieval, the UAV measurements on 5, 15 and 21 April 2016 are used. The samples of 5 and 15 April were collected under the moderately mixed dust and continental conditions shown in Fig. 7. On 5 April, the sample was collected at an altitude of 1.823 km (). On 15 April two samples were collected from a 0.998 km and 1.281 km altitude (). On 21 April, the pure-dust sample was collected from a 2.55 km altitude () (Fig. 4). Analysis performed in FRIDGE chamber provided the INP concentrations for these cases. The in situ samples were analyzed at −20, −25 and −30 ∘C. For the deposition nucleation (Figs. 9a and 10a), the samples were analyzed at a RHw of 95 %, 97 % and 99 %, leading to three values of Sice for each temperature (1.16, 1.18 and 1.23 for −20 ∘C; 1.21, 1.24 and 1.26 for −25 ∘C; and 1.27, 1.30 and 1.33 for −30 ∘C). For the immersion freezing (Fig. 9b), the samples were analyzed at a RHw of 101 %, leading to Sice of 1.23, 1.29 and 1.35 for the temperatures of −20, −25 and −30 ∘C, respectively. For ∘C, RHw = 101 % and Sice = 1.23, we refer to the freezing process as condensation freezing.
The sample of 21 April was analyzed by single-particle analysis using a scanning electron microscope, which showed that 99 % of the particles were dust and 1 % was Ca sulfates and carbonaceous particles (Schrod et al., 2017). This sample is used in order to evaluate the performance of the nINP lidar estimates in a pure-dust case, where (i) the errors originating from the first step of our methodology (separation in dust and nondust aerosol components) are small (∼30 %) and (ii) the uncertainties induced from the D10 and U17(soot) parameterizations are minimal. Figure 9 shows the nINP on 21 April as they were calculated from the CALIPSO lidar measurements (colored symbols) and measured from the UAV-FRIDGE samples (black triangles), (panel a) for deposition nucleation (as a function of saturation over ice) and (panel b) for condensation and immersion freezing (as a function of temperature).
Likewise, we are using all the aforementioned cases in order to evaluate the performance of the nINP lidar estimates in cases with dust and continental aerosols. Figure 10 shows scatter plots of all the lidar-estimated nINP (from PollyXT and CALIPSO) against the in situ measurements for (panel a) deposition nucleation and (panel b) condensation and immersion freezing. In Fig. 10b the ratio between the lidar-derived and the in situ nINP is provided as a function of temperature. Similar results are observed for both the pure-dust (Fig. 9) and the dust and continental cases (Fig. 10), with the lidar-estimated nINP during the pure-dust event to show the best agreement with the in situ measurements.
For the nINP retrievals in the deposition mode we see that using the U17-dep in a dust case the lidar-derived concentrations are in excellent agreement with the in situ observations (well within their uncertainties), with nINP values to span over 2.5 orders of magnitude (for different ice supersaturation conditions) and the retrievals to capture the whole extent of this range (Fig. 9a). The lidar-retrieved U17-dep values in this case are dominated by the dust-related nINP (estimated from Eq. 3; Table 1), with the nondust-related nINP (estimated from Eq. 6; Table 1) being 5 orders of magnitude lower. In dust and continental cases (Fig. 10a), 97 % of all the U17-dep lidar-derived nINP are within the error bars of the in situ measurements and within a factor of 10 around the 1:1 line (r=0.75). The nINP sampled with the UAVs ranged between 0.02 and 20 L−1. Using S15 parameterization, the predicted nINP values are 3 to 5 orders of magnitude larger than the in situ measurements in both dust and dust–continental cases (r=0.42). An overestimation was already expected as discussed in Sect. 2 and Steinke et al. (2015), but for completeness we include these results.
Figures 9b and 10b show the lidar-derived immersion/condensation INPs. U17-imm dust-related nINP values are calculated using the INP parameterization of Eq. (1) (Table 1) with the Sd,dry from Eq. (9) (Table 3). The D15 dust-related nINP are calculated using Eq. (2) (Table 1) with the from Eq. (8) (Table 3). The D10 continental-related nINP are calculated using Eq. (7) (Table 1) with the from Eq. (10) (Table 3). The D15 + D10 values for the total (dust + continental) aerosol in the scene are the summation of the aforementioned D15 (dust-related) and D10 (continental-related) nINP calculations (See Figs. A1 and A2 in Appendix). We did not include the U17-imm soot estimates in the plot since these are quite similar to the estimated values from D10 at temperatures ∘C (Sect. 2; Fig. 1). Consequently, for the total INP load in the scene, the estimations provided from D15 + D10 are similar to the ones provided from D15 + U17-imm(soot). In the rest of this paper, we will discuss only the joint D15 + D10 estimates, keeping in mind that the same conclusions apply for the joint D15 + U17-imm(soot) estimates.
In Figs. 9b and 10b we see that the lidar-derived nINP using D15 for dust and D10 for continental particles are in good agreement with the in situ observations, within the respective uncertainties for the samples analyzed at −20 and −25 ∘C. The best nINP agreement is observed for the pure-dust sample analyzed under condensation freezing conditions (at −20 ∘C): with in situ measurements of 3.6±0.1 L−1 and lidar-derived D15 + D10 estimates of 3.8 L−1. From them, 2.4 L−1 originated from the D15 dust contribution and 1.4 L−1 from the D10 nondust contribution (although the contribution from the nondust INP at lower temperatures was insignificant with nondust concentrations 1 order of magnitude lower than the dust ones). Using all the dust and continental cases we see that, for the samples analyzed under condensation freezing conditions, the D15 + D10 estimated nINP are no more than 2.5 times higher than the in situ measurements (Fig. 10b). Larger differences are observed at the temperatures where immersion freezing dominates over condensation as the main INP pathway, with 1.5–7 times larger values at −25 ∘C and 4–13 times larger values at −30 ∘C. Indicatively, for the pure-dust case, at ∘C the in situ nINP were 12±3 L−1 and the D15 + D10 lidar-derived nINP were 26 L−1 (with a negative error of 14 L−1). At ∘C, the in situ nINP were 62±14 L−1 while D15 + D10 nINP estimates were 1 order of magnitude higher (242 L−1). Overall, in 85 % of the analyzed cases, the D15 + D10 lidar retrievals are less than an order of magnitude higher than the UAV measurements. Regarding the U17-imm lidar-derived nINP values, they are overall 1 to 3 orders of magnitude higher than the in situ ones. In particular they are 3–11, 2–80 and 2–1000 times larger than the samples analyzed at FRIDGE chamber at −20, −25 and −30 ∘C, respectively. Nevertheless, the in situ observations are within the uncertainty of the parameterization for all the cases. Indicatively, for the pure-dust case, the U17-imm lidar-derived nINP values are 50 L−1 at ∘C. Recent comparisons of nINP derived from samples analyzed in the FRIDGE chamber usually present good linear correlations but somewhat lower values with observations derived from pure immersion paths (e.g., D15) (DeMott et al., 2018). Possible reasons for these discrepancies may be (a) deficits and inadequacies in instrumentation and measurement techniques, (b) the lacking overlap of the freezing modes, (c) inconsistencies between the inlet systems of the parameterization measurement (using cutoffs) and the in situ measurements (using no cutoff), and (d) a variation in RHw (D15: 105 %; FRIDGE: 101 %) (Schrod et al., 2017).
The error bars of the lidar-based nINP estimations in Figs. 9 and 10 are calculated using Gaussian error propagation together with the typical uncertainties provided in Table 2. In DeMott et al. (2015), a standard deviation of 2 orders of magnitude is reported as the uncertainty of the D15 parameterization. In the same plots, the uncertainty of the nINP from in situ data is very low. Under most experimental conditions, the repeatability of the ice nucleation in the FRIDGE chamber dominates other uncertainties. An uncertainty of 20 % has been suggested as a useful guideline for the uncertainty of the intrinsic measurements, corresponding to the statistical reproducibility of an individual sample. However, it has also been reported that natural variability by far outweighs the intrinsic uncertainty (Schrod et al., 2016). We need to consider the full uncertainty including precision and accuracy. The DeMott et al. (2018) intercomparison of INP methods saw that at all temperatures and for various test aerosols the nINP uncertainty for immersion freezing is 1 order of magnitude, while for deposition condensation the uncertainty is expected to be even larger.
Our analysis suggests that the D15 + D10 (and D15 + U17-imm(soot)) immersion/condensation parameterization (applicable for the temperature range −35 to −9 ∘C) and the U17-dep parameterization (applicable for the temperature range −50 to −33 ∘C) agree well with in situ observations of nINP and can provide good nINP estimates in pure-dust and dust–continental environments. The U17-imm pure immersion parameterization provides values 1–2 orders of magnitude larger; we therefore consider the nINP estimates according to D15 + D10 as the lower boundary of possible values, with the actual values being up to 1 order of magnitude larger in the temperature regime of immersion freezing.
4.3 nINP profiles from PollyXT and CALIOP during the evolution of mixed-phase clouds in a Saharan dust event
The case study of 21 April 2016 demonstrates the feasibility of the proposed methodology to provide profiles of cloud-relevant aerosol parameters up to the cloud levels, using (ground-based and spaceborne) lidar measurements. In particular for this case, the temporarily averaged PollyXT lidar observations at 01:00–02:00 UTC and the spatially averaged CALIPSO observations at 11:01 UTC provide us the information of the n250,dry, Sdry and nINP right before and after the cloud event which was formed inside the dust layer that day between 02:00 and 10:45 UTC. The profiles of n250,dry and Sdry before (PollyXT) and after (CALIPSO) the cloud event are the ones already presented in Fig. 6. As discussed above, the dust plume declined by approximately 300 m during that period while its nINP stayed relatively constant inside its dense part. Above the main dust layer the aerosol conditions were variable, with multiple thin layers present up to 8 km altitude only before the appearance of the clouds. Specifically, a contribution of nondust continental particles is observed between 5.6 and 8 km a.g.l. ( cm−3; Fig. 6d), and three thin dust layers are visible at 6.4, 6.8 and 7.8 km with dust n250,dry of 2.9, 1.5 and 2.0 cm−3, respectively, and a local minimum at 7.55 km (0.01 cm−3) (Fig. 6c). Figure 11 shows the nINP concentrations derived from the different parameterizations at altitudes between 3 and 8 km a.g.l. From the WRF and MERRA-2 assimilations we see that ∘C in heights up to 7.8 km a.g.l., which indicates that the immersion freezing mechanism is dominant in this case and that the deposition nucleation mechanism is not significant.
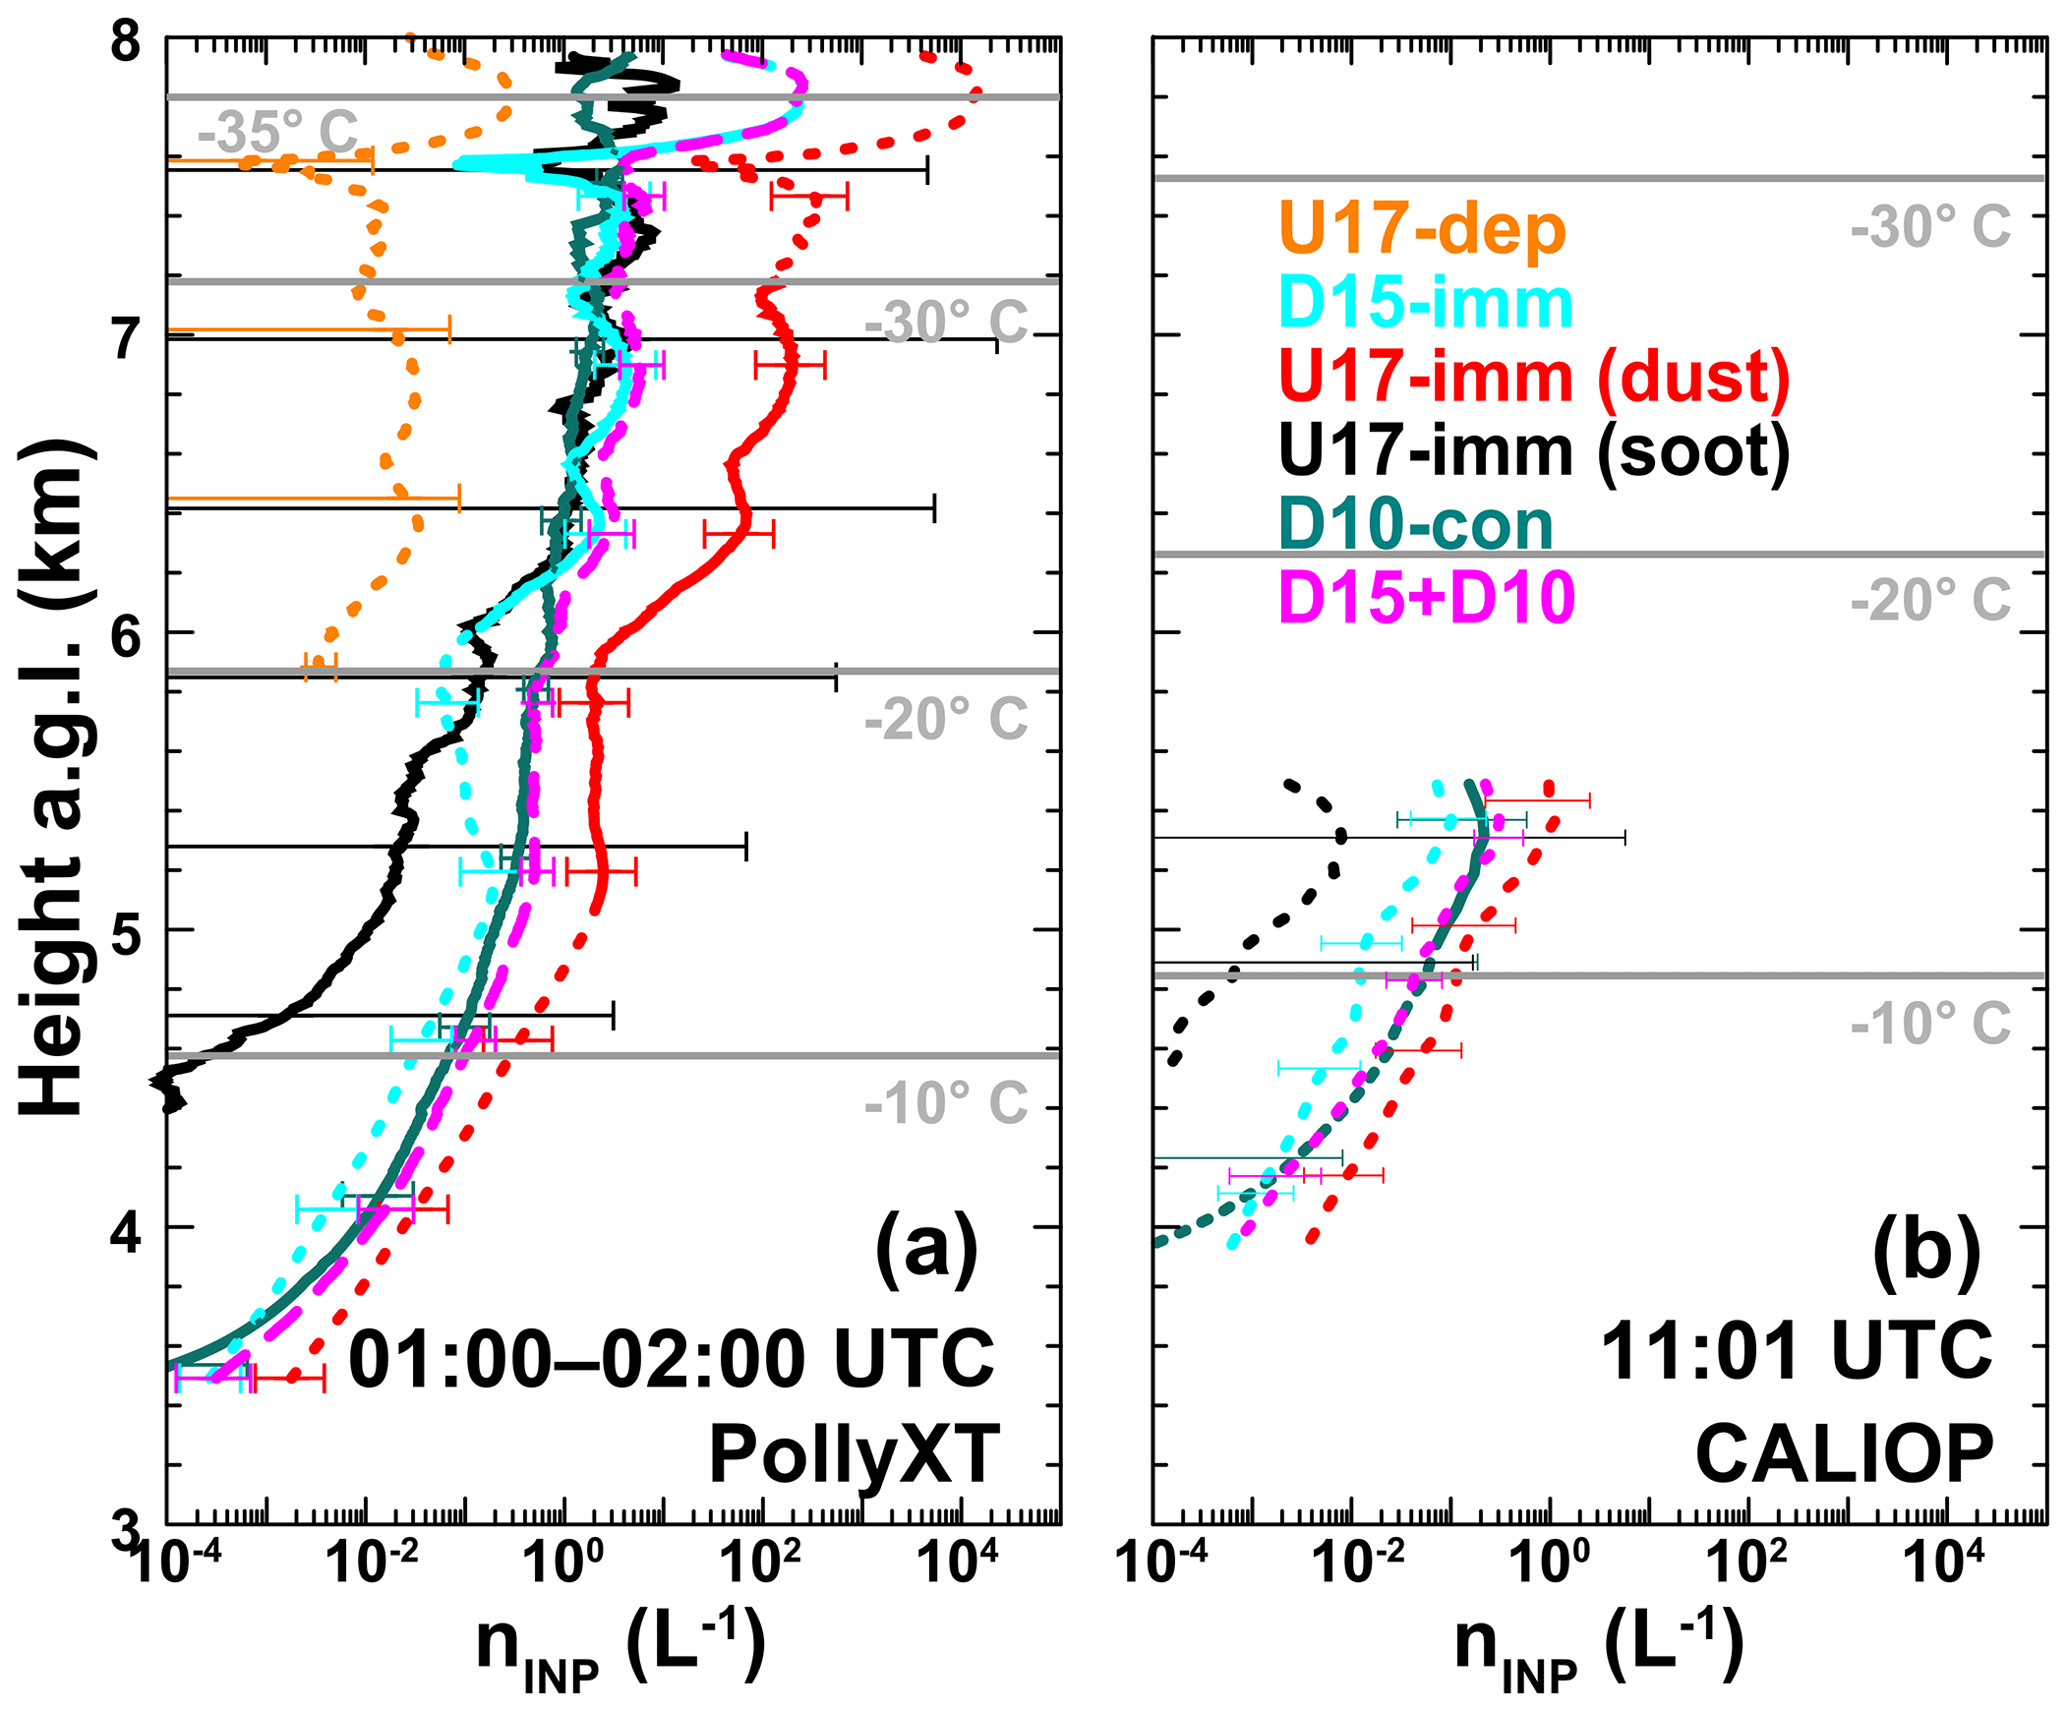
Figure 11INP concentration profiles estimated from the measurements with (a) PollyXT between 01:00 and 02:00 UTC on 21 April 2016 and (b) CALIOP at 11:01 UTC on 21 April 2016. Temperature levels are derived from the WRF and MERRA-2 models. Colors refer to different INP parameterizations. Solid lines mark the temperature range for which the corresponding parameterization has been developed. Dashed lines refer to the extrapolated temperature range (see Table 1).
Figure 11a shows that before the cloud formation the nondust aerosols contribute to a gradual increase in nINP per height from ∼0.04 L−1 (4.5 km; −10 ∘C) up to ∼0.4 L−1 (5.8 km; −20 ∘C) and 4 L−1 (7.8 km; −34 ∘C) (based on D10). Using U17-imm for soot we derived the nINP for the relevant nondust particles of 10−4 L−1 (−10 ∘C), 0.04 L−1 (−20 ∘C) and 8 L−1 (−34 ∘C). Figure 11a shows here again the relatively good agreement between the lidar-derived nondust nINP using D10 and U17-imm parameterizations at ∘C and their significant discrepancies at lower temperatures. The dust aerosols in the scene contribute to a gradual increase in nINP inside the main dust layer from 0.05 L−1 (4.5 km; −10 ∘C) to ∼0.4 L−1 (5.3 km; −14 ∘C). Then a decrease of 1 order of magnitude is observed up to 6 km (0.06 L−1; −20 ∘C) at the top end of the main dust layer. Above this altitude, a wavy nINP profile is observed with local maxima at 6.5, 7.0 and 7.9 km of 2 L−1 (−22 ∘C), 4 L−1 (−25 ∘C) and 200 L−1 (−33 ∘C). The aforementioned values correspond to D15 estimates. The U17-imm dust estimates are 60 L−1 (−22 ∘C), 200 L−1 (−25 ∘C) and 1000 L−1 (−33 ∘C). Overall, 91 % of the total nINP is attributed to dust aerosols (D15) and 9 % to nondust continental aerosols (D10) at altitudes between 6.3 and 8 km (temperatures ∘C). These abundances are reversed inside the main dust layer (altitudes between 4 and 5.5 km; temperatures: [−20,−6] ∘C) where 34 % of the total nINP is attributed to dust aerosols (0.06 L−1) and 66 % to nondust aerosols (0.12 L−1). Shortly after the period analyzed here, mixed-phase clouds are observed above Nicosia at first at altitudes between 5 and 7 km and during the rest of the cloudy period mainly above 4 km (Fig. 4).
Figure 11b show the lidar-derived nINP above the station shortly after the end of the cloudy conditions. At that time, the main dust layer is observed at altitudes up to 5.5 km without additional layers above it. These observations are close to the local noon, with the air temperature above the station being increased by 2.7∘, leading to temperatures of 0 ∘C at 3.6 km and −15 ∘C at 5.4 km a.g.l. At these altitudes, a relatively constant contribution of nondust particles is present ( cm−3; Fig. 6d), which leads to a gradual increase in the nondust nINP per height from L−1 (4 km; −2 ∘C) to 10−2 L−1 (4.4 km; −5 ∘C) to 0.2 L−1 (5.3 km; −12 ∘C) (D10 estimates). Additionally, the dust concentration per altitude is constant inside the dust layer and is decreased gradually above 4.6 km (n250,dry = 16 cm−3; 4–4.6 km; Fig. 6c). The dust-related nINP per height are L−1 (4 km; −2 ∘C), L−1 (4.4 km; −5 ∘C) and 0.1 L−1 (5.3 km; −12 ∘C) (D10 estimates). Overall, 25 % of the total nINP is attributed to dust aerosols (D15) and 75 % to nondust aerosols (D10) at altitudes between 3.8 and 5.6 km.
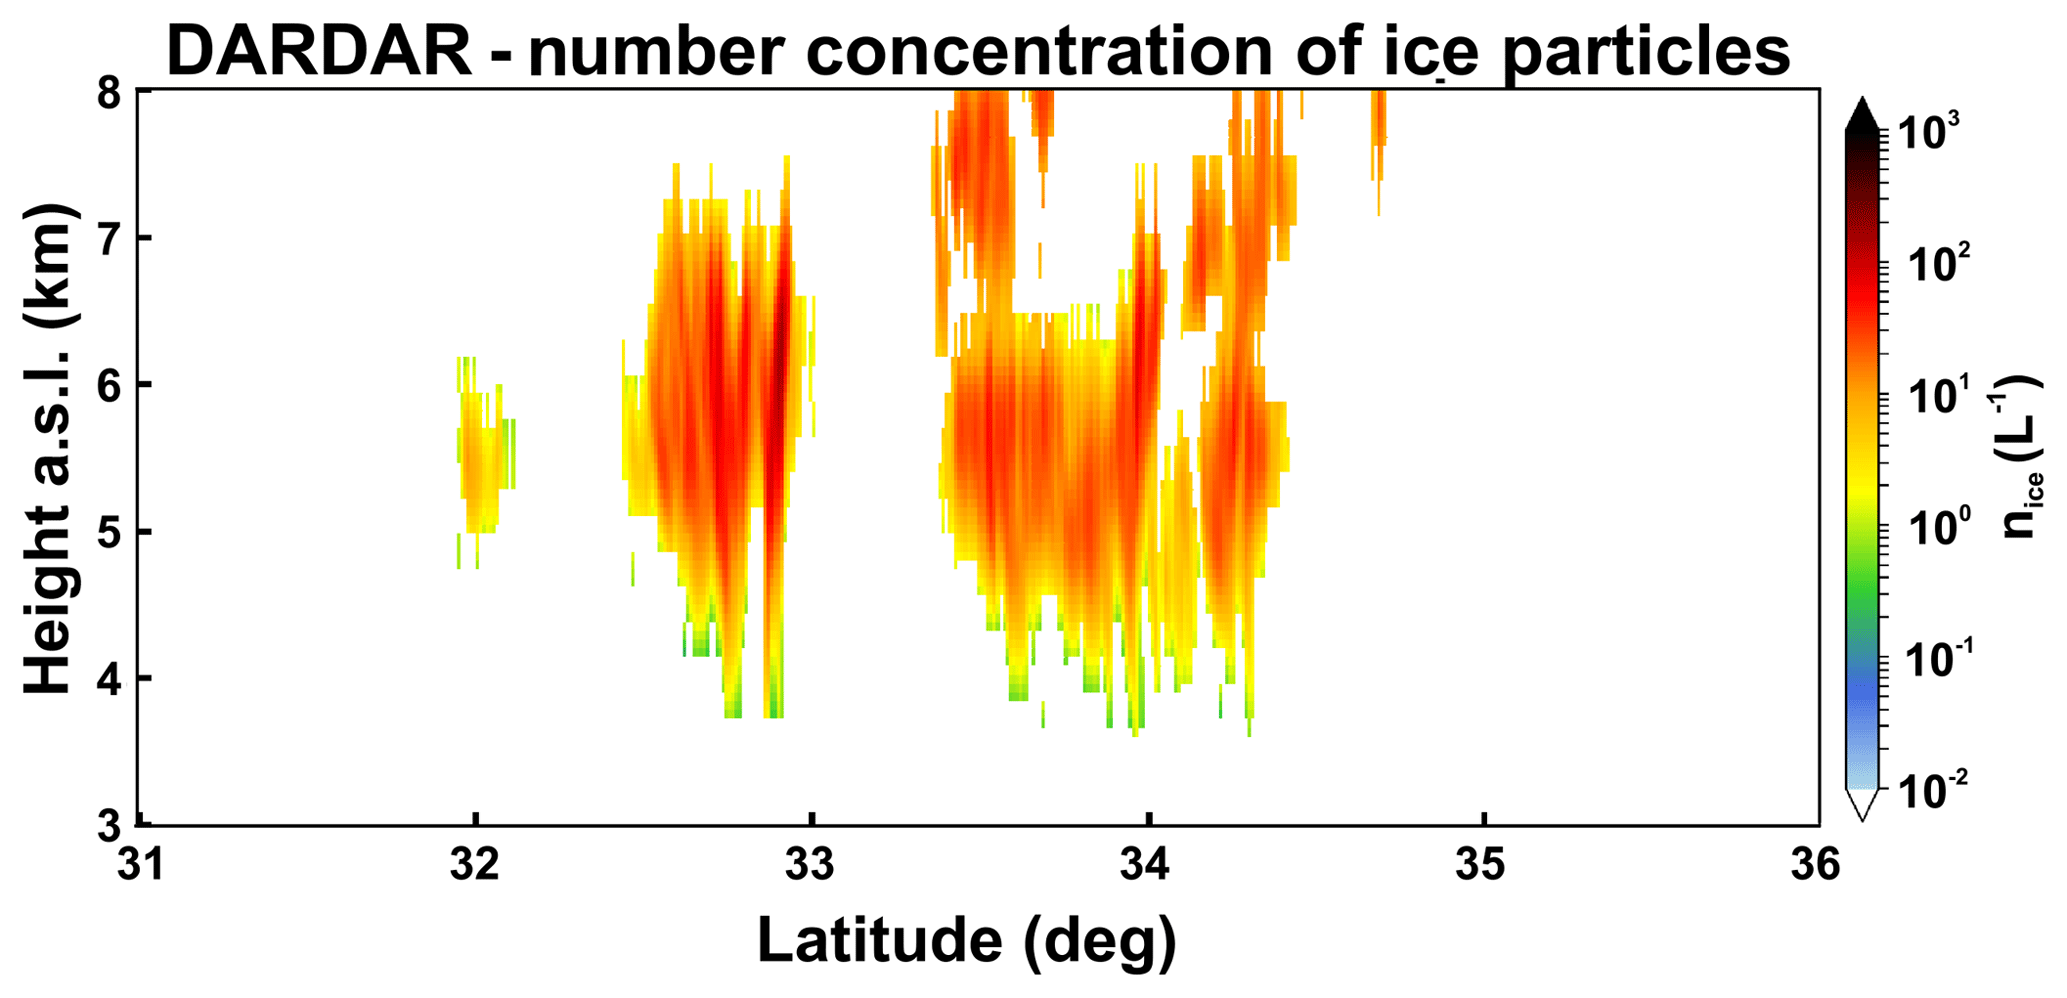
Figure 12Spatial distribution of the DARDAR ice particle number concentrations at 11:01 UTC on 21 April 2016.
Taking into consideration all the aerosols, the nINP before and after the cloud development is ∼0.6 L−1 and ∼0.1 L−1 respectively at 5.3 km altitude (D15 + D10 in Fig. 6). This difference is due to the increase in the air temperature during the day and the decrease in n250,dry and Sdry. Before the cloud formation, the nINP values at [6, 7.5] km are 1 order of magnitude larger than at 5.3 km (∼3 L−1), and they are 2 orders of magnitude higher at 7.8 km than at 6 km (200 L−1). These results indicate that the particles in the main dust layer and the thin layers above it acted as seeding INPs for the cloud that formed in that layer, affecting also its characteristics. However, further measurements are necessary to reach a more concrete conclusion, for example, measurements of the atmosphere dynamics (e.g., from a wind lidar) and observations of the cloud evolution (e.g., from a cloud radar as in the recent study of Ansmann et al., 2019). Although these measurements are absent from our ground-based instrumentation, we utilize the DARDAR-Nice product (based on the CLOUDSAT and CALIPSO observations on 21 April 2016 – Fig. 5) as a hint for the true nINP of the scene, and we compare them with the neighboring CALIPSO nINP estimates.
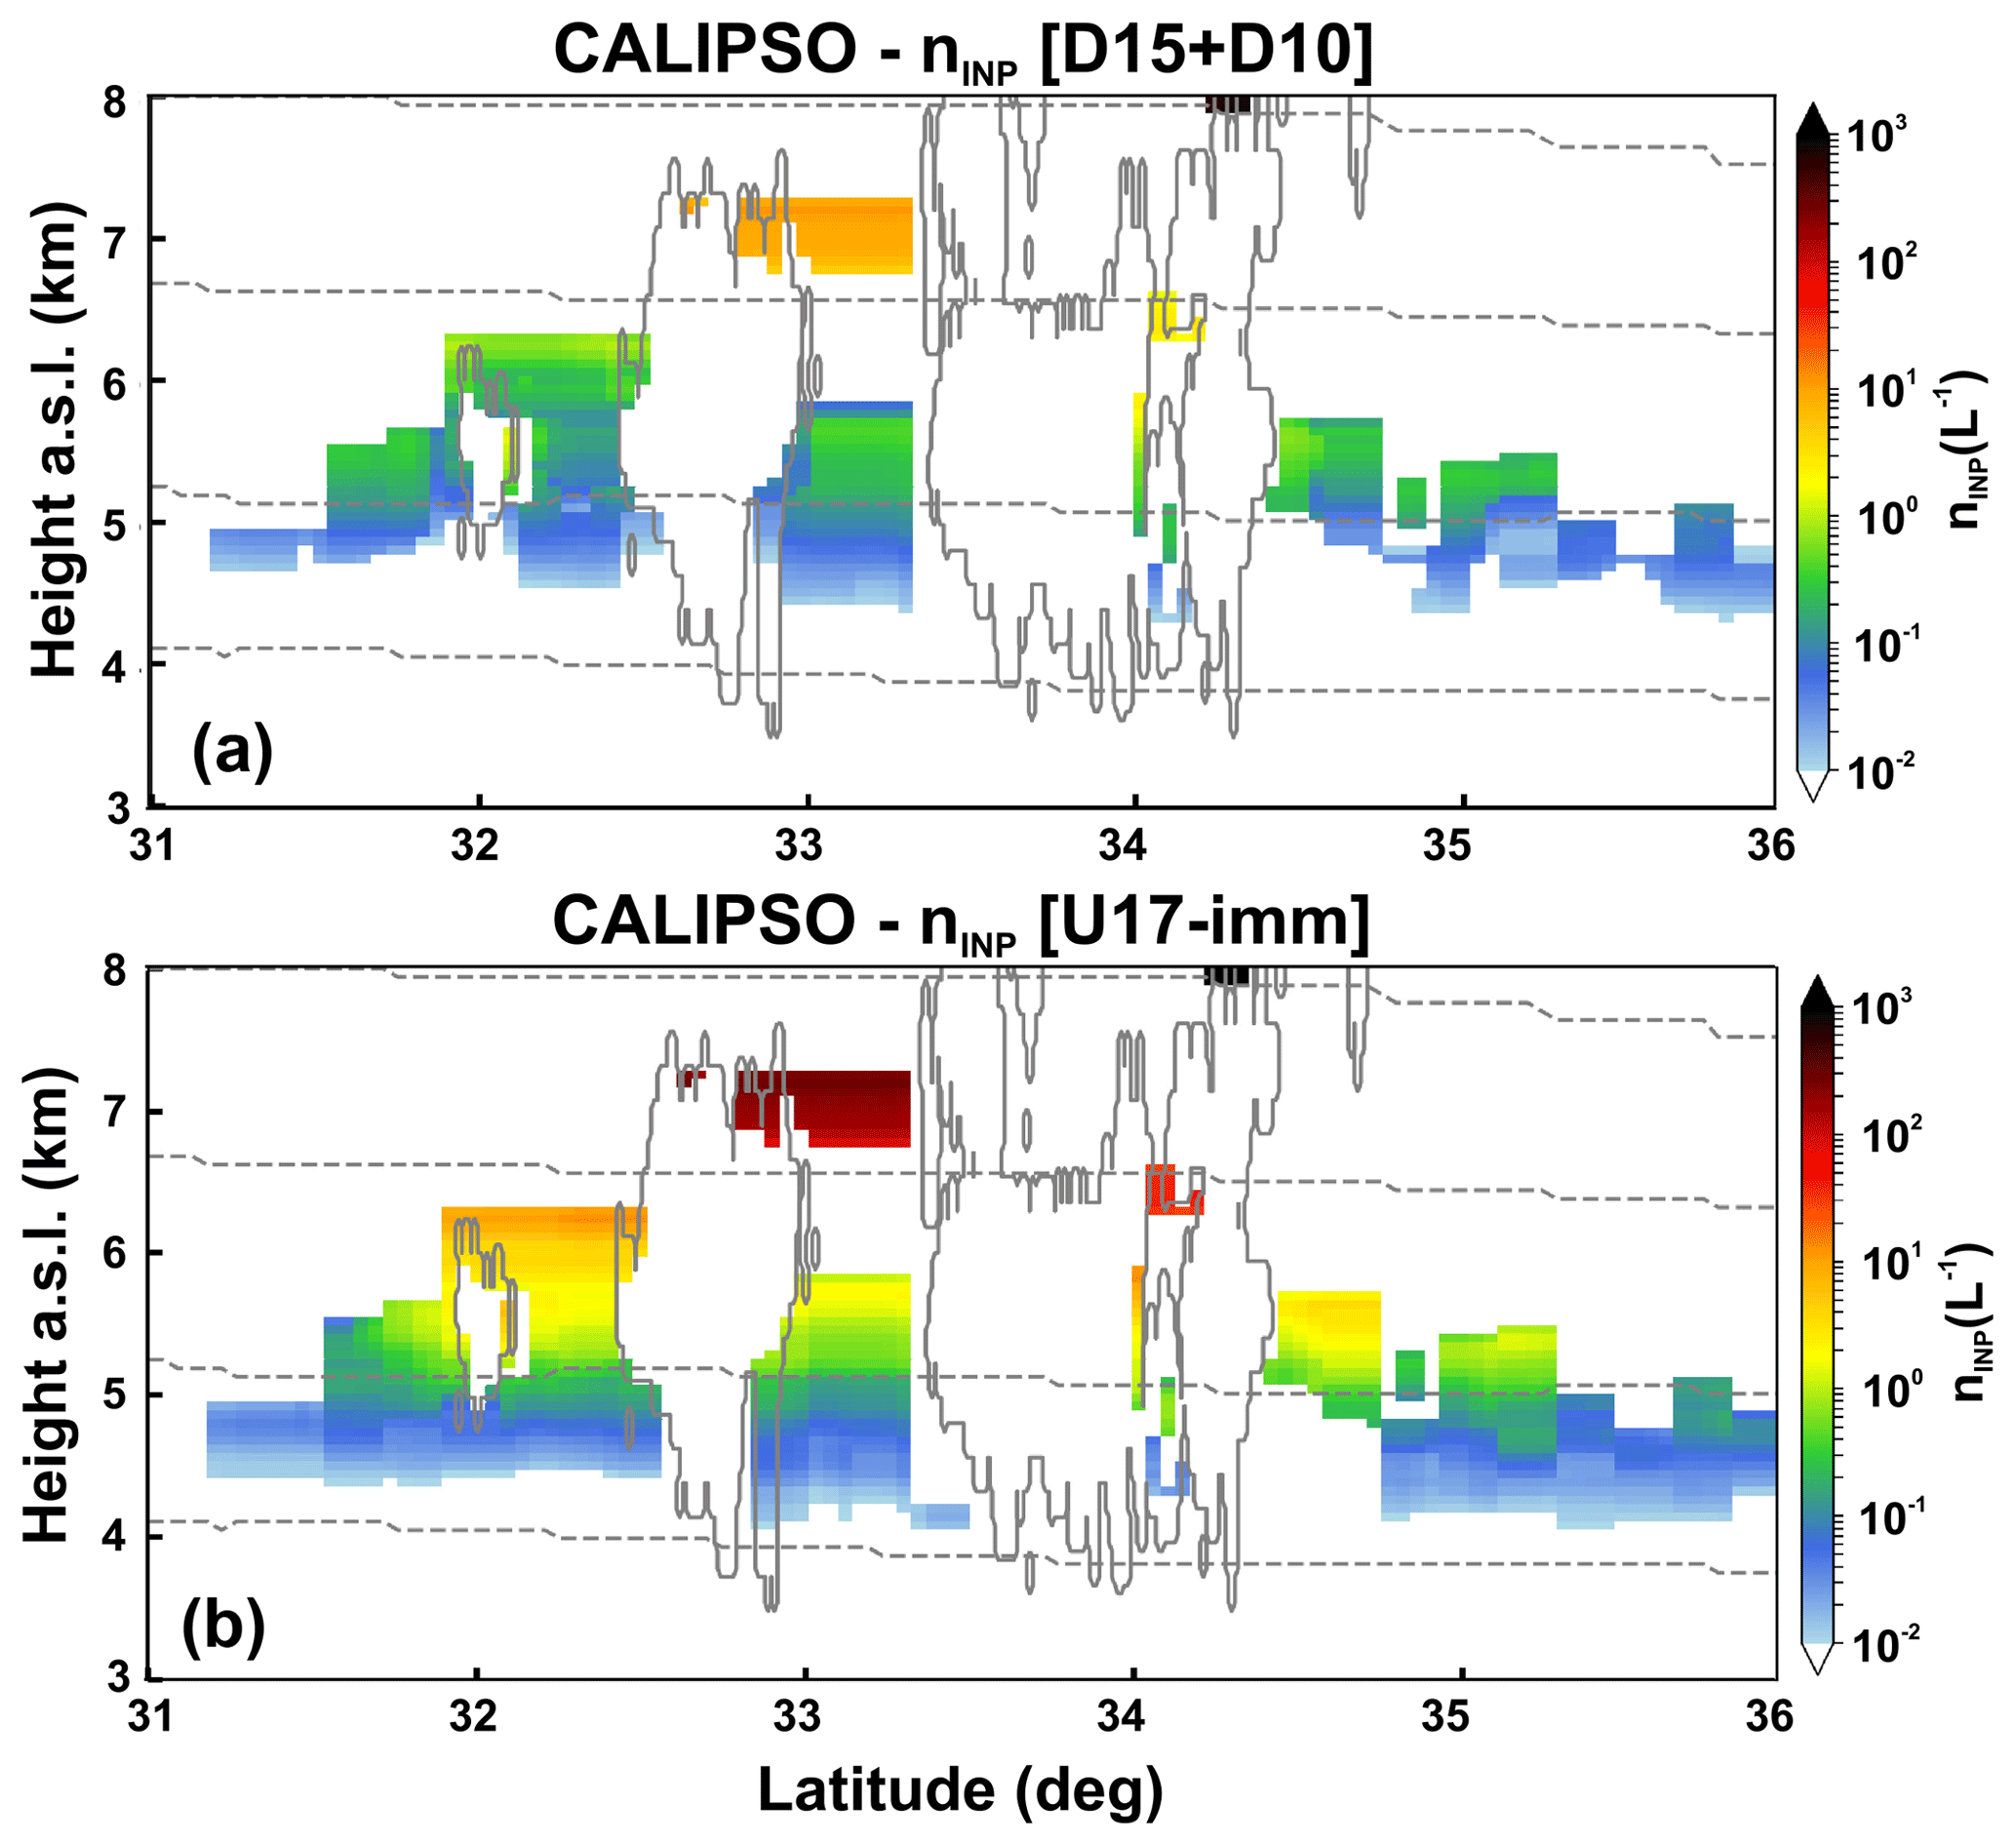
Figure 13Spatial distribution of the INP concentrations during the event of 21 April 2016 at 11:01 UTC, as derived with the D15 + D10 (a) and U17-imm (b) parameterizations. The location of the clouds observed is depicted with gray contours. The dotted lines correspond to and −30 ∘C, based on the MERRA-2 model.
Figure 12 shows the DARDAR nice estimations along the A-Train track (presented in Fig. 5), and Fig. 13 shows the nINP calculations on the same curtain using the D15 + D10 (upper panel) and U17-imm (lower panel) parametrizations. Clouds are formed on top of the dust layer at latitudes of 32, 32.8 and 34∘ N. The clouds observed at 32 and 32.8∘ N are coupled with an aerosol layer at their cloud top, at altitudes of 6.3 and 7.3 km and temperatures of −18 and −25 ∘C respectively. Figure 14 shows the nice profiles derived in these two clouds, along with the nINP profiles estimates in their vicinity. Due to the strong INP number increase with deceasing temperature, the highest nINP concentrations are observed at the top of the upper aerosol–cloud layers. We assume that the ice crystals in these two clouds nucleate close to the cloud top (where the coldest temperatures are observed) and that afterwards the crystals grow and fall through the lower heights of the clouds formed. Moreover, we consider that no secondary ice production (SIP) processes are present in these clouds, or at least their contribution to the nice is insignificant, as the cloud top temperatures are much lower than the temperatures where SIP has been observed (between −3 and −8 ∘C) (Hallett and Mossop, 1974; Field et al., 2017; Sullivan et al., 2017, 2018). We compare the nINP at cloud top height with the nice inside the cloud, having in mind that, with our hypotheses, the nice values can be up to the nINP values if all the INPs are activated to ice crystals. For the smaller cloud, at ∼32 ∘ N, nice between 0.8 and 8 L−1 are retrieved, and nINP between 0.3 to 2 and 4 to 20 L−1 are estimated with the D15 + D10 and the U17-imm respectively. For the cloud at ∼32.8 ∘ N, nice between 0.4 and 60 L−1 are retrieved, and nINP between 3 to 20 L−1 and 100 to 400 L−1 are estimated with the D15 + D10 and the U17-imm respectively. Overall, in these two clouds the nINP estimates in the top of the clouds have an uncertainty of 1–2 orders of magnitude in their estimates and differences of 1 order of magnitude in the retrievals between each other. Additionally the retrieved DARDAR profiles provide us only with a hint of the order of magnitude of the true nice. Nevertheless the nice estimates are between the estimated nINP values and within the errors of the two parameterizations. These results strengthen our conclusion that we can use the lidar-derived nINP from D15 + D10 and U17-imm to estimate a minimum and maximum boundary of the nice in a cloud formed in their presence, when immersion is the dominant mechanism.
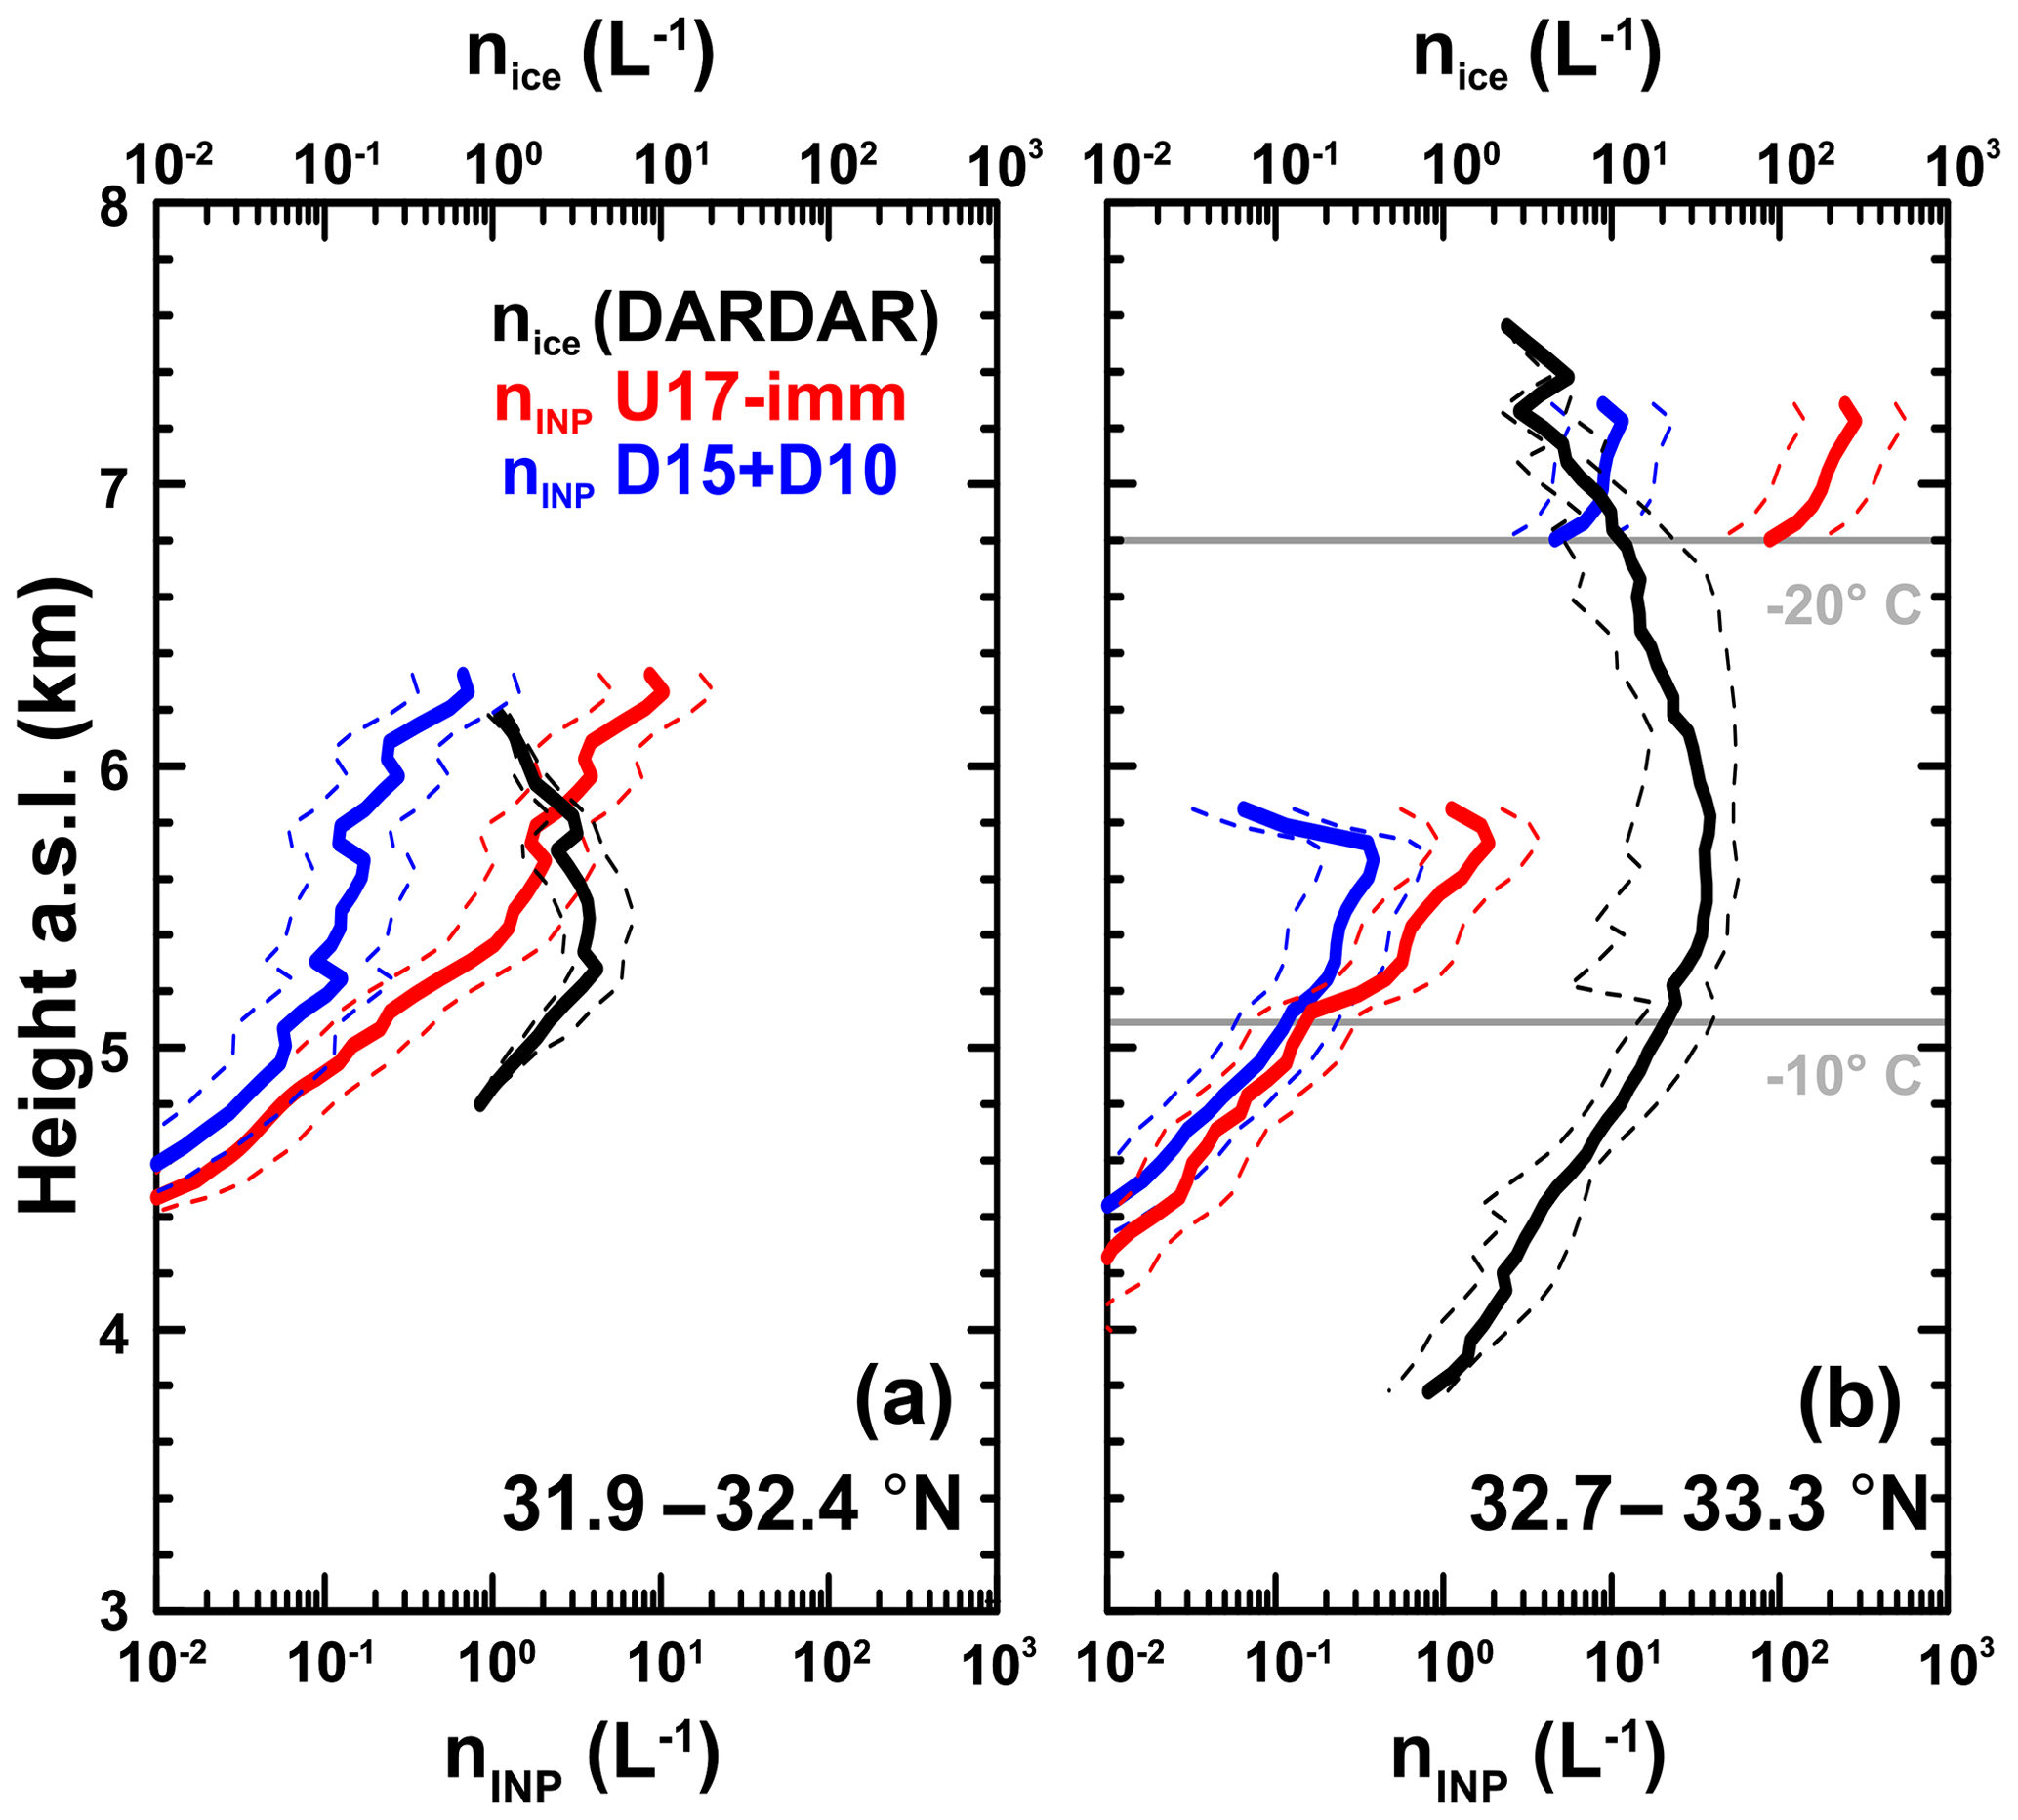
Figure 14Concentration profiles of nINP and nice from the A-Train measurements presented in Figs. 12 and 13 for the areas of (a) 31.9 to 32.4 ∘ N and (b) 32.7 to 33.3 ∘ N. The nINP dotted lines denote the uncertainties of the estimations. The nice dotted lines correspond to the 25 % and 75 % percentiles of the concentrations retrieved in the cloud. The overall uncertainty of the retrievals is discussed in the main text. The indicative temperature lines are from the MERRA-2 model.
We present a methodology for deriving nINP profiles from lidar measurements and a comparison with in situ UAV measurements of nINP. More specifically, seven INP parameterizations are tested to obtain lidar (ground-based and spaceborne) nINP estimates representative of mineral dust and continental, pollution or soot aerosol. We prove that a compilation of the parameterizations of DeMott et al. (2015) (D15) and DeMott et al. (2010) (D10), for dust and non dust particles respectively, is in agreement with airborne in situ measurements (Schrod et al., 2017) for addressing immersion/condensation freezing (at ∘C). A similar conclusion is derived from the compilation of the parameterizations of DeMott et al. (2015) (D15) for dust and Ullrich et al. (2017) (U17) for soot. Specifically, lidar-derived nINP using D15 + D10 (and D15 + U17-imm(soot)) agree with the in situ measurements within the reported uncertainty range of the D15 parameterization (i.e., 2 orders of magnitude; DeMott et al., 2015). The best assessment for the deposition-related INPs is derived with the Ullrich et al. (2017) deposition nucleation parameterization for dust and soot (for ∘C), with results agreeing with the UAV-FRIDGE measurements within 1 order of magnitude for different values of ice supersaturation.
The cloud-relevant aerosol parameters necessary for INP estimations (n250,dry and Sdry) are derived from lidar measurements as shown by Mamouri and Ansmann (2015, 2016). The comparison between the lidar-derived concentrations of dry particles with radii larger than 250 nm with coincident UAV-OPC in situ measurements showed a good agreement with slightly lower values (32 %) for the n250,dry derived by the lidar. This effect is less pronounced at low concentrations with a squared correlation coefficient of 0.98. For the majority of the cases, we find that in situ observations and remote-sensing estimates are in agreement within their uncertainty ranges.
A further step for improving the lidar-derived INP retrievals and investigating the different parametrizations used is by conducting dedicated studies with collocated lidar measurements and additional temperature and humidity profiling in order to calculate the INP concentrations at real conditions, as well as the combination of the retrieved nINP with airborne in situ ice concentration measurements.
Our methodology is validated for cases with dust presence. Additional measurements are required in order to define the optimum INP parameterizations for nondust atmospheric conditions (e.g., continental, marine, smoke). Future experimental INP campaigns with airborne in situ observations from aircrafts (including UAVs) collocated with lidar measurements at pure marine conditions and at mixed aerosol conditions could provide an ideal setup for an in-depth investigation of the potential of the lidar-based INP profiles in complex and nondust atmospheric conditions.
The results presented in this study give us confidence to proceed to the next step, which is to combine cloud-relevant lidar aerosol and wind parameters and cloud radar height-resolved observations to monitor the evolution of clouds embedded in aerosol layers. This will provide a unique opportunity to better understand aerosol–cloud interactions in the field of heterogeneous ice formation.
Moreover, the study enhances the confidence for the production of global 3-D products of n250,dry, Sdry and nINP from the CALIPSO dataset. The application of our methodology to CALIPSO measurements of more than a decade long could provide valuable insight into the global height-resolved distribution of n250,dry and nINP related to mineral dust, as well as possibly other aerosol types. This will enable worldwide studies of aerosol–cloud interactions to combine the new product with satellite radar observations (CloudSat) and the upcoming EarthCARE (Earth Cloud Aerosol and Radiation Explorer) mission.
A challenge of a new global INP climatology will be the assessment of its underestimation at high altitudes where it is known that CALIPSO observations can miss thin layers with small concentrations. A way to investigate the effect of the satellite-undetected layers in the n250,dry, Sdry and nINP CALIPSO products is the utilization of ground-based lidar network observations such as EARLINET and PollyNet.
The satellite products used in this study are the CALIPSO 5 km aerosol profile product (Vaughan et al., 2019) publicly available at the NASA Atmospheric Science Data Center (Nasa Atmospheric Science data center, 2019); the DARDAR-Mask v1.1.4 product (Ceccaldi et al., 2013) as well as the DARDAR-Cloud v2.1.1 retrieval product (Delanoë, et al., 2014), both publicly available on the AERIS/ICARE database (ICARE data and services center, 2019); and The MODIS Corrected Reflectance (True Color) images (Gumley et al., 2010) publicly available on the NASA Worldview center (NASA Worldview snapshots application center, 2019). The in situ INP data used in this study can be accessed through the BACCHUS database of INP observations (BACCHUS Ice Nucleation DataBase, 2019). The database is accessible to members only, but membership is free. The PollyXT observations (level 0 data of measured signals and level 2 data of backscatter coefficient and depolarization profiles), the in situ OPC measurement and the WRF modeled profiles used in this study can be accessed through the REACT database (Marinou et al., 2019). All datasets created during the calculation of the lidar-based number concentrations and the correction of the in situ OPC number concentrations will be provided upon request.
A1 Methodological diagram for the analysis of the ground-based lidar measurements
The Fig. A1 illustrates the general idea of the methodology followed for the INP estimations from the PollyXT measurements. The equations for the conversions of the measured optical properties into the microphysical properties are provided in Table 3. The equations for the conversions of the microphysical properties to INPs are provided in Table 1.
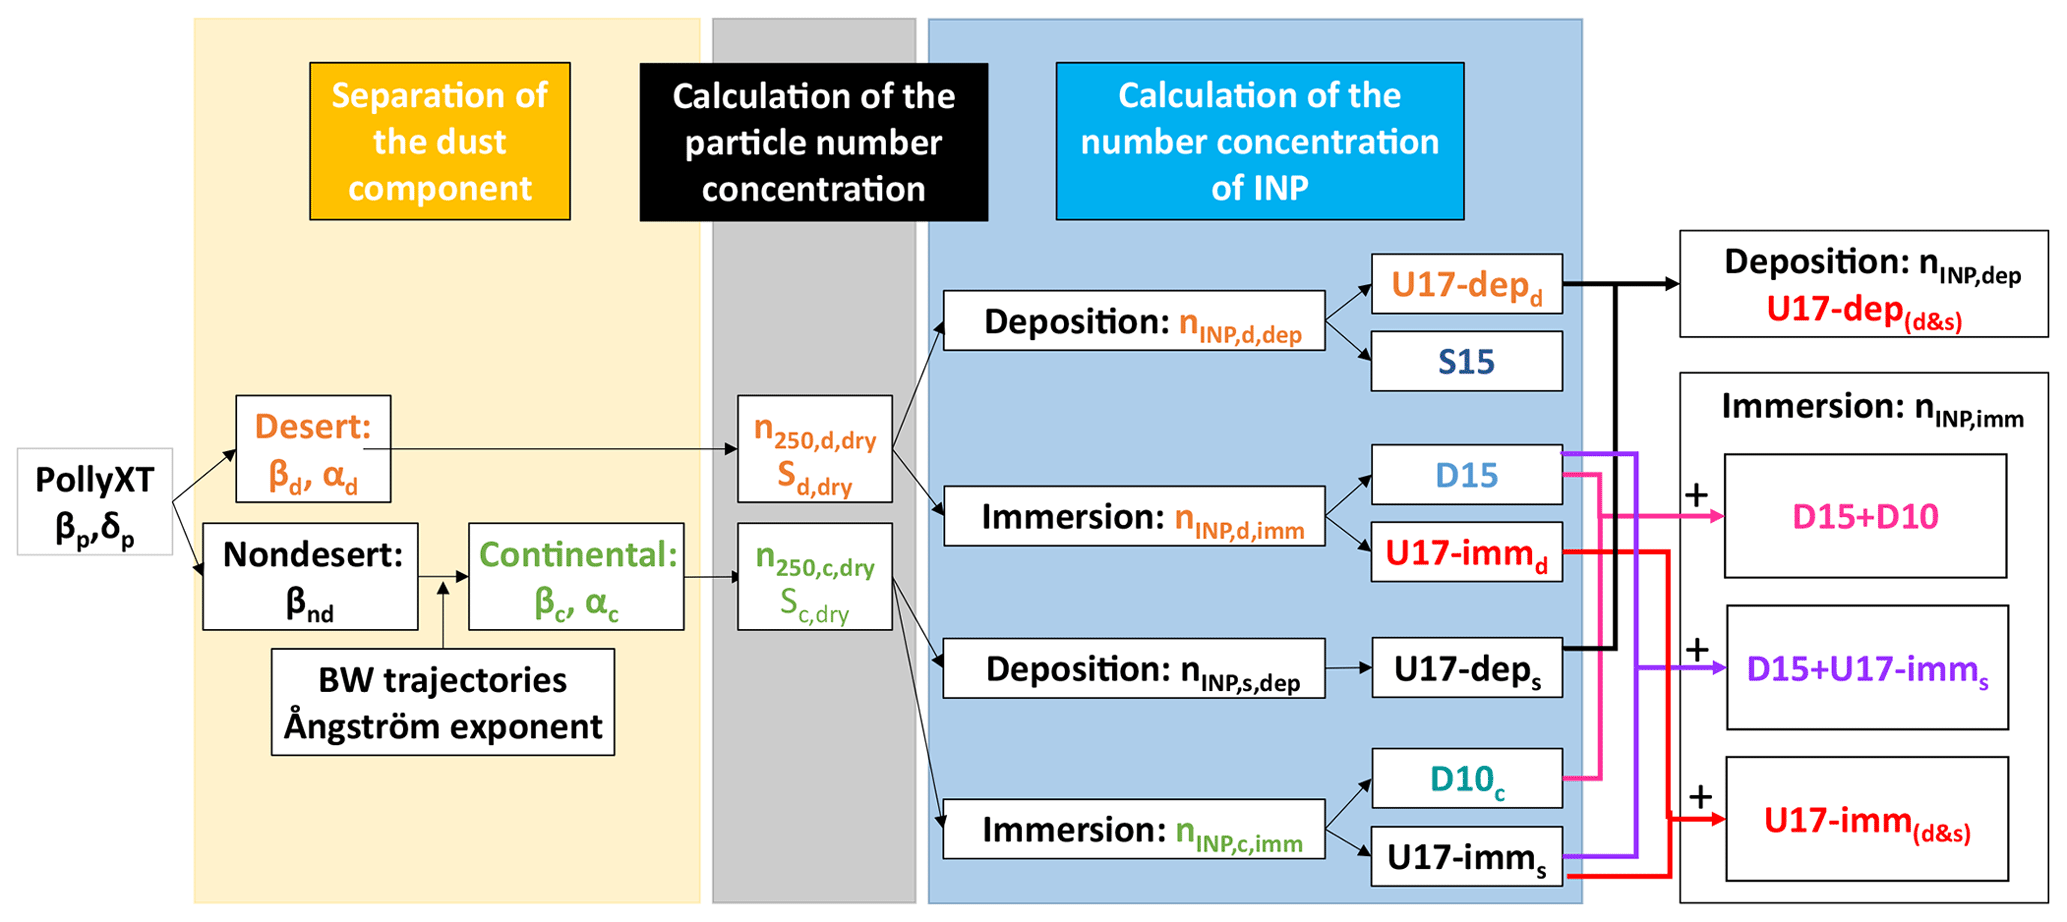
Figure A1Overview of the data analysis scheme followed for the PollyXT measurements in this work. In the first step, we separate desert and nondesert backscatter coefficients (βd and βnd) by means of the particle linear depolarization ratio (δp). The backscatter coefficients for the nondesert aerosol are estimated to be continental aerosol mixtures βc by means of, e.g., backward (BW) trajectory analysis and Ångström exponent information. The two backscatter coefficients are then converted to aerosol type-dependent particle extinction coefficients (αi). In the next step, the extinction coefficients are converted to aerosol type-dependent profiles of particle number concentrations () and particle surface area concentration (Si,dry). In the next step, ice-nucleating particle number concentrations (nINP,i) are estimated by applying INP parameterizations from the literature indicated by D10, D15, S15 and U17 for DeMott et al. (2010, 2015), Steinke et al. (2015) and Ullrich et al. (2017), respectively. Finally, the INP concentrations estimated for the different aerosol types are summed in order to estimate the total nINP.
A2 Methodological diagram for the analysis of the spaceborne lidar measurements
The Fig. A2 illustrates the general idea of the methodology followed for the INP estimations from the CALIPSO measurements. The equations for the conversions of the measured optical properties into the microphysical properties are provided in Table 3. The equations for the conversions of the microphysical properties to INPs are provided in Table 1.
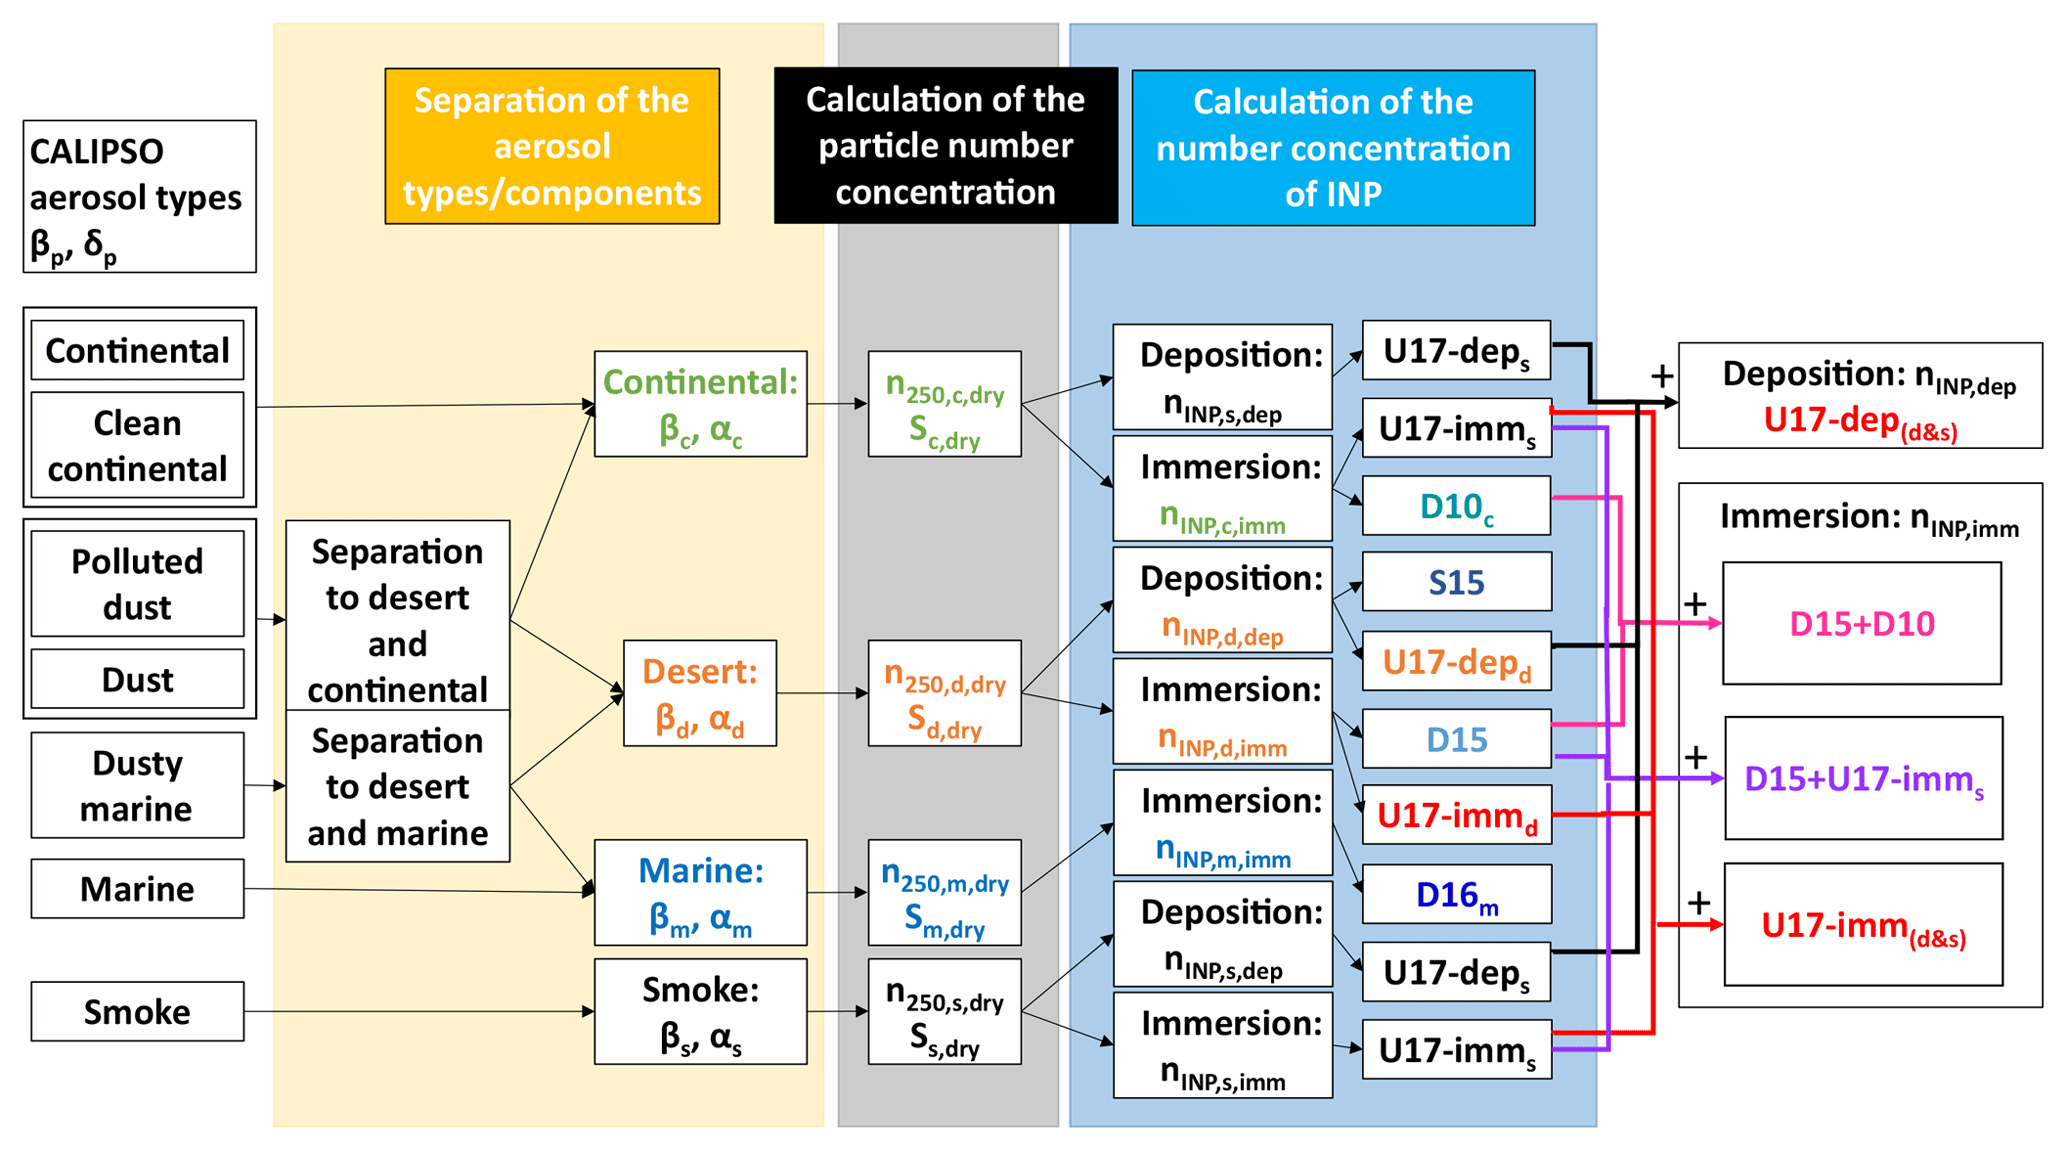
Figure A2Overview of the data analysis scheme applied to CALIPSO measurements. In the CALIPSO case considered in this work only dust and polluted dust aerosol types have been observed. For that reason, only these combinations are considered here.
VA and EM conceived the presented idea. EM performed the analysis, drafted the manuscript, and designed the figures with support from MT and AT; AN guided and supervised EM on the ice nuclei mechanism and parameterizations and encouraged EM to investigate the errors of the lidar-derived INP concentrations. AA guided and supervised EM on the methodology and parameterizations for the lidar-derived INP concentrations and encouraged EM to investigate the errors of the in situ OPC concentrations and the DARDAR nice concentrations. JS performed the analysis of the INP samples and guided EM on the limitations of these measurements. JS conceived and planned the experiment. MP was responsible for the UAV flights and the analysis of the OPC measurements. DM and AT performed the correction of the OPC measurements. RE supported essentially the PollyXT measurements during the campaign. HB supported the derivation of the PollyXT lidar backscatter coefficients. SS derived the WRF model profiles. FE derived the nice from DARDAR. All authors provided critical feedback and helped shape the research, analysis and manuscript.
The authors declare that they have no conflict of interest.
This article is part of the special issue “EARLINET aerosol profiling: contributions to atmospheric and climate research”. It is not associated with a conference.
We are grateful to Balis Dimitrios, Bingemer Heinz G. and Biskos George for their helpful contribution and advice on the interpretation of the results of this study. We thank Philippe Goloub for the provision of one of the Cimel instruments operating during the campaign. We are grateful to the Cyprus Institute Unmanned System Research Laboratory (USRL) team for their support in the operation of the UAV flights. We thank EARLINET (https://www.earlinet.org/, last access: 8 August 2019), ACTRIS (https://www.actris.eu, last access: 8 August 2019), AERONET (https://aeronet.gsfc.nasa.gov/, last access: 8 August 2019) and AERONET-Europe for the data collection, calibration, processing and dissemination. We thank the PollyNet group, and especially Dietrich Althausen and Birgit Heese, for their support during the development and operation of the PollyXT lidar of NOA. We are grateful to the AERIS/ICARE Data and Services Center for generating and storing the DARDAR products and for providing access to the CALIPSO data used and their computational center (http://www.icare.univ-lille1.fr/, last access: 8 August 2019). We thank the NASA CloudSat Project and NASA/LaRC/ASDC for making available the CloudSat and CALIPSO products, respectively, which are used to build the synergetic DARDAR products. We acknowledge the use of imagery from the Worldview Snapshots application (https://wvs.earthdata.nasa.gov/, last access: 8 August 2019), part of the Earth Observing System Data and Information System (EOSDIS). We gratefully acknowledge the NOAA Air Resources Laboratory (ARL) for the provision of the HYSPLIT transport and dispersion model and READY website (http://www.ready.noaa.gov, last access: 8 August 2019).
This research has been supported by the European Research Council (grant no. 725698, D-TECT; and grant no. 726165, PyroTRACH), the European Union's Seventh Framework Programme (grant no. 603445, BACCHUS), the Deutsche Forschungsgemeinschaft (grant no. 1525, INUIT), the European Union's Horizon 2020 research and innovation program (654109, ACTRIS-2), the Deutscher Akademischer Austauschdienst (grant no. 57370121), the Stavros Niarchos Foundation, the General Secretariat for Research and Technology and the Hellenic Foundation for Research and Innovation (grant no. 294).
This paper was edited by Eduardo Landulfo and reviewed by three anonymous referees.
Altaratz, O., Koren, I., Remer, L. A., and Hirsch, E.: Review: Cloud invigoration by aerosols – Coupling between microphysics and dynamics, Atmos. Res., 140, 38–60, https://doi.org/10.1016/j.atmosres.2014.01.009, 2014. a
Amiridis, V., Wandinger, U., Marinou, E., Giannakaki, E., Tsekeri, A., Basart, S., Kazadzis, S., Gkikas, A., Taylor, M., Baldasano, J., and Ansmann, A.: Optimizing CALIPSO Saharan dust retrievals, Atmos. Chem. Phys., 13, 12089–12106, https://doi.org/10.5194/acp-13-12089-2013, 2013.
Ansmann, A., Wandinger, U., Riebesell, M., Weitkamp, C., Michaelis, W. Independent measurement of extinction and backscatter profiles in cirrus clouds by using a combined raman elastic-backscatter lidar, Appl. Opt., 31, 7113–7131, https://doi.org/10.1364/AO.31.007113, 1992. a
Ansmann, A., Mattis, I., Muller, D., Wandinger, U., Radlach, M., Althausen, D., and Damoah, R.: Ice formation in Saharan dust over central Europe observed with temperature/humidity/aerosol Raman lidar, J. Geophys. Res., 110, D18S12, https://doi.org/10.1029/2004JD005000, 2005. a
Ansmann, A., Tesche, M. Althausen, D., Müller, D., Freudenthaler, V. Heese, B., Wiegner, M., Pisani, G., Knippertz, P., and Dubovik, O.: Influence of Saharan dust on cloud glaciation in southern Morocco during SAMUM, J. Geophys. Res., 112, D04210, https://doi.org/10.1029/2007JD008785, 2008. a
Ansmann, A., Tesche, M., Seifert, P., Althausen, D., Engelmann, R., Fruntke, J., Wandinger, U., Mattis, I., and Müller, D.: Evolution of the ice phase in tropical altocumulus: SAMUM lidar observations over Cape Verde, J. Geophys. Res., 114, D17208, https://doi.org/10.1029/2008JD011659, 2009. a
Ansmann, A., Tesche, M., Seifert, P., Groß, S., Freudenthaler, V., Apituley, A., Wilson, K. M., Serikov, I., Linné, H., Heinold, B., Hiebsch, A., Schnell, F., Schmidt, J., Mattis, I., Wandinger, U., and Wiegner, M.: Ash and fine-mode particle mass profiles from EARLINET-AERONET observations over central Europe after the eruptions of the Eyjafjallajökull volcano in 2010, J. Geophys. Res.-Atmos., 116, D00U02, doi:10.1029/2010JD015567, 2011a. a, b
Ansmann, A., Petzold, A., Kandler, K., Tegen, I., Wendisch, M., Müller, D., Weinzierl, B., Müller, T., and Heintzenberg, J.: Saharan mineral dust experiments SAMUM-1 and SAMUM-2: what have we learned?, Tellus B, 63, 403-–429, https://doi.org/10.1111/j.1600-0889.2011.00555.x, 2011b. a
Ansmann, A., Seifert, P., Tesche, M., and Wandinger, U.: Profiling of fine and coarse particle mass: case studies of Saharan dust and Eyjafjallajökull/Grimsvötn volcanic plumes, Atmos. Chem. Phys., 12, 9399–9415, https://doi.org/10.5194/acp-12-9399-2012, 2012. a
Ansmann, A., Mamouri, R.-E., Bühl, J., Seifert, P., Engelmann, R., Hofer, J., Nisantzi, A., Atkinson, J. D., Kanji, Z. A., Sierau, B., Vrekoussis, M., and Sciare, J.: Ice-nucleating particle versus ice crystal number concentration in altocumulus and cirrus embedded in Saharan dust: A closure study, Atmos. Chem. Phys. Discuss., https://doi.org/10.5194/acp-2019-447, in review, 2019. a
Baars, H., Kanitz, T., Engelmann, R., Althausen, D., Heese, B., Komppula, M., Preißler, J., Tesche, M., Ansmann, A., Wandinger, U., Lim, J.-H., Ahn, J. Y., Stachlewska, I. S., Amiridis, V., Marinou, E., Seifert, P., Hofer, J., Skupin, A., Schneider, F., Bohlmann, S., Foth, A., Bley, S., Pfüller, A., Giannakaki, E., Lihavainen, H., Viisanen, Y., Hooda, R. K., Pereira, S. N., Bortoli, D., Wagner, F., Mattis, I., Janicka, L., Markowicz, K. M., Achtert, P., Artaxo, P., Pauliquevis, T., Souza, R. A. F., Sharma, V. P., van Zyl, P. G., Beukes, J. P., Sun, J., Rohwer, E. G., Deng, R., Mamouri, R.-E., and Zamorano, F.: An overview of the first decade of PollyNET: an emerging network of automated Raman-polarization lidars for continuous aerosol profiling, Atmos. Chem. Phys., 16, 5111–5137, https://doi.org/10.5194/acp-16-5111-2016, 2016. a, b, c, d, e
Baars, H., Seifert, P., Engelmann, R., and Wandinger, U.: Target categorization of aerosol and clouds by continuous multiwavelength-polarization lidar measurements, Atmos. Meas. Tech., 10, 3175–3201, https://doi.org/10.5194/amt-10-3175-2017, 2017. a
BACCHUS Ice Nucleation DataBase: available at: http://www.bacchus-env.eu/in/info.php?id=72, last access: 13 August 2019. a
Barahona, D. and Nenes, A.: Parameterizing the competition between homogeneous and heterogeneous freezing in cirrus cloud formation – monodisperse ice nuclei, Atmos. Chem. Phys., 9, 369–381, https://doi.org/10.5194/acp-9-369-2009, 2009.
Bègue, N., Tulet, P., Pelon, J., Aouizerats, B., Berger, A., and Schwarzenboeck, A.: Aerosol processing and CCN formation of an intense Saharan dust plume during the EUCAARI 2008 campaign, Atmos. Chem. Phys., 15, 3497–3516, https://doi.org/10.5194/acp-15-3497-2015, 2015. a
Brown, P. R. and Francis, P. N.: Improved Measurements of the Ice Water Content in Cirrus Using a Total-Water Probe, J. Atmos. Ocean. Tech., 12, 410–-414, https://doi.org/10.1175/1520-0426(1995)012<0410:IMOTIW>2.0.CO;2, 1995. a
Bühl, J., Seifert, P., Myagkov, A., and Ansmann, A.: Measuring ice- and liquid-water properties in mixed-phase cloud layers at the Leipzig Cloudnet station, Atmos. Chem. Phys., 16, 10609–10620, https://doi.org/10.5194/acp-16-10609-2016, 2016. a, b
Burkart, J., Steiner, G., Reischl, G., Moshammer, H., Neuberger, M., and Hitzenberger, R.: Characterizing the performance of two optical particle counters (Grimm OPC1.108 and OPC1.109) under urban aerosol conditions, J. Aerosol. Sci., 41, 953–962, https://doi.org/10.1016/j.jaerosci.2010.07.007, 2010. a
Burkert-Kohn, M., Wex, H., Welti, A., Hartmann, S., Grawe, S., Hellner, L., Herenz, P., Atkinson, J. D., Stratmann, F., and Kanji, Z. A.: Leipzig Ice Nucleation chamber Comparison (LINC): intercomparison of four online ice nucleation counters, Atmos. Chem. Phys., 17, 11683–11705, https://doi.org/10.5194/acp-17-11683-2017, 2017. a
Ceccaldi, M., Delanoë, J., Hogan, R. J., Pounder, N. L., Protat, A., and Pelon, J.: From CloudSat-CALIPSO to EarthCare: Evolution of the DARDAR cloud classification and its comparison to airborne radar-lidar observations, J. Geophys. Res.-Atmos., 118, 7962–7981, https://doi.org/10.1002/jgrd.50579, 2013. a
de Boer, G., Morrison, H., Shupe, M. D., and Hildner, R.: Evidence of liquid dependent ice nucleation in high-latitude stratiform clouds from surface remote sensors, Geophys. Res. Lett., 38, L01803, https://doi.org/10.1029/2010GL046016, 2011. a, b
Delanoë, J. and Hogan, R. J.: A variational scheme for retrieving ice cloud properties from combined radar, lidar, and infrared radiometer, J. Geophys. Res., 113, D07204, https://doi.org/10.1029/2007JD009000, 2008. a
Delanoë, J. and Hogan R. J.: Combined CloudSat-CALIPSO-MODIS retrievals of the properties of ice clouds, J. Geophys. Res., 115, D00H29, https://doi.org/10.1029/2009JD012346, 2010.
Delanoë, J. M. E., Heymsfield, A. J., Protat, A., Bansemer, A., and Hogan, R. J.: Normalized particle size distribution for remote sensing application, J. Geophys. Res.-Atmos., 119, 4204–4227, https://doi.org/10.1002/2013JD020700, 2014. a
DeMott, P. J., Prenni, A. J., Liu, X., Kreidenweis, S. M., Petters, M. D., Twohy, C. H., Richardson, M. S., Eidhammer, T., and Rogers, D. C.: Predicting global atmospheric ice nuclei distributions and their impacts on climate, P. Natl. Acad. Sci. USA, 107, 11217–11222, https://doi.org/10.1073/pnas.0910818107, 2010. a, b, c, d, e, f, g, h, i
DeMott, P. J., Prenni, A. J., McMeeking, G. R., Sullivan, R. C., Petters, M. D., Tobo, Y., Niemand, M., Möhler, O., Snider, J. R., Wang, Z., and Kreidenweis, S. M.: Integrating laboratory and field data to quantify the immersion freezing ice nucleation activity of mineral dust particles, Atmos. Chem. Phys., 15, 393–409, https://doi.org/10.5194/acp-15-393-2015, 2015. a, b, c, d, e, f, g, h, i, j, k, l
DeMott, P. J., Hill, T. C. J., McCluskey, C. S., Prather, K. A., Collins, D. B., Sullivan, R. C., Ruppel, M. J., Mason, R. H., Irish, V. E., Lee, T., Hwang, C. Y., Rhee, T. S., Snider, J. R., McMeeking, G. R., Dhaniyala, S., Lewis, E. R., Wentzell, J. J. B., Abbatt, J., Lee, C., Sultana, C. M., Ault, A. P., Axson, J. L., Martinez, M. D., Venero, I., Santos-Figueroa, G., Stokes, M. D., Deane, G. B., Mayol-Bracero, O. L., Grassian, V. H., Bertram, T. H., Bertram, A. K., Moffett, B. F., and Franc, G. D.: Sea spray aerosol as a unique source of ice nucleating particles, P. Natl. Acad. Sci. USA, 113, 5797–5803, https://doi.org/10.1073/pnas.1514034112, 2015b. a
DeMott, P. J., Hill, T. C. J., Petters, M. D., Bertram, A. K., Tobo, Y., Mason, R. H., Suski, K. J., McCluskey, C. S., Levin, E. J. T., Schill, G. P., Boose, Y., Rauker, A. M., Miller, A. J., Zaragoza, J., Rocci, K., Rothfuss, N. E., Taylor, H. P., Hader, J. D., Chou, C., Huffman, J. A., Pöschl, U., Prenni, A. J., and Kreidenweis, S. M.: Comparative measurements of ambient atmospheric concentrations of ice nucleating particles using multiple immersion freezing methods and a continuous flow diffusion chamber, Atmos. Chem. Phys., 17, 11227–11245, https://doi.org/10.5194/acp-17-11227-2017, 2017. a, b, c
DeMott, P. J., Möhler, O., Cziczo, D. J., Hiranuma, N., Petters, M. D., Petters, S. S., Belosi, F., Bingemer, H. G., Brooks, S. D., Budke, C., Burkert-Kohn, M., Collier, K. N., Danielczok, A., Eppers, O., Felgitsch, L., Garimella, S., Grothe, H., Herenz, P., Hill, T. C. J., Höhler, K., Kanji, Z. A., Kiselev, A., Koop, T., Kristensen, T. B., Krüger, K., Kulkarni, G., Levin, E. J. T., Murray, B. J., Nicosia, A., O'Sullivan, D., Peckhaus, A., Polen, M. J., Price, H. C., Reicher, N., Rothenberg, D. A., Rudich, Y., Santachiara, G., Schiebel, T., Schrod, J., Seifried, T. M., Stratmann, F., Sullivan, R. C., Suski, K. J., Szakáll, M., Taylor, H. P., Ullrich, R., Vergara-Temprado, J., Wagner, R., Whale, T. F., Weber, D., Welti, A., Wilson, T. W., Wolf, M. J., and Zenker, J.: The Fifth International Workshop on Ice Nucleation phase 2 (FIN-02): laboratory intercomparison of ice nucleation measurements, Atmos. Meas. Tech., 11, 6231–6257, https://doi.org/10.5194/amt-11-6231-2018, 2018. a, b, c
Dusek, U., Frank, G. P., Hildebrandt, L., Curtius, J., Schneider, J., Walter, S., Chand, D., Drewnick, F., Hings, S., Jung, D., Borrmann, S., and Andreae M. O.: Size matters more than chemistry for cloud-nucleating ability of aerosol particles, Science, 1375–1378, https://doi.org/10.1126/science.1125261, 2006.
Engelmann, R., Kanitz, T., Baars, H., Heese, B., Althausen, D., Skupin, A., Wandinger, U., Komppula, M., Stachlewska, I. S., Amiridis, V., Marinou, E., Mattis, I., Linné, H., and Ansmann, A.: The automated multiwavelength Raman polarization and water-vapor lidar PollyXT: the neXT generation, Atmos. Meas. Tech., 9, 1767–1784, https://doi.org/10.5194/amt-9-1767-2016, 2016. a
Fernald, F. G.: Analysis of atmospheric lidar observations: some comments, Appl. Opt. 23, 652–653, https://doi.org/10.1364/AO.23.000652, 1984. a
Field, P. R., Lawson, R. P., Brown, P. R., Lloyd, G., Westbrook, C., Moisseev, D., Miltenberger, A., Nenes, A., Blyth, A., Choularton, T., Connolly, P., Buehl, J., Crosier, J., Cui, Z., Dearden, C., DeMott, P., Flossmann, A., Heymsfield, A., Huang, Y., Kalesse, H., Kanji, Z. A., Korolev, A., Kirchgaessner, A., Lasher-Trapp, S., Leisner, T., McFarquhar, G., Phillips, V., Stith, J., and Sullivan, S.: Secondary Ice Production: Current State of the Science and Recommendations for the Future, Meteorol. Mon., 58, 7.1–-7.20, https://doi.org/10.1175/AMSMONOGRAPHS-D-16-0014.1, 2017. a
Floutsi, A.: Determination of aerosol optical properties with lidar, A comparison between algorithms, (Master thesis), TU Delft, uuid:6c012d93-4df8-49be-8b04-e09196ba7a37, 2018. a
Freudenthaler, V., Esselborn, M., Wiegner, M., Heese, B., Tesche, M., Ansmann, A., Müller, D., Althausen, D., Wirth, M., Fix, A., Ehret, G., Knippertz, P., Toledano, C., Gasteiger, J., Garhammer, M., and Seefeldner, M.: Depolarization ratio profiling at several wavelengths in pure Saharan dust during SAMUM 2006, Tellus B, 61, 165–-179, https://doi.org/10.1111/j.1600-0889.2008.00396.x, 2009. a, b, c
Freudenthaler, V.: About the effects of polarising optics on lidar signals and the Δ90 calibration, Atmos. Meas. Tech., 9, 4181–4255, https://doi.org/10.5194/amt-9-4181-2016, 2016. a
Garimella, S., Huang, Y.-W., Seewald, J. S., and Cziczo, D. J.: Cloud condensation nucleus activity comparison of dry- and wet-generated mineral dust aerosol: The significance of soluble material, Atmos. Chem. Phys., 14, 6003–6019, https://doi.org/10.5194/acp-14-6003-2014, 2014. a
Groß, S., Esselborn, M., Abicht, F., Wirth, M., Fix, A., and Minikin, A.: Airborne high spectral resolution lidar observation of pollution aerosol during EUCAARI-LONGREX, Atmos. Chem. Phys., 13, 2435–2444, https://doi.org/10.5194/acp-13-2435-2013, 2013. a, b
Gumley, L., Descloitres, J., and Schmaltz, J.: Creating Reprojected True Color MODIS Images: A Tutorial, Version 1.0.2, University of Wisconsin-Madison and NASA Goddard Space Flight Center,, available at: https://cdn.earthdata.nasa.gov/conduit/upload/946/MODIS_True_Color.pdf (last access: 12 August 2019), 17 pp., 2010. a
Haarig, M., Ansmann, A., Gasteiger, J., Kandler, K., Althausen, D., Baars, H., Radenz, M., and Farrell, D. A.: Dry versus wet marine particle optical properties: RH dependence of depolarization ratio, backscatter, and extinction from multiwavelength lidar measurements during SALTRACE, Atmos. Chem. Phys., 17, 14199–14217, https://doi.org/10.5194/acp-17-14199-2017, 2017. a, b
Hallett, J. and Mossop, S. C.: Production of secondary ice particles during the riming process, Nature, 249, 26–28, https://doi.org/10.1038/249026a0, 1974. a
Heymsfield, A. J., Schmitt, C., Bansemer, A., and Twohy, C. H.: Improved Representation of Ice Particle Masses Based on Observations in Natural Clouds, J. Atmos. Sci., 67, 3303–3318, https://doi.org/10.1175/2010JAS3507.1, 2010. a
Holben, B. N., Eck, T. F., Slutsker, I., Tanré, D., Buis, J. P., Setzer, A., Vermote, E., Reagan, J. A., Kaufman, Y. J., Nakajima, T., Lavenu, F., Jankowiaki, I., and Smirnov, A.: AERONET – A federated instrument network and data archive for aerosol characterization, Remote Sens. Environ., 66, 1–16, https://doi.org/10.1016/S0034-4257(98)00031-5, 1998. a
Hoose, C. and Möhler, O.: Heterogeneous ice nucleation on atmospheric aerosols: a review of results from laboratory experiments, Atmos. Chem. Phys., 12, 9817–9854, https://doi.org/10.5194/acp-12-9817-2012, 2012. a, b
ICARE data and services center, available at: http://www.icare.univ-lille1.fr/, last access: 12 August 2019.
Illingworth, A. J., Hogan, R. J., O’Connor, E. J., Bouniol, D., Delanoë, J., Pelon, J., Protat, A., Brooks, M. E., Gaussiat, N., Wilson, D. R., Donovan, D. P., Klein Baltink, H., van Zadelhoff, G.-J., Eastment, J. D., Goddard, J. W. F., Wrench, C. L., Haeffelin, M., Krasnov, O. A., Russchenberg, H. W. J., Piriou, J.-M., Vinit, F., Seifert, A., Tompkins, A. M., and Willen, J., CLOUDNET: Continuos evaluation of cloud profiles in seven operational models using ground-based observations, B. Am. Meteorol. Soc., 88, 883–898, 2007. a
Janjic, Z. I., Gerrity Jr., J. P., and Nickovic, S.: An Alternative Approach to Nonhydrostatic Modeling, Mon. Weather Rev., 129, 1164–1178, 2001. a
Kamphus, M., Ettner-Mahl, M., Klimach, T., Drewnick, F., Keller, L., Cziczo, D. J., Mertes, S., Borrmann, S., and Curtius, J.: Chemical composition of ambient aerosol, ice residues and cloud droplet residues in mixed-phase clouds: single particle analysis during the Cloud and Aerosol Characterization Experiment (CLACE 6), Atmos. Chem. Phys., 10, 8077–8095, https://doi.org/10.5194/acp-10-8077-2010, 2010. a
Kanitz, T., Seifert, P., Ansmann, A., Engelmann, R., Althausen, D., Casiccia, C., and Rohwer, E. G.: Contrasting the impact of aerosols at northern and southern midlatitudes on heterogeneous ice formation, Geophys. Res. Lett., 38, L17802, https://doi.org/10.1029/2011GL048532, 2011. a
Kanji, Z. A., Ladino, L. A., Wex, H., Boose, Y., Burkert-Kohn, M., Cziczo, D. J., and Krämer, M.: Overview of ice nucleating particles, Meteorol. Mon., 58, 1.1–1.33, https://doi.org/10.1175/AMSMONOGRAPHS-D-16-0006.1, 2017. a
Kar, J., Vaughan, M. A., Lee, K.-P., Tackett, J. L., Avery, M. A., Garnier, A., Getzewich, B. J., Hunt, W. H., Josset, D., Liu, Z., Lucker, P. L., Magill, B., Omar, A. H., Pelon, J., Rogers, R. R., Toth, T. D., Trepte, C. R., Vernier, J.-P., Winker, D. M., and Young, S. A.: CALIPSO lidar calibration at 532 nm: version 4 nighttime algorithm, Atmos. Meas. Tech., 11, 1459–1479, https://doi.org/10.5194/amt-11-1459-2018, 2018. a
Kelly, J. T., Chuang, C. C., and Wexler, A. S.: Influence of dust composition on cloud droplet formation, Atmos. Environ., 41, 2904–2916, 2007.
Kim, M.-H., Omar, A. H., Tackett, J. L., Vaughan, M. A., Winker, D. M., Trepte, C. R., Hu, Y., Liu, Z., Poole, L. R., Pitts, M. C., Kar, J., and Magill, B. E.: The CALIPSO version 4 automated aerosol classification and lidar ratio selection algorithm, Atmos. Meas. Tech., 11, 6107–6135, https://doi.org/10.5194/amt-11-6107-2018, 2018. a
Klett, J.: Stable analytical inversion solution for processing lidar returns, Appl. Opt., 20, 211–-220, 1981. a
Kumar, P., Sokolik, I. N., and Nenes, A.: Measurements of cloud condensation nuclei activity and droplet activation kinetics of fresh unprocessed regional dust samples and minerals, Atmos. Chem. Phys., 11, 3527–3541, https://doi.org/10.5194/acp-11-3527-2011, 2011a. a
Kumar, P., Sokolik, I. N., and Nenes, A.: Cloud condensation nuclei activity and droplet activation kinetics of wet processed regional dust samples and minerals, Atmos. Chem. Phys., 11, 8661–8676, https://doi.org/10.5194/acp-11-8661-2011, 2011b. a, b
Levin, Z., Teller, A., Ganor, E., and Yin, Y.: On the interactions of mineral dust, sea-salt particles, and clouds: A measurement and modeling study from the Mediterranean Israeli Dust Experiment campaign, J. Geophys. Res., 110, D20202, https://doi.org/10.1029/2005JD005810, 2005. a
Lohmann, U. and Feichter, J.: Global indirect aerosol effects: a review, Atmos. Chem. Phys., 5, 715–737, https://doi.org/10.5194/acp-5-715-2005, 2005. a
Mamali, D., Marinou, E., Sciare, J., Pikridas, M., Kokkalis, P., Kottas, M., Binietoglou, I., Tsekeri, A., Keleshis, C., Engelmann, R., Baars, H., Ansmann, A., Amiridis, V., Russchenberg, H., and Biskos, G.: Vertical profiles of aerosol mass concentration derived by unmanned airborne in situ and remote sensing instruments during dust events, Atmos. Meas. Tech., 11, 2897–2910, https://doi.org/10.5194/amt-11-2897-2018, 2018. a, b
Mamouri, R. E. and Ansmann, A.: Fine and coarse dust separation with polarization lidar, Atmos. Meas. Tech., 7, 3717–3735, https://doi.org/10.5194/amt-7-3717-2014, 2014. a
Mamouri, R. E. and Ansmann, A.: Estimated desert-dust ice nuclei profiles from polarization lidar: methodology and case studies, Atmos. Chem. Phys., 15, 3463–3477, https://doi.org/10.5194/acp-15-3463-2015, 2015. a, b, c, d
Mamouri, R.-E. and Ansmann, A.: Potential of polarization lidar to provide profiles of CCN- and INP-relevant aerosol parameters, Atmos. Chem. Phys., 16, 5905–5931, https://doi.org/10.5194/acp-16-5905-2016, 2016. a, b, c, d, e, f, g, h, i, j, k
Marinou, E., Amiridis, V., Binietoglou, I., Tsikerdekis, A., Solomos, S., Proestakis, E., Konsta, D., Papagiannopoulos, N., Tsekeri, A., Vlastou, G., Zanis, P., Balis, D., Wandinger, U., and Ansmann, A.: Three-dimensional evolution of Saharan dust transport towards Europe based on a 9-year EARLINET-optimized CALIPSO dataset, Atmos. Chem. Phys., 17, 5893–5919, https://doi.org/10.5194/acp-17-5893-2017, 2017. a
Marinou, E., Tesche, M., Nenes, A., Ansmann, A., Schrod, J., Mamali, D., Tsekeri, A., Pikridas, M., Baars, H., Engelmann, R., Voudouri, K.-A., Solomos, S., Sciare, J., Groß, S., and Amiridis, V.: available at: https://react.space.noa.gr/papers/Marinou_et_al_2019/Dataset, last access: 12 August 2019. a
Mason, R. H., Si, M., Chou, C., Irish, V. E., Dickie, R., Elizondo, P., Wong, R., Brintnell, M., Elsasser, M., Lassar, W. M., Pierce, K. M., Leaitch, W. R., MacDonald, A. M., Platt, A., Toom-Sauntry, D., Sarda-Estève, R., Schiller, C. L., Suski, K. J., Hill, T. C. J., Abbatt, J. P. D., Huffman, J. A., DeMott, P. J., and Bertram, A. K.: Size-resolved measurements of ice-nucleating particles at six locations in North America and one in Europe, Atmos. Chem. Phys., 16, 1637–1651, https://doi.org/10.5194/acp-16-1637-2016, 2016.
McFiggans, G., Artaxo, P., Baltensperger, U., Coe, H., Facchini, M. C., Feingold, G., Fuzzi, S., Gysel, M., Laaksonen, A., Lohmann, U., Mentel, T. F., Murphy, D. M., O'Dowd, C. D., Snider, J. R., and Weingartner, E.: The effect of physical and chemical aerosol properties on warm cloud droplet activation, Atmos. Chem. Phys., 6, 2593–2649, https://doi.org/10.5194/acp-6-2593-2006, 2006.
Mitchell, D. L.: Use of Mass- and Area-Dimensional Power Laws for Determining Precipitation Particle Terminal Velocities, J. Atmos. Sci., 53, 1710–1723, https://doi.org/10.1175/1520-0469(1996)053<1710:UOMAAD>2.0.CO;2, 1996. a
Morris, C. E., Conen, F., Alex Huffman, J., Phillips, V., Pöschl, U., and Sands, D. C.: Bioprecipitation: A feedback cycle linking Earth history, ecosystem dynamics and land use through biological ice nucleators in the atmosphere, Glob. Change Biol., 20, 341–351, https://doi.org/10.1111/gcb.12447, 2014. a
Müller, D., Ansmann, A., Mattis, I., Tesche, M., Wandinger, U., Althausen, D., and Pisani, G.: Aerosol-type-dependent lidar ratios observed with Raman lidar, J. Geophys. Res., 112, D16202, https://doi.org/10.1029/2006JD008292, 2007. a, b
Murray, B. J., O’Sullivan, D., Atkinson, J. D., and Webb, M. E.: Ice nucleation by particles immersed in supercooled cloud droplets, Chem. Soc. Rev., 41, 6519–6554, https://doi.org/10.1039/c2cs35200a, 2012. a, b, c, d
Nasa Atmospheric Science data center: the CALIPSO 5 km aerosol profile product, available at: https://doi.org/10.5067/CALIOP/CALIPSO/LID_L2_05kmAPro-Standard-V4-20, last access: 12 August 2019. a
NASA Worldview snapshots application center: available at: https://worldview.earthdata.nasa.gov/, last access: 12 August 2019. a
Nenes, A., Murray, B., and Bougiatioti, A.: Mineral Dust and Its Microphysical Interactions with Clouds, In Knippertz, P., and Stuut, J.B., Mineral Dust: A Key Player in the Earth System, Springer, 287–325, ISBN 978-94-017-8977-6, 2014. a
Nickovic, S., Kallos, G., Papadopoulos, A., and Kakaliagou, O.: A model for prediction of desert dust cycle in the atmosphere, J. Geophys. Res., 106, 18113–18129, 2001. a
Nickovic, S., Cvetkovic, B., Madonna, F., Rosoldi, M., Pejanovic, G., Petkovic, S., and Nikolic, J.: Cloud ice caused by atmospheric mineral dust – Part 1: Parameterization of ice nuclei concentration in the NMME-DREAM model, Atmos. Chem. Phys., 16, 11367–11378, https://doi.org/10.5194/acp-16-11367-2016, 2016. a
Niemand, M., Möhler, O., Vogel, B., Vogel, H., Hoose, C., Connolly, P., Klein, H., Bingemer, H., DeMott, P., Skrotzki, J., and Leisner, T.: parameterisation of immersion freezing on mineral dust particles: an application in a regional scale model, J. Atmos. Sci., 69, 3077–3092, 2012. a, b
Nisantzi, A., Mamouri, R. E., Ansmann, A., Schuster, G. L., and Hadjimitsis, D. G.: Middle East versus Saharan dust extinction-to-backscatter ratios, Atmos. Chem. Phys., 15, 7071–7084, https://doi.org/10.5194/acp-15-7071-2015, 2015. a, b
O'Sullivan, D., Murray, B. J., Malkin, T. L., Whale, T. F., Umo, N. S., Atkinson, J. D., Price, H. C., Baustian, K. J., Browse, J., and Webb, M. E.: Ice nucleation by fertile soil dusts: relative importance of mineral and biogenic components, Atmos. Chem. Phys., 14, 1853–1867, https://doi.org/10.5194/acp-14-1853-2014, 2014. a
O'Sullivan, D., Murray, B. J., Ross, J. F., Whale, T. F., Price, H. C., Atkinson, J. D., Umo, N. S., and Webb, M. E.: The relevance of nanoscale biological fragments for ice nucleation in clouds, Sci. Rep., 5, A8082, https://doi.org/10.1038/srep08082, 2015. a
O'Sullivan, D., Murray, B. J., Ross, J. F., and Webb, M. E.: The adsorption of fungal ice-nucleating proteins on mineral dusts: a terrestrial reservoir of atmospheric ice-nucleating particles, Atmos. Chem. Phys., 16, 7879–7887, https://doi.org/10.5194/acp-16-7879-2016, 2016. a
Pérez, C., Nickovic, S., Baldasano, J., Sicard, M., Rocadenbosch, F., and Cachorro, V. E.: A long Saharan dust event over the western Mediterranean: Lidar, Sun photometer observations, and regional dust modeling, J. Geophys. Res., 111, D15214, https://doi.org/10.1029/2005JD006579, 2006. a
Petters, M. D. and Kreidenweis, S. M.: A single parameter representation of hygroscopic growth and cloud condensation nucleus activity, Atmos. Chem. Phys., 7, 1961–1971, https://doi.org/10.5194/acp-7-1961-2007, 2007.
Pruppacher, H. R. and Klett, J. D.: Microphysics of clouds and precipitation 2 Edn., Kluwer Academic Publishers, Boston, MA, XXII, 954, 1997. a
Rosenfeld, D., Andreae, M. O., Asmi, A., Chin, M., de Leeuw, G., Donovan, D. P., Kahn, R., Kinne, S., Kivekäs, N., Kulmala, M., Lau, W., Schmidt, K. S., Suni, T., Wagner, T., Wild, M., and Quaas, J.: Global observations of aerosol-cloud-precipitation-climate interactions, Rev. Geophys., 52, 750–808, https://doi.org/10.1002/2013RG000441, 2014. a
Schnell, R. C. and Vali, G.: Biogenic ice nuclei: Part I. Terrestrial and marine sources, J. Atmos. Sci., 33, 1554–-1564, 1976. a
Schrod, J., Danielczok, A., Weber, D., Ebert, M., Thomson, E. S., and Bingemer, H. G.: Re-evaluating the Frankfurt isothermal static diffusion chamber for ice nucleation, Atmos. Meas. Tech., 9, 1313–1324, https://doi.org/10.5194/amt-9-1313-2016, 2016. a, b, c
Schrod, J., Weber, D., Drücke, J., Keleshis, C., Pikridas, M., Ebert, M., Cvetković, B., Nickovic, S., Marinou, E., Baars, H., Ansmann, A., Vrekoussis, M., Mihalopoulos, N., Sciare, J., Curtius, J., and Bingemer, H. G.: Ice nucleating particles over the Eastern Mediterranean measured by unmanned aircraft systems, Atmos. Chem. Phys., 17, 4817–4835, https://doi.org/10.5194/acp-17-4817-2017, 2017. a, b, c, d, e, f, g, h, i, j
Seifert, P., Ansmann, A., Mattis, I., Wandinger, U., Tesche, M., Engelmann, R., Müller, D., Pérez, C., and Haustein, K.: Saharan dust and heterogeneous ice formation: Eleven years of cloud observations at a central European EARLINET site, J. Geophys. Res., 115, D20201, https://doi.org/10.1029/2009JD013222, 2010. a
Seinfeld, J. H., Bretherton, C., Carslaw, K. S., Coe, H., DeMott, P. J., Dunlea, E. J., Feingold, G., Ghan, S., Guenther, A. B., Kahn, R., Kraucunas, I., Kreidenweis, S. M., Molina, M. J., Nenes, A., Penner, J. E., Prather, K. A., Ramanathan, V., Ramaswamy, V., Rasch, P. J., Ravishankara, A. R., Rosenfeld, D., Stephens, G., and Wood, R.: Improving our fundamental understanding of the role of aerosol-cloud interactions in the climate system, P. Natl. Acad. Sci. USA, 113, 5781–5790, https://doi.org/10.1073/pnas.1514043113, 2016. a, b
Shimizu, A., Sugimoto, N., Matsui,I., Arao, K., Uno, I., Murayama, T., Kagawa, N., Aoki, K., Uchiyama, A., and Yamazaki, A.: Continuous observations of Asian dust and other aerosols by polarization lidars in China and Japan during ACE-Asia, J. Geophys. Res., 109, D19S17, https://doi.org/10.1029/2002JD003253, 2004. a
Skamarock, W. C., Klemp, J. B., Dudhia, J., Gill, D. O., Barker, D. M., Duda, M. G., Huang, X. Y., Wang, W., and Powers, J. G.: A Description of the Advanced Research WRF Version 3, in: NCAR Technical Note, available at: http://citeseerx.ist.psu.edu/viewdoc/download?doi=10.1.1.167.9219&rep=rep1&type=pdf (last access: 8 August 2019), 475, 2008. a
Solomos, S., Amiridis, V., Zanis, P., Gerasopoulos, E., Sofiou, F. I., Herekakis, T., Brioude, J., Stohl, A., Kahn, R. A., and Kontoes, C.: Smoke dispersion modeling over complex terrain using high resolution meteorological data and satellite observations – The FireHub platform, Atmos. Environ., 119, 348–361, https://doi.org/10.1016/j.atmosenv.2015.08.066, 2015. a
Solomos, S., Kalivitis, N., Mihalopoulos, N., Amiridis, V., Kouvarakis, G., Gkikas, A., Binietoglou, I., Tsekeri, A., Kazadzis, S., Kottas, M., Pradhan, Y., Proestakis, E., Nastos, P. T., and Marenco, F.: From Tropospheric Folding to Khamsin and Foehn Winds: How Atmospheric Dynamics Advanced a Record-Breaking Dust Episode in Crete, Atmosphere, 9, 240, https://doi.org/10.3390/atmos9070240, 2018. a
Sourdeval, O., Gryspeerdt, E., Krämer, M., Goren, T., Delanoë, J., Afchine, A., Hemmer, F., and Quaas, J.: Ice crystal number concentration estimates from lidar–radar satellite remote sensing – Part 1: Method and evaluation, Atmos. Chem. Phys., 18, 14327–14350, https://doi.org/10.5194/acp-18-14327-2018, 2018. a, b
Steinke, I., Hoose, C., Möhler, O., Connolly, P., and Leisner, T.: A new temperature- and humidity-dependent surface site density approach for deposition ice nucleation, Atmos. Chem. Phys., 15, 3703–3717, https://doi.org/10.5194/acp-15-3703-2015, 2015. a, b, c, d, e, f
Sullivan, S. C., Morales Betancourt, R., Barahona, D., and Nenes, A.: Understanding cirrus ice crystal number variability for different heterogeneous ice nucleation spectra, Atmos. Chem. Phys., 16, 2611–2629, https://doi.org/10.5194/acp-16-2611-2016, 2016. a
Sullivan, S. C., Hoose, C., and Nenes, A.: Investigating the contribution of secondary ice production to in‐cloud ice crystal numbers, J. Geophys. Res.-Atmos., 122, 9391–9412, https://doi.org/10.1002/2017JD026546, 2017. a
Sullivan, S. C., Hoose, C., Kiselev, A., Leisner, T., and Nenes, A.: Initiation of secondary ice production in clouds, Atmos. Chem. Phys., 18, 1593–1610, https://doi.org/10.5194/acp-18-1593-2018, 2018. a
Tackett, J. L., Winker, D. M., Getzewich, B. J., Vaughan, M. A., Young, S. A., and Kar, J.: CALIPSO lidar level 3 aerosol profile product: version 3 algorithm design, Atmos. Meas. Tech., 11, 4129–4152, https://doi.org/10.5194/amt-11-4129-2018, 2018. a
Tao, W.-K., Chen, J.-P. , Li, Z., Wang, C., and Zhang, C.: Impact of aerosols on convective clouds and precipitation, Rev. Geophys., 50, RG2001, https://doi.org/10.1029/2011RG000369, 2012. a
Tesche, M., Ansmann, A., Müller, D., Althausen, D., Engelmann, R., Freudenthaler, V., and Groß, S.: Vertically resolved separation of dust and smoke over Cape Verde using multiwavelength Raman and polarization lidars during Saharan Mineral Dust Experiment 2008, J. Geophys. Res., 114, D13202, https://doi.org/10.1029/2009JD011862, 2009. a, b
Tesche, M., Wandinger, U., Ansmann, A., Althausen, D., Müller, D., and Omar, A. H.: Ground-based validation of CALIPSO observations of dust and smoke in the Cape Verde region, J. Geophys. Res. Atmos., 118, 2889–2902, https://doi.org/10.1002/jgrd.50248, 2013.
Twohy, C. H., Kreidenweis, S. M., Eidhammer, T., Browell, E. V., Heymsfield, A. J., Bansemer, A. R., Anderson, B. E., Chen, G., Ismail, S., DeMott, P. J., and Van Den Heever, S. C.: Saharan dust particles nucleate droplets in eastern Atlantic clouds, Geophys. Res. Lett., 36, L01807, https://doi.org/10.1029/2008GL035846, 2009. a
Twohy, C. H., Anderson, B. E., Ferrare, R. A., Sauter, K. E., L'Ecuyer, T. S., van den Heever, S. C., Heymsfield, A. J., Ismail, S., and Diskin, G. S.: Saharan dust, convective lofting, aerosol enhancement zones, and potential impacts on ice nucleation in the tropical upper troposphere, J. Geophys. Res.-Atmos., 122, 8833–8851, https://doi.org/10.1002/2017JD026933, 2017. a
Ullrich, R., Hoose, C., Möhler, O., Niemand, M., Wagner, R., Höhler, K., Hiranuma, H., Saathoff, H., and Leisner, T.: A new ice nucleation active site parameterization for desert dust and soot, J. Atmos. Sci., 74, 699–717, https://doi.org/10.1175/JAS-D-16-0074.1, 2017. a, b, c, d, e, f, g, h, i, j, k, l, m, n, o, p, q, r
Vali, G., DeMott, P. J., Möhler, O., and Whale, T. F.: Technical Note: A proposal for ice nucleation terminology, Atmos. Chem. Phys., 15, 10263–10270, https://doi.org/10.5194/acp-15-10263-2015, 2015. a
Vaughan, M., Pitts, M., Trepte, C., Winker, D., Detweiler, P., Garnier, A., Getzewich, B., Hunt, W., Lambeth, J., Lee, K.-P.,Lucker, P., Murray, T., Rodier, S., Tremas, T., Bazureau, A., and Pelon, J.: Cloud-Aerosol LIDAR Infrared Pathfinder Satellite Observations (CALIPSO) data management system data products catalog, Release 4.50, NASA Langley Research Center Document PC-SCI-503, 173 pp., available at: https://www-calipso.larc.nasa.gov/products/CALIPSO_DPC_Rev4x50.pdf, last access: 12 August 2019. a
Vergara-Temprado, J., Murray, B. J., Wilson, T. W., O'Sullivan, D., Browse, J., Pringle, K. J., Ardon-Dryer, K., Bertram, A. K., Burrows, S. M., Ceburnis, D., DeMott, P. J., Mason, R. H., O'Dowd, C. D., Rinaldi, M., and Carslaw, K. S.: Contribution of feldspar and marine organic aerosols to global ice nucleating particle concentrations, Atmos. Chem. Phys., 17, 3637–3658, https://doi.org/10.5194/acp-17-3637-2017, 2017. a
Weinzierl, B., Petzold, A., Esselborn, M., Wirth, M., Rasp, K., Kandler, K., Schütz, L., Koepke, P., and Fiebig, M.: Airborne measurements of dust layer properties, particle size distribution and mixing state of Saharan dust during SAMUM 2006, Tellus B, 61, 96–117, https://doi.org/10.1111/j.1600-0889.2008.00392.x, 2009. a
Westbrook, C. D. and Illingworth A. J.: Evidence that ice forms primarily in supercooled liquid clouds at temperatures ∘C, Geophys. Res. Lett., 38, L14808, https://doi.org/10.1029/2011GL048021, 2011. a
Wilson, T. W., Ladino, L. A., Alpert, P. A., Breckels, M. N., Brooks, I. M., Browse, J., Burrows, S. M., Carslaw, K. S., Huffman, J. A., Judd, C., Kilthau, W. P., Mason, R. H., McFiggans, G., Miller, L. A., Najera, J. J., Polishchuk, E., Rae, S., Schiller, C. L., Si, M., Temprado, J. V., Whale, T. F., Wong, J. P. S., Wurl, O., Yakobi-Hancock, J. D., Abbatt, J. P. D., Aller, J. Y., Bertram, A. K., Knopf, D. A., and Murray, B. J.: A marine biogenic source of atmospheric ice-nucleating particles, Nature, 525, 234–238, https://doi.org/10.1038/nature14986, 2015. a
Winker, D. M., Vaughan, M. A., Omar, A., Hu, Y., Powell, K. A., Liu, Z., Hunt, W. H., and Young, S. A.: Overview of the CALIPSO Mission and CALIOP Data Processing Algorithms, J. Atmos. Ocean. Tech., 26, 2310–2323, https://doi.org/10.1175/2009JTECHA1281.1, 2009. a
- Abstract
- Introduction
- INP parameterizations
- Instruments and methodology
- Results and discussion
- Summary and conclusions
- Data availability
- Appendix A: Lidar retrievals of nINP
- Author contributions
- Competing interests
- Special issue statement
- Acknowledgements
- Financial support
- Review statement
- References
The requested paper has a corresponding corrigendum published. Please read the corrigendum first before downloading the article.
- Article
(11610 KB) - Full-text XML
- Abstract
- Introduction
- INP parameterizations
- Instruments and methodology
- Results and discussion
- Summary and conclusions
- Data availability
- Appendix A: Lidar retrievals of nINP
- Author contributions
- Competing interests
- Special issue statement
- Acknowledgements
- Financial support
- Review statement
- References