the Creative Commons Attribution 4.0 License.
the Creative Commons Attribution 4.0 License.
 | 26 Aug 2019
Observationally constrained analysis of sea salt aerosol in the marine atmosphere
Huisheng Bian
Karl Froyd
Daniel M. Murphy
Jack Dibb
Anton Darmenov
Mian Chin
Peter R. Colarco
Arlindo da Silva
Tom L. Kucsera
Gregory Schill
Hongbin Yu
Paul Bui
Maximilian Dollner
Bernadett Weinzierl
Alexander Smirnov
Atmospheric sea salt plays important roles in marine cloud formation and atmospheric chemistry. We performed an integrated analysis of NASA GEOS model simulations run with the GOCART aerosol module, in situ measurements from the PALMS and SAGA instruments obtained during the NASA ATom campaign, and aerosol optical depth (AOD) measurements from the AERONET Marine Aerosol Network (MAN) and from MODIS satellite observations to better constrain sea salt in the marine atmosphere. ATom measurements and GEOS model simulations both show that sea salt concentrations over the Pacific and Atlantic oceans have a strong vertical gradient, varying up to 4 orders of magnitude from the marine boundary layer to free troposphere. The modeled residence times suggest that the lifetime of sea salt particles with a dry diameter of less than 3 µm is largely controlled by wet removal, followed by turbulent process. During both boreal summer and winter, the GEOS-simulated sea salt mass mixing ratios agree with SAGA measurements in the marine boundary layer (MBL) and with PALMS measurements above the MBL. However, comparison of AOD from GEOS with AERONET/MAN and MODIS aerosol retrievals indicated that the model underestimated AOD over the oceans where sea salt dominates. The apparent discrepancy of slightly overpredicted concentration and large underpredicted AOD could not be explained by biases in the model RH affecting the particle hygroscopic growth, as modeled RH was found to be comparable to or larger than the in situ measurements. This conundrum could at least partially be explained by the difference in sea salt size distribution; the GEOS simulation has much less sea salt percentage-wise in the smaller particle size range and thus less efficient light extinction than what was observed by PALMS.


Bubble-bursting and jet drops at the ocean surface result in the production of sea spray particles composed of inorganic sea salt and organic matter (e.g., de Leeuw et al., 2011; Quinn and Bates, 2014). Among various atmospheric aerosol components, sea salt is estimated to have the largest mass emission flux and the second-largest atmospheric mass loading globally (Textor et al., 2006). Sea salt particles in the atmosphere could exert direct radiative effect of around −1.5 to −5.03 W m−2 annually at the top of the atmosphere (IPCC, 2001). On a global and annual scale, the direct radiative effect of sea salt is equal to or greater in magnitude than that of natural sulfate and soil dust (Jacobson, 2001; Takemura et al., 2002). Sea salt particles are efficient cloud condensation nuclei (CCN). Consequently, sea salt particles have indirect effects on climate and weather (Dadashazaer et al., 2017; Dall'Osto et al., 2017, 2018; Kogan et al., 2012; Pierce and Adams, 2006). Furthermore, sea salt aerosol particles serve as sinks for reactive gases and small particles and are a source of halogens to the atmosphere (e.g., Alexander al., 2005; Anastasio and Newberg, 2007; Lawler et al., 2011). There is also observational evidence suggesting that new particle formation may be suppressed in the presence of sea salt aerosol (Browse et al., 2014; Lewis and Schwartz, 2004). To quantify the effects of sea salt aerosol on the environment, a detailed knowledge of its mass, size, and vertical distribution is required. However, measurements of sea salt are not only sparse but also mostly limited to near the surface at a few locations (Prospero et al., 2003), posing difficulties in assessing the global environmental effects of sea salt as well as evaluating model skill at simulating sea salt vertical distributions and properties.
A recent NASA-funded Earth Venture suborbital project, the Atmospheric Tomography Mission (ATom), deployed an extensive gas and aerosol instrumental payload on the NASA DC-8 aircraft for systematic, global-scale sampling of the atmosphere in four seasons over a 3-year period (2016–2018), profiling continuously from 0.2 to 12 km altitude with flight routes over the Pacific Ocean, Atlantic Ocean, Southern Ocean, North America, and Greenland from 85∘ N to 65∘ S (see Fig. 1). For the first time, vertical profiles of sea salt aerosol concentration and size distribution are measured in ATom over vast oceanic routes in different seasons, providing an unprecedented opportunity for models to evaluate transport and parameterizations of physical and chemical processes.
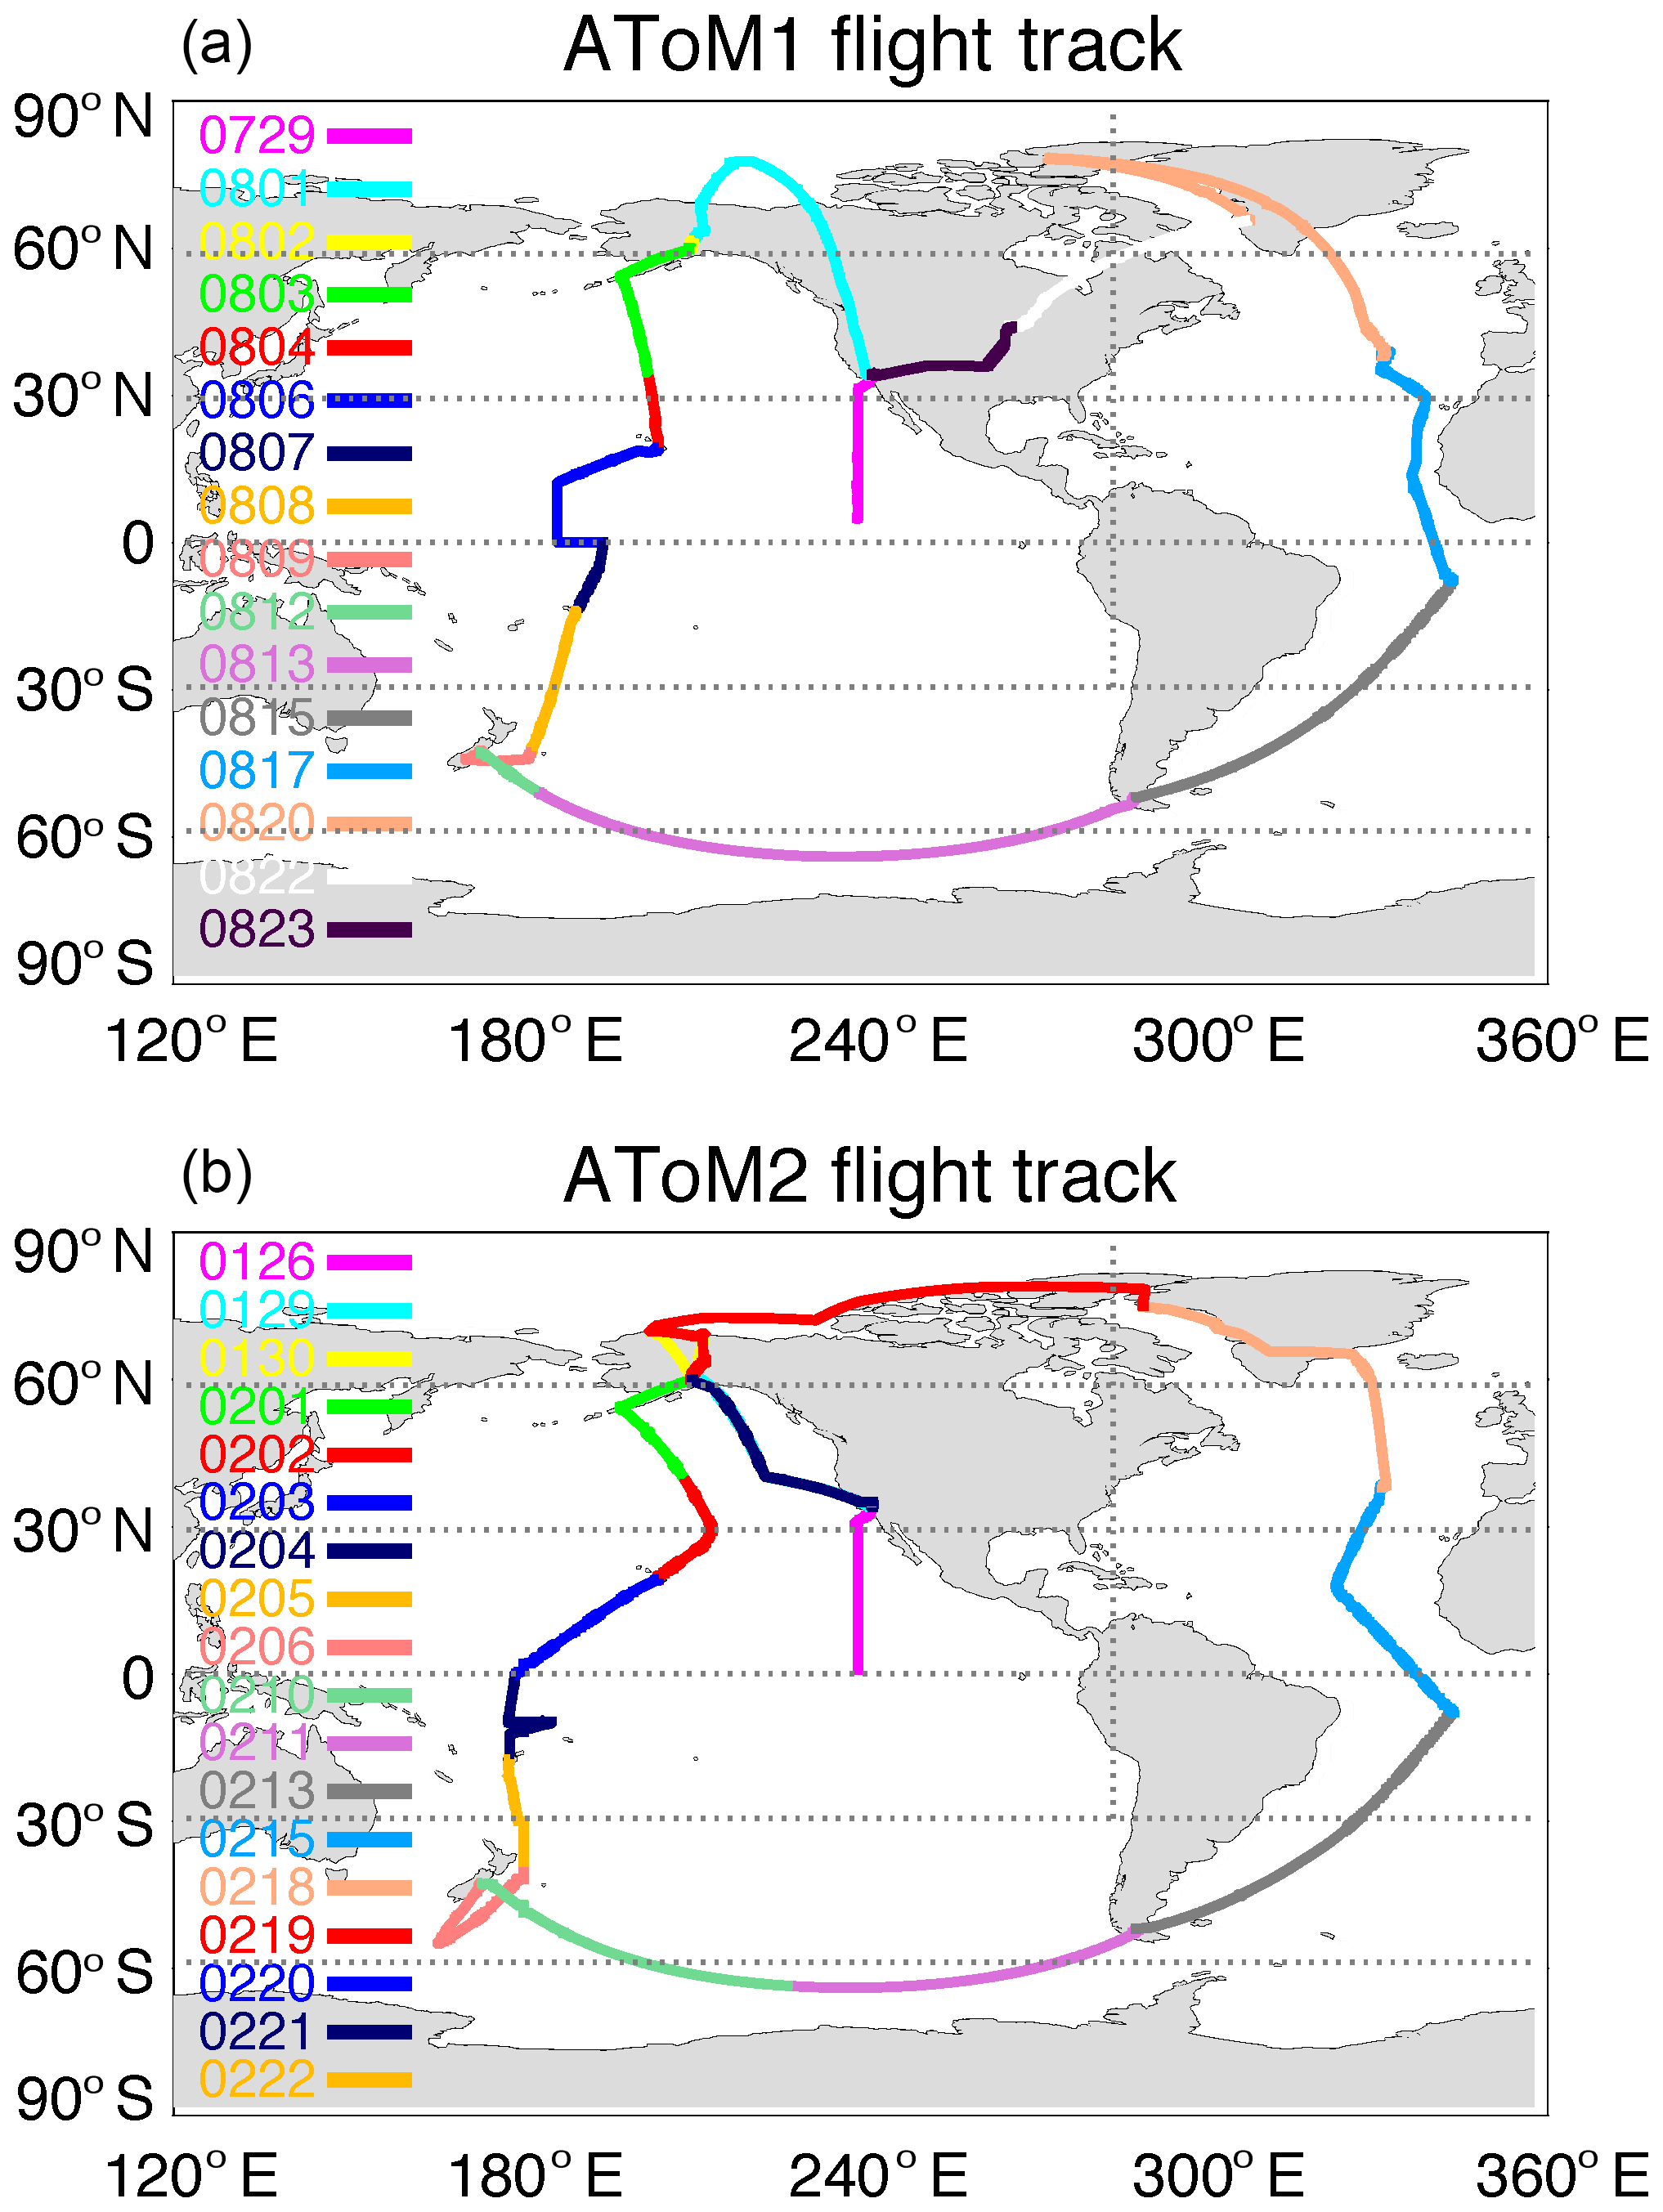
Figure 1AToM1 (a) and AToM2 (b) flight tracks sorted out for each flight day.
We present in this study a comprehensive evaluation of sea salt aerosol simulated with the Goddard Chemistry, Aerosol, Radiation, and Transport model (GOCART) in the Goddard Earth Observing System (GEOS) framework using aerosol measurements obtained during the first two ATom deployments, which represent the summer and winter seasons for both hemispheres. We utilize ATom's high-frequency vertical measurements of sea salt over global remote oceans from the marine boundary layer (MBL) to the upper troposphere, in contrast with previous model validations of sea salt simulation performed with in situ measurements at the surface and over limited selected locations and regions (Chin et al., 2014; Kishcha et al., 2011; Spada et al., 2013, 2015; Tsyro et al., 2011; Witek et al., 2007) and typically using only monthly averaged observations (Grini et al., 2002; Textor et al., 2006). We compare the model-simulated sea salt vertical distributions with observations in various latitudinal zones over the Pacific and Atlantic oceans, refer to dry and wet deposition processes, and examine the sea salt size distribution that is important to both aerosol optical depth (AOD) calculations and cloud formation.
The GEOS/GOCART model is described in Sect. 2, particularly the sea salt emission scheme used in this study. The NASA ATom field campaign is introduced in Sect. 3, including a brief description of the Particle Analysis by Laser Mass Spectrometry (PALMS) and Soluble Acidic Gases and Aerosols (SAGA) instruments that are used to provide sea salt measurements. Measured and modeled vertical profiles, size distributions, and AOD are compared to assess model emissions and removal processes in Sect. 4. In Sect. 5, we summarize the outcome of our study and discuss the potentially important chemical and physical processes that likely have an impact on sea salt simulation and recommend future improvements.
Global aerosol is simulated by GEOS/GOCART, which is the global aerosol model GOCART (Chin et al., 2002, 2014) implemented in the GEOS Earth system model (Gelaro et al., 2017; Rienecker et al., 2011). The GEOS/GOCART aerosols include dust, sea salt, sulfate, nitrate, ammonium, black carbon, and organic matter, all mixed externally (Bian et al., 2013, 2017; Colarco et al., 2010).
Sea salt emissions are controlled by aerosol particles generated from collapsing bubbles and ejected jet droplets that in turn are directly related to the whitecap fraction in the ocean and are commonly parameterized as a function of wind speed and sea surface temperature (SST). The sea salt emission scheme in the GEOS/GOCART model was initially based on the algorithm of Gong (2003), who provided a parameterization of the size-resolved flux of sea salt particles as a function of the 10 m wind speed. Two modifications to this scheme were subsequently developed based on comparisons of simulated sea salt aerosol to satellite AOD from the Moderate Resolution Imaging Spectroradiometer (MODIS) (Darmenov et al., 2013; Randles et al., 2017): (1) the emission function was recalibrated in terms of the surface friction velocity rather than the 10 m wind speed, and (2) an SST correction term that is similar to the work of Jaeglé et al. (2011) was introduced. The model's surface winds are constrained by the two satellite observations, Special Sensor Microwave Imager (SSM/I) and Quick Scatterometer (QuikSCAT) (Rienecker et al., 2011). This emission algorithm is the default GEOS/GOCART sea salt emission and is used in this study.
The current default setting of GEOS/GOCART allows sea salt to be completely removed by warm clouds from convective updraft and from large-scale rainout and washout. Sea salt can also be removed by dry deposition (turbulent) and sedimentation. These processes were described in Chin et al. (2002). We assume that the particles undergo hygroscopic growth according to the equilibrium parameterization of Gerber (1985), which is a function of the relative humidity (RH). The humidified particle sizes are considered in our computations of the particle sedimentation, aerodynamic deposition velocity, and optical properties.
The GEOS/GOCART includes five bulk sea salt size bins in the range of 0.06–20 µm in dry diameter. Specifically, they are 0.06–0.2, 0.2–1.0, 1.0–3.0, 3.0–10, and 10–20 µm, respectively. The first bin was not included in the previous GOCART versions (Chin et al., 2002, 2014) but was added to facilitate aerosol–cloud interactions and optical property studies (Colarco et al., 2010). We further classify the first two bins as fine mode and the remaining bins as coarse mode throughout this paper. The sea salt particle density is 2200 (kg m−3) for all sizes.
In this study, we ran GEOS/GOCART at a global ∼50 km horizontal resolution on the cubed-sphere grid and 72 vertical layers from surface to 0.01 hPa. We ran the model in the “replay” mode, which sets the model dynamical state (winds, pressure, and temperature) at every 6 h to the balanced state provided by the meteorological reanalysis fields from the Modern-Era Reanalysis for Research and Applications version 2 (MERRA-2). An 18-month simulation was conducted from the beginning of 2016 to cover the first two phases of ATom measurement periods, with the first half year as a spin-up period.
ATom provides measurements for various important atmospheric gases, aerosols, and their precursors over vast open oceans. Among these, sea salt has been measured by two instruments, the NOAA PALMS instrument, which provides mass mixing ratio and size distribution up to 3 µm in dry diameter, and the University of New Hampshire SAGA instrument, which includes measurements of sodium ion (Na+) as a proxy of sea salt.
PALMS is a laser ionization mass spectrometer that makes in situ measurements of the chemical composition of individual aerosol particles. A detailed description of PALMS, including its physical working mechanism and measurement features, has been given by Murphy et al. (2019) and Froyd et al. (2019). The instrument is capable of measuring particles from 0.12 to 3 µm in dry diameter and analysis is completed in less than 1 ms after the aerosols enter the inlet. The real power of the PALMS sea salt measurements is twofold: (a) high sensitivity at low concentrations above the MBL such that the measured vertical profiles are more reliable than most previous data, and (b) the data are size-segregated up to 3 µm in dry diameter, covering the active size range for optical and radiative calculations.
On the other hand, the sea salt aerosol mass concentration from SAGA is deduced by applying a factor of 3.27 to the measured Na+ mass concentration (Keene et al., 1986; Wilson, 1975). This assumes that all of the measured Na+ comes from sea salt, which should be a reasonable assumption for most ATom samples. SAGA collects particles on a filter with a sampling frequency of around 5–15 min to allow more time for the filter media to collect sufficient particles. As reported by the DC-8 Inlet Characterization Experiment (DICE), the SAGA inlet performed nearly identically in the marine boundary environment to the University of Hawaii inlet used by PALMS during ATom (McNaughton et al., 2007). In other words, the cut-off size of the SAGA instrument is also roughly 3 µm in dry diameter. As shown in Murphy et al. (2019), sea salt concentrations inferred from the SAGA sodium data are highly correlated with PALMS sea salt data in the cloud-free MBL.
We use ATom1 (July–August 2016) and ATom2 (January–February 2017) campaign data in this study. These two deployments combined together provided detailed information for summer and winter on a global scale.
4.1 Comparisons in the marine boundary layer
Sea salt is sufficiently rich in the MBL that SAGA can collect enough aerosol there for analysis. Comparisons of the sea salt in a layer from surface up to 1.5 km between the model simulation and ATom (PALMS and SAGA) measurements are shown in Fig. 2a. To have a proper comparison, we made three data treatments. First, we excluded SAGA samples with significant dust signal, identified when the measurements meet the two conditions: Ca2+ greater than 0.05 µg sm−3 and the ratio of Ca2+ to Na+ greater than 0.06. Second, we only include GEOS sea salt particles smaller than 3 µm in dry diameter in order to be consistent with the instrument measurements. Third, we sampled GEOS and PALMS data at the SAGA measurement time frequency when the SAGA has valid measurements. The correlation coefficients (R) between the model and PALMS or SAGA data are generally higher than 0.79 and the covariance (R2) higher than 0.64 in both ATom1 and 2 periods.

Figure 2(a) Scatter plot of sea salt between GEOS and PALMS (magenta) and between GEOS and SAGA (blue) in ATom1 (symbol +) and ATom2 (symbol ⋄) for all flight measurements within 1.5 km atmospheric thickness above ocean surface. The SAGA samples are filtered out when dust signal is significant. The GEOS sea salt shown here are cut at 3 µm in dry diameter. Both GEOS and PALMS data are then sampled using SAGA measurement time frequency. The statistical parameter r is the correlation coefficient and b is the ratio of SS(GEOS) to SS(ATom). (b) Similar to (a) with the samples contaminated by clouds further excluded using CAPS cloud indicator.
There are outliers on the Fig. 2a. Just a small amount of cloud can wash off salt previously deposited on an inlet wall. Therefore, in Fig. 2b we excluded samples that might be contaminated by clouds during sampling, using a cloud indicator from the Cloud, Aerosol, and Precipitation Spectrometer (CAPS). The outliers are gone on Fig. 2b and the correlation coefficients between model and measurements are indeed improved from 0.82–0.84 to 0.85–0.87. On the other hand, the GEOS sea salt mass mixing ratios are still more than double of those of PALMS (2.3 in ATom1 and 4.7 in ATom2), which could be at least partially explained by potential sampling biases in PALMS instrument, particularly in the size distribution. The cut-off at 3 µm in dry diameter is recommended by the instrument teams, it is known that this is subject to a large uncertainty of wet/dry size ratio that is strongly dependent on ambient relative humidity. Furthermore, the sea salt mass distribution is (sometimes) still rising sharply through the inlet cutpoints. Considering the combination of all these systematic and random uncertainties, which are decreased across the sea salt coarse mode, the measurement can easily result in uncertainties on the order of ∼2x in dry mass. When checking the comparison between GEOS and SAGA, GEOS sea salt mixing ratio is comparable to or slightly larger than SAGA results (i.e., ratio of GEOS to SAGA is 0.92 in ATom1 and 1.3 in ATom2). Overall, the GEOS is most likely to overestimate sea salt mass during February. Comparing sea salt between the two instruments directly shows a high correlation (0.81 in ATom1 and 0.94 in ATom2), while sea salt mass of PALMS is only 36 % (ATom1) and 24 % (ATom2) of that in SAGA (also see Murphy et al., 2019).
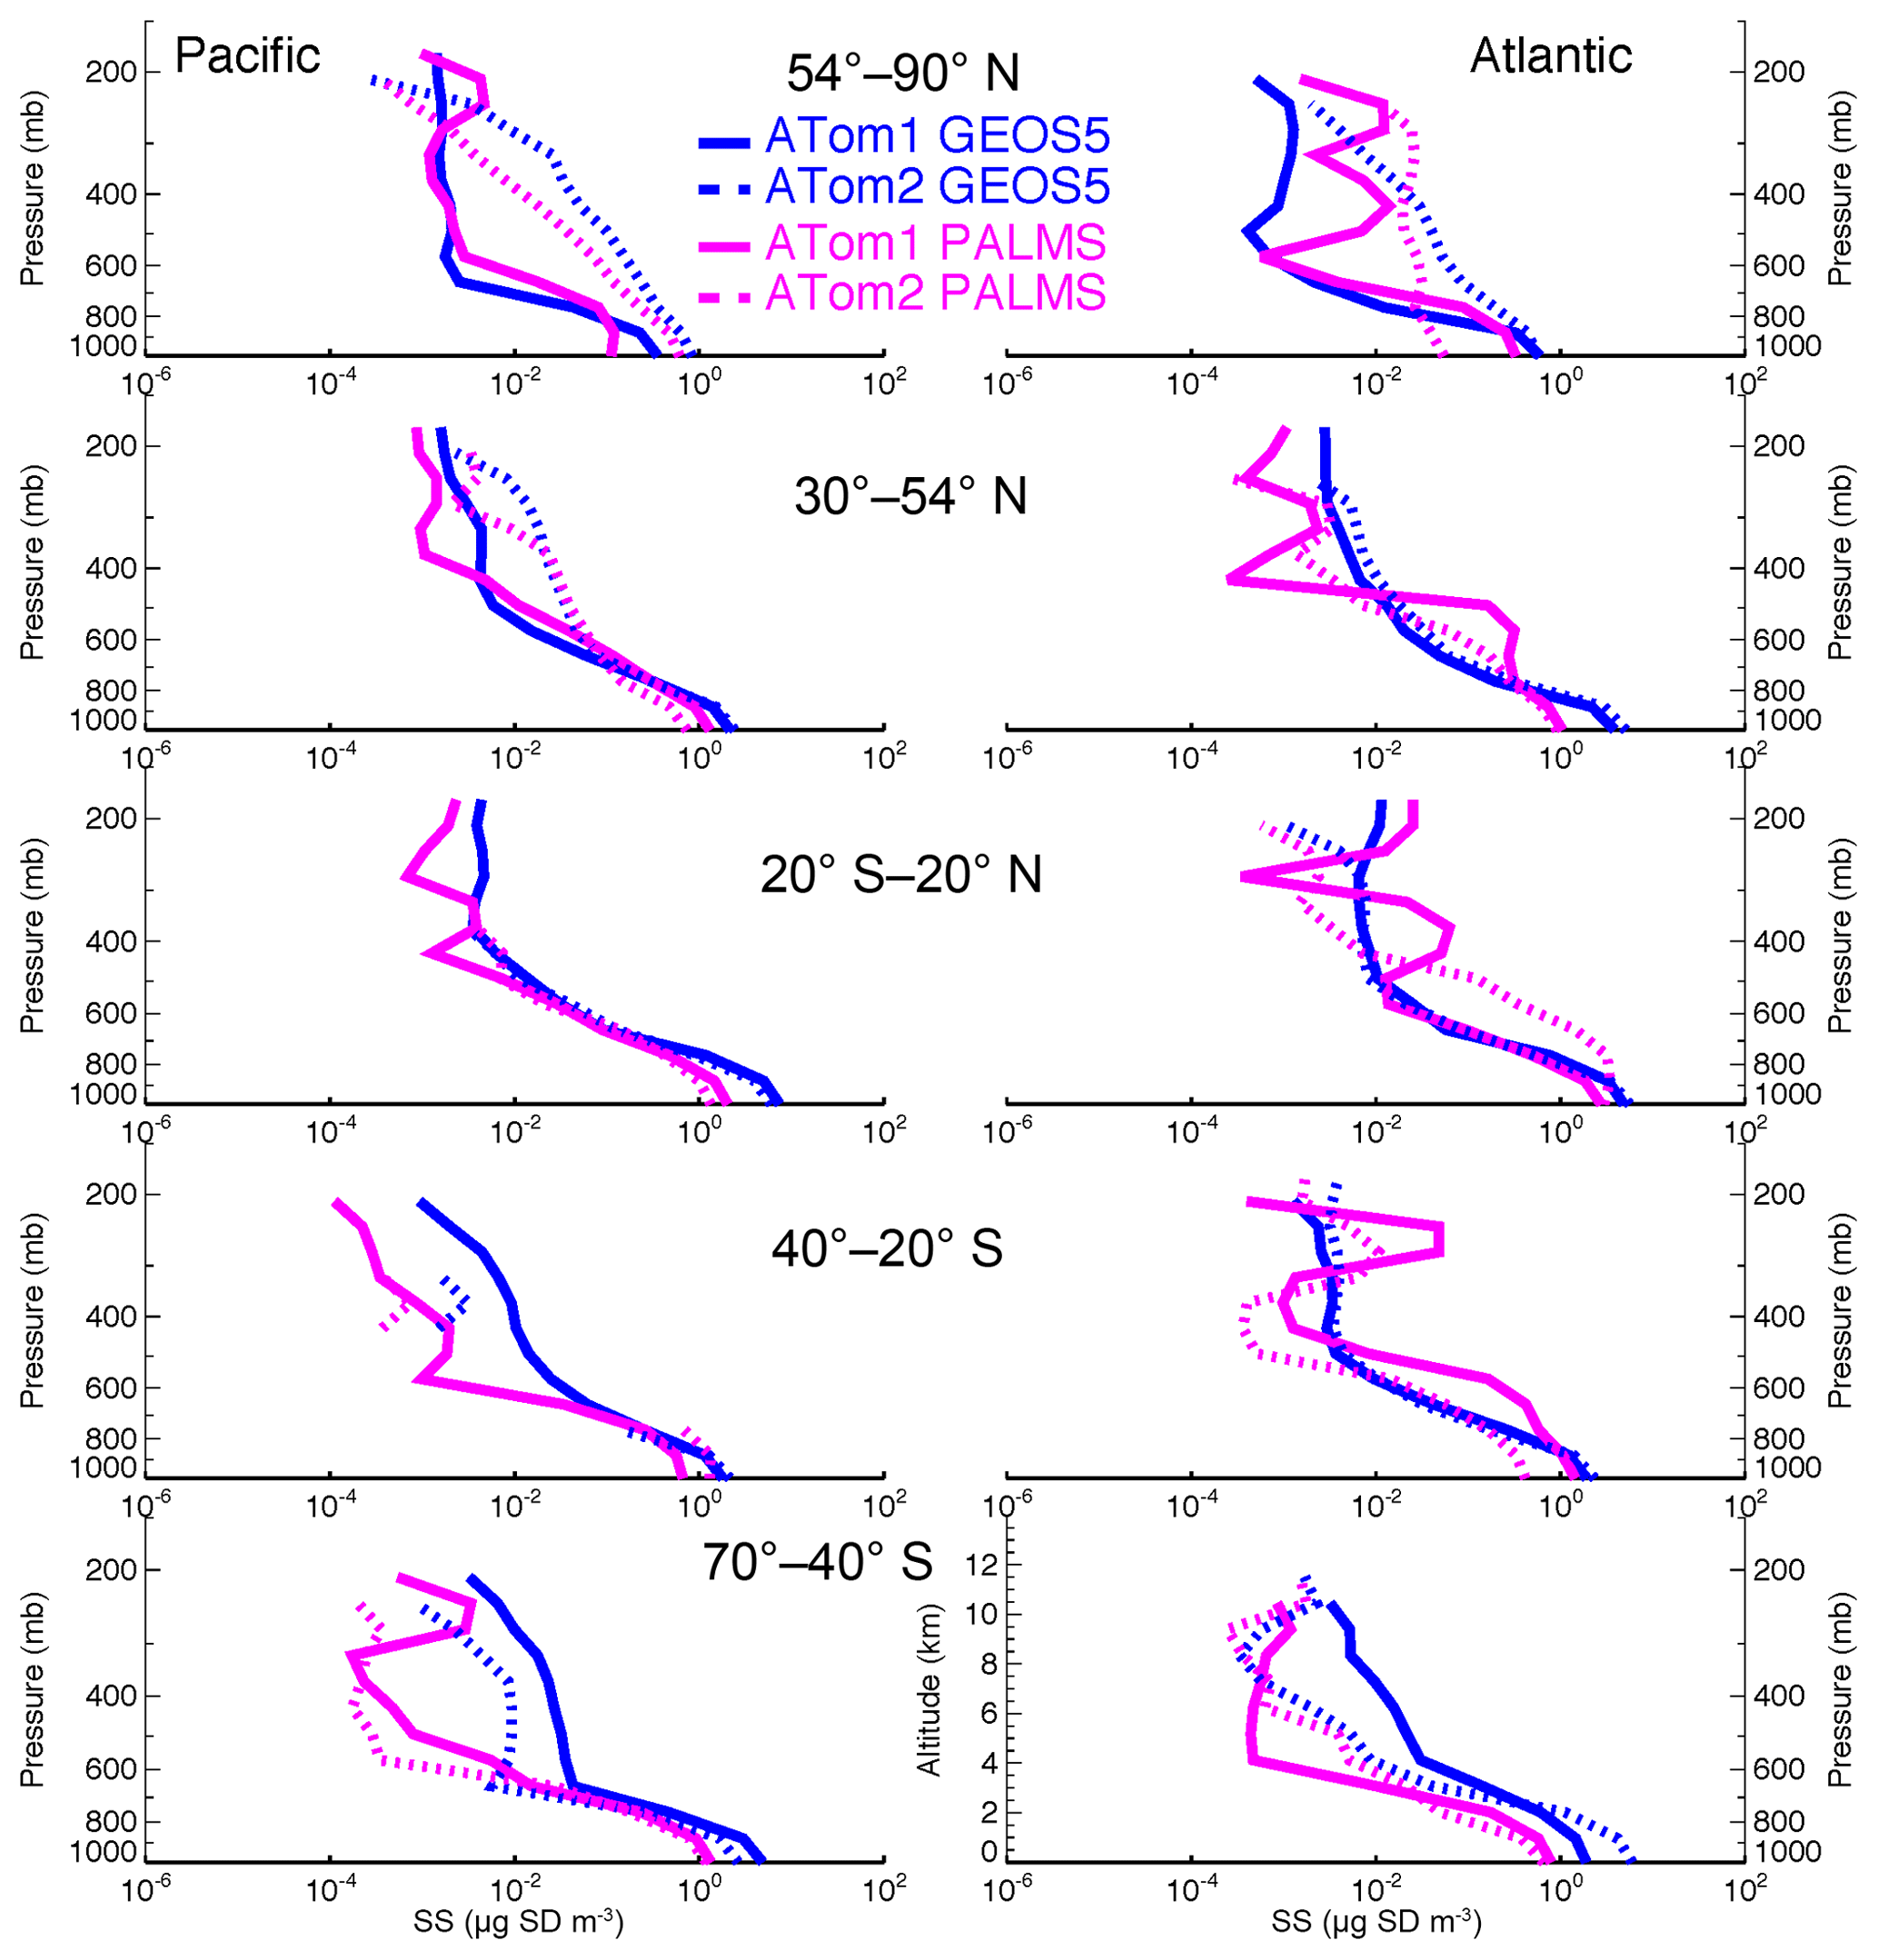
Figure 3Sea salt (Dp<3 µm) vertical profiles from GEOS simulation and PALMS measurement along ATom1 and ATom2 flight tracks in five latitudinal bands over the Pacific and Atlantic oceans. The latitudinal bands are marked by dotted grey lines in Fig. 1.
4.2 Vertical distribution
Understanding the sea salt vertical distribution is important, particularly in the tropical marine upper troposphere where a reliable background aerosol field is needed. However, most previous sea salt measurements were limited to the surface or near coastal areas, leading to nearly no in situ observations of the vertical distribution of sea salt over vast areas of the open oceans. The ATom measurements fill this gap by providing measurements over the Pacific, Atlantic, and Southern oceans from near surface to the upper troposphere (0.2–12 km). Furthermore, the PALMS instrument measures in situ sea salt mass and size distribution. The high sensitivity of the PALMS instrument makes its data very useful in studying the relatively clean environments above the MBL. Using the ATom sea salt measurements over remote open oceans has some additional advantages over previous studies. For instance, airborne measurements alleviate biases typical at land stations due to onshore wave breaking activities, especially at sites with steep topography (Witek et al., 2007; Spada et al., 2015).
Figure 3 shows the sea salt vertical profiles of the PALMS measurement and the GEOS model simulation over five latitudinal zones over the Pacific and Atlantic oceans in ATom1 and ATom2. The GEOS model results are sampled at the time and location closest to the measurement points. As discussed in Sect. 4.1, modeled sea salt mass concentrations are higher than the PALMS data near the surface over all latitudinal zones during both summer and winter seasons.
There are often two vertical regimes: a sharp gradient of sea salt in the lower atmosphere and a lesser gradient above. Wet removal processes, particularly convective cloud removal, are likely the driving factors for the sea salt distribution in the size range considered in this study (Table 1, column 2). Sea salt is a highly soluble species. It is assumed to fully dissolve in clouds, resulting in efficient removal by shallow marine clouds, typically marine stratus and stratocumulus clouds (Eastman et al., 2011; Lebsock et al., 2011; Wood, 2012; Zhou et al., 2015). Sea salt dry deposition (turbulent) and sedimentation also contribute to its removal from low altitudes. Interestingly, the sedimentation process plays the smallest removal role for the sea salt particles with a diameter less than 3 µm, whereas it overwhelmingly controls sea salt loss rate (i.e., more than 1.5 times those of all other processes combined) when coarser-mode sea salt is included (see Table 1, column 3). This is expected because nearly 90 % of injected sea salt mass is in coarse mode based on our emission scheme. Since sea salt is found mostly in the lower atmosphere, further removal of sea salt particles by cold clouds was found to have only marginal impact on its mass budget in our sensitivity studies, although its feedback on cold clouds needs further study. Note that results in Table 1 are summarized on an annual basis from July 2016 to June 2017.
Table 1Sea salt (SS) budget analysis on annual basis from July 2016 to June 2017 (second column: GEOS SS up to 3 µm in dry diameter; third column: GEOS SS for all bins; fourth column: AeroCom SS for all bins).
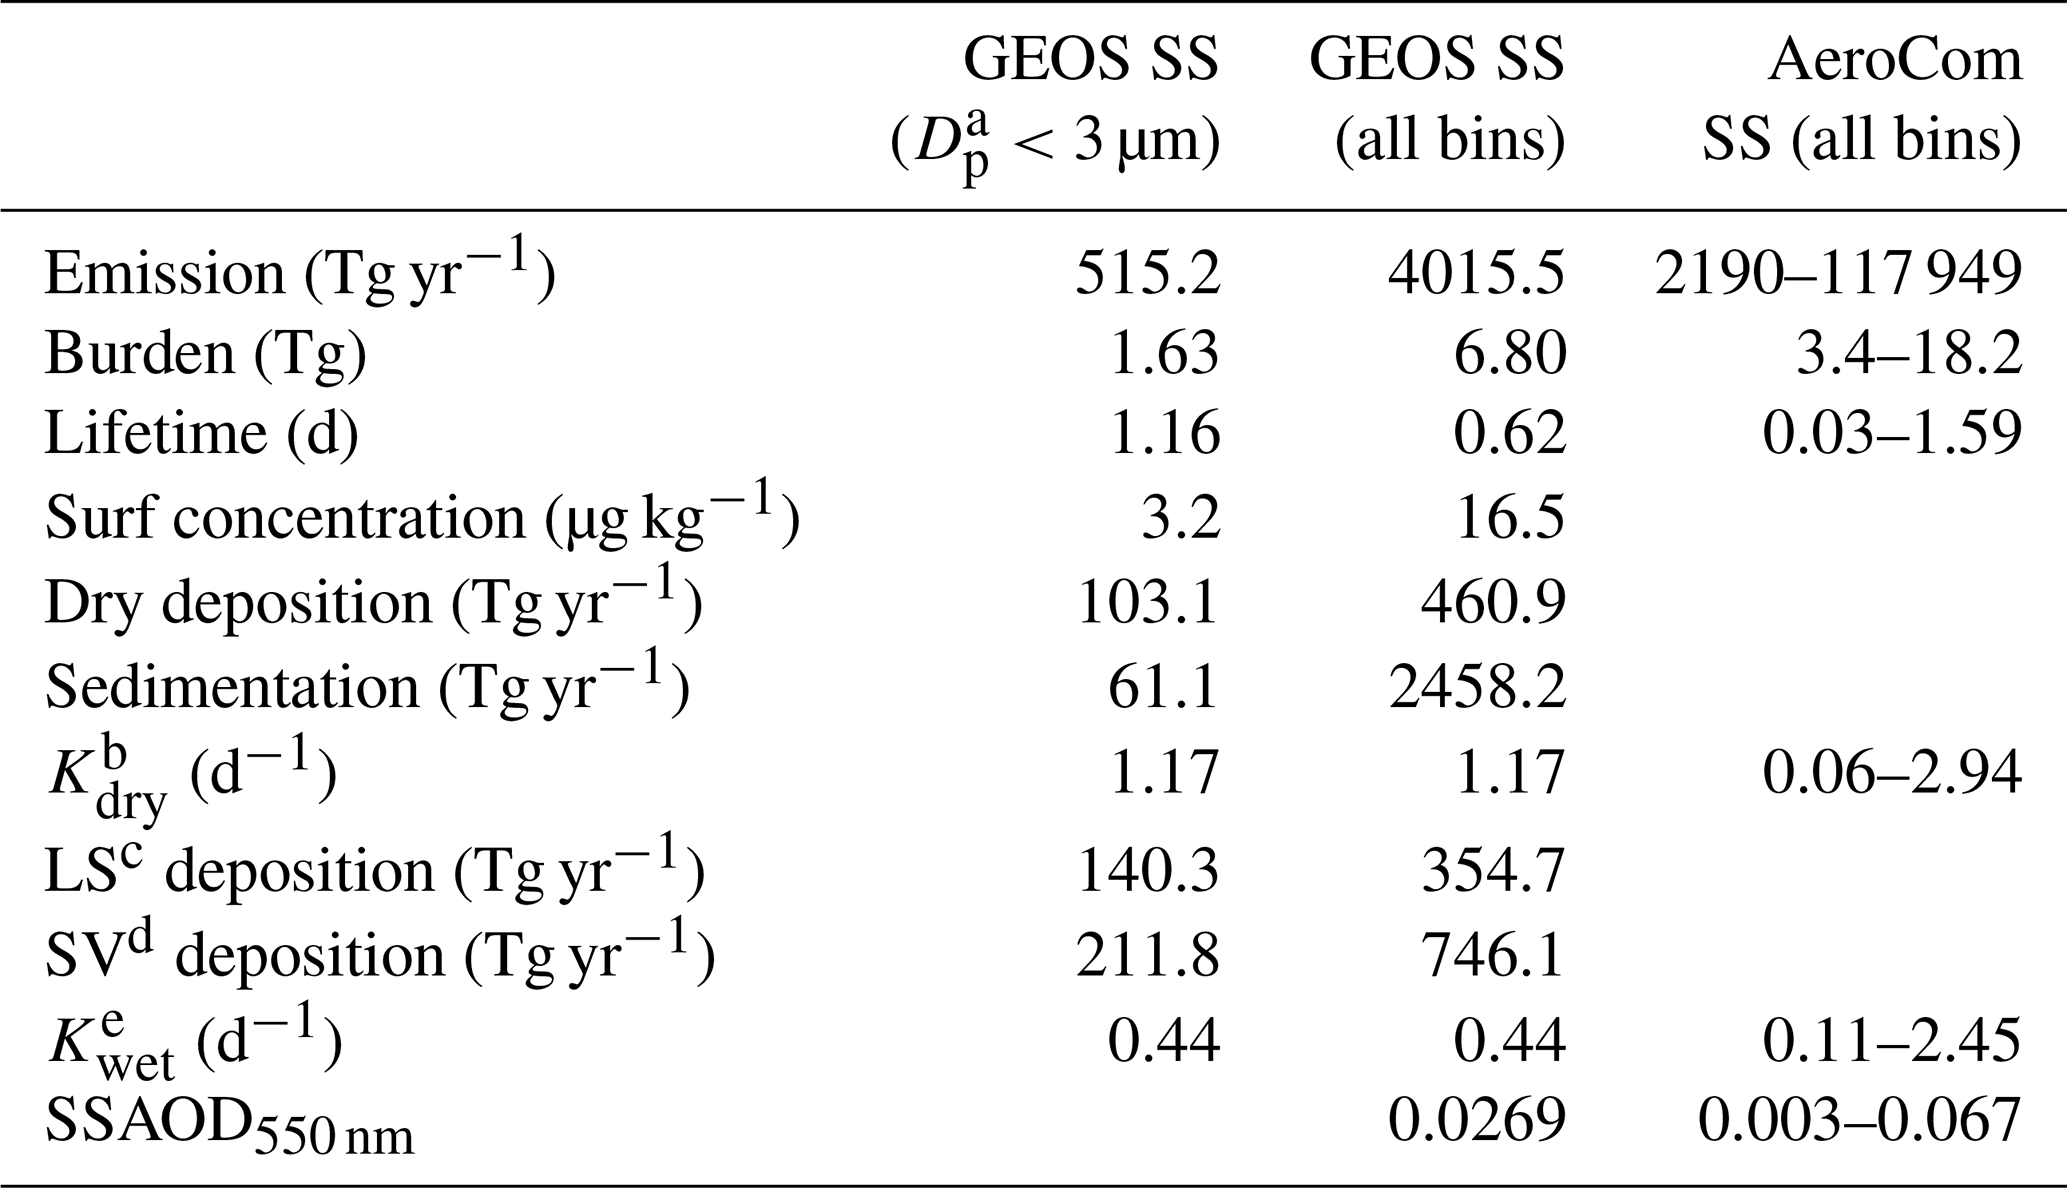
a Dp: particle diameter (µm); b Kdry: loss frequency due to dry deposition and sedimentation (d−1); c LS: large-scale wet deposition (Tg yr−1); d SV: convective wet deposition (Tg yr−1); e Kwet: loss frequency due to wet large-scale and convective depositions (d−1).
Atmospheric convection impacts the sea salt vertical distribution as well. The height of the turnaround level (or the transition layer) between two vertical distribution regimes in Fig. 3 is around 600 hPa in the polar regions and moves up to 400 hPa in the tropical region, given that more vigorous convective activities occur in the tropical region. The seasonal variation in the vertical gradient is larger in polar regions than in tropical region, consistent with stronger seasonal variations in the meteorological fields (e.g., T, RH, wind, etc.) in high latitudes.
4.3 Marine aerosol AOD
To provide an overall picture of sea salt for this study, we compared the GEOS AOD with satellite MODIS Collection 6 (C6) Aerosol AOD retrieval (Levy et al., 2013) and AERONET Maritime Aerosol Network (MAN) measurements (Smirnov et al., 2017), focusing on sea-salt-dominated regions. AOD integrates extinction by all aerosols in the atmospheric column, with extinction dependent on the absolute mass, size distribution, hygroscopic growth, vertical distribution, and optical properties of each individual component and the composition of aerosols.
Figure 4 shows total AOD comparison between MODIS and GEOS in August 2016 and February 2017. Here, the GEOS AODs are sampled using daily MODIS AOD retrieval. The AODs are only shown where the fraction of sea salt AOD relative to the total aerosol AOD simulated by GEOS (fSSAOD, Fig. 4e and f) is larger than 0.6 so that we can focus our discussion over sea salt dominant regions. MODIS AODs are much higher than GEOS AODs for both seasons over remote oceans where sea salt dominates, by 0.043 in August 2016 and 0.062 in February 2017. These differences between MODIS and GEOS are higher than the potential positive bias of MODIS C6 AOD, up to 0.03, over oceans (Fig. 16 in Levy et al., 2013). It is difficult for us to remove the MODIS bias in the comparison shown in the Fig. 4 since the study of Levy et al. (2013) gave only statistical values of MODIS AOD bias without information about geophysical location.
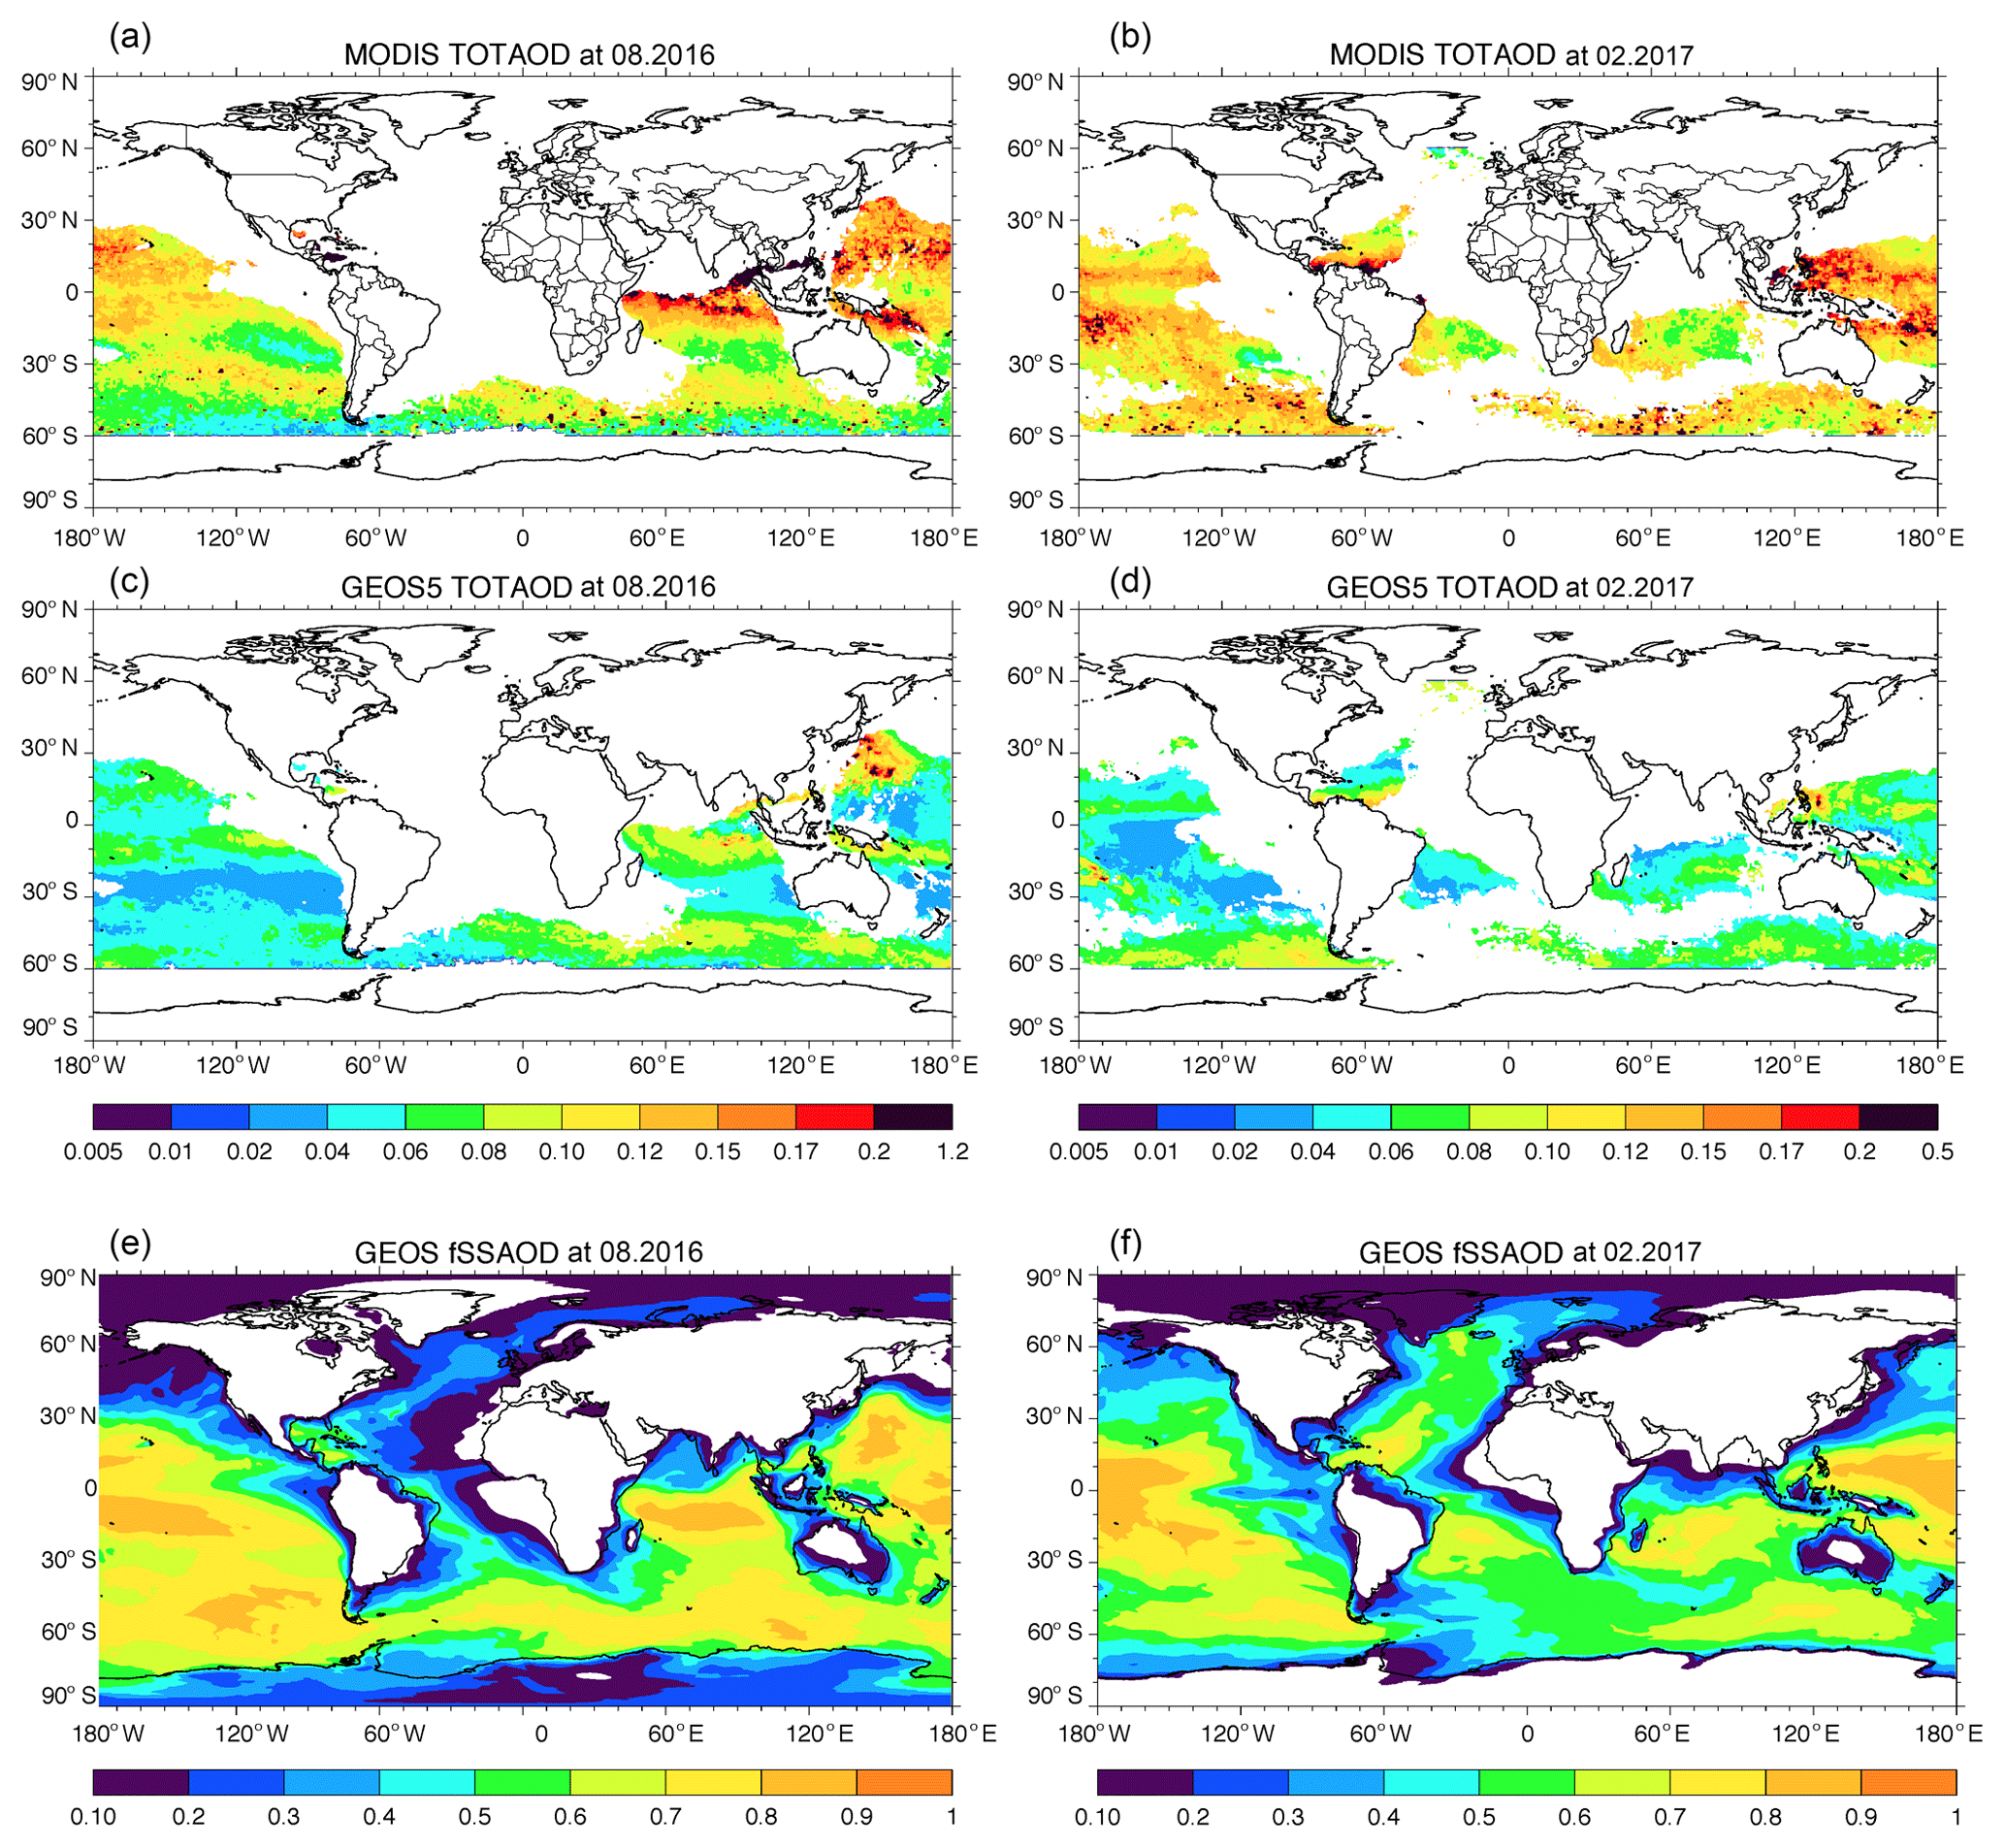
Figure 4Total aerosol AOD in August 2016 (a, c) and February 2017 (b, d) from MODIS (a, b) and GEOS (c, d). Panels (e, f) show the AOD fraction of sea salt relative to the total aerosol simulated by GEOS.
The conclusion of a lower GEOS AOD can also be found in Fig. 5 by comparing AOD between ground-based shipboard measurements and the GEOS simulations. AERONET MAN provides shipborne aerosol optical depth measurements from Microtops II sun photometers. The MAN data are not found to have the positive systematic bias reported for MODIS. MAN measurements from July 2016 to June 2017 are used in this study. The GEOS model results are sampled at the closest time and location of the ship-based measurements. The model AODs are much smaller than MAN measurements over a majority of the open ocean areas, except part of the Atlantic Ocean where AOD was impacted by dust. The scatter plot at the bottom of the figure clearly indicates that the modeled AOD is biased low, especially over the Southern Ocean where the model AOD is less than half of MAN's.
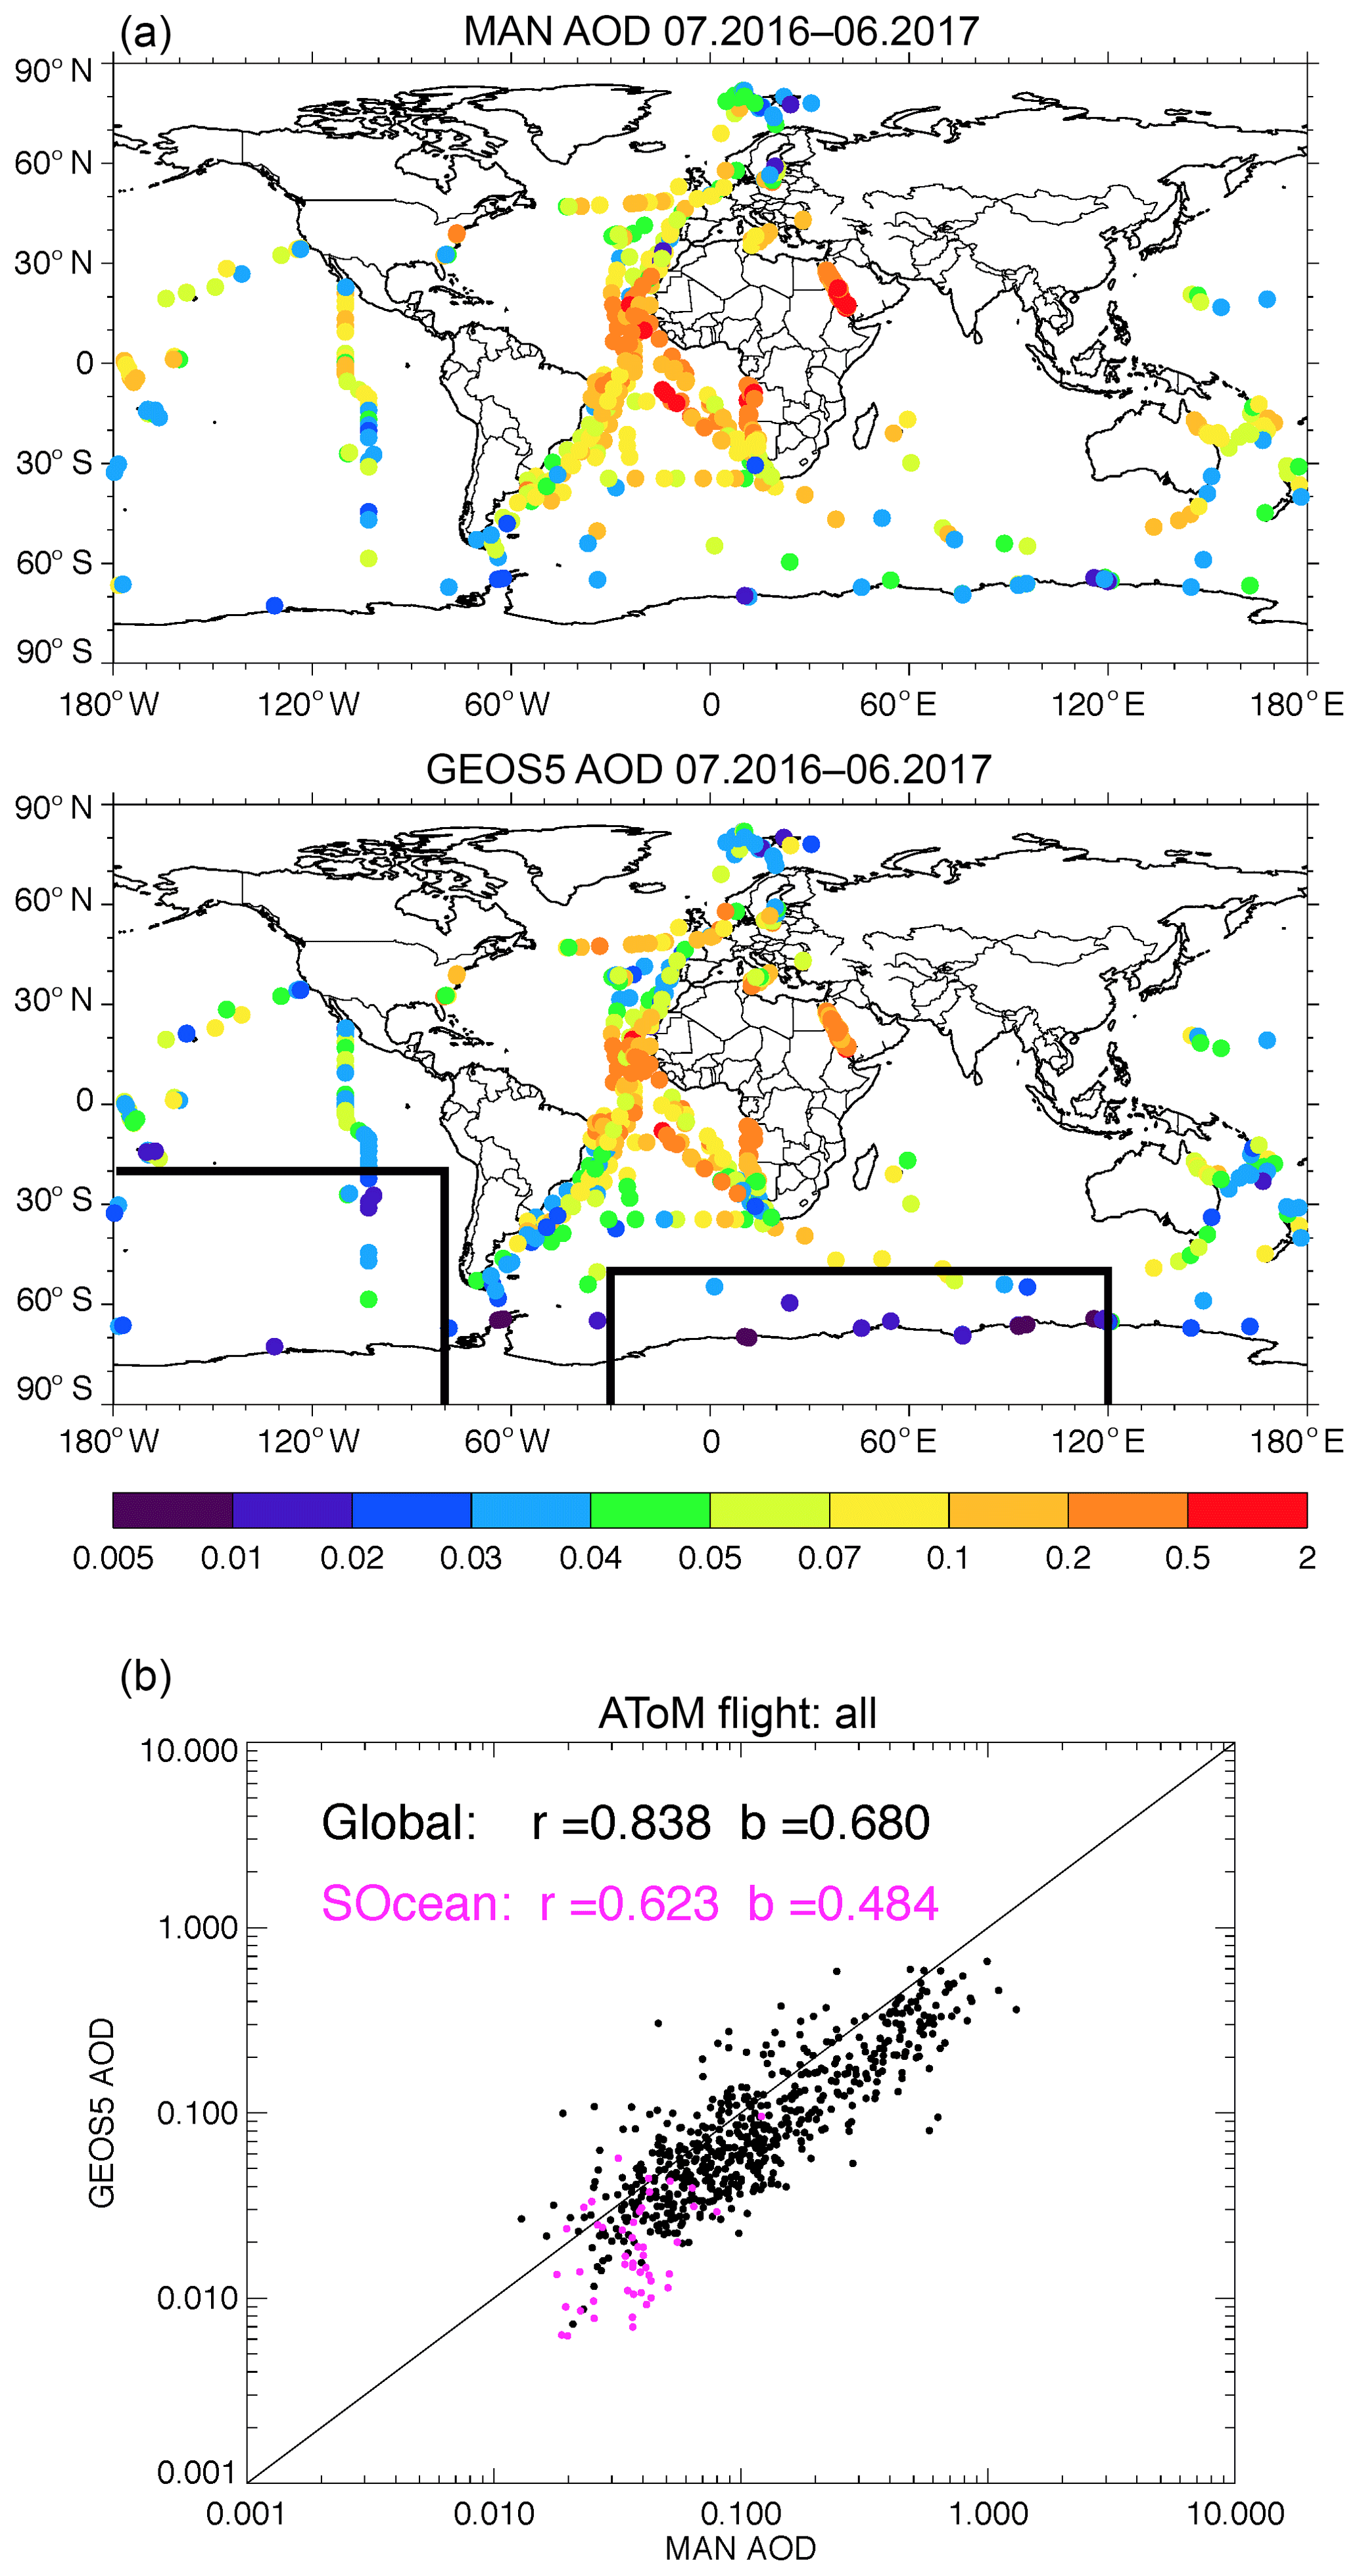
Figure 5Total AOD measured by the MAN cruise, which occurred during July 2016 to June 2017 (a), and simulated by GEOS but sampled with MAN measurements (b). Panel (c) shows the total AOD scattering plot between MAN and GEOS and the purple color is for the data over the Southern Ocean shown inside the boxes in (b).
On the one hand, GEOS's sea salt mass is comparable to SAGA in situ measurements in the MBL, and, on the other hand, GEOS underestimates AOD when compared with measurements from MAN and MODIS. The agreement with PALMS vertical gradients shows that the AOD cannot be explained by sea salt above the MBL. There are various potential reasons for this conundrum, such as the sea salt size distribution, atmospheric relative humidity, sea salt particle hygroscopic growth rate, sea salt refractive index, etc. We will discuss the first two potential reasons below.
4.4 Size distribution and atmospheric RH
The sea salt size distribution is a key factor in AOD calculation because small particles are more optically efficient at light extinction. Aerosol size also modulates the transport and removal processes. The necessity for studying sea salt size distribution also lies in the important role of sea salt particle sizes that affects atmospheric chemistry, radiative effects, and cloud formation processes.
To compare the sea salt size distributions between the model and ATom data, we calculate normalized percentage of sea salt mass in each of the first three size bins for PALMS and GEOS over three atmospheric vertical layers for ATom1 and 2, as shown in Fig. 6. The three vertical layers (i.e., 0–1.5, 1.5–6, and >6 km) represent the boundary layer, middle troposphere, and upper troposphere. GEOS sea salt particle mass and size have been computed at RH of 45 % to match the measurement condition of PALMS. The particle sizes here are limited to be less than 3 µm in dry diameter due to the size cut of the PALMS inlet. Particles in this range are most important in light extinction and cloud formation, with many more sea salt particles in fine mode than in coarse mode on a per unit of mass basis.
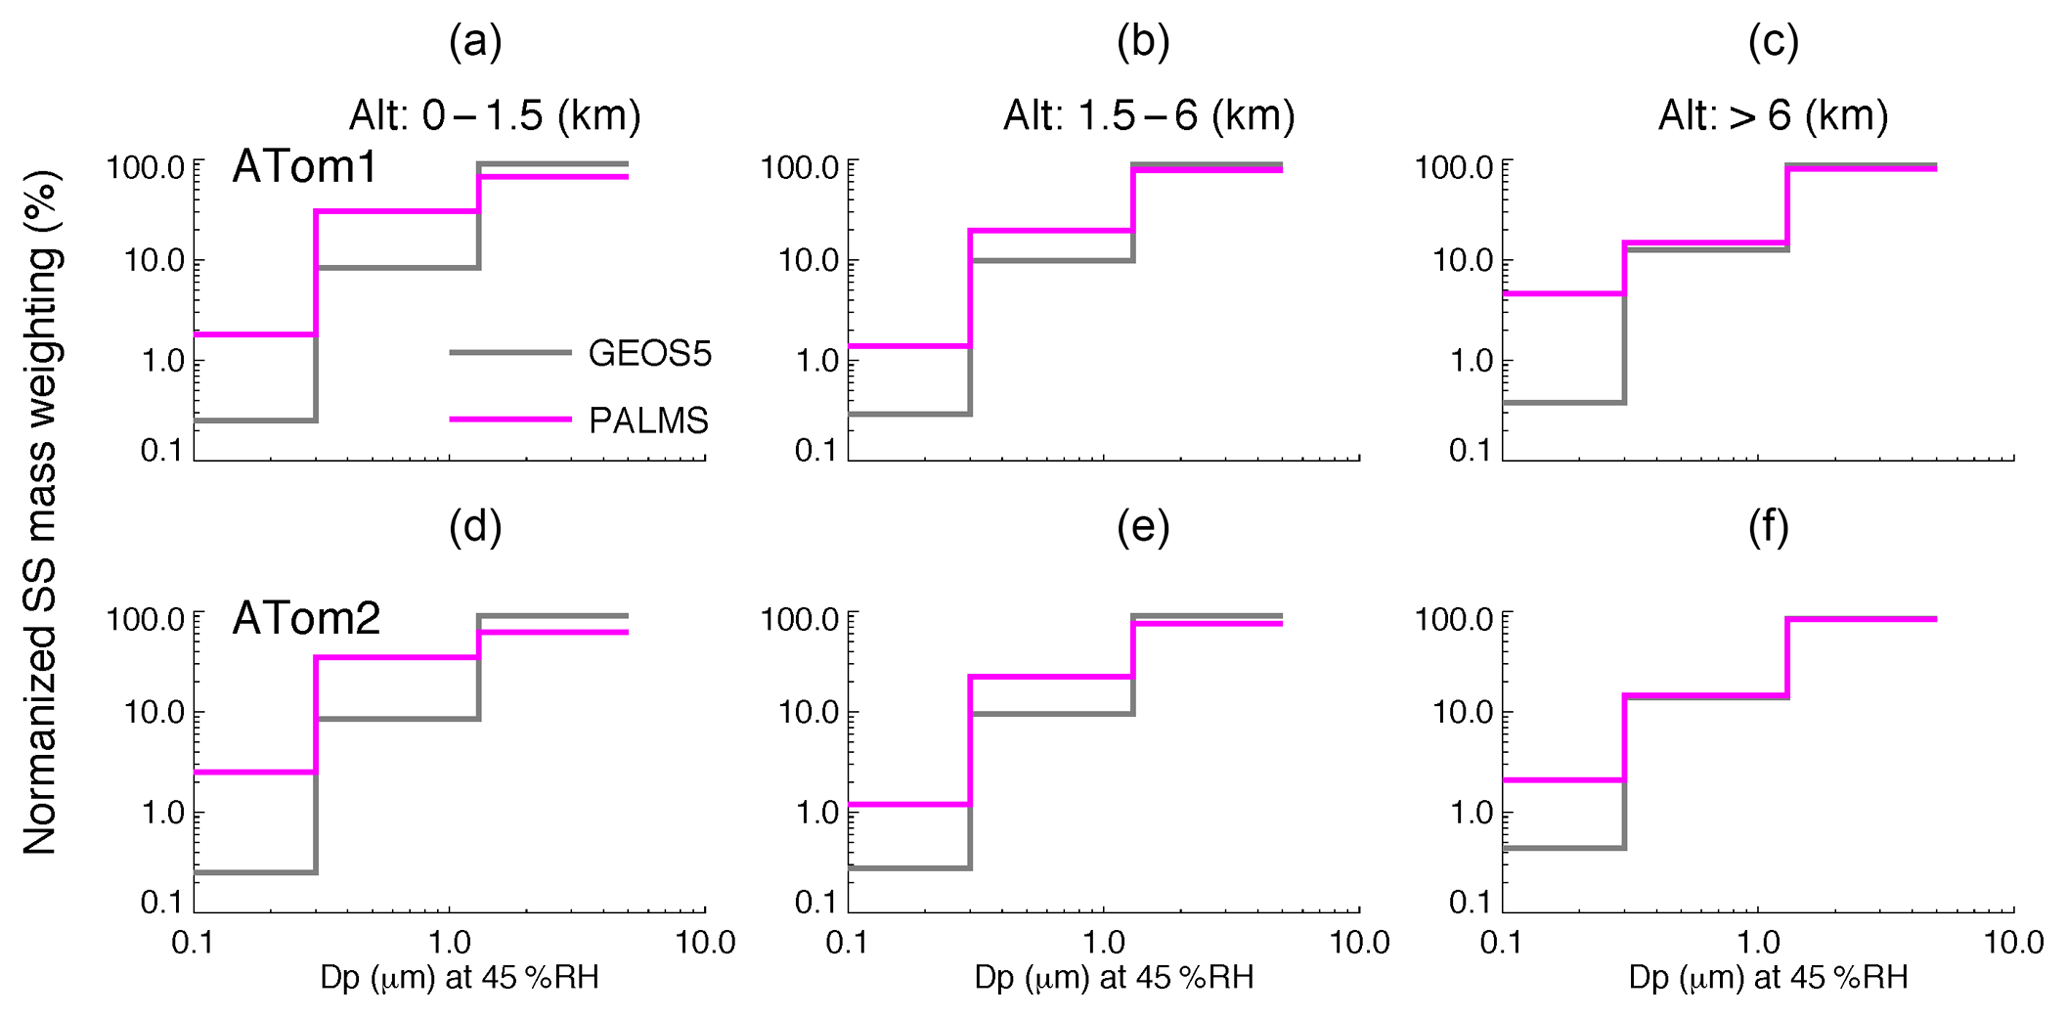
Figure 6Percentage distribution of sea salt mass over the first three bins, normalized to the total sea salt with a particle wet diameter up to ∼5 µm at RH 45 %. The normalized SS mass-weighting distribution is sorted over three vertical layers and for ATom1 (a–c) and ATom2 (d–f), respectively.
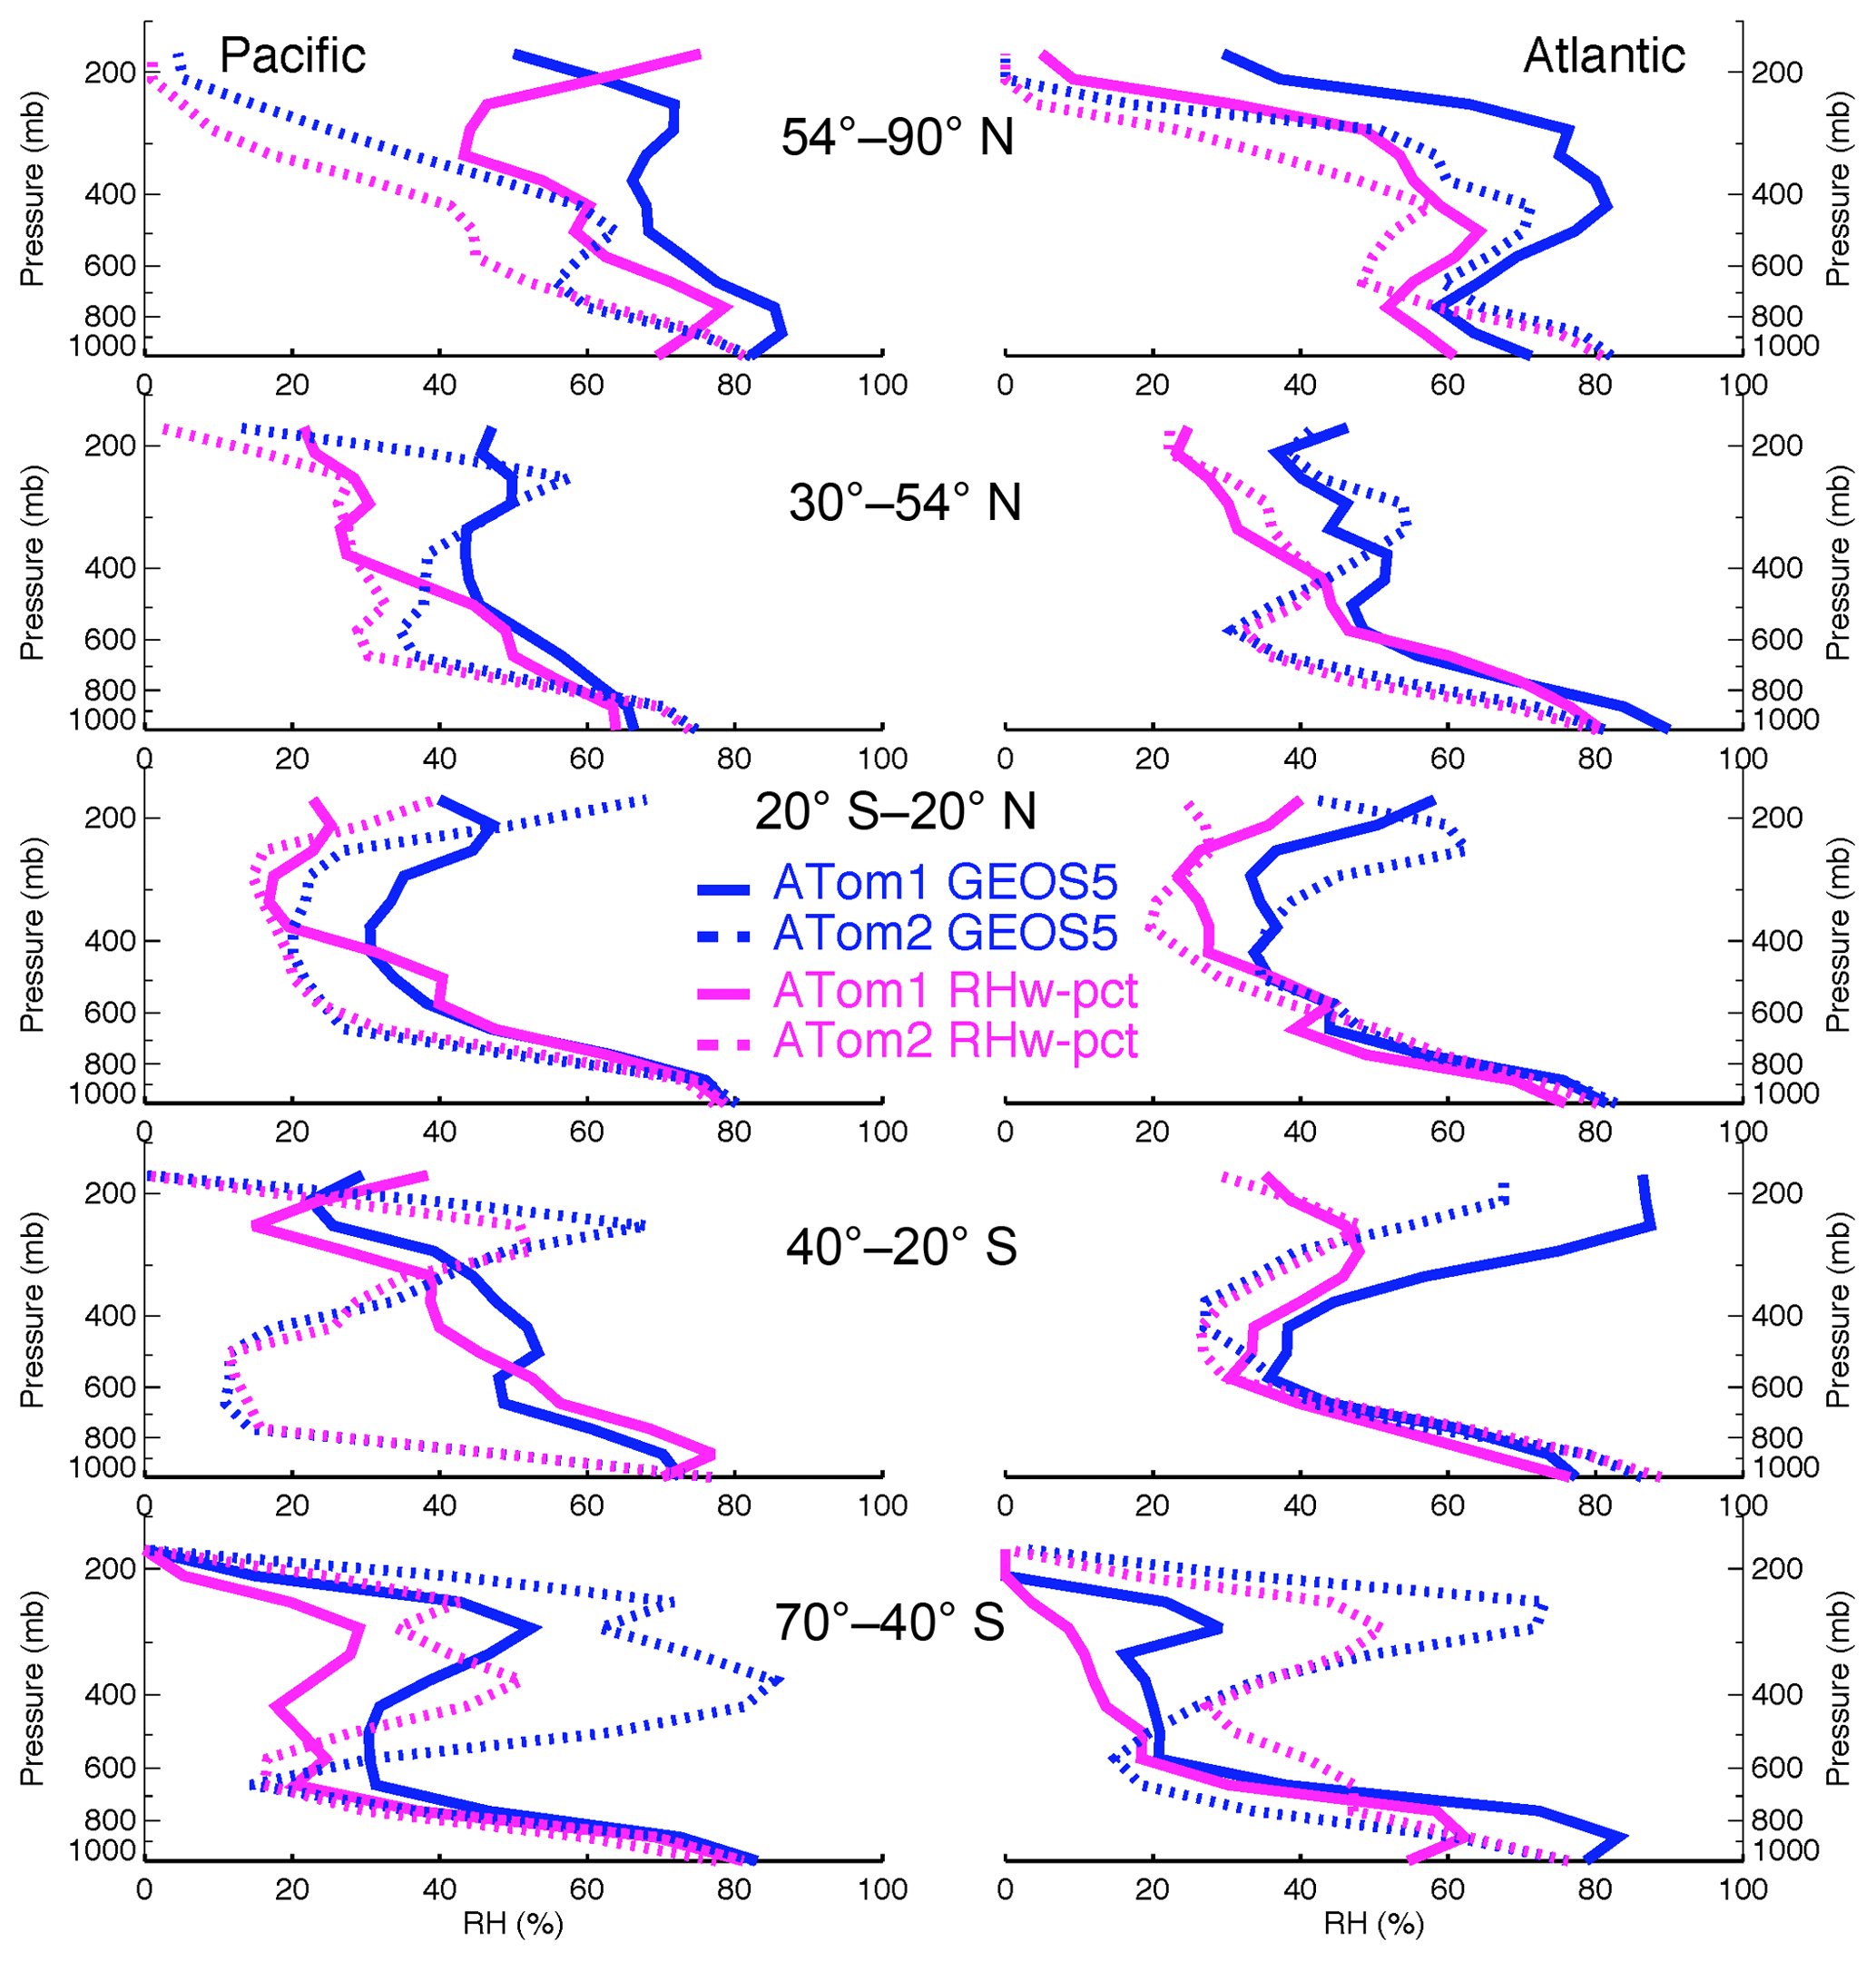
Figure 7Atmospheric RH vertical profiles from GEOS simulation and ATom measurement along ATom1 and ATom2 flight tracks in five latitudinal bands over the Pacific and Atlantic oceans.
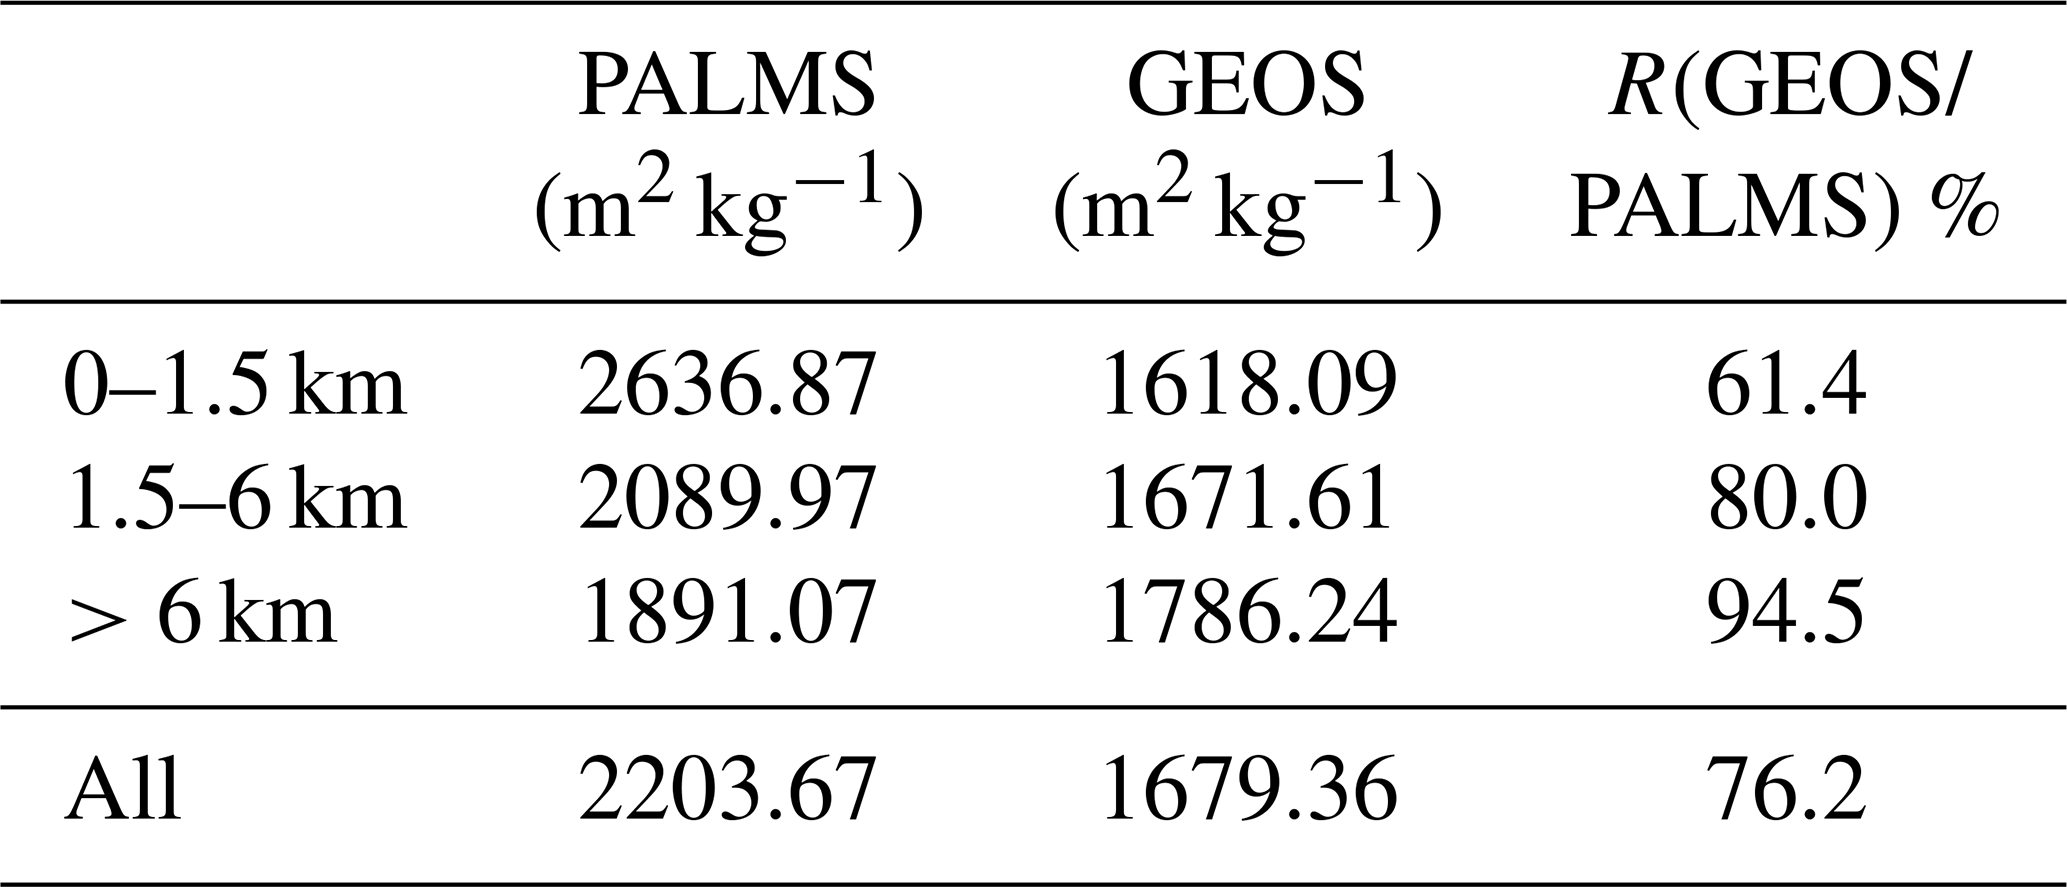
Figure 6 reveals that the size distribution is more flat in PALMS than in GEOS. In other words, with the same sea salt mass, the fraction of sea salt in the finest mode in PALMS is much larger (i.e., about 5–7 times higher) than in GEOS. To quantify the potential impact of sea salt size distribution on AOD calculation, we calculate the sea salt mass extinction efficiency (MEE) integrated over the three bins using the two size distributions of PALMS and GEOS at RH 45 % and 550 nm in the same three vertical layers and in the whole atmosphere (Table 2). The size-segregated MEEs used in the calculation are 1.6, 5.6, and 1.2 m2 g−1 for bins 1–3, respectively. The effective MEE from GEOS for the size range is 1.7 m2 g−1, which is about 24 % lower than 2.2 m2 g−1 calculated with the PALMS size distribution. Thus, the underestimation of GEOS AOD shown in Fig. 5c may partially stem from the model underestimate of the small sea salt particles, especially for those with a diameter less than 1 µm (Fig. 6). The underestimation of AOD by GEOS is more significant in the boundary layer shown in Table 2, which implies that the sea salt size distribution from emission may need to be revisited.
Table 2Sea salt mass extinction efficient (MEE) for PALMS and GEOS and the ratio of MEEs between GEOS and PALMS in three vertical layers and in the whole atmosphere at RH 45 %.
Apparently, sea salt size distribution is a potential culprit for the dichotomy in GEOS simulation since GEOS partitions more sea salt onto larger particles that are less optically active compared with the significant fine-mode sea salt observed in PALMS measurements. Such large underestimation of fine sea salt particles by the model may have significant implications not only on the AOD calculation but also on studies of radiative effects and cloud formation because particle number concentration is a key quantity for these processes. The conclusion that GEOS sea salt size distribution favors the coarse-mode sea salt particles is consistent with a recent study of Neumann et al. (2016), which found that the sea salt emission of Gong (2003) yielded overestimations in the PM10 measured at coastal stations and underestimations at inland stations over northwestern Europe.
Sea salt particle size distribution changes horizontally and vertically, but the change is much smaller than the difference between those of model and measurement. This implies a possibility of using a global size distribution without sacrificing much accuracy.
Another possible contribution to underestimation of the AOD due to sea salt in the model is if there is a general underestimate in the humidification of sea salt particles in the model, with a corresponding underestimate on optical efficiency per unit of dry mass. Figure 7 compares atmospheric RHs between ATom measurements and GEOS simulations along flight tracks summarized over the same regions as in Fig. 3. With only a few exceptions, the model RH is higher than the ATom measurements, including in the MBL, where humidity is typically high. Thus, atmospheric water vapor simulation is not responsible for the low AOD calculation. In fact, using measured RH along with the model's sea salt size distribution and vertical distribution would give even lower AOD. There should be other factors contributing to a lower GEOS AOD calculation as well, such as sea salt hygroscopic growth rate, sea salt optical properties, and other aerosol species over ocean. Further investigations looking for these factors are needed to better understand the GEOS sea salt simulation.
A systematic and comprehensive global sea salt study was conducted by integrating NASA GEOS model simulations with ATom in situ measurements from the PALMS and SAGA instruments, as well as AOD measurements from the AERONET MAN and the satellite MODIS over the oceans. This work takes advantage of PALMS sea salt vertical profile measurement, together with SAGA filter measurements in the MBL, covering global remote regions over the Pacific, Atlantic, and Southern oceans from near the surface to ∼12 km altitude in both summer and winter. Important atmospheric sea salt fields, e.g., mass mixing ratio, vertical distribution, size distribution, and aerosol AOD, are examined. The meteorological field of RH and the sea salt simulation processes of emission, dry deposition, sedimentation, and large-scale and convective wet depositions were explored to explain the sea salt fields and to reveal a potential direction for model improvement.
Generally, the agreement between ATom measurements and the model is remarkable, both in terms of absolute loading and especially in the shape of the vertical distribution under a wide range of different tropospheric environments. The correlation coefficients are generally higher than 0.8 between GEOS-PALMS and GEOS-SAGA for both ATom1 and ATom2 periods. GEOS results capture the strong sea salt vertical gradient shown in the measurements, except over SH high latitudes, where the PALMS's gradient is deeper. In the MBL, the current GEOS sea salt simulation is comparable (ATom1) or slightly higher (ATom2) than SAGA data, which in turn is higher than PALMS data.
An underestimation of GEOS aerosol AOD over sea-salt-dominated oceans is found from the comparison of AODs between GEOS and MAN, as well as GEOS and MODIS. This is contradictory to the finding that GEOS sea salt mass abundance is comparable to or slightly higher than measurements. This conundrum may be partially attributed to the difference in sea salt mass size distributions between GEOS and PALMS. The GEOS sea salt mass size distribution favors the coarse mode, while PALMS has a larger fraction of more optically active submicron sea salt. The atmospheric water vapor, however, can be ruled out as the cause of model underestimation of AOD, since the GEOS RH is comparable to or higher than ATom measurements almost everywhere along the flight tracks, especially in the MBL.
Atmospheric sea salt vertical distribution is impacted by various processes including emission, hygroscopic growth, dry deposition, sedimentation, wet deposition, convection, and large-scale advection. Among these processes, wet deposition, owing to both shallow marine cloud structure and rapid hygroscopic growth of sea salt particles, is most important in shaping the vertical profile for the size range studied in this work and results in a sharp gradient in the low atmosphere where RH is typically very high. Vertical convection is also important for explaining the sea salt vertical profiles.
More work is needed in the future to investigate sea salt hygroscopic growth rate, optical properties, sea water salinity, sea ice, and marine organic aerosol to understand the dilemma in GEOS simulation. Consideration of variations in salinity of surface seawater is missing in the GEOS aerosol model. Although salinity may not be an important factor in sea salt emission on the global scale, owing to its relatively uniformity across the world oceans, it may be important regionally, as discussed by Grythe et al. (2014). Salinity also impacts sea spray aerosol (SSA) size. The dry SSA size distribution shifts towards smaller sizes with lower salinities found in the EMEP intensive campaigns (Barthel et al., 2014). Sea ice, whose contribution is also neglected in the GEOS aerosol model, could be an important source of sea salt aerosol over polar regions and has significant implications for polar climate and atmospheric chemistry reported by recent publications (Dall'Osto et al., 2017; May et al., 2016; Rhodes et al., 2017). More importantly, primary marine organic aerosols (Randles et al., 2004) that also come from sea spray bubble-bursting as sea salts, but are more submicron particles (i.e., diameter less than 0.5 µm, should be investigated to disentangle the sea spray aerosols.
Most of the ATom observational data, including flight tracks, meteorological fields, aerosol fields, and cloud fields are publicly accessible at https://www.dropbox.com/s/8uwauow5x6qfsio/ATom_public_allmerge.2019-08-02.tar?dl=0 (last access: August 2019). Other observational data are also freely available, MODIS AOD at https://modis-atmosphere.gsfc.nasa.gov/data/dataprod/ (Levy et al., 2013), and AERONET MAN AOD at https://aeronet.gsfc.nasa.gov/new_web/maritime_aerosol_network.html (Smirnov et al., 2017). The GEOS GOCART model results can be provided by contacting with the corresponding author.
HB and MC designed the experiments. PRC, AD, AdS, TLK, and HY contributed to GEOS-GOCART model setup and provided tools to analyze model data. HB conducted the model simulation and was in charge of the analyses. KF, DMM, and GS provided ATom PALMS measurement data. JD provided ATom SAGA measurement data. MD and BW provided ATom CAPS cloud data. PB provided ATom MMS data for RH measurement. HY and AS provided MODIS satellite and AERONET MAN measurement data. All authors contributed to the data analyses and paper writing.
The authors declare that they have no conflict of interest.
This research was supported by two programs of the National Aeronautics and Space Administration (NASA): the Atmospheric Composition: Modeling and Analysis Program (ACMAP) and the Earth Venture suborbital program for the Atmospheric Tomography Mission (ATom).
This research has been supported by the NASA Astrobiology Institute (ACMAP) and the NASA Astrobiology Institute (EV2-ATom).
This paper was edited by Maria Cristina Facchini and reviewed by two anonymous referees.
Alexander, B., Park, R. J., Jacob, D. J., Li, Q. B., Yantosca, R. M., Savarino, J., Lee, C. C. W., and Thiemens, M. H.: Sulfate formation in sea-salt aerosols: Constraints from oxygen isotopes, J. Geophys. Res., 110, D10307, https://doi.org/10.1029/2004JD005659, 2005.
Anastasio, C. and Newberg, J. T.: Sources and sinks of hydroxyl radical in sea-salt particles, J. Geophys. Res., 112, D10306, https://doi.org/10.1029/2006JD008061, 2007.
Barthel, S., Tegen, I., Wolke, R., and van Pinxteren, M.: Model study on the dependence of primary marine aerosol emission on the sea surface temperature, Atmos. Chem. Phys. Discuss., 14, 377–434, https://doi.org/10.5194/acpd-14-377-2014, 2014.
Bian, H., Colarco, P. R., Chin, M., Chen, G., Rodriguez, J. M., Liang, Q., Blake, D., Chu, D. A., da Silva, A., Darmenov, A. S., Diskin, G., Fuelberg, H. E., Huey, G., Kondo, Y., Nielsen, J. E., Pan, X., and Wisthaler, A.: Source attributions of pollution to the Western Arctic during the NASA ARCTAS field campaign, Atmos. Chem. Phys., 13, 4707–4721, https://doi.org/10.5194/acp-13-4707-2013, 2013.
Bian, H., Chin, M., Hauglustaine, D. A., Schulz, M., Myhre, G., Bauer, S. E., Lund, M. T., Karydis, V. A., Kucsera, T. L., Pan, X., Pozzer, A., Skeie, R. B., Steenrod, S. D., Sudo, K., Tsigaridis, K., Tsimpidi, A. P., and Tsyro, S. G.: Investigation of global nitrate from the AeroCom Phase III experiment, Atmos. Chem. Phys., 17, 12911–12940, https://doi.org/10.5194/acp-17-12911-2017, 2017.
Browse, J., Carslaw, K. S., Mann, G. W., Birch, C. E., Arnold, S. R., and Leck, C.: The complex response of Arctic aerosol to sea-ice retreat, Atmos. Chem. Phys., 14, 7543–7557, https://doi.org/10.5194/acp-14-7543-2014, 2014.
Chin, M., Ginoux, P., Kinne, S., Holben, B. N., Duncan, B. N., Martin, R. V., Logan, J. A., Higurashi, A., and Nakajima, T.: Tropospheric aerosol optical thickness from the GOCART model and comparisons with satellite and sun photometer measurements, J. Atmos. Sci., 59, 461–483, 2002.
Chin, M., Diehl, T., Tan, Q., Prospero, J. M., Kahn, R. A., Remer, L. A., Yu, H., Sayer, A. M., Bian, H., Geogdzhayev, I. V., Holben, B. N., Howell, S. G., Huebert, B. J., Hsu, N. C., Kim, D., Kucsera, T. L., Levy, R. C., Mishchenko, M. I., Pan, X., Quinn, P. K., Schuster, G. L., Streets, D. G., Strode, S. A., Torres, O., and Zhao, X.-P.: Multi-decadal aerosol variations from 1980 to 2009: a perspective from observations and a global model, Atmos. Chem. Phys., 14, 3657–3690, https://doi.org/10.5194/acp-14-3657-2014, 2014.
Colarco, P., da Silva, A., Chin, M., and Diehl, T.: On-line simulations of global aerosol distributions in the NASA GEOS-4 model and comparisons to satellite and ground based aerosol optical depth, J. Geophys. Res., 115, D14207, https://doi.org/10.1029/2009JD012820, 2010.
Dadashazar, H., Wang, Z., Crosbie, E., Brunke, M., Zeng, X., Jonsson, H., Woods, R. K., Flagan, R. C., Seinfeld, J. H., and Sorooshian, A.: Relationships between giant sea salt particles and clouds inferred from aircraft physico-chemical data, J. Geophys. Res.-Atmos., 122, 3421–3434, https://doi.org/10.1002/2016JD026019, 2017.
Dall'Osto, M., Beddows, D. C. S., Tunved, P., Krejci, R., Ström, J., Hansson, H.-C., Yoon, Y. J., Park, K.-T., Becagli, S., Udisti, R., Onasch, T., O'Dowd, C. D., Simó, R., and Harrison, R. M.: Arctic sea ice melt leads to atmospheric new particle formation, Scient. Rep., 7, 3318, https://doi.org/10.1038/s41598-017-03328-1, 2017.
Dall'Osto, M., Geels, C., Beddows, D. C. S., Boertmann, D., Lange, R., Nøjgaard, J. K., Harrison, R. M., Simo, R., Skov, H., and Massling, A., Regions of open water and melting sea ice drive new particle formation in North East Greenland, Sci. Rep., 8, 6109, https://doi.org/10.1038/s41598-018-24426-8, 2018.
Darmenov, A., da Silva, A., Liu, X., and Colarco, P. R.: Data-driven aerosol development in the GEOS-5 modeling and data assimilation system, in: Abstract A43D-0305 presented at 2013 Fall Meeting, AGU, 9–13 December 2013, San Francisco, California, 2013.
de Leeuw, G., Andreas, E. L., Anguelova, M. D., Fairall, C. W., Lewis, E. R., O'Dowd, C.,Schulz, M., and Schwartz, S. E.: Production flux of sea spray aerosol, Rev. Geophys., 49, RG2001, https://doi.org/10.1029/2010rg000349, 2011.
Eastman, R., Warren, S. G., and Hahn, C. J.: Variations in cloud cover and cloud types over the ocean from surface observations, 1954–2008, J. Climate, 24, 5914–5934, 2011.
Froyd, K. D., Murphy, D. M., Brock, C. A., Campuzano-Jost, P., Dibb, J. E., Jimenez, J.-L., Kupc, A., Middlebrook, A. M., Schill, G. P., Thornhill, K. L., Williamson, C. J., Wilson, J. C., and Ziemba, L. D.: A new method to quantify mineral dust and other aerosol species from aircraft platforms using single particle mass spectrometry, Atmos. Meas. Tech. Discuss., https://doi.org/10.5194/amt-2019-165, in review, 2019.
Gelaro, R., McCarty, W., Suárez, M. J., Todling, R., Molod, A., Takacs, L., Randles, C. A., Darmenov, A., Bosilovich, M. G., Reichle, R., Wargan, K., Coy, L., Cullather, R., Draper, C., Akella, S., Buchard, V., Conaty, A., da Silva, A. M., Gu, W., Kim, G. K., Koster, R., Lucchesi, R., Merkova, D., Nielsen, J. E., Partyka, G., Pawson, S., Putman, W., Rienecker, M., Schubert, S. D., Sienkiewicz, M., and Zhao, B.: The Modern-Era Retrospective Analysis for Research and Applications, Version 2 (MERRA-2), J. Climate, 30, 5419–5454, https://doi.org/10.1175/JCLI-D-16-0758.1, 2017.
Gerber, H. E.: Relative-humidity parameterization of the Navy aerosol model (NAM), NRL Rep. 8956, Naval Res. Lab., Washington, D.C., 1985.
Gong, S. L.: A parameterization of sea-salt aerosol source function for sub- and super-micron particles, Global Biogeochem. Cy., 17, 1097, https://doi.org/10.1029/2003GB002079, 2003.
Grini, A., Myhre, M., Sundet, J. K., and Isaksen, I. S. A.: Modeling the Annual Cycle of Sea Salt in the Global 3D Model Oslo CTM2: Concentrations, Fluxes, and Radiative Impact, J. Climate, 15, 1717–1730, https://doi.org/10.1175/1520-0442(2002)015<1717:MTACOS>2.0.CO;2, 2002.
Grythe, H., Ström, J., Krejci, R., Quinn, P., and Stohl, A.: A review of sea-spray aerosol source functions using a large global set of sea salt aerosol concentration measurements, Atmos. Chem. Phys., 14, 1277–1297, https://doi.org/10.5194/acp-14-1277-2014, 2014.
IPCC – Intergovernmental Panel on Climate Change: 2001 In Climate Change 2001: The Scientific Basis, edited by: Houghton, J. T., Ding, Y., D. Griggs, J., Noguer, M., van der Linden, P. J., and Xiaosu, D., Cambridge University Press, New York, NY, 2001.
Jacobson, M. Z.: Global direct radiative forcing due to multicomponent anthropogenic and natural aerosols, J. Geophys. Res., 106, 1551–1568, 2001.
Jaeglé, L., Quinn, P. K., Bates, T. S., Alexander, B., and Lin, J.-T.: Global distribution of sea salt aerosols: new constraints from insitu and remote sensing observations, Atmos. Chem. Phys., 11, 3137–3157, https://doi.org/10.5194/acp-11-3137-2011, 2011.
Keene, W. C., Psxenny, A. A. P., Galloway, J. N., and Hawley, M. E.: Seasalt corrections and interpretation of constituent ratios in marine precipitation, J. Geophys. Res., 91, 6647–6658, 1986.
Kishcha, P., Nickovic, S., Starobinetes, B., di Sarra, A., Udisti, R., Becagli, S., Sferlazzo, D., Bommarito, C., and Alpert, P.: Sea-salt aerosol forecasts compared with daily measurements at the island of Lampedusa (Central Mediterranean), Atmos. Res., 100, 28–35, 2011.
Kogan, Y. L., Mechem, D. B., and Choi, K.: Effects of Sea-Salt Aerosols on Precipitation in Simulations of Shallow Cumulus, J. Atmos. Sci.,69, 463–483, https://doi.org/10.1175/JAS-D-11-031.1, 2012.
Lawler, M. J., Sander, R., Carpenter, L. J., Lee, J. D., von Glasow, R., Sommariva, R., and Saltzman, E. S.: HOCl and Cl2 observations in marine air, Atmos. Chem. Phys., 11, 7617–7628, https://doi.org/10.5194/acp-11-7617-2011, 2011.
Lebsock, M. D., L'Ecuyer, T. S., and Stephens, G. L.: Detecting the ratio of rain and cloud water in low-latitude shallow marine clouds, J. Appl. Meteorol. Clim., 50, 419–432, https://doi.org/10.1175/2010JAMC2494.1, 2011.
Levy, R. C., Mattoo, S., Munchak, L. A., Remer, L. A., Sayer, A. M., Patadia, F., and Hsu, N. C.: The Collection 6 MODIS aerosol products over land and ocean, Atmos. Meas. Tech., 6, 2989–3034, https://doi.org/10.5194/amt-6-2989-2013, 2013.
Lewis, E. R. and Schwartz, S. E.: Sea salt aerosol production: mechanisms, methods, measurements and models – a critical review, in: Geophysical Monograph, vol. 152, American Geophysical Union, Washington, D.C., ISBN:9780875904177, Online ISBN:9781118666050, https://doi.org/10.1029/GM152, 2004.
May, N. W., Quinn, P. K., McNamara, S. M., and Pratt, K. A.: Multiyear study of the dependence of sea salt aerosol on wind speed and sea ice conditions in the coastal Arctic, J. Geophys. Res.-Atmos., 121, 9208–9219, https://doi.org/10.1002/2016JD025273, 2016.
McNaughton, C. S., Clarke, A. D., Howell, S. G., Pinkerton, M., Anderson, B., Thornhill, L., Hudgins, C., Winstead, E., Dibb, J. E., Scheuer, E., and Maring, H.: Results from the DC-8 Inlet Characterization Experiment (DICE): Airborne Versus Surface Sampling of Mineral Dust and Sea Salt Aerosols, Aerosol Sci. Tech., 41, 136–159, 2007.
Murphy, D. M., Froyd, K. D., Bian, H., Brock, C. A., Dibb, J. E., DiGangi, J. P., Diskin, G., Dollner, M., Kupc, A., Scheuer, E. M., Schill, G. P., Weinzierl, B., Williamson, C. J., and Yu, P.: The distribution of sea-salt aerosol in the global troposphere, Atmos. Chem. Phys., 19, 4093–4104, https://doi.org/10.5194/acp-19-4093-2019, 2019.
Neumann, D., Matthias, V., Bieser, J., Aulinger, A., and Quante, M.: A comparison of sea salt emission parameterizations in north-western Europe using a chemistry transport model setup, Atmos. Chem. Phys., 16, 9905–9933, https://doi.org/10.5194/acp-16-9905-2016, 2016.
Pierce, J. R. and Adams, P. J.: Global evaluation of CCN formation by direct emission of sea salt and growth of ultrafine sea salt, J. Geophys. Res., 111, D06203, https://doi.org/10.1029/2005JD006186, 2006.
Prospero, J. M., Savoie, D. L., and Arimoto, R.: Long-term record of nss-sulfate and nitrate in aerosols on Midway Island, 1981–2000: evidence of increased (now decreasing?) anthropogenic emissions from Asia, J. Geophys. Res., 108, 4019, https://doi.org/10.1029/2001JD001524, 2003.
Quinn, P. K. and Bates, T.: Ocean-Derived Aerosol and Its Climate impacts, in: Treatise on Geochemistry, Elsevier, Oxford, 317–330, https://doi.org/10.1016/b978-0-08-095975-7.00416-2, 2014.
Randles, C. A., Russell, L. M., and Ramaswamy, V.: Hygroscopic and optical properties of organic sea salt aerosol and consequences for climate forcing, Geophys. Res. Lett., 31, L16108, https://doi.org/10.1029/2004GL020628, 2004.
Randles, C. A., da Silva, A. M., Buchard, V., Colarco, P. R., Darmenov, A., Govindaraju, R., Smirnov, A., Holben, B., Ferrare, R., Hair, J., Shinozuka, Y., and Flynn, C. J.: The MERRA-2 Aerosol Reanalysis, 1980–onward, Part I: System Description and Data Assimilation Evaluation, J. Climate, 30, 6823–6850, https://doi.org/10.1175/jcli-d-16-0609.1, 2017.
Rhodes, R. H., Yang, X., Wolff, E. W., McConnell, J. R., and Frey, M. M.: Sea ice as a source of sea salt aerosol to Greenland ice cores: a model-based study, Atmos. Chem. Phys., 17, 9417–9433, https://doi.org/10.5194/acp-17-9417-2017, 2017.
Rienecker, M. M., Suarez, M. J., Gelaro, R., Todling, R., Bacmeister, J., Liu, E., Bosilovich, M. G., Schubert, S. D., Takacs, L.,Kim, G. K., Bloom, S., Chen, J., Collins, D., Conaty, A., da Silva, A., Gu, W., Joiner, J., Koster, R. D., Lucchesi, Andrea Molod, A., Owens, T., Pawson, S., Pegion, P., Redder, C. R., Reichle, R., Robertson, F. R., Ruddick, A. G., Sienkiewicz, M., and Woollen, J.: MERRA: NASA's Modern-Era Retrospective Analysis for Research and Applications, J. Climate, 24, 3624–3648, 2011.
Smirnov, A., Petrenko, M., Ichoku, C., and Holben, B.: Maritime Aerosol Network optical depth measurements and comparison with satellite retrievals from various different sensors, in: Proc. of SPIE, Remote Sensing of Clouds and the Atmosphere XXII, vol. 10424, edited by: Comerón, A., Kassianov, E. I., Schäfer, K., Picard, R. H., and Weber, K., 1042402-1, https://doi.org/10.1117/12.2277113, 2017.
Spada, M., Jorba, O., Pérez García-Pando, C., Janjic, Z., and Baldasano, J. M.: Modeling and evaluation of the global sea-salt aerosol distribution: sensitivity to size-resolved and sea-surface temperature dependent emission schemes, Atmos. Chem. Phys., 13, 11735–11755, https://doi.org/10.5194/acp-13-11735-2013, 2013.
Spada, M., Jorba, O., Pérez García-Pando, C., Janjic, Z., and Baldasano, J. M.: On the evaluation of global sea-salt aerosol models at coastal/orographic sites, Atmos. Environ., 101, 41–48, https://doi.org/10.1016/j.atmosenv.2014.11.019, 2015.
Takemura, T., Nakajima, T., Dubovik, O., Holben, B. N., and Kinne, S.: Single-scattering albedo and radiative forcing of various aerosol species with a global three-dimensional model, J. Climate, 15, 333–352, 2002.
Textor, C., Schulz, M., Guibert, S., Kinne, S., Balkanski, Y., Bauer, S., Berntsen, T., Berglen, T., Boucher, O., Chin, M., Dentener, F., Diehl, T., Easter, R., Feichter, H., Fillmore, D., Ghan, S., Ginoux, P., Gong, S., Grini, A., Hendricks, J., Horowitz, L., Huang, P., Isaksen, I., Iversen, I., Kloster, S., Koch, D., Kirkevåg, A., Kristjansson, J. E., Krol, M., Lauer, A., Lamarque, J. F., Liu, X., Montanaro, V., Myhre, G., Penner, J., Pitari, G., Reddy, S., Seland, Ø., Stier, P., Takemura, T., and Tie, X.: Analysis and quantification of the diversities of aerosol life cycles within AeroCom, Atmos. Chem. Phys., 6, 1777–1813, https://doi.org/10.5194/acp-6-1777-2006, 2006.
Tsyro, S., Aas, W., Soares, J., Sofiev, M., Berge, H., and Spindler, G.: Modelling of sea salt concentrations over Europe: key uncertainties and comparison with observations, Atmos. Chem. Phys., 11, 10367–10388, https://doi.org/10.5194/acp-11-10367-2011, 2011.
Wilson, T. R. S.: Salinity and the major elements of sea water, in: Chemical Oceanography, vol. 1, 2nd Edn., edited by: Riley, J. P. and Skirrow, G., Academic, Orlando, Florida, 365–413, 1975.
Witek, M. L., Flatau, P. J., Quinn, P. K., and Westphal, D. L.: Global sea-salt modeling: Results and validation against multicampaign shipboard measurements, J. Geophys. Res., 112, D08215, https://doi.org/10.1029/2006JD007779, 2007.
Wood, R.: Stratocumulus clouds, Mon. Weather Rev. 140, 2373–2423, 2012.
Zhou, X., Kollias, P., and Lewis, E. R.: Clouds, precipitation, and marine boundary layer structure during the MAGIC field campaign, J. Climate, 28, 2420–2442, https://doi.org/10.1175/JCLI-D-14-00320.1, 2015.