the Creative Commons Attribution 4.0 License.
the Creative Commons Attribution 4.0 License.
 | 22 Aug 2019
Retrieval of total column and surface NO2 from Pandora zenith-sky measurements
Debora Griffin
Vitali Fioletov
Chris McLinden
Jonathan Davies
Akira Ogyu
Sum Chi Lee
Alexandru Lupu
Michael D. Moran
Alexander Cede
Martin Tiefengraber
Moritz Müller
Pandora spectrometers can retrieve nitrogen dioxide (NO2) vertical column densities (VCDs) via two viewing geometries: direct Sun and zenith sky. The direct-Sun NO2 VCD measurements have high quality (0.1 DU accuracy in clear-sky conditions) and do not rely on any radiative transfer model to calculate air mass factors (AMFs); however, they are not available when the Sun is obscured by clouds. To perform NO2 measurements in cloudy conditions, a simple but robust NO2 retrieval algorithm is developed for Pandora zenith-sky measurements. This algorithm derives empirical zenith-sky NO2 AMFs from coincident high-quality direct-Sun NO2 observations. Moreover, the retrieved Pandora zenith-sky NO2 VCD data are converted to surface NO2 concentrations with a scaling algorithm that uses chemical-transport-model predictions and satellite measurements as inputs. NO2 VCDs and surface concentrations are retrieved from Pandora zenith-sky measurements made in Toronto, Canada, from 2015 to 2017. The retrieved Pandora zenith-sky NO2 data (VCD and surface concentration) show good agreement with both satellite and in situ measurements. The diurnal and seasonal variations of derived Pandora zenith-sky surface NO2 data also agree well with in situ measurements (diurnal difference within ±2 ppbv). Overall, this work shows that the new Pandora zenith-sky NO2 products have the potential to be used in various applications such as future satellite validation in moderate cloudy scenes and air quality monitoring.


Nitrogen dioxide (NO2) is an important air pollutant and plays a critical role in tropospheric photochemistry (e.g., ECCC, 2016; EPA, 2014). It is primarily emitted from combustion processes such as fossil fuel combustion (e.g., traffic, electricity generation from power plants) and biomass burning, as well as from lightning. NO2 is a nitrate aerosol precursor, and it also contributes to acid deposition and eutrophication (ECCC, 2016). Exposure to NO2 can lead to adverse health effects, such as irritation of the lungs, a decrease in lung function, and an increase in susceptibility to allergens for people with asthma (EEA, 2017; WHO, 2017).
As surface NO2 concentrations are regulated by many environmental agencies (e.g., Environment and Climate Change Canada and US Environment Protection Agency), in situ NO2 measurements are commonly carried out by many national monitoring networks, such as the National Air Pollution Surveillance (NAPS; https://www.canada.ca/en/environment-climate-change/services/air-pollution/monitoring-networks-data/national-air-pollution-program.html, last access: 15 August 2019) network in Canada, which was established in 1969. The in situ methods used to measure surface NO2 have evolved over the years; for example, luminol chemiluminescence (e.g., Kelly et al., 1990; Maeda et al., 1980; Wendel et al., 1983), long-path differential optical absorption spectroscopy (e.g., Platt, 1994), photolytic conversion/chemiluminescence (e.g., Gao et al., 1994; Ryerson et al., 2000), and laser-induced fluorescence (e.g., Thornton et al., 2000) are all found to be reliable methods with an uncertainty within 10 % at 1 ppbv and higher concentration levels (McClenny, 2000). Currently, the in situ approach used by NAPS for surface NO2 air quality monitoring is the photolytic conversion/chemiluminescence technique, which converts NO2 to NO and subsequently detects the NO by chemiluminescence reaction (McClenny, 2000; NRC, 1992). This in situ monitoring measurements provides good measurements at ground level (0.4 ppbv accuracy), but NO2 is not uniformly mixed through the atmosphere, and not even within the atmospheric boundary layer due to emission and removal processes taking place at the surface.
Total vertical column NO2 can be measured by many ground-based UV–visible remote-sensing instruments using direct-Sun, zenith-sky, or off-axis spectroscopy techniques (Cede et al., 2006; Drosoglou et al., 2017; Herman et al., 2009; Lee et al., 1994; Noxon, 1975; Piters et al., 2012; Roscoe et al., 2010; Tack et al., 2015; Vaughan et al., 1997). These measurements are of high quality and good precision, and have been widely used for atmospheric chemistry studies (e.g., Adams et al., 2012; Hendrick et al., 2014) and satellite validations (e.g., Celarier et al., 2008; Drosoglou et al., 2018; Irie et al., 2008; Wenig et al., 2008). Among all these different viewing geometries, direct-Sun measurements are of high accuracy and are not dependent on radiative transfer models (RTMs) to calculate air mass factors (AMFs) (Herman et al., 2009) or on knowledge of other atmospheric constituents. Zenith-sky observations have been widely used for stratospheric ozone and NO2 observations, particularly under cloudy conditions when direct-Sun measurements are unreliable (note that zenith-sky observations use scattered sunlight and are less sensitive to clouds, e.g., Zhao et al., 2019). Off-axis measurements have good sensitivity in the boundary layer and could provide tropospheric trace gas profiles and surface concentrations (Frieß et al., 2011; Hendrick et al., 2014; Kramer et al., 2008; Wagner et al., 2011), but they are more sensitive to cloud cover than zenith-sky measurements.
The Pandora Sun spectrometer is a new instrument developed to measure vertical column densities (total columns) of trace gases in the atmosphere using Sun and sky radiation in the UV–visible part of the spectrum (Herman et al., 2009). One of its primary data products is NO2 total vertical column density (VCD) from the direct-Sun viewing mode, where VCD represents the vertically integrated number of molecules per unit area and is reported in units of molec cm−2 or Dobson units (1 DU molec cm−2). The Pandora direct-Sun NO2 VCD products have been validated through many field campaigns (Flynn et al., 2014; Lamsal et al., 2017; Martins et al., 2016; Piters et al., 2012; Reed et al., 2015), ground-based comparisons (Herman et al., 2009; Wang et al., 2010), and satellite validations (Ialongo et al., 2016; Lamsal et al., 2014).
Since their introduction in 2006, Pandora spectrometers have been deployed at more than 50 sites globally. The Pandora no. 103 instrument used in this study has been deployed in Toronto, Canada since 2013 to perform direct-Sun measurements (Zhao et al., 2016). Since 2015, the observation schedule of Pandora no. 103 has been modified to perform alternating direct-Sun and zenith-sky measurements. Knepp et al. (2017) assessed Pandora's capability to derive stratospheric NO2 using zenith-sky viewing geometry (in twilight periods), but their study was limited to slant column densities (SCDs). At this time, there are no standard Pandora zenith-sky NO2 VCD data products available. As one goal of this work, we have focused on developing a new NO2 retrieval algorithm for zenith-sky measurements to expand Pandora NO2 measurements into cloudy scenes.
In addition to retrieval of zenith-sky total column NO2, another goal of this work is to derive surface NO2 concentration from total column measurements. Surface NO2 has been a focus of scientific studies due to its strong correlation with air quality (AQ) and health issues (ECCC, 2016), with NO2 as one of the three components (along with ozone and PM2.5) used to compute the Air Quality Health Index (AQHI; Stieb et al., 2008) in Canada's AQ public awareness programs. Efforts to link total column NO2 with its surface concentrations have been made by many researchers (Flynn et al., 2014; Knepp et al., 2015; Kollonige et al., 2017; Lamsal et al., 2008, 2014; McLinden et al., 2014). For example, Knepp et al. (2015) proposed a method to estimate NO2 surface mixing ratios from Pandora direct-Sun total column NO2 via application of a planetary boundary layer (PBL) height correction factor. Kollonige et al. (2017) adapted this method and compared Pandora direct-Sun surface NO2 and Ozone Monitoring Instrument (OMI) surface NO2. They concluded that the two main sources of error for the conversion of the total column NO2 to surface NO2 are (1) poor weather conditions (e.g., cloud cover and precipitation) and (2) PBL height estimation, both of which affect the NO2 column–surface relationship and instrument sensitivities to boundary layer NO2. Thus, in this work, we present a simple but robust algorithm for deriving surface NO2 concentration from Pandora zenith-sky measurements, which has several advantages, such as the ability (1) to extend Pandora NO2 measurements to cloudy conditions and (2) to provide more accurate surface NO2 concentration estimates that are less sensitive to PBL height. This work also provides reliable total column NO2 measurements in cloudy conditions and could be used in satellite validations in partially cloudy scenes.
This paper is organized as follows. Section 2 describes the measured and modelled NO2 data used in this study. In Sect. 3, the empirical AMFs for Pandora zenith-sky NO2 measurements are derived using high-quality Pandora direct-Sun total column NO2 data. These empirical AMFs and the Network for the Detection of Atmospheric Composition Change (NDACC) AMFs (Hendrick et al., 2011; Sarkissian et al., 1995; Van Roozendael et al., 1998; Van Roozendael and Hendrick, 2009; Vaughan et al., 1997) are both applied to Pandora zenith-sky total column NO2 retrievals to help evaluate the performance of the empirical AMFs. Also, the retrieved Pandora zenith-sky total column NO2 data are evaluated by comparison with satellite measurements. In Sect. 4, the zenith-sky total column NO2 data are converted to surface concentration by using a scaling algorithm. The zenith-sky surface NO2 concentration data are assessed by comparison with in situ measurements. Lastly, in Sect. 5, several aspects of this zenith-sky surface NO2 dataset are discussed, which include diurnal and seasonal variation, and PBL effect, followed by conclusions in Sect. 6.
2.1 Measurements
2.1.1 Pandora direct-Sun total column NO2
The Pandora instrument records spectra between 280 and 530 nm with a resolution of 0.6 nm (Herman et al., 2009, 2015; Tzortziou et al., 2012). It uses a temperature-stabilized Czerny–Turner spectrometer, with a 50 µm entrance slit, 1200 groove mm−1 grating, and a 2048×64 back-thinned Hamamatsu charge-coupled device (CCD) detector. The spectra are analyzed using a total optical absorption spectroscopy (TOAS) technique (Cede, 2019), in which absorption cross sections for multiple atmospheric absorbers, such as ozone, NO2, and sulfur dioxide (SO2), are fitted to the spectra.
The Pandora direct-Sun total column NO2 data are produced using Pandora's standard NO2 algorithm implemented in the BlickP software (Cede, 2019). The measured direct-Sun spectra from 400 to 440 nm are used in the TOAS analysis. A synthetic reference spectrum is produced by averaging multiple measured spectra and corrected for the estimated total optical depth included in it. Cross sections of NO2 at an effective temperature of 254.5 K (Vandaele et al., 1998), ozone at an effective temperature of 225 K (Brion et al., 1993, 1998; Daumont et al., 1992), and a fourth-order polynomial are all fitted. The resulting NO2 SCDs are then converted to total column VCDs by using direct-Sun geometry AMFs. Herman et al. (2009) show that Pandora direct-Sun total column NO2 has a clear-sky precision of 0.01 DU (in the slant column) and a nominal accuracy of 0.1 DU (in the vertical column, 2σ level). Additional information on Pandora calibrations, operation, and retrieval algorithms can be found in Herman et al. (2009) and Cede (2019).
The Pandora no. 103 instrument has been deployed in Toronto since September 2013 to perform direct-Sun observations (Zhao et al., 2016). The instrument is installed on the roof of the Environment and Climate Change Canada (ECCC) Downsview building (43.7810∘ N, −79.4680∘ W) in Toronto. The building is located in a suburban area with multiple roads nearby. Since 2015, the instrument has been employing an alternating direct-Sun and zenith-sky observation schedule, which consists of direct-Sun measurements every 90 s and zenith-sky measurements every 30 min during the sunlit period. About 2.5 years (February 2015 to September 2017) of continuous alternating measurements are used in this study.
2.1.2 Pandora zenith-sky total column NO2
Retrieval of trace gases from Pandora's zenith-sky measurements is not included in the standard BlickP processing software (Cede, 2019). The Pandora zenith-sky spectra for this study are processed using the differential optical absorption spectroscopy (DOAS) technique (Noxon, 1975; Platt, 1994; Platt and Stutz, 2008; Solomon et al., 1987) with the QDOAS software (Danckaert et al., 2015). A single reference spectrum is used, which was obtained from a zenith-sky measurement at local noon from a day that had low total column NO2. Following the NDACC recommendations (Van Roozendael and Hendrick, 2012), NO2 differential slant column densities (dSCDs) are retrieved in the 425–490 nm window (to retrieve oxygen collision complex simultaneously). The oxygen collision complex (O2)2 (referred here as O4), which is created by the collision of two oxygen molecules, has broadband absorptions from UV to near-IR spectral ranges (Greenblatt et al., 1990; Platt and Stutz, 2008; Thalman and Volkamer, 2013). O4 is widely used as a reference gas by many DOAS applications to infer cloud and aerosol properties (e.g., Gielen et al., 2014; Wagner et al., 2004, 2014, 2016, 2019; Wang et al., 2015; Zhao et al., 2019). Cross sections of NO2 at an effective temperature of 254.5 K (Vandaele et al., 1998), ozone at an effective temperature of 223 K (Bogumil et al., 2003), H2O (Rothman et al., 2005), O4 (Hermans et al., 2003), and ring (Chance and Spurr, 1997) are all fitted; a fifth-order polynomial and a first-order linear offset are also included in the DOAS analysis.
The output of QDOAS is NO2 dSCDs, which can be converted to total column NO2 via the Langley plot method with the use of the NDACC NO2 AMF look-up table (LUT) (Van Roozendael and Hendrick, 2012). The NDACC AMF LUT is used here only as a reference since it was primarily developed for retrieval of stratospheric NO2. Other empirical zenith-sky NO2 AMFs have been developed and are used to convert NO2 dSCDs to total columns. Details about these two different AMFs are given in Sect. 3.1.
2.1.3 OMI SPv3 data
OMI is a Dutch–Finnish nadir-viewing UV–visible spectrometer aboard the National Aeronautics and Space Administration (NASA)'s Earth Observing System (EOS) Aura satellite that was launched in July 2004. The OMI instrument measures the solar radiation backscattered by the Earth's atmosphere and surface between 270 and 500 nm with resolution of 0.5 nm (Levelt et al., 2006, 2018). OMI has a 780×576 CCD detector that measures at 60 across-track positions simultaneously and thus does not require across-track scanning. Due to this approach, the spatial resolution of the CCD pixels varies significantly along the across-track direction: those pixels near the track centre have a ground footprint of 13 km×24 km (along track × across track), whereas those close to the track edge (e.g., view zenith angle =56∘) have a ground footprint roughly of 23 km×126 km (de Graaf et al., 2016). Note that from 2012 onwards the smallest pixels (across-track positions) can no longer be used and are excluded from the analysis (known as the “row anomaly”, i.e., Levelt et al., 2018). This means the “smallest” pixels available for an OMI comparison are larger than 13 km×24 km.
The OMI NO2 data used in this work are the NASA standard product (SP) (Bucsela et al., 2013; Wenig et al., 2008) version 3.0 level 2 (SPv3.0) (Krotkov et al., 2017). The NO2 SCDs are derived using the DOAS technique in the 405–465 nm window (Marchenko et al., 2015). The AMFs used in SPv3.0 are calculated by using (latitude × longitude) resolution a priori NO2 and temperature profiles from the Global Modeling Initiative (GMI) chemistry–transport model with yearly varying emissions (Krotkov et al., 2017).
2.1.4 In situ measurements
The NAPS network was established in 1969 to monitor and assess the quality of ambient (outdoor) air in the populated regions of Canada. NAPS provides accurate long-term air quality data (ozone, NO2, SO2, carbon monoxide (CO), fine particulate matter, etc.) of a uniform standard across Canada (e.g., Dabek-Zlotorzynska et al., 2011; Reid and Aherne, 2016).
The in situ NO2 data used in this study were collected at the NAPS Toronto north station (located 100 m away from the Pandora instrument). The site is 186 m above sea level, and the height of the air intake is 4 m above the ground.
The in situ NO2 concentration is measured using a photolytic NO2 instrument (Thermo 42i) that is also sensitive to other gaseous inorganic nitrogen compounds (e.g., nitric acid (HNO3) and peroxyacetyl nitrate (PAN)) (McLinden et al., 2014). Thus, in areas where direct NOx (nitrogen oxides) emission sources are limited and other nitrogen compounds are present, NO2 may be overestimated (e.g., in rural areas). For the current site, however, this positive bias has been found to be only about 5 %, except for very low NO2 concentrations (< 5 ppbv) (Yushan Su, Ontario Ministry of the Environment, Conservation and Parks, personal communication, October 2018).
2.2 Numerical models
Predicted NO2 fields from three atmospheric chemistry models are used in the algorithm described in Sect. 4.1 to derive surface NO2 concentration from Pandora zenith-sky total column NO2 data. Following McLinden et al. (2014), this work uses the Global Environmental Multi-scale Modelling Air quality and CHemistry (GEM-MACH) regional chemical transport model (CTM) and the GEOS-Chem global CTM to simulate total columns and vertical profiles of tropospheric NO2 and surface NO2 concentration. The stratospheric NO2 partial columns are estimated using OMI satellite data and the Pratmo box model.
2.2.1 GEM-MACH
GEM-MACH is ECCC's regional air quality forecast model. It is run operationally twice per day to predict hourly surface pollutant concentrations over North America for the next 48 h (Moran et al., 2009; Pavlovic et al., 2016; Pendlebury et al., 2018). The model consists of an online tropospheric chemistry module (Akingunola et al., 2018; Pavlovic et al., 2016) embedded within the ECCC Global Environmental Multi-scale (GEM) numerical weather prediction model (Côté et al., 1998). Physical and chemical processes represented in GEM-MACH include emissions, dispersion, gas- and aqueous-phase chemistry, inorganic heterogeneous chemistry, aerosol dynamics, and wet and dry removal. The model uses gridded hourly emission fields based on US and Mexican national inventories from the US Environmental Protection Agency (EPA) Air Emissions Modeling Platform and on Canada's national Air Pollutant Emission Inventory (APEI; https://pollution-waste.canada.ca/air-emission-inventory, last access: 23 November 2018) (Zhang et al., 2018). Currently, only NOx emissions in the PBL are included in the operational model; free-tropospheric NOx emissions from lightning and in-flight aircraft are not considered. In this work, the GEM-MACH hourly NO2 vertical profiles from 0 to 1.5 km and surface concentrations are retrieved from archived operational forecasts on the native model grid covering North America at 10 km×10 km horizontal resolution for the period April 2016 to December 2017. The corresponding grid box closest to the Pandora location was used in this study.
2.2.2 GEOS-Chem
The GEOS-Chem chemical transport model (Bey et al., 2001) has been used extensively in the retrieval of tropospheric columns and has been shown to be capable of reasonably simulating the vertical distributions of NO2 (Lamsal et al., 2008; Martin et al., 2002; McLinden et al., 2014). The model has a detailed representation of tropospheric chemistry, including aerosols and their precursors (Park et al., 2004). In the simulation used in this study, a global lightning NOx source of 6 Tg N yr−1 (Martin et al., 2002) was imposed. Lightning NOx emissions are computed as a function of cloud-top height and are scaled globally as described by Sauvage et al. (2007) to match Optical Transient Detector/Lightning Imaging Sensor (OTD/LIS) climatological observations of lightning flashes. The model was run on a (latitude × longitude) grid in nested mode over North America and was driven by assimilated meteorology from the Goddard Earth Observing System (GEOS-5). The modelled NO2 profiles were used to calculate monthly mean NO2 partial columns in the free troposphere (1.5 to 12 km), as the GEM-MACH model does not include free-tropospheric NO2 sources (lightning, in-flight aircraft emissions).
2.2.3 Pratmo box model
Pratmo is a stratospheric photochemical box model (Brohede et al., 2008; Lindenmaier et al., 2011; McLinden et al., 2000). The model has detailed stratospheric chemistry that includes long-lived species (nitrous oxide (N2O), methane (CH4), and water vapor (H2O)) and halogen families (NOy, Cly, and Bry) that are based on a combination of three-dimensional model output and tracer correlations (Adams et al., 2017). Heterogeneous chemistry of background stratospheric sulfate aerosols is also included. The model is constrained with climatological profiles of ozone and temperature.
Stratospheric NO2 has a strong diurnal variation; therefore, diurnal corrections must be applied when OMI stratospheric NO2 measurements (around local noon) are interpolated to Pandora measurement times. Ratios of modelled stratospheric NO2 columns are calculated at OMI overpass time and Pandora measurement time. These ratios are multiplied by the OMI measured stratospheric NO2 to produce stratospheric NO2 columns corresponding to the time of Pandora measurements. Details about the use of the Pratmo box model and the calculation of stratospheric NO2 partial columns are provided in Sect. 4.1.
3.1 Zenith-sky air mass factor
The NDACC UV–visible network uses zenith-sky AMFs in its total column NO2 retrievals. To improve the overall homogeneity of the UV–visible NO2 column measurements, NDACC recommended using the NO2 AMF LUT (Van Roozendael and Hendrick, 2012). This LUT is based on climatological NO2 profiles that are composed of (1) 20–60 km NO2 profiles developed by Lambert et al. (1999, 2000) and (2) 12–20 km NO2 profiles derived from SAOZ (Système D'Analyse par Observations Zénithales) balloon observations (Van Roozendael and Hendrick, 2012). The NO2 concentration is set to zero below 12 km altitude. The NO2 AMFs have been calculated using the UVSPEC/DISORT RTM (Hendrick et al., 2006; Wagner et al., 2007). The parameters used in building the LUT are wavelength, ground albedo, altitude of the station, and solar zenith angle (SZA). Aerosol extinction, ozone, and temperature profiles come from an aerosol model (Shettle, 1989), the US Standard Atmosphere, and the TOMS V8 climatology, respectively.
The NDACC LUT is designed for stratospheric NO2 retrievals. Note that the absence of tropospheric NO2 in the NDACC LUT construction will lead to an underestimation of the total column NO2 in urban areas. For example, from 2015 to 2017, tropospheric NO2 accounted for 73±11 % (1σ) of the total column amounts in Toronto (OMI SPv3.0 data). To account for this significant tropospheric NO2 in urban areas, new empirical AMFs were developed in this study and the NDACC AMF LUT is used for comparison purposes only. In Tack et al. (2015), a more sophisticated four-step approach to derive total and tropospheric NO2 columns from zenith-sky measurements was proposed, which involved using a RTM to calculate appropriate tropospheric AMFs. However, due to benefits from using the high-quality Pandora direct-Sun total column NO2 measurements, this work took a different but simple and robust approach to derive zenith-sky total column NO2.
Empirical AMFs are calculated for Pandora zenith-sky NO2 measurements in such a way that they can be used to retrieve zenith-sky total column NO2 values that match the high-quality Pandora direct-Sun total column NO2 values. Inferring total columns from zenith-sky observations through comparisons with accurate direct-Sun observations is a common approach for Brewer and Dobson zenith-sky total ozone measurements (Kerr et al., 1988). For example, in the Brewer instrument zenith-sky ozone algorithm, weighted zenith-sky light intensities measured at four wavelengths (F) are expressed as a function of the slant path (μ) and total column ozone (Kerr et al., 1981). The nine semi-empirical coefficients used to derive total column ozone from measured F in the equation are estimated from a set of direct-Sun and zenith-sky observations made nearly simultaneously (Fioletov et al., 2011). Instead of finding the link between zenith-sky spectral intensity and total column values (i.e., following the Brewer and Dobson zenith-sky total ozone retrieval method), deriving empirical zenith-sky AMFs for Pandora zenith-sky measurements is more straightforward since Pandora zenith-sky spectra can be analyzed to produce NO2 dSCDs.
The relation between VCD and dSCD can be expressed as
where RCD is the reference column density that shows the slant column amount of the trace gas in the reference spectrum (Sect. 2.1.2). If we make an assumption that the coincident direct-Sun (DS) and zenith-sky (ZS) measurements sampled the same air mass, then the empirical zenith-sky AMFs (referred to here as AMFZS-Emp) can be calculated by assuming VCDDS= VCDZS, which gives
Next, we can use nearly coincident VCDDS and dSCDZS in a multi-non-linear regression to retrieve AMFZS-Emp and RCDZS together. To ensure the quality of the retrieved AMFZS-Emp, only high-quality direct-Sun total column NO2 data are used with SZA < 75∘. Details about the empirical zenith-sky AMF calculation are shown in Appendix A.
Figure 1 shows a comparison of the empirical zenith-sky AMFs and NDACC AMFs (calculated for the Toronto measurements). Total column NO2 can then be retrieved using Eq. (1) and these two sets of AMFs, where the one based on empirical AMFs is referred to as VCDZS-Emp and the one based on NDACC AMFs is referred to as VCDZS-NDACC. The RCD value used in the retrievals is 0.39±0.01 DU, which is retrieved along with AMFZS-Emp (Appendix A). Figure 2 shows the comparisons of the NO2 columns measured by zenith-sky and direct-Sun methods. The regression analyses were performed by using the following coincidence criteria: (1) nearest Pandora direct-Sun measurement that was within ±5 min of Pandora zenith-sky measurement, (2) SZA < 75∘, and (3) Pandora direct-Sun total column NO2 data have assured high quality (BlickP L2 data quality flag for nitrogen dioxide is 0). In general, the VCDZS-Emp and VCDZS-NDACC performed as expected. Compared with VCDDS, the VCDZS-NDACC shows a −25 % bias, while the VCDZS-Emp only shows a −4 % bias (indicated by the red lines on each panel and their slopes). In addition, VCDZS-Emp shows less SZA dependence than VCDZS-NDACC (see the increased bias for measurements made in larger SZA conditions in Fig. 2b). These results confirm that, for urban sites, the tropospheric NO2 profile should be included when calculating empirical zenith-sky AMFs. In the rest of the paper, only the zenith-sky NO2 retrieved using empirical AMFs will be discussed. The derived zenith-sky total column NO2 values are affected by both clouds and aerosols due to their impact on the light path. The presence of clouds and aerosols contributes to the uncertainty of the measurements. However, the impact of aerosols is expected to be moderate in most cases compared to that of clouds (e.g., Hendrick et al., 2011; Tack et al., 2015). Thus, this work has focused on evaluating the impact from clouds. Note that the Pandora zenith-sky total column NO2 data discussed in Sect. 3 are a “clear-sky subset” of Pandora zenith-sky measurements. The assessment of Pandora zenith-sky NO2 measurements in cloudy conditions is provided in Sect. 4.
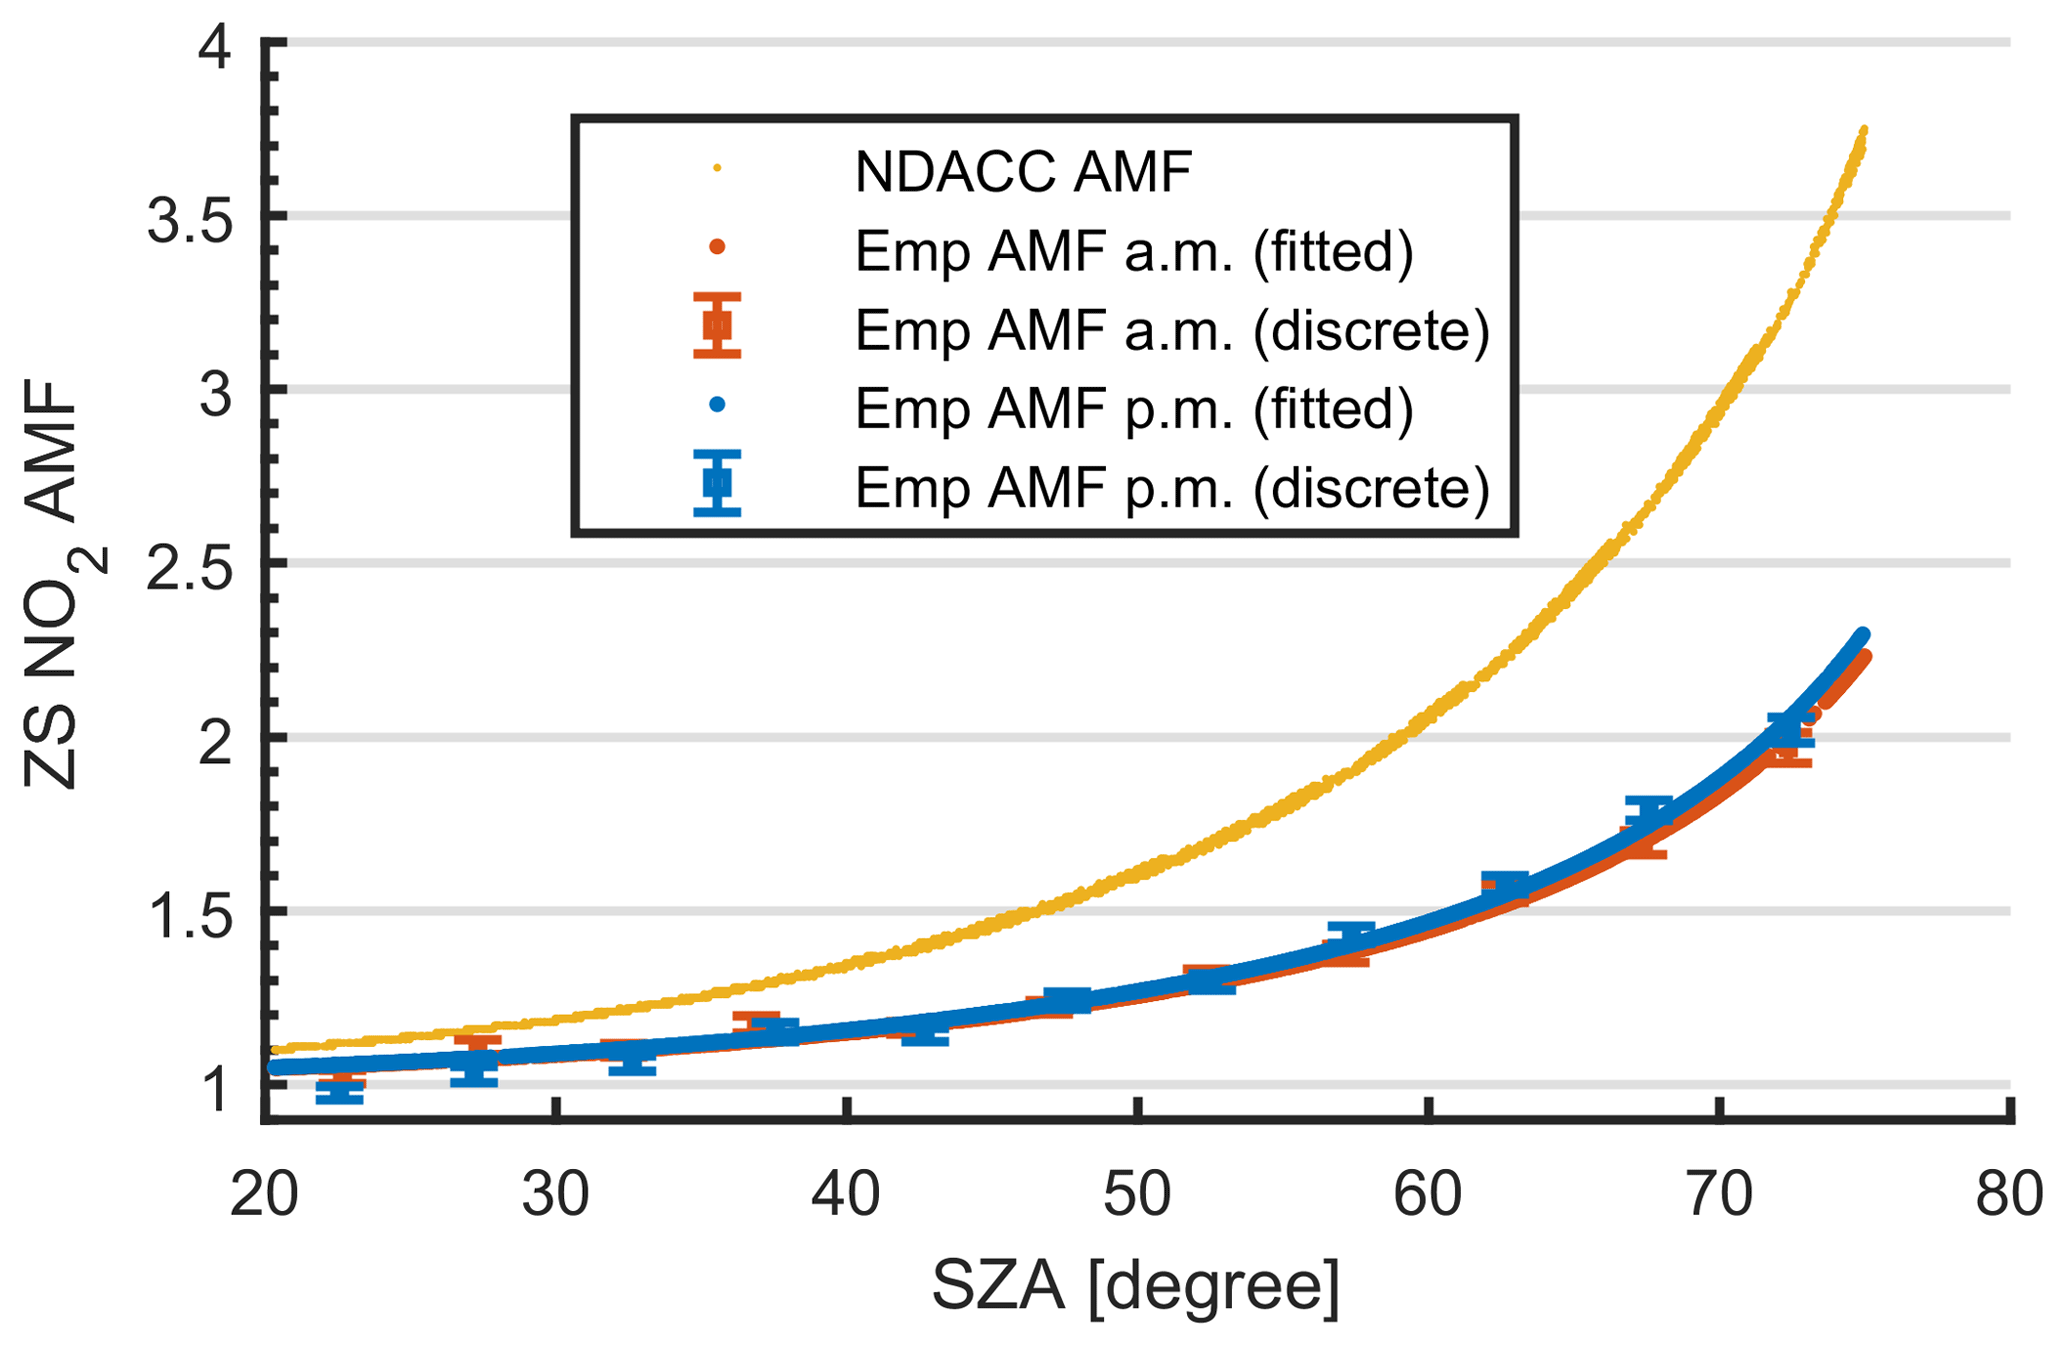
Figure 1Comparison of zenith-sky NO2 air mass factors. Blue and red squares with error bars (standard error) represent the empirical discrete zenith-sky NO2 AMFs in each SZA bin for Toronto for the period February 2015 to September 2017. Blue and red lines show the fitted empirical zenith-sky NO2 AMFs. NDACC AMFs calculated using the NDACC look-up table and assuming no NO2 in the troposphere are shown in yellow.
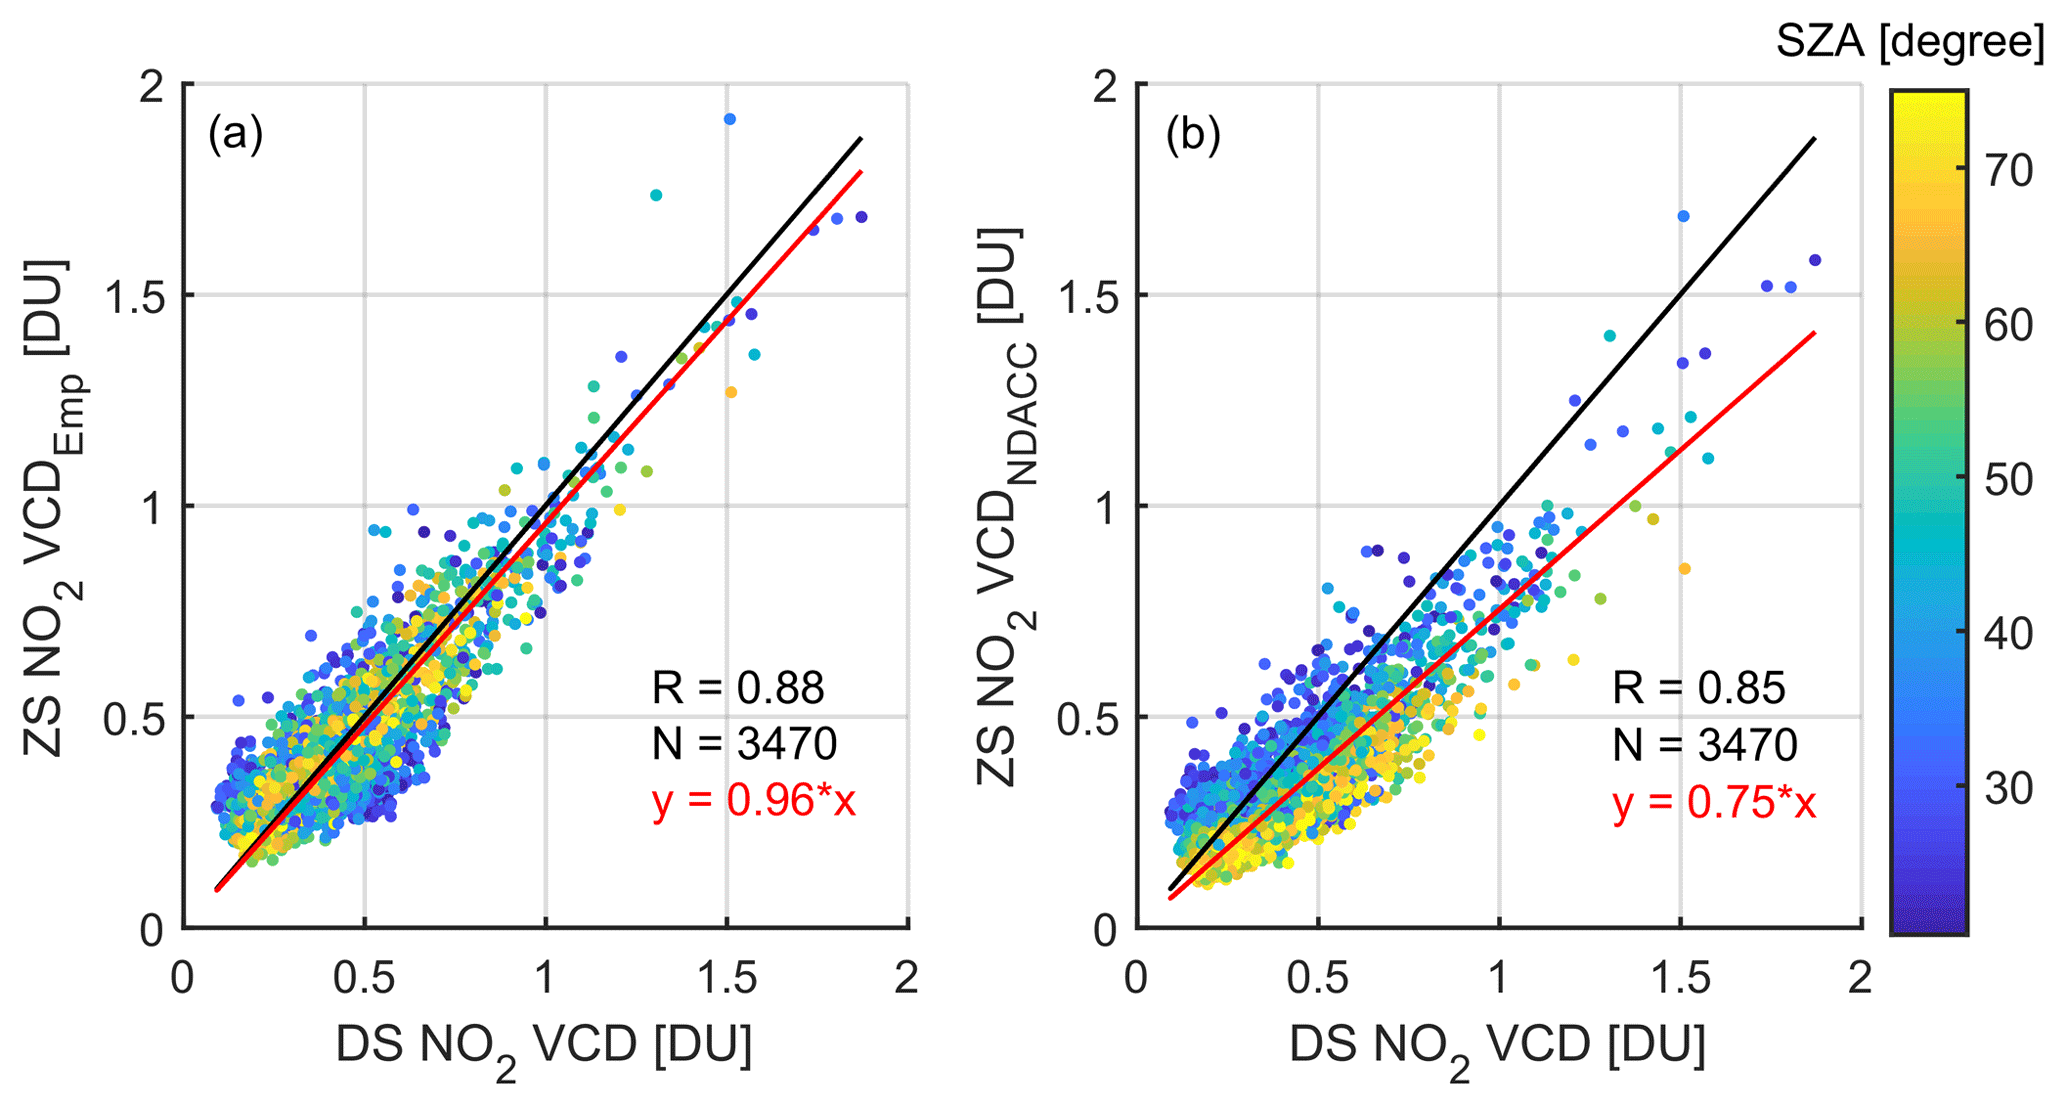
Figure 2Comparisons of NO2 total columns (2015–2017): (a) zenith-sky total column NO2 retrieved using empirical AMFs vs. direct-Sun total column NO2, (b) zenith-sky total column NO2 retrieved using NDACC AMFs vs. direct-Sun total column NO2. On each scatter plot, the red line is the linear fit with intercept set to 0, and the black line is the one-to-one line. The scatter plot is colour-coded by solar zenith angle (SZA).
3.2 Comparison with satellite measurements
To illustrate the NO2 variability over Toronto, Fig. 3 shows the time series (2015–2017) from Pandora direct-Sun, zenith-sky, and OMI SPv3.0 total column NO2. In general, the NO2 datasets from the ground-based Pandora instrument and the satellite follow the same pattern. However, the satellite data are likely to miss the peak NO2 values in the morning since OMI only passes over Toronto once per day around 13:30 LT (local time).
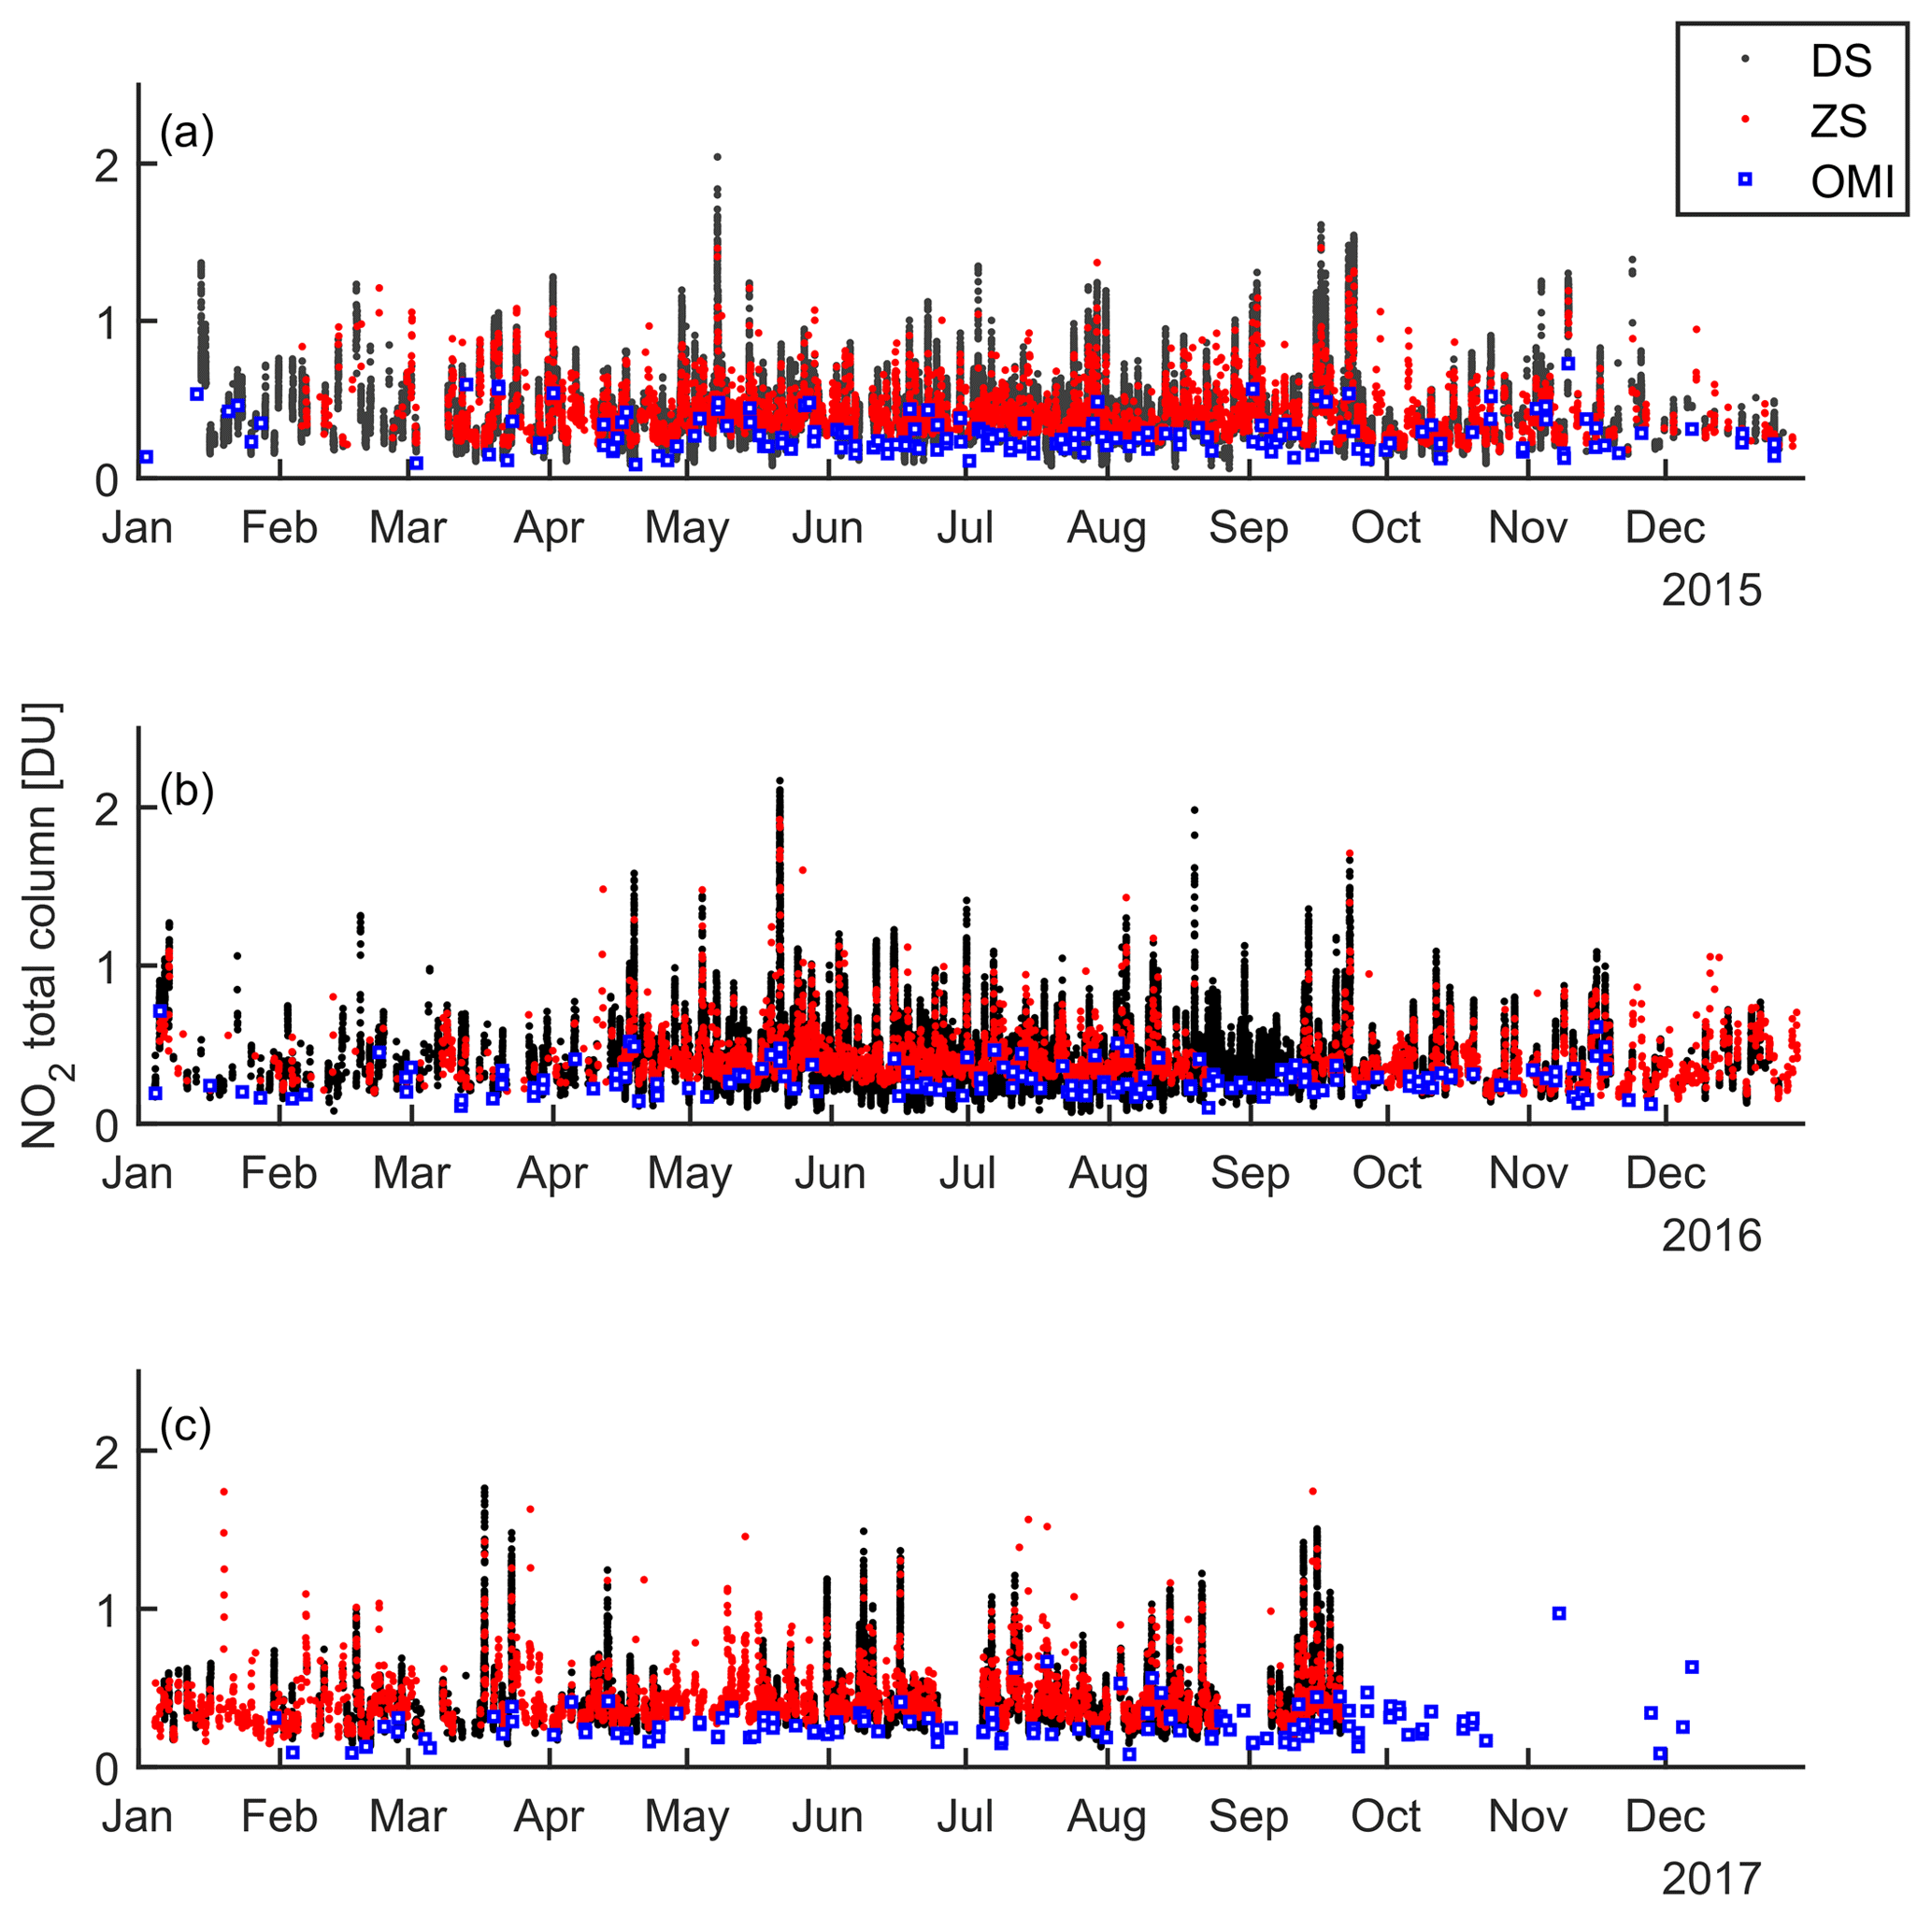
Figure 3Annual time series of Pandora direct-Sun (DS), Pandora zenith-sky (ZS), and OMI SPv3 total column NO2 in Toronto from 2015 to 2017.
We also performed regression analyses by using the following coincidence criteria: (1) nearest (in time) measurement that was within ±30 min of OMI overpass time, (2) closest OMI ground pixel (having a distance from the ground pixel centre to the location of the Pandora instrument less than 20 km), and (3) cloud fraction < =0.3 (the effective geometric cloud fraction, as determined by the OMCLDO2 algorithm; Celarier et al., 2016). In this comparison, only high-quality OMI data are used (VcdQualityFlags =0) (Celarier et al., 2016). Figure 4a and b show the scatter plots of OMI vs. Pandora direct-Sun and OMI vs. Pandora zenith-sky total column NO2, respectively. Figure 4c and d show similar comparisons but only use OMI NO2 measured by “small pixels” (i.e., having viewing zenith angle of less than 35∘). The better correlation and lower bias for zenith-sky vs. direct-Sun measurements might be a case of coincident errors; i.e., compared to Pandora direct-Sun total column NO2, both OMI and Pandora zenith-sky total column NO2 underestimate the local NO2 at Toronto (see Fig. 2). When taking into account the standard error of the fitting and the confidence level of R, the difference between zenith-sky and direct-Sun data is not significant (i.e., in Fig. 4 from panels a to d, the slopes with standard error are 0.64±0.02, 0.67±0.02, 0.70±0.04, and 0.71±0.03; the 95 % confidence intervals for R values are 0.45 to 0.63, 0.61 to 0.75, 0.43 to 0.77, and 0.60 to 0.86). The comparison results indicate that, at the Toronto site, OMI underestimates the total column by about 30 %. This underestimation is qualitatively consistent with the fact that the Pandora location is near the northern edge of peak Toronto NO2, and the relatively large OMI pixels are also generally sampling areas of less NO2 in the vicinity. The use of the relatively coarse (1∘) GMI model for profile shapes (Sect. 2.1.3) will also lead to a low bias considering the peak NOx emissions span roughly . Similar results have been found elsewhere.
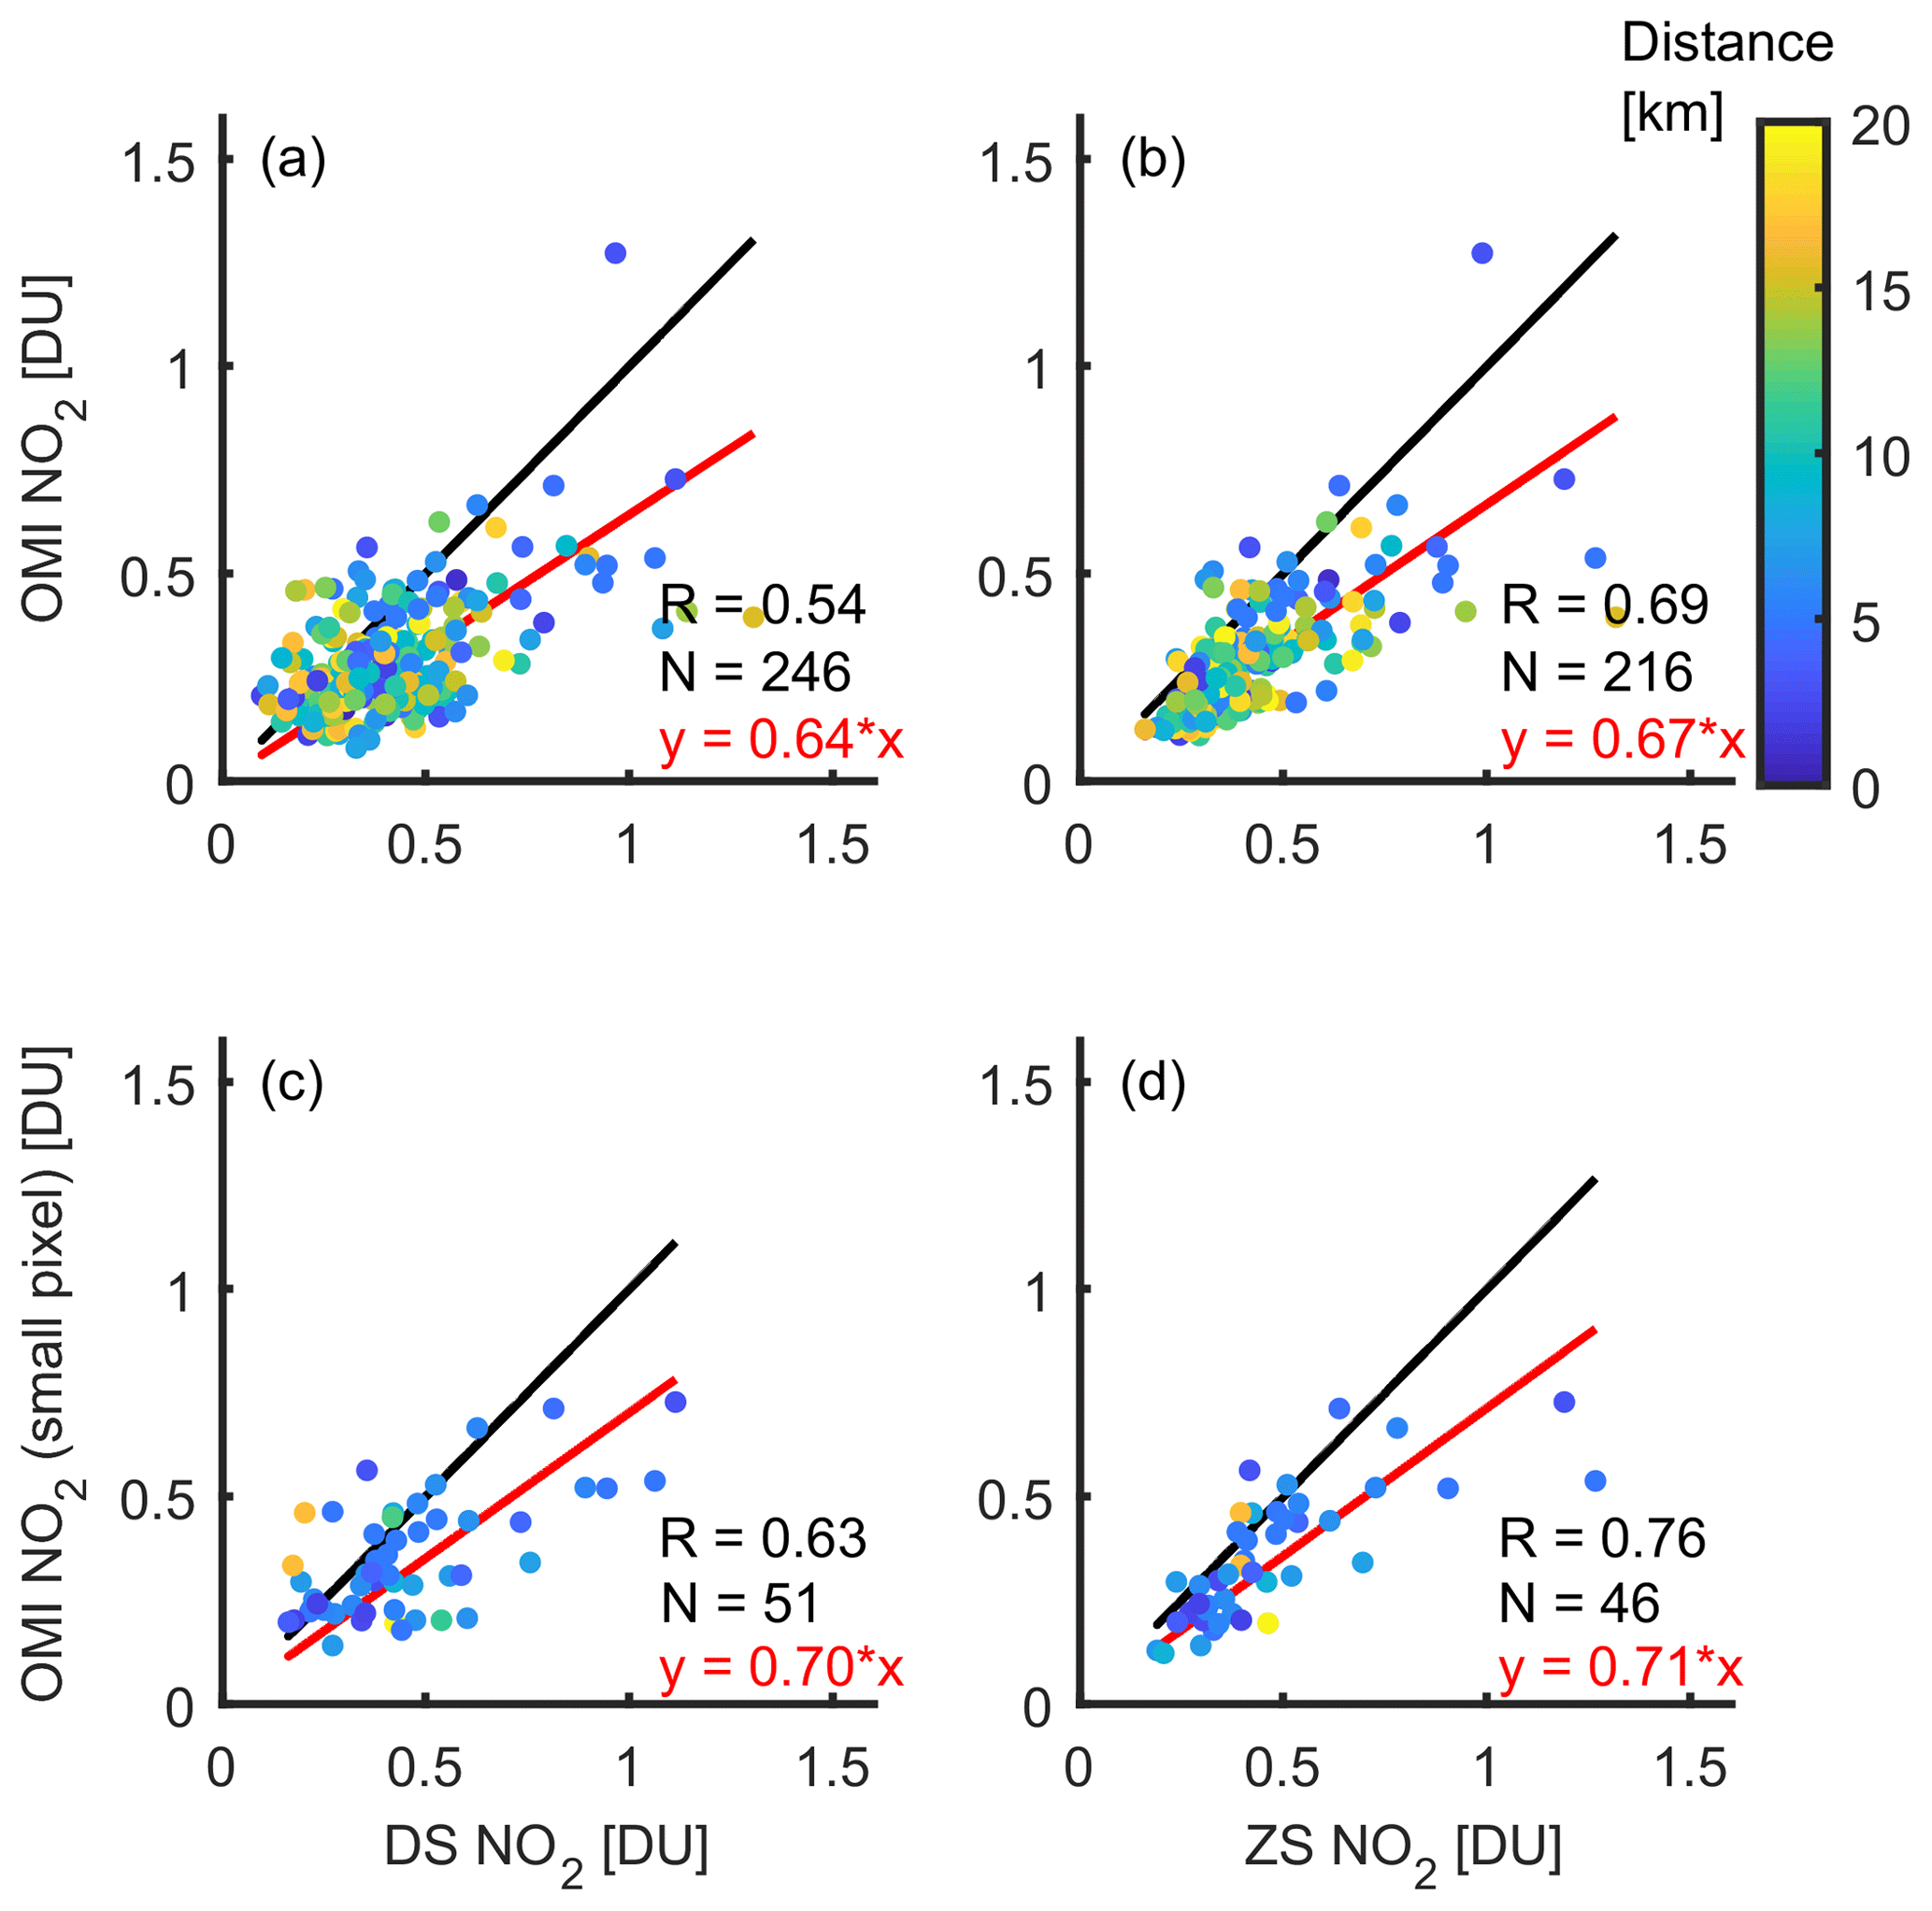
Figure 4OMI vs. Pandora total column NO2 (2015–2017). Panels (a) and (c) show OMI vs. Pandora direct-Sun NO2, and (b) and (d) show OMI vs. Pandora zenith-sky NO2. Panels (a) and (b) show all available OMI measurements, while panels (c) and (d) show OMI data from small pixels only. On each scatter plot, the red line is the linear fit with intercept set to 0 and the black line is the one-to-one line. All scatter plots are colour-coded by the distance from the centre of an OMI ground pixel to the location of Pandora.
Ialongo et al. (2016) reported a similar negative bias using OMI SPv3.0 and Pandora direct-Sun total column NO2 in Helsinki (−32 % bias and R=0.51), and they suggested this was due to the difference between the OMI pixel and the relatively small Pandora field of view. In Reed et al. (2015), Pandora measurements at 11 sites were evaluated; the authors found that the best correlation between OMI SPv3.0 and Pandora direct-Sun total column NO2 data is for rural sites. They concluded this could be due to smaller atmospheric variability in the rural region. Other studies such as Goldberg et al. (2017) found an even worse OMI–Pandora comparison between these two data products with striking negative bias at high values and poor correlation (R=0.3). The authors attributed the poor agreement to the coarse resolution of OMI and its AMFs computed with GMI a priori NO2 profiles. In general, our comparison results show that (1) the Pandora direct-Sun total column NO2 data measured in Toronto have a reasonable agreement with OMI, and (2) the Pandora zenith-sky total column NO2 data show results similar to those for direct-Sun total column when compared with OMI SPv3.0.
The performance of the clear-sky Pandora zenith-sky total column NO2 data has been assessed by using OMI and Pandora direct-Sun data as described in Sect. 3.2. However, the validation of cloudy-scene Pandora zenith-sky total column data is not simple, since near-simultaneous good-quality direct-Sun or satellite measurements in most cloudy conditions are not available. This cloudy-scene validation can be done by comparison with in situ NO2 measurements that are not affected by weather. In general, the comparison between total column and surface concentrations can be done by two approaches: (1) convert Pandora zenith-sky total columns to surface concentrations; and (2) convert in situ surface concentrations to total column values. For example, Spinei et al. (2018) calculated “ground-up” VCDs from in situ surface concentrations by using additional measurements of PBL height or assuming trace gas profiles. In this work, the first approach is employed since the surface NO2 data products from Pandora remote-sensing measurements have direct applications in areas such as air quality monitoring.
4.1 Column-to-surface conversion algorithm
A simple but robust scaling method is adapted to derive surface NO2 concentration from Pandora zenith-sky total column NO2 measurements. Following Lamsal et al. (2008) and McLinden et al. (2014), the surface NO2 concentration is estimated using the modelled profile and surface concentration:
where Cpan is the surface NO2 volume mixing ratio (VMR) to be estimated, C is the surface NO2 VMR from GEM-MACH (or G-M), Vpan is the total column NO2 measured by Pandora, Vstrat is the stratospheric NO2 partial column, Vftrop is the NO2 partial column in the free troposphere, and VPBL is the NO2 partial column in the PBL. This equation assumes the chemical transport models can effectively capture the spatial and temporal behaviour of the concentration-to-partial-column ratio.
In this work, VPBL (0–1.5 km) is integrated from the GEM-MACH NO2 profile and Vftrop (1.5–12 km) is integrated from the GEOS-Chem NO2 profile. Both GEM-MACH and GEOS-Chem have an hourly temporal resolution. Thus, the integrated VPBL and Vftrop can account for NO2 diurnal variation. However, Vstrat is from OMI monthly mean stratospheric NO2, which does not have diurnal variation. Thus, the Pratmo box model is used to calculate stratospheric NO2 diurnal ratios. The OMI stratospheric NO2 columns are interpolated to morning and evening hours by multiplying by the box-model diurnal ratios. Details about the calculation of Vstrat as well as references are provided in Appendix B.
The (C∕VPBL)G-M ratio in Eq. (3) is provided by GEM-MACH, and has hourly temporal resolution. This modelled (C∕VPBL)G-M ratio is referred to here as a conversion ratio RCV. Besides the hourly modelled conversion ratio, a simple monthly look-up table is built using an average of the 1.5 years of GEM-MACH model outputs (April 2016 to December 2017) that were available. The look-up table (referred to here as the Pandora surface-concentration look-up table, or PSC-LUT) is composed of monthly conversion ratios with hourly resolution as shown in Fig. 5. For example, assuming that a Pandora NO2 total column measurement is made on a day in December at 15:00 LST, then the corresponding conversion ratio from the PSC-LUT is 28 ppbv DU−1 (see the black arrow). Our results in Fig. 5 show that the conversion ratio changes throughout the day as well as with season: 0.1 DU (partial column NO2 in the PBL) corresponds to 5–8 pptv of surface NO2 in the morning (08:00 LST), 2–3 pptv around local noon (13:00 LST), and 2–4 pptv in the evening (18:00 LST). In general, the variation of conversion ratios demonstrates that the surface NO2 concentration is controlled not only by PBL height but also by both boundary layer dynamics and photochemistry. The surface NO2 derived using the hourly modelled RCV ratio is referred to here as Cpan-model, while the surface NO2 derived using the monthly mean PSC-LUT is referred to here as Cpan-LUT. In general, Cpan-model is a data product that depends on daily model outputs, but Cpan-LUT only needs the pre-calculated PSC-LUT and is thus less dependent on the model. In general, the look-up table approach (Cpan-LUT) is aiming for a quick and near-real-time data delivery. Thus, to minimize year-to-year variation (e.g., from changing meteorological conditions or changing local emission patterns), for a given year, we recommend using a mean PSC-LUT that is calculated from model simulations of previous years. On the other hand, the Cpan-model is the offline, high-quality, year-specific data product that will be delivered for air quality research and other applications. Details of these two different surface NO2 data products are discussed in the next section.
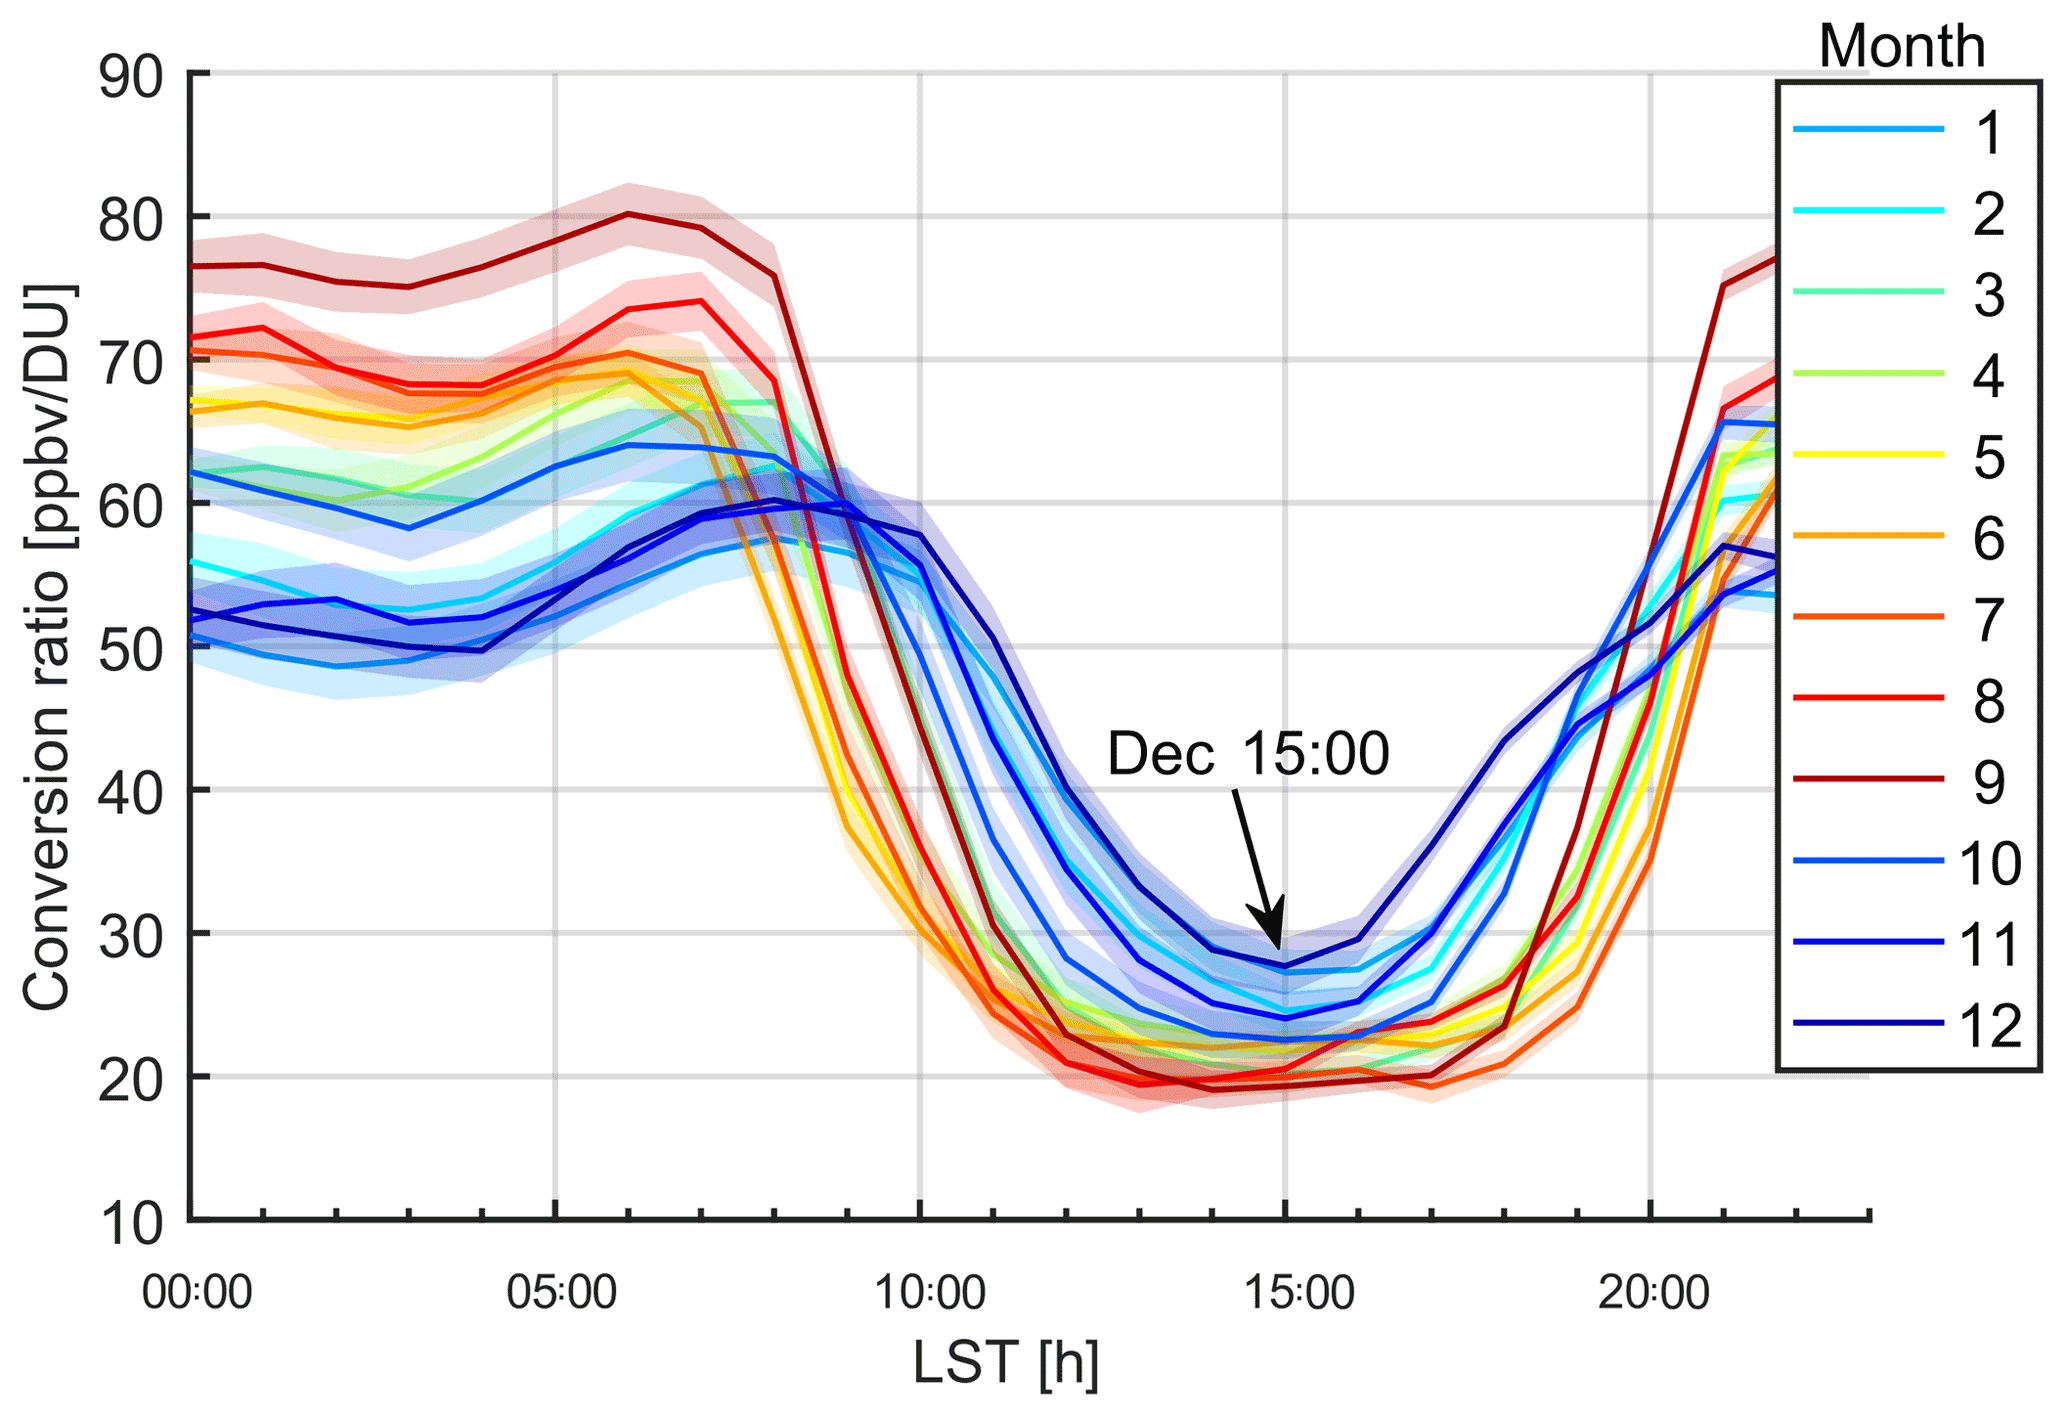
Figure 5Dependence of the Pandora surface NO2 concentration look-up table (PSC-LUT) on month of year and hour of day. The PSC-LUT is constructed using the GEM-MACH modelled NO2 conversion ratios. Solid lines are monthly mean conversion ratios colour-coded by month. The shaded envelopes are the standard error of the mean.
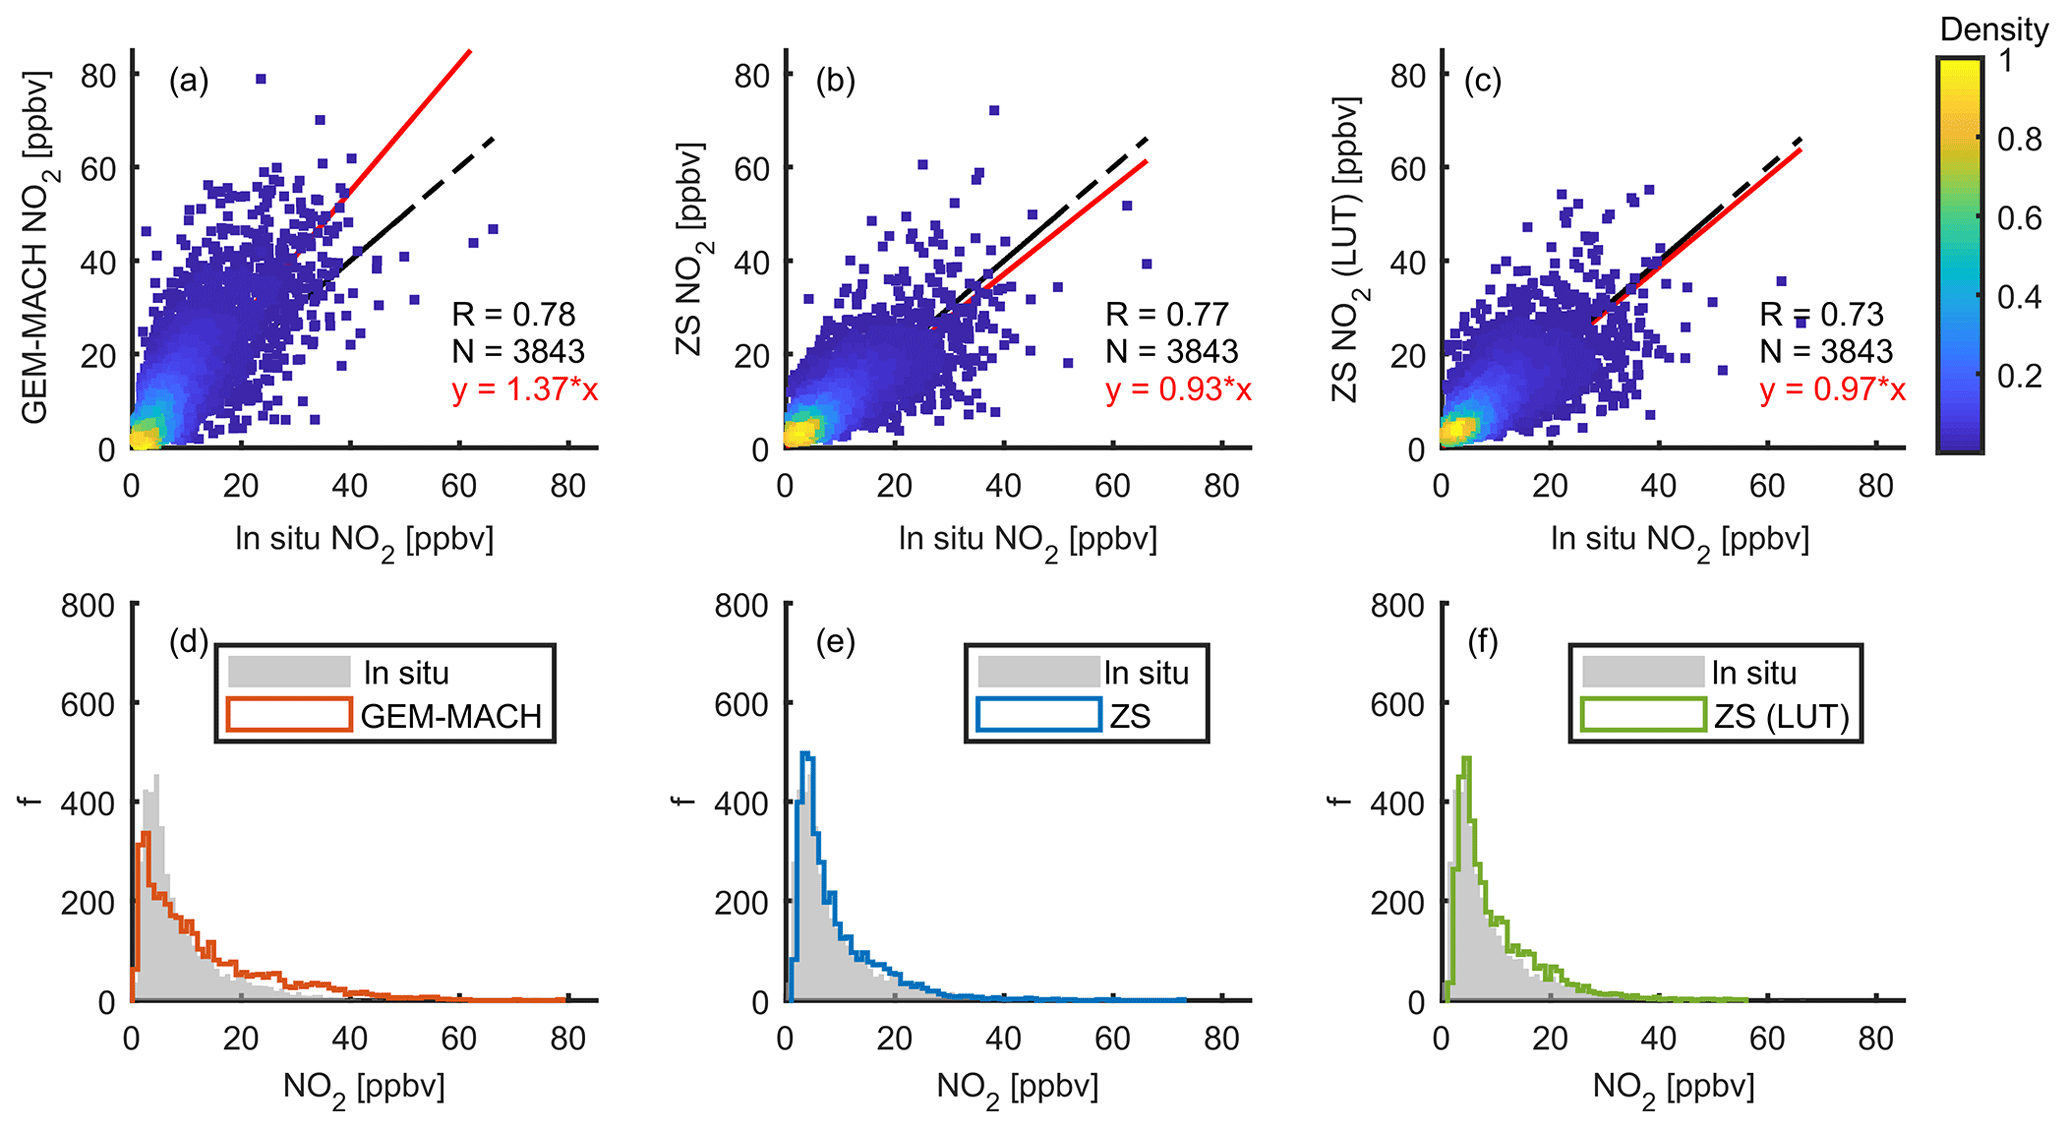
Figure 6Modelled and Pandora zenith-sky surface NO2 vs. in situ NO2 (2016–2017). Panel (a) shows the GEM-MACH modelled surface NO2 data vs. in situ NO2; panels (b) and (c) show the Pandora ZS surface NO2 data vs. in situ NO2. The Pandora ZS surface NO2 data in panels (b) and (c) are derived using the hourly modelled conversion ratio and the monthly PSC-LUT, respectively. Panels (d) to (f) are histograms corresponding to the data in panels (a) to (c). On each scatter plot, the red line is the linear fit with intercept set to 0 and the black line is the one-to-one line. The scatter plots are colour-coded by the normalized density of the points.
4.2 Comparison with measurements and model
Figure 6 shows the evaluation of modelled and Pandora zenith-sky surface NO2 concentrations, both using in situ NO2 measurements as the reference. The Pandora data have been filtered for heavy clouds (details are given in Sect. 4.3). The GEM-MACH modelled surface concentrations in Toronto reproduce the in situ measurements very well with the comparison showing high correlation (R=0.78) and moderate positive bias (37 %, Fig. 6a). The Pandora zenith-sky surface NO2 data, Cpan-model, shows almost the same correlation (R=0.77), with only −7 % bias (Fig. 6b). The better performance of Cpan-model is expected since the conversion method for Pandora zenith-sky measurements relies on the GEM-MACH modelled NO2 profile (see Eq. 3); in other words, the Pandora zenith-sky surface NO2 has at least one more piece of information (i.e., NO2 total column) than GEM-MACH surface NO2 concentrations. The Cpan-LUT shows a similar correlation coefficient (R=0.73) and has improved bias (−3 %, Fig. 6c). This result (slightly lower correlation) is also reasonable and acceptable since Cpan-LUT is derived with the monthly PSC-LUT, which has less accurate information than the hourly modelled data.
Besides the improved bias, Pandora zenith-sky surface NO2 concentrations, Cpan-model and Cpan-LUT (Fig. 6e and f), also have better frequency distributions than the GEM-MACH (Fig. 6d). Figure 6d shows that the NO2 surface concentrations peaks (ambient background concentrations) from model and in situ data are misaligned. This indicates that the GEM-MACH NO2 background surface concentrations have a 1 ppbv low bias at this site. In contrast, the zenith-sky surface NO2 at peak frequency matches the in situ data (Fig. 6e and f), indicating that the low bias of the background surface NO2 value has been corrected with this additional information from Pandora zenith-sky total column measurements. In addition, in high NO2 concentration conditions (> 20 ppbv), the zenith-sky surface NO2 also shows better agreement with the in situ NO2 than do the modelled data. The mean of the top 10 % of the in situ data is 26±1 ppbv (uncertainty of the mean), whereas the corresponding values for GEM-MACH, Cpan-model, and Cpan-LUT are 39±1, 26±1, and 27±1 ppbv, respectively.

Figure 7Modelled and Pandora direct-Sun surface NO2 vs. in situ NO2 (2016–2017). Panel (a) shows the GEM-MACH modelled surface NO2 data vs. in situ NO2; panels (b) and (c) show the Pandora DS surface NO2 data vs. in situ NO2. The Pandora DS surface NO2 data in panels (b) and (c) are derived using the hourly modelled conversion ratio and the monthly PSC-LUT, respectively. Panels (d) to (f) are histograms corresponding to the data in panels (a) to (c). On each scatter plot, the red line is the linear fit with intercept set to 0 and the black line is the one-to-one line. The scatter plots are colour-coded by the normalized density of the points.
The total column-to-surface concentration conversion algorithm has also been applied to the Pandora direct-Sun total column NO2 (see Fig. 7). Figure 7b shows that the direct-Sun surface NO2 data have a similar agreement with the in situ data (−8 % bias and R=0.80) as the zenith-sky surface NO2. In high NO2 concentration conditions, direct-Sun data have a similarly good agreement with the in situ measurements. For this direct-Sun based dataset, the mean of the top 10 % of the in situ data is 27±1 ppbv, whereas the corresponding values for GEM-MACH, Cpan-model, and Cpan-LUT are 40±1, 27±1, and 27±1 ppbv, respectively.
Thus, in general, both Pandora zenith-sky and direct-Sun surface NO2 datasets can be used reliably to obtain surface concentrations. The good consistency between Cpan-model and Cpan-LUT implies that two versions of Pandora surface NO2 data can be delivered in the future, i.e., an offline version that relies on the inputs from hourly model and a near-real-time version that only needs a pre-calculated LUT.
4.3 Measurements in different sky conditions
Although zenith-sky observations are less sensitive to cloud conditions than direct-Sun observations, we still need to be cautious about the derived zenith-sky surface NO2 in heavy cloud conditions. Due to enhanced scattering, heavy clouds could lead to a significant overestimation of surface NO2 derived from zenith-sky measurements. A cloud filtering method based on retrieved O4 dSCDs is used to identify these conditions. High retrieved O4 values correspond to long optical path lengths, and therefore it is expected that corresponding NO2 values are overestimated as discussed in Appendix C.

Figure 8Example of surface NO2 concentration time series in all conditions (April 2017). The in situ, Pandora DS, and Pandora ZS surface NO2 concentrations are shown by different coloured dots. The TSI relative strength of direct-Sun data is plotted as a colour-coded horizontal dotted line in the top area of each panel. For Pandora zenith-sky data, the measurements with enhanced O4 (heavy cloud indicator) are also labelled by green squares. Dates are in mm/dd format.
The effectiveness of the zenith-sky NO2 in cloudy scenes is demonstrated by the time series plots (Fig. 8) of in situ and Pandora direct-Sun and zenith-sky data (in their original temporal resolutions). Under clear-sky conditions (for example, 8–14 April), both Pandora direct-Sun and zenith-sky-based surface concentrations correlate well with the in situ measurements. Under moderately cloudy conditions, when Pandora direct-Sun observations cannot provide high-quality data, Pandora zenith-sky observation still can yield good measurements that compare well with in situ data (for example, 26–29 April). Under heavy cloud conditions, however, which are identified by enhanced O4 (Appendix C), Pandora zenith-sky-derived surface NO2 yielded higher than in situ measurements (for example, 4 and 6 April; see the green squares). This feature is due to the enhanced multi-scattering in heavy cloud conditions, which leads to enhanced NO2 absorption in the measured spectra.
Sensitivity tests (Appendix C) show that only 10 % of all zenith-sky measurements are strongly affected by this enhanced absorption, indicating the zenith-sky NO2 algorithm is applicable to most measurements made in thin and moderate cloud conditions (Toronto has about 44 % of daylight hours with clear-sky conditions per year). The relative strength of direct Sun measured by a collocated total sky imager (model TSI-880) is plotted at the top of each panel in Fig. 8 as an additional indicator of sky conditions. The relative strength of the direct Sun is from the integration of blocking-strip luminance. In general, when the relative strength of direct-Sun is high (> 60), good-quality direct-Sun and zenith-sky NO2 data can both be produced. However, when Sun strength is moderate (30–60), only zenith-sky NO2 data are reliable. When Sun strength is low (< 30), zenith-sky NO2 has increased bias and needs to be filtered out.
This study evaluated the performance of Pandora zenith-sky measurements with Pandora direct-Sun measurements, satellite measurements, and in situ measurements. In general, the quality of zenith-sky data is affected by three main factors: (1) quality of empirical zenith-sky AMFs; (2) cloud conditions (heavy clouds or moderate/thin clouds); and (3) quality of modelled NO2 profile (this factor only applies to Pandora surface NO2 data). The quality of empirical zenith-sky AMFs and the cloud effect have been addressed in Appendices A and C, respectively. The third factor is discussed in Sect. 5.1 and 5.2. The uncertainty estimations for Pandora zenith-sky and direct-Sun data products are provided in Appendix D.
5.1 Diurnal and seasonal variation
From the Pandora zenith-sky and direct-Sun measurements, and modelled NO2 profiles, surface NO2 concentrations were obtained that agree well with in situ measurements collected at the same location. The Pandora surface NO2 data were also analyzed in more detail with a focus on temporal variations. Figure 9 shows the averaged surface NO2 diurnal variations of four different datasets. The in situ instrument produces continuous measurements 24 h d−1, whereas Pandora only has measurements when sunlight is available. The diurnal variation of surface NO2 concentration is controlled by dynamics (e.g., vertical mixing, wind direction), photochemistry, and local emissions. Thus, the diurnal variations are calculated using only the hours when in situ, direct-Sun, and zenith-sky data are all available.
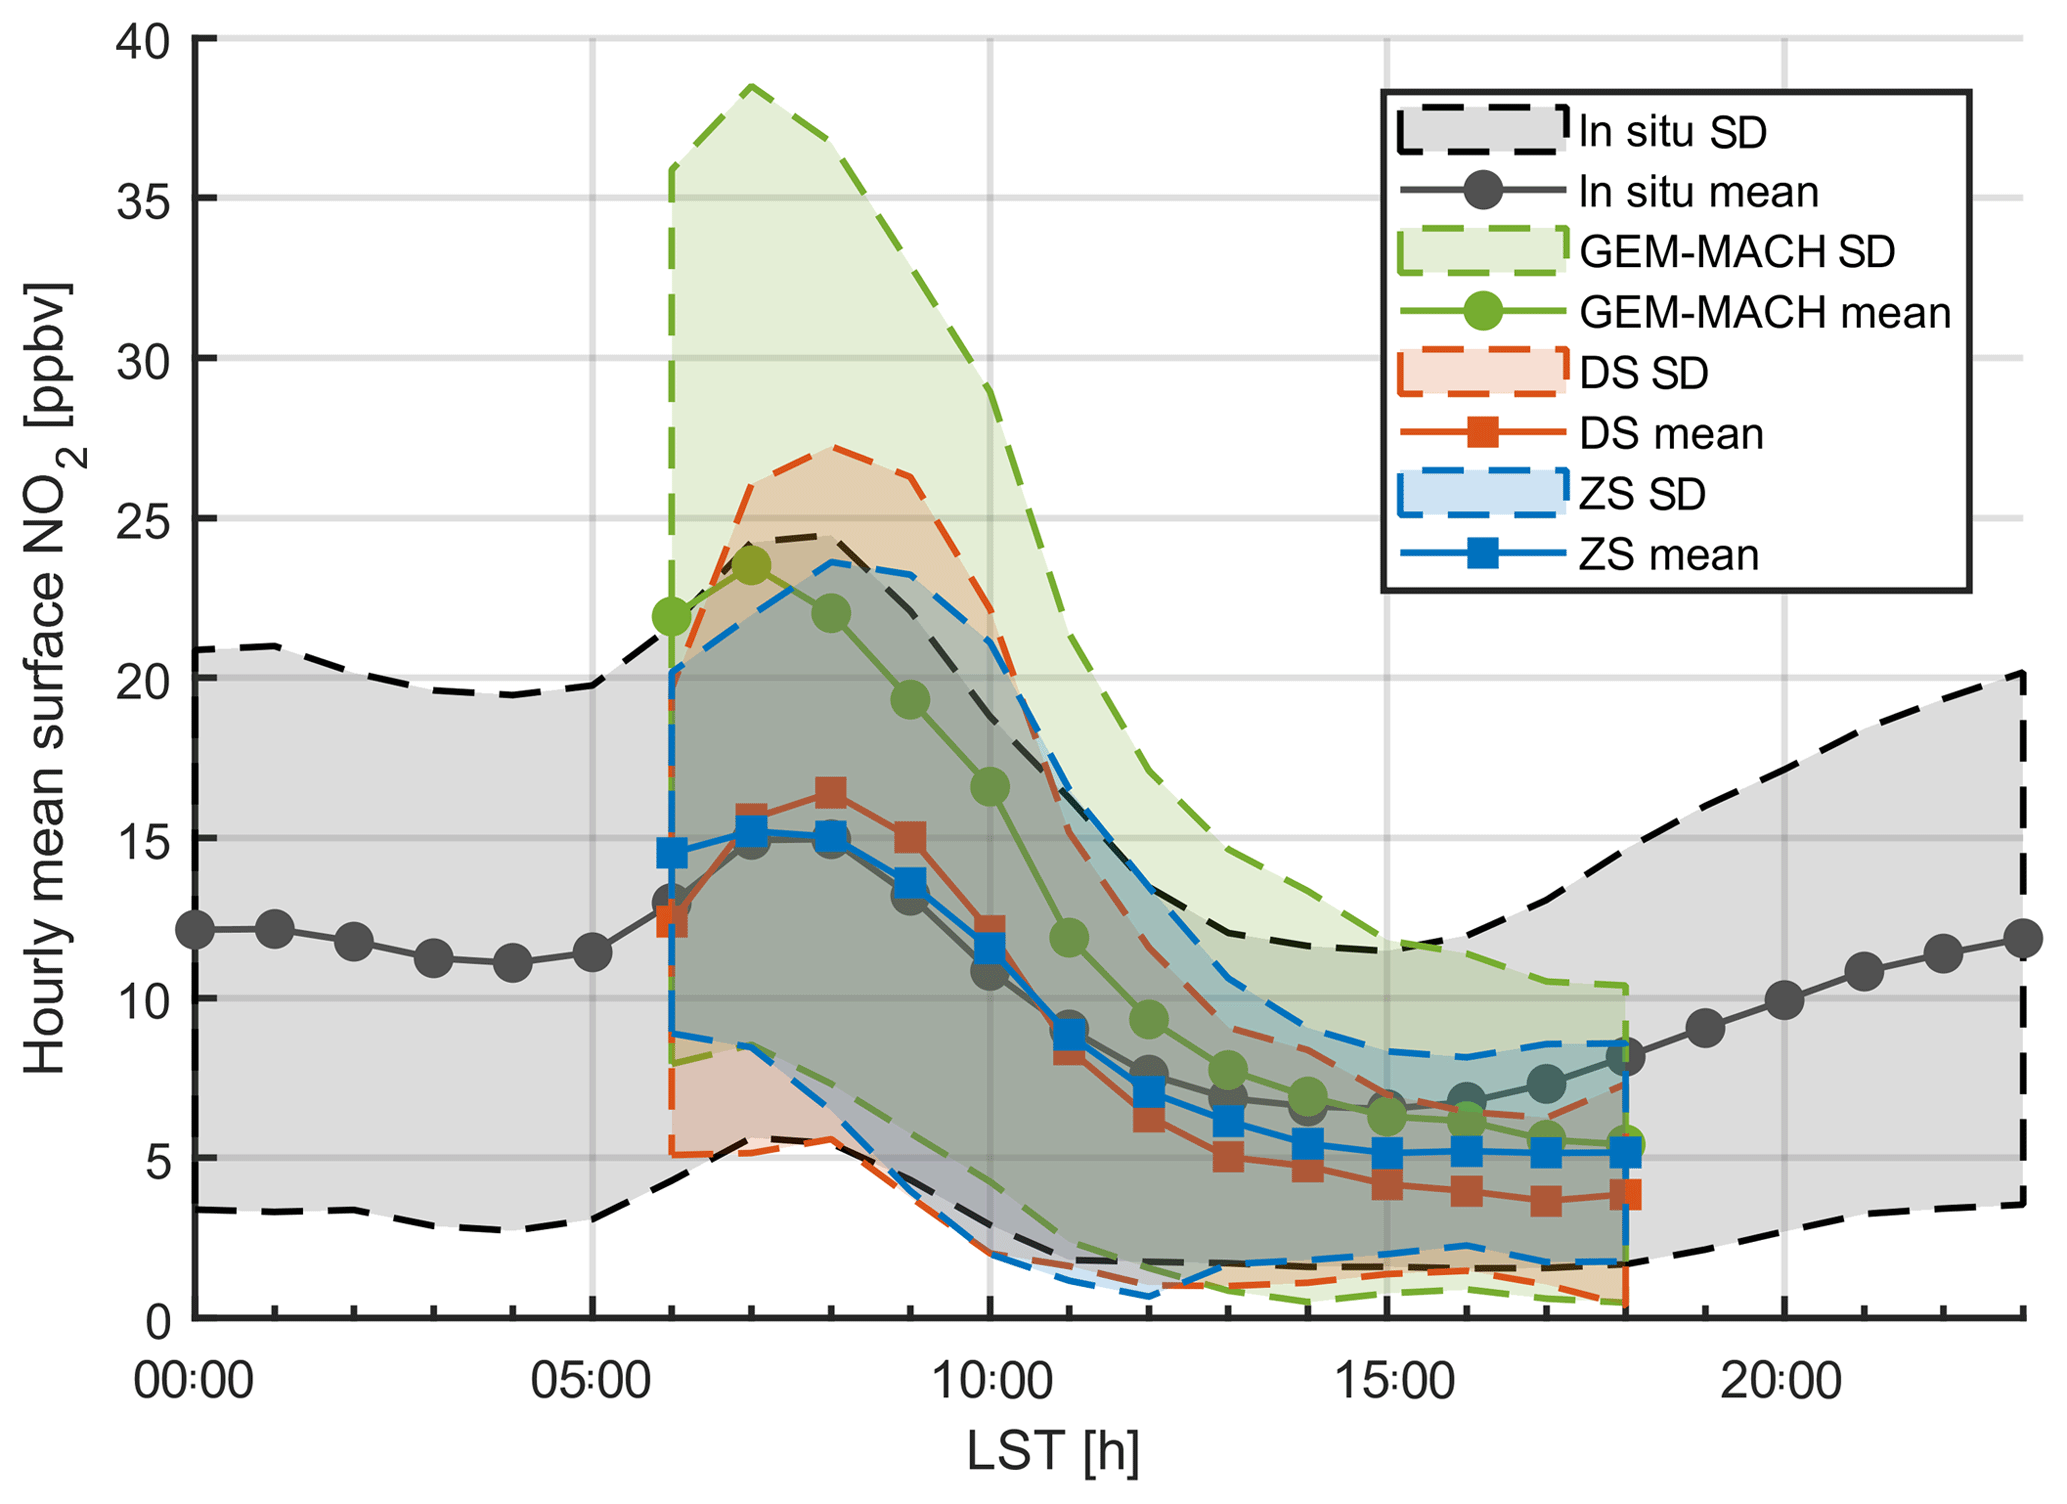
Figure 9Diurnal variation of surface NO2 concentration (2016–2017). The x axis is the local standard time (LST). Lines with dot/square symbols represent the hourly mean of corresponding data indicated by the legend. The shaded area represents the 1σ envelope.
Figure 9 shows that all four datasets/curves captured the enhanced morning surface NO2 and the decreasing trend afterwards. However, the model has a positive offset (6–9 ppbv) in the morning (due in part to the use of older emission inventories; Moran et al., 2018) and a negative offset (1–3 ppbv) in the evening relative to the in situ data. For example, at 07:00 LST, in situ NO2 is 14.9±9.3 ppbv, while GEM-MACH, Pandora DS, and Pandora ZS NO2 are 23.5±15.0, 15.6±10.5, and 15.2±6.8 ppbv, respectively. At 17:00 LST, in situ NO2 is 7.3±5.8 ppbv, while GEM-MACH, Pandora DS, and Pandora ZS NO2 are 5.6±5.0, 3.6±2.6, and 5.2±3.4 ppbv, respectively. The larger standard deviations in the morning are due to the datasets not being divided into workdays and weekends. Compared to the modelled data, the Pandora direct-Sun and zenith-sky data show improvements in the morning but almost no changes for the evening. This feature is investigated and found to be correlated with the GEM-MACH modelled PBL height (details in Sect. 5.2).

Figure 10Diurnal variation of surface NO2 concentration by season (2016–2017). The x axis is the local standard time (LST). Each panel represents data collected in one season (spring, summer, autumn, or winter). Solid lines represent mean of corresponding data indicated by the legend. The shaded area represents the 1σ envelope.
The diurnal variation is also examined by grouping the data by seasons. Figure 10 shows that the surface NO2 concentrations in winter (December, January, and February) are higher than the corresponding values in summer (June, July, and August). This difference is mainly due to short sunlit periods and less solar radiation (e.g., increased lifetime of NO2 and decreased PBL height) in winter. The model has better agreement with the in situ data in summer than in the colder seasons. The best performance of the model is found around local noon, and this feature is not dependent on seasons. Figure 10 also shows that the quality of Pandora zenith-sky and direct-Sun surface NO2 estimates is affected by the quality of GEM-MACH modelled data. For example, Fig. 10c shows that in autumn (September, October, and November), GEM-MACH has the largest offset in the morning. This error is thus propagated to the Pandora direct-Sun surface data, and leads to a larger offset in the morning (than any other season). On the other hand, when GEM-MACH shows a better agreement with in situ measurements (e.g., in spring and summer), Pandora zenith-sky and direct-Sun estimates also show better agreement with in situ observations. In general, both Pandora direct-Sun and zenith-sky surface NO2 data show good agreement with in situ measurements in all seasons; the hourly mean values of Pandora surface NO2 are all well within the 1σ envelope of the in situ measurements.
5.2 Planetary boundary layer effect
The larger morning offset in modelled surface NO2 may indicate that the GEM-MACH modelled PBL heights are biased in the morning when the boundary layer is shallow. Figure 11 (left column) shows the modelled PBL height plotted as a function of the difference between modelled and in situ surface NO2. Figure 11a shows that, in general, the difference between modelled and in situ NO2 decreases with an increase of PBL height. When the modelled PBL height is less than 100 m, the mean difference is 18±12 ppbv (1σ), while when the modelled PBL height is 1 km, the mean difference is only 2.9±6.4 ppbv.
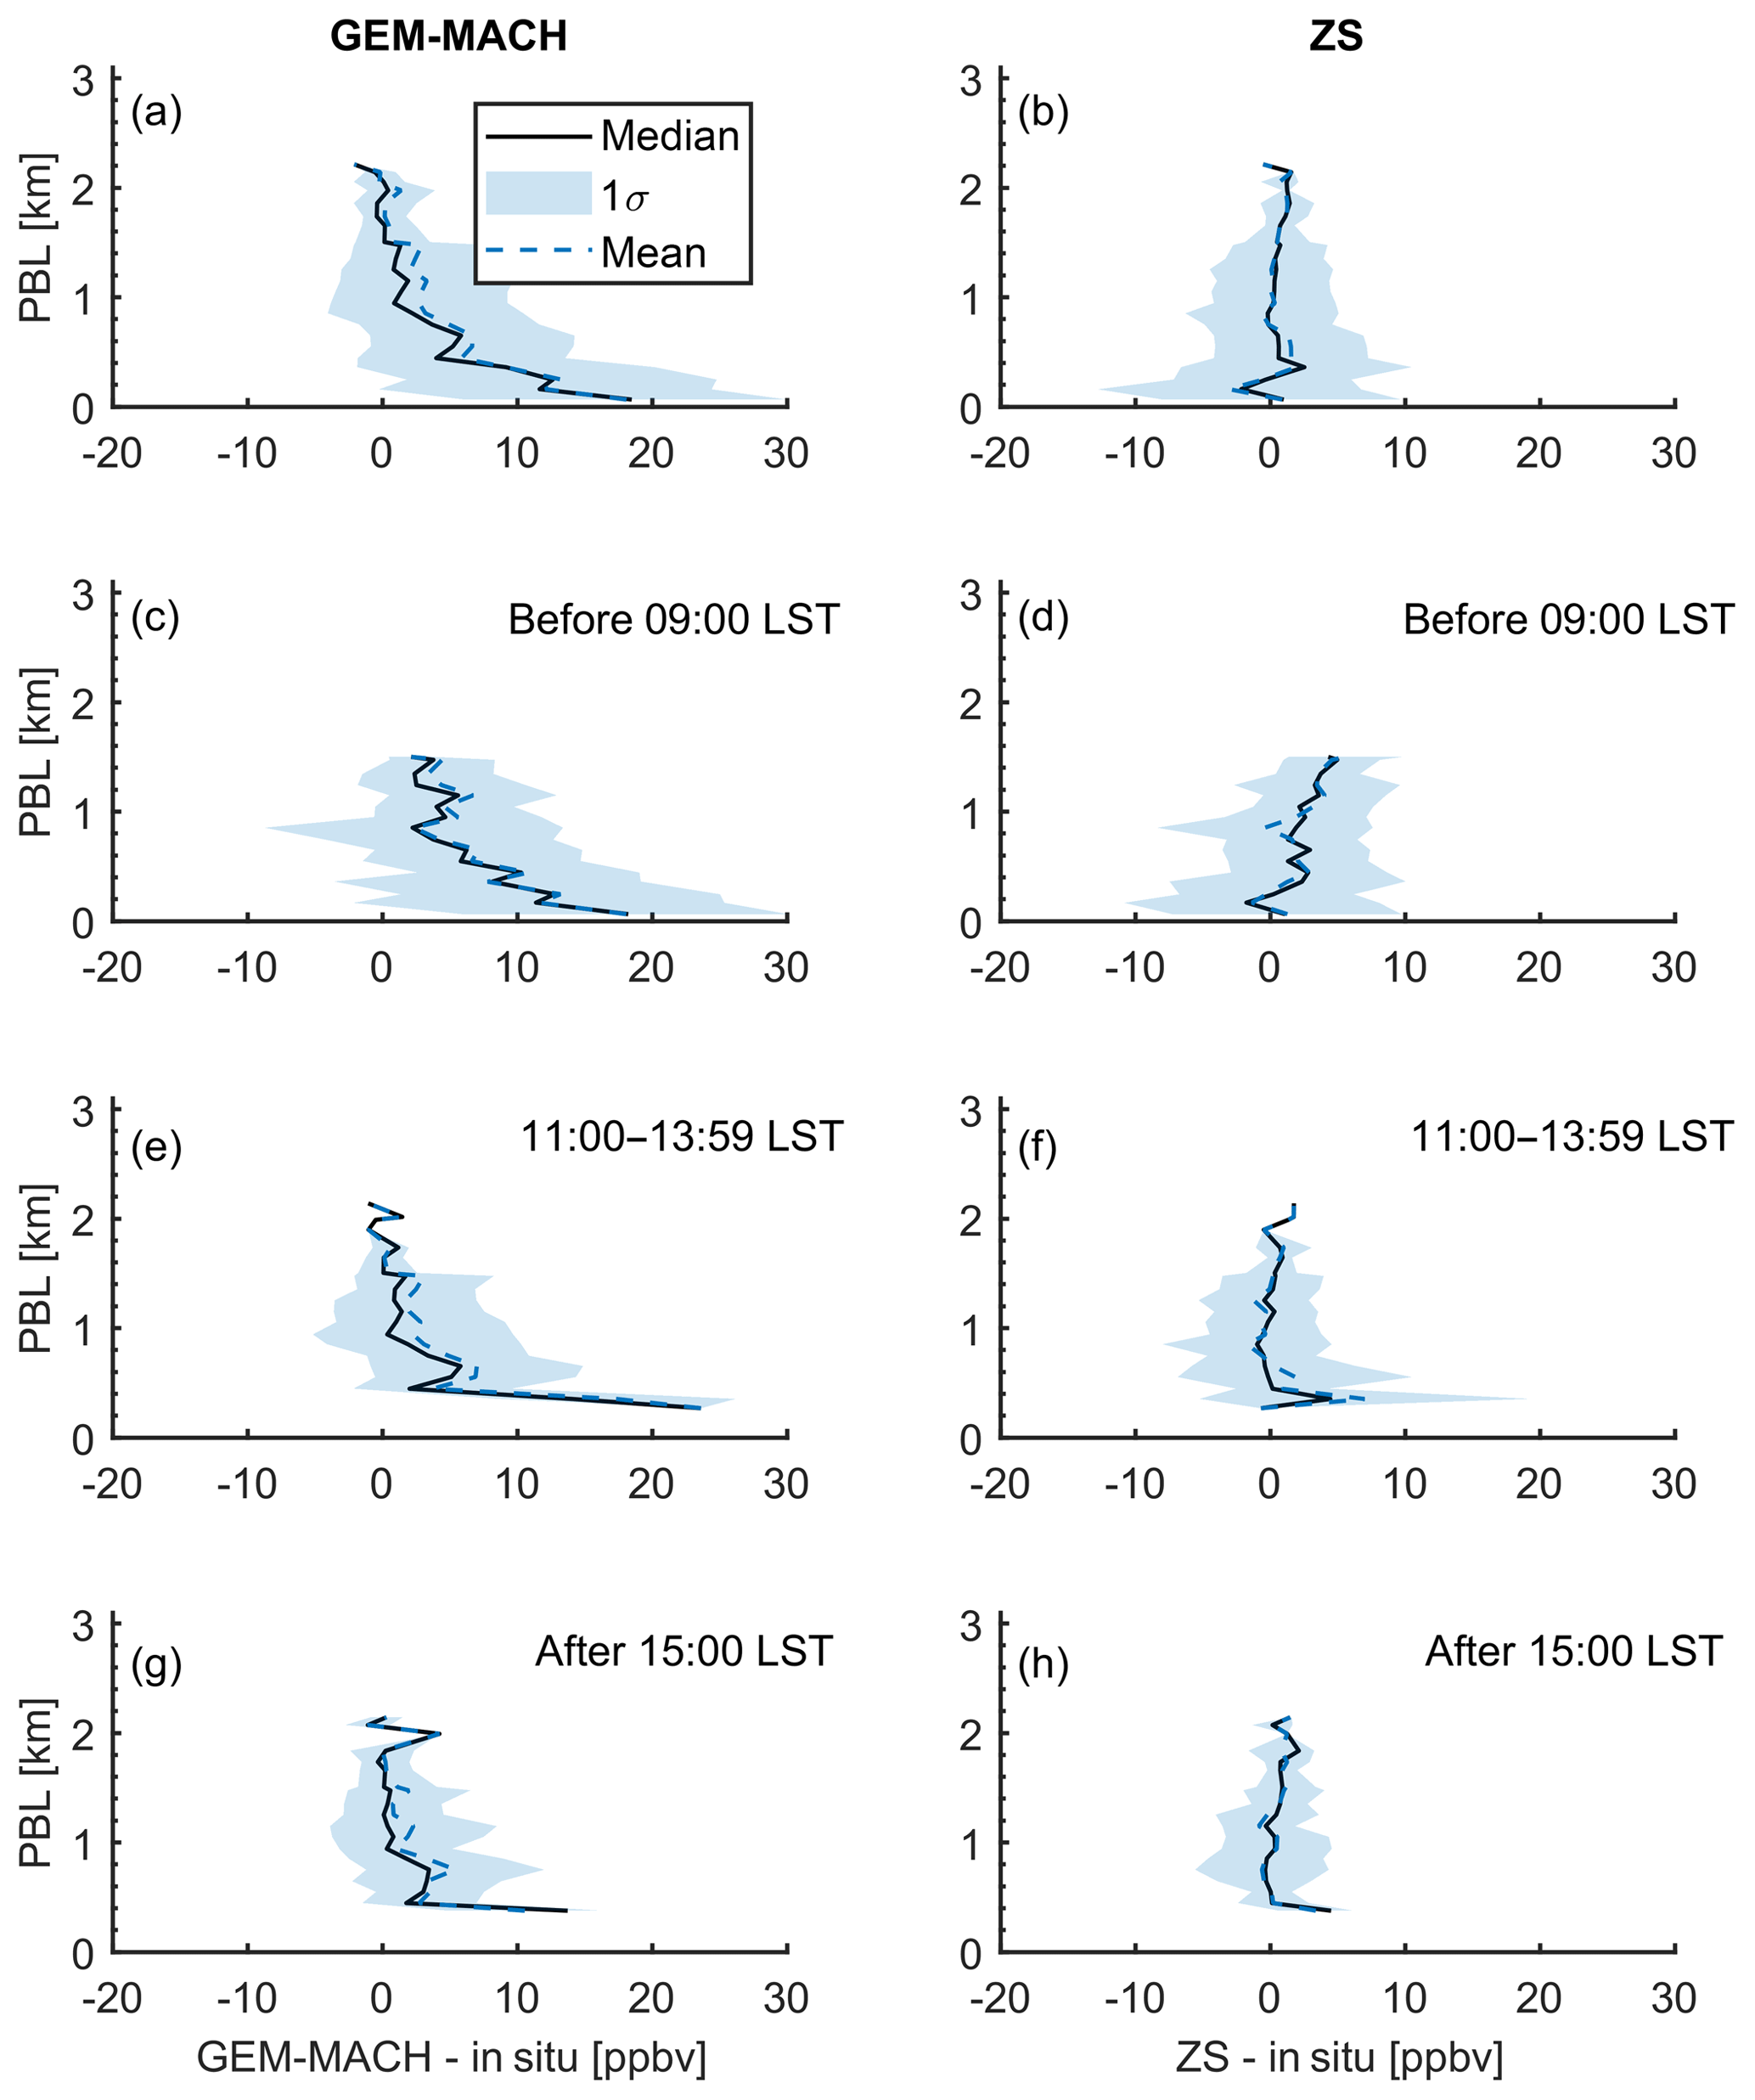
Figure 11Illustration of planetary boundary layer (PBL) effect (2016–2017). The y axis is planetary boundary layer height in kilometers. The x axes for the left column are the difference between GEM-MACH and in situ surface NO2 concentrations; the x axes for the right column are the difference between Pandora zenith-sky (Cpan-model) and in situ surface NO2 concentration. Panels (a) and (b) show all available data, panels (c) and (d) show the morning data (before 09:00 LST), panels (e) and (f) show the noon data (from 11:00 to 13:59 LST), and panels (g) and (h) show the evening data (after 15:00 LST).
Even though the modelled surface concentrations are significantly impacted by the PBL, the modelled conversion ratio (from column to surface concentrations) seems unaffected since the surface NO2 concentrations derived from Pandora zenith-sky data (Cpan-model) show much less dependence on the PBL height (Fig. 11b). When the modelled PBL height is less than 100 m, the mean difference is 0.9±8.9 ppbv. When the modelled PBL height is 1 km, the mean difference is slightly improved to 0.1±4.4 ppbv. Figure 11c and h show similar plots to Fig. 11a and b, but the dataset has been divided into three time bins (before 09:00, 11:00 to 13:59, and after 15:00 LST). Figure 11c, e, and f confirm that whenever the modelled PBL height is low, the relative difference between the model and in situ data is high. However, in general, most of these shallow PBL height conditions occur in the morning, and thus the modelled surface NO2 has larger bias compared to in situ data in the morning. Figure 11d, f, and h show that Pandora zenith-sky surface NO2 data have similar performance for all these three time bins, which indicates that the data have less PBL height dependency than the modelled data. In other words, the model is able to capture the ratio between the boundary layer partial column and surface NO2, although the PBL height may not be correct in the model. When this ratio is applied to both Pandora direct-Sun and zenith-sky data, the estimated surface concentrations agree better with the in situ measurements.
The Pandora spectrometer was originally designed to retrieve total columns of trace gases such as ozone and NO2 from direct-Sun spectral measurements in the UV–visible spectrum. In this work, a new zenith-sky total column NO2 retrieval algorithm has been developed. The algorithm is based on empirical AMFs derived from nearly simultaneous direct-Sun and zenith-sky measurements. It is demonstrated that this algorithm can retrieve total columns in thin and moderate cloud conditions when direct-Sun measurements are not available: only 10 % of the measurements affected by heavy cloud have to be filtered out due to large systematic biases (68 %). The new Pandora zenith-sky total column NO2 data shows only −4 % bias compared to the standard Pandora direct-Sun data product. In addition, OMI NO2 SPv3.0 data demonstrate similar biases (−30 % and −29 %, respectively) when compared to direct-Sun and zenith-sky Pandora total column NO2 data.
Surface NO2 concentrations were calculated from Pandora direct-Sun and zenith-sky total column NO2 using column-to-surface ratios derived from GEM-MACH regional chemical transport model. The bias between Pandora-based direct-Sun and zenith-sky NO2 surface concentration estimates and in situ measurements is only −8 % and −7 % (with correlation coefficients 0.80 and 0.77), respectively, while the bias between the modelled concentrations and in situ measurements is up to 37 %. The Pandora-based surface NO2 concentrations also show good diurnal and seasonal variation when compared to the in situ data. High surface NO2 concentrations in the morning (from 06:00 to 09:00 LST) are present in all measured and modelled datasets, while, on average, the model overestimates surface NO2 in the morning by 8.6 ppbv (at 07:00 LST). It appears that the bias in modelled surface NO2 is related at least in part to an incorrectly diagnosed PBL height. In contrast, the difference between Pandora-based and in situ NO2 does not show any significant dependence on the PBL height. Thus, to enable a fast and practical Pandora surface NO2 data production, the use of a pre-calculated conversion ratio PSC-LUT is recommended.
The new retrieval algorithm for Pandora zenith-sky NO2 measurements can provide high-quality NO2 data (both total column and surface concentration) not only in clear-sky conditions but also in thin and moderate cloud conditions, when direct-Sun observations are not available. Long-term Pandora zenith-sky NO2 data could be used in future satellite validation for the medium cloudy scenes. Moreover, a column-to-surface conversion look-up table was produced for the Pandora instruments deployed in Toronto; therefore, quick and practical Pandora-based surface NO2 concentration data can be obtained for air quality monitoring purposes. The variation of conversion ratios in the PSC-LUT demonstrates that the surface NO2 concentration is controlled not only by the PBL height but also by both boundary layer dynamics and photochemistry. This conversion approach can also be used to derive surface concentrations from satellite VCD measurements and thus can be particularly useful for the new generation of geostationary satellite instruments for air quality monitoring such as the Tropospheric Emissions: Monitoring of Pollution (TEMPO; Zoogman et al., 2014). Currently, the standard Pandora observation schedule includes direct-Sun, zenith-sky, and multi-axis scanning measurements (i.e., measuring at multiple viewing angles). At present, multi-axis measurement algorithms are still under development, but in the future, by using the multi-axis measurements and optimal estimation techniques (e.g., Rodgers, 2000) or the five-angle O2O2 ratio algorithm (Cede, 2019), it may be possible for Pandora measurements to be used to derive NO2 tropospheric profiles and columns.
Pandora data are available from the Pandonia network (http://pandonia.net/media/documents/BlickSoftwareSuite_Manual_v11.pdf, Cede, 2019). In situ surface NO2 data are available from the National Air Pollution Surveillance (NAPS) program (http://maps-cartes.ec.gc.ca/rnspa-naps/data.aspx, last access: 15 August 2019). OMI NO2 SPv3.0 data are available from https://doi.org/10.5067/Aura/OMI/DATA2017 (Krotkov et al., 2019). Any additional data may be obtained from Xiaoyi Zhao (xiaoyi.zhao@canada.ca).
Before calculating the empirical zenith-sky AMF, the VCDDS and dSCDZS have both been strictly filtered to ensure any measurements used in this calculation have the highest quality. For VCDDS, data are filtered following Cede (2019) with several factors being considered, such as wavelength shift and residual in spectra fitting, direct-Sun AMF, and estimated uncertainties for the vertical column. For dSCDZS, data are filtered using similar criteria as for VCDDS, with adjustments for zenith-sky observations.
The VCDDS and dSCDZS data are merged and divided into several SZA bins. Each bin covers 5∘. A multi-non-linear regression is performed by using the following equation:
where VCDn is not a single direct-Sun VCD data point but is an m×1 matrix (m is the total number of measurements in SZA bin number n); the VCDn represents all direct-Sun VCDs in a 5∘ SZA bin, and each element of the m×1 matrix is a single VCD in that SZA bin. Similarly, dSCDn is also an m×1 matrix, with each element representing a single coincident zenith-sky dSCD in SZA bin number n. In is an m×1 indicator function, where the elements of In are set to 1. The RCD and b1 to bn are the parameters to be retrieved. In short, the design of this regression is based on Eq. (2) (Sect. 3.1). The idea is to retrieve zenith-sky AMFs in several SZA bins, and, at the same time, all these regressions in different SZA bins are constrained to share a common predictor (RCD). The regression model can be solved by using an iterative procedure (Seber and Wild, 2003) to yield the estimated coefficients, b1 to bn and RCD. The bn is the reciprocal of zenith-sky AMF in SZA bin n.
This regression model has been evaluated by using different sizes for the SZA bins. A 5∘ SZA bin is selected because the SZA bin must be small enough to capture the SZA dependency on zenith-sky AMFs, and, at the same time, it must also be large enough to ensure a sufficient number of measurements in each SZA bin (to perform reliable regressions). In order to deal with the diurnal variation of NO2 concentration and changing of profile shape (e.g., due to changing of boundary layer heights), the dataset has been divided into morning and evening sets, and discrete AMFs are retrieved for morning and evening hours separately (see the blue and red squares with error bars in Fig. 1).
Next, these discrete AMF values are used to fit an empirical zenith-sky NO2 AMF function, which has the expression
The fitted empirical zenith-sky AMFs are shown in Fig. 1 as blue and red lines (data regression period from February 2015 to September 2017). Several sensitivity tests have been performed to assess the quality of the empirical zenith-sky AMFs, including fitting the AMFs with/without a diurnal difference, fitting the AMFs with different empirical functions (e.g., exponential and simple geometry approximation), and fitting the AMFs by seasons. All these different choices of empirical AMFs fitting functions or methods only introduce less than 5 % difference in the retrieved empirical AMFs. Thus, to make the empirical AMFs simple and robust, we selected to fit with a diurnal difference (Eq. 5). In addition, the current empirical AMFs are limited to high- and intermediate-Sun conditions (i.e., SZA < 75∘). For low-Sun conditions, the total AMF for zenith-sky measurements is expected to be a strong function of not only the SZA but also the tropospheric column itself. Thus, for future work to derive low-Sun empirical zenith-sky AMFs, the stronger influence of PBL NO2 has to be accounted (i.e., the geometry-form AMFs are not enough).
Several stratospheric NO2 column values were tested and used in the surface NO2 concentration algorithm (Eq. 3). Figure B1a shows the OMI monthly mean (referred to as OMI) and Pratmo box-model stratospheric column NO2 (Adams et al., 2016; McLinden et al., 2000) (referred to as box). Since the satellite only samples Toronto once per day, the OMI stratospheric NO2 lacks diurnal variation. To account for the diurnal variation, diurnal ratios of NO2 VCD have been calculated and applied to OMI monthly mean data. The stratospheric NO2 columns are calculated using
where VOMI(t0) is the OMI-measured stratospheric column, t0 is OMI overpass time, Vbox(t0) is the modelled stratospheric column at OMI overpass time, Vbox(t) is the modelled stratospheric column at time t, and VOMI(t) is the interpolated stratospheric column at time t. The interpolated OMI stratospheric columns are referred to as OMI box. The grey dots in Fig. B1b are OMI-box stratospheric NO2 columns. The monthly mean of the box model (blue line) and OMI box (black line) show that the amplitude of OMI box is larger than the amplitude of the box model.
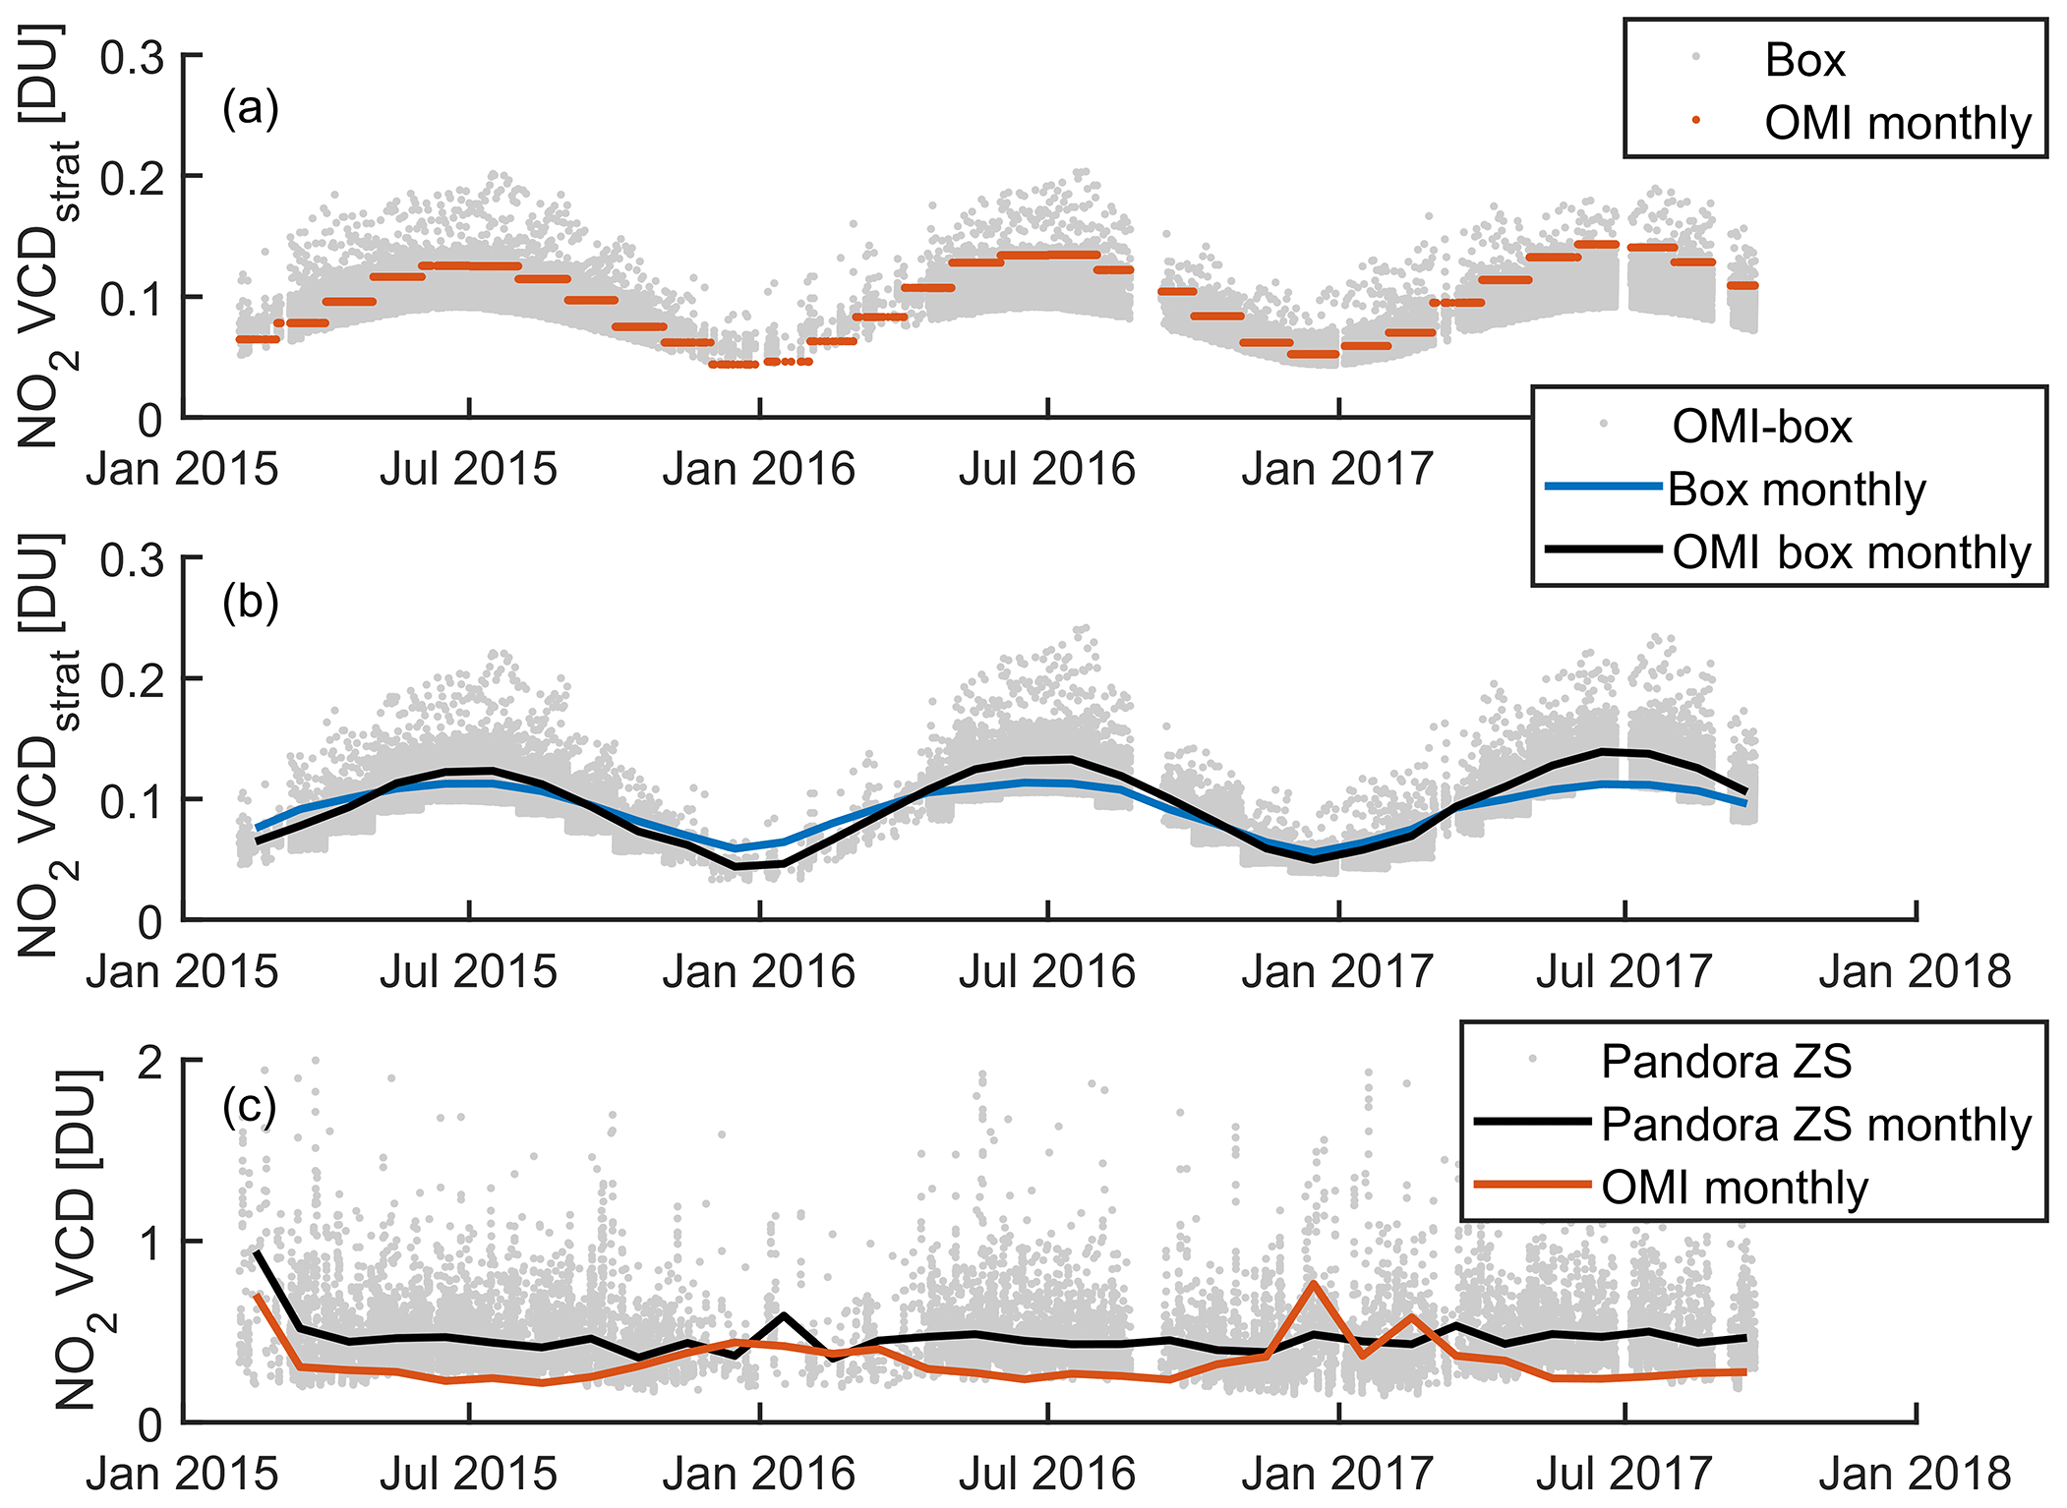
Figure B1Time series of measured and modelled NO2 columns: (a) stratospheric columns from the box model (hourly) and OMI (monthly), (b) stratospheric columns from OMI box (hourly), box (monthly) and OMI box (monthly), and (c) total columns from Pandora zenith sky and OMI.
To justify why this diurnal variation has to be included, Fig. B1c shows the total column NO2 time series. The diurnal stratospheric NO2 variation is about 0.1 DU in the summer (see grey dots in Fig. A1b) when Pandora measured monthly mean total column is about 0.5 DU (Fig. B1c). Thus, neglecting this diurnal variation will lead to diurnal biases in the derived surface NO2 data (e.g., in the morning, this will lead to the overestimation of the stratospheric NO2 and thus the underestimation of surface NO2). Please note that the strength of this bias is related to (1) the NO2 profile (weights between stratospheric and tropospheric NO2), and (2) the observation geometry (direct Sun or zenith sky). In general, an urban site with direct-Sun observation should have smaller impact from the stratospheric diurnal variation. On the other hand, a rural site with zenith-sky observation should have a significant impact.
Direct-Sun measurements need an unobscured Sun. Even thin clouds could decrease the quality of retrieved NO2 total columns, especially for low-altitude clouds. Unlike direct-Sun measurements, zenith-sky observations are made with scattered sunlight and have limited sensitivity to cloud cover. For example, Hendrick et al. (2011) calculated that, for NDACC UV–visible zenith-sky ozone measurements, clouds only contribute 3.3 % to the total random error. This is because a trace gas that is mostly distributed in the stratosphere has the mean scattering layer located at a higher altitude than the cloud layer. However, this assumption may not be valid for NO2. Depending on the properties of the clouds and the NO2 profile, the clouds could have non-negligible impacts on zenith-sky NO2 observations.
A typical method of removing zenith-sky measurements affected by heavy clouds is to eliminate measurements with large enhancements of O4 and/or H2O (Van Roozendael and Hendrick, 2012). In the Pandora zenith-sky NO2 retrieval, we use the O4 dSCDs. Since the measured O4 dSCDs has SZA dependency, all measured O4 dSCDs are plotted against SZA, and a second-order quantile regression (Koenker and Hallock, 2001) is applied to select the top few percentiles of the measured O4 dSCDs.
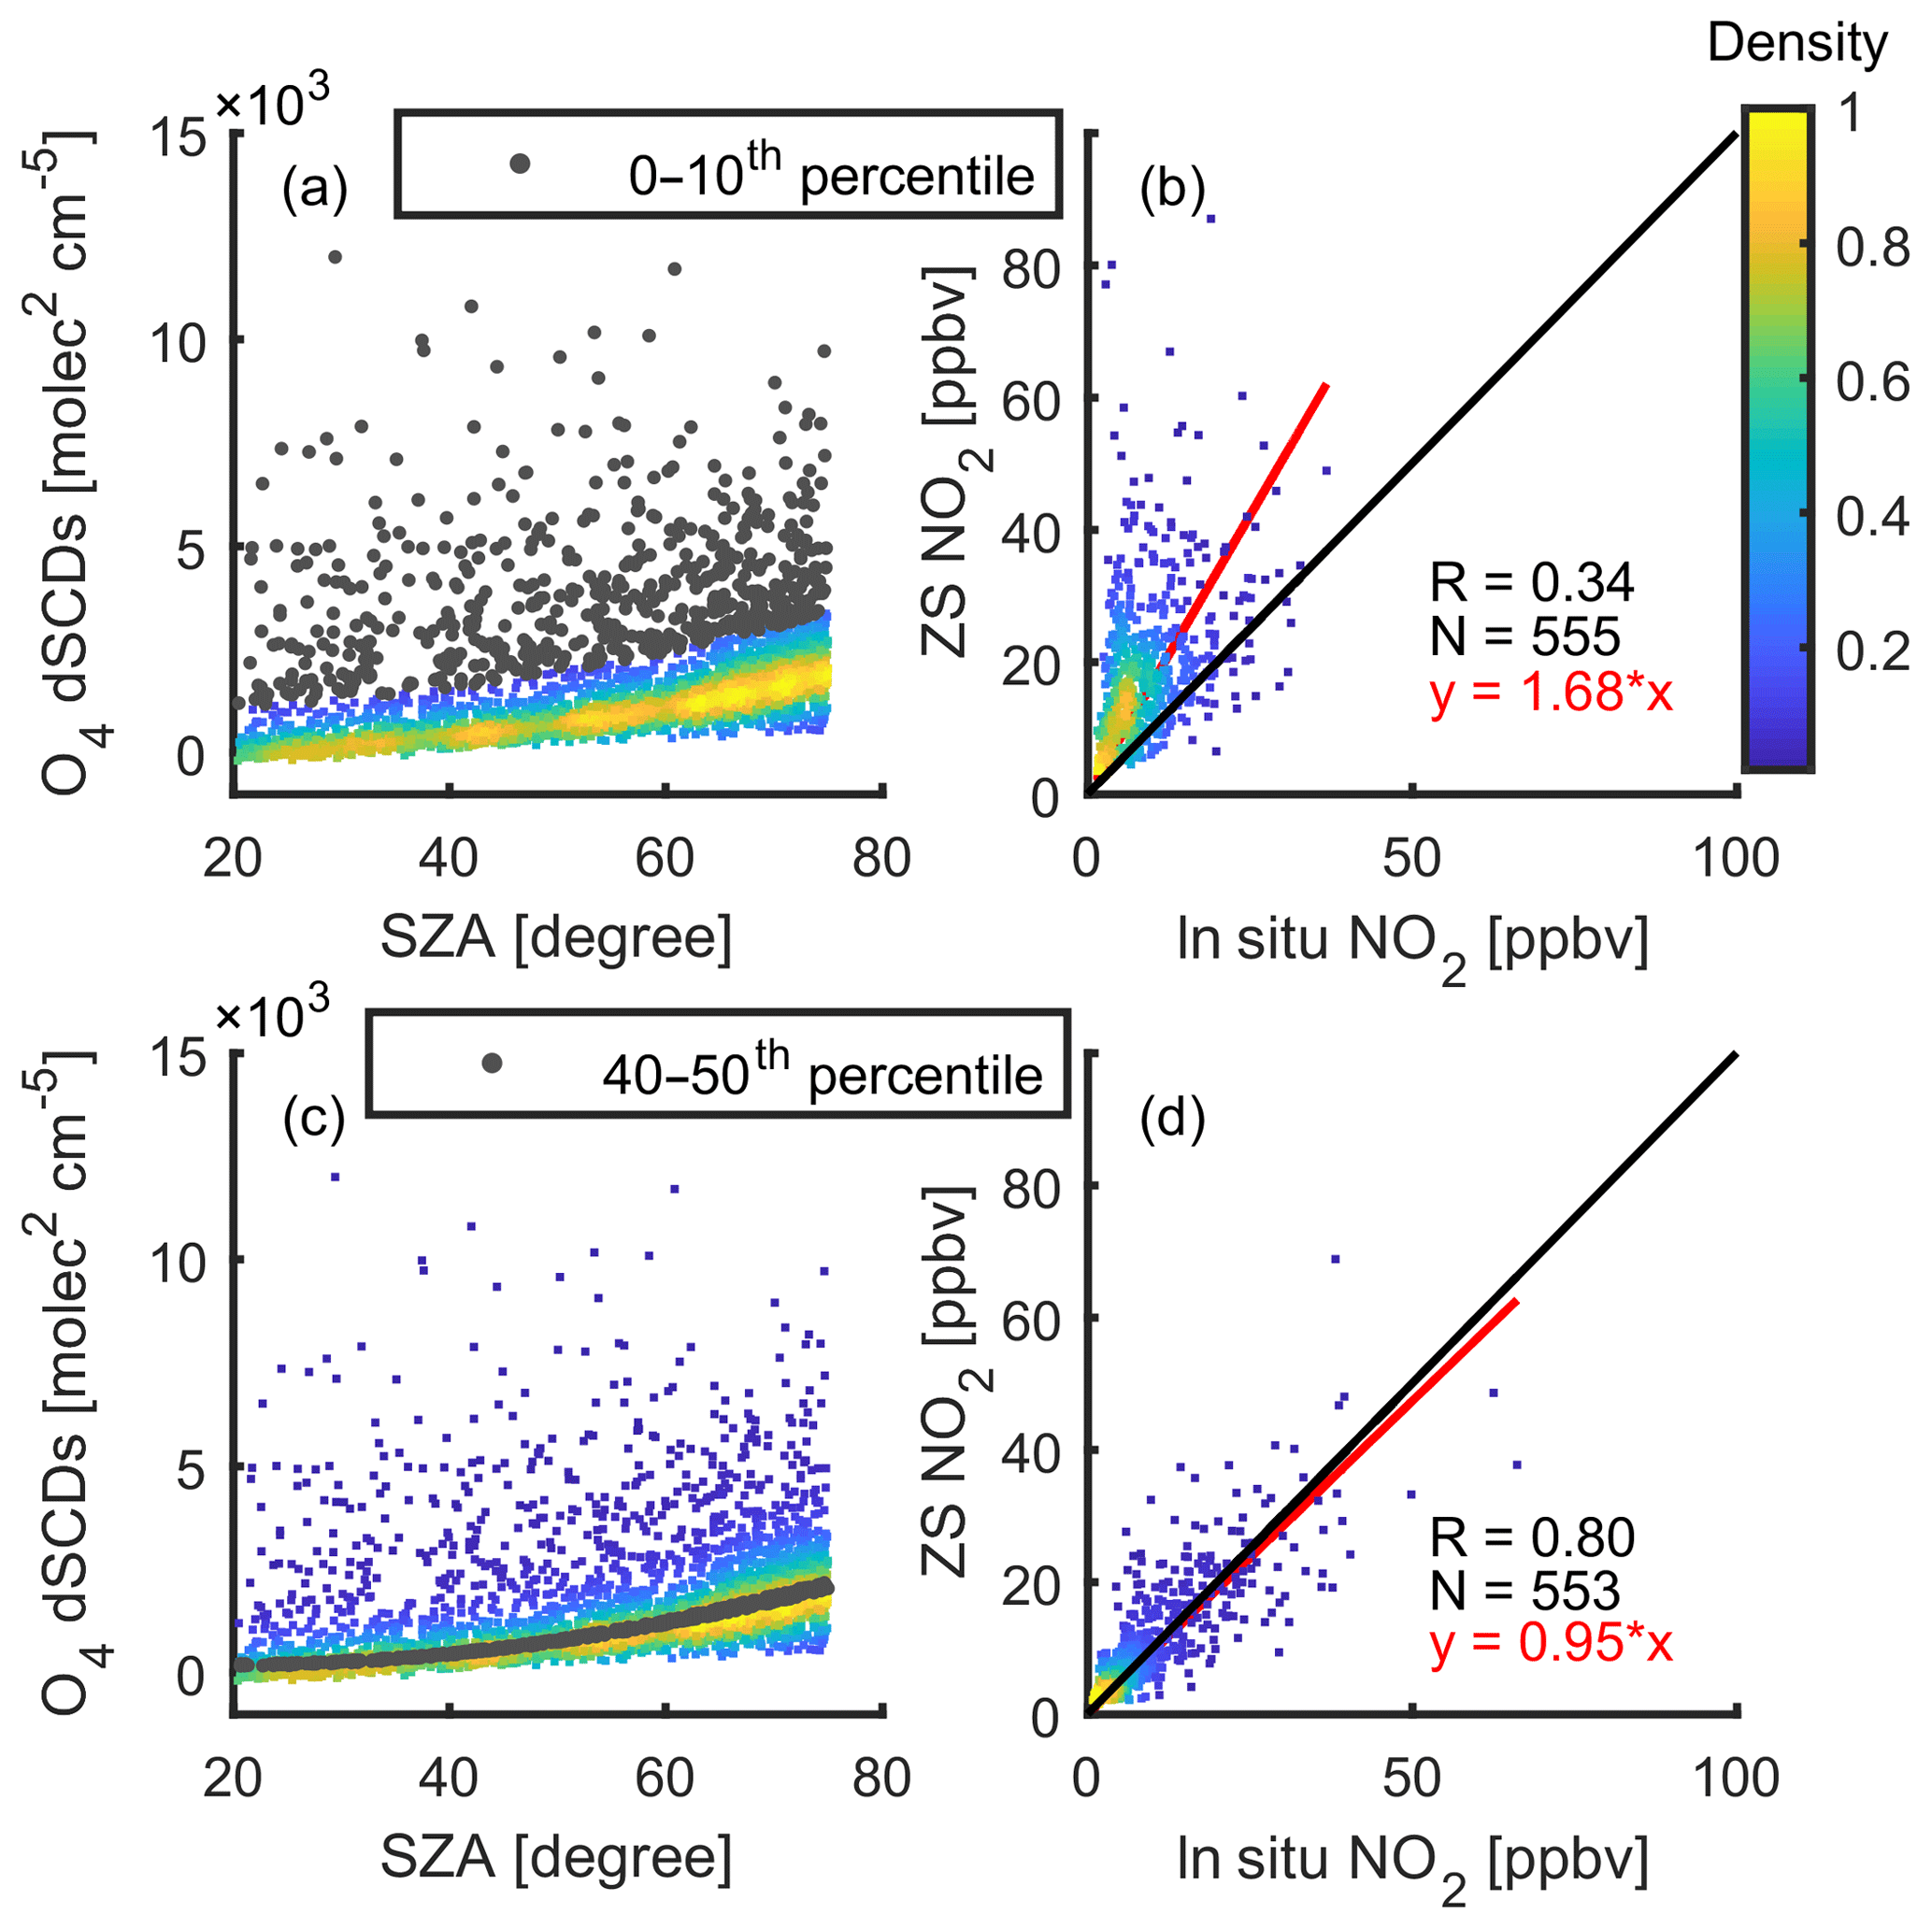
Figure C1Illustration of cloud effect and heavy cloud data filtration: panel (a) shows measured O4 differential slant column densities vs. solar zenith angle; the grey dots represent the top 0–10th percentile range of O4. Panel (b) shows the scatter plot of zenith-sky vs. in situ surface NO2 data that has O4 values within the 0–10th percentile range (as identified in panel a); panel (c) is similar to (a) but the grey dots represent the 40th–50th percentile range of O4; panel (d) is similar to (b) but uses the data that has O4 value within the 40th–50th percentile range. On the scatter plots in panels (b) and (d), the red line is the linear fit with intercept set to 0 and the black line is the one-to-one line. All plots are colour-coded by the normalized density of the points.
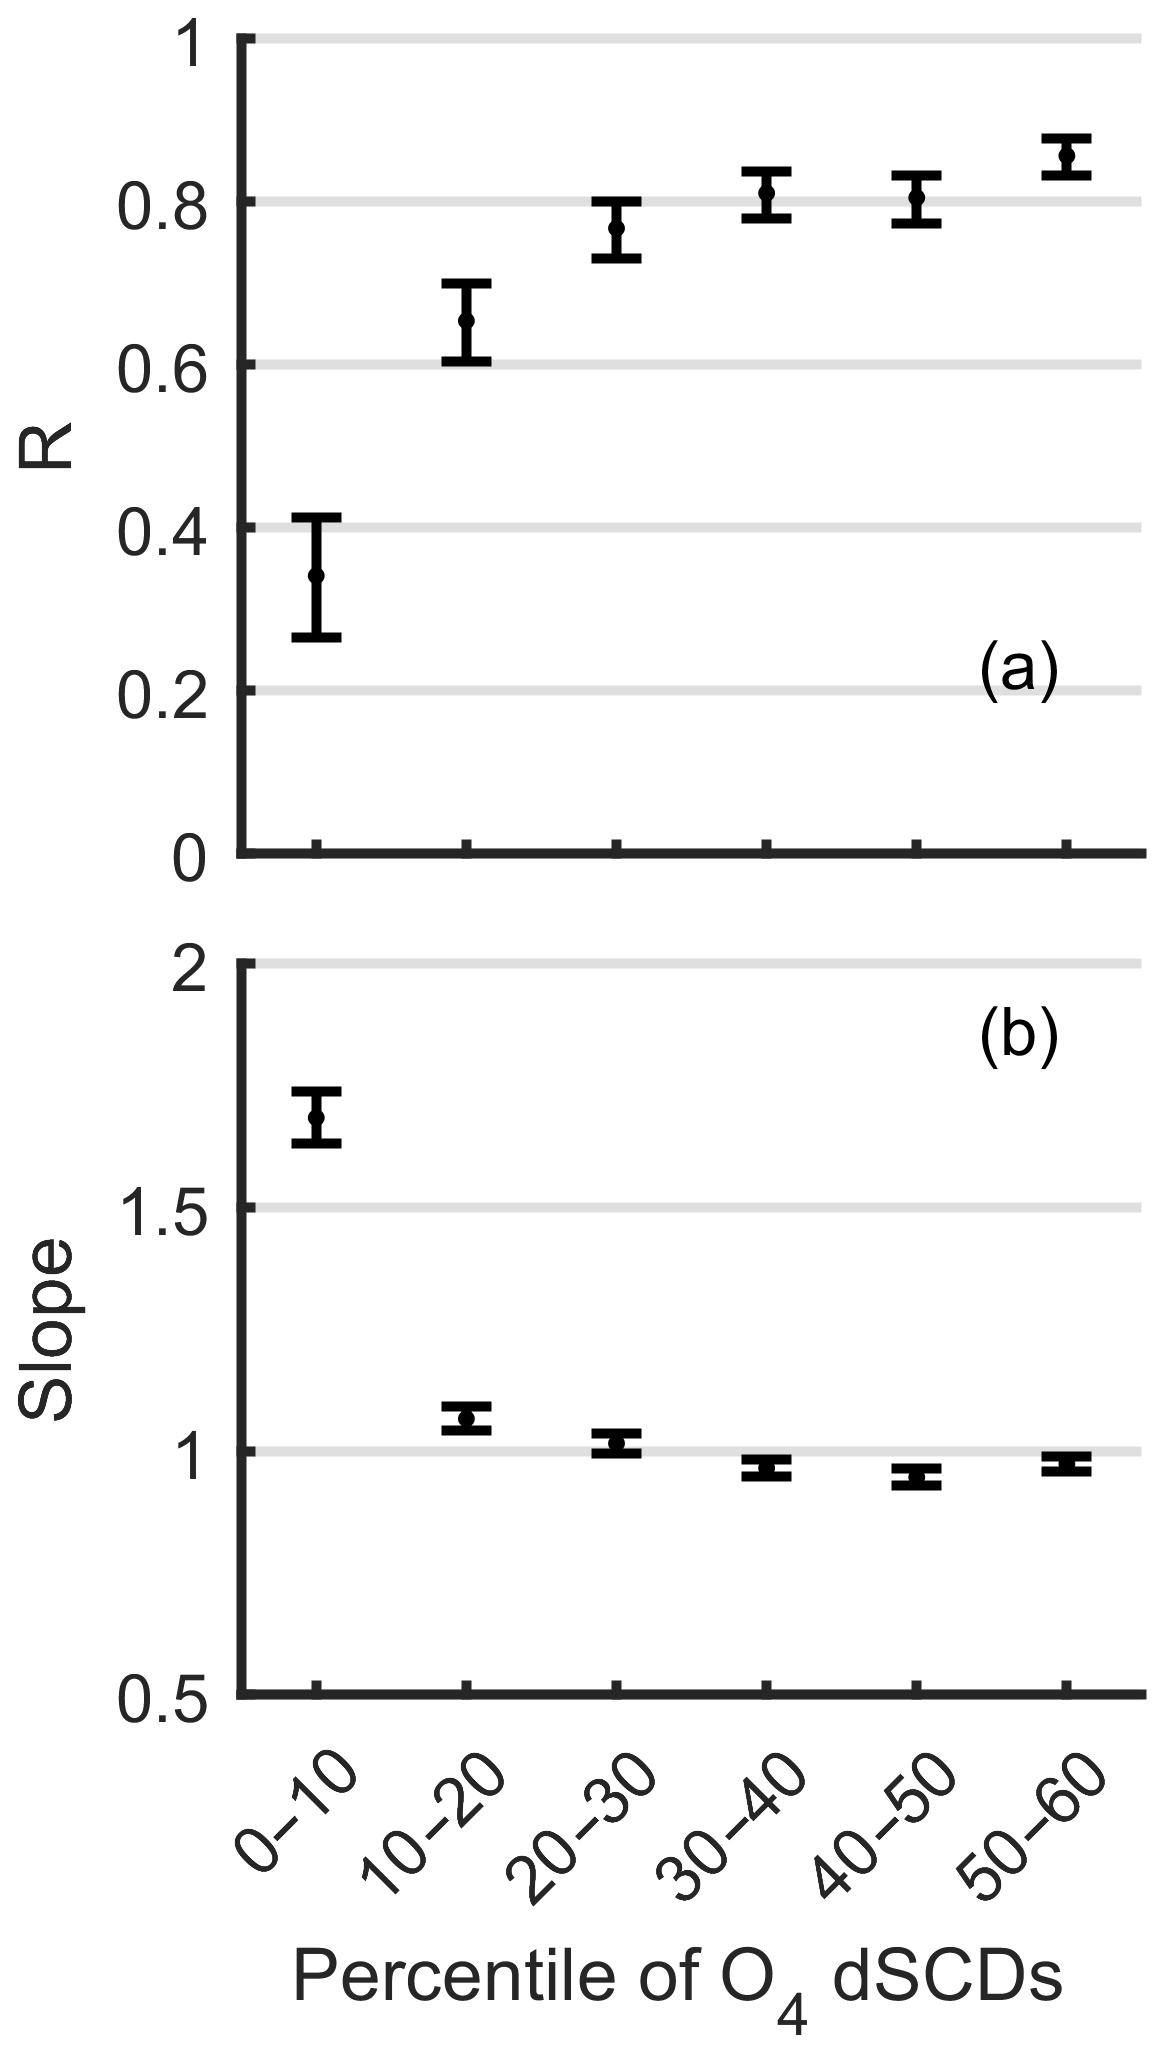
Figure C2Correlation coefficient and bias (slope) between zenith-sky and in situ surface NO2 data in different O4 dSCD percentile bins. Panel (a) shows the correlation coefficients; panel (b) shows the slopes of linear fit with intercept set to 0.
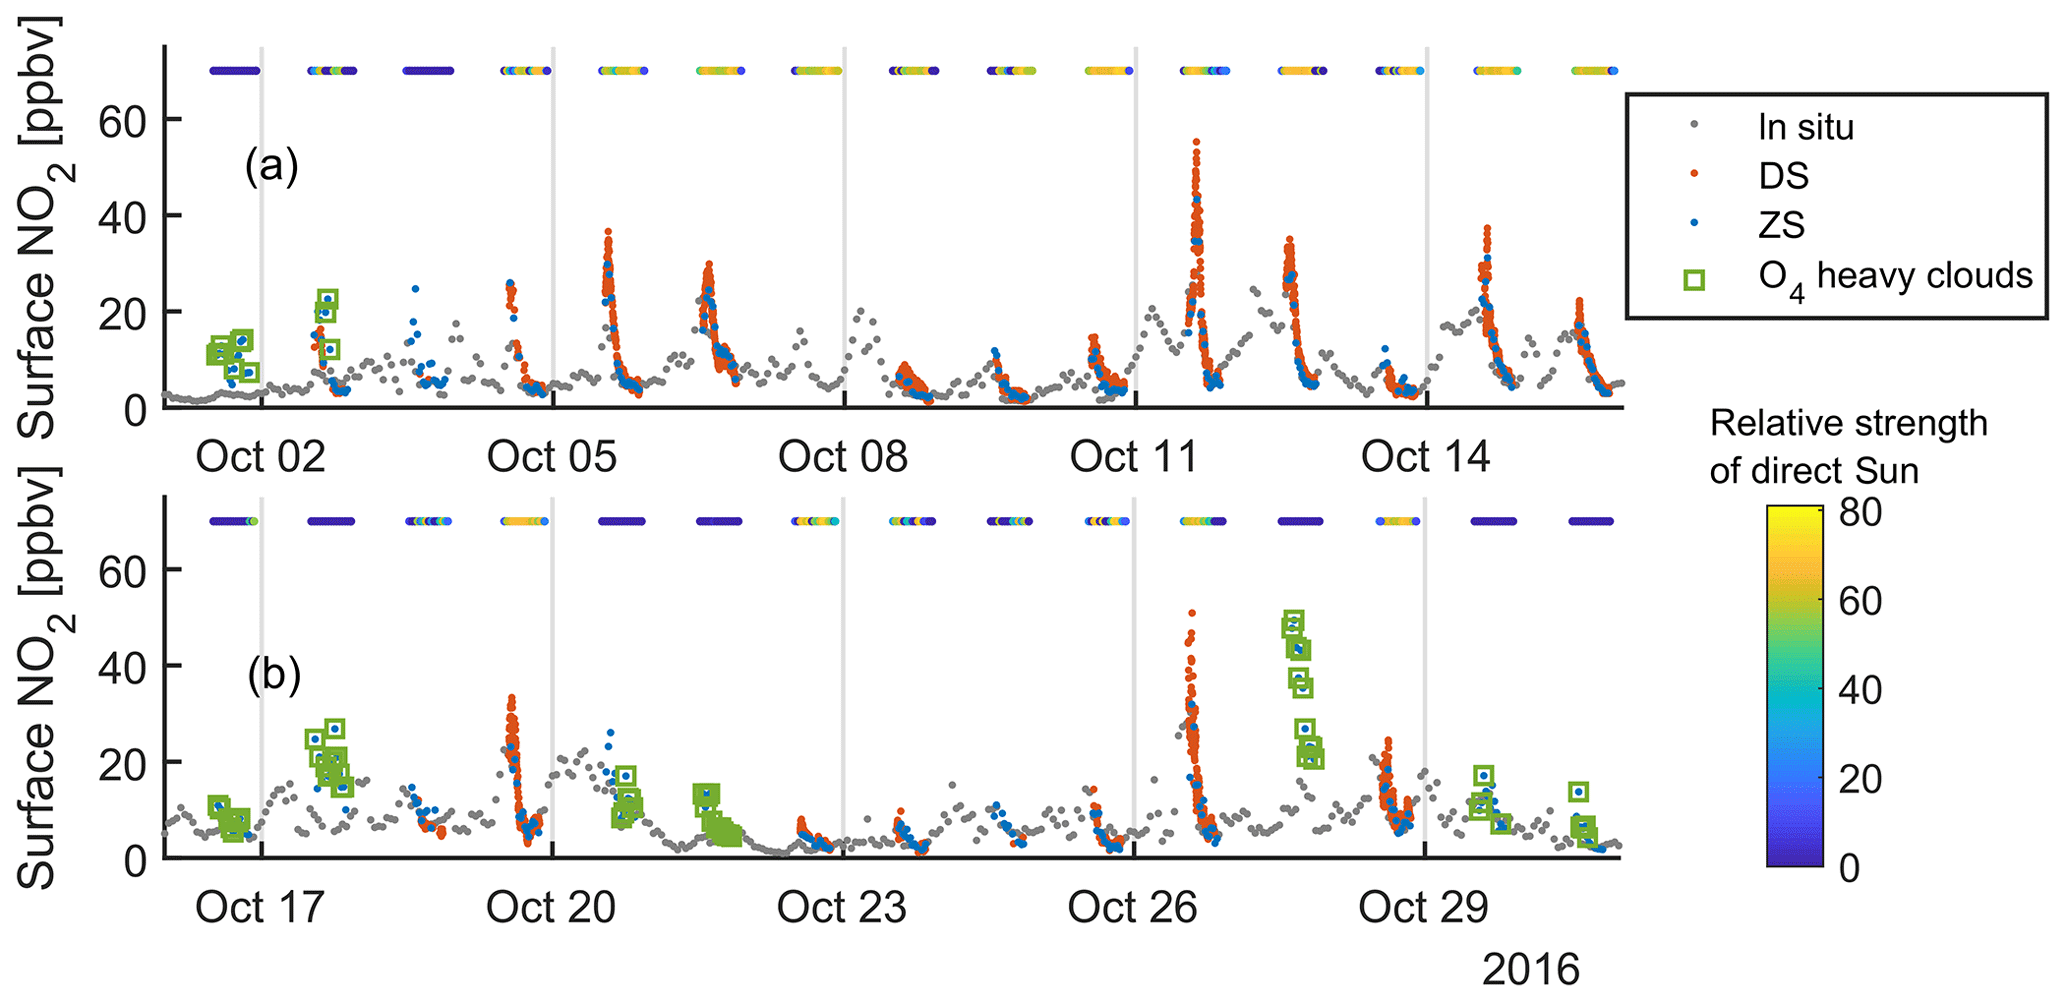
Figure C3Example of surface NO2 concentration time series in all conditions. The in situ, Pandora DS, and Pandora ZS surface NO2 concentrations are shown by different coloured dots. The TSI relative strength of direct-Sun data is plotted as a colour-coded horizontal dotted line in the top area of each panel. For Pandora zenith-sky data, the measurements with enhanced O4 (heavy cloud indicator) are also labelled by green squares. Dates are in mm/dd format.
Figure C1 shows examples of selected Pandora zenith-sky NO2 data and their corresponding O4 dSCD values. For example, Fig. C1a shows the O4 dSCDs vs. SZA, and the top 10 percentiles of the data with enhanced O4 are marked in grey. The corresponding Pandora zenith-sky data are plotted against in situ data in Fig. C1b, which shows low correlation (R=0.34) and high bias (68 %). This result indicates that the enhanced scattering due to heavy clouds caused a positive bias in the Pandora zenith-sky NO2 retrieval. Figures C1c and d are similar to Fig. C1a and b but for selected Pandora zenith-sky NO2 data that have O4 values within the 40th to 50th percentile range. Figure C1d shows that when O4 is not enhanced, the derived zenith-sky NO2 has good agreement with in situ data (R=0.8 and bias %). To summarize how the retrieved O4 dSCDs can indicate the quality of the Pandora zenith-sky NO2, the results from the other percentile bins are shown in Fig. C2. In general, besides the top 10th percentile of data, the results from all the other bins show good correlation (above 0.6) and low bias. Thus, in this study, the Pandora zenith-sky NO2 data that have O4 values within only the top 10th percentile are considered to be affected by heavy clouds and are removed. Some examples of this heavy cloud effect are shown in Figs. C3 and 8 in Sect. 4.3.
The uncertainties of retrieved Pandora zenith-sky NO2 data products (total column and surface concentration) are estimated and discussed here to assess the quality of the data products. The uncertainties of total column and surface concentrations are estimated first using the uncertainty propagation method (referred to here as the UP method) based on Eqs. (2) and (3). The combined uncertainties of total column can be calculated using
where σdSCD is the statistical uncertainty on the DOAS fit (output of QDOAS) and σRCD and σAMF are the estimated statistical uncertainties using standard errors of the RCD and the zenith-sky empirical AMF regression, respectively (Eq. A1). To estimate the upper limit of the nominal uncertainty, AMF and SCD are used as median and maximum values in the dataset, respectively.
The combined uncertainties of the surface concentration can be calculated using
where is the uncertainty of Pandora zenith-sky total column NO2, (here we use the derived σVCD in Eq. D1), is the uncertainty of the stratospheric NO2 column (estimated using the 1σ standard deviation of the Vstrat), is the uncertainty of the free troposphere NO2 column (estimated using the 1σ standard deviation of the Vftrop). RCV is the GEM-MACH calculated surface VMR to PBL column ratio, and σR is the uncertainty of that ratio (estimated using the 1σ standard deviation of the RCV). The means of RCV, VPan, Vstrat, and Vftrop are used in the uncertainty estimation.
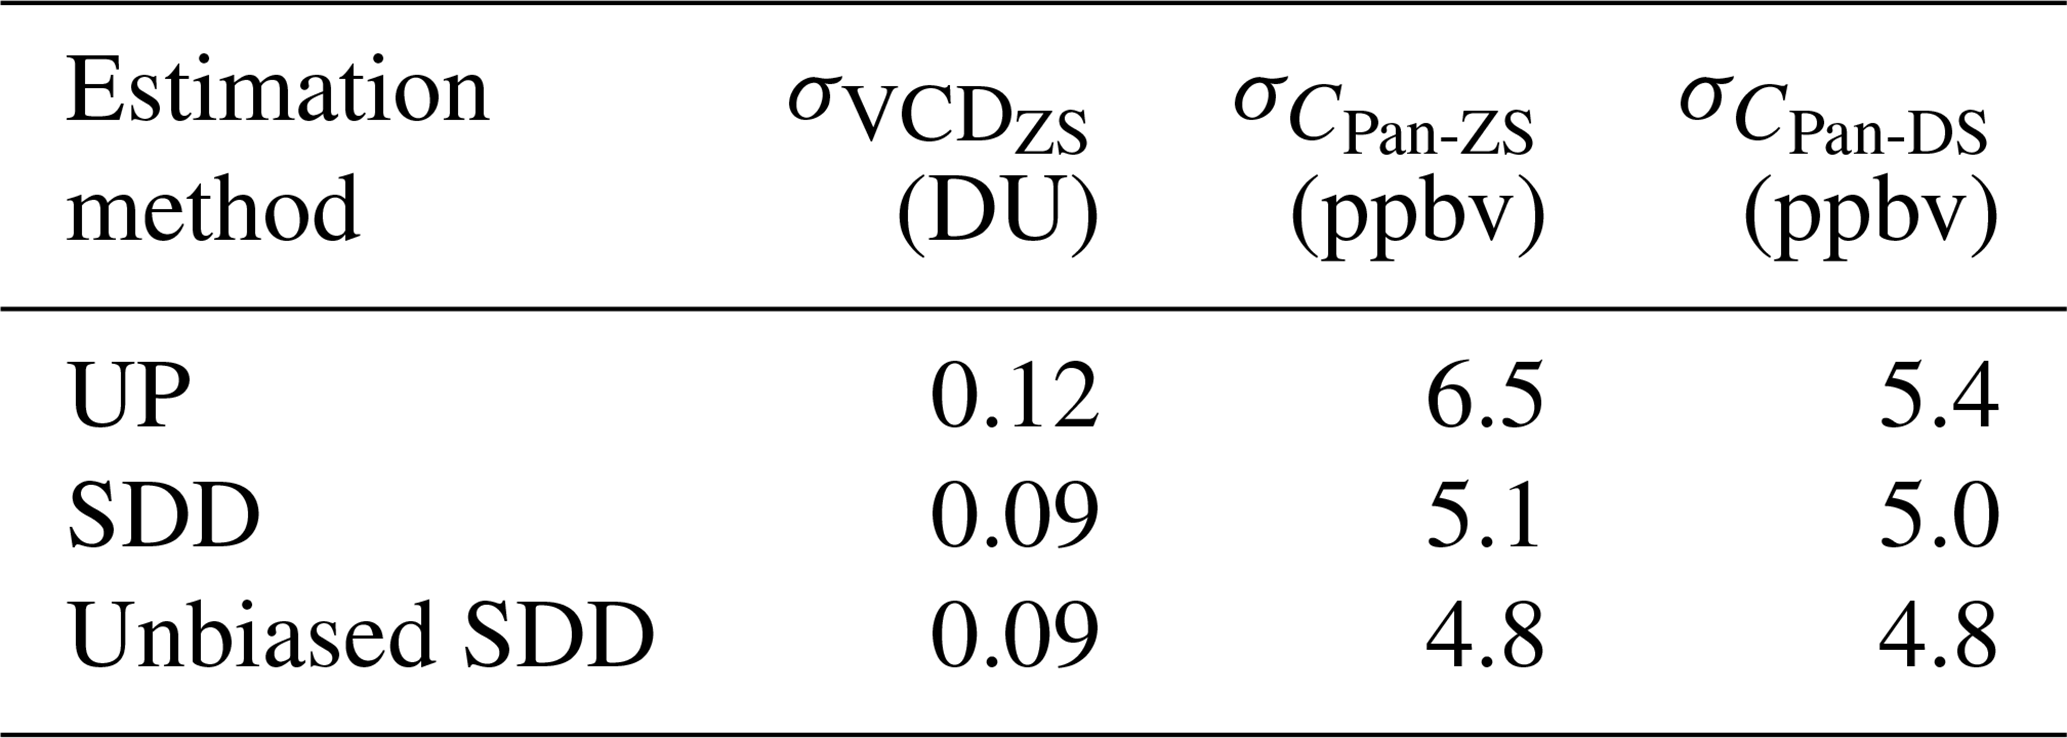
Table D1Estimated uncertainties for Pandora zenith-sky total column and surface NO2.
Besides the UP method, another simple approach to estimate uncertainty is to compare the data product with another high-quality (lower uncertainty) coincident datum. For example, if we assume that the Pandora direct-Sun total column NO2 data can represent the true value, we can estimate the uncertainty of Pandora zenith-sky total column NO2 by calculating the 1σ standard deviation of their difference (referred to here as the SDD method):
Similarly, if we assume that the in situ surface NO2 VMR can represent the true value, the uncertainty of Pandora zenith-sky-based surface NO2 VMR can be given by
Also, if there is systematic bias between the two datasets, it can be removed and the random uncertainty can be calculated by
where k1 and k2 are the slopes in the linear fits with intercept set to zero (e.g., slopes in Figs. 2 and 6). This method is referred to here as the unbiased SDD. These three uncertainty estimation methods (UP, SDD, and unbiased SDD) were all implemented, and the results are summarized in Table D1. The results show that Pandora zenith-sky total column NO2 data have a 0.09–0.12 DU uncertainty that is about twice the Pandora direct-Sun total column nominal accuracy (0.05 DU, at 1σ level). When using the UP method, for the worst-case scenario, the Pandora zenith-sky total column NO2 data have a 0.17 DU uncertainty (i.e., using minimum of AMFs to estimate the upper limit of uncertainty). The estimated Pandora zenith-sky-based surface NO2 VMR data have uncertainties from 4.8 to 6.5 ppbv. In Eq. (D2), the contributions of the VPan, VStrat, Vftrop, and RCV terms to the total uncertainty are 36 %, 2 %, 0.3 %, and 62 %, respectively. This result indicates that the uncertainty in the Pandora zenith-sky-based surface NO2 VMR is dominated by the uncertainties of Pandora zenith-sky total column NO2 and the modelled column-to-surface conversion ratio (RCV). However, note that this uncertainty budget depends on the NO2 vertical distributions and hence may vary from site to site; e.g., in Toronto, tropospheric column NO2 is typically 2–4 times higher than stratospheric column NO2, and thus the contribution to uncertainty from VPan is much larger than the corresponding contributions from VStrat and Vftrop. In addition, the uncertainty of Pandora direct-Sun surface NO2 VMR is also estimated and provided in Table D1. It shows slightly better results than for zenith-sky-based surface NO2 VMR.
XZ analyzed the data and prepared the manuscript, with significant conceptual input from DG, VF, and CM, and critical feedback from all co-authors. JD, AO, VF, XZ, and SCL operated and managed the Canadian Pandora network. AL, MDM, and DG performed and analyzed the GEM-MACH simulations. AC, MT, and MM operated the Pandonia network and provided critical technical support to the Canadian Pandora measurements and subsequent data analysis.
The authors declare that they have no conflict of interest.
Xiaoyi Zhao was supported by the NSERC Visiting Fellowships in Canadian Government Laboratories program. We thank Ihab Abboud and Reno Sit for their technical support of Pandora measurements. We thank NAPS for providing surface NO2 data. We acknowledge the NASA Earth Science Division for providing OMI NO2 SPv3.0 data. We also thank Thomas Danckaert, Caroline Fayt, Michel Van Roozendael, and others from IASB-BIRA for providing the QDOAS software, the NDACC UV–visible working group for providing NDACC UV–visible NO2 AMF LUT, and Yushan Su from the Ontario Ministry of the Environment, Conservation and Parks for providing NAPS Toronto north station in situ NO2 information. We thank two anonymous referees for their helpful and insightful comments, which improved the overall quality of this work.
This paper was edited by Robert McLaren and reviewed by Michel Van Roozendael and one anonymous referee.
Adams, C., Strong, K., Zhao, X., Bassford, M. R., Chipperfield, M. P., Daffer, W., Drummond, J. R., Farahani, E. E., Feng, W., Fraser, A., Goutail, F., Manney, G., McLinden, C. A., Pazmino, A., Rex, M., and Walker, K. A.: Severe 2011 ozone depletion assessed with 11 years of ozone, NO2, and OClO measurements at 80∘ N, Geophys. Res. Lett., 39, L05806, https://doi.org/10.1029/2011gl050478, 2012.
Adams, C., Normand, E. N., McLinden, C. A., Bourassa, A. E., Lloyd, N. D., Degenstein, D. A., Krotkov, N. A., Belmonte Rivas, M., Boersma, K. F., and Eskes, H.: Limb-nadir matching using non-coincident NO2 observations: proof of concept and the OMI-minus-OSIRIS prototype product, Atmos. Meas. Tech., 9, 4103–4122, https://doi.org/10.5194/amt-9-4103-2016, 2016.
Adams, C., Bourassa, A. E., McLinden, C. A., Sioris, C. E., von Clarmann, T., Funke, B., Rieger, L. A., and Degenstein, D. A.: Effect of volcanic aerosol on stratospheric NO2 and N2O5 from 2002–2014 as measured by Odin-OSIRIS and Envisat-MIPAS, Atmos. Chem. Phys., 17, 8063–8080, https://doi.org/10.5194/acp-17-8063-2017, 2017.
Akingunola, A., Makar, P. A., Zhang, J., Darlington, A., Li, S.-M., Gordon, M., Moran, M. D., and Zheng, Q.: A chemical transport model study of plume-rise and particle size distribution for the Athabasca oil sands, Atmos. Chem. Phys., 18, 8667–8688, https://doi.org/10.5194/acp-18-8667-2018, 2018.
Bey, I., Jacob, D. J., Yantosca, R. M., Logan, J. A., Field, B. D., Fiore, A. M., Li, Q., Liu, H. Y., Mickley, L. J., and Schultz, M. G.: Global modeling of tropospheric chemistry with assimilated meteorology: Model description and evaluation, J. Geophys. Res., 106, 23073–23095, https://doi.org/10.1029/2001JD000807, 2001.
Bogumil, K., Orphal, J., Homann, T., Voigt, S., Spietz, P., Fleischmann, O. C., Vogel, A., Hartmann, M., Kromminga, H., Bovensmann, H., Frerick, J., and Burrows, J. P.: Measurements of molecular absorption spectra with the SCIAMACHY pre-flight model: instrument characterization and reference data for atmospheric remote-sensing in the 230–2380 nm region, J. Photoch. Photobio. A, 157, 167–184, https://doi.org/10.1016/s1010-6030(03)00062-5, 2003.
Brion, J., Chakir, A., Daumont, D., Malicet, J., and Parisse, C.: High-resolution laboratory absorption cross section of O3. Temperature effect, Chem. Phys. Lett., 213, 610–612, https://doi.org/10.1016/0009-2614(93)89169-I, 1993.
Brion, J., Chakir, A., Charbonnier, J., Daumont, D., Parisse, C., and Malicet, J.: Absorption Spectra Measurements for the Ozone Molecule in the 350–830 nm Region, J. Atmos. Chem., 30, 291–299, https://doi.org/10.1023/a:1006036924364, 1998.
Brohede, S., McLinden, C. A., Urban, J., Haley, C. S., Jonsson, A. I., and Murtagh, D.: Odin stratospheric proxy NOy measurements and climatology, Atmos. Chem. Phys., 8, 5731–5754, https://doi.org/10.5194/acp-8-5731-2008, 2008.
Bucsela, E. J., Krotkov, N. A., Celarier, E. A., Lamsal, L. N., Swartz, W. H., Bhartia, P. K., Boersma, K. F., Veefkind, J. P., Gleason, J. F., and Pickering, K. E.: A new stratospheric and tropospheric NO2 retrieval algorithm for nadir-viewing satellite instruments: applications to OMI, Atmos. Meas. Tech., 6, 2607–2626, https://doi.org/10.5194/amt-6-2607-2013, 2013.
Cede, A.: Manual for Blick Software Suite 1.6, available at: http://pandonia.net/media/documents/BlickSoftwareSuite_Manual_v11.pdf, last accessed: 15 August 2019.
Cede, A., Herman, J., Richter, A., Krotkov, N., and Burrows, J.: Measurements of nitrogen dioxide total column amounts using a Brewer double spectrophotometer in direct Sun mode, J. Geophys. Res., 111, D05304, https://doi.org/10.1029/2005JD006585, 2006.
Celarier, E. A., Brinksma, E. J., Gleason, J. F., Veefkind, J. P., Cede, A., Herman, J. R., Ionov, D., Goutail, F., Pommereau, J.-P., Lambert, J.-C., Roozendael, M. van, Pinardi, G., Wittrock, F., Schönhardt, A., Richter, A., Ibrahim, O. W., Wagner, T., Bojkov, B., Mount, G., Spinei, E., Chen, C. M., Pongetti, T. J., Sander, S. P., Bucsela, E. J., Wenig, M. O., Swart, D. P. J., Volten, H., Kroon, M., and Levelt, P. F.: Validation of Ozone Monitoring Instrument nitrogen dioxide columns, J. Geophys. Res., D15S15, https://doi.org/10.1029/2007JD008908, 2008.
Celarier, E. A., Lamsal, L. N., Bucsela, E. J., Marchenko, S. V., and Krotkov, N. A.: OMNO2 Version 3.0 Level 2 File Description (Document version 3.1), NASA Goddard Space Flight Center, 2016.
Chance, K. V. and Spurr, R. J. D.: Ring effect studies: Rayleigh scattering, including molecular parameters for rotational Raman scattering, and the Fraunhofer spectrum, Appl. Opt., 36, 5224–5230, https://doi.org/10.1364/AO.36.005224, 1997.
Côté, J., Gravel, S., Méthot, A., Patoine, A., Roch, M., and Staniforth, A.: The Operational CMC–MRB Global Environmental Multiscale (GEM) Model. Part I: Design Considerations and Formulation, Mon. Weather Rev., 126, 1373–1395, https://doi.org/10.1175/1520-0493(1998)126<1373:TOCMGE>2.0.CO;2, 1998.
Dabek-Zlotorzynska, E., Dann, T. F., Kalyani Martinelango, P., Celo, V., Brook, J. R., Mathieu, D., Ding, L., and Austin, C. C.: Canadian National Air Pollution Surveillance (NAPS) PM2.5 speciation program: Methodology and PM2.5 chemical composition for the years 2003–2008, Atmos. Environ., 45, 673–686, https://doi.org/10.1016/j.atmosenv.2010.10.024, 2011.
Danckaert, T., Fayt, C., Van Roozendael, M., de Smedt, I., Letocart, V., Merlaud, A., and Pinardi, G.: QDOAS Software user manual version 2.109, Software user manual, Belgian Institute for Space Aeronomy, Brussels, 2015.
Daumont, D., Brion, J., Charbonnier, J., and Malicet, J.: Ozone UV spectroscopy I: Absorption cross-sections at room temperature, J. Atmos. Chem., 15, 145–155, https://doi.org/10.1007/bf00053756, 1992.
de Graaf, M., Sihler, H., Tilstra, L. G., and Stammes, P.: How big is an OMI pixel?, Atmos. Meas. Tech., 9, 3607–3618, https://doi.org/10.5194/amt-9-3607-2016, 2016.
Drosoglou, T., Bais, A. F., Zyrichidou, I., Kouremeti, N., Poupkou, A., Liora, N., Giannaros, C., Koukouli, M. E., Balis, D., and Melas, D.: Comparisons of ground-based tropospheric NO2 MAX-DOAS measurements to satellite observations with the aid of an air quality model over the Thessaloniki area, Greece, Atmos. Chem. Phys., 17, 5829–5849, https://doi.org/10.5194/acp-17-5829-2017, 2017.
Drosoglou, T., Koukouli, M. E., Kouremeti, N., Bais, A. F., Zyrichidou, I., Balis, D., van der A, R. J., Xu, J., and Li, A.: MAX-DOAS NO2 observations over Guangzhou, China; ground-based and satellite comparisons, Atmos. Meas. Tech., 11, 2239–2255, https://doi.org/10.5194/amt-11-2239-2018, 2018.
ECCC: Canadian Environmental Sustainability Indicators: Air Quality. Environment and Climate Change Canada, ISBN 978-0-660-06016-3, 2016.
EEA: Air quality in Europe – 2017 report, European Environment Agency, EEA Report No. 13/2017, 2017.
EPA: Air Quality Index-A Guide to Air Quality and Your Health, U.S. Environmental Protection Agency, EPA-454/R-00-005, 2014.
Fioletov, V. E., McLinden, C. A., McElroy, C. T., and Savastiouk, V.: New method for deriving total ozone from Brewer zenith sky observations, J. Geophys. Res., 116, D08301, https://doi.org/10.1029/2010JD015399, 2011.
Flynn, C. M., Pickering, K. E., Crawford, J. H., Lamsal, L., Krotkov, N., Herman, J., Weinheimer, A., Chen, G., Liu, X., Szykman, J., Tsay, S.-C., Loughner, C., Hains, J., Lee, P., Dickerson, R. R., Stehr, J. W., and Brent, L.: Relationship between column-density and surface mixing ratio: Statistical analysis of O3 and NO2 data from the July 2011 Maryland DISCOVER-AQ mission, Atmos. Environ., 92, 429–441, https://doi.org/10.1016/j.atmosenv.2014.04.041, 2014.
Frieß, U., Sihler, H., Sander, R., Pöhler, D., Yilmaz, S., and Platt, U.: The vertical distribution of BrO and aerosols in the Arctic: Measurements by active and passive differential optical absorption spectroscopy, J. Geophys. Res., 116, D00R04, https://doi.org/10.1029/2011jd015938, 2011.
Gao, R. S., Keim, E. R., Woodbridge, E. L., Ciciora, S. J., Proffitt, M. H., Thompson, T. L., Mclaughlin, R. J., and Fahey, D. W.: New photolysis system for NO2 measurements in the lower stratosphere, J. Geophys. Res.-Atmos., 99, 20673–20681, https://doi.org/10.1029/94JD01521, 1994.
Gielen, C., Van Roozendael, M., Hendrick, F., Pinardi, G., Vlemmix, T., De Bock, V., De Backer, H., Fayt, C., Hermans, C., Gillotay, D., and Wang, P.: A simple and versatile cloud-screening method for MAX-DOAS retrievals, Atmos. Meas. Tech., 7, 3509–3527, https://doi.org/10.5194/amt-7-3509-2014, 2014.
Goldberg, D. L., Lamsal, L. N., Loughner, C. P., Swartz, W. H., Lu, Z., and Streets, D. G.: A high-resolution and observationally constrained OMI NO2 satellite retrieval, Atmos. Chem. Phys., 17, 11403–11421, https://doi.org/10.5194/acp-17-11403-2017, 2017.
Greenblatt, G. D., Orlando, J. J., Burkholder, J. B., and Ravishankara, A. R.: Absorption measurements of oxygen between 330 and 1140 nm, J. Geophys. Res., 95, 18577–18582, https://doi.org/10.1029/JD095iD11p18577, 1990.
Hendrick, F., Van Roozendael, M., Kylling, A., Petritoli, A., Rozanov, A., Sanghavi, S., Schofield, R., von Friedeburg, C., Wagner, T., Wittrock, F., Fonteyn, D., and De Mazière, M.: Intercomparison exercise between different radiative transfer models used for the interpretation of ground-based zenith-sky and multi-axis DOAS observations, Atmos. Chem. Phys., 6, 93–108, https://doi.org/10.5194/acp-6-93-2006, 2006.
Hendrick, F., Pommereau, J.-P., Goutail, F., Evans, R. D., Ionov, D., Pazmino, A., Kyrö, E., Held, G., Eriksen, P., Dorokhov, V., Gil, M., and Van Roozendael, M.: NDACC/SAOZ UV-visible total ozone measurements: improved retrieval and comparison with correlative ground-based and satellite observations, Atmos. Chem. Phys., 11, 5975–5995, https://doi.org/10.5194/acp-11-5975-2011, 2011.
Hendrick, F., Müller, J.-F., Clémer, K., Wang, P., De Mazière, M., Fayt, C., Gielen, C., Hermans, C., Ma, J. Z., Pinardi, G., Stavrakou, T., Vlemmix, T., and Van Roozendael, M.: Four years of ground-based MAX-DOAS observations of HONO and NO2 in the Beijing area, Atmos. Chem. Phys., 14, 765–781, https://doi.org/10.5194/acp-14-765-2014, 2014.
Herman, J., Cede, A., Spinei, E., Mount, G., Tzortziou, M., and Abuhassan, N.: NO2 column amounts from ground-based Pandora and MFDOAS spectrometers using the direct-sun DOAS technique: Intercomparisons and application to OMI validation, J. Geophys. Res., 114, D13307, https://doi.org/10.1029/2009JD011848, 2009.
Herman, J., Evans, R., Cede, A., Abuhassan, N., Petropavlovskikh, I., and McConville, G.: Comparison of ozone retrievals from the Pandora spectrometer system and Dobson spectrophotometer in Boulder, Colorado, Atmos. Meas. Tech., 8, 3407–3418, https://doi.org/10.5194/amt-8-3407-2015, 2015.
Hermans, C., Vandaele, A. C., Fally, S., Carleer, M., Colin, R., Coquart, B., Jenouvrier, A., and Merienne, M.-F.: Absorption cross-section of the collision-induced bands of oxygen from the UV to the NIR, in: Weakly Interacting Molecular Pairs: Unconventional Absorbers of Radiation in the Atmosphere, edited by: Camy-Peyret, C. and Vigasin, A. A., 193–202, Springer, Germany, 2003.
Ialongo, I., Herman, J., Krotkov, N., Lamsal, L., Boersma, K. F., Hovila, J., and Tamminen, J.: Comparison of OMI NO2 observations and their seasonal and weekly cycles with ground-based measurements in Helsinki, Atmos. Meas. Tech., 9, 5203–5212, https://doi.org/10.5194/amt-9-5203-2016, 2016.
Irie, H., Kanaya, Y., Akimoto, H., Tanimoto, H., Wang, Z., Gleason, J. F., and Bucsela, E. J.: Validation of OMI tropospheric NO2 column data using MAX-DOAS measurements deep inside the North China Plain in June 2006: Mount Tai Experiment 2006, Atmos. Chem. Phys., 8, 6577–6586, https://doi.org/10.5194/acp-8-6577-2008, 2008.
Kelly, T. J., Spicer, C. W., and Ward, G. F.: An assessment of the luminol chemiluminescence technique for measurement of NO2 in ambient air, Atmos. Environ., 24, 2397–2403, https://doi.org/10.1016/0960-1686(90)90332-H, 1990.
Kerr, J. B., McElroy, C. T., and Olafson, R. A.: Measurements of ozone with the Brewer ozone spectrophotometer, in: Proceedings of the Quadrennial Ozone Symposium, 74–79, Boulder, USA, 1981.
Kerr, J. B., Asbridge, I. A., and Evans, W. F. J.: Intercomparison of total ozone measured by the Brewer and Dobson spectrophotometers at Toronto, J. Geophys. Res., 93, 11129–11140, https://doi.org/10.1029/JD093iD09p11129, 1988.
Knepp, T., Pippin, M., Crawford, J., Chen, G., Szykman, J., Long, R., Cowen, L., Cede, A., Abuhassan, N., Herman, J., Delgado, R., Compton, J., Berkoff, T., Fishman, J., Martins, D., Stauffer, R., Thompson, A. M., Weinheimer, A., Knapp, D., Montzka, D., Lenschow, D., and Neil, D.: Estimating surface NO2 and SO2 mixing ratios from fast-response total column observations and potential application to geostationary missions, J. Atmos. Chem., 72, 261–286, https://doi.org/10.1007/s10874-013-9257-6, 2015.
Knepp, T. N., Querel, R., Johnston, P., Thomason, L., Flittner, D., and Zawodny, J. M.: Intercomparison of Pandora stratospheric NO2 slant column product with the NDACC-certified M07 spectrometer in Lauder, New Zealand, Atmos. Meas. Tech., 10, 4363–4372, https://doi.org/10.5194/amt-10-4363-2017, 2017.
Koenker, R. and Hallock, K. F.: Quantile Regression, J. Econ. Perspect., 15, 143–156, https://doi.org/10.1257/jep.15.4.143, 2001.
Kollonige, D. E., Thompson, A. M., Josipovic, M., Tzortziou, M., Beukes, J. P., Burger, R., Martins, D. K., Zyl, P. G. van, Vakkari, V., and Laakso, L.: OMI Satellite and Ground-Based Pandora Observations and Their Application to Surface NO2 Estimations at Terrestrial and Marine Sites, J. Geophys. Res., 123, 1441–1459, https://doi.org/10.1002/2017JD026518, 2017.
Kramer, L. J., Leigh, R. J., Remedios, J. J., and Monks, P. S.: Comparison of OMI and ground-based in situ and MAX-DOAS measurements of tropospheric nitrogen dioxide in an urban area, J. Geophys. Res., 113, D16S39, https://doi.org/10.1029/2007JD009168, 2008.
Krotkov, N. A., Lamsal, L. N., Celarier, E. A., Swartz, W. H., Marchenko, S. V., Bucsela, E. J., Chan, K. L., Wenig, M., and Zara, M.: The version 3 OMI NO2 standard product, Atmos. Meas. Tech., 10, 3133–3149, https://doi.org/10.5194/amt-10-3133-2017, 2017.
Krotkov, N. A., Lamsal, L. N., Marchenko, S. V., Celarier, E. A.,Bucsela, E. J., Swartz, W. H., and Veefkind, P.: OMI/Aura Nitrogen Dioxide (NO2) Total and Tropospheric Column 1-orbit L2 Swath 13×24 km V003, Greenbelt, MD, USA, Goddard Earth Sciences Data and Information Services Center (GES DISC), https://doi.org/10.5067/Aura/OMI/DATA2017, last access: 15 August 2019.
Lambert, J.-C., Granville, J., Van Roozendael, M., Sarkissian, A., Goutail, F., Müller, J.-F., Pommereau, J.-P., and Russell III, J. M.: A climatology of NO2 profile for improved Air Mass Factors for ground-based vertical column measurements, in: Stratospheric Ozone 1999, Air Pollution Research Report 73 (CEC DG XII), 1999.
Lambert, J.-C., Granville, J., Van Roozendael, M., Müller, J.-F., Goutail, F., Pommereau, J.-P., Sarkissian, A., Johnston, P. V., and Russell III, J. M.: in Global Behaviour of Atmospheric NO2 as Derived from the Integrated Use of Satellite, Ground-based Network and Balloon Observations, 201–202, Sapporo, Japan, 2000.
Lamsal, L. N., Martin, R. V., Donkelaar, A. van, Steinbacher, M., Celarier, E. A., Bucsela, E., Dunlea, E. J., and Pinto, J. P.: Ground-level nitrogen dioxide concentrations inferred from the satellite-borne Ozone Monitoring Instrument, J. Geophys. Res., 113, D16308, https://doi.org/10.1029/2007JD009235, 2008.
Lamsal, L. N., Krotkov, N. A., Celarier, E. A., Swartz, W. H., Pickering, K. E., Bucsela, E. J., Gleason, J. F., Martin, R. V., Philip, S., Irie, H., Cede, A., Herman, J., Weinheimer, A., Szykman, J. J., and Knepp, T. N.: Evaluation of OMI operational standard NO2 column retrievals using in situ and surface-based NO2 observations, Atmos. Chem. Phys., 14, 11587–11609, https://doi.org/10.5194/acp-14-11587-2014, 2014.
Lamsal, L. N., Janz, S. J., Krotkov, N. A., Pickering, K. E., Spurr, R. J. D., Kowalewski, M. G., Loughner, C. P., Crawford, J. H., Swartz, W. H., and Herman, J. R.: High-resolution NO2 observations from the Airborne Compact Atmospheric Mapper: Retrieval and validation, J. Geophys. Res., 122, 1953–1970, https://doi.org/10.1002/2016JD025483, 2017.
Lee, A. M., Roscoe, H. K., Oldham, D. J., Squires, J. A. C., Sarkissian, A., Pommereau, J.-P., and Gardiner, B. G.: Improvements to the accuracy of measurements of NO2 by zenith-sky visible spectrometers, J. Quant. Spectrosc. Ra., 52, 649–657, https://doi.org/10.1016/0022-4073(94)90031-0, 1994.
Levelt, P. F., Hilsenrath, E., Leppelmeier, G. W., Van den Oord, G. H., Bhartia, P. K., Tamminen, J., De Haan, J. F., and Veefkind, J. P.: Science objectives of the ozone monitoring instrument, IEEE T. Geosci. Remote, 44, 1199–1208, https://doi.org/10.1109/TGRS.2006.872336, 2006.
Levelt, P. F., Joiner, J., Tamminen, J., Veefkind, J. P., Bhartia, P. K., Stein Zweers, D. C., Duncan, B. N., Streets, D. G., Eskes, H., van der A, R., McLinden, C., Fioletov, V., Carn, S., de Laat, J., DeLand, M., Marchenko, S., McPeters, R., Ziemke, J., Fu, D., Liu, X., Pickering, K., Apituley, A., González Abad, G., Arola, A., Boersma, F., Chan Miller, C., Chance, K., de Graaf, M., Hakkarainen, J., Hassinen, S., Ialongo, I., Kleipool, Q., Krotkov, N., Li, C., Lamsal, L., Newman, P., Nowlan, C., Suleiman, R., Tilstra, L. G., Torres, O., Wang, H., and Wargan, K.: The Ozone Monitoring Instrument: overview of 14 years in space, Atmos. Chem. Phys., 18, 5699–5745, https://doi.org/10.5194/acp-18-5699-2018, 2018.
Lindenmaier, R., Strong, K., Batchelor, R. L., Bernath, P. F., Chabrillat, S., Chipperfield, M. P., Daffer, W. H., Drummond, J. R., Feng, W., Jonsson, A. I., Kolonjari, F., Manney, G. L., McLinden, C., Ménard, R., and Walker, K. A.: A study of the Arctic NOy budget above Eureka, Canada, J. Geophys. Res., 116, D23302, https://doi.org/10.1029/2011JD016207, 2011.
Maeda, Y., Aoki, K., and Munemori, M.: Chemiluminescence method for the determination of nitrogen dioxide, Anal. Chem., 52, 307–311, https://doi.org/10.1021/ac50052a022, 1980.
Marchenko, S., Krotkov, N. A., Lamsal, L. N., Celarier, E. A., Swartz, W. H., and Bucsela, E. J.: Revising the slant column density retrieval of nitrogen dioxide observed by the Ozone Monitoring Instrument, J. Geophys. Res., 120, 5670–5692, https://doi.org/10.1002/2014JD022913, 2015.
Martin, R. V., Chance, K., Jacob, D. J., Kurosu, T. P., Spurr, R. J. D., Bucsela, E., Gleason, J. F., Palmer, P. I., Bey, I., Fiore, A. M., Li, Q., Yantosca, R. M., and Koelemeijer, R. B. A.: An improved retrieval of tropospheric nitrogen dioxide from GOME, J. Geophys. Res., 107, ACH 9-1–ACH 9-21, https://doi.org/10.1029/2001JD001027, 2002.
Martins, D. K., Najjar, R. G., Tzortziou, M., Abuhassan, N., Thompson, A. M., and Kollonige, D. E.: Spatial and temporal variability of ground and satellite column measurements of NO2 and O3 over the Atlantic Ocean during the Deposition of Atmospheric Nitrogen to Coastal Ecosystems Experiment, J. Geophys. Res., 121, 14175–14187, https://doi.org/10.1002/2016JD024998, 2016.
McClenny, W. A.: Recommended methods for ambient air monitoring of NO, NO2, NOy and individual NOz species, Tech. rep., US Environmental Protection Agency, Traingle Park, NC 27711, 2000.
McLinden, C. A., Olsen, S. C., Hannegan, B., Wild, O., Prather, M. J., and Sundet, J.: Stratospheric ozone in 3-D models: A simple chemistry and the cross-tropopause flux, J. Geophys. Res., 105, 14653–14665, https://doi.org/10.1029/2000jd900124, 2000.
McLinden, C. A., Fioletov, V., Boersma, K. F., Kharol, S. K., Krotkov, N., Lamsal, L., Makar, P. A., Martin, R. V., Veefkind, J. P., and Yang, K.: Improved satellite retrievals of NO2 and SO2 over the Canadian oil sands and comparisons with surface measurements, Atmos. Chem. Phys., 14, 3637–3656, https://doi.org/10.5194/acp-14-3637-2014, 2014.
Moran, M. D., Menard, S., Talbot, D., Huang, P., Makar, P. A., Gong, W., Landry, H., Gong, S., Gravel, S., Crevier, L.-P., and Kallaur, A.: Particulate-matter forecasting with GEM-MACH15, a new Canadian operational air quality forecast model, in 30th NATO/SPS ITM on Air Pollution Modelling and Its Application, 289–293, Springer, San Francisco, 2009.
Moran, M. D., Pavlovic, R., and Anselmo, D.: Regional Air Quality Deterministic Prediction System (RAQDPS): Update from version 019 to version 020. Technical note, Sept., Canadian Centre for Meteorological and Environmental Prediction, Montreal, 43 pp., available at: http://collaboration.cmc.ec.gc.ca/cmc/CMOI/product_guide/docs/tech_notes/technote_raqdps-v20_20180918_e.pdf (last access: 15 August 2019), 2018.
Noxon, J. F.: Nitrogen dioxide in the stratosphere and troposphere measured by ground-based absorption spectroscopy, Science, 189, 547–549, 1975.
NRC: Rethinking the Ozone Problem in Urban and Regional Air Pollution, National Research Council, National Academy Press, Washington, D.C., 1992.
Park, R. J., Jacob, D. J., Field, B. D., Yantosca, R. M., and Chin, M.: Natural and transboundary pollution influences on sulfate-nitrate-ammonium aerosols in the United States: Implications for policy, J. Geophys. Res., 109, D15204, https://doi.org/10.1029/2003JD004473, 2004.
Pavlovic, R., Chen, J., Anderson, K., Moran, M. D., Beaulieu, P.-A., Davignon, D., and Cousineau, S.: The FireWork air quality forecast system with near-real-time biomass burning emissions: Recent developments and evaluation of performance for the 2015 North American wildfire season, J. Air Waste Manage., 66, 819–841, https://doi.org/10.1080/10962247.2016.1158214, 2016.
Pendlebury, D., Gravel, S., Moran, M. D., and Lupu, A.: Impact of chemical lateral boundary conditions in a regional air quality forecast model on surface ozone predictions during stratospheric intrusions, Atmos. Environ., 174, 148–170, https://doi.org/10.1016/j.atmosenv.2017.10.052, 2018.
Piters, A. J. M., Boersma, K. F., Kroon, M., Hains, J. C., Van Roozendael, M., Wittrock, F., Abuhassan, N., Adams, C., Akrami, M., Allaart, M. A. F., Apituley, A., Beirle, S., Bergwerff, J. B., Berkhout, A. J. C., Brunner, D., Cede, A., Chong, J., Clémer, K., Fayt, C., Frieß, U., Gast, L. F. L., Gil-Ojeda, M., Goutail, F., Graves, R., Griesfeller, A., Großmann, K., Hemerijckx, G., Hendrick, F., Henzing, B., Herman, J., Hermans, C., Hoexum, M., van der Hoff, G. R., Irie, H., Johnston, P. V., Kanaya, Y., Kim, Y. J., Klein Baltink, H., Kreher, K., de Leeuw, G., Leigh, R., Merlaud, A., Moerman, M. M., Monks, P. S., Mount, G. H., Navarro-Comas, M., Oetjen, H., Pazmino, A., Perez-Camacho, M., Peters, E., du Piesanie, A., Pinardi, G., Puentedura, O., Richter, A., Roscoe, H. K., Schönhardt, A., Schwarzenbach, B., Shaiganfar, R., Sluis, W., Spinei, E., Stolk, A. P., Strong, K., Swart, D. P. J., Takashima, H., Vlemmix, T., Vrekoussis, M., Wagner, T., Whyte, C., Wilson, K. M., Yela, M., Yilmaz, S., Zieger, P., and Zhou, Y.: The Cabauw Intercomparison campaign for Nitrogen Dioxide measuring Instruments (CINDI): design, execution, and early results, Atmos. Meas. Tech., 5, 457–485, https://doi.org/10.5194/amt-5-457-2012, 2012.
Platt, U.: Differential optical absorption spectroscopy (DOAS), in: Air Monitoring by Spectroscopic Techniques, 27–84, John Wiley, New York, 1994.
Platt, U. and Stutz, J.: Differential Optical Absorption Spectroscopy: Principles and Applications, Springer, Germany, Berlin, 2008.
Reed, A. J., Thompson, A. M., Kollonige, D. E., Martins, D. K., Tzortziou, M. A., Herman, J. R., Berkoff, T. A., Abuhassan, N. K., and Cede, A.: Effects of local meteorology and aerosols on ozone and nitrogen dioxide retrievals from OMI and pandora spectrometers in Maryland, USA during DISCOVER-AQ 2011, J. Atmos. Chem., 72, 455–482, https://doi.org/10.1007/s10874-013-9254-9, 2015.
Reid, H. and Aherne, J.: Staggering reductions in atmospheric nitrogen dioxide across Canada in response to legislated transportation emissions reductions, Atmos. Environ., 146, 252–260, https://doi.org/10.1016/j.atmosenv.2016.09.032, 2016.
Rodgers, C. D.: Inverse Methods for Atmospheric Sounding: Theory and Practice, World Scientific, Singapore, 2000.
Roscoe, H. K., Van Roozendael, M., Fayt, C., du Piesanie, A., Abuhassan, N., Adams, C., Akrami, M., Cede, A., Chong, J., Clémer, K., Friess, U., Gil Ojeda, M., Goutail, F., Graves, R., Griesfeller, A., Grossmann, K., Hemerijckx, G., Hendrick, F., Herman, J., Hermans, C., Irie, H., Johnston, P. V., Kanaya, Y., Kreher, K., Leigh, R., Merlaud, A., Mount, G. H., Navarro, M., Oetjen, H., Pazmino, A., Perez-Camacho, M., Peters, E., Pinardi, G., Puentedura, O., Richter, A., Schönhardt, A., Shaiganfar, R., Spinei, E., Strong, K., Takashima, H., Vlemmix, T., Vrekoussis, M., Wagner, T., Wittrock, F., Yela, M., Yilmaz, S., Boersma, F., Hains, J., Kroon, M., Piters, A., and Kim, Y. J.: Intercomparison of slant column measurements of NO2 and O4 by MAX-DOAS and zenith-sky UV and visible spectrometers, Atmos. Meas. Tech., 3, 1629–1646, https://doi.org/10.5194/amt-3-1629-2010, 2010.
Rothman, L. S., Jacquemart, D., Barbe, A., Chris Benner, D., Birk, M., Brown, L. R., Carleer, M. R., Chackerian, J. C., Chance, K., Coudert, L. H., Dana, V., Devi, V. M., Flaud, J. M., Gamache, R. R., Goldman, A., Hartmann, J. M., Jucks, K. W., Maki, A. G., Mandin, J. Y., Massie, S. T., Orphal, J., Perrin, A., Rinsland, C. P., Smith, M. A. H., Tennyson, J., Tolchenov, R. N., Toth, R. A., Vander Auwera, J., Varanasi, P., and Wagner, G.: The HITRAN 2004 molecular spectroscopic database, J. Quant. Spectrosc. Ra., 96, 139–204, https://doi.org/10.1016/j.jqsrt.2004.10.008, 2005.
Ryerson, T. B., Williams, E. J., and Fehsenfeld, F. C.: An efficient photolysis system for fast-response NO2 measurements, J. Geophys. Res., 105, 26447–26461, https://doi.org/10.1029/2000JD900389, 2000.
Sarkissian, A., Roscoe, H. K., Fish, D., Van Roozendael, M., Gil, M., Chen, H. B., Wang, P., Pommereau, J. P., and Lenoble, J.: Ozone and NO2 Air-Mass Factors for Zenith-Sky Spectrometers – Intercomparison of Calculations with Different Radiative-Transfer Models, Geophys. Res. Lett., 22, 1113–1116, 1995.
Sauvage, B., Martin, R. V., van Donkelaar, A., Liu, X., Chance, K., Jaeglé, L., Palmer, P. I., Wu, S., and Fu, T.-M.: Remote sensed and in situ constraints on processes affecting tropical tropospheric ozone, Atmos. Chem. Phys., 7, 815–838, https://doi.org/10.5194/acp-7-815-2007, 2007.
Seber, G. A. F. and Wild, C. J.: Nonlinear Regression, Wiley-Interscience, Hoboken, NJ, 2003.
Shettle, E. P.: Models of aerosols, clouds, and precipitation for atmospheric propagation studies, in AGARD Conference Proceedings No. 454: Atmospheric Propagation in the UV, Visible, IR, and MM-Wave Region and Related Systems Aspects, Neuilly sur Seine, France, 1989.
Solomon, S., Schmeltekopf, A., and Sanders, R.: On the interpretation of zenith sky absorption measurements, J. Geophys. Res., 2, 8311–8319, 1987.
Spinei, E., Whitehill, A., Fried, A., Tiefengraber, M., Knepp, T. N., Herndon, S., Herman, J. R., Müller, M., Abuhassan, N., Cede, A., Richter, D., Walega, J., Crawford, J., Szykman, J., Valin, L., Williams, D. J., Long, R., Swap, R. J., Lee, Y., Nowak, N., and Poche, B.: The first evaluation of formaldehyde column observations by improved Pandora spectrometers during the KORUS-AQ field study, Atmos. Meas. Tech., 11, 4943–4961, https://doi.org/10.5194/amt-11-4943-2018, 2018.
Stieb, D. M., Burnett, R. T., Smith-Doiron, M., Brion, O., Shin, H. H., and Economou, V.: A New Multipollutant, No-Threshold Air Quality Health Index Based on Short-Term Associations Observed in Daily Time-Series Analyses, J. Air Waste Manage., 58, 435–450, https://doi.org/10.3155/1047-3289.58.3.435, 2008.
Tack, F., Hendrick, F., Goutail, F., Fayt, C., Merlaud, A., Pinardi, G., Hermans, C., Pommereau, J.-P., and Van Roozendael, M.: Tropospheric nitrogen dioxide column retrieval from ground-based zenith-sky DOAS observations, Atmos. Meas. Tech., 8, 2417–2435, https://doi.org/10.5194/amt-8-2417-2015, 2015.
Thalman, R. and Volkamer, R.: Temperature dependent absorption cross-sections of O2-O2 collision pairs between 340 and 630 nm and at atmospherically relevant pressure, Phys. Chem. Chem. Phys., 15, 15371–15381, 2013.
Thornton, J. A., Wooldridge, P. J., and Cohen, R. C.: Atmospheric NO2: In Situ Laser-Induced Fluorescence Detection at Parts per Trillion Mixing Ratios, Anal. Chem., 72, 528–539, https://doi.org/10.1021/ac9908905, 2000.
Tzortziou, M., Herman, J. R., Cede, A., and Abuhassan, N.: High precision, absolute total column ozone measurements from the Pandora spectrometer system: Comparisons with data from a Brewer double monochromator and Aura OMI, J. Geophys. Res., 117, D16303, https://doi.org/10.1029/2012JD017814, 2012.
Vandaele, A. C., Hermans, C., Simon, P. C., Carleer, M., Colin, R., Fally, S., Mérienne, M. F., Jenouvrier, A., and Coquart, B.: Measurements of the NO2 absorption cross-section from 42 000 cm−1 to 10 000 cm−1 (238–1000 nm) at 220 K and 294 K, J. Quant. Spectrosc. Ra., 59, 171–184, https://doi.org/10.1016/s0022-4073(97)00168-4, 1998.
Van Roozendael, M. and Hendrick, F.: Recommendations for total ozone retrieval from NDACC zenith-sky UV-VIS spectrometers, Belgian Institute for Space Aeronomy, Brussels, 2009.
Van Roozendael, M. and Hendrick, F.: Recommendations for NO2 column retrieval from NDACC zenith-sky UV-VIS spectrometers, Belgian Institute for Space Aeronomy, Brussels, 2012.
Van Roozendael, M., Peeters, P., Roscoe, H. K., De Backer, H., Jones, A. E., Bartlett, L., Vaughan, G., Goutail, F., Pommereau, J.-P., and Kyro, E.: Validation of ground-based visible measurements of total ozone by comparison with Dobson and Brewer spectrophotometers, J. Atmos. Chem., 29, 55–83, https://doi.org/10.1023/A:1005815902581, 1998.
Vaughan, G., Roscoe, H. K., Bartlett, L. M., OConnor, F. M., Sarkissian, A., Van Roozendael, M., Lambert, J. C., Simon, P. C., Karlsen, K., Hoiskar, B. A. K., Fish, D. J., Jones, R. L., Freshwater, R. A., Pommereau, J. P., Goutail, F., Andersen, S. B., Drew, D. G., Hughes, P. A., Moore, D., Mellqvist, J., Hegels, E., Klupfel, T., Erle, F., Pfeilsticker, K., and Platt, U.: An intercomparison of ground-based UV-visible sensors of ozone and NO2, J. Geophys. Res., 102, 1411–1422, https://doi.org/10.1029/96JD00515, 1997.
Wagner, T., Dix, B., Friedeburg, C. v, Frieß, U., Sanghavi, S., Sinreich, R., and Platt, U.: MAX-DOAS O4 measurements: A new technique to derive information on atmospheric aerosols: Principles and information content, J. Geophys. Res., 109, D22205, https://doi.org/10.1029/2004jd004904, 2004.
Wagner, T., Burrows, J. P., Deutschmann, T., Dix, B., von Friedeburg, C., Frieß, U., Hendrick, F., Heue, K.-P., Irie, H., Iwabuchi, H., Kanaya, Y., Keller, J., McLinden, C. A., Oetjen, H., Palazzi, E., Petritoli, A., Platt, U., Postylyakov, O., Pukite, J., Richter, A., van Roozendael, M., Rozanov, A., Rozanov, V., Sinreich, R., Sanghavi, S., and Wittrock, F.: Comparison of box-air-mass-factors and radiances for Multiple-Axis Differential Optical Absorption Spectroscopy (MAX-DOAS) geometries calculated from different UV/visible radiative transfer models, Atmos. Chem. Phys., 7, 1809–1833, https://doi.org/10.5194/acp-7-1809-2007, 2007.
Wagner, T., Beirle, S., Brauers, T., Deutschmann, T., Frieß, U., Hak, C., Halla, J. D., Heue, K. P., Junkermann, W., Li, X., Platt, U., and Pundt-Gruber, I.: Inversion of tropospheric profiles of aerosol extinction and HCHO and NO2 mixing ratios from MAX-DOAS observations in Milano during the summer of 2003 and comparison with independent data sets, Atmos. Meas. Tech., 4, 2685–2715, https://doi.org/10.5194/amt-4-2685-2011, 2011.
Wagner, T., Apituley, A., Beirle, S., Dörner, S., Friess, U., Remmers, J., and Shaiganfar, R.: Cloud detection and classification based on MAX-DOAS observations, Atmos. Meas. Tech., 7, 1289–1320, https://doi.org/10.5194/amt-7-1289-2014, 2014.
Wagner, T., Beirle, S., Remmers, J., Shaiganfar, R., and Wang, Y.: Absolute calibration of the colour index and O4 absorption derived from Multi AXis (MAX-)DOAS measurements and their application to a standardised cloud classification algorithm, Atmos. Meas. Tech., 9, 4803–4823, https://doi.org/10.5194/amt-9-4803-2016, 2016.
Wagner, T., Beirle, S., Benavent, N., Bösch, T., Chan, K. L., Donner, S., Dörner, S., Fayt, C., Frieß, U., García-Nieto, D., Gielen, C., González-Bartolome, D., Gomez, L., Hendrick, F., Henzing, B., Jin, J. L., Lampel, J., Ma, J., Mies, K., Navarro, M., Peters, E., Pinardi, G., Puentedura, O., Puķīte, J., Remmers, J., Richter, A., Saiz-Lopez, A., Shaiganfar, R., Sihler, H., Van Roozendael, M., Wang, Y., and Yela, M.: Is a scaling factor required to obtain closure between measured and modelled atmospheric O4 absorptions? An assessment of uncertainties of measurements and radiative transfer simulations for 2 selected days during the MAD-CAT campaign, Atmos. Meas. Tech., 12, 2745–2817, https://doi.org/10.5194/amt-12-2745-2019, 2019.
Wang, S., Pongetti, T. J., Sander, S. P., Spinei, E., Mount, G. H., Cede, A., and Herman, J.: Direct Sun measurements of NO2 column abundances from Table Mountain, California: Intercomparison of low- and high-resolution spectrometers, J. Geophys. Res., 115, D13305, https://doi.org/10.1029/2009JD013503, 2010.
Wang, Y., Penning de Vries, M., Xie, P. H., Beirle, S., Dörner, S., Remmers, J., Li, A., and Wagner, T.: Cloud and aerosol classification for 2.5 years of MAX-DOAS observations in Wuxi (China) and comparison to independent data sets, Atmos. Meas. Tech., 8, 5133–5156, https://doi.org/10.5194/amt-8-5133-2015, 2015.
Wendel, G. J., Stedman, D. H., Cantrell, C. A., and Damrauer, L.: Luminol-based nitrogen dioxide detector, Anal. Chem., 55, 937–940, https://doi.org/10.1021/ac00257a027, 1983.
Wenig, M. O., Cede, A. M., Bucsela, E. J., Celarier, E. A., Boersma, K. F., Veefkind, J. P., Brinksma, E. J., Gleason, J. F., and Herman, J. R.: Validation of OMI tropospheric NO2 column densities using direct-Sun mode Brewer measurements at NASA Goddard Space Flight Center, J. Geophys. Res., 113, D16S45, https://doi.org/10.1029/2007JD008988, 2008.
WHO: Evolution of WHO air quality guidelines: past, present and future, WHO Regional Office for Europe, Copenhagen, 2017.
Zhang, J., Moran, M. D., Zheng, Q., Makar, P. A., Baratzadeh, P., Marson, G., Liu, P., and Li, S.-M.: Emissions preparation and analysis for multiscale air quality modeling over the Athabasca Oil Sands Region of Alberta, Canada, Atmos. Chem. Phys., 18, 10459–10481, https://doi.org/10.5194/acp-18-10459-2018, 2018.
Zhao, X., Fioletov, V., Cede, A., Davies, J., and Strong, K.: Accuracy, precision, and temperature dependence of Pandora total ozone measurements estimated from a comparison with the Brewer triad in Toronto, Atmos. Meas. Tech., 9, 5747–5761, https://doi.org/10.5194/amt-9-5747-2016, 2016.
Zhao, X., Bognar, K., Fioletov, V., Pazmino, A., Goutail, F., Millán, L., Manney, G., Adams, C., and Strong, K.: Assessing the impact of clouds on ground-based UV-visible total column ozone measurements in the high Arctic, Atmos. Meas. Tech., 12, 2463–2483, https://doi.org/10.5194/amt-12-2463-2019, 2019.
Zoogman, P., Jacob, D. J., Chance, K., Liu, X., Lin, M., Fiore, A., and Travis, K.: Monitoring high-ozone events in the US Intermountain West using TEMPO geostationary satellite observations, Atmos. Chem. Phys., 14, 6261–6271, https://doi.org/10.5194/acp-14-6261-2014, 2014.
- Abstract
- Introduction
- Datasets and models
- Total column NO2 retrieval
- Surface NO2 concentration retrieval
- Discussion
- Conclusions
- Data availability
- Appendix A: Empirical zenith-sky AMF
- Appendix B: Stratospheric NO2 column
- Appendix C: Cloud effect and heavy cloud filtration
- Appendix D: Uncertainty estimation
- Author contributions
- Competing interests
- Acknowledgements
- Review statement
- References