the Creative Commons Attribution 4.0 License.
the Creative Commons Attribution 4.0 License.
 | 21 Aug 2019
Large contribution of meteorological factors to inter-decadal changes in regional aerosol optical depth
Xiangao Xia
Yaqiang Wang
Brent N. Holben
Philippe Goloub
Emilio Cuevas-Agulló
Hong Wang
Yu Zheng
Hujia Zhao
Xiaoye Zhang
Aerosol optical depth (AOD) has become a crucial metric for assessing global climate change. Although global and regional AOD trends have been studied extensively, it remains unclear what factors are driving the inter-decadal variations in regional AOD and how to quantify the relative contribution of each dominant factor. This study used a long-term (1980–2016) aerosol dataset from the Modern-Era Retrospective Analysis for Research and Applications, version 2 (MERRA-2) reanalysis, along with two satellite-based AOD datasets (MODIS/Terra and MISR) from 2001 to 2016, to investigate the long-term trends in global and regional aerosol loading. Statistical models based on emission factors and meteorological parameters were developed to identify the main factors driving the inter-decadal changes of regional AOD and to quantify their contribution. Evaluation of the MERRA-2 AOD with the ground-based measurements of AERONET indicated significant spatial agreement on the global scale (r= 0.85, root-mean-square error = 0.12, mean fractional error = 38.7 %, fractional gross error = 9.86 % and index of agreement = 0.94). However, when AOD observations from the China Aerosol Remote Sensing Network (CARSNET) were employed for independent verification, the results showed that MERRA-2 AODs generally underestimated CARSNET AODs in China (relative mean bias = 0.72 and fractional gross error %). In general, MERRA-2 was able to quantitatively reproduce the annual and seasonal AOD trends on both regional and global scales, as observed by MODIS/Terra, although some differences were found when compared to MISR. Over the 37-year period in this study, significant decreasing trends were observed over Europe and the eastern United States. In contrast, eastern China and southern Asia showed AOD increases, but the increasing trend of the former reversed sharply in the most recent decade. The statistical analyses suggested that the meteorological parameters explained a larger proportion of the AOD variability (20.4 %–72.8 %) over almost all regions of interest (ROIs) during 1980–2014 when compared with emission factors (0 %–56 %). Further analysis also showed that SO2 was the dominant emission factor, explaining 12.7 %–32.6 % of the variation in AOD over anthropogenic-aerosol-dominant regions, while black carbon or organic carbon was the leading factor over the biomass-burning-dominant (BBD) regions, contributing 24.0 %–27.7 % of the variation. Additionally, wind speed was found to be the leading meteorological parameter, explaining 11.8 %–30.3 % of the variance over the mineral-dust-dominant regions, while ambient humidity (including soil moisture and relative humidity) was the top meteorological parameter over the BBD regions, accounting for 11.7 %–35.5 % of the variation. The results of this study indicate that the variation in meteorological parameters is a key factor in determining the inter-decadal change in regional AOD.
- Article
(11358 KB) -
Supplement
(6378 KB) - BibTeX
- EndNote


Atmospheric aerosols play a key role in the energy budget of the Earth's climate system through aerosol–radiation interactions (direct effect) and aerosol–cloud interactions (indirect effect). On the one hand, by absorbing and scattering solar and terrestrial radiation, aerosols generally cool the Earth's surface and heat the atmosphere, depending on the absorption level of the aerosols (McCormick and Ludwig 1967; Ding et al., 2016; Sun et al., 2018; Zheng et al., 2019). This effect is termed the aerosol direct effect. The cooling effect of aerosols may partly counteract the warming caused by the increase in CO2 and other greenhouse gases in the past several decades (Bernstein et al., 2007). On the other hand, by acting as cloud condensation nuclei or ice nuclei, not only can aerosols alter the microphysical and radiative properties of clouds, as well as their lifetimes (Rosenfeld et al., 2019; Andreae, 2009), but they can also change the precipitation efficiency (depending on the aerosol type; Jiang et al., 2018), modify the characteristics of the atmospheric circulation and affect the global hydrological cycle (Ramanathan et al., 2001; Ackerman et al., 2000; Hansen et al., 1997; Sarangi et al., 2018). This effect is termed the aerosol indirect effect. Furthermore, depending on their physical and chemical properties, as well as their composition, aerosols can affect ecosystems (Yue et al., 2017; Liu et al., 2017), atmospheric visibility (Che et al., 2007, 2014; Wang et al., 2009; Gui et al., 2016) and even human health (such as through their roles in lung cancer, respiratory infection and cardiovascular disease; Silva et al., 2013; Lelieveld et al., 2015; Cohen et al., 2017). Unlike the long-lived greenhouse gases (e.g., CO2, CH4 and N2O), aerosols produced via anthropogenic activity or naturally have relatively short life spans and large spatial and temporal variability. Therefore, it is essential to investigate the long-term variability and inter-decadal trends of atmospheric aerosol loadings on both regional and global scales.
Aerosol optical depth (AOD), representing the attenuation of sunlight induced by aerosols and serving as an important measure of aerosol loading, has become a crucial metric in assessing global climate change and the effects of aerosols on radiation, precipitation and clouds. Through the efforts of scientists in various countries over the past 3 decades, a series of AOD datasets with different time spans derived from continuous ground-based and satellite observations have been accumulated. These datasets have been widely employed to investigate the long-term annual and seasonal trends of AOD at global and regional scales. Although ground-based observations have limited spatial and/or temporal coverage, they can provide more detailed information on aerosol properties and long-term variations for satellite and model validation. For example, using the long-term and high-quality AOD datasets from the Aerosol Robotic Network (AERONET), Li et al. (2014) found that North America and Europe experienced a uniform decrease in AOD from 2000 to 2013. Che et al. (2015) estimated the change in AOD based on AOD data at 12 long-term ground-based sites in China from the China Aerosol Remote Sensing Network (CARSNET) and found that AOD showed a downward trend from 2006 to 2009 and an upward trend from 2009 to 2013. Compared with the spatial sparseness of ground-based observations, inferences from satellite-based sensors can provide a global perspective of AOD change, due to their continuous spatial measurements. Previous studies (Hsu et al., 2012; Pozzer et al., 2015; Mehta et al., 2016; Proestakis et al., 2018; Klingmüller et al., 2016; De Leeuw et al., 2018; Zhang and Reid, 2010) have investigated global and regional AOD trends by using multiple satellite observations, including the Moderate Resolution Imaging Spectroradiometer (MODIS), the Multiangle Imaging Spectroradiometer (MISR), the Sea-viewing Wide Field-of-view Sensor (SeaWiFS) and others. These studies have shown increased AODs over eastern China, India, the Middle East (ME), and the Bay of Bengal and decreased AODs over the eastern United States (EUS) and Europe.
In general, regional AOD changes are closely linked to the variations in natural emissions driven by meteorological conditions (such as mineral dust) and local anthropogenic emissions associated with economic and population growth. For example, over anthropogenic-aerosol-dominant regions, most of the primary pollutant emissions such as black carbon (BC) and aerosol precursors (such as SO2, NOx and NH3) in North America and Europe have declined in response to emissions control (Hammer et al., 2018). In contrast, pollutant emissions and their precursors in the rapidly developing countries (such as India and China) have increased over the past few decades, attributable to enhanced industrial activity. However, as a consequence of clean-air actions, anthropogenic emissions in China have declined significantly in recent years (Zheng et al., 2018). It has been proven that these changes in local pollutant emissions or aerosol precursors over the above regions can, to a certain extent, explain the regional AOD variability, as observed in long-term satellite aerosol data records (De Meij et al., 2012; Itahashi et al., 2012; Feng et al., 2018). On the other hand, various studies have shown that meteorological changes play a major role in determining the inter-decadal trend of AOD over mineral-dust-dominant regions, particularly in the Sahara desert (SD) and the ME (Pozzer et al., 2015; Klingmüller et al., 2016). Based on model simulations during 2001–2010, Pozzer et al. (2015) suggested that, over biomass-burning-dominant regions, the changes in both meteorology and emissions are equally important for driving AOD trends. Considering the localized changes in anthropogenic aerosol emissions and meteorological conditions in different regions, a key question is whether these factors are responsible for the regional AOD trends or which main factors dominate the trends. Therefore, it is important to investigate the cause of regional AOD trends in terms of the variations in both anthropogenic emissions and meteorological factors for projecting the response of the Earth atmosphere system to future changes.
In this study, we used a long-term (1980–2016) aerosol dataset obtained from the Modern-Era Retrospective Analysis for Research and Applications, version 2 (MERRA-2) reanalysis, along with two satellite-based datasets (MODIS/Terra and MISR) during 2001–2016, to conduct a comprehensive estimation of global and regional AOD trends over different periods. To ensure the reliability of the trend assessment, 468 AERONET sites and 37 CARSNET sites with continuous observations for at least 1 year were used to assess the performance of the MERRA-2 AOD on a global scale. A total of 12 regions dominated by different aerosol types were selected to explore the relationships between local anthropogenic emissions, meteorological factors and regional AOD. Furthermore, stepwise multiple linear regression (MLR) models were developed to estimate the regional AOD as a function of emission factors and other meteorological parameters, which allowed the influences of emissions and meteorology to be separated. Then, the Lindeman, Merenda and Gold (LMG) method was applied to the MLR models to identify the main factors driving the regional AOD variability and to quantitatively evaluate the contribution of each driving factor.
2.1 MERRA-2 aerosol reanalysis data
MERRA-2 is the latest atmospheric reanalysis version for the modern satellite era provided by the NASA Global Modeling and Assimilation Office (Gelaro et al., 2017), using the Goddard Earth Observing System, version 5 (GEOS-5), Earth system model (Molod et al., 2012, 2015), which includes atmospheric circulation and composition, ocean circulation and land surface processes, and biogeochemistry. Note that in MERRA-2, in addition to providing assimilation of traditional meteorological observations, a series of AOD observation datasets, including bias-corrected AODs, retrieved from the Advanced Very High Resolution Radiometer (AVHRR) instrument over the oceans (Heidinger et al., 2014) and MODIS (onboard both the Terra and Aqua satellites) (Levy et al., 2010; Remer et al., 2005), and non-bias-corrected AODs retrieved from MISR (Kahn et al., 2005) over bright surfaces and ground-based AERONET observations (Holben et al., 1998), were also assimilated within the GEOS-5 Earth system model. An overview of the MERRA-2 modeling system and a more detailed description of aerosols in the MERRA-2 system can be found in Gelaro et al. (2017) and Buchard et al. (2017), respectively. In this study, the 3-hourly MERRA-2 analyzed AOD fields, at a resolution of 0.5∘ latitude by 0.625∘ longitude, were used for evaluation, while the monthly mean AOD values were used for climate analysis.
2.2 Satellite aerosol data
Two AOD datasets during 2001–2016 retrieved from MODIS and MISR, both onboard the Terra platform, were used in this study. The MODIS sensor onboard the Terra satellite observes the Earth at multiple wavelengths (range: 410–1450 nm; 36 bands) with a 2330 km swath, which has provided near-daily global coverage since 2000 (King et al., 2003; Levy et al., 2015). This study employed the combined Dark Target–Deep Blue (DTB) AOD algorithm at 550 nm, with a resolution, from the level 3 (L3) monthly global aerosol dataset for MODIS Terra, Collection 6.1. The average mean absolute error (RMSE) of the level 3 MODIS/Terra DTB monthly AOD data have been estimated to be about 0.075 (0.120) over land (Wei et al., 2019). Note that MODIS/Aqua L3 was not used because it started late (June 2002). In addition, compared with the linear trend in MODIS/Aqua AOD during the overlapping period (2003–2016), MODIS/Terra AOD shows a similar performance worldwide (including spatial–temporal consistency and distribution patterns of trend values) (Fig. S1), although the Terra sensor has been documented to suffer from degradation issues. The similar performance between MODIS/Terra and MODIS/Aqua is mainly attributed to a new calibration approach in the C6 version, which can remove major non-polarimetric calibration trends from the MODIS data (Levy et al., 2013, 2015; De Leeuw et al., 2018).
Total column AOD observations from the MISR sensor onboard the Terra satellite, which provides observations of the Earth's atmosphere with nine different along-track viewing zenith angles at four different spectral bands (440–866 nm) (Diner et al., 1998), were utilized. It should be noted that, although MISR has a much narrower swath (∼ 360 km) compared with MODIS, the multi-angle observation from MISR provides the capability for retrieving a more reliable AOD over bright surfaces, such as desert areas (Diner et al., 1998; Kahn et al., 2010). The AOD retrieval in the 555 nm channel from monthly global aerosol datasets at a spatial resolution of were used in this study. The uncertainty of the MISR level 2 (L2) AOD data over land and ocean has been estimated to be ±0.05 or (Kahn et al., 2005). Note that the wavelength of AOD (555 nm) reported by MISR is different from that of the MERRA-2 and MODIS/Terra datasets (550 nm); however, this slight wavelength difference is not expected to affect our analysis and conclusions regarding AOD annual and seasonal trends.
2.3 Ground-based reference data: AERONET and CARSNET
Owing to the accuracy of ground-based AOD observations, long-term instantaneous AOD observation records from two independent operational networks – AERONET and CARSNET – were used to validate the 3-hourly MERRA-2 AOD values. Since there are not enough long-term AERONET observations in China, it was necessary to examine the performance of the MERRA-2 analyzed AOD fields using additional AOD observations from CARSNET. CARSNET is a ground-based network for monitoring aerosol optical properties that was first established by the China Meteorological Administration in 2002 (Che et al., 2009). Both AERONET and CARSNET use the same types of sun photometers, which can observe direct solar and sky radiances at seven wavelengths (typically 340, 380, 440, 500, 670, 870 and 1020 nm) within a 1.2∘ full field of view at intervals of about 15 min (Holben et al., 1998; Che et al., 2009). For CARSNET, operating instruments are calibrated and standardized using CARSNET reference instruments, which in turn are regularly calibrated at Izaña, Tenerife, Spain, together with the AERONET program (Che et al., 2009, 2018). The cloud-screened AOD (based on the work of Smirnov et al., 2000) in CARSNET has the same accuracy as AERONET, with an estimated uncertainty of 0.01–0.02 (Eck et al., 1999; Che et al., 2009).

Figure 1Geographical locations of the AERONET (yellow dots) and CARSNET sites (magenta dots) used in this work. The red boxes represent the 12 regions of interest selected in this study: northeastern Asia (NEA), northern China (NC), southern China (SC), southeastern Asia (SEA), northwestern China (NWC), southern Asia (SA), Middle East (ME), western Europe (WEU), Sahara desert (SD), central Africa (CF), eastern United States (EUS) and Amazon zone (AMZ).
In this work, we collected ground-based AOD observations (more than 1 year of data) from 468 AERONET sites worldwide and 37 CARSNET sites in China. The locations of these ground-based sites are shown in Fig. 1. Detailed information about these AERONET and CARSNET sites is given in Tables S4 and S5. The combined instantaneous AOD data collected by AERONET (quality-assured and cloud-screened L2 data) during 1993–2016 and CARSNET (cloud-screened L2 data) during 2002–2014 were used. Moreover, to ensure the reliability of AOD evaluation, the AOD measurements in two adjacent channels (i.e., 440 and 675 nm) from AERONET and CARSNET were subsequently interpolated to 550 nm for MERRA-2, using a second-order polynomial fit to ln (AOD) vs. ln (wavelength) (Eck et al., 1999).
2.4 Emissions inventory and meteorological data
The anthropogenic emissions inventories used in this study were obtained from the Peking University (PKU) website (http://inventory.pku.edu.cn/, last access: 31 March 2019), including total suspended particles (TSP) (Huang et al., 2014), SO2 (Su et al., 2011), BC (Wang et al., 2014) and organic carbon (OC) (Huang et al., 2015), with a spatial resolution of and spanning the period 1980–2014. The emissions were calculated using a bottom-up approach based on fuel consumption and an emissions factor database. Huang et al. (2015) showed that the PKU emissions inventories are broadly similar to those of EDGAR version 4.2 (Edgar, 2011). Monthly meteorological fields from the MERRA-2 global reanalysis were also utilized, including total surface precipitation, surface wind speed, surface relative humidity (RH), mean sea level pressure, etc. These data have a spatial resolution of and span the period 1980–2016 (Gelaro et al., 2017). For more detailed information on the selected meteorological parameters, see Table 1.
Table 1Prediction variables used in the stepwise MLR models.
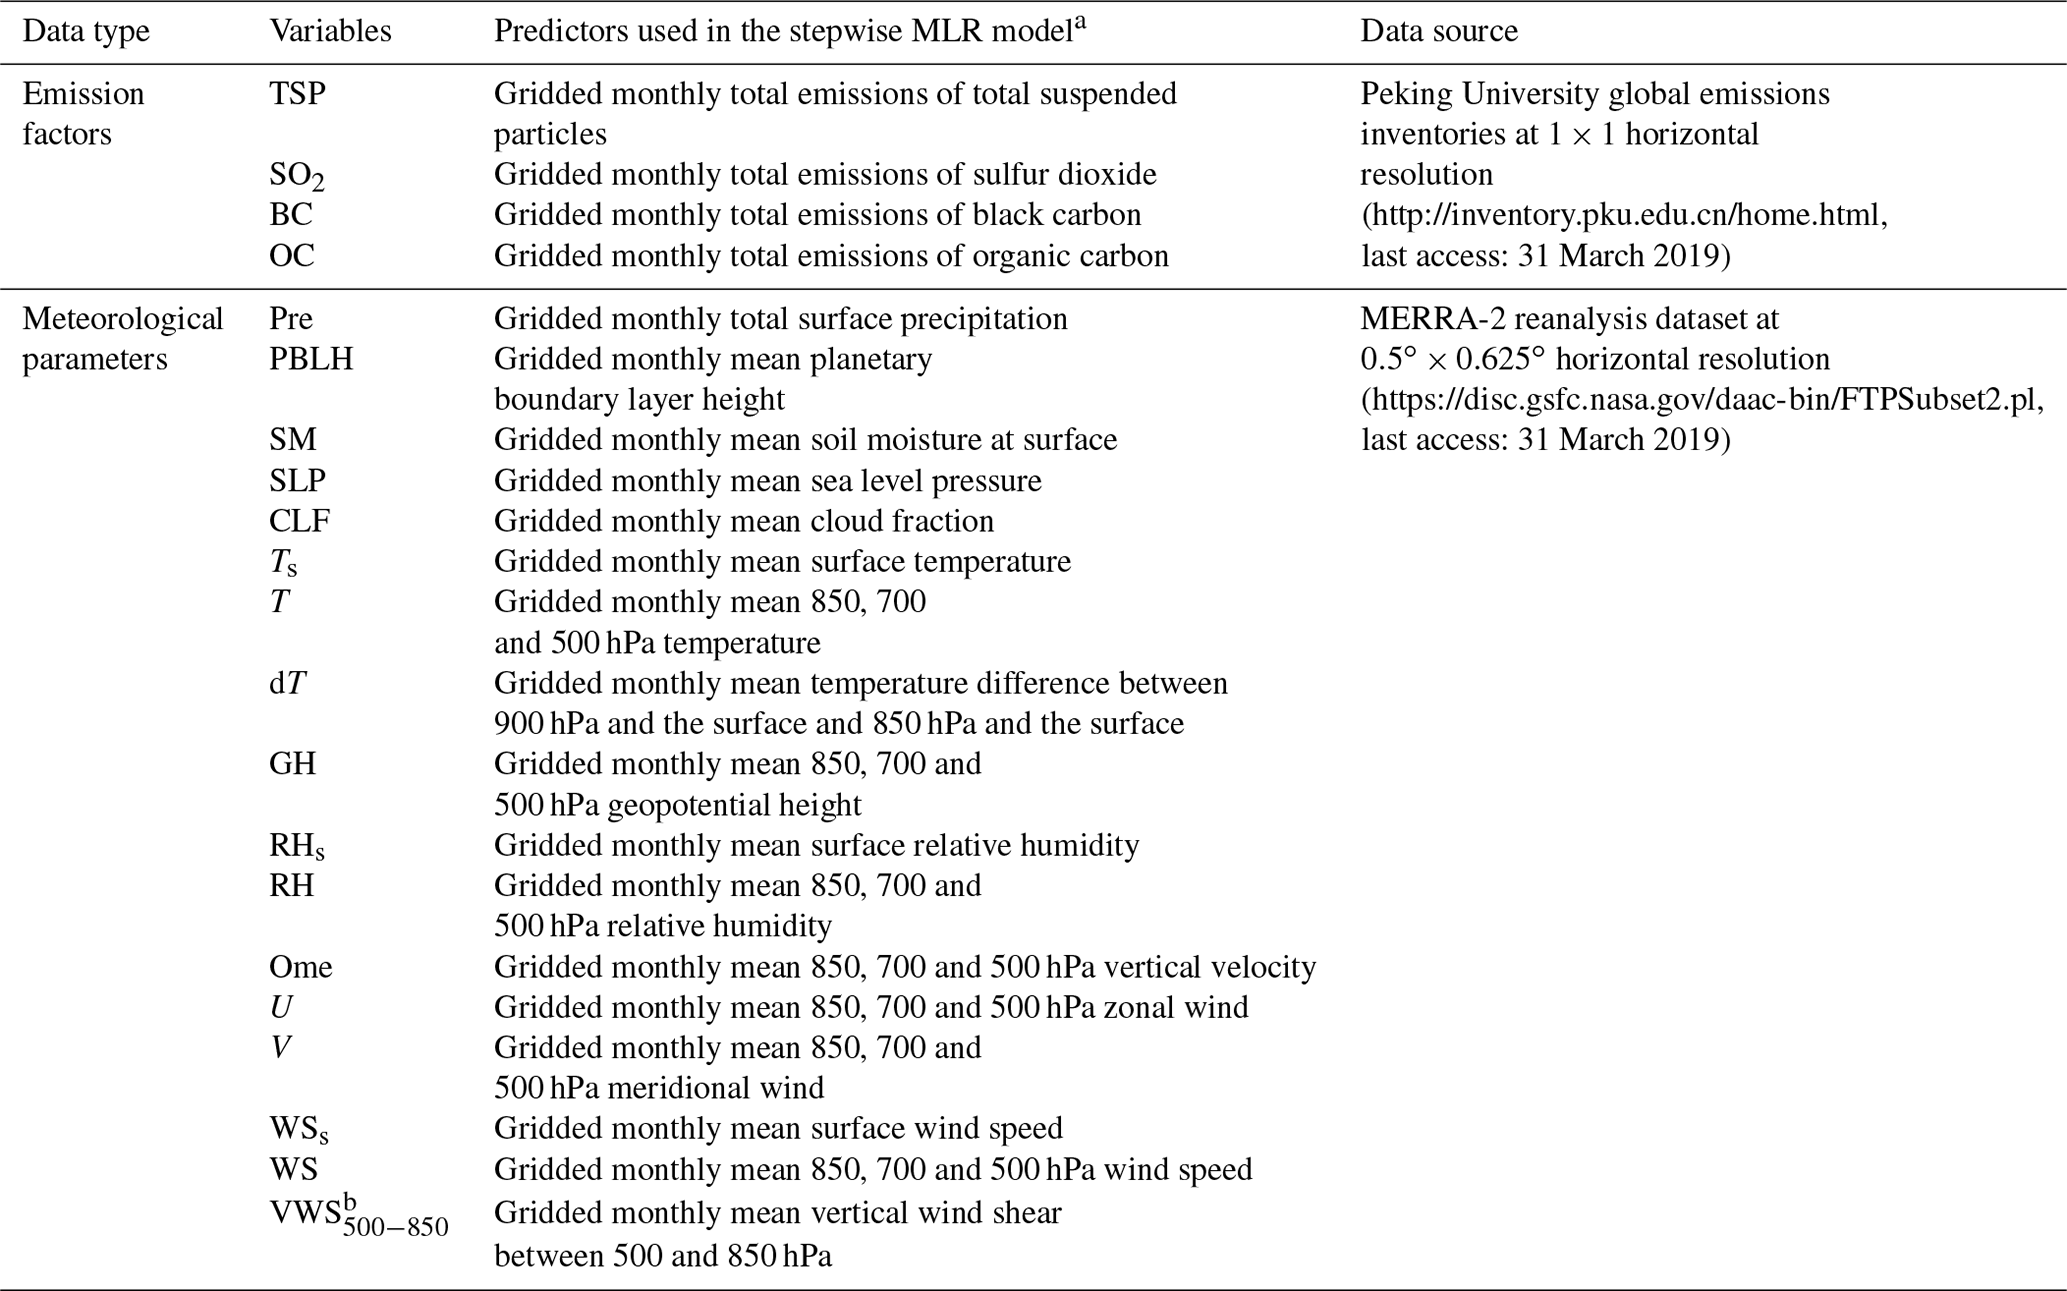
a Units: g km−2 (TSP, SO2, BC, OC); kg m−2 s−1 (Pre); m (PBLH, GH); 1 (SM, CLF); Pa (SLP); K (T, dT); % (RH); pa s−1 (Ome) and m s−1 (U,V, WS, VWS500−850). b VWS500−850 was calculated as .
2.5 Regions of Interest (ROIs)
In this study, 12 regions of interest (ROIs) dominated by different aerosol types were selected to study the long-term trends in regional aerosol loading and how they are related to local emission changes as well as the variation in meteorological variables. These 12 ROIs included three mineral-dust-dominant regions, SD (3–25∘ N, 17∘ W–20∘ E), ME (14–33∘ N, 38–56∘ E), and northwestern China (NWC; 35–47∘ N, 73–94∘ E); three biomass-burning-dominant regions, the Amazon zone (AMZ; 1–22∘ S, 46–60∘ W), central Africa (CF; 2–18∘ S, 12–33∘ E), and southeastern Asia (SEA; 8∘ S–18∘ N, 96–127∘ E); and six anthropogenic-aerosol-dominant regions, EUS (29–45∘ N, 73–94∘ W), western Europe (WEU; 37–59∘ N, 10∘ W–18∘ E), southern Asia (SA; 10–30∘ N, 72–90∘ E), northern China (NC; 30–40∘ N, 108–120∘ E), southern China (SC; 20–30∘ N, 108–120∘ E) and northeastern Asia (NEA; 30–41∘ N, 125–145∘ E). The geographical boundaries of these ROIs are shown in Fig. 1.
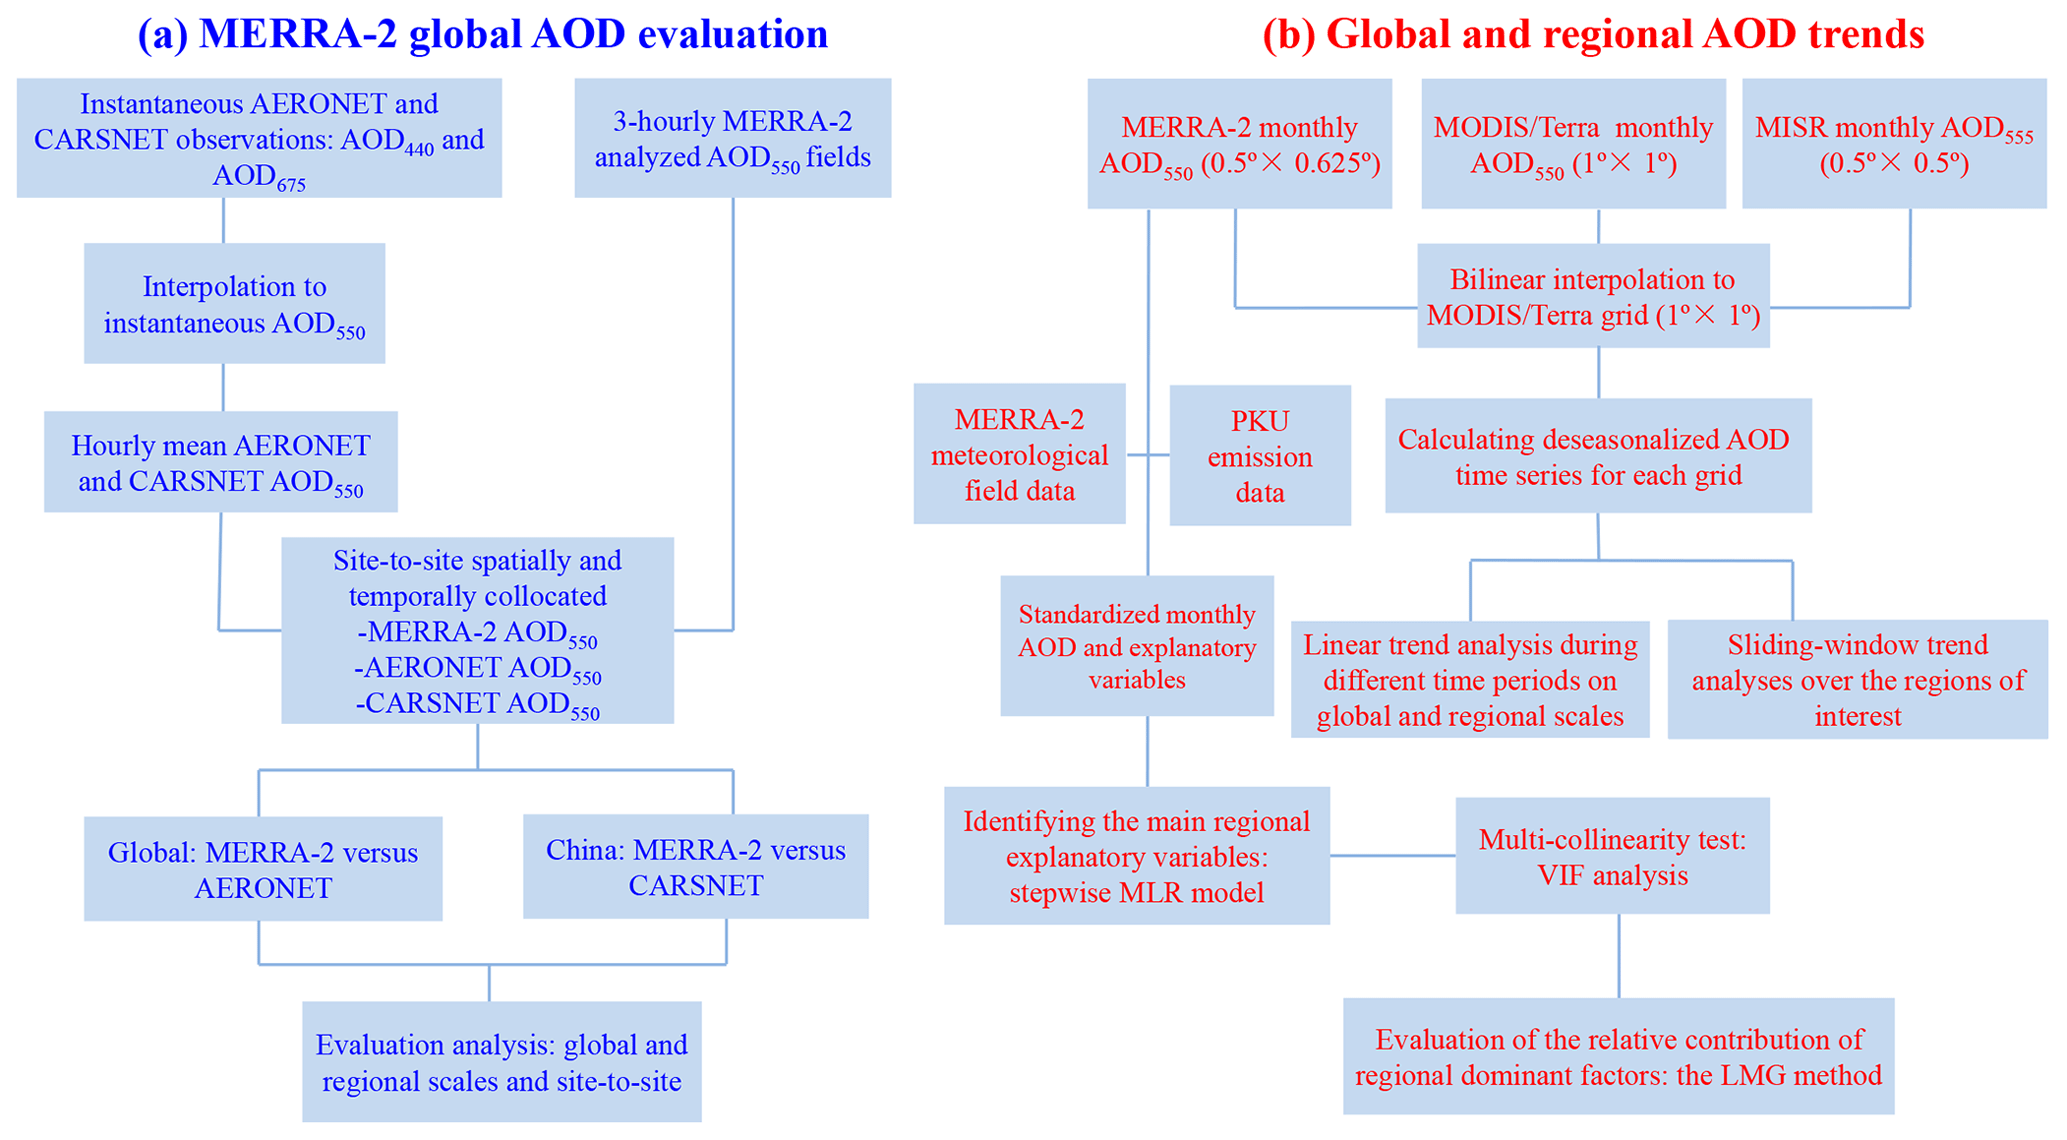
Figure 2Flowchart with the procedure followed for (a) the evaluation of MERRA-2 global AOD, using the AERONET and CARSNET ground-based reference dataset, and (b) the evaluation of global and regional AOD trends.
2.6 Statistical analysis
2.6.1 Comparison methods
AOD data from the 468 AERONET sites worldwide and the 37 CARSNET sites in China were used to evaluate the performance of the 3-hourly AOD datasets from MERRA-2. To ensure the accuracy of the assessment, instantaneous ground-based AOD observations within 1 h, obtained from AERONET and CARSNET, were averaged as the hourly mean AOD and compared with those from the MERRA-2 3-hourly AOD datasets (see Fig. 2a for the whole procedure).
The errors and quality of the MERRA-2 AOD retrievals are reported using the (Pearson) correlation coefficient (R, Eq. 1), the mean absolute error (MAE, Eq. 2), root-mean-square error (RMSE, Eq. 3), the relative mean bias (RMB, Eq. 4), the mean fractional error (MFE, Eq. 5), the fractional gross error (FGE, Eq. 6), and the index of agreement (IOA, Eq. 7) for validating the reanalysis (Yumimoto et al., 2017).
where N is the total number of pairs of modeled (M, i.e., MERRA-2) and observed (O, i.e., AERONET or CARSNET) values. MFE represents a measure of overall modeling error without emphasizing outliers. MFE can range from 0 (best score) to 200 %. FGE represents a measure of the estimation bias error that allows symmetric analysis of overestimation or underestimation by the model relative to observations. The maximum and minimum values of FGE are +200 % and −200 %, respectively, and 0 is the best value. IOA represents a standard measure of the degree of model accuracy and it ranges from 0 to 1 (perfect agreement) (Willmott, 1981).
2.6.2 Trend analysis and stepwise MLR model
Long-term trend analysis of the AOD from MERRA-2, MODIS/Terra and MISR was performed on monthly time series data, using ordinary least-squares linear regression – a technique widely employed for trend analysis of aerosol data (Hsu et al., 2012; Pozzer et al., 2015; Klingmüller et al., 2016; Ma et al., 2016; Hammer et al., 2018). Prior to regression, these data were first deseasonalized by subtracting the monthly mean for different study periods for each grid cell to eliminate the large influence of the annual cycle. To better compare the results of the trend analysis, the MERRA-2 and MISR datasets at high spatial resolution ( and , respectively) were bilinear interpolation to the MODIS/Terra resolution of (see Fig. 2b for the whole procedure). Incomplete sampling from the satellite instruments may introduce biases in long-term trend analysis. Thus, to ensure the reliability of the trend analysis, each grid cell for the MISR and MODIS/Terra AODs was required to have valid data for at least 60 % of the time period before regression was performed. Two-tailed Student's t tests were used to assess the robustness of each trend estimate, and the criterion for statistical significance was set at the 95 % confidence level.
Pearson's R was used to measure the strength of the relationship between AOD, anthropogenic emissions and meteorological parameters. MLR models of monthly MERRA-2 AODs were built for the 12 ROIs using emission factors, meteorological parameters or both as predictors. A total of 4 emission factors and 32 meteorological parameters were considered in the MLR models (Table 1). For each ROI, the MLR model could be expressed as
where y is the standardized monthly AOD and (x1, …, xn) is the ensemble of standardized monthly explanatory variables. The standardized regression coefficient βi was determined by the least-squares method, and ε is an error term.
In each step of the MLR model, a variable is considered to be moved or removed from the set of explanatory variables using the stepwise regression method to obtain the best model fit. In other words, for each step the model adds a significant (P<0.05) explanatory variable to the model, it can be removed only if it is insignificant (P>0.1) after adding or removing another variable. A similar model has been widely used to investigate the relationship between aerosols and meteorology (e.g., Yang et al., 2016; Lu et al., 2016; Zhai et al., 2019; Tai et al., 2010).
Although the most important explanatory variables were obtained via the above stepwise MLR model, there might be multiple collinearities among different explanatory variables. In that situation, the standardized regression coefficient as an explanation of relative importance is unstable and misleading. To eliminate the influence of multi-collinearity, the variance inflation factor (VIF) (Altland et al., 2006) was used to test whether there was a multi-collinearity problem among the variables. VIF is often regarded as a measure of collinearity between each variable and another variable in the model. VIF can be calculated from the following relationship:
where is the coefficient of determination of linear regression between the ith independent variable and other independent variables in the model. The present study used a VIF threshold of 10, as is widely recommended in the literature (e.g., Hair et al., 2007; Barnett et al., 2006; Field, 2005), to represent the maximum acceptability of collinearity.
Finally, to better quantify the relative contributions of each independent explanatory variable, which were obtained from the stepwise MLR model, to AOD variability, the LMG method (Bi, 2012; Grömping, 2006; Lindeman et al., 2014) was applied. This approach is one of the most advanced methods for determining the relative importance of explanatory variables in a linear model and provides a decomposition of the fraction of model-explained contributions (i.e., R2) into nonnegative contributions using semi-partial R values. The LMG measure for the ith regressor xi can be expressed as
where r represents the rth permutation (r=1, 2, …, p!) and seqR2({xi}|r) represents the sequential sum of squares for the regressor xi in the ordering of the regressors in the rth permutation.
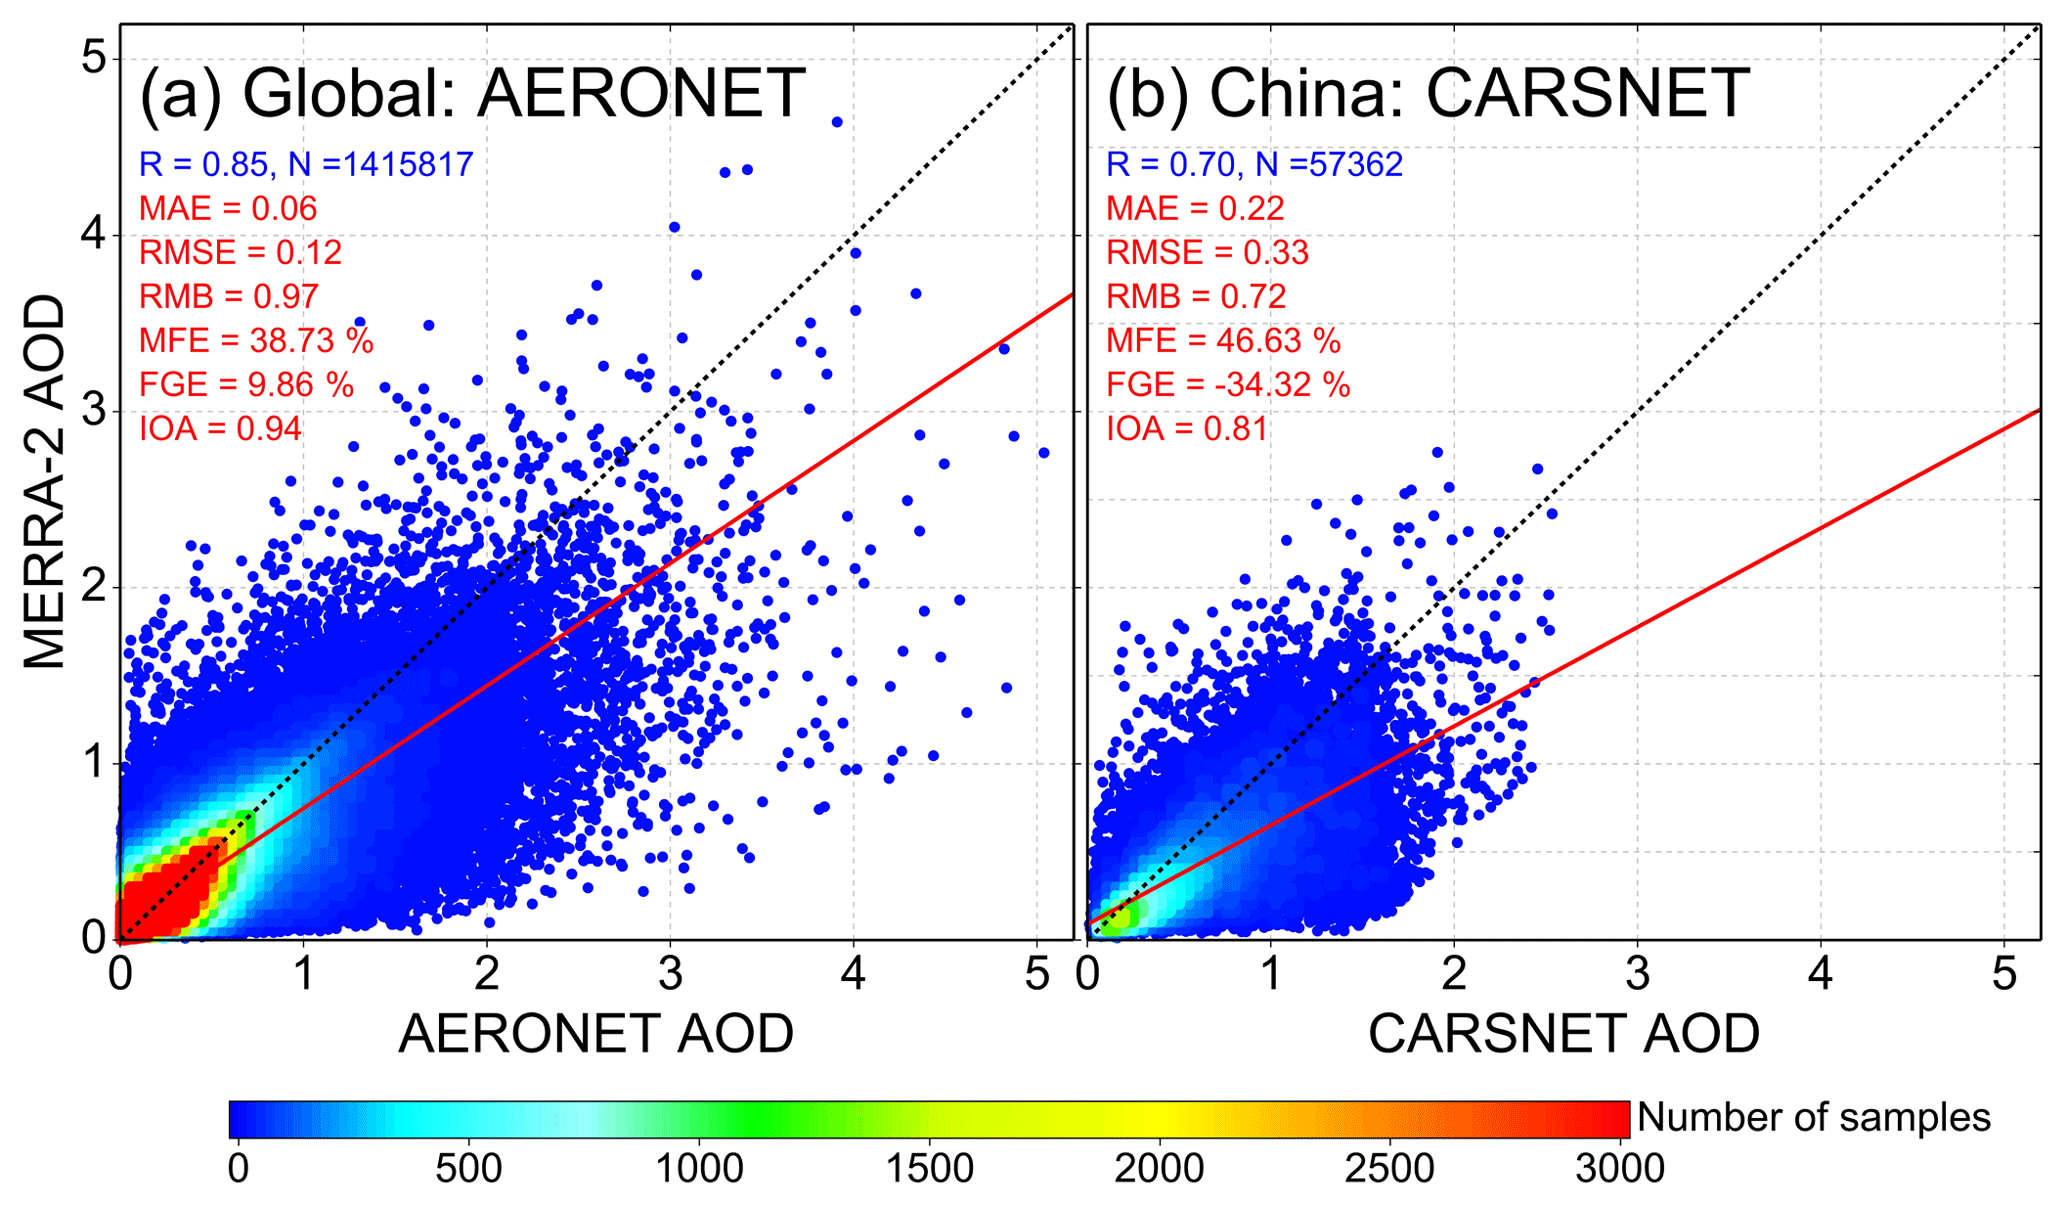
Figure 3Evaluation of the 3-hourly MERRA-2 AOD against the (a) AERONET and (b) CARSNET AODs. The color-coded dots indicate the number of samples. The solid red line is the line of best fit and the dashed black line is the 1 : 1 line. For descriptions of statistical metrics, see the comparison methods section.
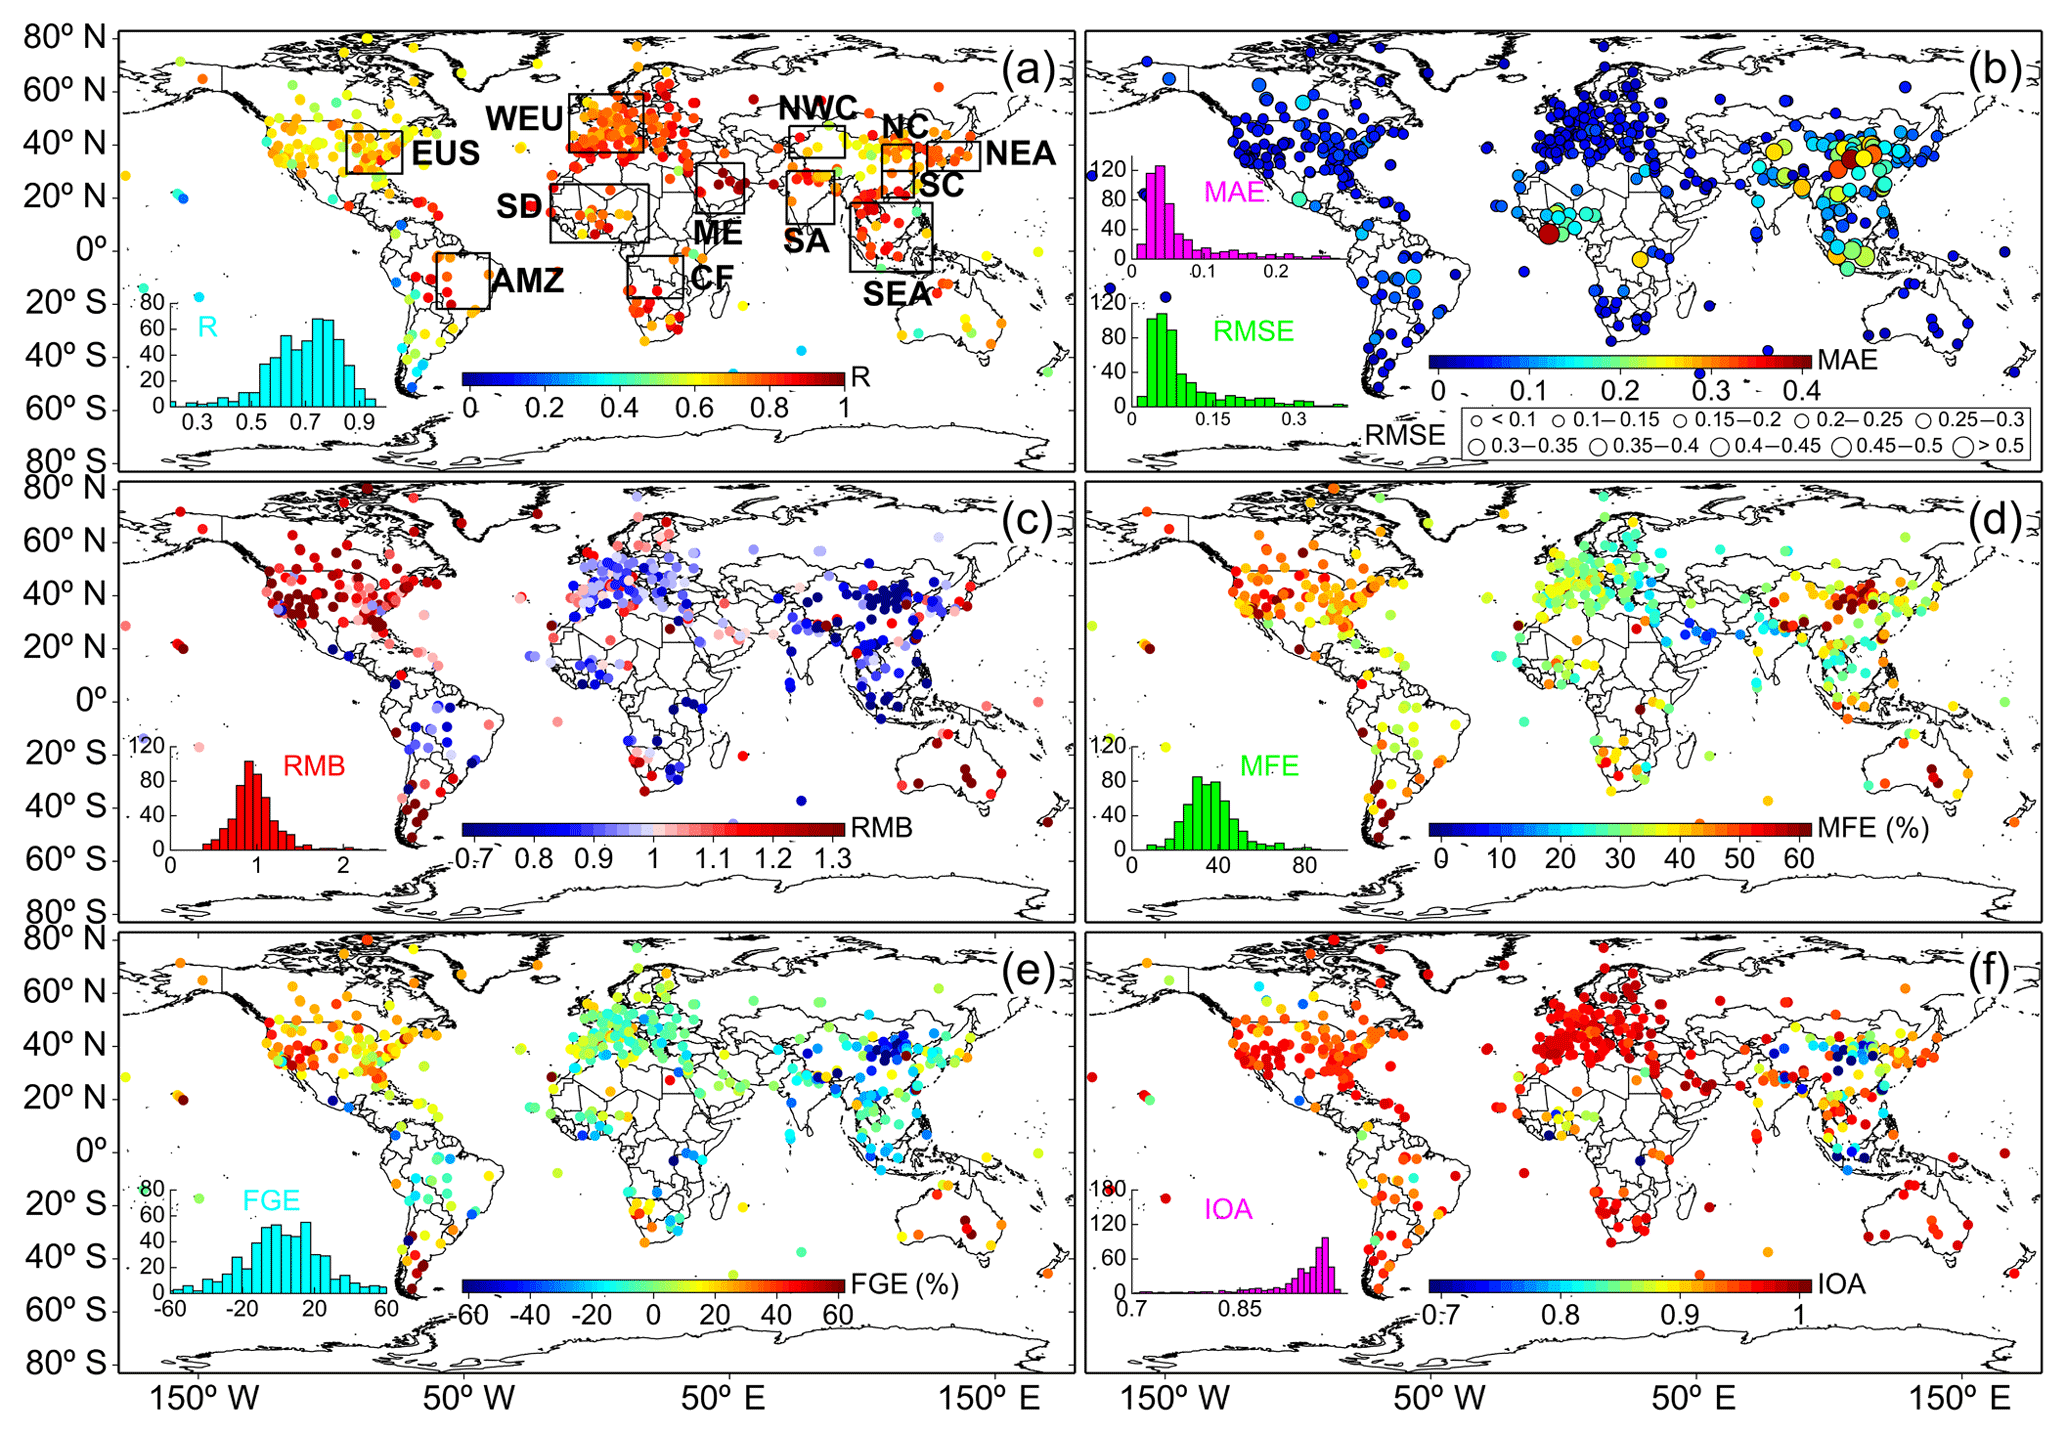
Figure 4Comparison of the 3-hourly MERRA-2 AOD datasets with AOD observations of 468 AERONET sites worldwide and 37 CARSNET sites in China: site performance maps for the (a) correlation coefficient (R), (b) mean absolute error (MAE), root-mean-square error (RMSE), (c) relative mean bias (RMB), (d) mean fractional error (MFE), (e) fractional gross error (FGE), and (f) the index of agreement (IOA) between MERRA-2 AOD and ground-based AOD observations. The size of the circles in (b) represents the RMSE and their inner color represents the MAE. The bars in the lower-left inset in each panel represent the frequency distribution histograms for the R, MAE, RMSE, RMB, MFE, FGE and IOA between MERRA-2 and all ground-based observations incorporating AERONET and CARSNET, respectively. Note that all sites within each region of interest (ROI) are integrated to assess the accuracy of the MERRA-2 AOD dataset in that area. The performance of the MERRA-2 AOD dataset in each ROI is illustrated in Figs. S2 and S3.
For a detailed introduction to and description of the calculation process of the LMG measure, refer to Grömping (2006). For all variables (including the AODs from MERRA-2, MISR, and MODIS/Terra; the meteorological variables from MERRA-2; and the emission estimates from PKU), the regional mean was calculated by averaging valid variable values over all grids within the 12 ROIs. For the seasonal analysis, the four seasons were considered as follows: spring (March–April–May), summer (June–July–August), autumn (September–October–November) and winter (December–January–February).
3.1 Assessing the performance of the MERRA-2 AOD datasets on the global scale
Although the official documentation points out that a large number of AOD observations have been assimilated into the system (Buchard et al., 2017), the global performance of MERRA-2 AOD is still unknown. In addition, since MERRA-2 assimilates a variety of AOD datasets from different observation periods (such as AVHRR before 1999, AERONET since 1999 and Earth Observing System (EOS) era satellites after 2000) (Buchard et al., 2017), it is difficult to disentangle the influence of each assimilated dataset alone on the overall accuracy of MERRA-2. Strictly speaking, we need to point out that MERRA-2 and AERONET are not independent of each other (after 1999). Nevertheless, we hope that this assessment will still provide some reference for other studies using the MERRA-2 AOD dataset. Therefore, we first use AERONET to evaluate the overall performance of MERRA-2 AOD on the global scale and then use CARSNET to independently examine the performance of the MERRA-2 analyzed AOD field in China.
Table 2Statistical measures of the 3-hourly MERRA-2 AOD vs. AERONET and CARSNET AODs over the 12 regions of interest.
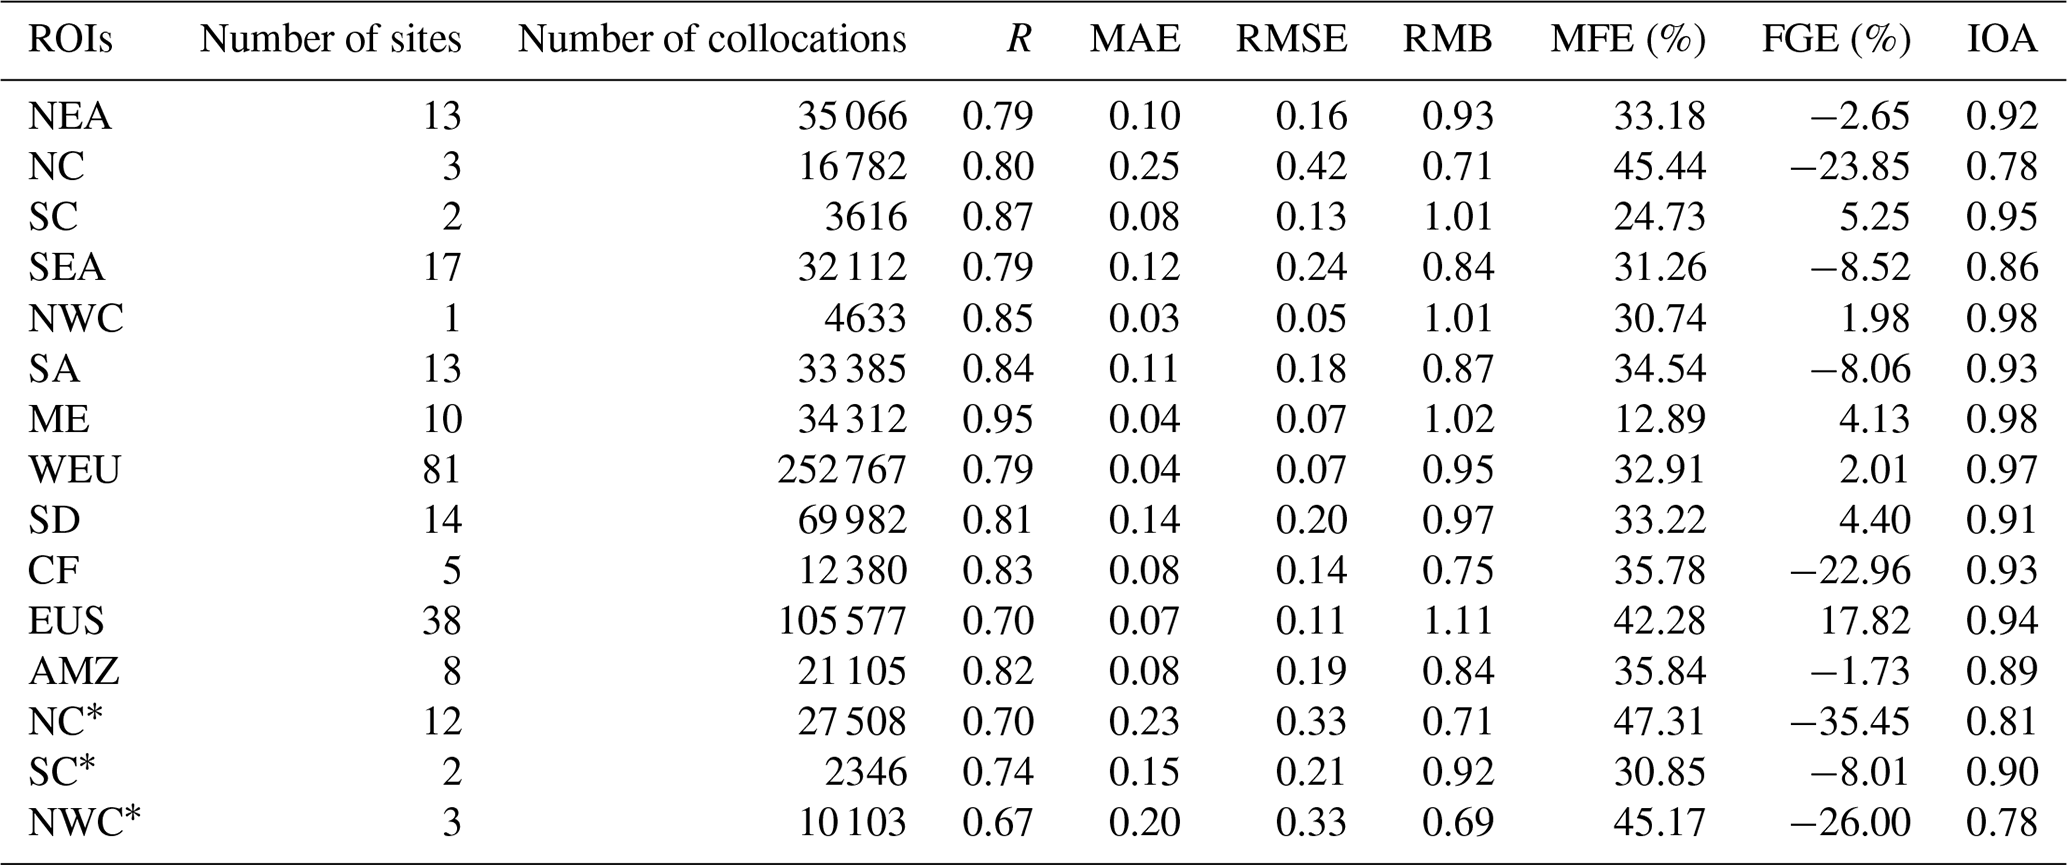
* Indicates the statistical results for CARSNET sites.
3.1.1 MERRA-2 vs. AERONET
Using all of the collected AERONET observations, the overall performance of the MERRA-2 AOD on a global scale was validated first. The results showed significant spatial agreement between MERRA-2 and ground-based AOD on the global scale, with an acceptable bias (r=0.85, RMSE = 0.12, MAE = 0.06 and MFE = 38.73 %) (Fig. 3a). Moreover, Fig. 4 shows site-to-site comparisons of the 3-hourly MERRA-2 AOD at 550 nm and the collocated AERONET AOD observations, and a statistical summary of the comparison and the location information for each site are given in Table S4. Globally, the MERRA-2 AOD datasets exhibited high R values against ground-based observations: over 83.3 %, 59.0 % and 28.0 % of sites had an R greater than 0.6, 0.7 and 0.8, respectively; 95.9 % and 87.6 % of sites had an IOA greater than 0.8 and 0.9, respectively; 85.3 % and 50.4 % of sites had an MAE lower than 0.1 and 0.05, respectively; 22.6 % and 59.8 % of sites had an MFE lower than 30 % and 40 %, respectively; and more than 69.9 % and 89.3 % of sites had an RMSE less than 0.1 and 0.2, respectively. These results indicated that, although MERRA-2 does not perform well in some individual regions, it does not affect the global accuracy of MERRA-2 as the latest global aerosol reanalysis dataset, especially in comparison with other satellite datasets. In addition, the obvious regional differences in the global performance of MERRA-2 AOD should not be overlooked. According to Fig. 4c and e, the RMB was greater than 1 and FGE was greater than 0 % in the United States, southern South America and Australia, which indicates that MERRA-2 overestimates the AOD in these regions. This overestimation may be attributed to the bias of MISR AOD in these areas (not shown here) and the fact that AERONET was not assimilated in MERRA-2 until 1999 (Buchard et al., 2017). In contrast, clear underestimation was found in other regions, such as the Amazon Basin, southern Europe, SA and SEA. This apparent underestimation (FGE %; see Fig. S2b) in NC was further confirmed using additional ground-based AOD observations from CARSNET (reported in the following section). Notably, this underestimation seems to be systematic, as negative RMB and FGE were found in most parts of the Northern Hemisphere, except the United States. Such systematic underestimation over these regions is likely due to the lack of nitrate aerosols in the GOCART model (Buchard et al., 2017). Furthermore, the underestimation seems to be more prominent in high nitrate emission areas such as NC and SA.
To ensure the accuracy of interannual variations in AODs over different ROIs (as defined in Fig. 1), the regional performance of MERRA-2 AOD was evaluated by integrating all sites within each ROI (Table 2 and Fig. S2). Regionally, R ranged from 0.7 to 0.95 among the 12 ROIs, with the highest R (0.95) occurring in the ME and the lowest (0.7) in the EUS. Similar to the site-to-site FGE distribution, the FGE presented a systematic overestimation in the EUS of around 17.82 %. In contrast, the FGE showed significant systematic underestimation in NC, SA, CF and SEA, with the degree of underestimation being 23.9 %, 8.1 %, 23.0 % and 8.5 %, respectively. Significant differences in these regions were also supported by small RMBs of 0.71, 0.87, 0.75 and 0.84, respectively.
The MERRA-2 AOD datasets performed better over SA than over NC, which is one of the most polluted areas in the world, in terms of a smaller MAE (0.11) and RMSE (0.18) (Fig. S2f). The better performance over SA is likely due to more AOD observations having been assimilated in MERRA-2 compared to over NC (Buchard et al., 2017). For NEA, SC and WEU, MERRA-2 AOD generally compared well to AERONET AOD, with the MAE being less than 0.1, MFE less than 35 % and RMB greater than 0.93. For the SD, results were relatively poor in that the MAE was greater than 0.1 and the RMSE greater than 0.2. Besides, although MERRA-2 performed well in NWC when only one AERONET site was used, after using additional CARSNET ground-based observations it was found that the MERRA-2 AOD performance in NWC needs to be improved (Fig. S3c). Notably, MERRA-2 was found to produce lower AOD than AERONET and the bias between them was more obvious for high AERONET AODs. For instance, the MERRA-2 AODs over most polluted areas (such as the anthropogenic-aerosol-dominant regions of NC and SA and the biomass-burning-dominant regions of SEA and South America) were almost always lower than those of AERONET when the AERONET AOD was greater than 1.5. This indicated that MERRA-2 does not capture all high AOD events well (such as serious haze events over NC and SA and frequent biomass-burning events over SEA), due to the following three reasons: (1) a relatively low quantity of ground-based-observed aerosol data that can be used for assimilation, (2) the MERRA-2 system model lacks an adequate source of anthropogenic emissions with high temporal resolution and (3) a lack of nitrate aerosols in the GOCART model (Chin et al., 2002; Colarco et al., 2010; Buchard et al., 2017).
3.1.2 MERRA-2 vs. CARSNET
Since CARSNET is not assimilated in MERRA-2, it is considered for independent verification. Using all of the collected CARSNET observations, the performance of the MERRA-2 AOD in China was validated. Statistical measures for MERRA-2 AOD at each CARSNET site are shown in Fig. 4 and Table S5, and those for regional performance (i.e., NEC, NC and SC) are shown in Table 2 and Fig. S3. In general, the comparison results using CARSNET as reference showed that the performance of MERRA-2 AOD in China (r=0.70, RMSE = 0.33, MAE = 0.22 and MFE = 46.63 %) is much worse than that of MERRA-2 AOD on a global scale (Fig. 3a). Regionally, compared with the results from using three AERONET sites as a comparison, the results comparing CARSNET and MERRA-2 AOD showed a similar pattern – that is, the underestimation of MERRA-2 AOD over NC is universal. MERRA-2 underestimated the AOD at almost all CARSNET sites (Fig. 4e and Table S5), with an overall MAE of 0.23, RMSE of 0.33, MFE of 47.3 % and underestimation of ∼ 35.5 % (Fig. S3a). Similar results based on CARSNET observations in China have also been reported in the literature (Song et al., 2018; Qin et al., 2018). Specifically, there was higher agreement over SC compared with NC (Fig. S3b), mainly because nitrate aerosols in China are mainly concentrated in industrially intensive areas such as Henan, Shandong, Hebei and the Sichuan Basin (Zhang et al., 2012). The lack of a nitrate module in the GOCART model will cause further AOD uncertainty in these above areas, which is the main reason behind the relatively low performance of MERRA-2 AOD in these areas.
The purpose of this work was to study the interannual or inter-decadal variations in AOD in different regions. Therefore, taking MODIS/Terra and MISR AOD as a reference, the accuracy of MERRA-2 annual-mean AOD was evaluated at global and regional scales (Figs. S4 and S5). Globally, the overall spatial correlations between the MERRA-2 AOD and MODIS/Terra and MISR AOD datasets was found to be quite acceptable, with no apparent disagreements in the annual AOD variations during 2001–2016 (Fig. S5). Besides, although an offset was found between MERRA-2, MODIS/Terra and MISR in terms of absolute values of AOD in some ROIs, the short-term tendency during the overlapping period was similar among the three datasets (Fig. S4). Because the aerosol retrieval algorithm based on satellite observation does not work well under cloudy conditions or for bright surfaces, there are always numerous missing values in satellite-retrieved AOD datasets. In contrast, not only is the accuracy of the MERRA-2 AOD dataset comparable with satellite observations (Fig. S4), it also provides a complete AOD record from 1980 to the present day. These reasons give confidence that the MERRA-2 aerosol dataset is suitable for analysis of the variations in AOD. Thus, the AOD values from MERRA-2's aerosol analysis fields, in combination with the AOD datasets derived from two satellite sensors, were used to comprehensively analyze the spatiotemporal variability of aerosols at global and regional scales.
3.1.3 Global AOD distribution and interannual evolution of regional AOD
Figure S6 shows the global annual- and seasonal-mean AOD distribution calculated from the MERRA-2 AOD products during 1980–2016. Furthermore, the distributional characteristics of the global annual-mean AOD from MERRA-2, MODIS and MISR during the same period (2001–2016) are also compared in the figure. The comparison shows that, although MISR underestimated the AOD (e.g., in SA and eastern China), as expected because of insufficient sampling (Mehta et al., 2016; Kahn et al., 2009), the three AOD products were generally closely consistent on the global scale (also see Fig. S5). Generally, high AOD loading was mainly observed in areas of high anthropogenic and industrial emissions, such as in eastern China and India, and major source areas of natural mineral dust – particularly the Saharan, Arabian and Taklimakan deserts.
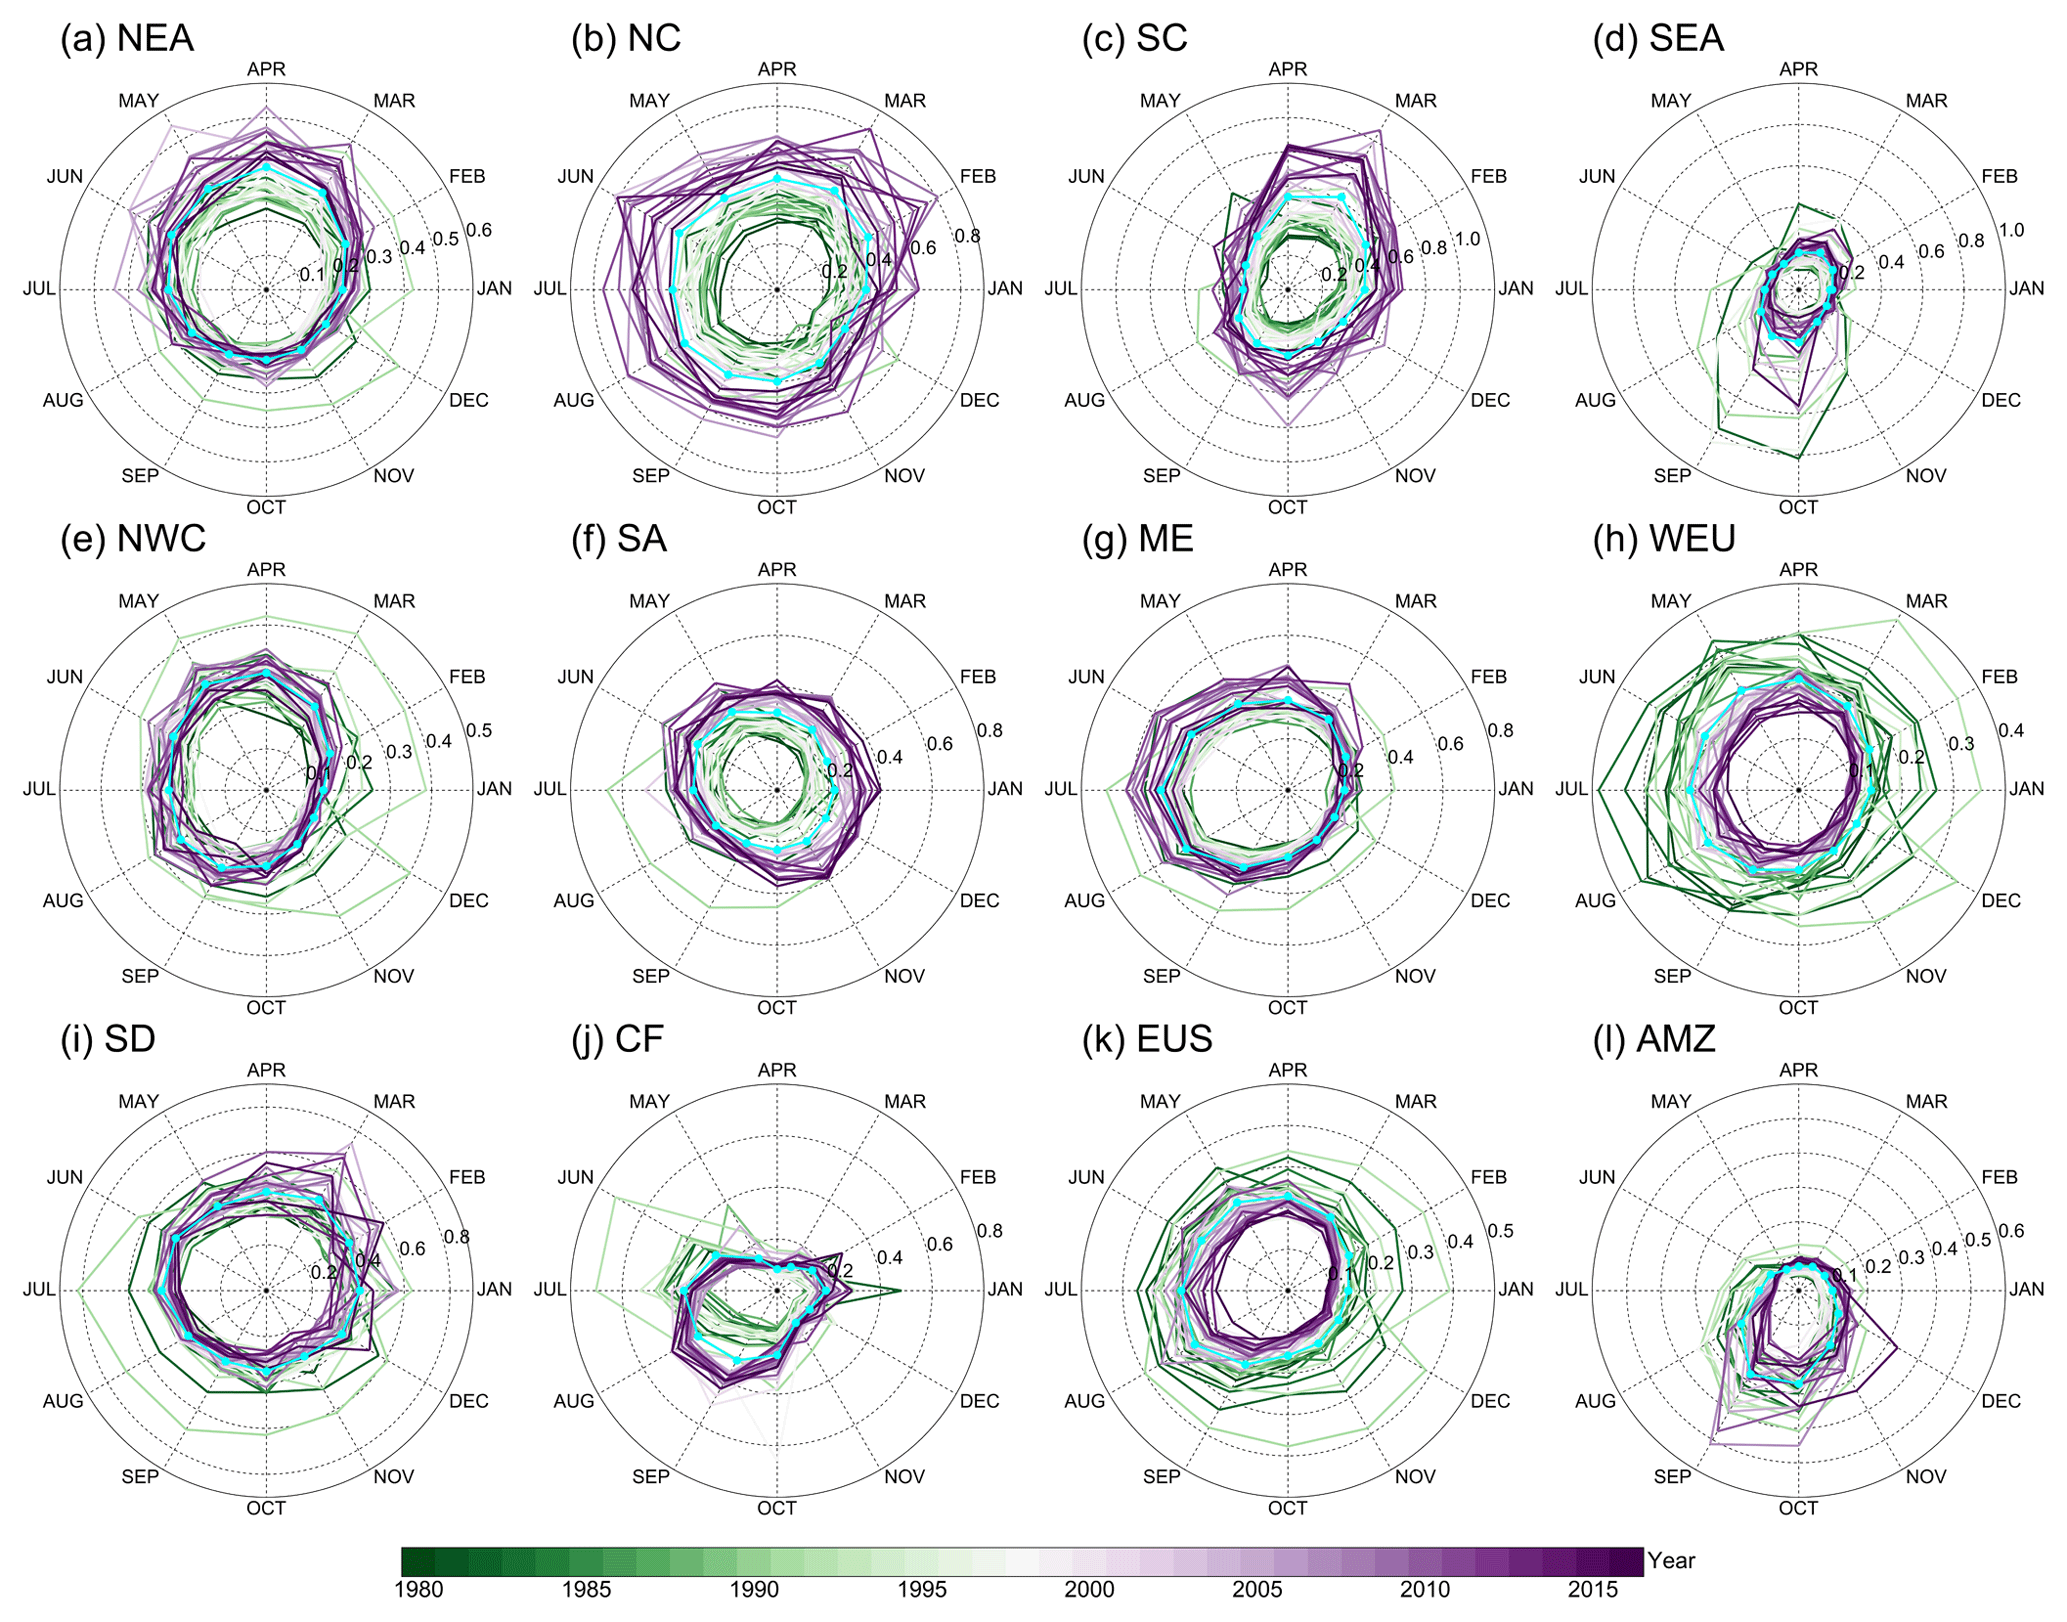
Figure 5Temporal evolution of regional monthly averaged AOD for the 12 regions of interest. Each year is represented by an irregular ring with 12 directions. Each direction of the ring represents a specific month, the distance from the center of the ring represents the regional monthly mean AOD value and the color of the ring represents the year. A special cyan-colored ring represents the monthly mean AOD for the period 1980–2016.
Due to the seasonal variation in the atmospheric circulation driven by solar radiation and the intensity of human activities in different regions, the global distribution of AOD also shows obvious seasonal differences, with global aerosol loading reaching its maximum in spring and summer. On the one hand, this can mainly be attributed to the enhanced circulation in spring and summer, which increases the likelihood of natural mineral dust from several major dust sources in the Northern Hemisphere (i.e., the Sahara and Sahel, the Arabian Peninsula, Central Asia, and the Taklimakan and Gobi deserts) being brought into the atmosphere; additionally, along the westerly belt airflow dust can be transmitted to surrounding sea areas (such as the strip of the northern tropical Atlantic stretching between West Africa and the Caribbean, the Caribbean, the Arabian Sea, and the Bay of Bengal) and more remote areas (such as South America; the Indo-Gangetic Plain; and the eastern coastal areas of China, Korea, and Japan) (Mao et al., 2014). On the other hand, higher temperatures and damp air in summer can create favorable conditions for the hygroscopic growth and secondary formation of aerosols (Minguillón et al., 2015; Zhao et al., 2018), which raises the AOD in some areas, such as NC and northern India, dominated by anthropogenic aerosol emissions in summer. Moreover, frequent local biomass-burning aerosol emissions in central Africa during summer are the main cause of high AOD in the region (Tummon et al., 2010).
In contrast, global aerosol loading is relatively low in autumn and winter. The atmosphere in autumn and winter is generally more stable and vertical mixing is weaker, and thus it is difficult for more aerosols – particularly natural mineral dust – to be brought into the atmosphere, which leads to lower AOD in autumn and winter (Zhao et al., 2018). Nevertheless, the AOD in autumn in South America, SEA, SC and CF is clearly high, which is mainly attributable to the emission of large amounts of fine aerosol particles (i.e., BC and OC) from frequent biomass burning in these regions (Thornhill et al., 2018; Ikemori et al., 2018; Chen et al., 2017). Notably, fine particulate matter composed of sulfate–nitrate–ammonium aerosols, which is produced by high-intensity anthropogenic activities in autumn and winter, is still the main contributor to high AOD in eastern China and India (Gao et al., 2018; David et al., 2018).
To better characterize the temporal evolution of regional AOD, the monthly mean AODs over the 12 ROIs from 1980 to 2016 were calculated. As illustrated in Fig. 5, the monthly regional AOD had large seasonal variability, in addition to varying degrees of fluctuation in different periods. In areas dominated by smoke aerosols from biomass burning (i.e., AMZ, CF and SEA), biomass-burning events tend to occur in the warm season (May–October), leading to a more prominent monthly AOD at this time of the year compared with the cold season (November–April). It is noteworthy that MERRA-2 also captured several well-known forest-fire events, such as those in Indonesia in 1983 and 1997, which have been proven to be mainly related to climatic drying caused by El Niño and large-scale deforestation (Page et al., 2002; Goldammer, 2007). In the CF region, the monthly mean maximum AOD experienced a transformation process – that is, the monthly maximum AOD often occurred in June and July before 2000, whereas after 2000 it occurred more frequently in August and September. This shift may be attributed to the fact that MERRA-2 did not assimilate any land-based AOD observations before 1999, which made it difficult for the model to simulate the monthly variation in regional AOD (Gelaro et al., 2017; Buchard et al., 2017). In the AMZ and SEA regions, September and October seem to be the two most frequent months for the occurrence of high AOD values, but the magnitude of AOD values has decreased in recent years, which may be related to changes in meteorological conditions (Torres et al., 2010).

Figure 6Spatial distributions of the linear trends in annual and seasonal MERRA-2 AOD calculated from the time series value of the deseasonalized monthly anomaly during (a) 1980–2016, (b) 1980–1997 and (c) 1998–2016. Only trend values with statistical significance at the 95 % confidence level are shown.
In areas dominated by natural mineral dust aerosol (i.e., the SD, the ME and NWC), the monthly maximum AOD mainly occurred in March–August. Before 2000, there were many anomalies in the AOD monthly maximum, which also implied frequent sandstorms. In contrast, the frequency of monthly AOD anomalies decreased after 2000, which may be attributable to the reduced surface wind speed and increased vegetation cover (Kim et al., 2017; Wang et al., 2018; An et al., 2018). Compared with the areas dominated by smoke and dust aerosols, the seasonal differences of AOD in the areas dominated by anthropogenic aerosol emissions appear to be smaller, but their temporal evolution is more pronounced. In NEA, the monthly maximum AOD often occurred in March–June, possibly related to the long-distance transportation of sand and dust in the China–Mongolia deserts (Taklimakan and Gobi). However, as the frequency of sandstorms has decreased in the past 10 years (An et al., 2018), the monthly maximum AOD has also shown a downward trend. In NC and SA, the monthly AOD has gradually expanded outward since 1980, indicating that AOD has experienced a gradual increase. Monthly AOD had large seasonal variability in the SC region, reaching its maximum in February–April. The increased aerosol emissions from biomass burning in spring seem to be one of the main reasons for high AOD in the SC region (Chen et al., 2017). For the EUS and WEU regions, the characteristics of the monthly variation in AOD were similar, i.e., large values of AOD occurred in summer. With time, the monthly AOD showed a tendency to gradually shrink inwards, suggesting AOD has experienced a significant decline over the past few decades in the EUS and WEU. The main drivers of the interannual variability of AOD over each ROI are discussed in detail in Sect. 3.5 and 3.6.
3.2 Global AOD trend maps
Annual and seasonal linear trends of the MERRA-2 AOD anomaly were separately calculated for each grid cell for the whole of 1980–2016 period (period 1) and for the first 18 years (1980–1997, period 2) and last 19 years (1998–2016, period 3). Figure 6 shows the spatial distribution of these trends on the global scale. Throughout period 1, the regions where annual AOD showed a significant upward trend (p<0.05) were mainly located in eastern China, SA, the ME, northern South America and the southern coastal areas of Africa, whereas some significant downward trends were observed in the whole of Europe and the EUS. However, compared with the annual trends, the seasonal AOD trends had obvious regional differences in terms of their spatial distribution. For instance, a strong positive trend throughout East Asia, including Korea and Japan, was found in spring. In summer, there was a significant upward and downward AOD trend in Siberia (and other areas of Asian Russia) and the Amazon basin, respectively. In contrast, winter AOD had a significant downward trend in the area north of 40∘ N. These differences in seasonal trends are closely related to the seasonal variations in anthropogenic aerosols generated by local emissions and natural aerosols driven by meteorological conditions (De Meij et al., 2012; Chin et al., 2014).
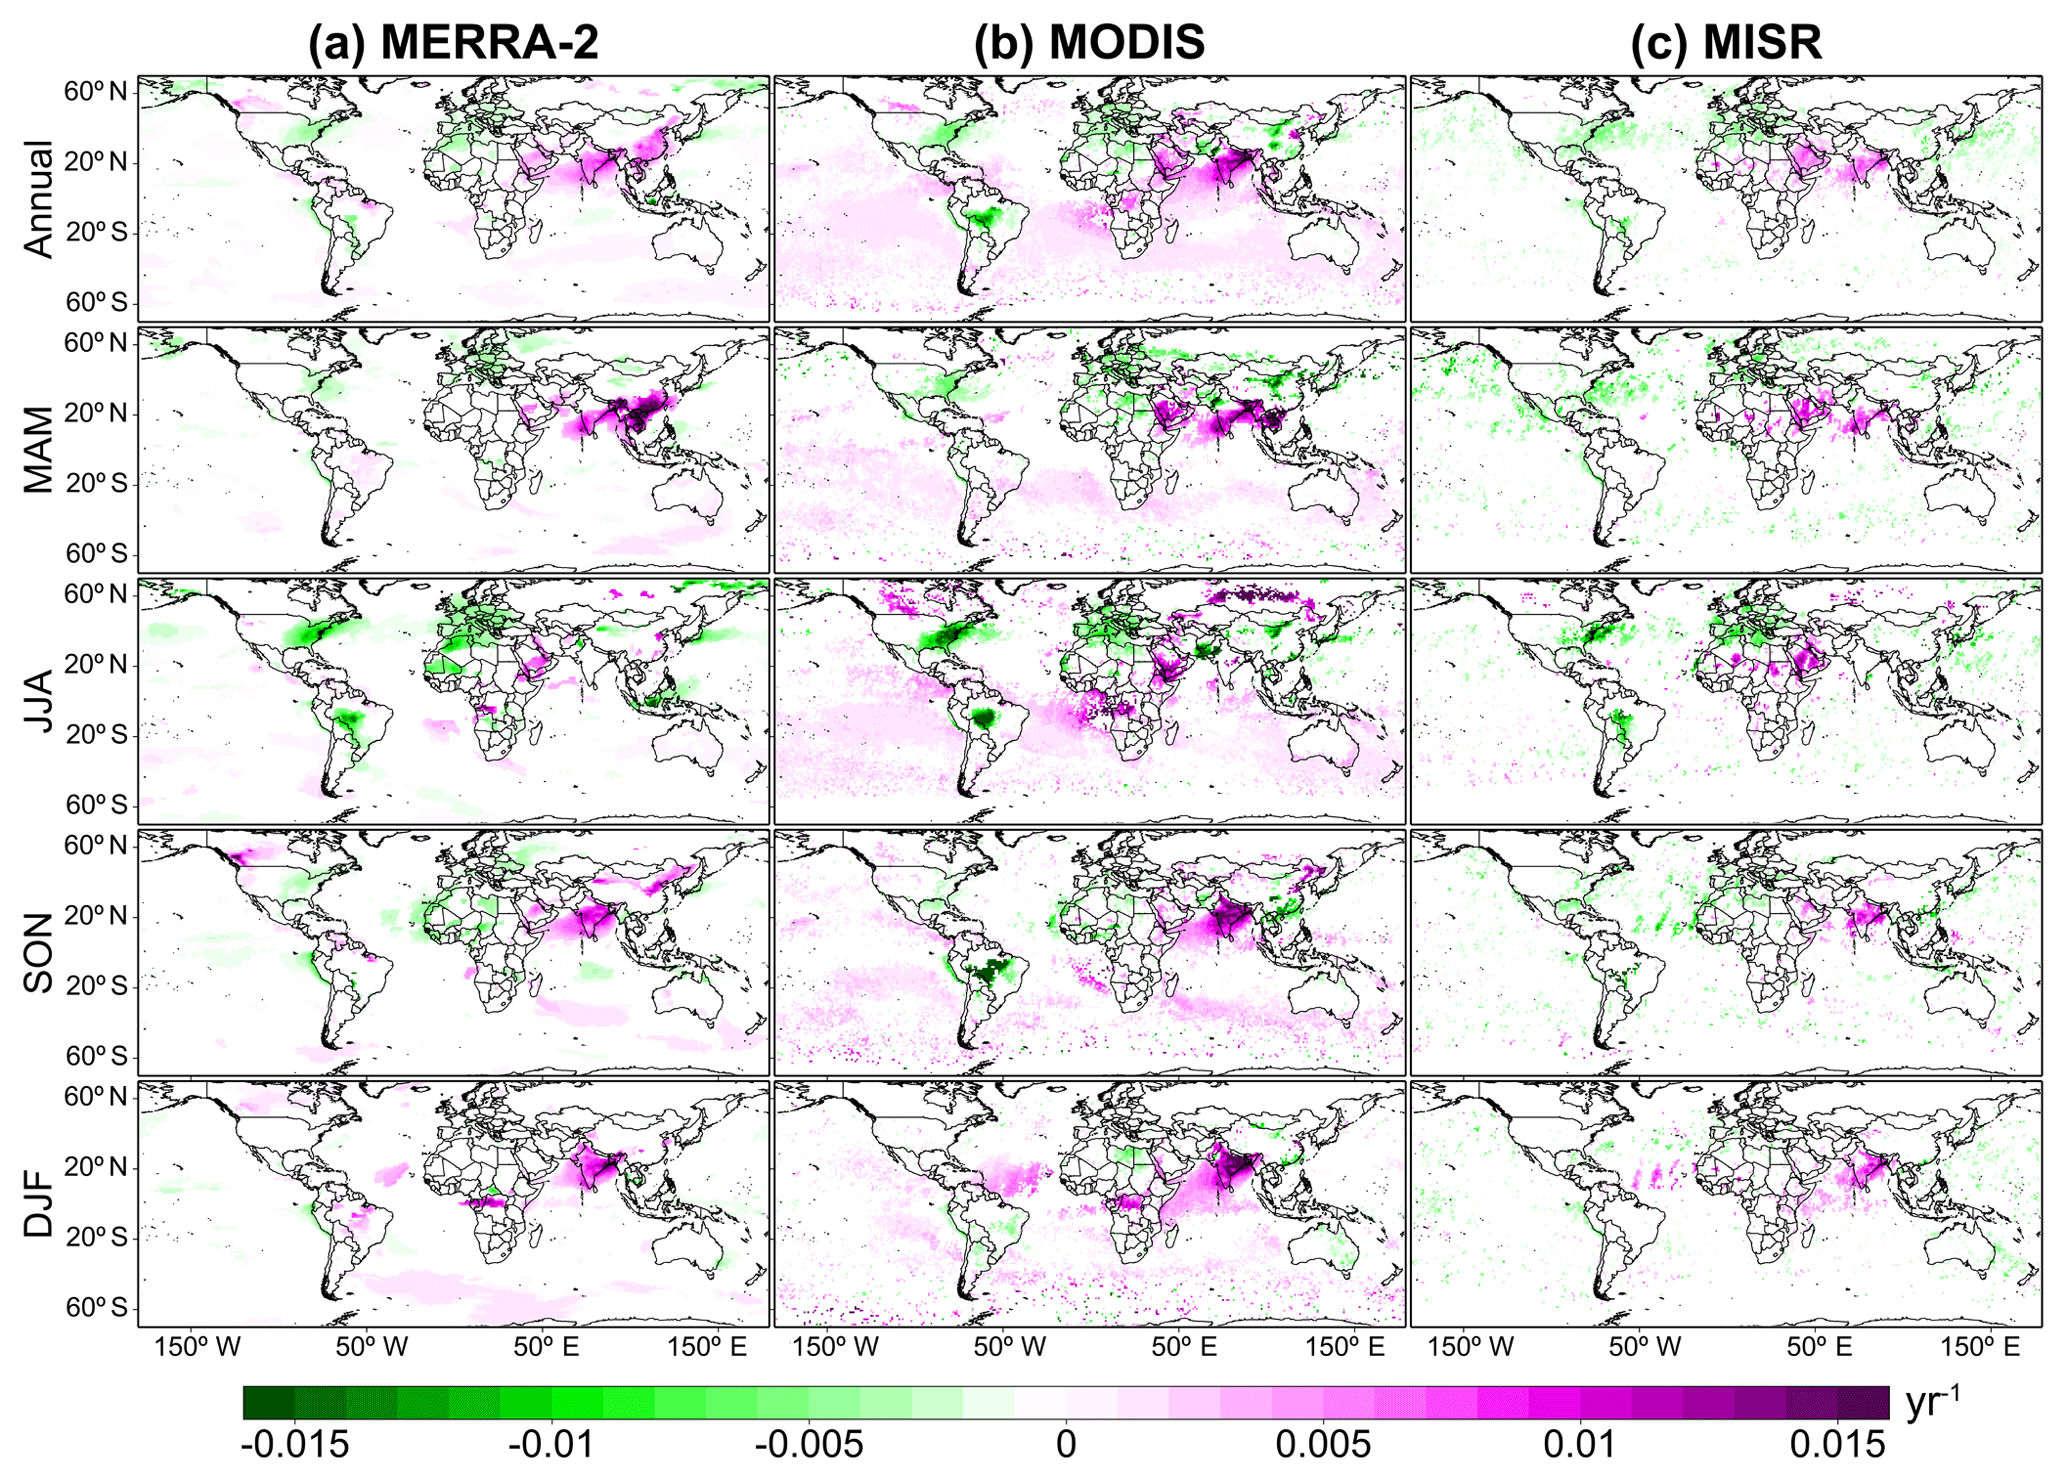
Figure 7Spatial distributions of annual and seasonal trends in AOD calculated from the time series value of the deseasonalized monthly anomaly from (a) MERRA-2, (b) MODIS/Terra, and (c) MISR between 2001 and 2016. Only trend values with statistical significance at the 95 % confidence level are shown.
In the two different historical periods (i.e., period 2 and 3), these trends seem to have experienced a remarkable shift. During period 2, the annual AOD had a significant upward trend throughout the Southern Hemisphere, and similar upward trends also existed in eastern and northwestern China. This upward trend in the Southern Hemisphere, which was most likely associated with two giant volcano eruption events in the early 1980s (El Chichón, Hofmann and Rosen, 1983) and early 1990s (Pinatubo volcanoes, Stenchikov et al., 1998; Bluth et al., 1992; Kirchner et al., 1999), is also reflected in the regional annual mean AOD time series shown in Fig. S4. The eruptions led to a strong increase in volcanic ash and SO2 emissions, consequently increasing AODs from place to place via airflow transport, which was captured accurately by MERRA-2. Meanwhile, AOD had a significant downward trend throughout Europe and the EUS, which appears to be related to the reduction of TSP and SO2 emissions (see Sect. 3.5). Seasonally, a significant upward trend seems to be prevalent in all seasons in the Southern Hemisphere. Compared with other seasons, the decline of AOD was more obvious in Europe and America. In winter, except for the positive trend that still existed in the marine area of the Southern Hemisphere, the fluctuations in other regions were smaller and relatively stable.
During period 3, AOD began to show a significant upward trend in most regions, especially in SA, SEA, the ME, central Russia, the western United States and northern South America, while still maintaining an upward trend in eastern China with greater intensity. These upward trends over SA, the ME and eastern China are in good agreement with the results of Hsu et al. (2012), who used SeaWiFS AOD records from 1997 to 2010. It is worth noting that the trends for the whole of Europe shifted from significantly positive to statistically insignificant, while the region that had shown a significant downward trend before 1997 in the EUS was also shrinking. Furthermore, the region showing a positive trend, prevailing in the Southern Hemisphere, shrunk dramatically. Similarly, the spatial distribution of the trend also had significant differences in different seasons of this period. In spring and winter, only significant upward trends could be observed on a global scale, mainly in eastern China, SA, the ME and South America. Conversely, significant downward trends were apparent in the EUS, northwestern Africa and central South America in summer. Additionally, it was also found that the region with a significant downward trend in Africa shifted from the northwest in summer to the southwest in autumn. The joint effect of the changes in local emissions and meteorological conditions determined these trends in these regions. See Sect. 3.5 for a more detailed explanation.

Figure 8Intercomparisons of global and regional annual trends in AOD calculated from the time series value of the deseasonalized monthly anomaly of MERRA-2, MODIS/Terra and MISR, during the four periods of 1980–2016, 1980–1997, 1998–2016 and 2001–2016. Error bars represent the uncertainty associated with the calculated trend. The hatched trend bars indicate statistical significance at the 95 % confidence level.
Ensuring the accuracy of AOD trends calculated by MERRA-2 is critical for quantifying the contribution of local emissions and meteorological factors to the inter-decadal variation in AOD in different regions. For comparison, the resulting annual and seasonal trends of the MERRA-2, MODIS/Terra and MISR AOD anomaly over the whole globe were derived, using the same method, between 2001 and 2016; the results are shown in Fig. 7. This comparison shows that the AOD trends during 2001–2016 calculated by MERRA-2 in most regions of the world agreed well with the results of MODIS and MISR, on both annual and seasonal timescales. Although MERRA-2 assimilates MODIS and MISR at the same time, the relatively small difference between MERRA-2 and MISR may be mainly due to the insufficient sample size of MISR (MODIS produces 3 to 4 times more data than MISR) (De Meij et al., 2012).
For the annual trend, the significant upward trend observed by MODIS/Terra and MISR in SA and the ME and the significant downward trend observed in the EUS, WEU and central South America were consistent with the results of the MERRA-2 trend. Similar trends were reported in a previous study based on 14 years (2001–2014) of observational records (Mehta et al., 2016). Similarly, upward trends also existed in spring, autumn and winter, while downward trends were also apparent in spring, summer and autumn. It should be noted that the trend signals calculated from MERRA-2 and MODIS/Terra were opposite in SC. The difference in sign associated with trends during 2001–2016 could mainly be due to the larger deviation between MERRA-2 and MODIS/Terra between 2001 and 2004 (Fig. S4c). The large deviation directly led to a reversal of trend throughout the period 2001–2016. This deviation may be related to the use of different versions of MODIS data: in the MERRA-2 AOD observing system, MERRA-2 assimilated the bias-corrected AOD derived from MODIS radiances, Collection 5 (C5; Buchard et al., 2017), and the MODIS data used in this study was the latest collection (Collection 6.1, C6). Different versions mean differences in algorithms (Fan et al., 2017), which may affect the statistical error.
3.3 Regional AOD trends
To examine the spatial and temporal changes in more detail, the annual trend over the globe and in the 12 ROIs, derived based on MERRA-2 during periods 1, 2 and 3, were calculated. In addition, for comparison purposes, the regional trends in AODs from MERRA-2, MODIS and MISR during 2001–2016 were also estimated. It should be noted that different datasets may have a certain effect on global and regional trend assessment due to their own uncertainties. Nevertheless, we include them for completeness but exercise caution when interpreting the differences in trend values between different datasets. The comparisons of the magnitudes of global annual trends with these regional trends are summarized in Fig. 8 and Table S1. In general, the annual trends derived from different datasets were small on the global scale. As indicated by the results in Fig. 8 and Table S1, the trend values were −0.00068 yr−1 for the globe during period 1, with statistical significance at the 95 % confidence level. In contrast, no statistically significant trend was detected at the global scale for period 2 (0.00050 yr−1) or 3 (0.00038 yr−1). Analyzing the global AOD trends during 2001–2016 from MERRA-2 and the two satellite datasets, it was found that the MERRA-2 trends were negligible, whereas significant positive (negative) trends were found for MODIS (MISR).
However, the trends could be considerable on regional scales. For example, over the anthropogenic-aerosol-dominant regions for periods 1, 2 and 3, strong positive trends were apparent over NEA, NC, SC and SA, while strong and statistically significant negative trends were found over WEU and EUS. For biomass-burning regions (SEA, CF and AMZ but not CF, which had a negligible and insignificant trend), there was a positive trend during periods 1, 2 and 3. For the mineral-dust-dominant regions, although there seemed to be an upward trend over the ME, the estimated trends were not statistically significant for other areas, such as NWC and the SD. During 2001–2016, the estimated MERRA-2 AOD trend in most ROIs (i.e., NEA, SA, ME, WEU, EUS and AMZ) was comparable to and had the same sign as the trend from both the MODIS and MISR sensors. However, it was opposite in sign to the MISR data over NC, NWC and the SD and to the MODIS data over SC, SEA and CF during overlapping years. These differences in global trends between MERRA-2 and satellites may be related to several aspects, including the difference in sample number, data accuracy, different measurement methods, etc. (De Meij et al., 2012).
In addition to the annual trend, the seasonal trend of AOD for different datasets in different ROIs and different historical periods was also studied (Fig. S7 and Table S1). Globally, negative trends were observed throughout the four seasons during period 1, especially during summer, autumn and winter (−0.00078, −0.00092 and −0.00097 yr−1, respectively; statistically significant at the 95 % confidence level). In contrast, there was a negative trend in period 2, although it was not significant. In the subsequent period, period 3, the trend values shifted from negative to positive. The positive trend was more significant in spring and autumn (0.00053 and 0.00070 yr−1). Regionally, strong positive trends were apparent over both NC and SC throughout the four seasons during periods 1, 2 and 3. Strong upward trends were also found over SA. These upward trends were most likely associated with an increase in urban and industrial pollution in China and India. Meanwhile, some similar but relatively moderate upward trends also existed over NEA in spring. In contrast, strong negative trends were observed over the WEU and EUS regions, especially during spring, summer and autumn. The negative trends over WEU and the EUS may partly have been due to a decrease in polluting aerosols associated with emission control measures (De Meij et al., 2012; Li et al., 2014). A statistically significant upward trend was also found over the SD, NWC and the ME in spring during periods 1, 2 and 3 (0.00252, 0.00300 and 0.00463 yr−1), respectively. In contrast to the strong downward trends over AMZ in summer during periods 1, 2 and 3, there appeared to be upward trends in spring over AMZ and in winter over CF and AMZ. When compared with the regional trends during 2001–2016 calculated by the two satellite datasets, we found that the seasonal trends of MERRA-2 were highly consistent with the satellite results in almost all regions, especially in spring and autumn. It is worth noting that the trend differences among the three different datasets in all four seasons still existed in NC and SC, and the differences had different seasonal characteristics. For example, over NC, the most significant difference occurred in spring and summer, whereas it occurred in summer and winter over SC. Seasonal differences in trends are mainly due to insufficient accuracy of MERRA-2 in China (see Sect. 3.1.2).
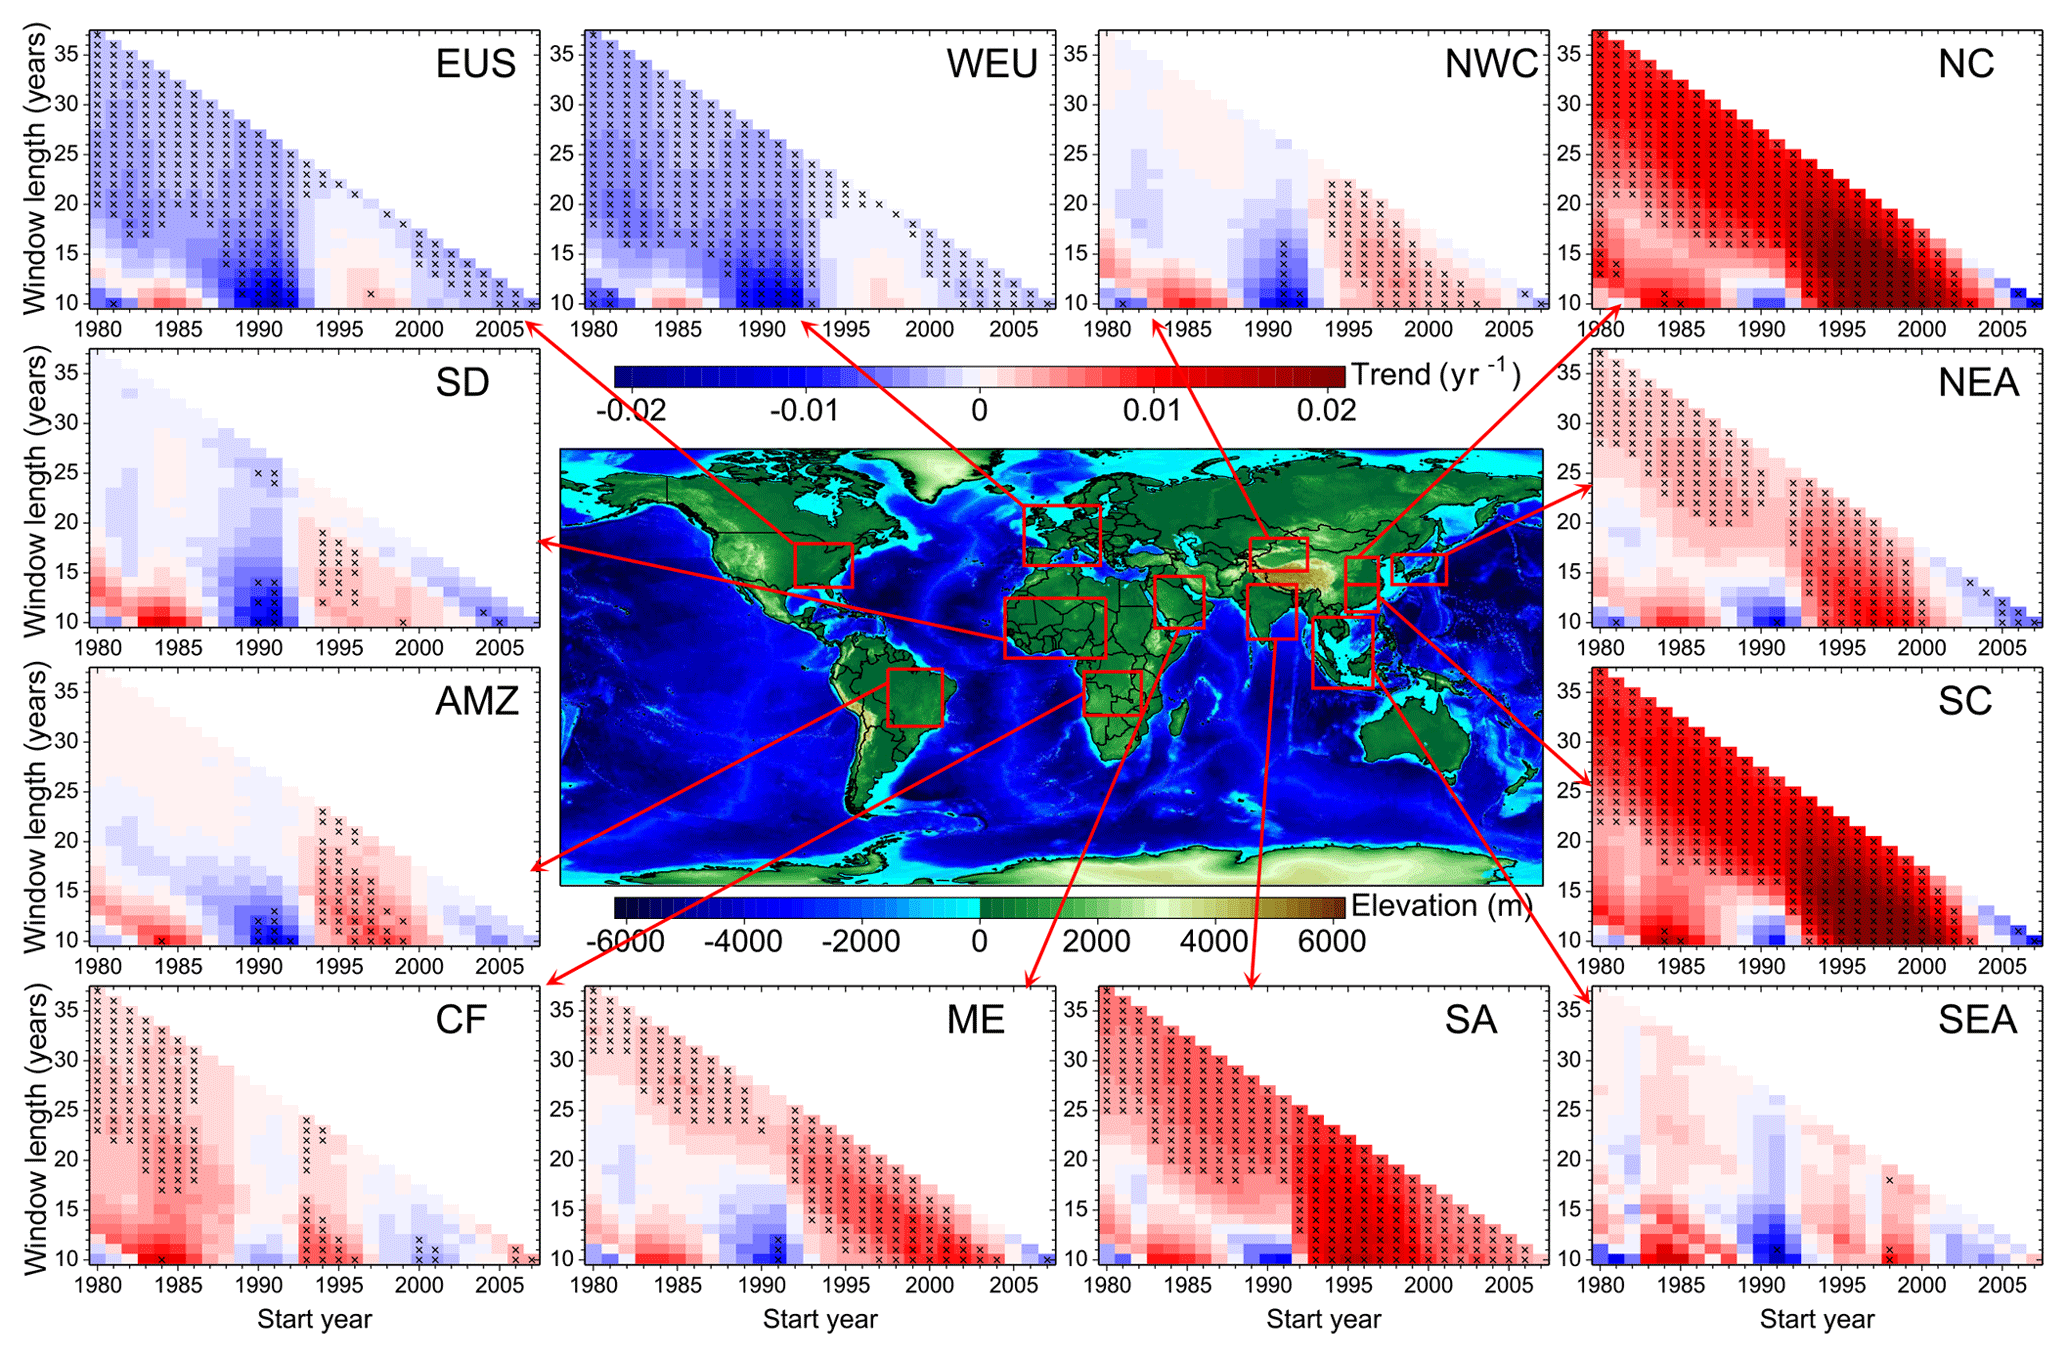
Figure 9Sliding-window trend analyses of the annual mean MERRA-2 AOD from 1980 to 2016 over the 12 ROIs (see Fig. 1 for names and locations of regions), with at least 10 years used to calculate trends. The x axis and y axis indicate the start year and the length of the time series to calculate the trend, respectively. The colors of the rectangles represent the intensity of the trend (units: yr−1) and those with black “x” signs indicate linear trends above the 95 % significance level.
Since the sign of a trend value often varies with the span of the calculation period, it was necessary to evaluate the sliding trend of different periods to help examine the time node of the changes more precisely. Therefore, sliding trend analyses were used to present a more comprehensive analysis of annual trends over the 12 ROIs during different historical periods (Fig. 9). These trends were calculated for all periods, starting each year from 1980 to 2007 and ending in 2016 with increments of at least 10 years. As shown in Fig. 9, in the EUS and WEU the AOD experienced a large decline up until the 1981–1990 period, then the trend reversed moderately from 1984 to 1986, declined sharply from 1989 after a short increase from 1996 to 1999 and sustained a moderate downward trend in the last 17 years. A similar pattern was found for NWC, the SD and AMZ, although there was a stronger upward trend and relatively weaker downward trend in the corresponding period. In SC and NC, the AOD experienced a slight increase in the 1980s and a short-term decline around the 1990s, and then showed its largest positive trend since 1995, before reversing sharply over the last 10 years (Sun et al., 2019). A similar evolution also existed in NEA and the ME, although the intensities of the trends were relatively weak. In addition to the negligible downward trend in the 1980s and 1990s, SA showed overall positive trends throughout the period, corresponding to increasing anthropogenic emissions (Fig. 11). Furthermore, in CF, a moderate increasing trend was detected from 1983 to 1985 and then again in 1990, and the trends became relatively stable but unexpectedly showed sharp increases after 1993, followed by a significant decline in the 2000s and reversal in the last 10 years. The trends for SEA were much smaller and relatively stable. Also, note that around 1985 and 1990 two distinct opposite trend signs were found in all regions. These two unexpected trends indicated that large volcanic eruptions not only greatly affect short-term changes in local aerosols but also impose different degrees of disturbance in long-term trends of aerosols in different regions of the world (Hofmann and Rosen, 1983; Stenchikov et al., 1998; Kirchner et al., 1999).
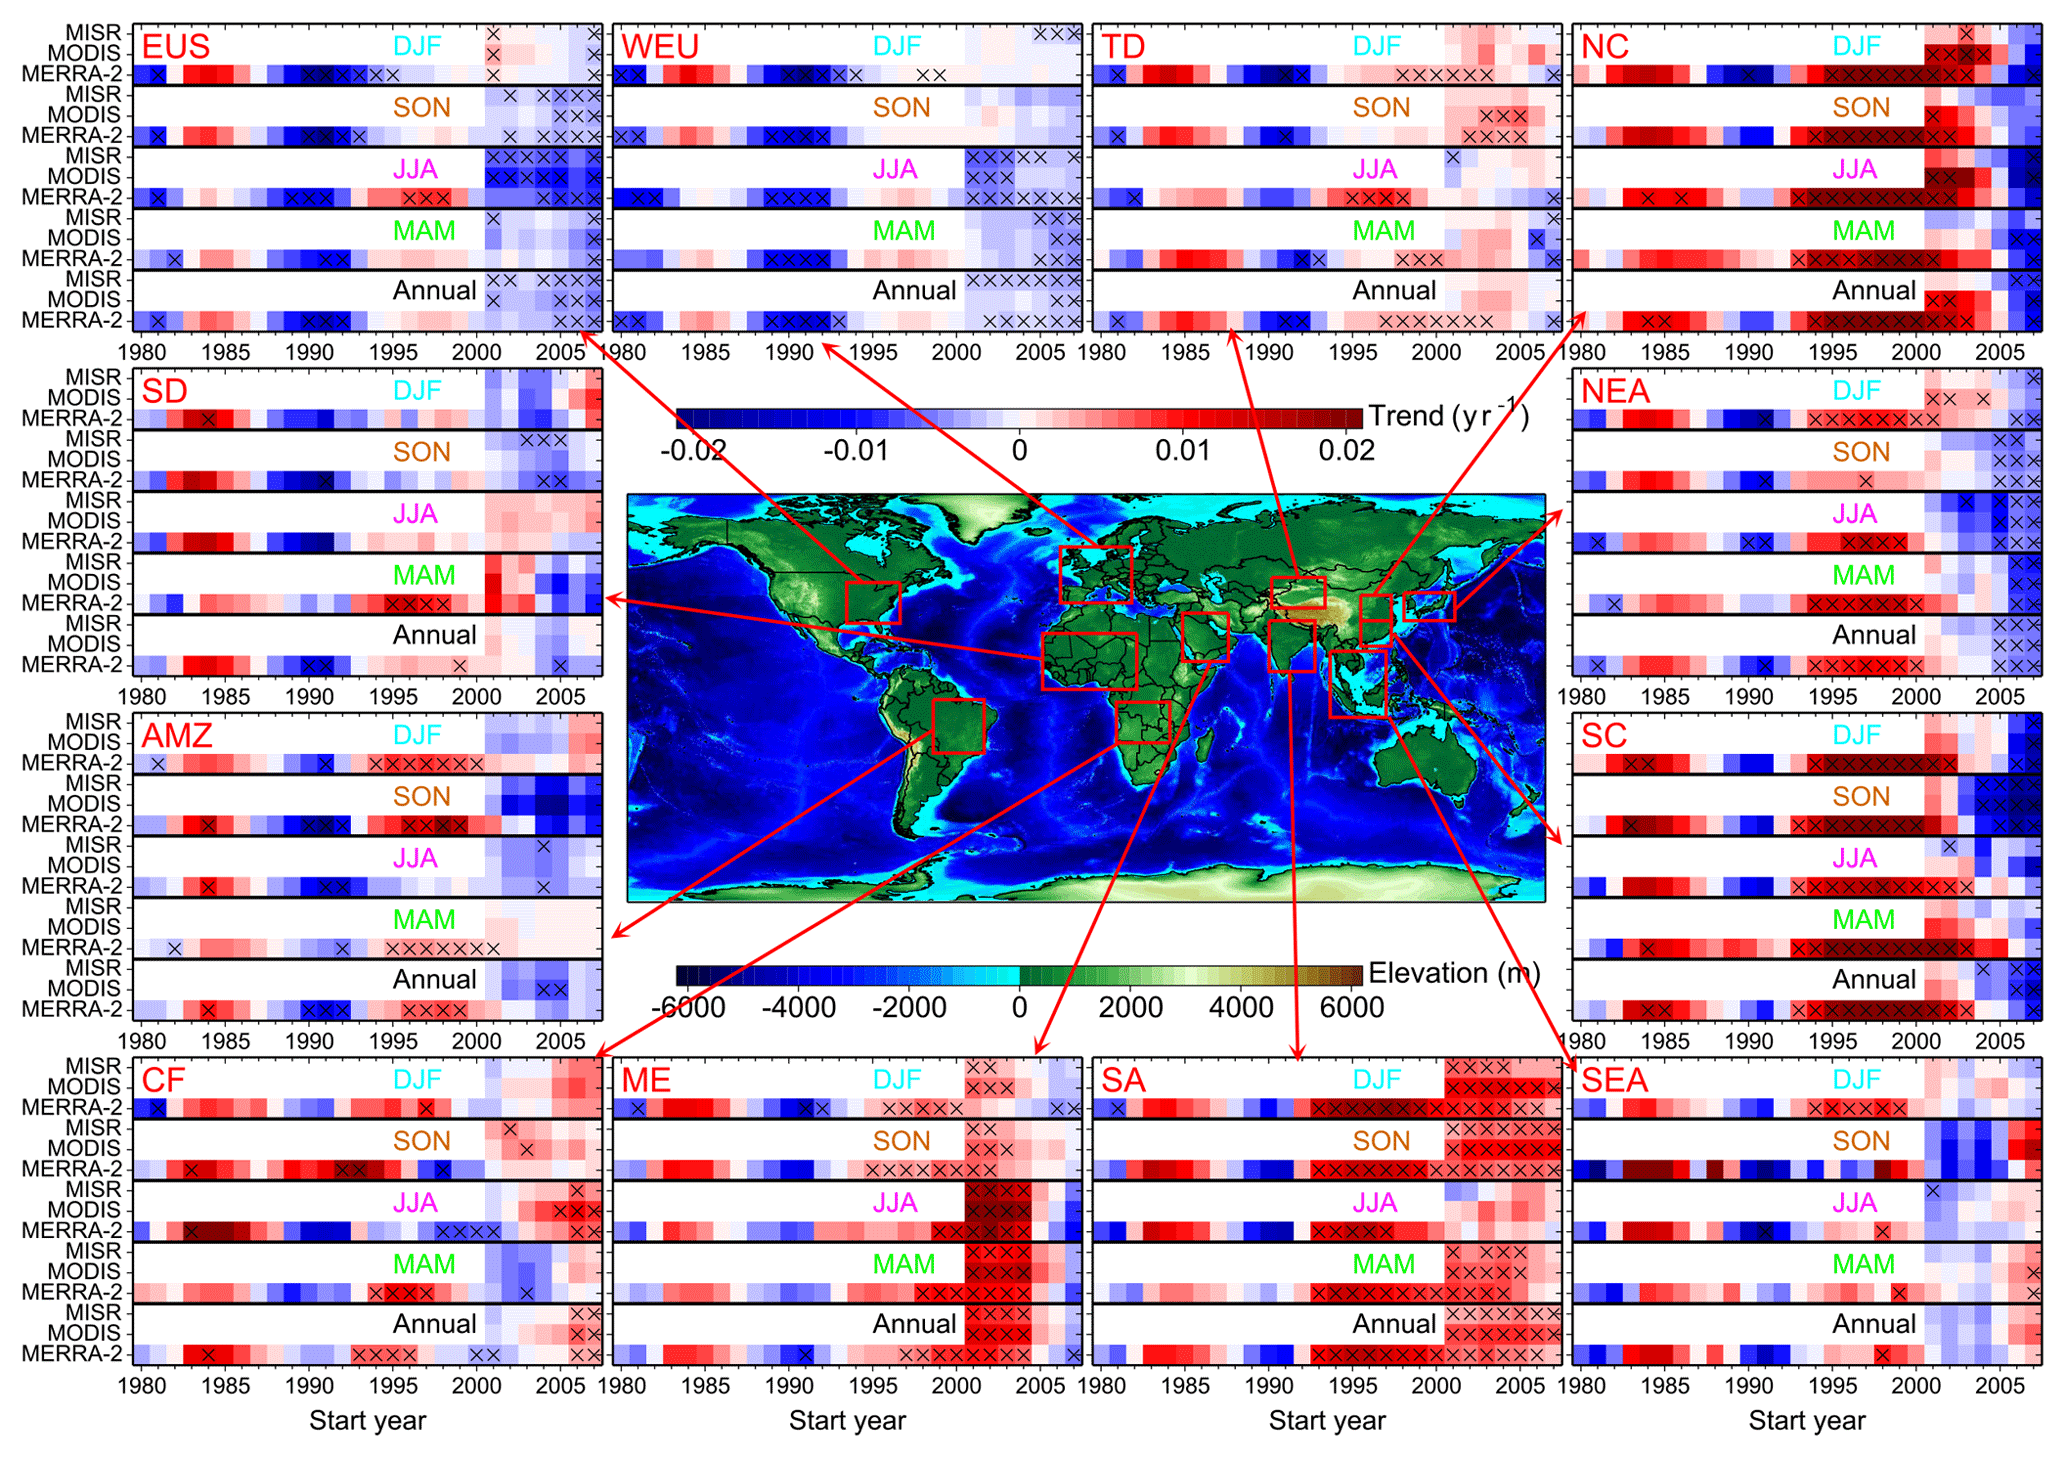
Figure 10Temporal evolution of sliding decadal trends in the annual and seasonal mean AOD from MERRA-2, MODIS/Terra and MISR over the 12 ROIs. The trends were calculated for each 10-year interval from 1980 to 2007 for MERRA-2 and from 2001 to 2007 for MODIS/Terra and MISR. The colors of the rectangles represent the intensity of the decadal trend (units: yr−1) and those with black “x” signs indicate linear trends above the 95 % significance level.
Furthermore, considering that aerosol concentration and composition usually have strong seasonal cycles (Li et al., 2018), the trends for each season were also calculated separately and compared with the MODIS and MISR trends in the period of overlap (2001–2016). Note that Fig. 10 only shows the evolution of seasonal and annual trends for every 10-year period starting from 1980 to 2007 for MERRA-2 and from 2001 to 2007 for MODIS and MISR; refer to Figs. S8–11 for a fuller presentation of the regional seasonal trend. For all regions, the trends for all seasons, except autumn in SEA, CF and AMZ and spring in the SD, were in phase with the annual trend (also see Fig. S12). In general, autumn trends over SEA, CF and AMZ were larger and often out of phase, possibly attributable to the sudden increase in aerosol concentration caused by biomass-burning events. Similarly, the spring trend over the SD was also larger and more asynchronous than in other seasons. This phenomenon can mainly be attributed to active spring dust events (Liu et al., 2001). In addition, compared with the annual and seasonal regional trends during 2001–2016 (Figs. 8 and S7), the decadal trends of MERRA-2 agreed better with the trend results from MODIS and MISR. This implies that the trends can change relatively quickly with time (Li et al., 2018). Supporting evidence was also found from the strongest trends on both annual and seasonal scales being mostly concentrated in the lower y axis values (Figs. 9 and S8–S11). These results also highlight the importance of evaluating temporal shifts or decadal AOD trends.
3.4 Response of inter-decadal variation in regional AOD to local emissions and meteorological parameters
Previous studies have shown that the interannual variations in regional AOD are mainly controlled by changes in emissions and meteorological factors (De Meij et al., 2012; Pozzer et al., 2015; Itahashi et al., 2012; Zhao et al., 2017; Lee et al., 2016; Chin et al., 2014). First, the trends of the four emission factors (i.e., TSP, SO2, BC and OC) and their correlations with AOD were calculated for the whole study period (1980–2014), as well as for two individual periods (i.e., 1980–1997 and 1998–2014). Note that the PKU global emissions inventories were only available for 1980–2014, which limited our research to a relatively short period. Figures 11 and S13 show the linear trends in emissions and their relationships with MERRA-2 AOD during 1980–2014, respectively. The decreasing AOD trends over Europe and the EUS (see Fig. 6) coincided with substantial reductions in the emissions of primary anthropogenic aerosols (TSP and BC) and precursor gases (SO2), corresponding to pollution controls (Hammer et al., 2018; De Meij et al., 2012). This was also supported by significant positive correlation between AOD and emissions in most regions of Europe and the EUS (Fig. S13).
Positive trends in TSP and SO2 were present over India and eastern China, which explained the significant upward trend of AOD in these two regions. In addition, eastern China and India experienced a shift in the emissions trend during the two periods (Figs. S14 and S16). In 1980–1997, a significant upward trend existed in both regions (Huang et al., 2014). In contrast, in 1998–2014, India at least maintained this upward trend for all four emission factors, with it sometimes being even stronger, while the positive trends in emissions of TSP and SO2 over eastern China were interspersed with negative trends. More importantly, the trend of BC and OC in eastern China reversed completely. The shift in these emission trends in eastern China can mainly be attributed to the implementation of multiple emission reduction policies (Zheng et al., 2018). The reductions in emissions were at least partly responsible for the decreasing trend of AOD in the NC and SC regions in the last 10 years (see Fig. 9). The trends in primary BC emissions followed a similar pattern to the trends in OC emissions, except there were positive trends over northeastern China and the positive (negative) trends over CF, AMZ and SEA (WEU and SC) were lower in magnitude, reflecting regional changes in fire activity. There were positive AOD trends in areas dominated by biomass burning (especially in CF and SEA), in response to increased BC and OC emissions. Because human activities are scarce in desert areas, there was no direct relationship between AOD and emissions, as expected. Therefore, this highlights the importance of studying how natural factors (here, this refers to meteorological parameters) control the interannual variation in AOD in different desert areas. Furthermore, it is worth noting that in the two short periods (especially 1998–2014), these regions with significant positive correlation shrunk and were no longer significant (Figs. S15 and S17), suggesting other factors such as meteorological parameters might be driving the interannual trend of regional AOD.
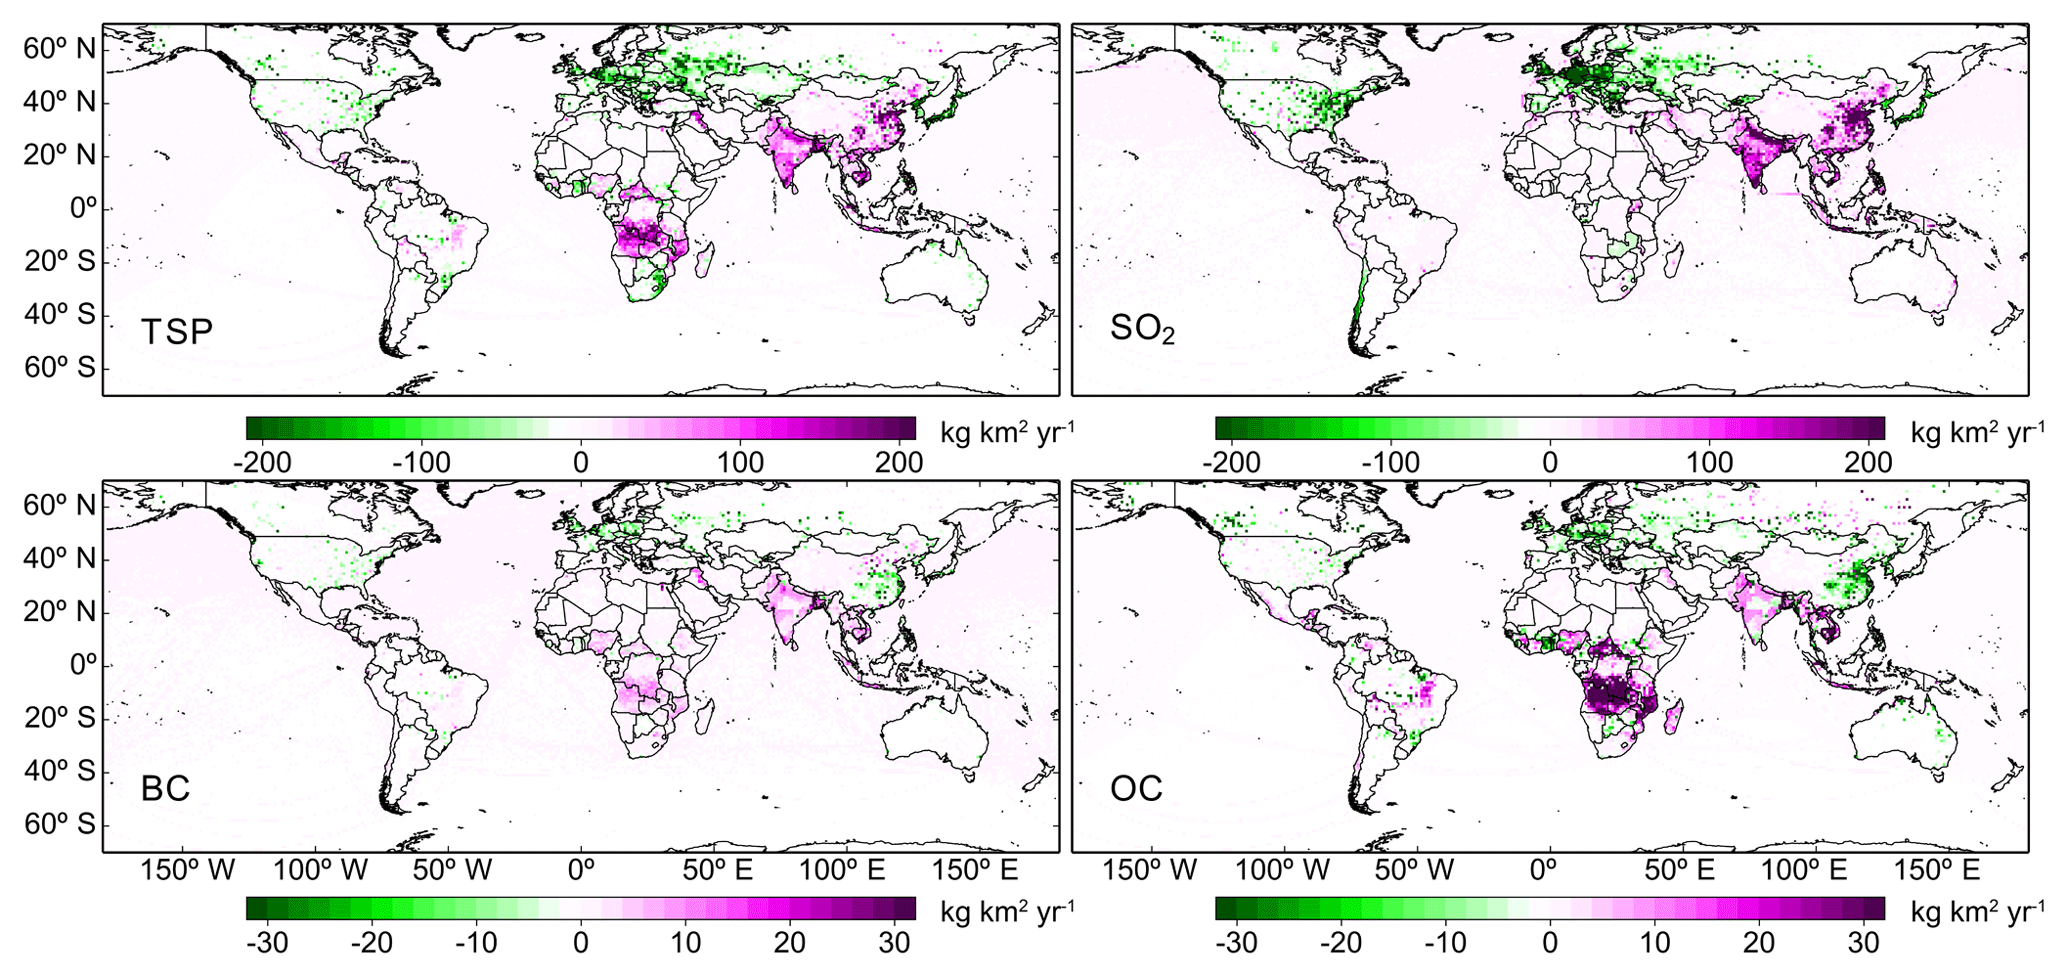
Figure 11Spatial distributions of linear trends (units: kg km−2 yr−1) in total anthropogenic emissions of total suspended particles (TSP), SO2, black carbon (BC) and organic carbon (OC) during 1980–2014 derived from the Peking University emissions inventory (http://inventory.pku.edu.cn/, last access: 31 March 2019) (Huang et al., 2014). Only linear trend values with statistical significance at the 95 % confidence level are shown.
To investigate the roles of meteorological parameters in the decadal variation in AOD, Pearson's R values between AOD and meteorological parameters (a total of 32; see Table 1) and over the 12 ROIs for the three periods (i.e., 1980–2014, 1980–1997 and 1998–2014) were calculated. Some of these meteorological variables, such as surface precipitation, surface wind speed, wind velocity, RH and surface wetness, have been shown before to be correlated with regional AOD (Klingmüller et al., 2016; Pozzer et al., 2015; Chin et al., 2014; He et al., 2016). Correlation analysis showed similar correlation patterns between AOD and meteorological parameters for the three different periods over all ROIs. During the period 1998–2014, the correlation was generally stronger than in the other two periods (see Fig. S18), suggesting meteorological factors may have played a more important role in this period. In addition, these correlations seemed to be similar in regions dominated by the same aerosol type. For example, in the mineral-dust-dominated regions (i.e., NWC, the ME and the SD), AOD had a significant positive (negative) correlation with near-surface wind speed (soil moisture), suggesting that surface wind speed and soil moisture may be the main factors controlling the dust cycle, which is consistent with previous studies in the ME (Klingmüller et al., 2016). In the biomass-burning-dominated regions (i.e., SEA, CF and AMZ), AOD had a significant negative correlation with humidity-related meteorological parameters (such as surface precipitation, RH and soil moisture), implying that ambient humidity (including the atmosphere and soil) may be a direct correlation factor in controlling the frequency of biomass-burning events (Torres et al., 2010). In contrast, in the regions dominated by anthropogenic aerosols, the correlation was regionally dependent and their signs differed from place to place.
Correlation analysis cannot directly identify the main factors affecting the inter-decadal change of AOD in different regions. Here, MLR models were used to diagnose the influences of local anthropogenic emissions and other meteorological parameters on the inter-decadal variation in AOD over the 12 ROIs. Figure 12 shows the time series of monthly mean MERRA-2 and MLR model-predicted normalized AOD anomalies, which used the emission factors, meteorological parameters or both as input predictors over the 12 ROIs for the whole study period (1980–2014). Similar comparisons for the two individual periods (i.e., 1980–1997 and 1998–2014) are also presented in Figs. S19 and S20, respectively. Table S2 summarizes the predictors included in the MLR models and their performance for the three different periods over each ROI. The MLR models with both emissions and meteorological parameters as predictors generally reproduced the AOD values in most regions during 1980–2014, except for high AOD values (Fig. 12), which are discussed below. For all the ROIs, the MLR models explained most of the MERRA-2 AOD variability (R2=0.42–0.76). However, when meteorology and emissions alone were used as predictors, there were considerable differences in different ROIs. When emission factors alone were used as the predictor, it could account for more than 35 % of the AOD variability in regions dominated by anthropogenic aerosols and biomass burning (except NEA, 14 %), with the largest explanation occurring in NC (58 %). In contrast, in the mineral-dust-dominated regions (the SD and ME), emission factors contributed little (< 0.05 %) to the interannual variation in AOD (Fig. 11g and i). Moreover, emission factors contributed 37 % of the AOD variability in NWC, which is mainly because of the strong anthropogenic emission sources in northern Xinjiang (mainly encompassing Ürümqi, Korla, Kashgar, etc.). However, compared with meteorological factors, emissions were not the main factors driving the interannual change of AOD (Fig. 12e).
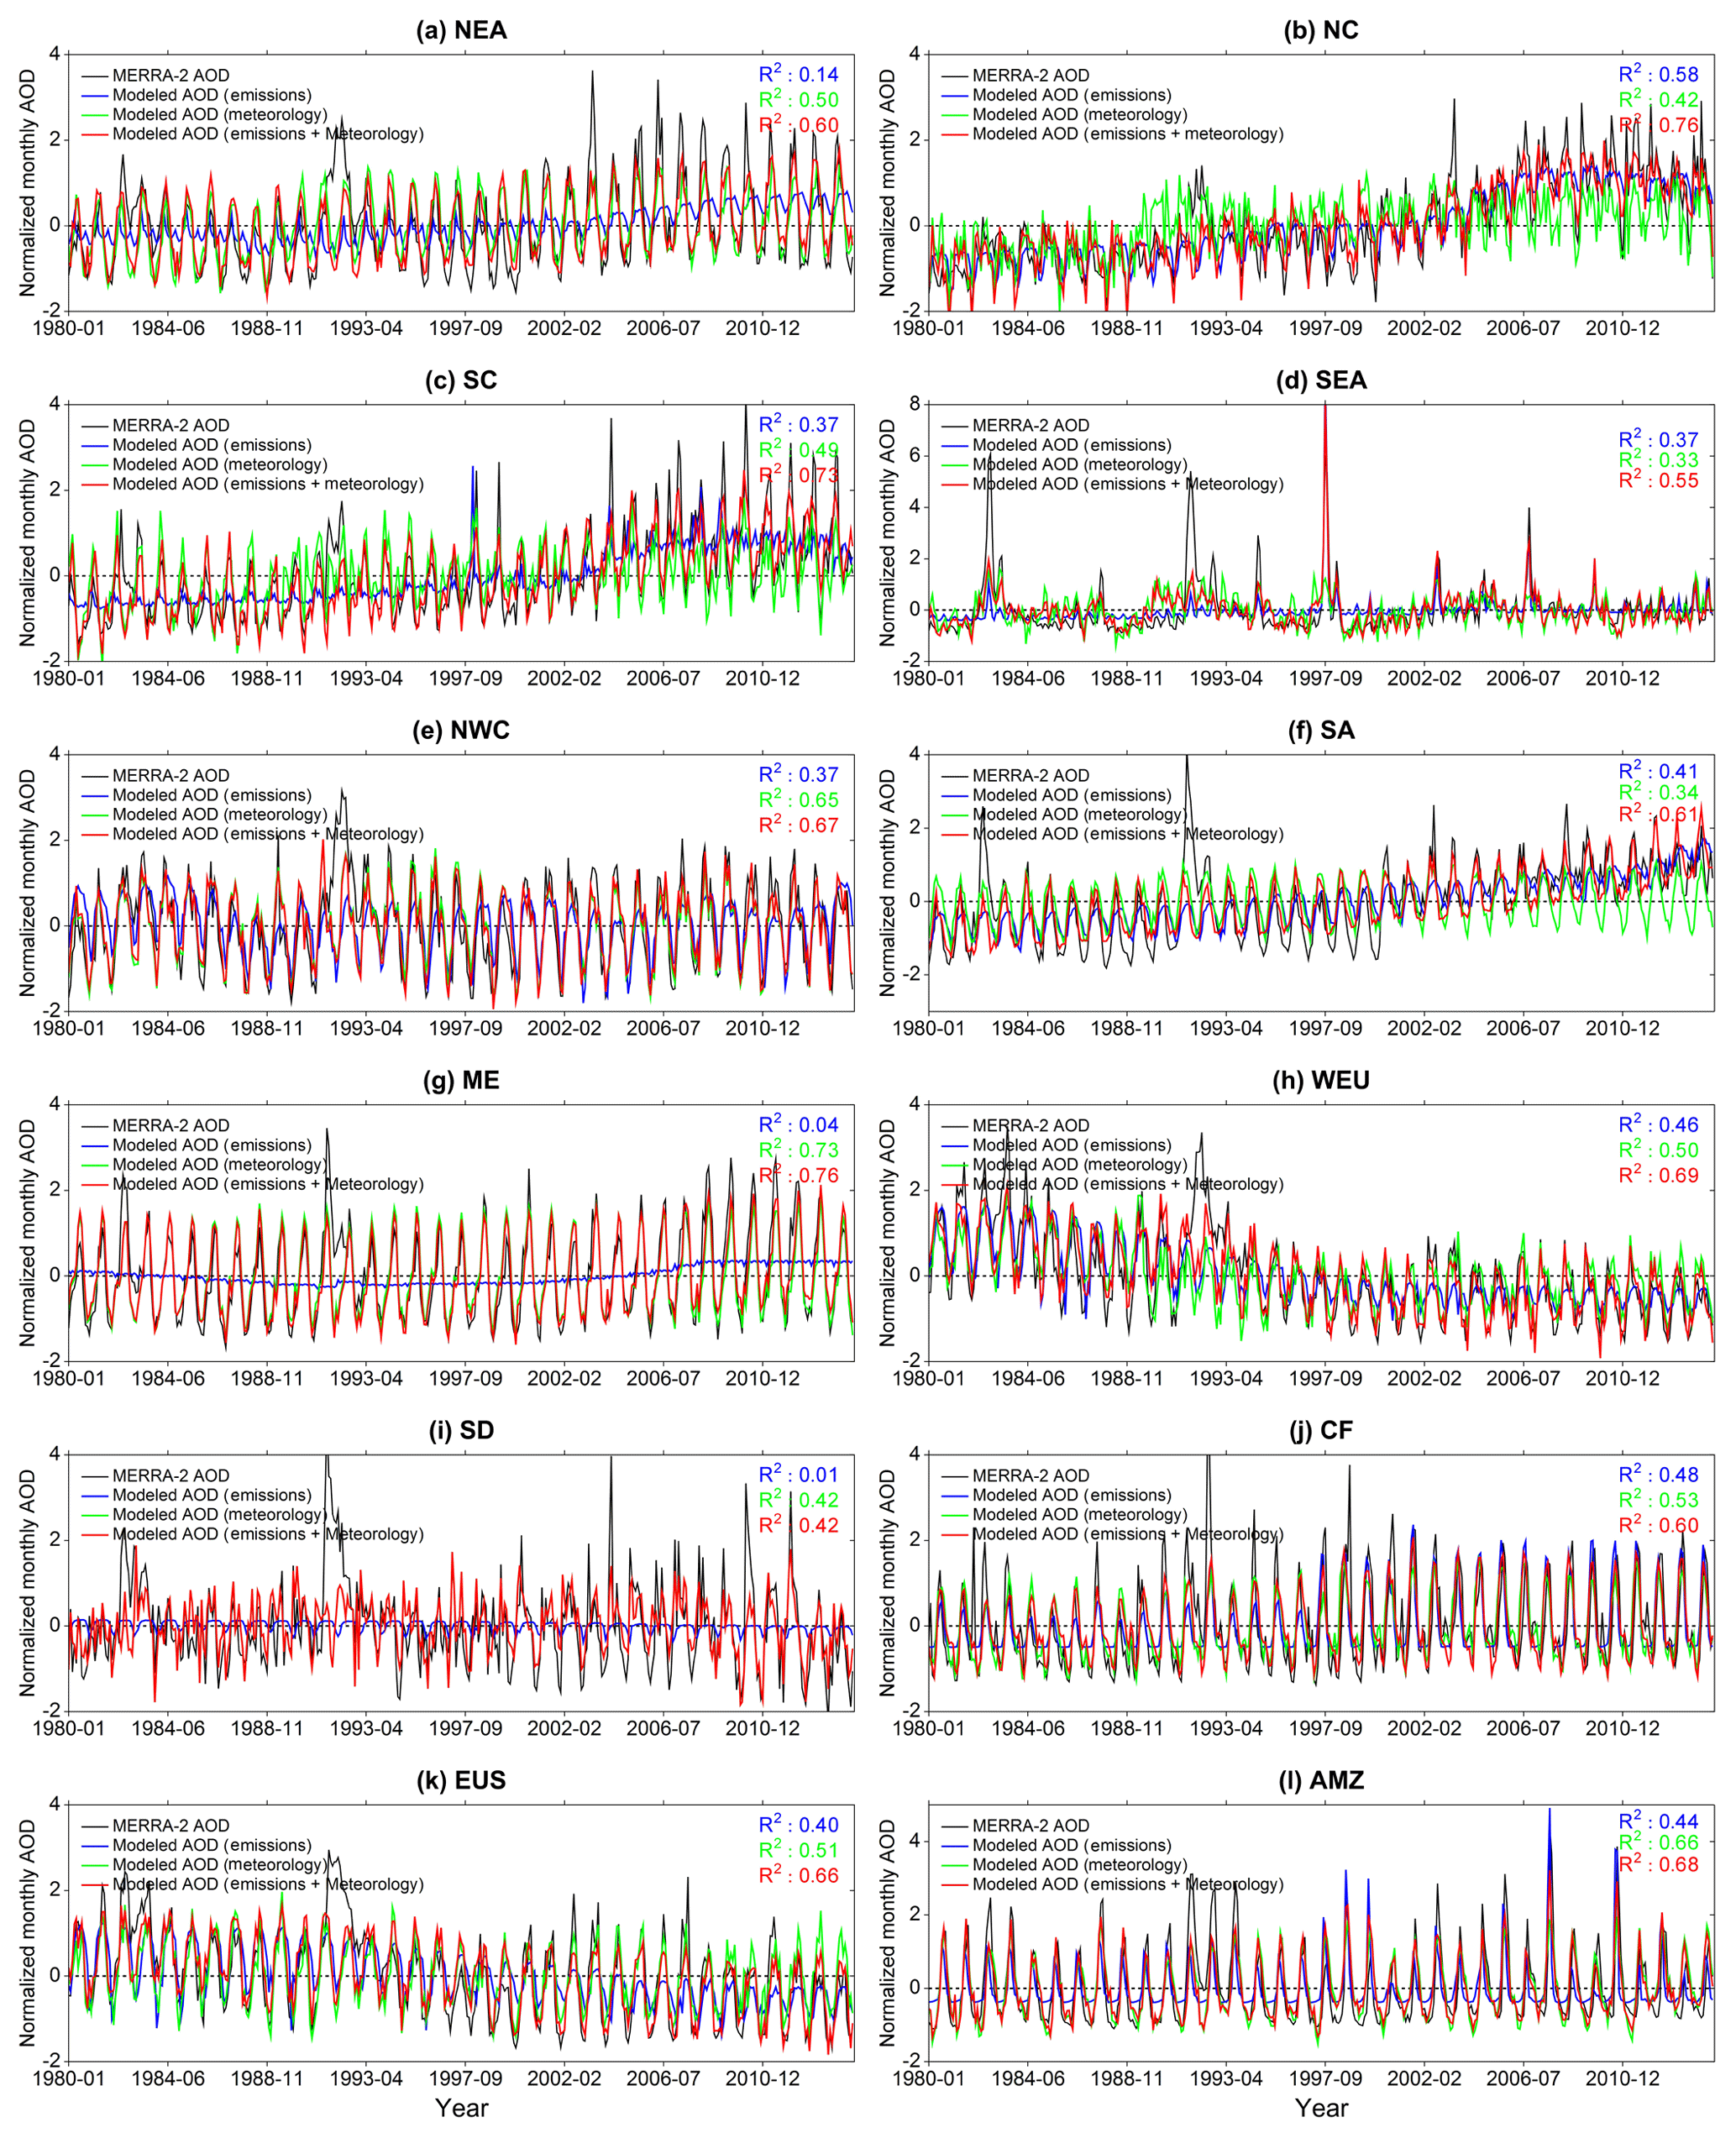
Figure 12Time series of MERRA-2 (in black) and modeled AOD monthly normalized anomalies from 1980 to 2014 over the 12 regions of interest. The coefficient of determination (R2) of the regression fit of the stepwise MLR model with emission factors (in blue), meteorology (in green), and both emissions and meteorology (in red) as predictors are given in the top-right of each panel.
On the other hand, when meteorological factors were used as predictors in the MLR models, it was surprising that they explained a larger proportion of the AOD changes in all ROIs except NC and SEA, where emission factors accounted for slightly lower AOD changes of 42 % and 33 %, respectively. Further analysis indicated that this difference in contribution between emissions and meteorology seemed to be greater for the two shorter periods of 1980–1997 and 1998–2017 (see Figs. S19 and S20). Besides, it should also be noted that the total explained variances of the MLR model for 1980–1997 were generally lower than those of the MLR model for 1998–2014, in all ROIs. The difference can be explained by two reasons: (1) a greater number of high AOD anomaly values occurred during the period 1980–1997 (Figs. 12 and S19), especially in relation to the two volcanic eruption events in the 1980s and 1990s, which directly reduced the total explained variances of the MLR model, because the model only considers the inter-decadal variations in local emissions and meteorological factors and the large-scale transport of pollutants is not considered, and (2) meteorology and emissions were confirmed to explain more AOD changes during the period 1998–2014.
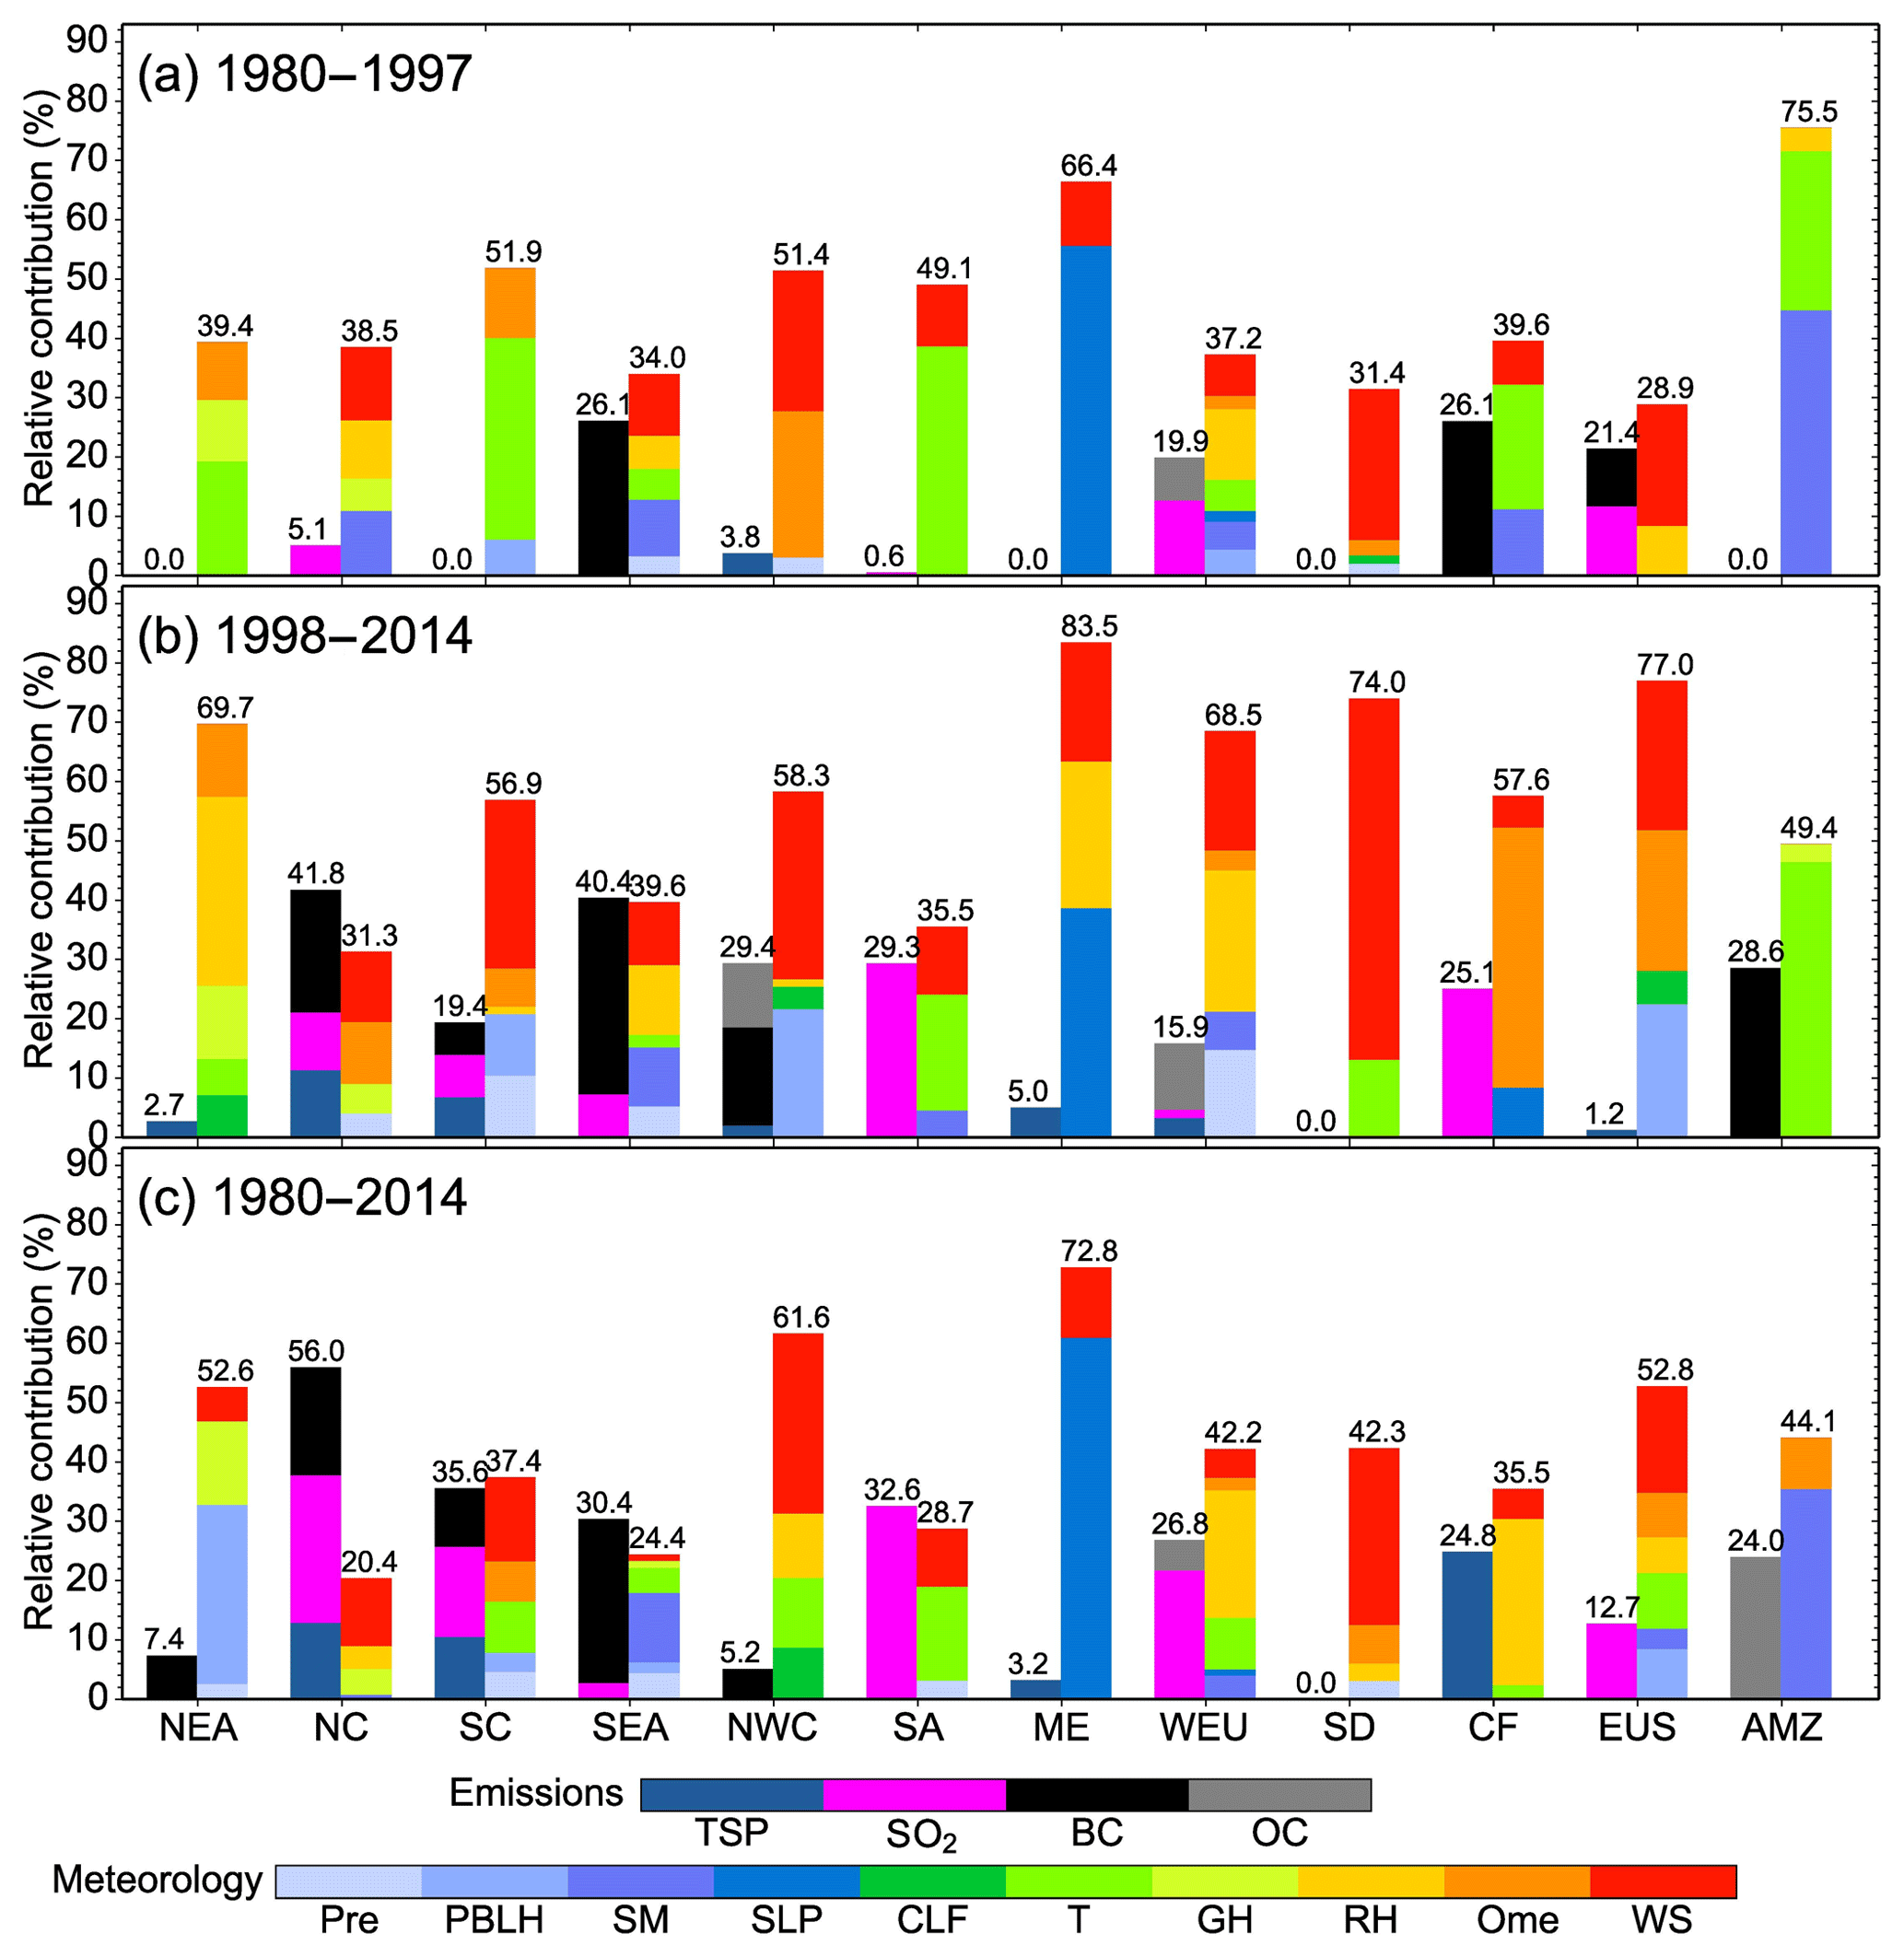
Figure 13The LMG method-estimated relative contributions (%) of total variances in the stepwise MLR model explained by the local emission factors (left-hand bars) and meteorological variables (right-hand bars) over the 12 regions of interest during three periods: (a) 1980–1997, (b) 1998–2014 and (c) 1980–2014. Note that meteorological parameters were combined as follows: temperature, T (Ts, T850, T700, T500, dT900−s, dT850−s); geopotential height, GH (GH850, GH700, GH500); relative humidity, RH (RHs, RH850, RH700, RH500); vertical velocity, Ome (Ome850, Ome700, Ome500); and wind speed, WS (U850, U700, U500, V850, V700, V500, WSs, WS850, WS700, WS500, VWS500−850). Refer to Table S3 for the detailed relative contributions of each variable in the stepwise MLR models.
3.5 Relative contributions of local emissions and meteorological parameters to inter-decadal variations in regional AOD
Application of the LMG method (see Sect. 2) to the MLR model allowed the relative contributions of each anthropogenic emission type and meteorological factor to the inter-decadal variations or trend of regional AOD to be quantified. Figure 13 shows the relative contributions of the local emissions and meteorological factors to the changes in regional AOD for the period 1980–2014, as well as for 1980–1997 and 1998–2014, using both emissions and meteorology as predictors in the MLR model. During the period 1980–2014, over the anthropogenic-aerosol-dominant regions, SO2 was the dominant emissions-driving factor, explaining 24.9 %, 15.2 %, 32.6 %, 21.7 % and 12.7 % of the variance of AOD over NC, SC, SA, WEU and the EUS, respectively (also see Table S3). The above results also confirm that particulate sulfate is the main contributor to fine-mode AOD in anthropogenic-aerosol-dominant regions (Itahashi et al., 2012; David et al., 2018). Meanwhile, wind speed (including surface and upper wind speed) was the dominant meteorological driving factor, explaining 11.4 %, 14.2 % and 17.9 % of the variance of AOD over NC, SC and the EUS, respectively. In addition, planetary boundary layer height, temperature (including surface temperature, upper temperature, and the temperature difference between the surface and upper atmosphere) and RH (including surface and upper RH) were the strongest meteorological driving factors over NEA, SA and WEU, contributing 30.2 %, 15.9 % and 21.5 %, respectively.
In contrast, over the biomass-burning-dominant regions, BC (OC) was the dominant emissions-driving factor over SEA (AMZ), explaining 27.7 % (24.0 %) of the variance of AOD. Meanwhile, soil moisture and RH were the top meteorological driving factors over SEA, AMZ and CF, contributing 11.7 %, 35.5 % and 28.5 %, respectively. Furthermore, over the dust-dominant regions, wind speed was the strongest meteorological driving factor, explaining 30.3 % and 29.8 % of the variance in AOD over NWC and the SD, respectively. In contrast to wind speed being the primary meteorological driving factor over NWC and the SD, it was the second-most important factor over the ME, while sea level pressure was the primary driving factor, accounting for 60.9 % of the variation in AOD. This large variance, explained by sea level pressure and significant anticorrelations of the AOD with it (see Fig. S18c), further confirms the previous studies' findings that frequent sandstorms over the ME often correspond to a large horizontal pressure gradient differences caused by the enhanced high-pressure system across the eastern Mediterranean Sea and the enhanced low-pressure system across Iran and Afghanistan (Hamidi et al., 2013; Yu et al., 2016).
By comparing the estimated results of the two independent study periods (i.e., 1980–1997 and 1998–2014), it was found that in almost all ROIs (except NC and AMZ), meteorological factors contributed a larger explained proportion of AOD changes during 1998–2014, which indicates that meteorological factors seem to be becoming increasingly more important in dominating the inter-decadal change of regional AOD. It is worth noting that, in addition to the increased explained proportion of SO2 and BC, among these meteorological factors, the role of diffusion-related parameters (such as horizontal and vertical wind speed, representing horizontal and vertical diffusion, respectively) seems to be the most prominent. This is consistent with the findings of Gui et al. (2019), who found wind speed to be the dominant meteorological driver for decadal changes in fine particulate matter over SC, based on a 19-year record of satellite-retrieved fine particulate matter data (1998–2016).
This paper presents a comprehensive assessment of the global and regional AOD trends over the past 37 years (1980–2016), based on the reanalysis MERRA-2 AOD dataset. AOD observations from both AERONET and CARSNET stations were used to assess the performance of the MERRA-2 AOD dataset on global and regional scales prior to calculating the global and regional AOD trends. Satellite retrievals from MODIS/Terra and MISR were then used to estimate the AOD annual and seasonal trends and compare them with the MERRA-2 results. Finally, the stepwise MLR and LMG methods were jointly applied to quantify the influences of emission factors and meteorological parameters on the inter-decadal changes in AOD over 12 ROIs during the three periods of 1980–2014, 1980–1997 and 1998–2014.
Results showed that the MERRA-2 AOD was comparable in accuracy to the satellite-retrieved AOD, albeit there was slight overestimation in the United States, southern South America and Australia and underestimation in the NC, SA, CF and SEA when compared with the ground-based AERONET and CARSNET AOD. MERRA-2 was proven to be capable of estimating the long-term variability and trend of AOD, owing to its good accuracy and continuous and complete spatiotemporal resolution. It was revealed that, in general, MERRA-2 was able to quantitatively reproduce the AOD annual and seasonal trends (especially decadal trends) during the overlapping years (2001–2016), as observed by the MODIS/Terra, albeit some discrepancies (caused by the insufficient sample size) were found when compared to MISR. The resulting trend analyses based on the MERRA-2 data from 1980 to 2016 showed that the global annual trend of AOD during this period, although significantly (p<0.05) weakly negative (i.e., −0.00068 yr−1), was essentially negligible when compared to the magnitudes of regional AOD trends. On regional scales, sliding trend analyses suggested that the inter-decadal trends of AOD in different periods could be significantly different. It was noted that during the entire study period (1980–2016), the EUS and WEU showed a non-monotonous decreasing trend accompanied by occasional fluctuations in the 1980s and 1990s, responding to the decrease in pollutant emissions, but the intensity of this downward tendency has slowed over the recent decade. In contrast, AODs in NC and SC experienced a sustained and significant upward trend before ∼ 2006, and then the trend shifted from upward to downward due to the Chinese government's emissions-reduction policy. In addition to the negligible downward trend in the 1980s and 1990s, SA showed overall significant positive trends throughout the study period. Moreover, the two large volcanic eruptions that occurred in the 1980s and 1990s not only greatly affected the short-term changes in local aerosol loading but also impacted significantly on the inter-annual trend of the regional AOD around the world. This highlights the importance of examining the effects of trans-regional pollutant transport on decadal or temporal shifts in local AOD trends.
To diagnose the influences of local anthropogenic emissions and other meteorological parameters on the inter-decadal variation in regional AODs, statistical MLR models that estimated AOD monthly values over each ROI as a function of local emissions factors and various meteorological variables were developed. The modeled AODs using emission factors, meteorological parameters or both as input predictors in the MLR models were compared during three individual periods (i.e., 1980–2014, 1980–1997 and 1998–2014). In general, the MLR models with both emissions and meteorological parameters as predictors could account for 42 %–76 % of the variability of the MERRA-2 AOD, depending on the ROI. However, when meteorology and emissions alone were used as predictors, there were considerable differences in different ROIs. During 1980–2014, compared with the emission factors (0 %–56 %), it was found that meteorological parameters explained a larger proportion of the AOD changes (20.4 %–72.8 %) over all ROIs (except NC and SEA). Besides, further analysis also showed that this dominant driving role of meteorological parameters was stronger during the other two periods.
The LMG method for MLR models suggested that SO2 was the dominant emissions-driving factor, explaining 24.9 %, 15.2 %, 32.6 %, 21.7 % and 12.7 % of the variance of AOD over NC, SC, SA, WEU and the EUS, respectively. In contrast, BC (OC) was the dominant emissions-driving factor over SEA (AMZ), explaining 27.7 % (24.0 %) of the variance of AOD. For meteorological driving factors over the mineral-dust-dominant regions, wind speed was the top driving factor, explaining 30.3 % and 29.8 % of the variance of AOD over NWC and the SD. Meanwhile, soil moisture and RH were the strongest meteorological driving factors over SEA, AMZ and CF, contributing 11.7 %, 35.5 % and 28.5 %, respectively. Notably, the performance of the MLR model in 1980–1997 was significantly worse than that in 1998–2014, which can mainly be attributed to the fact that the statistical model used in this study did not take into account the impact of trans-regional transport. Consequently, the model failed to capture the abnormally high values of regional AOD caused by trans-regional transport during 1980–1997. Finally, deeper insight into the influence of emissions, meteorological factors and atmospheric transport on the inter-decadal change in regional AOD will be provided in future modeling studies.
The CARSNET AOD dataset used in the study can be requested by contacting the corresponding author.
MERRA-2 aerosol reanalysis data are available at https://disc.gsfc.nasa.gov/daac-bin/FTPSubset2.pl (last access: 31 March 2019, NASA, 2019).
Data from PKU emissions inventory research group are available at http://inventory.pku.edu.cn/home.html (last access: 31 March 2019, Peking University, 2019) and data from AERONET networks are available at https://aeronet.gsfc.nasa.gov/ (last access: 31 March 2019). Gridded AOD products of MODIS and MISR are available through the Giovanni website (https://giovanni.gsfc.nasa.gov/giovanni/, last access: 31 March 2019).
All figures in this study were produced by the open-source software of MeteoInfoLab from Meteoinfo (Wang, 2019, http://www.meteothink.org/index.html, last access: 31 March 2019).
The supplement related to this article is available online at: https://doi.org/10.5194/acp-19-10497-2019-supplement.
All authors contributed to shaping up the ideas and reviewing the paper. HC, KG and XZ designed and implemented the research and prepared the manuscript; HC, KG and YW contributed to analysis of the MERRA-2, MODIS and MISR dataset; HC, XX, BNH, PG, and EGA contributed to the CARSNET data retrieval; HC, KG, YW, HW, YZ, and HZ carried out the CARSNET observations; XX, BNH, PG, and EGA provided constructive comments on this research.
The authors declare that they have no conflict of interest.
NASA's global modeling and assimilation office is gratefully acknowledged for making the MERRA-2 aerosol reanalysis publicly accessible. Thanks are also extended to the PKU emissions inventory research group and AERONET networks for making their data available online, as well as the GES-DISC for providing gridded AOD products of MODIS and MISR through their Giovanni website.
This research has been supported by the National Science Fund for Distinguished Young Scholars (grant no. 41825011), the National Key R & D Program Pilot Projects of China (grant nos. 2016YFA0601901 and 2016YFC0203304), the National Natural Science Foundation of China (grant no. 41590874), the CAMS Basis Research Project (grant no. 2017Z011), the European Union Seventh Framework Programme(FP7/2007-2013) (grant no. 262254), and the AERONET-Europe ACTRIS-2 program, European Union's Horizon 2020 research and innovation programme (grant no. 654109).
This paper was edited by Stelios Kazadzis and reviewed by two anonymous referees.
Ackerman, A. S., Toon, O. B., Stevens, D. E., Heymsfield, A. J., Ramanathan, V. and Welton, E. J.: Reduction of tropical cloudiness by soot, Science, 288, 1042–1047, https://doi.org/10.1126/science.288.5468.1042, 2000.
Altland, H. W., Freund, R. J., and Wilson, W. J.: Regression Analysis: Statistical Modeling of a Response Variable, Technometrics, https://doi.org/10.2307/1271353, 2006.
An, L., Che, H., Xue, M., Zhang, T., Wang, H., Wang, Y., Zhou, C., Zhao, H., Gui, K., Zheng, Y., Sun, T., Liang, Y., Sun, E., Zhang, H., and Zhang, X.: Temporal and spatial variations in sand and dust storm events in East Asia from 2007 to 2016: Relationships with surface conditions and climate change, Sci. Total Environ., 633, 368, https://doi.org/10.1016/j.scitotenv.2018.03.068, 2018.
Andreae, M. O.: Correlation between cloud condensation nuclei concentration and aerosol optical thickness in remote and polluted regions, Atmos. Chem. Phys., 9, 543–556, https://doi.org/10.5194/acp-9-543-2009, 2009.
Barnett, V., Neter, J., and Wasserman, W.: Applied Linear Statistical Models, J. R. Stat. Soc. Ser. A, 138, 258, https://doi.org/10.2307/2984653, 2006.
Bi, J.: A review of statistical methods for determination of relative importance of correlated predictors and identification of drivers of consumer liking, J. Sens. Stud., 27, 87–101, https://doi.org/10.1111/j.1745-459X.2012.00370.x, 2012.
Bluth, G. J. S., Doiron, S. D., Schnetzler, C. C., Krueger, A. J., and Walter, L. S.: Global tracking of the SO2 clouds from the June, 1991 Mount Pinatubo eruptions, Geophys. Res. Lett., 19, 151–154, https://doi.org/10.1029/91GL02792, 1992.
Buchard, V., Randles, C. A., da Silva, A. M., Darmenov, A., Colarco, P. R., Govindaraju, R., Ferrare, R., Hair, J., Beyersdorf, A. J., Ziemba, L. D., and Yu, H.: The MERRA-2 aerosol reanalysis, 1980 onward. Part II: Evaluation and case studies, J. Clim., 30, 6851–6872, https://doi.org/10.1175/JCLI-D-16-0613.1, 2017.
Che, H., Zhang, X., Li, Y., Zhou, Z., and Qu, J. J.: Horizontal visibility trends in China 1981–2005, Geophys. Res. Lett., 34, 1–5, https://doi.org/10.1029/2007GL031450, 2007.
Che, H., Zhang, X., Chen, H., Damiri, B., Goloub, P., Li, Z., Zhang, X., Wei, Y., Zhou, H., Dong, F., Li, D., and Zhou, T.: Instrument calibration and aerosol optical depth validation of the China aerosol remote sensing network, J. Geophys. Res.-Atmos., 114, D03206, https://doi.org/10.1029/2008JD011030, 2009.
Che, H., Xia, X., Zhu, J., Li, Z., Dubovik, O., Holben, B., Goloub, P., Chen, H., Estelles, V., Cuevas-Agulló, E., Blarel, L., Wang, H., Zhao, H., Zhang, X., Wang, Y., Sun, J., Tao, R., Zhang, X., and Shi, G.: Column aerosol optical properties and aerosol radiative forcing during a serious haze-fog month over North China Plain in 2013 based on ground-based sunphotometer measurements, Atmos. Chem. Phys., 14, 2125–2138, https://doi.org/10.5194/acp-14-2125-2014, 2014.
Che, H., Zhang, X.-Y., Xia, X., Goloub, P., Holben, B., Zhao, H., Wang, Y., Zhang, X.-C., Wang, H., Blarel, L., Damiri, B., Zhang, R., Deng, X., Ma, Y., Wang, T., Geng, F., Qi, B., Zhu, J., Yu, J., Chen, Q., and Shi, G.: Ground-based aerosol climatology of China: aerosol optical depths from the China Aerosol Remote Sensing Network (CARSNET) 2002–2013, Atmos. Chem. Phys., 15, 7619–7652, https://doi.org/10.5194/acp-15-7619-2015, 2015.
Che, H., Qi, B., Zhao, H., Xia, X., Eck, T. F., Goloub, P., Dubovik, O., Estelles, V., Cuevas-Agulló, E., Blarel, L., Wu, Y., Zhu, J., Du, R., Wang, Y., Wang, H., Gui, K., Yu, J., Zheng, Y., Sun, T., Chen, Q., Shi, G., and Zhang, X.: Aerosol optical properties and direct radiative forcing based on measurements from the China Aerosol Remote Sensing Network (CARSNET) in eastern China, Atmos. Chem. Phys., 18, 405–425, https://doi.org/10.5194/acp-18-405-2018, 2018.
Chen, J., Li, C., Ristovski, Z., Milic, A., Gu, Y., Islam, M. S., Wang, S., Hao, J., Zhang, H., He, C., Guo, H., Fu, H., Miljevic, B., Morawska, L., Thai, P., LAM, Y. F., Pereira, G., Ding, A., Huang, X., and Dumka, U. C.: A review of biomass burning: Emissions and impacts on air quality, health and climate in China, Sci. Total Environ., 579, 1000–1034, https://doi.org/10.1016/j.scitotenv.2016.11.025, 2017.
Chin, M., Ginoux, P., Kinne, S., Torres, O., Holben, B. N., Duncan, B. N., Martin, R. V., Logan, J. A., Higurashi, A., and Nakajima, T.: Tropospheric Aerosol Optical Thickness from the GOCART Model and Comparisons with Satellite and Sun Photometer Measurements, J. Atmos. Sci., 59, 461–483, https://doi.org/10.1175/1520-0469(2002)059<0461:TAOTFT>2.0.CO;2, 2002.
Chin, M., Diehl, T., Tan, Q., Prospero, J. M., Kahn, R. A., Remer, L. A., Yu, H., Sayer, A. M., Bian, H., Geogdzhayev, I. V., Holben, B. N., Howell, S. G., Huebert, B. J., Hsu, N. C., Kim, D., Kucsera, T. L., Levy, R. C., Mishchenko, M. I., Pan, X., Quinn, P. K., Schuster, G. L., Streets, D. G., Strode, S. A., Torres, O., and Zhao, X.-P.: Multi-decadal aerosol variations from 1980 to 2009: a perspective from observations and a global model, Atmos. Chem. Phys., 14, 3657–3690, https://doi.org/10.5194/acp-14-3657-2014, 2014.
Cohen, A. J., Brauer, M., Burnett, R., Anderson, H. R., Frostad, J., Estep, K., Balakrishnan, K., Brunekreef, B., Dandona, L., Dandona, R., Feigin, V., Freedman, G., Hubbell, B., Jobling, A., Kan, H., Knibbs, L., Liu, Y., Martin, R., Morawska, L., Pope, C. A., Shin, H., Straif, K., Shaddick, G., Thomas, M., van Dingenen, R., van Donkelaar, A., Vos, T., Murray, C. J. L., and Forouzanfar, M. H.: Estimates and 25-year trends of the global burden of disease attributable to ambient air pollution: an analysis of data from the Global Burden of Diseases Study 2015, Lancet, 389, 1907–1918, https://doi.org/10.1016/S0140-6736(17)30505-6, 2017.
Colarco, P., Da Silva, A., Chin, M., and Diehl, T.: Online simulations of global aerosol distributions in the NASA GEOS-4 model and comparisons to satellite and ground-based aerosol optical depth, J. Geophys. Res.-Atmos., 115, D14207, https://doi.org/10.1029/2009JD012820, 2010.
David, L. M., Ravishankara, A. R., Kodros, J. K., Venkataraman, C., Sadavarte, P., Pierce, J. R., Chaliyakunnel, S., and Millet, D. B.: Aerosol Optical Depth Over India, J. Geophys. Res.-Atmos., 123, 3688–3703, https://doi.org/10.1002/2017JD027719, 2018.
de Leeuw, G., Sogacheva, L., Rodriguez, E., Kourtidis, K., Georgoulias, A. K., Alexandri, G., Amiridis, V., Proestakis, E., Marinou, E., Xue, Y., and van der A, R.: Two decades of satellite observations of AOD over mainland China using ATSR-2, AATSR and MODIS/Terra: data set evaluation and large-scale patterns, Atmos. Chem. Phys., 18, 1573–1592, https://doi.org/10.5194/acp-18-1573-2018, 2018.
De Meij, A., Pozzer, A., and Lelieveld, J.: Trend analysis in aerosol optical depths and pollutant emission estimates between 2000 and 2009, Atmos. Environ., 51, 75–85, https://doi.org/10.1016/j.atmosenv.2012.01.059, 2012.
Diner, D. J., Beckert, J. C., Reilly, T. H., Bruegge, C. J., Conel, J. E., Kahn, R. A., Martonchik, J. V., Ackerman, T. P., Davies, R., Gerstl, S. A. W., Gordon, H. R., Muller, J. P., Myneni, R. B., Sellers, P. J., Pinty, B., and Verstraete, M. M.: Multi-angle imaging spectroradiometer (MISR) instrument description and experiment overview, IEEE T. Geosci. Remote, 36, 1072–1087, https://doi.org/10.1109/36.700992, 1998.
Ding, A. J., Huang, X., Nie, W., Sun, J. N., Kerminen, V.-M., Petäjä, T., Su, H., Cheng, Y. F., Yang, X.-Q., Wang, M. H., Chi, X. G., Wang, J. P., Virkkula, A., Guo, W. D., Yuan, J., Wang, S. Y., Zhang, R. J., Wu, Y. F., Song, Y., Zhu, T., Zilitinkevich, S., Kulmala, M., and Fu, C. B.: Black carbon enhances haze pollution in megacities in China, Geophys. Res. Lett., 43, 2873–2879, https://doi.org/10.1002/2016GL067745, 2016.
Eck, T. F., Holben, B. N., Reid, J. S., Dubovik, O., Smirnov, A., O'Neill, N. T., Slutsker, I., and Kinne, S.: Wavelength dependence of the optical depth of biomass burning, urban, and desert dust aerosols, J. Geophys. Res., 104, 31333–31349, https://doi.org/10.1029/1999JD900923, 1999.
Edgar: EDGAR – Emission Database for Global Atmospheric Research, Glob. Emiss. EDGAR v4.2 (November 2011), https://doi.org/10.2904/EDGARv4.2, 2011.
Fan, A., Chen, W., Liang, L., Sun, W., Lin, Y., Che, H., and Zhao, X.: Evaluation and comparison of long-term MODIS C5.1 and C6 products against AERONET observations over China, Remote Sens., 9, 1–16, https://doi.org/10.3390/rs9121269, 2017.
Feng, Y., Chen, D., Ouyang, X., and Zhang, X.: Variability of satellite-based total aerosols and the relationship with emission, meteorology and landscape in North China during 2000–2016, Environ. Earth Sci., 77, 1–11, https://doi.org/10.1007/s12665-018-7685-y, 2018.
Field, A.: Discovering Statistics Using IBM SPSS Statistics, 4th edn., Sage, London, 2013.
Gao, M., Ji, D., Liang, F., and Liu, Y.: Attribution of aerosol direct radiative forcing in China and India to emitting sectors, Atmos. Environ., 190, 35–42, https://doi.org/10.1016/j.atmosenv.2018.07.011, 2018.
Gelaro, R., McCarty, W., Suárez, M. J., Todling, R., Molod, A., Takacs, L., Randles, C. A., Darmenov, A., Bosilovich, M. G., Reichle, R., Wargan, K., Coy, L., Cullather, R., Draper, C., Akella, S., Buchard, V., Conaty, A., da Silva, A. M., Gu, W., Kim, G. K., Koster, R., Lucchesi, R., Merkova, D., Nielsen, J. E., Partyka, G., Pawson, S., Putman, W., Rienecker, M., Schubert, S. D., Sienkiewicz, M., and Zhao, B.: The modern-era retrospective analysis for research and applications, version 2 (MERRA-2), J. Clim., 30, 5419–5454, https://doi.org/10.1175/JCLI-D-16-0758.1, 2017.
Goldammer, J. G.: History of equatorial vegetation fires and fire research in Southeast Asia before the 1997-98 episode: A reconstruction of creeping environmental changes, Mitig. Adapt. Strateg. Glob. Chang., 12, 13–32, https://doi.org/10.1007/s11027-006-9044-7, 2007.
Grömping, U.: Relative importance for linear regression in R: the package relaimpo, J. Stat. Softw., 234, S218, https://doi.org/10.1016/j.foreco.2006.08.245, 2006.
Gui, K., Che, H., Chen, Q., An, L., Zeng, Z., Guo, Z., Zheng, Y., Wang, H., Wang, Y., Yu, J., and Zhang, X.: Aerosol optical properties based on ground and satellite retrievals during a serious haze episode in December 2015 over Beijing, Atmosphere, 7, 70, https://doi.org/10.3390/atmos7050070, 2016.
Gui, K., Che, H., Wang, Y., Wang, H., Zhang, L., Zhao, H., Zheng, Y., Sun, T., and Zhang, X.: Satellite-derived PM2.5 concentration trends over Eastern China from 1998 to 2016: Relationships to emissions and meteorological, Environ. Pollut., 247, 1125–1133, https://doi.org/10.1016/j.envpol.2019.01.056, 2019.
Hair, J. F., Black, B., Babin, B., and Anderson, R. E.: Multivariate Data Analysis: seventh edition (6th edn.), Englewood Cliffs, New Jersey: Prentice Hall, 2007.
Hamidi, M., Kavianpour, M. R., and Shao, Y.: Synoptic analysis of dust storms in the Middle East, Asia-Pacific, J. Atmos. Sci., 49, 279–286, https://doi.org/10.1007/s13143-013-0027-9, 2013.
Hammer, M. S., Martin, R. V., Li, C., Torres, O., Manning, M., and Boys, B. L.: Insight into global trends in aerosol composition from 2005 to 2015 inferred from the OMI Ultraviolet Aerosol Index, Atmos. Chem. Phys., 18, 8097–8112, https://doi.org/10.5194/acp-18-8097-2018, 2018.
Hansen, J., Sato, M., and Ruedy, R.: Radiative forcing and climate response, J. Geophys. Res.-Atmos., 102, 6831–6864, https://doi.org/10.1029/96JD03436, 1997.
He, Q., Zhang, M., and Huang, B.: Spatio-temporal variation and impact factors analysis of satellite-based aerosol optical depth over China from 2002 to 2015, Atmos. Environ., 129, 79–90, https://doi.org/10.1016/j.atmosenv.2016.01.002, 2016.
Heidinger, A. K., Foster, M. J., Walther, A., and Zhao, X.: The pathfinder atmospheres-extended avhrr climate dataset, B. Am. Meteorol. Soc., 95, 909–922, https://doi.org/10.1175/BAMS-D-12-00246.1, 2014.
Hofmann, D. J. and Rosen, J. M.: Stratospheric sulfuric acid fraction and mass estimate for the 1982 volcanic eruption of El Chichon, Geophys. Res. Lett., 10, 313–316, https://doi.org/10.1029/GL010i004p00313, 1983.
Holben, B. N., Eck, T. F., Slutsker, I., Tanré, D., Buis, J. P., Setzer, A., Vermote, E., Reagan, J. A., Kaufman, Y. J., Nakajima, T., Lavenu, F., Jankowiak, I., and Smirnov, A.: AERONET – A Federated Instrument Network and Data Archive for Aerosol Characterization, Remote Sens. Environ., 66, 1–16, https://doi.org/10.1016/S0034-4257(98)00031-5, 1998.
Hsu, N. C., Gautam, R., Sayer, A. M., Bettenhausen, C., Li, C., Jeong, M. J., Tsay, S.-C., and Holben, B. N.: Global and regional trends of aerosol optical depth over land and ocean using SeaWiFS measurements from 1997 to 2010, Atmos. Chem. Phys., 12, 8037–8053, https://doi.org/10.5194/acp-12-8037-2012, 2012.
Huang, Y., Shen, H., Chen, H., Wang, R., Zhang, Y., Su, S., Chen, Y., Lin, N., Zhuo, S., Zhong, Q., Wang, X., Liu, J., Li, B., Liu, W., and Tao, S.: Quantification of global primary emissions of PM2.5, PM10, and TSP from combustion and industrial process sources, Environ. Sci. Technol., 48, 13834–13843, https://doi.org/10.1021/es503696k, 2014.
Huang, Y., Shen, H., Chen, Y., Zhong, Q., Chen, H., Wang, R., Shen, G., Liu, J., Li, B., and Tao, S.: Global organic carbon emissions from primary sources from 1960 to 2009, Atmos. Environ., 122, 505–512, https://doi.org/10.1016/j.atmosenv.2015.10.017, 2015.
Ikemori, F., Sugata, S., Uranishi, K., Shimadera, H., and Kondo, A.: Impact of field biomass burning on local pollution and long-range transport of PM2.5 in Northeast Asia, Environ. Pollut., 244, 414–422, https://doi.org/10.1016/j.envpol.2018.09.061, 2018.
Bernstein, L., Bosch, P., Canziani, O., Chen, Z., Christ, R., and Riahi K.: IPCC, 2007: Climate Change 2007: Synthesis Report, Geneva: IPCC, ISBN 2-9169-122-4, 2008.
Itahashi, S., Uno, I., Yumimoto, K., Irie, H., Osada, K., Ogata, K., Fukushima, H., Wang, Z., and Ohara, T.: Interannual variation in the fine-mode MODIS aerosol optical depth and its relationship to the changes in sulfur dioxide emissions in China between 2000 and 2010, Atmos. Chem. Phys., 12, 2631–2640, https://doi.org/10.5194/acp-12-2631-2012, 2012.
Jiang, J. H., Su, H., Huang, L., Wang, Y., Massie, S., Zhao, B., Omar, A., and Wang, Z.: Contrasting effects on deep convective clouds by different types of aerosols, Nat. Commun., 9, 3874, https://doi.org/10.1038/s41467-018-06280-4, 2018.
Kahn, R. A., Gaitley, B. J., Martonchik, J. V., Diner, D. J., Crean, K. A., and Holben, B.: Multiangle Imaging Spectroradiometer (MISR) global aerosol optical depth validation based on 2 years of coincident Aerosol Robotic Network (AERONET) observations, J. Geophys. Res.-Atmos., 110, 1–16, https://doi.org/10.1029/2004JD004706, 2005.
Kahn, R. A., Nelson, D. L., Garay, M. J., Levy, R. C., Bull, M. A., Diner, D. J., Martonchik, J. V., Paradise, S. R., Hansen, E. G., and Remer, L. A.: MISR aerosol product attributes and statistical comparisons with MODIS, IEEE T. Geosci. Remote, 4095–4114, https://doi.org/10.1109/TGRS.2009.2023115, 2009.
Kahn, R. A., Gaitley, B. J., Garay, M. J., Diner, D. J., Eck, T. F., Smirnov, A., and Holben, B. N.: Multiangle Imaging SpectroRadiometer global aerosol product assessment by comparison with the Aerosol Robotic Network, J. Geophys. Res.-Atmos., 115, D23209, https://doi.org/10.1029/2010JD014601, 2010.
Kim, D., Chin, M., Remer, L. A., Diehl, T., Bian, H., Yu, H., Brown, M. E., and Stockwell, W. R.: Role of surface wind and vegetation cover in multi-decadal variations of dust emission in the Sahara and Sahel, Atmos. Environ., 148, 282–296, https://doi.org/10.1016/j.atmosenv.2016.10.051, 2017.
King, M. D., Menzel, W. P., Kaufman, Y. J., Tanré, D., Gao, B. C., Platnick, S., Ackerman, S. A., Remer, L. A., Pincus, R., and Hubanks, P. A.: Cloud and aerosol properties, precipitable water, and profiles of temperature and water vapor from MODIS, IEEE T. Geosci. Remote, 41, 442–456, https://doi.org/10.1109/TGRS.2002.808226, 2003.
Kirchner, I., Stenchikov, G. L., Graf, H. F., Robock, A., and Antuña, J. C.: Climate model simulation of winter warming and summer cooling following the 1991 Mount Pinatubo volcanic eruption, J. Geophys. Res.-Atmos., 104, 19039–19055, https://doi.org/10.1029/1999JD900213, 1999.
Klingmüller, K., Pozzer, A., Metzger, S., Stenchikov, G. L., and Lelieveld, J.: Aerosol optical depth trend over the Middle East, Atmos. Chem. Phys., 16, 5063–5073, https://doi.org/10.5194/acp-16-5063-2016, 2016.
Lelieveld, J., Evans, J. S., Fnais, M., Giannadaki, D., and Pozzer, A.: The contribution of outdoor air pollution sources to premature mortality on a global scale, Nature, 525, 367–371, https://doi.org/10.1038/nature15371, 2015.
Lee, H., Kalashnikova, O. V., Suzuki, K., Braverman, A., Garay, M. J., and Kahn, R. A.: Climatology of the aerosol optical depth by components from the Multi-angle Imaging SpectroRadiometer (MISR) and chemistry transport models, Atmos. Chem. Phys., 16, 6627–6640, https://doi.org/10.5194/acp-16-6627-2016, 2016.
Levy, R. C., Remer, L. A., Kleidman, R. G., Mattoo, S., Ichoku, C., Kahn, R., and Eck, T. F.: Global evaluation of the Collection 5 MODIS dark-target aerosol products over land, Atmos. Chem. Phys., 10, 10399-10420, https://doi.org/10.5194/acp-10-10399-2010, 2010.
Levy, R. C., Mattoo, S., Munchak, L. A., Remer, L. A., Sayer, A. M., Patadia, F., and Hsu, N. C.: The Collection 6 MODIS aerosol products over land and ocean, Atmos. Meas. Tech., 6, 2989–3034, https://doi.org/10.5194/amt-6-2989-2013, 2013.
Levy, R. C., Munchak, L. A., Mattoo, S., Patadia, F., Remer, L. A., and Holz, R. E.: Towards a long-term global aerosol optical depth record: applying a consistent aerosol retrieval algorithm to MODIS and VIIRS-observed reflectance, Atmos. Meas. Tech., 8, 4083–4110, https://doi.org/10.5194/amt-8-4083-2015, 2015.
Li, J., Carlson, B. E., Dubovik, O., and Lacis, A. A.: Recent trends in aerosol optical properties derived from AERONET measurements, Atmos. Chem. Phys., 14, 12271–12289, https://doi.org/10.5194/acp-14-12271-2014, 2014.
Li, J., Li, C., and Zhao, C.: Different trends in extreme and median surface aerosol extinction coefficients over China inferred from quality-controlled visibility data, Atmos. Chem. Phys., 18, 3289–3298, https://doi.org/10.5194/acp-18-3289-2018, 2018.
Lindeman, R. H., Merenda, P. F., and Gold, R. Z.: Introduction to Bivariate and Multivariate Analysis, Scott, Foresman, Glenview, Ill., 76, 2014.
Liu, J., Rühland, K. M., Chen, J., Xu, Y., Chen, S., Chen, Q., Huang, W., Xu, Q., Chen, F., and Smol, J. P.: Aerosol-weakened summer monsoons decrease lake fertilization on the Chinese Loess Plateau, Nat. Clim. Change, 7, 190–194, https://doi.org/10.1038/nclimate3220, 2017.
Liu, P., Washington, W. M., Meehl, G. A., Wu, G., and Potter, G. L.: Historical and future trends of the Sahara Desert, Geophys. Res. Lett., 28, 2683–2686, https://doi.org/10.1029/2001GL012883, 2001.
Lu, X., Zhang, L., Yue, X., Zhang, J., Jaffe, D. A., Stohl, A., Zhao, Y., and Shao, J.: Wildfire influences on the variability and trend of summer surface ozone in the mountainous western United States, Atmos. Chem. Phys., 16, 14687–14702, https://doi.org/10.5194/acp-16-14687-2016, 2016.
Ma, Z., Hu, X., Sayer, A. M., Levy, R., Zhang, Q., Xue, Y., Tong, S., Bi, J., Huang, L., and Liu, Y.: Satellite-based spatiotemporal trends in PM2.5concentrations: China, 2004–2013, Environ. Health Perspect., 124, 184–192, https://doi.org/10.1289/ehp.1409481, 2016.
Mao, K. B., Ma, Y., Xia, L., Chen, W. Y., Shen, X. Y., He, T. J., and Xu, T. R.: Global aerosol change in the last decade: An analysis based on MODIS data, Atmos. Environ., 94, 680–686, https://doi.org/10.1016/j.atmosenv.2014.04.053, 2014.
McCormick, R. A. and Ludwig, J. H.: Climate modification by atmospheric aerosols, Science, 156, 1358–1359, https://doi.org/10.1126/science.156.3780.1358, 1967.
Mehta, M., Singh, R., Singh, A., Singh, N., and Anshumali: Recent global aerosol optical depth variations and trends – A comparative study using MODIS and MISR level 3 datasets, Remote Sens. Environ., 181, 137–150, https://doi.org/10.1016/j.rse.2016.04.004, 2016.
Minguillón, M. C., Brines, M., Pérez, N., Reche, C., Pandolfi, M., Fonseca, A. S., Amato, F., Alastuey, A., Lyasota, A., Codina, B., Lee, H. K., Eun, H. R., Ahn, K. H., and Querol, X.: New particle formation at ground level and in the vertical column over the Barcelona area, Atmos. Res., 164–165, 118–130, https://doi.org/10.1016/j.atmosres.2015.05.003, 2015.
Molod, A., Takacs, L. L., Suarez, M. J., Bacmeister, J. T., Song, I.-S., and Eichmann, A.: The GEOS-5 Atmospheric General Circulation Model: Mean Climate and Development from MERRA to Fortuna, edited by: Suarez, M. J., NASA Tech. Memo. 104606, Vol. 28, Tech. Rep. Series on Global Modeling and Data Assimilation, 117 pp., 2012.
Molod, A., Takacs, L., Suarez, M., and Bacmeister, J.: Development of the GEOS-5 atmospheric general circulation model: evolution from MERRA to MERRA2, Geosci. Model Dev., 8, 1339–1356, https://doi.org/10.5194/gmd-8-1339-2015, 2015.
NASA Earth Sciences (GES) Data and Information Center (DISC): MERRA-2, available at: https://disc.gsfc.nasa.gov/daac-bin/FTPSubset2.pl, last access: 31 March 2019.
Page, S. E., Siegert, F., Rieley, J. O., Boehm, H. D. V., Jaya, A., and Limin, S.: The amount of carbon released from peat and forest fires in Indonesia during 1997, Nature, 420, 61–65, https://doi.org/10.1038/nature01131, 2002.
Peking University, PKU global emissions inventory, available at: http://inventory.pku.edu.cn/home.html, last access: 31 March 2019.
Pozzer, A., de Meij, A., Yoon, J., Tost, H., Georgoulias, A. K., and Astitha, M.: AOD trends during 2001–2010 from observations and model simulations, Atmos. Chem. Phys., 15, 5521–5535, https://doi.org/10.5194/acp-15-5521-2015, 2015.
Proestakis, E., Amiridis, V., Marinou, E., Georgoulias, A. K., Solomos, S., Kazadzis, S., Chimot, J., Che, H., Alexandri, G., Binietoglou, I., Daskalopoulou, V., Kourtidis, K. A., de Leeuw, G., and van der A, R. J.: Nine-year spatial and temporal evolution of desert dust aerosols over South and East Asia as revealed by CALIOP, Atmos. Chem. Phys., 18, 1337–1362, https://doi.org/10.5194/acp-18-1337-2018, 2018.
Qin, W., Liu, Y., Wang, L., Lin, A., Xia, X., Che, H., Bilal, M. and Zhang, M.: Characteristic and Driving Factors of Aerosol Optical Depth over Mainland China during 1980–2017, Remote Sens., 10, 1064, https://doi.org/10.3390/rs10071064, 2018.
Ramanathan, V., Crutzen, P. J., Kiehl, J. T., and Rosenfeld, D.: Atmosphere: Aerosols, climate, and the hydrological cycle, Science, 294, 2119–2124, https://doi.org/10.1126/science.1064034, 2001.
Remer, L. A., Kaufman, Y. J., Tanré, D., Mattoo, S., Chu, D. A., Martins, J. V., Li, R.-R., Ichoku, C., Levy, R. C., Kleidman, R. G., Eck, T. F., Vermote, E., and Holben, B. N.: The MODIS Aerosol Algorithm, Products, and Validation, J. Atmos. Sci., 62, 947–973, https://doi.org/10.1175/JAS3385.1, 2005.
Rosenfeld, D., Zhu, Y., Wang, M., Zheng, Y., Goren, T., and Yu, S.: Aerosol-driven droplet concentrations dominate coverage and water of oceanic low-level clouds, Science, 363, eaav0566, https://doi.org/10.1126/science.aav0566, 2019.
Sarangi, C., Kanawade, V. P., Tripathi, S. N., Thomas, A., and Ganguly, D.: Aerosol-induced intensification of cooling effect of clouds during Indian summer monsoon, Nat. Commun., 9, 3754, https://doi.org/10.1038/s41467-018-06015-5, 2018.
Silva, R. A., West, J. J., Zhang, Y., Anenberg, S. C., Lamarque, J. F., Shindell, D. T., Collins, W. J., Dalsoren, S., Faluvegi, G., Folberth, G., Horowitz, L. W., Nagashima, T., Naik, V., Rumbold, S., Skeie, R., Sudo, K., Takemura, T., Bergmann, D., Cameron-Smith, P., Cionni, I., Doherty, R. M., Eyring, V., Josse, B., Mackenzie, I. A., Plummer, D., Righi, M., Stevenson, D. S., Strode, S., Szopa, S., and Zeng, G.: Global premature mortality due to anthropogenic outdoor air pollution and the contribution of past climate change, Environ. Res. Lett., 8, 034005, https://doi.org/10.1088/1748-9326/8/3/034005, 2013.
Smirnov, A., Holben, B. N., Eck, T. F., Dubovik, O., and Slutsker, I.: Cloud-screening and quality control algorithms for the AERONET database, Remote Sens. Environ., 73, 337–349, https://doi.org/10.1016/S0034-4257(00)00109-7, 2000.
Song, Z., Fu, D., Zhang, X., Wu, Y., Xia, X., and He, J.: Diurnal and seasonal variability of PM2.5 and AOD in North China plain: Comparison of MERRA-2 products and ground measurements, Atmos. Environ., 191, 70–78, https://doi.org/10.1016/j.atmosenv.2018.08.012, 2018.
Stenchikov, G. L., Kirchner, I., Robock, A., Graf, H. F., Antuña, J. C., Grainger, R. G., Lambert, A., and Thomason, L.: Radiative forcing from the 1991 Mount Pinatubo volcanic eruption, J. Geophys. Res.-Atmos., 103, 13837–13857, https://doi.org/10.1029/98JD00693, 1998.
Su, S., Li, B., Cui, S., and Tao, S.: Sulfur dioxide emissions from combustion in China: From 1990 to 2007, Environ. Sci. Technol., 45, 8403–8410, https://doi.org/10.1021/es201656f, 2011.
Sun, E., Xu, X., Che, H., Tang, Z., Gui, K., An, L., Lu, C., and Shi, G.: Variation in MERRA-2 aerosol optical depth and absorption aerosol optical depth over China from 1980 to 2017, J. Atmos. Sol.-Terr. Phys., 186, 8–19, https://doi.org/10.1016/j.jastp.2019.01.019, 2019.
Sun, T., Che, H., Qi, B., Wang, Y., Dong, Y., Xia, X., Wang, H., Gui, K., Zheng, Y., Zhao, H., Ma, Q., Du, R., and Zhang, X.: Aerosol optical characteristics and their vertical distributions under enhanced haze pollution events: effect of the regional transport of different aerosol types over eastern China, Atmos. Chem. Phys., 18, 2949–2971, https://doi.org/10.5194/acp-18-2949-2018, 2018.
Tai, A. P. K., Mickley, L. J., and Jacob, D. J.: Correlations between fine particulate matter (PM2.5) and meteorological variables in the United States: Implications for the sensitivity of PM2.5 to climate change, Atmos. Environ., 44, 3976–3984, https://doi.org/10.1016/j.atmosenv.2010.06.060, 2010.
Thornhill, G. D., Ryder, C. L., Highwood, E. J., Shaffrey, L. C., and Johnson, B. T.: The effect of South American biomass burning aerosol emissions on the regional climate, Atmos. Chem. Phys., 18, 5321–5342, https://doi.org/10.5194/acp-18-5321-2018, 2018.
Torres, O., Chen, Z., Jethva, H., Ahn, C., Freitas, S. R., and Bhartia, P. K.: OMI and MODIS observations of the anomalous 2008–2009 Southern Hemisphere biomass burning seasons, Atmos. Chem. Phys., 10, 3505–3513, https://doi.org/10.5194/acp-10-3505-2010, 2010.
Tummon, F., Solmon, F., Liousse, C., and Tadross, M.: Simulation of the direct and semidirect aerosol effects on the southern Africa regional climate during the biomass burning season, J. Geophys. Res.-Atmos., 115, D19206, https://doi.org/10.1029/2009JD013738, 2010.
Wang, K., Dickinson, R. E., and Liang, S.: Clear sky visibility has decreased over land globally from 1973 to 2007, Science, 323, 1468–1470, https://doi.org/10.1126/science.1167549, 2009.
Wang, R., Tao, S., Shen, H., Huang, Y., Chen, H., Balkanski, Y., Boucher, O., Ciais, P., Shen, G., Li, W., Zhang, Y., Chen, Y., Lin, N., Su, S., Li, B., Liu, J., and Liu, W.: Trend in global black carbon emissions from 1960 to 2007, Environ. Sci. Technol., 48, 6780–6787, https://doi.org/10.1021/es5021422, 2014.
Wang, X., Liu, J., Che, H., Ji, F., and Liu, J.: Spatial and temporal evolution of natural and anthropogenic dust events over northern China, Sci. Rep., 8, 2141, https://doi.org/10.1038/s41598-018-20382-5, 2018.
Wang, Y. Q.: An Open Source Software Suite for Multi-Dimensional Meteorological Data Computation and Visualisation, J. Open Res. Softw., 7, 21, https://doi.org/10.5334/jors.267, 2019.
Willmott, C. J.: On the validation of models, Phys. Geogr., 2, 184–194, https://doi.org/10.1002/joc.2419, 1981.
Wei, J., Peng, Y., Guo, J., and Sun, L.: Performance of MODIS Collection 6.1 Level 3 aerosol products in spatial- temporal variations over land, Atmos. Environ., 206, 30–44, https://doi.org/10.1016/j.atmosenv.2019.03.001, 2019.
Yang, Y., Liao, H., and Lou, S.: Increase in winter haze over eastern China in recent decades: Roles of variations in meteorological parameters and anthropogenic emissions, J. Geophys. Res., 121, 13050–13065, https://doi.org/10.1002/2016JD025136, 2016.
Yu, Y., Notaro, M., Kalashnikova, O. V., and Garay, M. J.: Climatology of summer Shamal wind in the Middle East, J. Geophys. Res., 121, 289–305, https://doi.org/10.1002/2015JD024063, 2016.
Yumimoto, K., Tanaka, T. Y., Oshima, N., and Maki, T.: JRAero: the Japanese Reanalysis for Aerosol v1.0, Geosci. Model Dev., 10, 3225–3253, https://doi.org/10.5194/gmd-10-3225-2017, 2017.
Yue, X., Unger, N., Harper, K., Xia, X., Liao, H., Zhu, T., Xiao, J., Feng, Z., and Li, J.: Ozone and haze pollution weakens net primary productivity in China, Atmos. Chem. Phys., 17, 6073–6089, https://doi.org/10.5194/acp-17-6073-2017, 2017.
Zhai, S., Jacob, D. J., Wang, X., Shen, L., Li, K., Zhang, Y., Gui, K., Zhao, T., and Liao, H.: Fine particulate matter (PM2.5) trends in China, 2013–2018: contributions from meteorology, Atmos. Chem. Phys. Discuss., https://doi.org/10.5194/acp-2019-279, in review, 2019.
Zhang, H., Shen, Z., Wei, X., Zhang, M., and Li, Z.: Comparison of optical properties of nitrate and sulfate aerosol and the direct radiative forcing due to nitrate in China, Atmos. Res., 113, 113–125, https://doi.org/10.1016/j.atmosres.2012.04.020, 2012.
Zhang, J. and Reid, J. S.: A decadal regional and global trend analysis of the aerosol optical depth using a data-assimilation grade over-water MODIS and Level 2 MISR aerosol products, Atmos. Chem. Phys., 10, 10949–10963, https://doi.org/10.5194/acp-10-10949-2010, 2010.
Zhao, B., Jiang, J. H., Gu, Y., Diner, D., Worden, J., Liou, K. N., Su, H., Xing, J., Garay, M., and Huang, L.: Decadal-scale trends in regional aerosol particle properties and their linkage to emission changes, Environ. Res. Lett., 12, 054021, https://doi.org/10.1088/1748-9326/aa6cb2, 2017.
Zhao, B., Jiang, J. H., Diner, D. J., Su, H., Gu, Y., Liou, K.-N., Jiang, Z., Huang, L., Takano, Y., Fan, X., and Omar, A. H.: Intra-annual variations of regional aerosol optical depth, vertical distribution, and particle types from multiple satellite and ground-based observational datasets, Atmos. Chem. Phys., 18, 11247–11260, https://doi.org/10.5194/acp-18-11247-2018, 2018.
Zheng, B., Tong, D., Li, M., Liu, F., Hong, C., Geng, G., Li, H., Li, X., Peng, L., Qi, J., Yan, L., Zhang, Y., Zhao, H., Zheng, Y., He, K., and Zhang, Q.: Trends in China's anthropogenic emissions since 2010 as the consequence of clean air actions, Atmos. Chem. Phys., 18, 14095–14111, https://doi.org/10.5194/acp-18-14095-2018, 2018.
Zheng, Y., Che, H., Xia, X., Wang, Y., Wang, H., Wu, Y., Tao, J., Zhao, H., An, L., Li, L., Gui, K., Sun, T., Li, X., Sheng, Z., Liu, C., Yang, X., Liang, Y., Zhang, L., Liu, C., Kuang, X., Luo, S., You, Y., and Zhang, X.: Five-year observation of aerosol optical properties and its radiative effects to planetary boundary layer during air pollution episodes in North China: Intercomparison of a plain site and a mountainous site in Beijing, Sci. Total Environ., 674, 140–158, https://doi.org/10.1016/J.SCITOTENV.2019.03.418, 2019.