the Creative Commons Attribution 4.0 License.
the Creative Commons Attribution 4.0 License.
 | 15 Aug 2019
Deposition of ionic species and black carbon to the Arctic snowpack: combining snow pit observations with modeling
Hans-Werner Jacobi
Friedrich Obleitner
Sophie Da Costa
Patrick Ginot
Konstantinos Eleftheriadis
Wenche Aas
Marco Zanatta
Although aerosols in the Arctic have multiple and complex impacts on the regional climate, their removal due to deposition is still not well quantified. We combined meteorological, aerosol, precipitation, and snowpack observations with simulations to derive information about the deposition of sea salt components and black carbon (BC) from November 2011 to April 2012 to the Arctic snowpack at two locations close to Ny-Ålesund, Svalbard. The dominating role of sea salt and the contribution of dust for the composition of atmospheric aerosols were reflected in the seasonal composition of the snowpack. The strong alignment of the concentrations of the major sea salt components in the aerosols, the precipitation, and the snowpack is linked to the importance of wet deposition for transfer from the atmosphere to the snowpack. This agreement was less strong for monthly snow budgets and deposition, indicating important relocation of the impurities inside the snowpack after deposition. Wet deposition was less important for the transfer of nitrate, non-sea-salt sulfate, and BC to the snow during the winter period. The average BC concentration in the snowpack remains small, with a limited impact on snow albedo and melting. Nevertheless, the observations also indicate an important redistribution of BC in the snowpack, leading to layers with enhanced concentrations. The complex behavior of bromide due to modifications during sea salt aerosol formation and remobilization in the atmosphere and in the snow were not resolved because of the lack of bromide measurements in aerosols and precipitation.
- Article
(6473 KB) -
Supplement
(3131 KB) - BibTeX
- EndNote


Aerosols and specifically black carbon (BC) play an important role in the regional climate of the Arctic (Shindell, 2007; Quinn et al., 2007) since they modify the radiation balance of the atmosphere, as well as the activation of clouds, and reduce the albedo of different cryospheric components like snow and glaciers, enhancing the melting of snow and ice after deposition. Arctic aerosols exhibit a pronounced seasonal cycle with high concentrations in winter and early spring and lower values in summer (Law and Stohl, 2007; Quinn et al., 2007; Eleftheriadis et al., 2009). This seasonality is caused by different processes related to emission, transport, and deposition, which undergo seasonal cycles (Law and Stohl, 2007; Croft et al., 2016).
Sea spray, dust, and biogenic aerosol particles are important natural aerosol types in the Arctic. In contrast, Arctic BC stems primarily from regions outside the Arctic (Law and Stohl, 2007). Like in all marine environments, sea salt aerosol (SSA) dominates the atmospheric aerosol burden over the Arctic Ocean and its coastal areas (e.g., Geng et al., 2010; Weinbruch et al., 2012). The production and climatic effects of SSA in the Arctic are expected to change in the future as a result of changes in the sea ice cover and ocean temperatures (Struthers et al., 2011; Zábori et al., 2013). Dust may act as effective ice nuclei in the Arctic (Si et al., 2018) and may have the potential to influence radiative and other properties of mixed-phase cold clouds.
Removal due to deposition controls the lifetime of aerosols and in the Arctic determines the input of aerosols to the snow and glaciers. In fact, past atmospheric input has been reconstructed from ice cores in the Arctic (Legrand and Mayewski, 1997; Isaksson et al., 2003; Bauer et al., 2013). Moreover, the deposition of BC to cryospheric components like snow and sea ice also impacts the local and regional climate in the Arctic due to the lowering of the snow albedo and associated albedo feedback processes (e.g., Flanner et al., 2007; Bond et al., 2013; Jacobi et al., 2015). The removal is a result of wet deposition caused by precipitation and dry deposition of particles, which depend on aerosol size, meteorological conditions, and properties of the atmospheric boundary layer. Despite its importance, the deposition of aerosols to the cryosphere is not well quantified for many polar sites, and even the respective contributions of wet and dry deposition are not well known for many compounds (Legrand and Mayewski, 1997; Bauer et al., 2013). Moreover, Stohl et al. (2007) evoked a potentially large enhancement of the deposition of impurities due to blowing snow during a period with elevated aerosol concentrations.
The recommended method to determine dry deposition relies mostly on the calculation of fluxes based on atmospheric composition and an estimated dry deposition velocity (Vet et al., 2014), which shows a large uncertainty. In the case of BC, the calculated deposition varies considerably across models since it depends on the applied assumptions and parameters concerning the size of the aerosols and the mixing state (Bond et al., 2013). For example, the estimated total BC deposition in the Arctic varies between 8 and more than 13 Tg C yr−1, with dry deposition contributing up to 40 % of the total removal (Liu et al., 2011). Although a comprehensive understanding of the microphysics and chemistry related to aging and deposition is essential for a successful simulation of BC concentrations over the Arctic (Liu et al., 2011; Sharma et al., 2013), direct BC deposition measurements are still limited. In addition, the few available measurements of the dry deposition of submicron particles over snow also show a large range of deposition velocities from 0.02 to 0.33 cm s−1 (Duan et al., 1988; Contini et al., 2010; Grönlund et al., 2002).
While detailed investigations of the chemical properties of aerosols have been performed at Ny-Ålesund based on single-particle analysis (e.g., Geng et al., 2010; Weinbruch et al., 2012), similar studies for the composition of precipitation and the snowpack are currently missing. Moreover, due to the rapid changes in aerosol sources it is urgent to better quantify the fate of different aerosol types in the Arctic. Here, we combine observations in the snowpack and the atmosphere to better constrain deposition processes for major and minor sea salt components and BC around Ny-Ålesund, Svalbard, during the winter period. We used meteorological observations to perform detailed physical snowpack modeling. The results of such simulations are to our knowledge for the first time combined with precipitation and atmospheric aerosol measurements to derive chemical profiles and monthly snow budgets related to dry and wet deposition. The calculated profiles are finally compared to physical and chemical snowpack measurements to evaluate the performance of the snowpack model and to improve our understanding of the deposition processes. Variations in the concentrations of multiple species in aerosols, precipitation, and in the snowpack are used to study the transfer processes from the atmosphere to the snow for the investigated species.
2.1 Snow sampling
Sampling of snow was performed in snow pits on two glaciers located approximately 8 and 35 km to the east of Ny-Ålesund, Svalbard (Fig. 1). The snow was sampled on 30 March 2012 on the Kongsvegen glacier (snow pit KV; 78.755∘ N, 13.337∘ E; ∼670 m a.s.l.) and on 13 April 2012 on the Austre Lovénbreen glacier (snow pit AL; 78.871∘ N, 12.150∘ E; ∼340 m a.s.l.). The Kongsvegen glacier is one of the largest glaciers in the vicinity of Ny-Ålesund, with an area of ∼100 km2 and a length of 26 km. It reaches from sea level to a maximum altitude of 750 m, with slopes ranging from 0.5 to 2.5∘ (Karner et al., 2013). Austre Lovénbreen is a low-elevation, small-valley glacier with an area of ∼10 km2 and a surrounding topography affecting meteorological conditions like wind and precipitation. Nevertheless, the snow pit was located in the central part of the glacier with rather homogeneous snow properties (Bernard et al., 2017). In both cases, pits were dug down to the ice layer formed during the summer–fall period in 2011. The sampled snowpack thus represented the precipitation accumulated during the previous winter period. For both snow pits the stratigraphy was established based on visual inspection of the different layers following international guidelines (Fierz et al., 2009). Snow density was measured using a 250 cm3 triangular snow cutter. Furthermore, duplicate snow samples were collected using 50 mL polypropylene tubes for either chemical or BC analysis. If allowed by the thickness and hardness, each identified snow layer was sampled separately and at least once. The tubes, with an inner diameter of 2.7 cm, were horizontally inserted into the wall of the snow pit after careful cleaning of the snow surface. The depths of the snow samples reported below correspond to the center of the tube openings. Furthermore, three fresh snow samples were collected within 12 h after the end of precipitation on 24 (two samples) and 29 March at a distance of ∼5 km from the village of Ny-Ålesund, which were analyzed for BC.
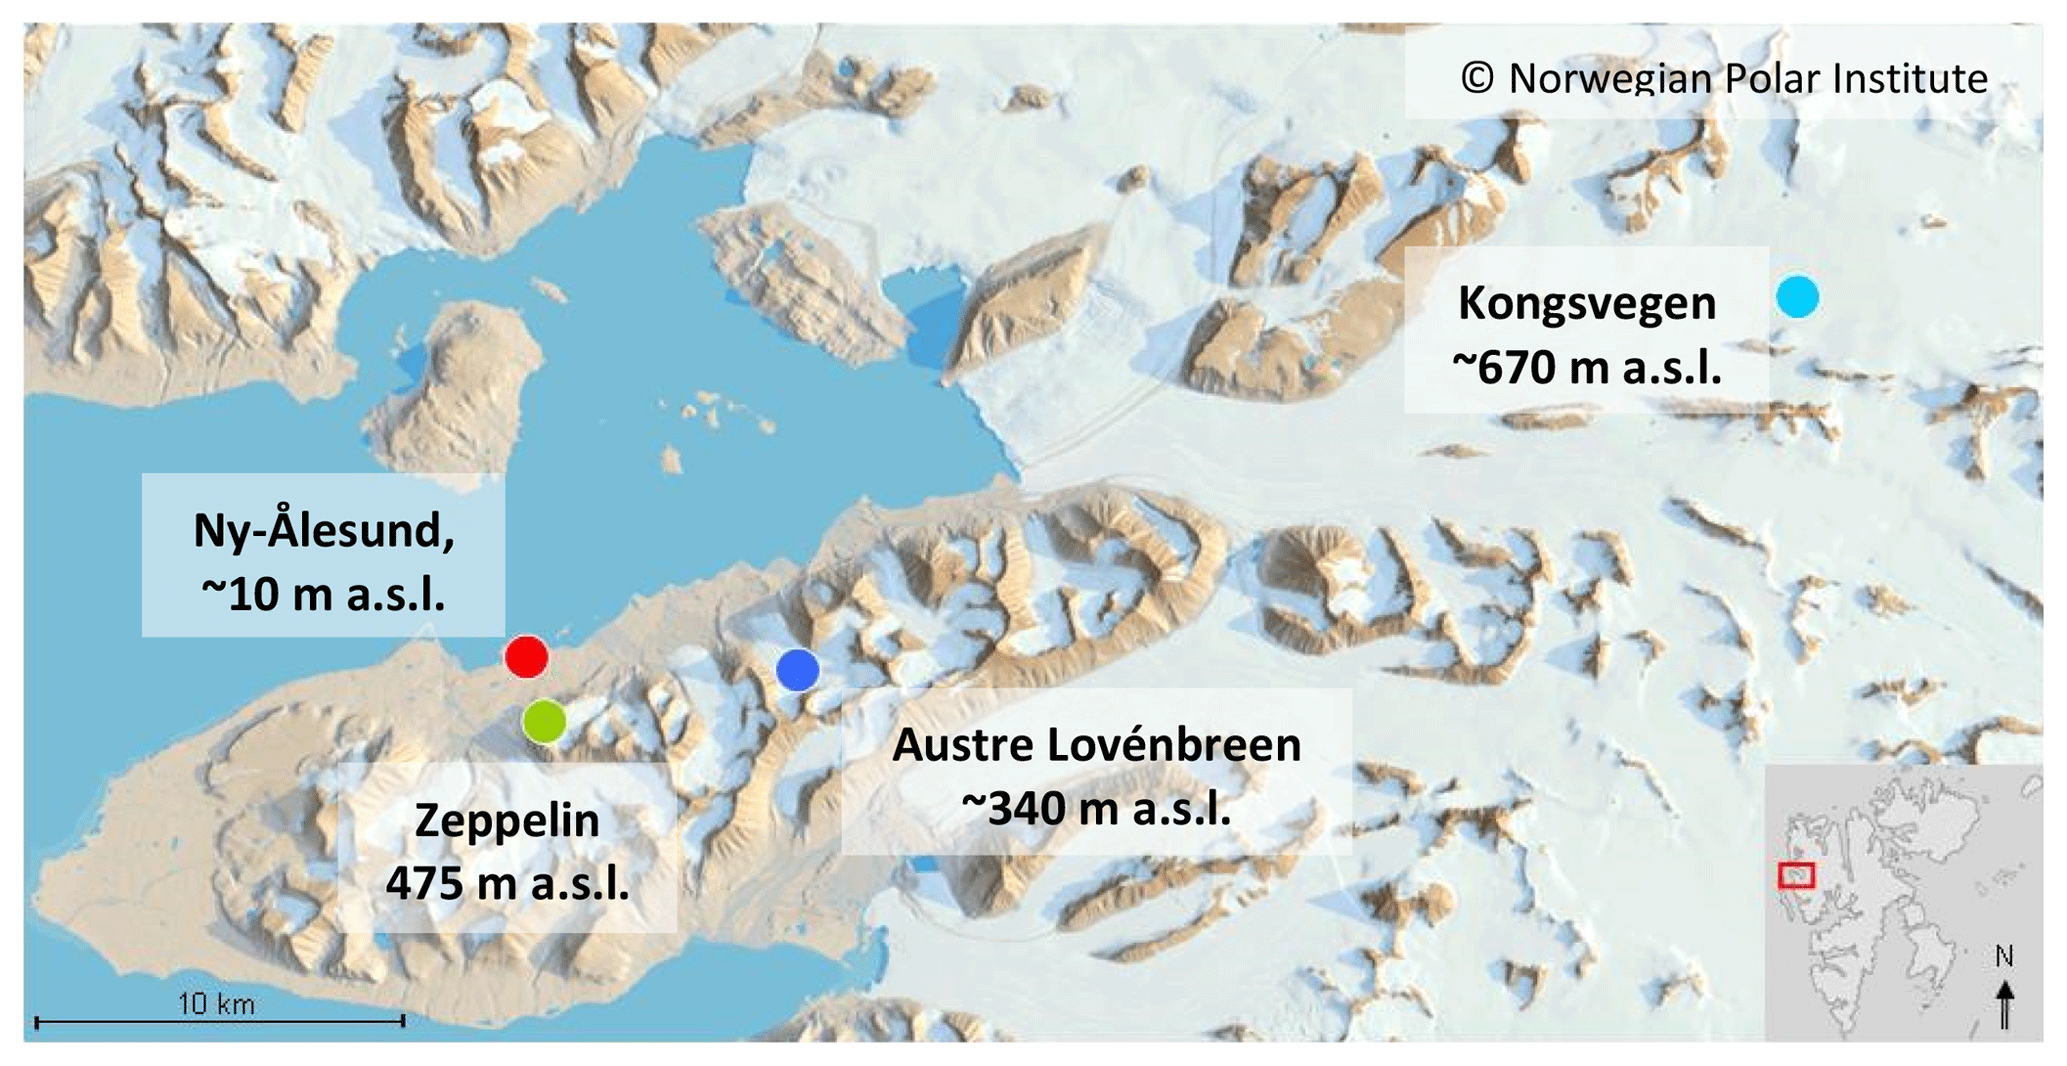
Figure 1A 3-D map of the Kongsfjord area with Ny-Ålesund (red), Zeppelin Station (green), and the locations of the snow pits on the Kongsvegen (light blue) and Austre Lovénbreen glaciers (dark blue) indicated (adapted from ©Norwegian Polar Institute).
2.2 Snow analysis
All samples were stored at −20 ∘C at Ny-Ålesund, transported frozen to Grenoble using isolated boxes, and stored further at −20 ∘C until analysis. All samples were melted in a thermostated water bath and were analyzed within 30 min after melting. Concentrations of the components sodium, potassium, magnesium, calcium, chloride, sulfate, nitrate, and bromide were determined using ion chromatography in one of the duplicate snow samples. The samples were filtered using 0.22 µm Acrodisc filters before analysis. Anions and cations were analyzed with a combined suppressed conductivity Dionex ICS3000 instrument using AS11-HC and CS12 columns. The detection limit is typically below 1 ppb for all measured compounds. The analytical precision is around 5 % for all ions. Five analyzed samples showed bromide concentrations below the detection limit (three samples for snow pit KV, two samples for snow pit AL), which were replaced by values of 0.5 ppb for all further calculations. Non-sea-salt sulfate concentrations were calculated according to [nss sulfate] = [sulfate] − 0.2516 × [sodium] (Millero et al., 2008).
Refractory BC (rBC) was determined with a single-particle soot photometer (SP2, Droplet Measurement Technologies, USA). Details of the analytical procedure are described in Lim et al. (2014). Briefly, the SP2 allows for quantifying the mass of single particles using a laser-induced incandescence technique. The instrument has unity detection efficiency for rBC particles with diameters between 80 and 600 nm, while avoiding interferences with other inorganic or organic species. The instrument was calibrated using size-selected fullerene soot (Alfa Aesar Inc., USA). A commercial nebulizer (APEX-Q, Elemental Scientific Inc., Omaha, USA) was used to transfer the particles from the melted snow to the aerosol phase. The losses during aerosolization were determined daily using suspensions of Aquadag standards with different mass concentrations, resulting in an average efficiency of 56 %, which was applied to all reported rBC concentrations. Further details are shown in the Supplement (Fig. S1). Two samples from snow pit AL showed rBC concentrations below the limit of quantification of 0.03 ppb (Lim et al., 2014), which was used instead for all further calculations.
2.3 Meteorological data
Meteorological parameters were recorded close to the analyzed snow pit KV by an energy balance station (Karner et al., 2013). The station provided data on air temperature, relative humidity, wind speed, wind direction, and shortwave and longwave radiation components. Surface height changes were recorded with an ultrasonic ranger and allowed for deriving accumulation rates. Temperature-corrected raw data were retained for changes of more than 1 cm h−1 to filter significant events and exclude potentially inaccurate data, which also may be due to potential disturbances by drifting snow. The significance of these events was cross-checked by temperature and humidity criteria. The resulting data were converted to water equivalent using a wind- and temperature-dependent parameterization of fresh snow density as used in the CROCUS snow model (Vionnet et al., 2012). A scaling factor of 1.1 was applied to achieve consistency with total snow height and average density observed in investigated snow pits. Overall, this procedure yields data on snow accumulation and thus represents changes in water equivalent in response to snow precipitation and subsequent redistribution. More details about this procedure as well as about the quality control of further recorded meteorological parameters are given in Karner et al. (2013) and Sauter and Obleitner (2015). Cloud cover was estimated from the ratio between observed and theoretical incoming shortwave radiation using the method described in Jacobi et al. (2015).
2.4 Snowpack modeling and snow budgets
Simulations for the snowpack on the Kongsvegen glacier were performed with the one-dimensional multilayer physical snowpack model CROCUS (Vionnet et al., 2012; Jacobi et al., 2010a, 2015), which was previously applied for mass-balance simulations of the glacier (Sauter and Obleitner, 2015). The model solves the surface mass and energy budgets by taking into account physical processes like heat diffusion, transfer of radiation, densification, sublimation, condensation, and melting. The model is forced using meteorological data including air temperature, wind speed, relative humidity, precipitation rate and phase, incoming direct and diffuse shortwave radiation, incoming longwave radiation, and cloud cover. The forcing data for the period September 2011 to March 2012 were generated from observations at the energy balance station KNG8. The model was initiated with an ice layer set to a temperature of 0 ∘C. The output refers to multiple homogeneous horizontal layers that are established according to snowfall events and undergo transformation related to a metamorphism scheme. The model delivers physical properties of each snow layer including thickness, density, temperature, structure parameters, and date of accumulation. According to the simulations the oldest conserved snowpack layer was deposited on 30 October 2011. The simulations deliver accumulation dates for each simulated layer, which were used to divide total snow budgets into monthly budgets for October 2011 and March 2012. However, the incomplete October budgets were not used for further analysis. Concentrations and densities of the simulated snow layers were used to calculate monthly budgets for each impurity.
We estimate an overall uncertainty of 21 % for the snow budgets due to error propagation from the combination of the spatial variability of 20 % (Svensson et al., 2013), analytical error of 5 % (2.2), and error of the density measurements of 6 % (Proksch et al., 2016). As a result all calculated (total and monthly) budgets differing by less than 21 % are not considered to be significantly different.
2.5 Atmospheric concentrations
Atmospheric concentrations Catm of ionic species in the aerosols were measured at Zeppelin Station at an altitude of 475 m a.s.l.. The aerosols were collected using a three-stage filter pack sampler with no size cutoff (Aas et al., 2013). The data were downloaded from the EBAS database (ebas.nilu.no) for the period 30 October 2011 to 29 March 2012 as daily averages. Concentrations of atmospheric BC corresponding to equivalent BC (eBC) were determined at Zeppelin Station using the 880 nm channel BC values recorded by a seven-wavelength AE31 aethalometer (Eleftheriadis et al., 2009) with updated parameters for absorption and attenuation according to Backman et al. (2017) and Zanatta et al. (2018). Daily averages were used for further calculations (Fig. S1). The eBC time series includes 23 missing values (7 d in November, 16 d in December) and 19 values below the detection limit (BDL) of 7 ng m−3 in the analyzed period. While the missing values were replaced by the monthly averages, the impact of using either the maximum or minimum value (7 or 0 ng m−3) to replace the BDL values remained small for calculated monthly averages (< 0.8 ng m−3 and < 7 %). Therefore, all BDL values were replaced by 3.5 ng m−3, which is equal to half of the detection limit, before further calculations.
2.6 Dry and wet deposition
Dry deposition of particles (Ddry; g m−2) was calculated using Eq. (1):
with the deposition velocity vd (m s−1), the atmospheric concentration of the aerosols Catm (µg m−3), and the averaging time t for the atmospheric measurements (here 24 h). While wind speed- and particle-size-dependent parameterizations for vd are available (e.g., Zhang et al., 2001), the use of single values of vd to estimate dry deposition fluxes from aerosol concentrations is still standard. Here, we used a high vd value of 1 cm s−1 for the ionic species, assuming that they were mainly associated with coarse sea salt aerosols (Zhang et al., 2001). Thus, we consider the estimated dry deposition of these components as an upper limit. The gas-phase species nitric acid (HNO3) and sulfur dioxide (SO2) also contribute to the total dry deposition of nitrogen and sulfur but are not included in the estimates here. Since bromide was not determined in the aerosols, the standard seawater ratio and observed sodium concentrations were used to estimate the dry deposition of bromide according to Dwet (bromide) = 0.00624×Dwet (sodium) (Millero et al., 2008). A smaller vd of 0.1 cm s−1 was used for BC, which corresponds to a typical global annual mean in many models (Wang et al., 2011) and is within the range of observed deposition velocities of submicron particles over snow (Duan et al., 1988; Contini et al., 2010; Grönlund et al., 2002). The total and monthly dry deposition was calculated as the sum of the daily deposition either for the full period or for each month from November 2011 to March 2012.
Wet deposition (Dwet; g m−2) was calculated using observed precipitation amounts (P; L m−2) and chemical concentrations (Cprecip; mg L−1) of the precipitation collected at Ny-Ålesund close to sea level using Eq. (2):
Major sea salt components and nitrate were determined using ion chromatography in precipitation samples collected on a weekly basis using a bucket funnel system in summer and a snow sampler in winter (Kühnel et al., 2011; Aas et al., 2013). The data downloaded from the EBAS database (ebas.nilu.no) were used without further correction, although the bulk sampler likely also collected gaseous compounds and particulate material due to dry deposition. Especially in periods with high wind speed, the bulk collector may also catch large sea spray aerosols. However, the exact contribution of dry deposition to the wet deposition calculated here is difficult to quantify since it depends on the frequency of rain events and episodes with elevated sea salt aerosols. The total and monthly wet deposition was calculated as the sum for the period 31 October 2011 to 1 April 2012 and for each month (except October). No measurements of bromide and BC in the precipitation are available. For bromide, wet deposition was estimated from the wet deposition of sodium, also by applying standard seawater ratios. Wet deposition of BC was estimated according to the scavenging scheme proposed by Sharma et al. (2013). The change in atmospheric BC concentration Δ[BC] was estimated using the BC concentration [BC], the scavenging coefficient (R; m2 kg−1), the precipitation rate (Pt, L m−2 s−1), and the time step (Δt, s) according to Eq. (3):
We used a scavenging coefficient of m2 kg−1 as recommended by Sharma et al. (2013). Since all scavenged atmospheric BC will be mixed into the accumulated weekly snowfall (Pt×Δt), the BC concentration in the snow [BC]snow (ppb) is calculated according to Eq. (4), where h denotes the depth of the atmospheric column affected by scavenging:
Since typical top heights of clouds in the wintertime Arctic are on the order of 4500 m (Intrieri et al., 2002) we used h=4500 m for the tropospheric column affected by scavenging. BC concentrations in snow were calculated only for weeks with precipitation recorded at Ny-Ålesund and using the observed weekly precipitation rates. For further calculations, we used monthly average BC concentrations in the snow due to scavenging to derive monthly wet deposition according to Eq. (2). Finally, total wet deposition corresponds here to the sum of the monthly wet deposition from November to March.
3.1 Physical properties of the snowpack
The stratigraphy and densities for the two analyzed snow pits are shown in Fig. 2. The investigated snow layers comprised depths down to −263 cm below the surface for snow pit KV and −195 cm for snow pit AL, in both cases reaching the surface of the ice layer formed during the previous summer. While both snow pits showed a typical increase in density from the surface to the deeper layers, the variability in terms of grain types and layer structures was higher for snow pit AL. At an altitude of 670 m a.s.l. the high wind speeds at snow pit KV led to the formation of several wind-packed layers. The impact of significant melting was not identified in the snow pit KV, although the recorded temperatures reached values several times above or close to the melting point (see Fig. S2). In contrast, at an altitude of 340 m a.s.l. melting events were more apparent in snow pit AL, which exhibited several melt–freeze crusts, probably due to warmer periods in November 2011 and January 2012, accompanied by air temperatures above 0 ∘C and large amounts of rain at sea level in Ny-Ålesund. The stronger impact of melting in the snow pit AL was confirmed by the chemical composition. The ratio of magnesium to sodium has been proposed as a melt indicator (Iizuka et al., 2002; Virkkunen et al., 2007; Ginot et al., 2010), with lower ratios caused by the preferential removal of magnesium due to percolating water. While the average magnesium-to-sodium ratios were around 0.12 in both snow pits, in snow pit AL the variability was higher and minimum values lower. The smallest ratios were encountered in layers deposited in November, January, and March corresponding to the months with elevated air temperatures. Nevertheless, in both snow pits the ratios did not reach the small ratios observed in ice cores from Svalbard (Iizuka et al., 2002; Virkkunen et al., 2007). Therefore, a redistribution of the impurities probably occurred in the snowpack due to melting, with a stronger impact on the Austre Lovénbreen glacier. This is, however, unlikely to have led to a complete elution. Hence, the overall budgets of both snow pits are assumed to be mostly unaffected by melting.
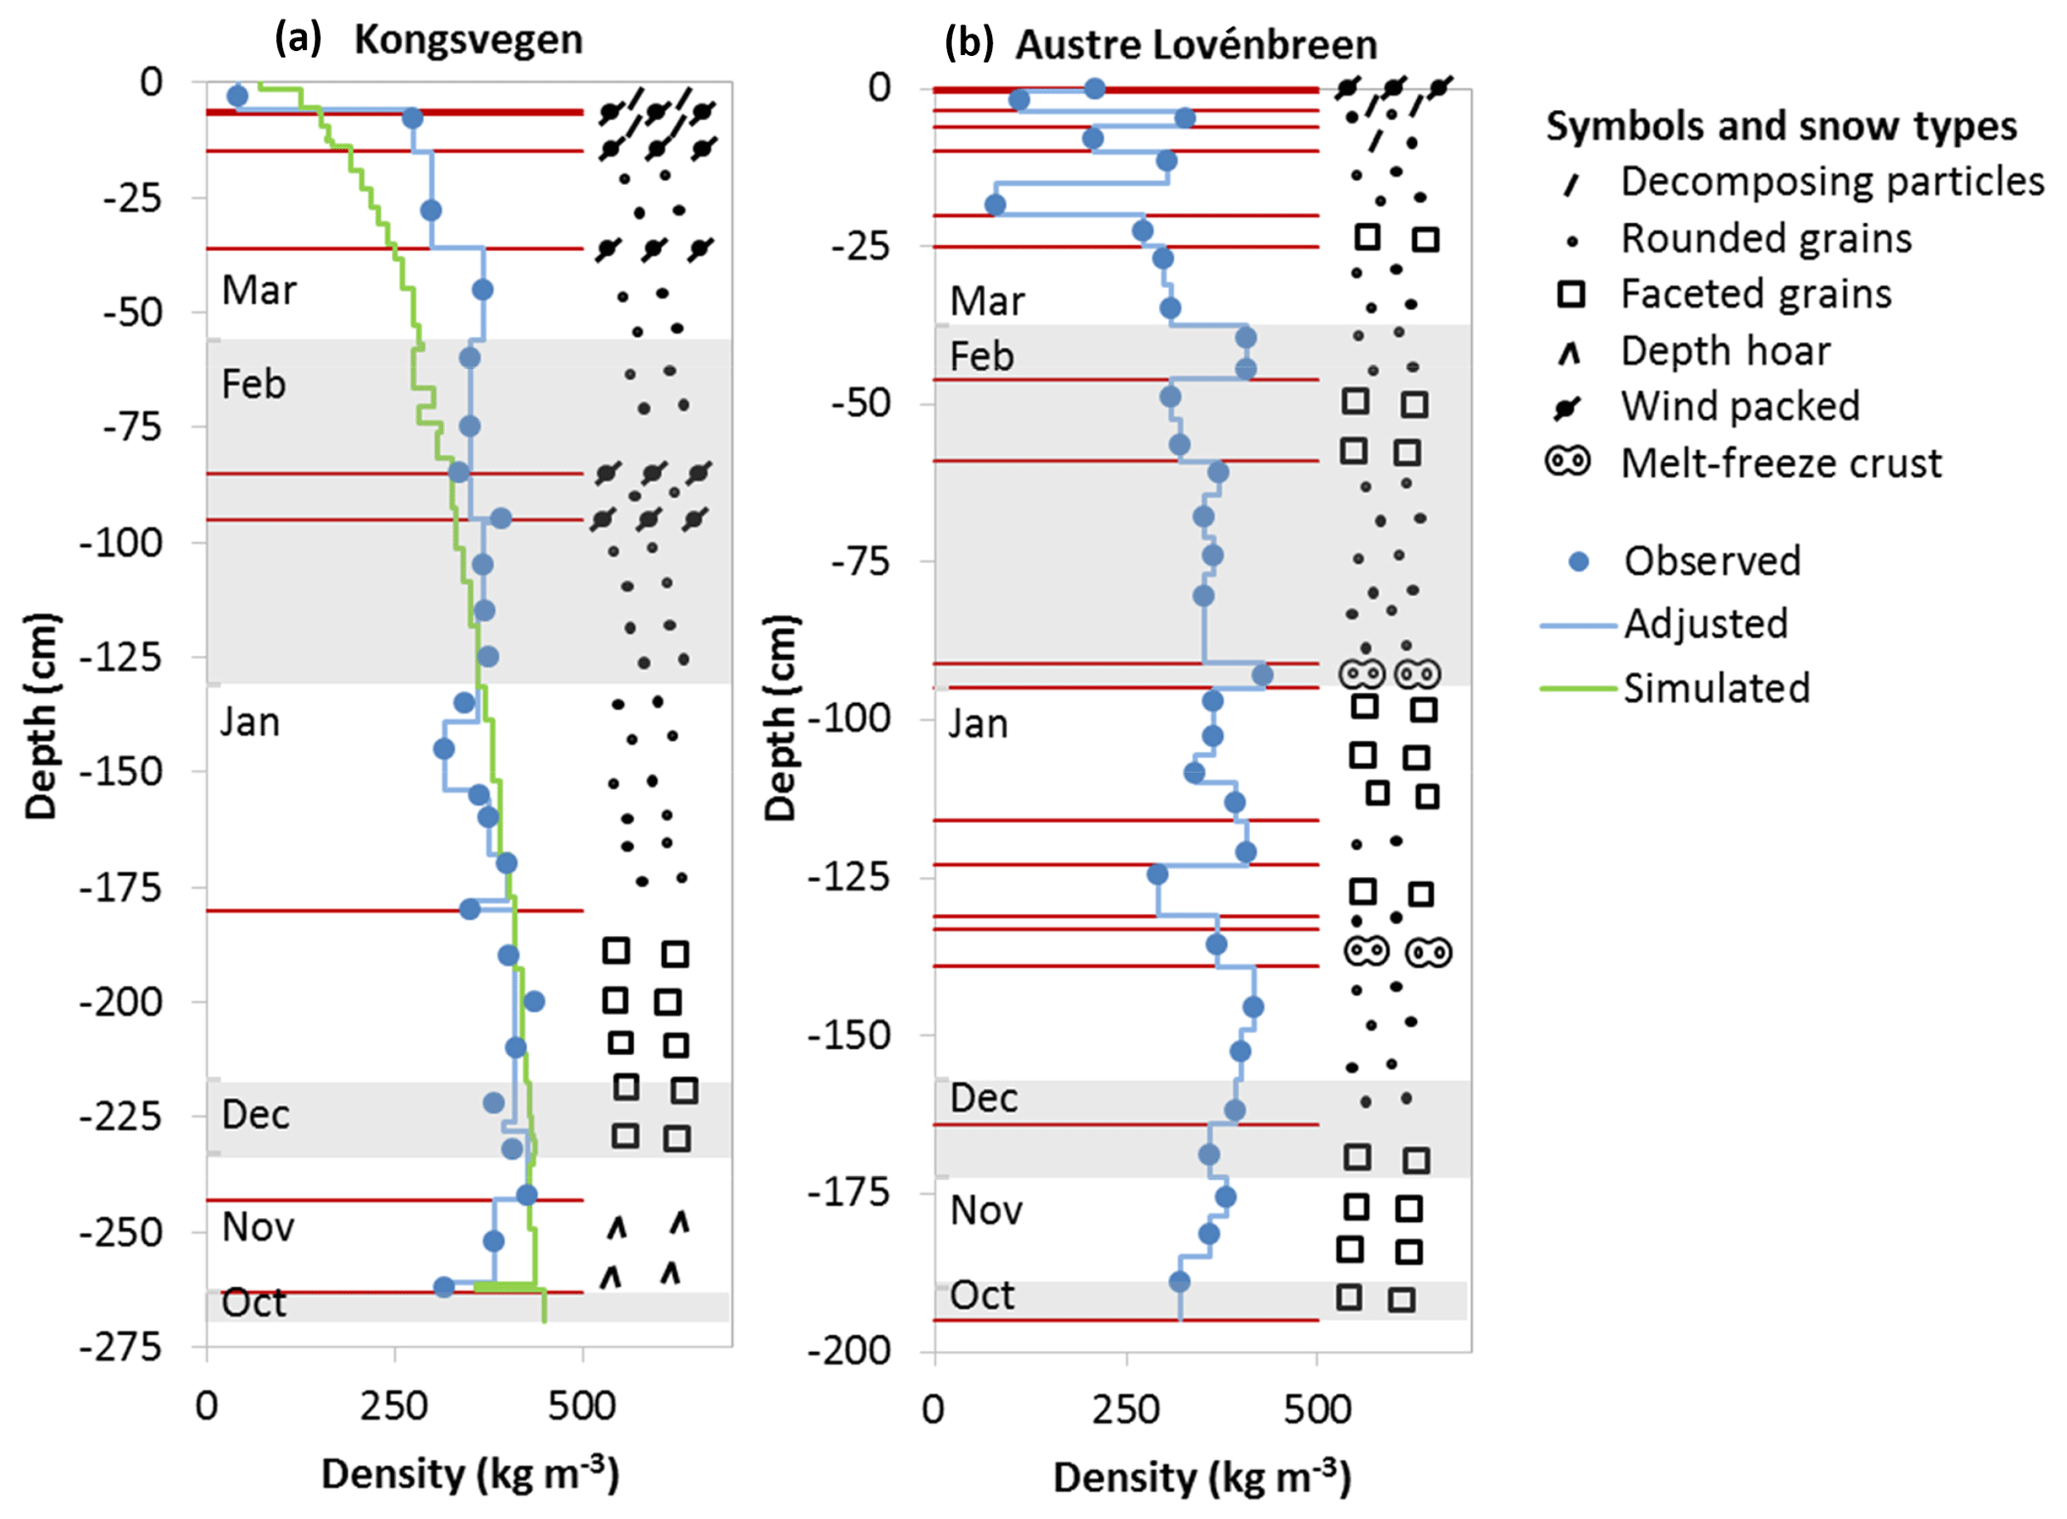
Figure 2Snow stratigraphy observed in the snow pits KV (a) and AL (b). Note the different depth scales. Snow types are indicated on the right side using the classification recommended by Fierz et al. (2009), with layers separated by horizontal red lines. Blue circles indicate observed snow densities, and vertical blue lines correspond to snow densities adjusted to observed and sampled layers. The green line shows snow densities simulated with the CROCUS model for snow pit KV. The alternating shaded and non-shaded areas correspond from the top to the months March to October.
Together with the stratigraphy, full snow density profiles were established for both pits as shown in Fig. 2. According to these profiles, the total accumulation amounts to 943 and 667 mm of snow water equivalent (SWE) for the snow pits KV and AL. The accumulation in the pit KV was close to the maximum observed in the years 2007 to 2009 at altitudes above 600 m on the Kongsvegen glacier (Forsström et al., 2013). The observed accumulation of precipitation at Ny-Ålesund close to sea level corresponds to a value of 278 mm for the period 31 October 2011 to 1 April 2012. The gradient in accumulation between the snow pits KV, AL, and Ny-Ålesund was slightly higher than 30 % per 100 m of altitude increase and is thus close to the accumulation gradients previously applied for the nearby Midre Lovénbreen and Austre Brøggerbreen glaciers (Hodson et al., 2005).
CROCUS model results obtained for the snow pit KV were used here for further analysis. The snowpack simulated for 29 March 2012 consists of 50 layers with varying densities covering a total depth of −269.4 cm (Fig. 2). The densities below −80 cm are well represented by the model, but the densities between −10 and −80 cm are underestimated compared to the observations. While density measurements using a cutter suffer from a systematic overestimation (Proksch et al., 2016), a strong bias in simulated snow densities in the top layers is common for snow models applied to polar regions (e.g., Groot Zwaaftink et al., 2013). Despite the differences in the top layers, the simulated total SWE of 937 mm is in excellent agreement with the observed SWE. Shaded areas in Fig. 2 indicate the different layers deposited in the months from October 2011 to March 2012 according to the simulations. Only complete identified snow layers were attributed to specific months. Assuming a constant linear decrease in accumulation from the snow pit KV to AL, monthly layers were also attributed to snow pit AL with linearly interpolated depth ranges using the ratio of the total snow heights of both pits (Fig. 2).
3.2 Impurity profiles in the snowpack
Colocated impurity profiles were established for each measured compound by combining the measured concentrations with either the observed stratigraphy for both snow pits or the simulated stratigraphy for snow pit KV. Profiles were established by assuming homogeneous concentrations for the identified snow layers and by adjusting the closest observed concentrations to the vertical extent of the observed or simulated layers. Figure 3 shows the observed sodium and rBC concentrations as well as the profiles. Some common features can be identified for sodium in the upper part of both snow pits. Snow pit KV showed three layers with elevated concentrations: a first peak in the March layer around −25 cm and a double peak in the February layer with a maximum around −60 cm and a broad maximum below −100 cm (Fig. 3a). A comparable pattern was found in snow pit AL, with the strongest peak in the March layer at −20 cm and two maxima in February at −40 cm as well as a broad peak between −60 and −90 cm (Fig. 3b). However, the relative strengths of the peaks are different in the two pits. These differences may be caused by site-dependent deposition fluxes. For example, strong vertical gradients in aerosol concentrations between the altitudes of the snow pits, as are sometimes observed for BC (Spolaor et al., 2017) have a direct impact on the local deposition fluxes. However, the differences in the profiles may also be related to meltwater formation and percolation, which likely had a stronger impact on snow pit AL. This may have also contributed to the higher variability of sodium in the lower part of the snow pit AL compared to KV. Moreover, peaks may have been missed at KV because of the larger spacing between the samples.
The lowest concentrations of all studied impurities were found for rBC. Average rBC concentrations differed by a factor of 2 between the two locations, with 0.6 ppb at KV (Fig. 3c) and 1.2 ppb at AL (Fig. 3d). The average concentration at AL is in good agreement with the average rBC concentration of (1.4±0.2) ppb for the snowpack accumulated during winter 2012–2013 on the Brøggerbreen glacier at 300 m of altitude (Sinha et al., 2018). However, the concentrations are lower than elemental carbon (EC) measured with a thermo-optical method in samples from the Kongsvegen glacier above 600 m a.s.l, where Forsström et al. (2013) found median concentrations of 1.4, 4.2, and 3.8 ppb in April 2007, 2008, and 2009. It should be noted here and during all further discussion that a comparison of the quantities EC, eBC, and rBC introduces additional uncertainties. For example, a previous comparison of EC and rBC in snow samples from Greenland indicated a mean ratio of 2 (Lim et al., 2014), while atmospheric rBC and eBC measurements in Ny-Ålesund are more consistent if adjusted absorption properties are used (Zanatta et al., 2018). These uncertainties may partly explain the differences in the determined concentrations. While an overall decrease in atmospheric BC concentrations in the Arctic (Sinha et al., 2017) potentially contributed to lower concentrations in 2012 compared to the years 2007 to 2009, the impact is difficult to analyze due to large interannual meteorological variabilities impacting the transport of BC to the Arctic (Eleftheriadis et al., 2009; Hirdmann et al., 2010), occasionally leading to high pollution events in wintertime (e.g., Winiger et al., 2012). Melting processes probably caused the higher variability of BC in the AL pit since insoluble particles show enrichments at the snow surface, generating layers with enhanced concentrations in the Arctic (Forsström et al., 2013).

Figure 3Sodium (a, b) and rBC concentrations (c, d) in the snow pits KV (a, c) and AL (b, d). Blue circles indicate observed concentrations, and blue lines correspond to concentrations adjusted to the observed stratigraphy. The green line shows concentrations adjusted to the simulated stratigraphy for the snow pit KV. The alternating shaded and non-shaded areas correspond from the top to the months March to October.
3.3 Wintertime snow budgets and deposition of ionic compounds
Total snow budgets of all measured compounds for the two snow pits were calculated using three different approaches. (i) Simple budgets were determined by multiplying the average concentrations by the total SWE. (ii) Adjusted budgets were calculated from the interpolated density profile shown in Fig. 2 and colocated concentration profiles like in Fig. 3. (iii) For snow pit KV, simulated budgets were obtained by combining the simulated density profiles with simulated concentration profiles. All calculated budgets are summarized in Fig. 4, which also shows the observed wet deposition at Ny-Ålesund and the estimated total dry aerosol deposition for the period 31 October 2011 to 29 March 2012. According to the meteorological records of the Norwegian Meteorological Service (eklima.met.no), no further precipitation occurred between 29 March and 15 April 2012, and the total wet deposition can thus be compared to the budget of the snow pit AL.

Figure 4Snow budgets of sea salt components, nss sulfate, nitrate, bromide (a, b), and BC (c) for the snow pits KV (Kongsvegen, orange) and AL (Austre Lovénbreen, green) for October 2011 to March 2012 according to different calculation methods: simple budgets from average concentrations and total SWE (light colors), adjusted budgets using colocated concentration and density profiles (middle colors), and simulated budgets for KV using interpolated concentration and simulated density profiles (dark colors). Also shown is the total deposition as the sum of observed wet deposition at Ny-Ålesund (blue) and estimated dry particle deposition (red). For bromide the wet deposition was estimated from the standard seawater ratio and all numbers are multiplied by 10. For BC the snow budgets correspond to rBC, while the wet deposition was estimated for the KV snow pit. The BC deposition corresponds to eBC. See text for further details.
Due to differences smaller than 21 % in their budgets, it can be assumed that differences for chloride, sodium, magnesium, calcium, and potassium are not significant. The spatial variability of snow concentrations at a scale of meters can be even larger (e.g., Svensson et al., 2013). Thus, the total snow budgets for the pits KV and AL reveal a consistent picture for the sea salt components chloride, sodium, magnesium, potassium, and bromide (Fig. 4), with insignificant differences in the observed total budgets despite differences in altitude and accumulation. This is consistent with recent observations revealing characteristic patterns of aerosol concentrations along Svalbard glaciers, including the Kongsvegen, demonstrating consistent formation, transport, and exchange processes between the atmosphere and the snow (Spolaor et al., 2017).
If post-depositional processes are negligible, the total snow budgets of the impurities correspond to the input due to the sum of wet and dry deposition. Based on the comparison of the total snow budgets with the observed wet deposition, the estimated dry deposition is evaluated for the different impurities. The total snow budgets of chloride, sodium, magnesium, and potassium agree well with the observed wet deposition at Ny-Ålesund, with differences smaller than 20 % for the period October 2011 to March–April 2012. However, the recorded wet deposition also includes variable contributions from dry deposition since the precipitation samples were collected with an open bucket instrument (Kühnel et al., 2011). Nevertheless, the estimated dry deposition corresponds to less than 5 % of the wet deposition of chloride, sodium, and magnesium and reaches a maximum of 14 % for potassium (Fig. 4). Subtracting the nss sulfate from the total sulfate shows that the dry deposition of sulfate with marine origin also corresponds to less than 5 % of the total wet deposition. Since the estimated dry deposition is considered to be an upper limit, it can be assumed that its contribution for the total snow budget on the Kongsvegen and Austre Lovénbreen glaciers during the period November 2011 to April 2012 remained small for chloride, sodium, magnesium, potassium, and sea salt sulfate. The estimated wet deposition for bromide based on sodium concentrations and the standard seawater ratio leads to an overestimation of more than 40 % compared to the observed bromide in the snowpack (Fig. 4). This demonstrates that sea salt bromide is undergoing important modifications during the formation of sea salt aerosols in the atmosphere or after deposition (see Sect. 3.7).
Like for the sea salt components, a good agreement between the KV snow budget of nitrate and nss sulfate and the total deposition during the period October 2011 to April 2012 is found. For these two compounds the observed wet deposition at Ny-Ålesund remains significantly below the snow budget, while the missing fractions are largely compensated for by the estimated dry deposition. For nitrate, the dry deposition is comparable to the wet deposition, whereas for nss sulfate, dry deposition even dominates the snow budget. The adjusted budgets of the snow pit AL show ∼50 % less nitrate and ∼40 % less nss sulfate compared to KV (Fig. 4), which may be related to the spatial variability of the dry deposition of the two species.
3.4 Wintertime snow budgets and deposition of BC
Regarding the snow budgets, the differences in the rBC profiles and average concentrations are partly compensated for by the different accumulation for the two snow pits. The simple, adjusted, and simulated snow budgets vary between 0.51 and 0.71 mg m−2 for KV and between 0.79 and 0.83 mg m−2 for AL; they are thus between 10 % and 60 % higher at AL compared to KV. Despite the difference between EC and rBC (see Sect. 3.2), it appears that the derived rBC budget for KV remains well below the EC budgets for 2007 to 2009 for the Kongsvegen glacier (Forsström et al., 2013). In contrast, the AL budget is somewhat above the rBC budget for the Brøggerbreen glacier of 0.49 mg m−2 determined in April 2013 (Sinha et al., 2018). These differences, which are partly related to the different detection methods for BC, are probably also related to the interannual variability of BC as reflected in the atmospheric observations (Eleftheriadis et al., 2009).The BC deposition derived here only relies on estimated values for scavenging and dry deposition velocities. The monthly averages of the estimated BC concentrations in fresh snow due to scavenging vary from 0.2 ppb in October to 0.8 ppb in March. The March average is in very good agreement with the three fresh snow samples collected in March 2012, which showed rBC concentrations of 0.47, 0.72, and 0.97 ppb. Moreover, these estimated concentrations are in agreement with average eBC concentrations in fresh snow samples collected in April and November in the years 2012 to 2017 on the glaciers surrounding Ny-Ålesund ranging from 0.9 to 2 ppb (Gogoi et al., 2018). Noone and Clarke (1988) proposed a dimensionless scavenging ratio (SR) corresponding to the ratio of the atmospheric and snow concentration of BC. Using the observed atmospheric BC and the estimated BC concentrations in snow, we derive SRs of approximately 30, which agree with the lower end of SRs for the Ny-Ålesund area (Gogoi et al., 2016, 2018).
The anticorrelation between accumulation and the average BC concentrations in the two snow pits points to an important contribution of dry deposition, which is in agreement with the estimated dry and wet deposition of BC. The dry deposition of eBC (Fig. 4) derived with a deposition velocity of 0.1 cm s−1 corresponds to approximately half of the observed rBC budget at KV and is thus somewhat higher than the contribution due to wet deposition. Despite the overall uncertainty related to the simplified methods for the estimation of BC deposition, the difference between the snow budgets and the total deposition remains below 25 % for the KV and below 45 % for the AL snow pit. This important contribution of dry deposition is in contrast to the wet and total deposition reported for Ny-Ålesund for winter 2012–2013 based on rBC measurements in falling snow and in the snowpack (Sinha et al., 2018). From these observations it was concluded that the dry deposition of rBC remained negligible. However, the authors also reported rBC fluxes at 300 m of altitude on the Brøggerbreen glacier, which were twice as high as in Ny-Ålesund. While Sinha et al. (2018) claim that this increase is mainly due to higher accumulation on the glacier, additional dry deposition at higher altitudes cannot be excluded. Moreover, the potential contamination of the snowpack close to Ny-Ålesund due to local power generation or a potential mismatch between the budgets of the falling snow and the snowpack due to removal by blowing snow was not considered.
Previous model studies have indicated that BC in the Arctic is primarily removed through wet deposition (e.g., Flanner et al., 2007; Wang et al., 2011). However, in the models the dry deposition velocity of BC was often reduced to improve the simulated atmospheric concentrations of BC. Moreover, the wintertime deposition observed here may not be extrapolated to the entire Arctic since BC deposition depends on multiple factors like air mass transport, aging processes of atmospheric BC particles, and ice nucleation (e.g., Sharma et al., 2013; Liu et al., 2011; Vergara-Temprado et al., 2018)
3.5 Comparison of monthly snow budgets and deposition
To derive a higher temporal resolution of the snow budgets, monthly snow budgets were calculated from layers deposited in each month between November 2011 and March 2012. The monthly budgets are further compared to monthly wet and dry deposition. Each weekly wet deposition was attributed to the month with the largest overlap in time to derive the monthly wet deposition, while the monthly dry deposition was calculated from the daily dry deposition. Monthly total deposition was calculated as the sum of the corresponding wet and dry deposition. Figure 5 shows the results for sodium, nitrate, and BC. Results similar to sodium were in general obtained for the other sea salt components. The dominating role of wet deposition for sodium and other sea salt components, as well as the larger contribution of dry deposition for nitrate and BC, is also reflected in the monthly budgets. For the months with recorded precipitation at Ny-Ålesund, the wet deposition of sea salt components largely dominates the total deposition. This is in contrast to nitrate and BC, which show several monthly budgets with higher values for dry than wet deposition.
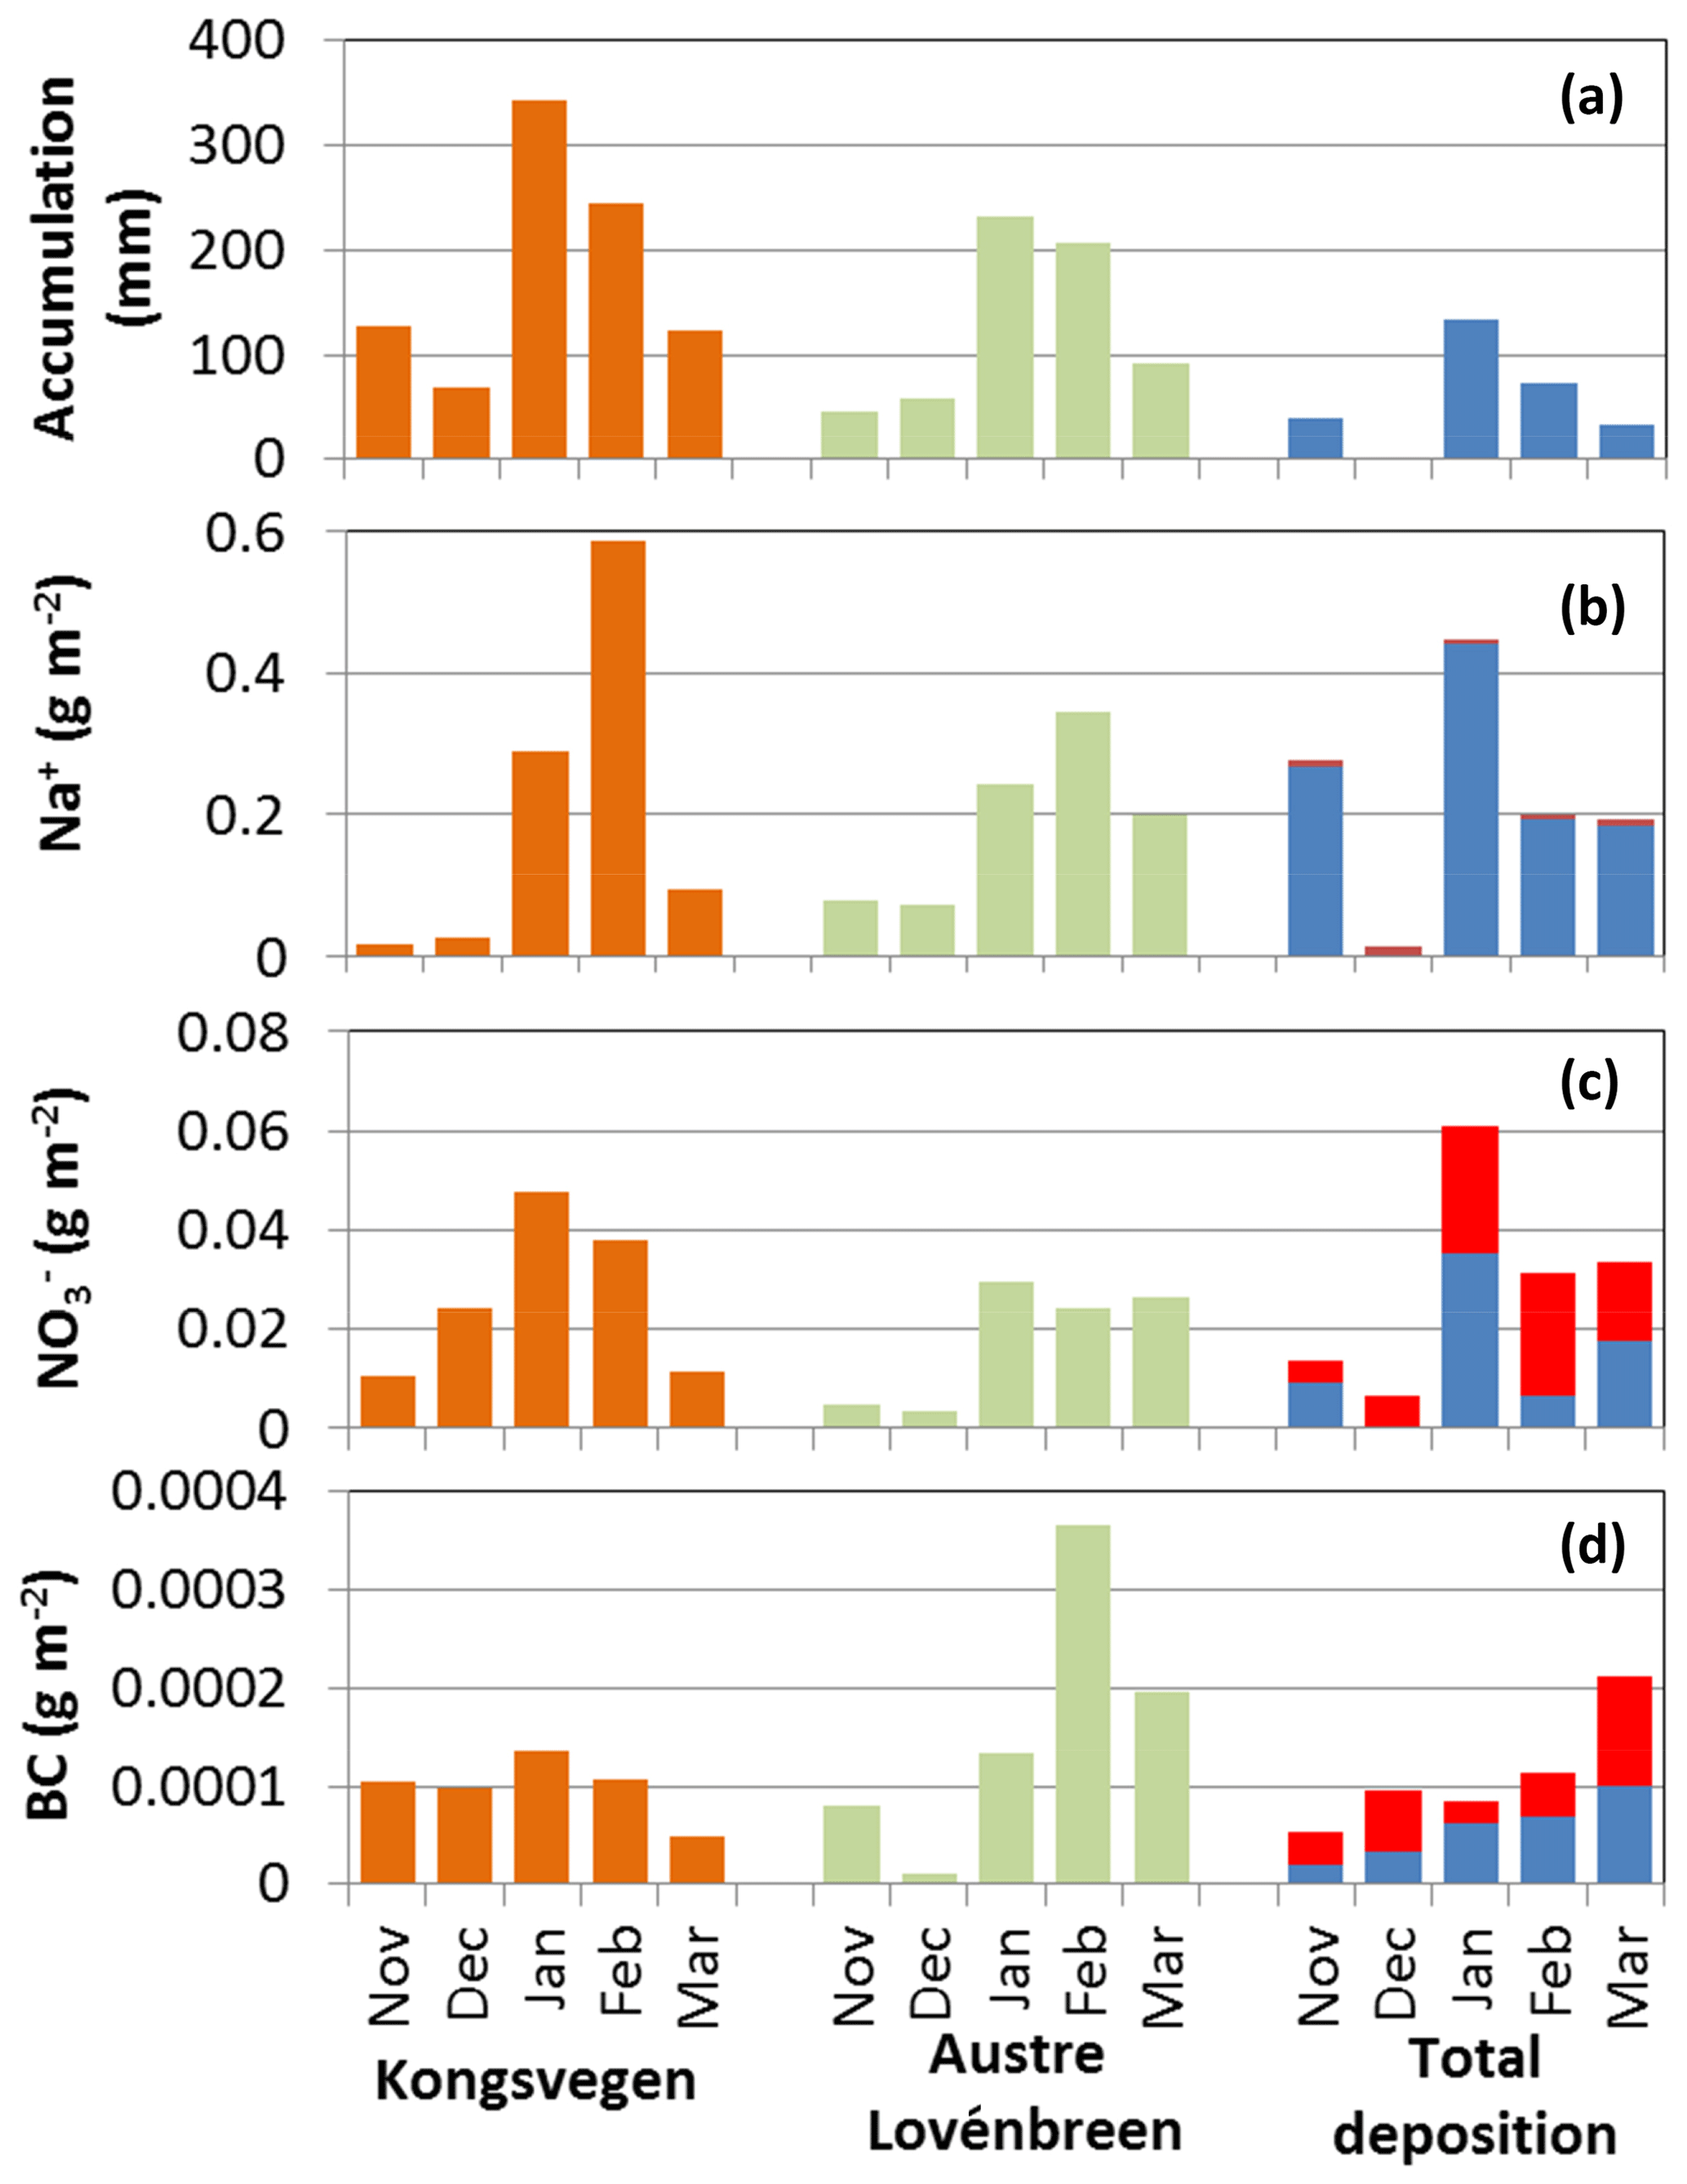
Figure 5Monthly accumulation and snow budgets for sodium, nitrate, and BC for the snow pits KV (Kongsvegen, orange) and AL (Austre Lovénbreen, green) according to the simulated profiles. Also shown is the observed accumulation at Ny-Ålesund (top, blue) and the total deposition divided into wet (blue) and dry (red) deposition. For sodium and nitrate the wet deposition was measured at Ny-Ålesund and the wet deposition for BC was estimated from scavenging. The BC snow budgets correspond to rBC, while the wet and dry depositions correspond to eBC.
The generally good agreement between the total budgets of the two snow pits and the wet and dry deposition (Fig. 4) is only partly confirmed by the monthly budgets shown in Fig. 5. For example, the monthly budgets of sodium show a much more pronounced variability at KV compared to AL. In contrast, the monthly total deposition shows a very low value for December due to the lack of wet deposition observed at Ny-Ålesund and no clear cycle for the remaining months. Similar results are obtained for other sea salt components. In general, differences are caused by multiple factors related to uncertainties in the snow model results, the corresponding forcing data, and the spatial variability of the observations in the snow, wet deposition, and aerosol concentrations. Moreover, post-depositional processes modifying the derived monthly snow budgets, like blowing snow or melting processes, are currently not taken into account in the simulations.
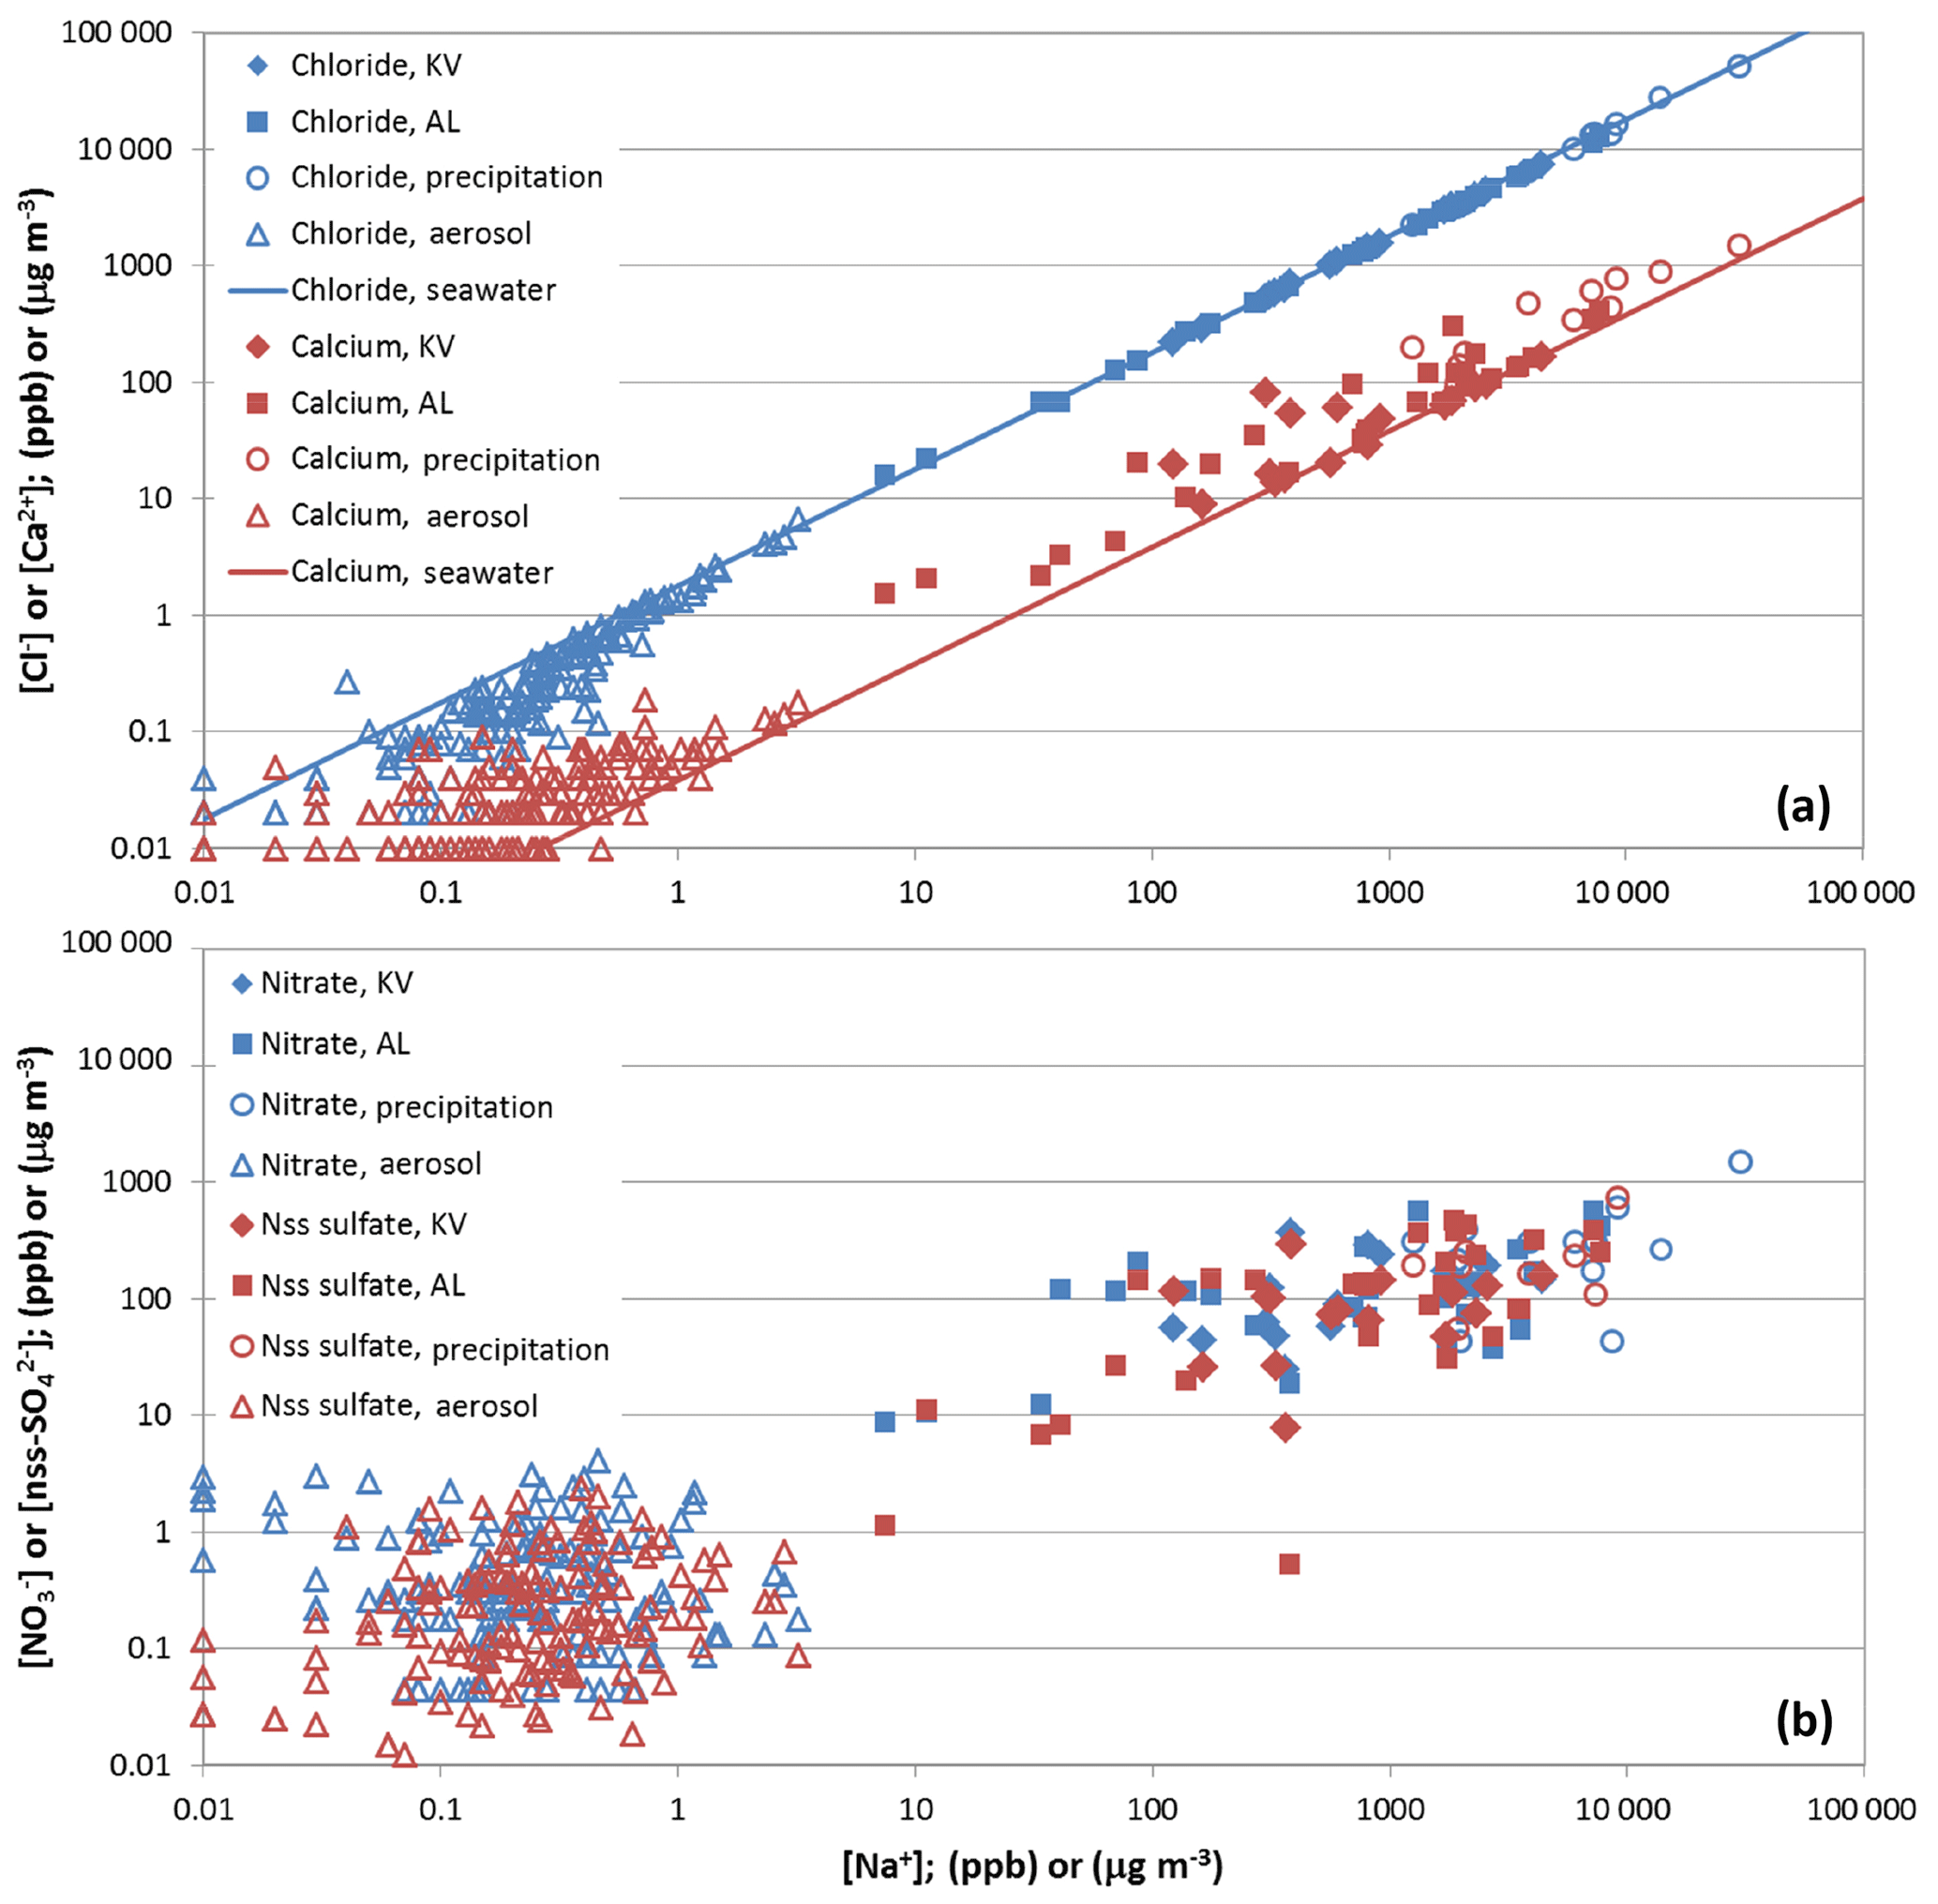
Figure 6(a) Chloride (blue) and calcium (red) concentrations vs. sodium concentrations in snow pit KV (filled diamonds) and AL (filled squares), in precipitation (open circles), and aerosols (open triangles). Aerosol concentrations (µg m−3) are derived from measurements at Zeppelin Station. The lines indicate the standard seawater ratio. (b) Same as top, but for nitrate (blue) and nss sulfate (red).
3.6 Variations of the chemical composition of snow, aerosols, and precipitation
Variation diagrams showing the concentrations of two trace compounds are often exploited to determine common sources or processes acting upon the correlated species. Here, the ratios of concentrations in the atmosphere, the precipitation, and the snow are used to study transfer processes from the atmosphere to the snow. Figure 6 shows the variation of chloride vs. sodium for the period October 2011 to April 2012 in aerosols at Zeppelin Station, in the precipitation at Ny-Ålesund, and in the snow pits KV and AL. Most of the chloride-to-sodium ratios in the aerosols are close to the standard seawater ratio (Millero et al., 2008), indicating that in the marine environment around Ny-Ålesund the composition of the aerosols is dominated by sea salt. Some aerosol samples show dechlorination, likely caused by the replacement of chlorine ions due to the uptake of sulfuric and nitric acid (Keene et al., 1998). Figure 6 further demonstrates that the impact of dechlorination becomes visible only during periods with low atmospheric loading of sea salt aerosols with less than 1 µg m−3 of sodium. Such a dechlorination, however, is masked in the precipitation and snow samples, which were all close to the standard seawater ratio. In summary, in wintertime the composition of the majority of aerosols and the precipitation around Ny-Ålesund are dominated by sea salt aerosols, confirming previous studies of individual aerosol particles (Weinbruch et al., 2012). This leads to the same chemical imprint in the snowpack. Magnesium and potassium show a similar variation with sodium (not shown), except that some aerosol samples showed elevated potassium concentrations, possibly due to potassium-enriched dust particles from soils. Nevertheless, the variation in the precipitation samples confirms that the contribution of dry aerosol deposition also remained small for these compounds with respect to the overall observed budget of the snow pits.
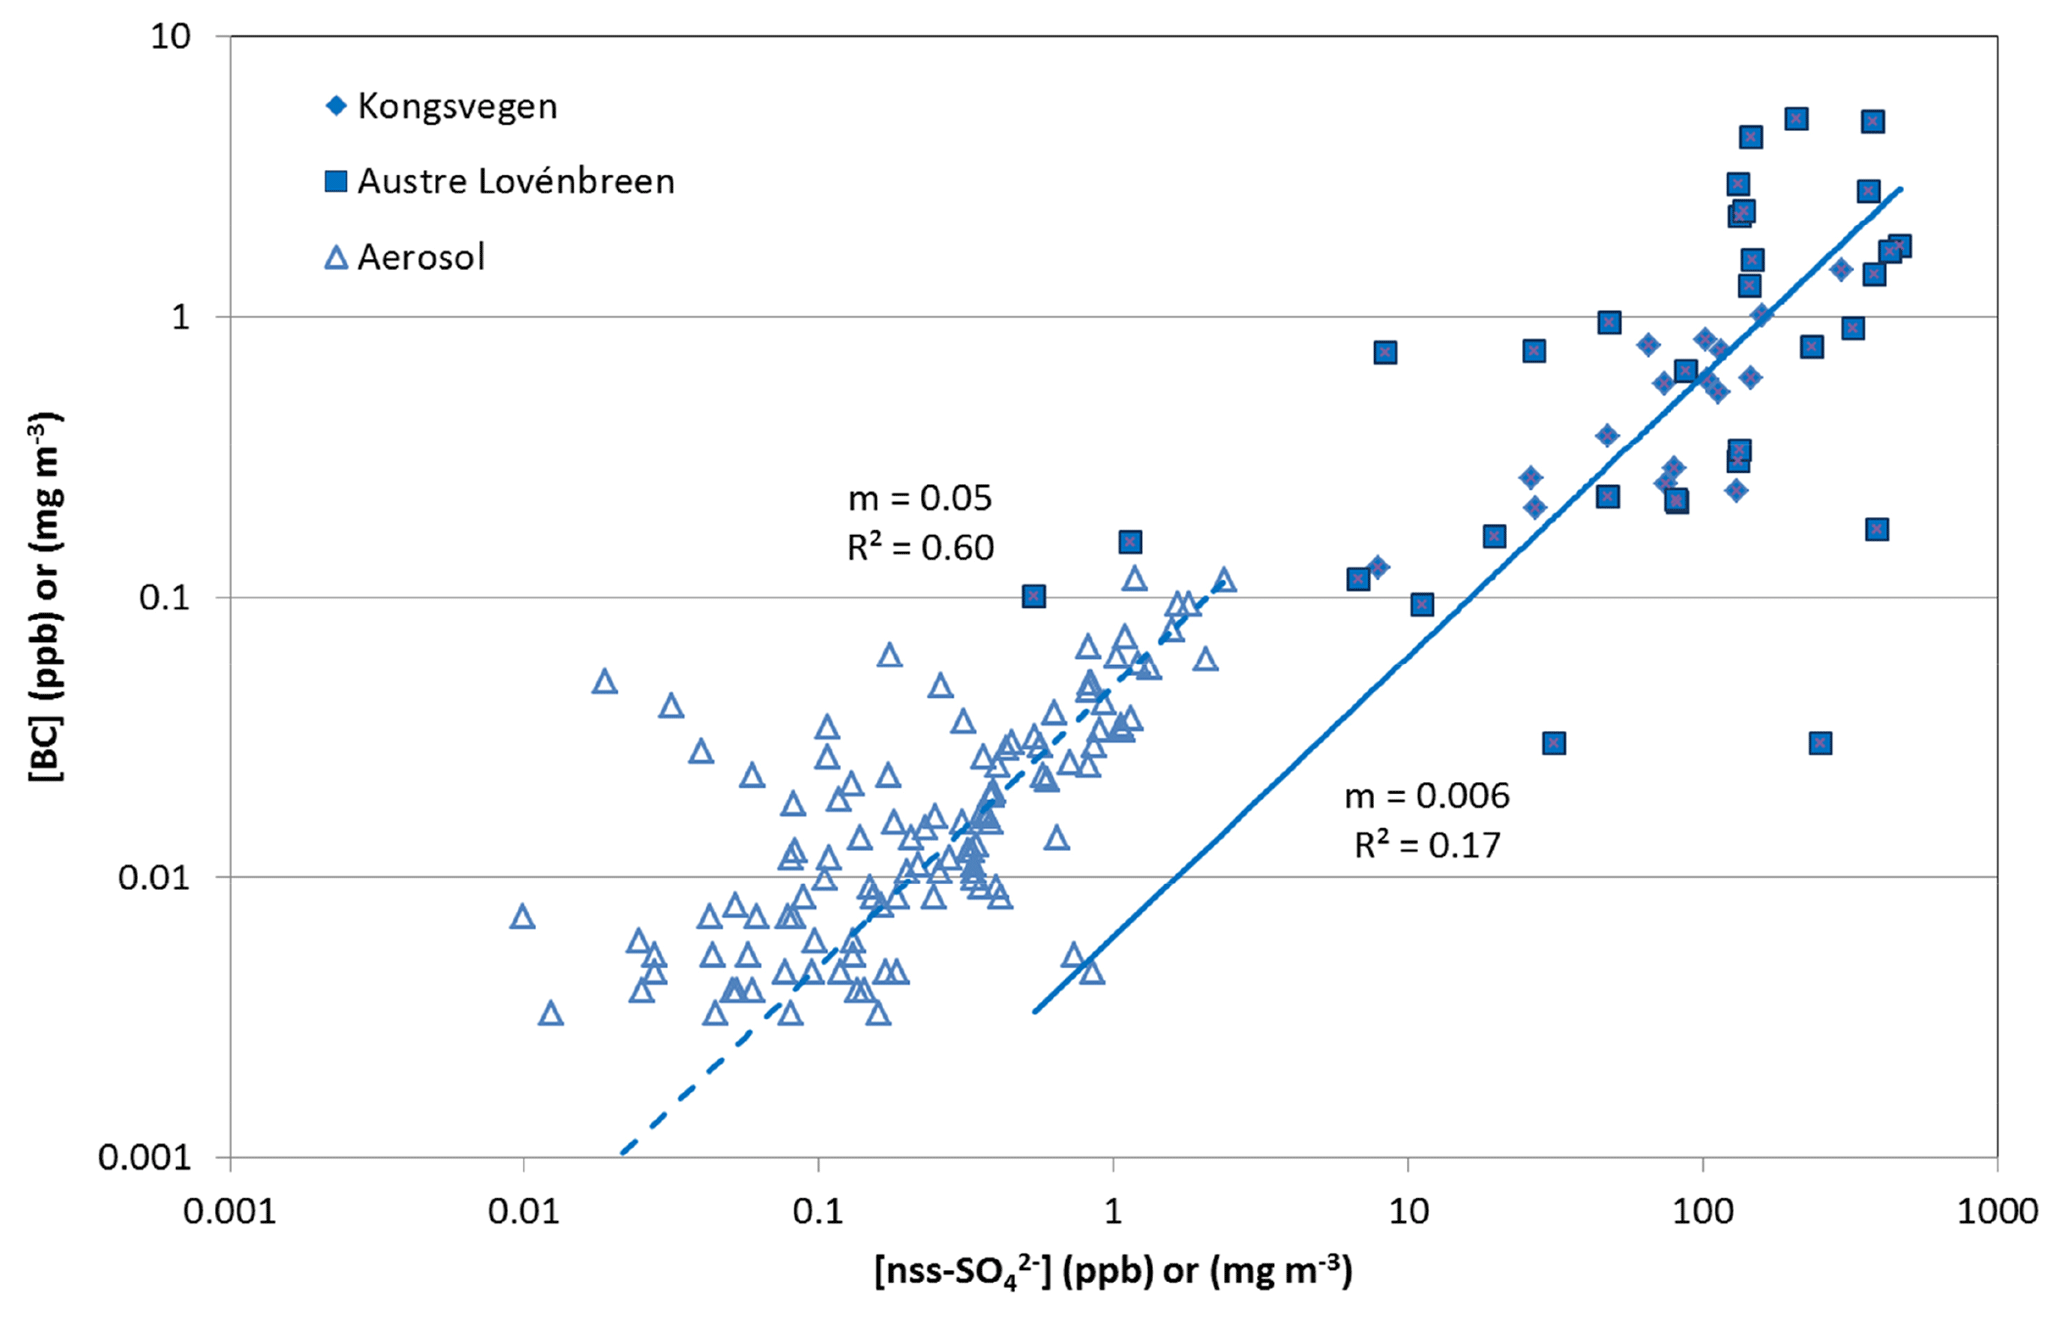
Figure 7BC vs. nss sulfate concentrations in snow pits KV (filled diamonds) and AL (filled squares) and in aerosols (open triangles). The lines calculated by linear regression with slope m and coefficient of determination R2 are forced through the origin and separated for the aerosol and snow samples. BC in the snow pits corresponds to rBC, while the BC in aerosols corresponds to eBC.

Figure 8Bromide-to-sodium ratio in the snow pits KV (a) and AL (b). Blue circles indicate observed ratios; blue lines correspond to ratios adjusted to the observed stratigraphy. The alternating shaded and non-shaded areas correspond from the top to the months March to October. The vertical dashed grey lines indicate the standard seawater ratio. The values for three peaks in the snow pit AL beyond the range of the scale are indicated.
Calcium shows a different behavior compared to the other major sea salt components, with a significant enrichment of calcium in the aerosols as well as in the precipitation, which results in calcium-to-sodium ratios above standard seawater in a large number of snow samples (Fig. 6). Such an enrichment in the Arctic may be attributed to calcium-rich aerosols originating from soils (Toom-Sauntry and Barrie, 2002; Geng et al., 2010; Jacobi et al., 2012; Weinbruch et al., 2012), although local aerosol formation was probably limited due to the extended snow cover. The in- or below-cloud scavenging of dust particles likely contributed to the transfer of elevated calcium concentrations from the aerosols to the precipitation and to the snow.
As demonstrated in previous studies (e.g., Jacobi et al., 2012), nitrate and nss sulfate in aerosols, precipitation, and snow do not exhibit a constant ratio compared to sodium (Fig. 6). The highest ratios are found in the aerosols and the lowest ratios in the precipitation, with the average snowpack ratio between these values. This confirms that the nitrate and nss sulfate in the snowpack can be attributed to a mixture of wet deposition and dry deposition of aerosols. Although in wintertime the reactive nitrogen budget is dominated by particulate nitrate (Hara et al., 1999), further dry deposition of gas-phase species to the snow is possible, which may be even more important than aerosol deposition (Björkman et al., 2013).
Due to the different sources of BC and sodium (long-range transport vs. local or regional formation of sea salt aerosols), no consistent BC-to-sodium variation is found in the aerosols (Fig. S3). Similarly, the variation of BC in the snow pits is also independent of the sodium concentrations. Since BC particles are preferentially coated by organic matter or sulfate (Liu et al., 2011), atmospheric BC shows a positive relationship to nss sulfate, resulting in a coefficient of determination R2 of 0.60 (Fig. 7). In the snowpack, the rBC-to-nss-sulfate ratios are less consistent, and the average ratio is almost 1 order of magnitude smaller than in the aerosols. Despite the different measurement techniques for BC in the aerosols and in the snow, the lower BC-to-nss-sulfate ratio in the snow can only partly be explained by the different measurement methods. Different ratios in the snow may be caused by the smaller contribution of wet to total deposition of BC compared to nss sulfate (Fig. 4). Moreover, the AL snow pit shows a higher variability in the BC-to-nss-sulfate variation than the KV snow pit (Fig. 7), indicating that the redistribution of impurities caused by melting probably also impacted BC and nss sulfate.
3.7 Bromide in the snowpack
Since no bromide concentrations in the aerosols or in the precipitation are available, the ratio between bromide and sodium is shown in the form of profiles for the snow pits KV and AL (Fig. 8). The ratio between the overall bromide and sodium budgets varies between 0.0045 for KV and 0.005 for AL; it is thus below the standard seawater ratio of 0.00624 (Millero et al., 2008). Only distinct layers show enrichments of bromide (Fig. 8). Multiple photochemical processes occur in the sea ice–snow–atmosphere system of the Arctic, acting upon the variation between bromide and sodium (Simpson et al., 2007; Jacobi et al., 2012). On solid surfaces (aerosols, snow, sea ice) bromide can be transformed into volatile bromine compounds that are released to the atmosphere and subsequently deposited. Therefore, bromide can be already depleted in the sea salt aerosols generated over sea ice, which would cause a wet and dry deposition flux lower than estimated based on the standard seawater ratio, or it can be diminished in the surface snow after deposition (Jacobi et al., 2012), explaining the average bromide-to-sodium ratios below the seawater ratio in both snow pits. Nevertheless, since the released bromide is subsequently deposited, a snowpack with layers enriched in bromide is also possible depending on the dominating influence of the release vs. the additional deposition of bromide (Simpson et al., 2007). This can also explain the contrasting results found on top of the Holtedahlfonna glacier, located approximately 40 km to the northeast of Ny-Ålesund, in April 2012. Spolaor et al. (2013) reported that the snowpack was highly enriched in bromide, with only a few samples close to the seawater ratio, potentially caused by the additional deposition of bromide after release from sea-ice-covered areas of the Arctic Ocean. It is well known that such activation of bromide mainly occurs in springtime after polar sunrise, explaining the low bromide budgets in the KV and AL snow pits in the winter period. Since bromine activation over sea ice also leads to a significant destruction of tropospheric ozone (Jacobi et al., 2010b), the ozone record at Zeppelin Station may be used as a proxy for the impact of bromine-rich air masses at Ny-Ålesund and the surrounding area. The ozone concentration during the entire period covered by the snow pits remained above 35 ppbV and dropped to ∼20 ppbV on the afternoon of 29 March (data accessible at ebas.nilu.no), indicating that the influence of bromine-enriched air remained small in spring 2012 before the sampling of the snow pits. Finally, meteorological conditions in Ny-Ålesund are less sensitive to the sea ice extent than other locations in Svalbard according to a study of precipitation trends (Osuch and Wawrzyniak, 2017). Thus, the distinct peaks in the bromide-to-sodium ratio in the snow pit AL, which occurred in layers attributed to early March, late February, and late January, are probably not caused by additional deposition as a consequence of bromine explosion events but are possibly related to the influence of melting. Accordingly, these high ratios are not produced by enhanced bromide but by low sodium concentrations. In summary, the potential use of bromide enrichment as a proxy for bromine activation and thus sea ice extent as developed by Spolaor et al. (2013) for the Holtedahlfonna record appears rather limited for the snowpack and glaciers around Ny-Ålesund due to a restricted impact of sea ice conditions in this region.
The chemical composition of aerosols, precipitation, and the snowpack was analyzed for Ny-Ålesund, Svalbard. The results concerning the snow budgets, wet deposition, and the ratios of the different components in the snowpack, precipitation, and aerosols underline the importance of wet deposition for the major sea salt components chloride, sodium, potassium, magnesium, and sulfate during the winter period from October 2011 to March 2012, confirming previous studies (Isaksson et al., 2003; Weinbruch et al., 2012; Geng et al., 2010). The significant contribution of wet deposition is further supported by the estimated maximum of dry deposition. Although the choice of the deposition velocity introduces considerable uncertainty, the estimated dry deposition remains well below 10 % of the total deposition for chloride, sodium, and magnesium, while it contributes more than 20 % to the snow budget of calcium and potassium, probably due to a stronger dust contribution. It is possible that the relatively high overall accumulation, including strong precipitation events in the last week of January, contributed to high input due to wet deposition during winter 2011–2012. Therefore, the contribution of the dry deposition of sea salt aerosols could be larger during winter periods with different precipitation characteristics. Nevertheless, it appears that the wet deposition measurements at Ny-Ålesund can be used to estimate the total wintertime deposition of the major sea salt components in the areas surrounding Ny-Ålesund.
In contrast to the major sea salt components, the dry deposition of nitrate and nss sulfate was more important than the wet deposition. However, the dry deposition of the corresponding gas-phase species like HNO3 and SO2 are not well quantified (e.g., Zhang et al., 2001; Osada et al., 2010) and probably also contributed to the observed snow budgets of nitrate and sulfate. Further direct measurements of the dry deposition of all N-containing species and nss sulfate would be needed to better quantify the full N and S cycle in the Arctic.
The obtained results for the snow budgets and the deposition of BC indicate a behavior of BC resembling nitrate and nss sulfate. In the wintertime the deposition of BC to the snowpack on the glaciers surrounding Ny-Ålesund appears to be equally driven by dry and wet deposition. However, it is important to note the large uncertainties in the estimated BC deposition, for which direct measurements in the Arctic are needed. Overall, the average rBC concentrations in the wintertime snowpack remained below 1.2 ppb, thus causing a marginal reduction of the snow albedo (e.g., Jacobi et al. 2015). In contrast, post-depositional processes are likely at the origin of snow layers, with rBC concentrations increased by a factor of 3 compared to the average. Such layers may cause a stronger direct and indirect impact on the snow albedo via enhanced metamorphism processes (e.g., Jacobi et al., 2015). Further studies with detailed observations of the vertical BC distribution in the snowpack are required for a better quantification of the climate impact of BC in snow.
Bromide is the sea salt compound showing the strongest variability in the ratio to other major components like sodium, which is related to its high mobility in the sea ice–atmosphere–snow system caused by chemical processes. Systematic measurements of bromide not only in the snowpack, but also in the aerosols, precipitation, and fresh snow, are required to further investigate processes before the formation of the sea salt aerosols, during their transport, or after deposition to the snowpack.
While the annual budgets and estimated deposition for most of the studied species agree well, the results for the monthly budgets obtained with detailed snowpack modeling are less convincing. Further improvements regarding the modeling of the Arctic snowpack are needed to better address physical properties (e.g., the evolution of the snow density) and post-depositional processes acting upon the vertical distribution of impurities in the snowpack. Although the treatment of impurities was recently implemented into the CROCUS snowpack model (Tuzet et al., 2017), the impact of processes modifying the vertical distribution of impurities in the Arctic snowpack like blowing snow, sublimation, and percolation are still not fully considered in most models. The full implementation of post-depositional processes into complex snow models may offer the opportunity to exploit further snowpack and ice core observations for the reconstruction of climate and pollution.
The snowpack scheme CROCUS is integrated into the surface modeling platform SURFEX developed by Météo France. The SURFEX code is freely available via https://www.umr-cnrm.fr/surfex/ (Météo France, SURFEX, last access: 12 August 2019) using a CeCILL-C license. The snow pit (https://doi.org/10.6096/parcs.12, https://doi.org/10.6096/parcs.13) and the meteorological data (https://doi.org/10.6096/parcs.17) are available from the PARCS database (https://www4.obs-mip.fr/parcs/database/; Pôle Aeris 2017 – Service de données OMP, Pollution in the Arctic System: Database, last access: 12 August 2019). Precipitation data are available from the EBAS database of the Norwegian Institute for Air Research (ebas.nilu.no). BC data are available on request.
The supplement related to this article is available online at: https://doi.org/10.5194/acp-19-10361-2019-supplement.
HWJ designed and wrote the paper and performed the snow sampling, the simulations, and the analysis. FO provided meteorological data for the simulations, advice during the analysis, and support in writing the paper. SDC contributed to the snow sampling and analysis. PG performed the chemical analysis of the snow samples. KE provided atmospheric BC data. WA provided precipitation data. PG, KE, and WA contributed to the writing of the paper. MZ contributed to the snow sampling, performed the BC analysis of the snow samples, and provided support in writing and designing the paper.
The authors declare that they have no conflict of interest.
The fieldwork and corresponding logistics were supported by the personnel of the AWIPEV station. The KV weather station is operated in cooperation with the Norwegian Polar Institute (Tromsø). The measurements of major inorganic ions in precipitation and aerosols at Ny-Ålesund and Zeppelin are part of national atmospheric monitoring financed by the Norwegian Environment Agency.
This research has been supported by the IPEV (grant no. 1030), the ANR (grants nos. ANR 2011 Blanc SIMI 5-6 021 04 and ANR-14-AORS-0002-01), Campus France (grant no. 31597SM), the Austrian Science Fund (grant no. I 369-B17), the CNRS/INSU (grant no. Chantier Arctique Francais/PARCS), the LabEx OSUG@2020 (grant no. ANR10 LABX56), and the Deutsche Forschungsgemeinschaft (grant no. 268020496 – TRR 172).
This paper was edited by Thorsten Bartels-Rausch and reviewed by two anonymous referees.
Aas, W., Solberg, S., Manø, S., and Yttri, K. E.: Monitoring of long-range transported air pollutants, Annual report for 2012 (In Norwegian), NILU Norwegian Institute for Air Research, Kjeller, NILU Scientific Reports OR 14/2013, 216 pp., 2013.
Backman, J., Schmeisser, L., Virkkula, A., Ogren, J. A., Asmi, E., Starkweather, S., Sharma, S., Eleftheriadis, K., Uttal, T., Jefferson, A., Bergin, M., Makshtas, A., Tunved, P., and Fiebig, M.: On Aethalometer measurement uncertainties and an instrument correction factor for the Arctic, Atmos. Meas. Tech., 10, 5039–5062, https://doi.org/10.5194/amt-10-5039-2017, 2017.
Bauer, S. E., Bausch, A., Nazarenko, L., Tsigaridis, K., Xu, B., Edwards, R. Bisiaux, M., and McConnell, J.: Historical and future black carbon deposition on the three ice caps: Ice core measurements and model simulations from 1850 to 2100, J. Geophys. Res.-Atmos., 118, 7948–7961, https://doi.org/10.1002/jgrd.50612, 2013.
Bernard, E., Friedt, J. M., Marlin, C., Tolle, F., Griselin, M., and Prokop, A.: Investigating snowpack volumes and icing dynamics in the moraine of an Arctic catchment using UAV/photogrammetry, Photogramm. Rec., 32, 497–512, https://doi.org/10.1111/phor.12217, 2017
Björkman, M. P., Kühnel, R., Partridge, D. G., Roberts, T. J., Aas, W., Mazzola, M., Viola, A., Hodson, A., Ström, J., and Isaksson, E.: Nitrate dry deposition in Svalbard, Tellus B, 65, 19071, https://doi.org/10.3402/tellusb.v65i0.19071, 2013.
Bond, T. C., Doherty, S. J., Fahey, D.W., Forster, P. M., Berntsen, T., De Angelo, B. J., Flanner, M. G., Ghan, S., Kärcher, B., Koch, D., Kinne, S., Kondo, Y., Quinn, P. K., Sarofim, M. C., Schultz, M. G., Schulz, M., Venkataraman, C., Zhang, H., Zhang, S., Bellouin, N., Guttikunda, S. K., Hopke, P. K., Jacobson, M. Z., Kaiser, J. W., Klimont, Z., Lohmann, U., Schwarz, J. P., Shindell, D., Storelvmo, T., Warren, S. G., and Zender, C. S.: Bounding the role of black carbon in the climate system: A scientific assessment, J. Geophys. Res.-Atmos., 118, 5380–5552, https://doi.org/10.1002/jgrd.50171, 2013.
Contini, D., Donateo, A., Belosi, F., Grasso, F. M., Santachiara, G., and Prodi, F.: Deposition velocity of ultrafine particles measured with the Eddy-Correlation Method over the Nansen Ice Sheet (Antarctica), J. Geophys. Res., 115, D16202, https://doi.org/10.1029/2009JD013600, 2010.
Croft, B., Martin, R. V., Leaitch, W. R., Tunved, P., Breider, T. J., D'Andrea, S. D., and Pierce, J. R.: Processes controlling the annual cycle of Arctic aerosol number and size distributions, Atmos. Chem. Phys., 16, 3665–3682, https://doi.org/10.5194/acp-16-3665-2016, 2016.
Duan, B., Fairall, C. W., and Thomson, D. W.: Eddy Correlation measurements of the dry deposition of particles in wintertime, J. Appl. Meteor., 27, 642–652, 1988.
Eleftheriadis, K., Vratolis, S., and Nyeki, S.: Aerosol black carbon in the European Arctic: Measurements at Zeppelin station, Ny-Ålesund, Svalbard from 1998–2007, Geophys. Res. Lett., 36, L02809, https://doi.org/10.1029/2008GL035741, 2009.
Fierz C., Armstrong R. L., Durand Y., Etchevers P., Greene E., McClung D. M., Nishimura K., Satyawali P. K., and Sokratov, S. A.: The international classification for seasonal snow on the ground, UNESCO-IHP, Paris, IHP-VII Technical Documents in Hydrology No. 83, IACS Contribution No. 1, 80 pp., 2009.
Flanner, M. G., Zender, C. S., Randerson, J. T., and Rasch, P. J.: Present-day climate forcing and response from black carbon in snow, J. Geophys. Res., 112, D11202, https://doi.org/10.1029/2006JD008003, 2007.
Forsström, S., Isaksson, E., Skeie, R. B., Ström, J., Pedersen, C. A., Hudson, S. R., Berntsen, T. K., Lihavainen, H., Godtliebsen, F., and Gerland, S.: Elemental carbon measurements in European Arctic snow packs, J. Geophys. Res.-Atmos., 118, 13614–13627, https://doi.org/10.1002/2013JD019886, 2013.
Geng, H., Ryu, J. Y., Jung, H.-J., Chung, H., Ahn, K;-H., and Ro, C-U.: Single-particle characterization of summertime arctic aerosols collected at Ny-Alesund, Svalbard, Environ. Sci. Technol., 44, 2348–2353, https://doi.org/10.1021/es903268j, 2010.
Ginot, P., Schotterer, U., Stichler, W., Godoi, M. A., Francou, B., and Schwikowski, M.: Influence of the Tungurahua eruption on the ice core records of Chimborazo, Ecuador, The Cryosphere, 4, 561–568, https://doi.org/10.5194/tc-4-561-2010, 2010.
Gogoi, M. M., Babu, S. S., Moorthy, K. K., Thakur, R. C., Chaubey, J. P., and Nair, V. S.: Aerosol black carbon over Svalbard regions of Arctic, Polar Sci., 10, 60–70, https://doi.org/10.1016/j.polar.2015.11.001, 2016.
Gogoi, M. M., Babu, S. S., Pandey, S. K., Nair, V. S., Vaishya, A., Girach, I. A., and Koushik, N.: Scavenging ratio of black carbon in the Arctic and the Antarctic, Polar Sci., 16, 10–22, https://doi.org/10.1016/j.polar.2018.03.002, 2018.
Grönlund, A., Nilsson, D., Koponen, I., Virkkula, A., and Hansson, M.: Aerosol dry deposition measured with eddy-covariance technique at Wasa and Aboa, DronningMaud Land, Antarctica, Ann. Glaciol., 35, 355–361, https://doi.org/10.3189/172756402781816519, 2002.
Groot Zwaaftink, C. D., Cagnati, A., Crepaz, A., Fierz, C., Macelloni, G., Valt, M., and Lehning, M.: Event-driven deposition of snow on the Antarctic Plateau: analyzing field measurements with SNOWPACK, The Cryosphere, 7, 333–347, https://doi.org/10.5194/tc-7-333-2013, 2013.
Hara, K., Osada, K., Hayashi, M., Matsunaga, K., Shibata, T., Iwasaka, Y., and Furuya, K.: Fractionation of inorganic nitrates in winter Arctic troposphere: Coarse aerosol particles containing inorganic nitrates, J. Geophys. Res., 104, 23671–23679, https://doi.org/10.1029/1999JD900348, 1999.
Hirdman, D., Burkhart, J. F., Sodemann, H., Eckhardt, S., Jefferson, A., Quinn, P. K., Sharma, S., Ström, J., and Stohl, A.: Long-term trends of black carbon and sulphate aerosol in the Arctic: changes in atmospheric transport and source region emissions, Atmos. Chem. Phys., 10, 9351–9368, https://doi.org/10.5194/acp-10-9351-2010, 2010.
Hodson, A. J., Mumford, P. N., Kohler, J., and Wynn, P. M.: The High Arctic glacial ecosystem: New insights from nutrient budgets, Biogeochemistry, 72, 233–256, https://doi.org/10.1007/s10533-004-0362-0, 2005.
Iizuka, Y., Igarashi, M., Kamiyama, K., Motoyama, H., and Watanabe, O.: Ratios of Mg2∕Na in snowpack and an ice core at Austfonna ice cap, Svalbard, as an indicator of seasonal melting, J. Glaciol., 48, 452–460, https://doi.org/10.3189/172756502781831304, 2002.
Intrieri, J. M., Shupe, M. D., Uttal, T., and McCarty, B. J.: An annual cycle of Arctic cloud characteristics observed by radar and lidar at SHEBA, J. Geophys. Res., 107, 8030, https://doi.org/10.1029/2000JC000423, 2002.
Isaksson, E., Hermanson, M., Hicks, S., Igarashi, M., Kamiyama, K., Moore, J., Motoyama, H., Muir, D., Pohjola, V., Vaikmäe, R., van de Wal, R. S. W., and Watanabe, O.: Ice cores from Svalbard-useful archives of past climate and pollution history, Phys. Chem. Earth, 28, 1217–1228, https://doi.org/10.1016/j.pce.2003.08.053, 2003.
Jacobi, H.-W., Domine, F., Simpson, W. R., Douglas, T. A., and Sturm, M.: Simulation of the specific surface area of snow using a one-dimensional physical snowpack model: implementation and evaluation for subarctic snow in Alaska, The Cryosphere, 4, 35–51, https://doi.org/10.5194/tc-4-35-2010, 2010a.
Jacobi, H.-W., Morin, S., and Bottenheim, J. W.: Observation of widespread depletion of ozone in the springtime boundary layer of the central Arctic linked to mesoscale synoptic conditions, J. Geophys. Res., 115, D17302, https://doi.org/10.1029/2010JD013940, 2010b.
Jacobi, H. W., Voisin, D., Jaffrezo, J. L., Cozic, J., and Douglas, T. A.: Chemical composition of the snowpack during the OASIS spring campaign 2009 at Barrow, Alaska, J. Geophys. Res., 117, D00R13, https://doi.org/10.1029/2011JD016654, 2012.
Jacobi, H.-W., Lim, S., Ménégoz, M., Ginot, P., Laj, P., Bonasoni, P., Stocchi, P., Marinoni, A., and Arnaud, Y.: Black carbon in snow in the upper Himalayan Khumbu Valley, Nepal: observations and modeling of the impact on snow albedo, melting, and radiative forcing, The Cryosphere, 9, 1685–1699, https://doi.org/10.5194/tc-9-1685-2015, 2015.
Karner, F., Obleitner, F., Krismer, T., Kohler, J., and Greuell, W.: A decade of energy and mass balance investigations on the glacier Kongsvegen, Svalbard, J. Geophys. Res.-Atmos., 118, 3986–4000, https://doi.org/10.1029/2012JD018342, 2013.
Keene, W.C., Sander, R., Pszenny, A. A. P., Vogt, R., Crutzen, P. J., and Galloway, J. N.: Aerosol pH in the marine boundary layer: A review and model evaluation, J. Aerosol Sci., 29, 339–356, https://doi.org/10.1016/S0021-8502(97)10011-8, 1998.
Kühnel, R., Roberts, T. J., Björkman, M. P., Isaksson, E., Aas, W., Holmén, K., and Ström, J.: 20-year climatology of NO and NH wet deposition at Ny-Alesund, Svalbard, Adv. Meteorol., 2011, 406508, https://doi.org/10.1155/2011/406508, 2011.
Law, K. S. and Stohl, A.: Arctic air pollution: Origins and impacts, Science, 315, 1537–1540, https://doi.org/10.1126/science.1137695, 2007.
Legrand, M. and Mayewski, P.: Glaciochemistry of polar ice cores: A review, Rev. Geophys., 35, 219–243, https://doi.org/10.1029/96RG03527, 1997.
Lim, S., Faïn, X., Zanatta, M., Cozic, J., Jaffrezo, J.-L., Ginot, P., and Laj, P.: Refractory black carbon mass concentrations in snow and ice: method evaluation and inter-comparison with elemental carbon measurement, Atmos. Meas. Tech., 7, 3307–3324, https://doi.org/10.5194/amt-7-3307-2014, 2014.
Liu, J., Fan, S., Horowitz, L. W., and Levy II, H.: Evaluation of factors controlling long-range transport of black carbon to the Arctic, J. Geophys. Res., 116, D04307, https://doi.org/10.1029/2010JD015145, 2011.
Millero, F. J., Feistel, R., Wright, D. G. and McDougall, T. J.: The composition of Standard Seawater and the definition of the Reference-Composition Salinity Scale, Deep-Sea Res. Pt. I, 55, 50–72, https://doi.org/10.1016/j.dsr.2007.10.001, 2008.
Noone, K. J. and Clarke, A. D.: Soot scavenging measurements in arctic snowfall, Atmos. Environ., 22, 2773–2778, https://doi.org/10.1016/0004-6981(88)90444-1, 1998.
Osada, K., Shido, Y., Iida, H., and Kido, M.: Deposition processes of ionic constituents to snow cover, Atmos. Environ., 44, 347–353, https://doi.org/10.1016/j.atmosenv.2009.10.031, 2010.
Osuch, M. and Wawrzyniak, T.: Inter- and intra-annual changes in air temperature and precipitation in western Spitsbergen, Int. J. Climatol., 37, 3082–3097, https://doi.org/10.1002/joc.4901, 2017.
Proksch, M., Rutter, N., Fierz, C., and Schneebeli, M.: Intercomparison of snow density measurements: bias, precision, and vertical resolution, The Cryosphere, 10, 371–384, https://doi.org/10.5194/tc-10-371-2016, 2016.
Quinn, P. K., Shaw, G., Andrews, E., Dutton, E. G., Ruoho-Airola, T., and Gong, S. L.: Arctic haze: current trends and knowledge gaps, Tellus B, 59, 99–114, https://doi.org/10.1111/j.1600-0889.2006.00236.x, 2007.
Sauter, T. and Obleitner, F.: Assessing the uncertainty of glacier mass-balance simulations in the European Arctic based on variance decomposition, Geosci. Model Dev., 8, 3911–3928, https://doi.org/10.5194/gmd-8-3911-2015, 2015.
Sharma S., Ishizawa, M., Chan, D., Lavoué, D., Andrews, E., Eleftheriadis, K., and Maksyutov, S.: 16-year simulation of Arctic black carbon: Transport, source contribution, and sensitivity analysis on deposition, J. Geophys. Res.-Atmos., 118, 943–964, https://doi.org/10.1029/2012JD017774, 2013.
Shindell, D.: Local and remote contributions to Arctic warming, Geophys. Res. Lett., 34, L14704, https://doi.org/10.1029/2007GL030221, 2007.
Si, M., Irish, V. E., Mason, R. H., Vergara-Temprado, J., Hanna, S. J., Ladino, L. A., Yakobi-Hancock, J. D., Schiller, C. L., Wentzell, J. J. B., Abbatt, J. P. D., Carslaw, K. S., Murray, B. J., and Bertram, A. K.: Ice-nucleating ability of aerosol particles and possible sources at three coastal marine sites, Atmos. Chem. Phys., 18, 15669–15685, https://doi.org/10.5194/acp-18-15669-2018, 2018.
Simpson, W. R., von Glasow, R., Riedel, K., Anderson, P., Ariya, P., Bottenheim, J., Burrows, J., Carpenter, L. J., Frieß, U., Goodsite, M. E., Heard, D., Hutterli, M., Jacobi, H.-W., Kaleschke, L., Neff, B., Plane, J., Platt, U., Richter, A., Roscoe, H., Sander, R., Shepson, P., Sodeau, J., Steffen, A., Wagner, T., and Wolff, E.: Halogens and their role in polar boundary-layer ozone depletion, Atmos. Chem. Phys., 7, 4375–4418, https://doi.org/10.5194/acp-7-4375-2007, 2007.
Sinha, P. R., Kondo, Y., Koike, M., Ogren, J. A. Jefferson, A., Barrett, T. E., Sheesley, R. J., Ohata, S., Moteki, N., Coe, H., Liu, D., Irwin, M., Tunved, P., Quinn, P. K., and Zhao, Y.: Evaluation of ground-based black carbon measurements by filter-based photometers at two Arctic sites, J. Geophys. Res.-Atmos., 122, 3544–3572, https://doi.org/10.1002/2016JD025843, 2017.
Sinha, P. R., Kondo, Y., Goto-Azuma, K., Tsukagawa, Y., Fukuda, K., Koike, M., Ohata, S., Moteki, N., Mori, T., Oshima, N., Førland, E. J., Irwin, M., Gallet, J.-C., and Pedersen, C. A.: Seasonal progression of the deposition of black carbon by snowfall at Ny-Ålesund, Spitsbergen, J. Geophys. Res.-Atmos., 123, 997–1016. https://doi.org/10.1002/2017JD028027, 2018.
Spolaor, A., Gabrieli, J., Martma, T., Kohler, J., Björkman, M. B., Isaksson, E., Varin, C., Vallelonga, P., Plane, J. M. C., and Barbante, C.: Sea ice dynamics influence halogen deposition to Svalbard, The Cryosphere, 7, 1645–1658, https://doi.org/10.5194/tc-7-1645-2013, 2013.
Spolaor, A., Barbaro, E., Mazzola, M., Viola, A. P., Lisok, J., Obleitner, F., Markowicz, K. M., and Cappelletti, D.: Determination of black carbon and nanoparticles along glaciers in the Spitsbergen (Svalbard) region exploiting a mobile platform, Atmos. Environ., 170, 18–196, https://doi.org/10.1016/j.atmosenv.2017.09.042, 2017.
Stohl, A., Berg, T., Burkhart, J. F., Fj?raa, A. M., Forster, C., Herber, A., Hov, Ø., Lunder, C., McMillan, W. W., Oltmans, S., Shiobara, M., Simpson, D., Solberg, S., Stebel, K., Ström, J., Tørseth, K., Treffeisen, R., Virkkunen, K., and Yttri, K. E.: Arctic smoke – record high air pollution levels in the European Arctic due to agricultural fires in Eastern Europe in spring 2006, Atmos. Chem. Phys., 7, 511–534, https://doi.org/10.5194/acp-7-511-2007, 2007.
Struthers, H., Ekman, A. M. L., Glantz, P., Iversen, T., Kirkevåg, A., Mårtensson, E. M., Seland, Ø., and Nilsson, E. D.: The effect of sea ice loss on sea salt aerosol concentrations and the radiative balance in the Arctic, Atmos. Chem. Phys., 11, 3459–3477, https://doi.org/10.5194/acp-11-3459-2011, 2011.
Svensson, J., Ström, J., Hansson, M., Lihavainen, H., and Kerminen, V.-M.: Observed metre scale horizontal variability of elemental carbon in surface snow, Environ. Res. Lett., 8, 034012, https://doi.org/10.1088/1748-9326/8/3/034012, 2013.
Toom-Sauntry, D. and Barrie, L. A.: Chemical composition of snowfall in the high Arctic: 1990–1994, Atmos. Environ., 36, 2683–2693, https://doi.org/10.1016/S1352-2310(02)00115-2, 2002.
Tuzet, F., Dumont, M., Lafaysse, M., Picard, G., Arnaud, L., Voisin, D., Lejeune, Y., Charrois, L., Nabat, P., and Morin, S.: A multilayer physically based snowpack model simulating direct and indirect radiative impacts of light-absorbing impurities in snow, The Cryosphere, 11, 2633–2653, https://doi.org/10.5194/tc-11-2633-2017, 2017.
Vergara-Temprado, J., Holden, M. A., Orton, T. R., O'Sullivan, D., Umo, N. S., Browse, J., Reddington, C., Baeza-Romero, M. T., Jones, J. M., Lea-Langton, A., Williams, A., Carslaw, K. S., and Murray, B. J.: Is black carbon an unimportant ice-nucleating particle in mixed-phase clouds?, J. Geophys. Res.-Atmos., 123, 4273–4283, https://doi.org/10.1002/2017JD027831, 2018.
Vet, R., Artz, R. S., Carou, S., Shaw, M., Ro, C.-U., Aas, W., Baker, A., Bowersox, V. C., Dentener, F., Galy-Lacaux, C., Hou, A., Pienaar, J. J., Gillett, R., Forti, M. C., Gromov, S., Hara, H., Khodzher, T., Mahowald, N. M., Nickovic, S., Rao, P. S. P., and Reid, N. W.: A global assessment of precipitation chemistry and deposition of sulfur, nitrogen, sea salt, base cations, organic acids, acidity and pH, and phosphorus, Atmos. Environ., 93, 3–100, https://doi.org/10.1016/j.atmosenv.2013.10.060, 2014.
Vionnet, V., Brun, E., Morin, S., Boone, A., Faroux, S., Le Moigne, P., Martin, E., and Willemet, J.-M.: The detailed snowpack scheme Crocus and its implementation in SURFEX v7.2, Geosci. Model Dev., 5, 773–791, https://doi.org/10.5194/gmd-5-773-2012, 2012.
Virkkunen, K., Moore, J. C., Isaksson, E., Pohjola, V., Perämäki, P, Grinsted, A., and Kekonen, T.: Warm summers and ion concentrations in snow: Comparison of present day with Medieval Warm Epoch from snow pits and an ice core from Lomonosovfonna, Svalbard, J. Glaciol., 53, 623–634, https://doi.org/10.3189/002214307784409388, 2007.
Wang, Q., Jacob, D. J., Fisher, J. A., Mao, J., Leibensperger, E. M., Carouge, C. C., Le Sager, P., Kondo, Y., Jimenez, J. L., Cubison, M. J., and Doherty, S. J.: Sources of carbonaceous aerosols and deposited black carbon in the Arctic in winter-spring: implications for radiative forcing, Atmos. Chem. Phys., 11, 12453–12473, https://doi.org/10.5194/acp-11-12453-2011, 2011.
Weinbruch, S., Wiesemann, D., Ebert, M., Schütze, K., Kallenborn, R., and Ström, J.: Chemical composition and sources of aerosol particles at Zeppelin Mountain (Ny Ålesund, Svalbard): An electron microscopy study, Atmos. Environ., 49, 142–150, https://doi.org/10.1016/j.atmosenv.2011.12.008, 2012.
Winiger, P., Andersson, A., Yttri, K. E., Tunved, P., and Gustafsson, Ö.: Isotope-based source apportionment of EC aerosol particles during winter high-pollution events at the Zeppelin Observatory, Svalbard, Environ. Sci. Technol., 49, 11959–1966, https://doi.org/10.1021/acs.est.5b02644, 2012.
Zábori, J., Krejci, R., Ström, J., Vaattovaara, P., Ekman, A. M. L., Salter, M. E., Mårtensson, E. M., and Nilsson, E. D.: Comparison between summertime and wintertime Arctic Ocean primary marine aerosol properties, Atmos. Chem. Phys., 13, 4783–4799, https://doi.org/10.5194/acp-13-4783-2013, 2013.
Zanatta, M., Laj, P., Gysel, M., Baltensperger, U., Vratolis, S., Eleftheriadis, K., Kondo, Y., Dubuisson, P., Winiarek, V., Kazadzis, S., Tunved, P., and Jacobi, H.-W.: Effects of mixing state on optical and radiative properties of black carbon in the European Arctic, Atmos. Chem. Phys., 18, 14037–14057, https://doi.org/10.5194/acp-18-14037-2018, 2018.
Zhang, L., Gong, S., Padro, J., and Barrie, L.: A size-segregated particle dry deposition scheme for an atmospheric aerosol module, Atmos. Environ., 35, 549–560, https://doi.org/10.1016/S1352-2310(00)00326-5, 2001.