the Creative Commons Attribution 4.0 License.
the Creative Commons Attribution 4.0 License.
 | 09 Aug 2019
MAX-DOAS measurements of tropospheric NO2 and HCHO in Nanjing and a comparison to ozone monitoring instrument observations
Ka Lok Chan
Zhuoru Wang
Aijun Ding
Klaus-Peter Heue
Yicheng Shen
Jing Wang
Feng Zhang
Yining Shi
Nan Hao
Mark Wenig
In this paper, we present long-term observations of atmospheric nitrogen dioxide (NO2) and formaldehyde (HCHO) in Nanjing using a Multi-AXis Differential Optical Absorption Spectroscopy (MAX-DOAS) instrument. Ground-based MAX-DOAS measurements were performed from April 2013 to February 2017. The MAX-DOAS measurements of NO2 and HCHO vertical column densities (VCDs) are used to validate ozone monitoring instrument (OMI) satellite observations over Nanjing. The comparison shows that the OMI observations of NO2 correlate well with the MAX-DOAS data with Pearson correlation coefficient (R) of 0.91. However, OMI observations are on average a factor of 3 lower than the MAX-DOAS measurements. Replacing the a priori NO2 profiles by the MAX-DOAS profiles in the OMI NO2 VCD retrieval would increase the OMI NO2 VCDs by ∼30 % with correlation nearly unchanged. The comparison result of MAX-DOAS and OMI observations of HCHO VCD shows a good agreement with R of 0.75 and the slope of the regression line is 0.99. An age-weighted backward-propagation approach is applied to the MAX-DOAS measurements of NO2 and HCHO to reconstruct the spatial distribution of NO2 and HCHO over the Yangtze River Delta during summer and winter time. The reconstructed NO2 fields show a distinct agreement with OMI satellite observations. However, due to the short atmospheric lifetime of HCHO, the backward-propagated HCHO data do not show a strong spatial correlation with the OMI HCHO observations. The result shows that the MAX-DOAS measurements are sensitive to the air pollution transportation in the Yangtze River Delta, indicating the air quality in Nanjing is significantly influenced by regional transportation of air pollutants. The MAX-DOAS data are also used to evaluate the effectiveness of air pollution control measures implemented during the Youth Olympic Games 2014. The MAX-DOAS data show a significant reduction of ambient aerosol, NO2 and HCHO (30 %–50 %) during the Youth Olympic Games. Our results provide a better understanding of the transportation and sources of pollutants over the Yangtze River Delta as well as the effect of emission control measures during large international events, which are important for the future design of air pollution control policies.


Nitrogen dioxide (NO2) and formaldehyde (HCHO) are major atmospheric pollutants playing crucial roles in atmospheric chemistry. NO2 is a catalyst for ozone (O3) formation in the troposphere, while also participating in the catalytic destruction of stratospheric O3 (Crutzen, 1970). Major NO2 sources include fossil fuel combustion, biomass burning, lightning and oxidation of ammonia (Bond et al., 2001; Zhang et al., 2003). The emission of NOx shows a significant increasing trend in China due to the rapid industrialization and economic development in the last 2 decades (Zhang et al., 2007; van der A et al., 2008; Zhao et al., 2013), making it one of the most severe air pollution problems. HCHO is an intermediate product of the oxidation of almost all volatile organic compounds (VOCs). Therefore, it is widely used as an indicator of nonmethane volatile organic compounds (NMVOCs) (Fried et al., 2011). VOCs also have significant impacts on the abundance of hydroxyl (OH) radicals in the atmosphere, which is the major oxidant in the troposphere. Major HCHO sources over the continents include the oxidation of VOCs emitted from plants, biomass burning, traffic and industrial emissions. Oxidation of methane (CH4) emitted from the ocean is the main source of HCHO over water. Both NO2 and HCHO contribute to the formation of secondary aerosols (Jang and Kamens, 2001), while the contribution from HCHO is relatively small. NO2 and HCHO are also toxic to humans in high concentrations. The spatial distribution of NO2 and HCHO is strongly related to their emissions due to their short atmospheric lifetimes. Consequently, it is important to understand the spatial and temporal variations in atmospheric NO2 and HCHO for better air pollution management and control.
Multi-AXis Differential Optical Absorption Spectroscopy (MAX-DOAS) is a powerful remote sensing measurement technique which provides valuable vertical distribution information on atmospheric aerosols and trace gases (Platt and Stutz, 2008). Information on tropospheric aerosols and trace gases is obtained from the molecular absorption in the ultraviolet and visible spectral bands by applying the differential optical absorption spectroscopy (DOAS) technique to the observations of scattered sunlight spectrum in several different viewing directions. As the experimental setup of MAX-DOAS is rather simple and inexpensive, it has been widely used for the observation of atmospheric aerosols and trace gases in the past decade (Hönninger and Platt, 2002; Hönninger et al., 2004; Wittrock et al., 2004; Frieß et al., 2006; Irie et al., 2008; Li et al., 2010; Clémer et al., 2010; Halla et al., 2011; Li et al., 2013; Ma et al., 2013; Chan et al., 2015; Jin et al., 2016; Wang et al., 2016; Chan et al., 2018). MAX-DOAS measurements are highly sensitive to aerosols and trace gases in the lower troposphere and provide valuable information on the vertical distribution of aerosol extinction and trace gases. The information on the aerosol and trace gas vertical profiles are particularly important for the study of the physical and chemical processes in the atmosphere.
Satellite-based remote sensing measurements provide indispensable spatial information on air pollutants (Burrows et al., 1999; Bovensmann et al., 1999; Callies et al., 2000; Levelt et al., 2006). Trace gas columns are derived from the satellite observations of Earth's reflected solar spectrum for the investigation of atmospheric dynamics and emissions from both anthropogenic and natural sources (Beirle et al., 2003, 2004; Wenig et al., 2003; Richter et al., 2005; Zhang et al., 2007; van der A et al., 2008). Satellite measurements can also be used to determine the effectiveness of emission control measures (Mijling et al., 2009; Witte et al., 2009; Wu et al., 2013; Chan et al., 2015). However, the uncertainties of satellite trace gas column retrievals are strongly dependent on the accuracy of the assumptions of trace gas vertical distributions. In addition, the temporal resolution of satellite measurements is often limited to a single observation per day. Therefore, it is useful to compare and integrate ground-based and satellite observations for the interpretation of the spatial and temporal variation in NO2 and HCHO.
Nanjing is the second largest city in the Yangtze River Delta and East China. It is also the provincial capital of Jiangsu province. The population of Nanjing is about 8 million. Yangtze River is running through the city of Nanjing making it the largest inland port in China. Industrial, water and road transportation are the major anthropogenic sources of air pollution in Nanjing. Due to its rapid development, as well as the surrounding cities in the Yangtze River Delta, Nanjing is facing a series of air pollution problems in recent years. In addition, Nanjing has also hosted several important international events including the summer Youth Olympic Games in 2014. Therefore, it is important to have a better understanding of the air pollution sources in order to support the design of air-quality-related environmental policies in the future.
In this paper, we present long-term MAX-DOAS observations of NO2 and HCHO in Nanjing. Ground-based MAX-DOAS measurements were performed from April 2013 to February 2017. Details of the MAX-DOAS experimental setup, the spectral analysis as well as the retrieval of the aerosol extinction, NO2 and HCHO profiles are presented in Sect. 2. Section 3.1 shows the validation of MAX-DOAS aerosol observations by comparing the reported aerosol optical depths (AODs) to sun photometer measurements. The comparison of NO2 and HCHO VCDs measured by the MAX-DOAS and OMI satellite is presented in Sect. 3.2. An analysis of regional transport of pollutants over the Yangtze River Delta is shown in Sect. 3.4. In Sect. 3.5, we present an evaluation of the pollution reduction observed during the Youth Olympic Games in 2014.
2.1 MAX-DOAS measurements
2.1.1 Experimental setup
A MAX-DOAS instrument was set up at a meteorological station of Nanjing University (32.12∘ N, 118.95∘ E), which is located on a small hill on the university campus at about 45 m above sea level. The meteorological station is located about 17 km northeast of Nanjing city center and about 5 km south of the Yangtze River. The MAX-DOAS instrument for scattered sunlight measurements consists of a scanning telescope, a stepping motor controlling the viewing zenith angle of the telescope and a spectrometer. Scattered sunlight collected by the telescope is redirected by a quartz fiber to the spectrometer for spectral analysis. The field of view of the telescope is about 0.6∘. An Ocean Optics USB2000 spectrometer equipped with a Sony ILX511 charge-coupled device (CCD) detector is used to cover the wavelength range from 288 to 434 nm. The full width at half maximum (FWHM) spectral resolution of the spectrometer is 0.6 nm (at 360 nm).
A complete measurement cycle consists of scattered sunlight observations at elevation angle (α) of 1, 2, 3, 6, 10, 18, 30∘ and the zenith (90∘). The viewing azimuth angle is adjusted to 320∘ (northwest). The exposure time and the number of scans of each measurement is adjusted automatically depending on the received intensity of the scattered sunlight spectrum in order to achieve a similar intensity level for all the measurements. A full measurement sequence takes about 5–10 min.
2.1.2 Spectral retrieval
All the measurement spectra were first corrected for offset and dark current and then analyzed using the software QDOAS version 3.2 (http://uv-vis.aeronomie.be/software/QDOAS/, last access: 7 August 2019). The MAX-DOAS spectral fit was performed at two different wavelength ranges of 338–370 nm for NO2 retrieval and 324.5–359 nm for HCHO retrieval. In this study, the zenith spectrum () taken in the same measurement cycle is used as reference spectrum in the spectral analysis to retrieve the differential slant column densities (DSCDs). The differential slant column density (DSCD) is defined as the difference between the slant column density (SCD) of the measured spectrum and the corresponding zenith reference spectrum. The broadband spectral structures caused by Rayleigh and Mie scattering are removed by including a low-order polynomial in the DOAS fit. Absorption cross section of several trace gases were included in the DOAS fit at different fitting ranges, details of the DOAS retrieval settings for each wavelength range are listed in Table 1. The DOAS fit settings follow the one used in the Quality Assurance for Essential Climate Variables (QA4ECV) project (http://www.qa4ecv.eu/, last access: 7 August 2019). These settings have also been adopted for the Second Cabauw Intercomparison campaign for Nitrogen Dioxide measuring Instruments (CINDI-2) campaign (Kreher et al., 2019). A Small shift or squeeze of the wavelengths is allowed in the wavelength mapping process in order to compensate small uncertainties caused by the instability of the spectrograph. Figure 1 shows an example of the spectral fit retrieval of NO2 and HCHO DSCDs from a MAX-DOAS spectrum taken on 12 May 2013 at 08:48 LT (local time) with a viewing elevation angle of 1∘.
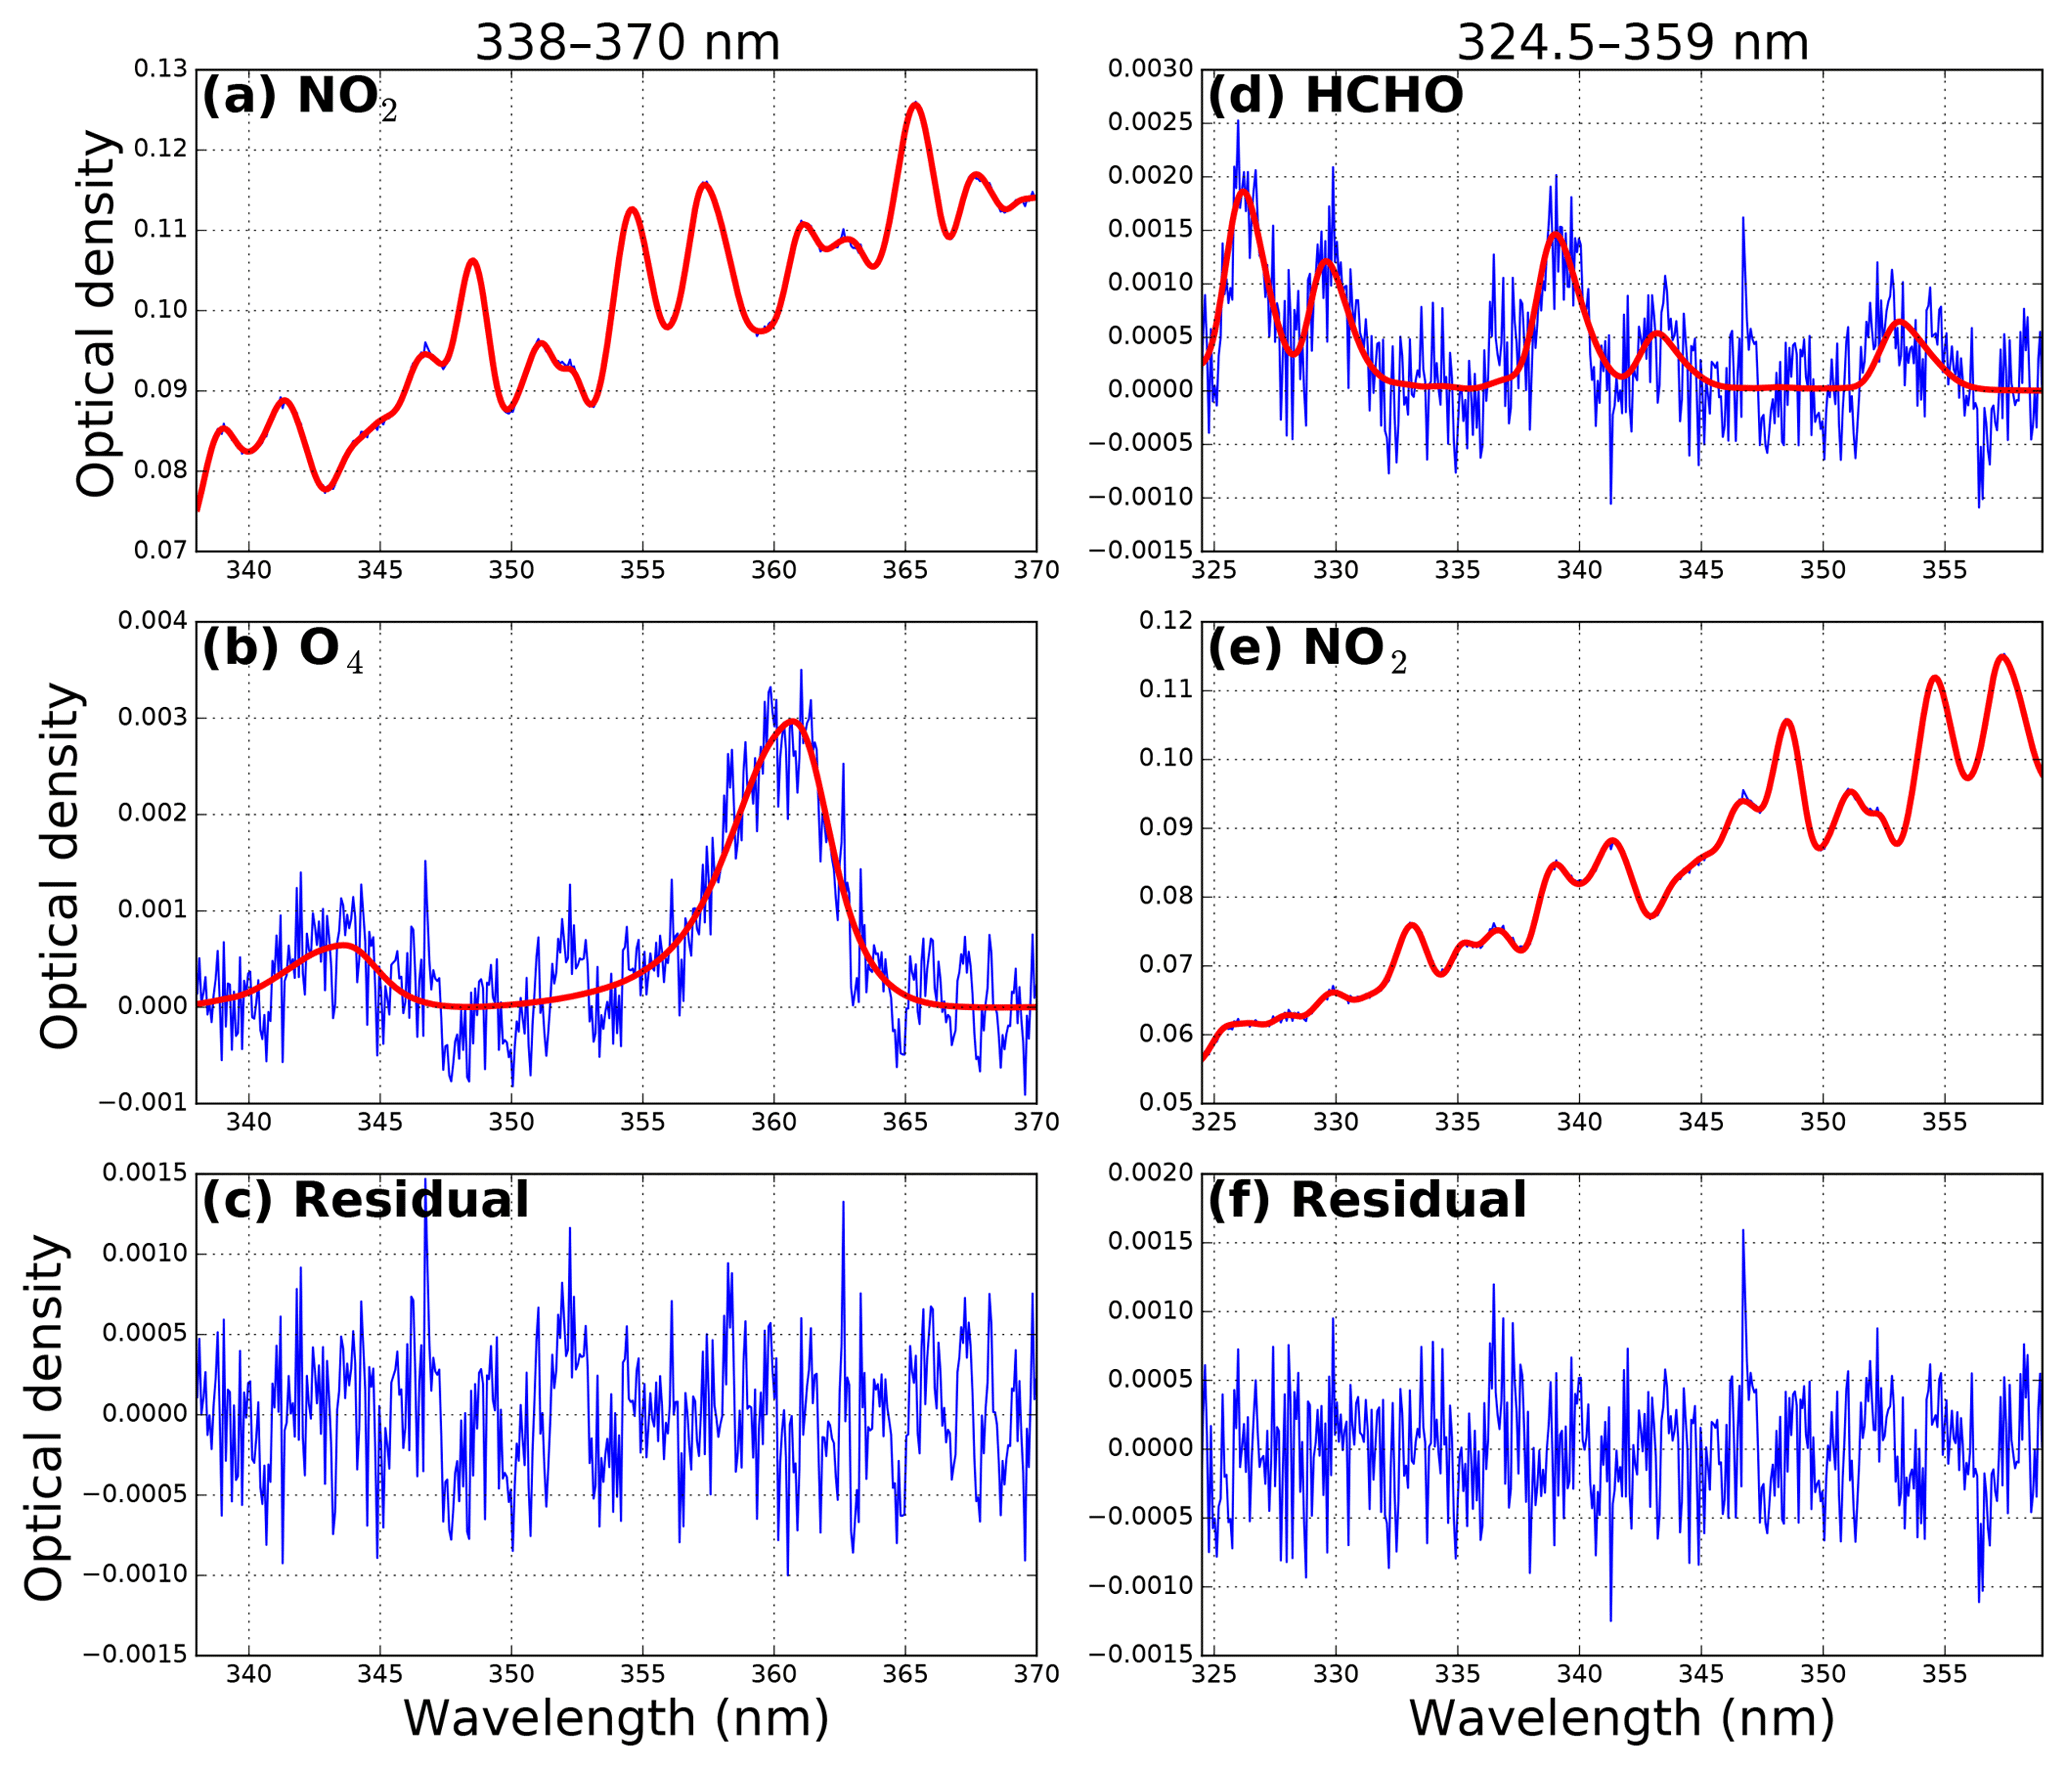
Figure 1An example of the DOAS retrieval of NO2 and HCHO DSCDs from a MAX-DOAS spectrum taken on 12 May 2013 at 08:48 LT (local time) with viewing elevation angle of 1∘. Panels (a, b, c) show the DOAS fit in the wavelength range of 338–370 nm, while panels (d, e, f) show DOAS fit in the wavelength range of 324.5–359 nm.
Table 1The DOAS retrieval settings for different wavelength bands.
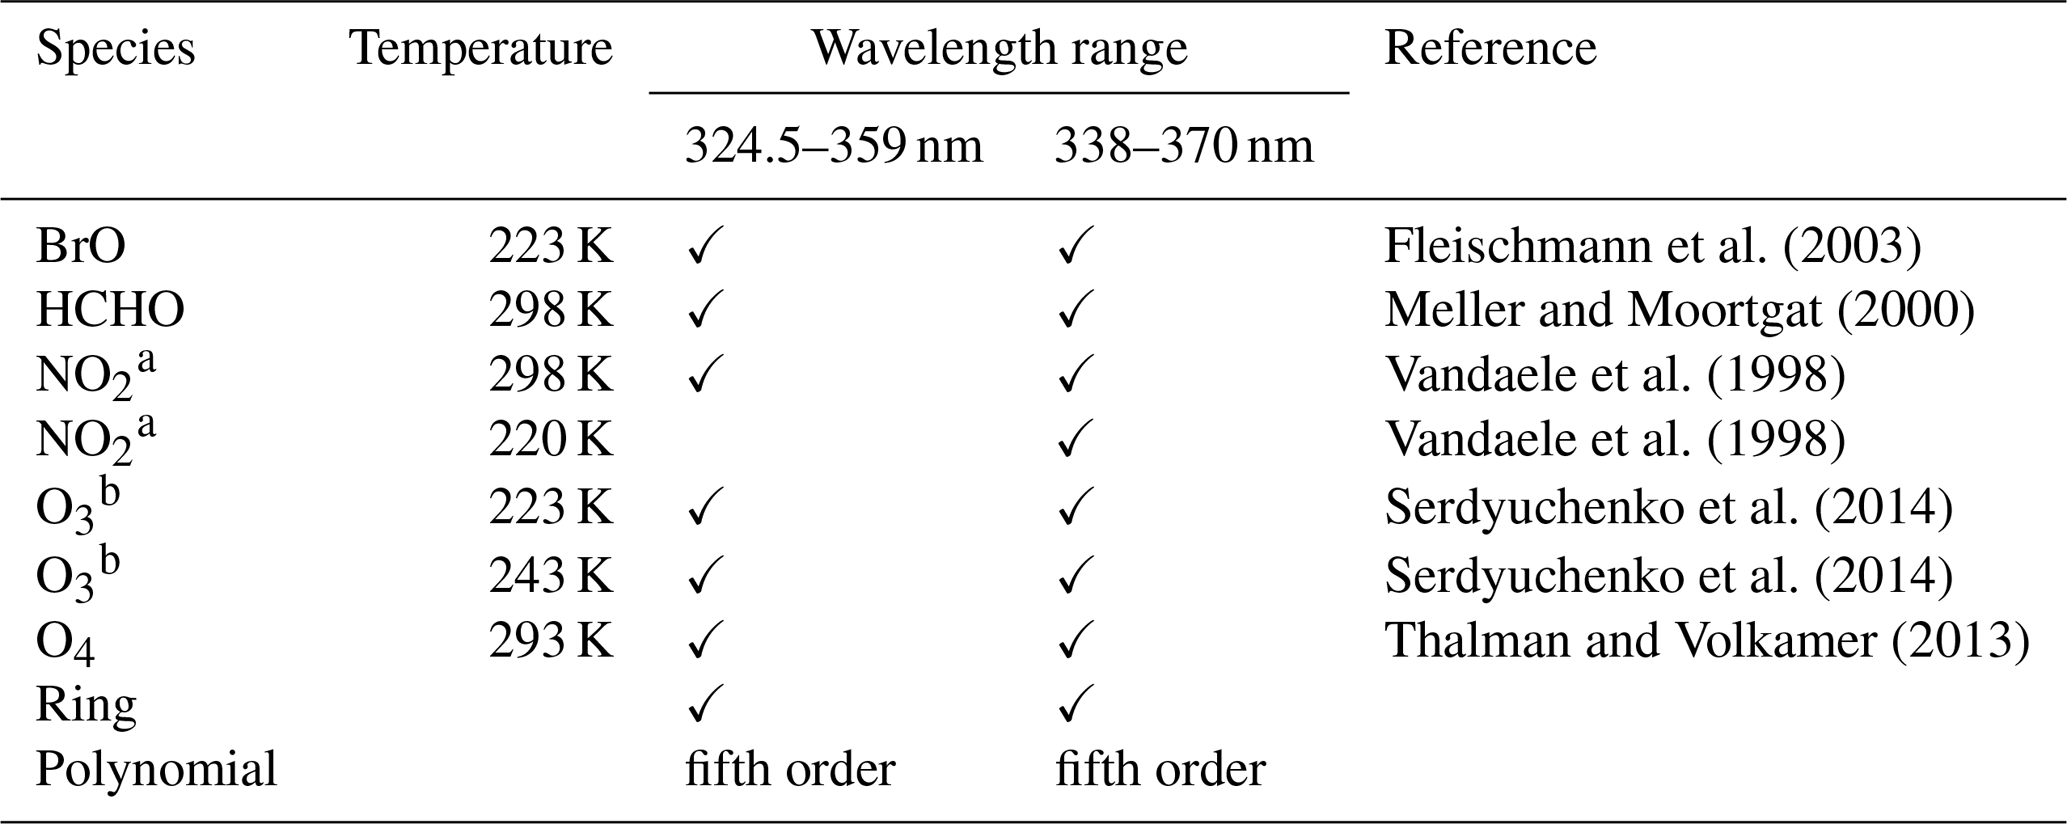
a I0 correction is applied with SCD of 1017 molec cm−2 (Aliwell et al., 2002). b I0 correction is applied with SCD of 1020 molec cm−2 (Aliwell et al., 2002).
As clouds are not included in the radiative transfer calculation of the aerosol and trace gas profile retrieval, the retrieval result can be significantly influenced by the presence of cloud in the atmosphere. Therefore, the retrieved DSCDs were first filtered by removing cloudy scenes before proceeding to the aerosol and trace gas profile retrieval. The vertical profile of the oxygen collision complex O4 only varies in a small range with atmospheric pressure and temperature, the retrieved O4 DSCDs and (relative) intensities are assumed to vary smoothly with time with the solar and viewing geometry. Rapid change in O4 DSCDs and intensities indicates a sudden change in the radiative transport condition, which is likely due to the presence of clouds. Therefore, we applied a locally weighted regression smoothing filter (LOWESS) (Cleveland, 1981) with a regression window of 3 h to the O4 DSCDs and intensity time series at each elevation angle to filter data influenced by inhomogeneous and/or rapid changes in radiation transport conditions. Data with rapidly varying O4 DSCDs and intensities were filtered out. Only data with slowly varying O4 DSCDs and intensities were used in the aerosol and trace gas retrieval. The limitation of this cloud screening algorithm is that the algorithm is not able to distinguish between continuous and homogeneous cloud conditions. However, it is rare that the cloud does not change for a long time (within an hour) and the cloud layer is homogeneous for all viewing directions.
2.1.3 Aerosol and trace gas profile retrieval
Previous studies show that there is a systematic discrepancy between observation and model simulation of O4 DSCDs (Wagner et al., 2009, 2011; Clémer et al., 2010; Chan et al., 2015, 2018; Wang et al., 2016; Zhang et al., 2018). A scaling correction factor has to be applied to the measured O4 DSCDs in order to bring measurement and model results into agreement. However, the physical meaning of this observation is still not well understood (Ortega et al., 2016; Wagner et al., 2019). Theoretically, the optical path should be the longest under aerosol-free conditions for off-zenith measurement. Thus, the MAX-DOAS measurement of O4 DSCDs should be smaller than the one simulated with pure Rayleigh atmosphere. In this study, we compared the forward simulation of O4 DSCDs under aerosol-free conditions to the O4 DSCDs retrieved from the MAX-DOAS observations to examine the necessity of O4 correction. Our result shows that the measured O4 DSCDs occasionally exceeded the forward simulation results which implies that correction of O4 DSCDs is necessary. The ratio between simulated and measured O4 DSCD varies from 0.75 to 1.0 for cases where the measured O4 DSCDs exceeded the forward simulation results. Our finding agrees with previously reported scaling correction factors of O4 DSCDs, which are ranging from 0.7 up to 1.0. In order to avoid over-correction due to the outliers, we take the 10th percentile instead of the minimum value of the simulated and measured O4 DSCD ratio as the correction factor which is ∼0.8. All MAX-DOAS observations of O4 DSCD are corrected by multiplying the correction factor of 0.8. From hereafter, all O4 DSCDs are referring to the corrected O4 DSCDs.
The conversion of the MAX-DOAS observations to aerosol extinction and trace gas profile requires inversion of the underlying radiative transfer equations. These equations cannot be linearized; therefore, it is suggested to fit the measurement quantities to the forward calculation of radiation transfer (Wagner et al., 2004; Hönninger et al., 2004; Sinreich et al., 2005; Frieß et al., 2006; Hartl and Wenig, 2013; Chan et al., 2018). As the vertical distribution profile of O4 is very stable and it has several absorption bands in the ultraviolet and visible spectral range, it is commonly used as a fitting quantity for the aerosol retrieval.
In this study, aerosol vertical profiles are retrieved at the 360 nm O4 absorption band using the Munich Multiple wavelength MAX-DOAS retrieval algorithm (M3; Chan et al., 2018). The algorithm is developed based on the optimal estimation method (Rodgers, 2000) and utilizes the Library for Radiative Transfer (LibRadTran) model (Emde et al., 2016) as the forward model. In this study, the U.S. Standard Atmosphere midlatitude profiles for winter (January) and summer (July) are temporally interpolated to each month of the year for the radiative transfer simulations. A brief description of the aerosol and trace gas vertical profile retrieval algorithm and the parameterization used in this study are presented in the following. A more detailed description of the M3 retrieval algorithm can be found in Chan et al. (2018).
In this study, all valid MAX-DOAS observations within a single measurement cycle are grouped together for the aerosol vertical profile retrieval. Assuming the set of measurements can be reproduced by the forward model and the forward model results are dependent on the aerosol extinction profile, we can then retrieve the aerosol extinction profile by fitting the forward model results to the MAX-DOAS O4 observations using the iterative Newton–Gauss method. The forward simulations of O4 DSCDs are performed at 360 nm due the strong O4 absorption at this wavelength. As the information contained in the MAX-DOAS observations are most likely not enough to retrieve a unique aerosol extinction profile, we have to supply the necessary information to the aerosol inversion in a form of a priori aerosol profile. As the aerosol load in Nanjing varies over a wide range, using a fixed a priori could result in over-regularizing the retrieval under higher aerosol load conditions. Therefore, we have implemented an iterative approach to avoid over-regularizing the retrieval. We first use a fixed initial a priori to retrieve the aerosol extinction profile. The fixed a priori profile is then scaled to have the same aerosol optical depth retrieved from the previous run. Then the new a priori is used in the next run to retrieve the aerosol extinction profile. This procedure is repeated until the difference between the retrieved and a priori aerosol optical depth is less than 10 % or the number of iterations reaches the limit.

Figure 2An example of vertical profile retrieval of aerosol extinction, NO2 and HCHO from MAX-DOAS measurements taken on 4 July 2013 at around 08:47 LT. The left panels show the (a) aerosol extinction, (d) NO2 and (g) HCHO profiles. Panels in the middle column indicate the average kernel of (b) aerosol extinction, (e) NO2 and (h) HCHO profile retrieval. The measured (blue curves) and modeled (green curves) DSCDs of (c) O4, (f) NO2 and (i) HCHO are shown in the right column.
As aerosols are typically emitted and formed close to the surface in urban areas, we assume the a priori aerosol extinction profile follows an exponentially decreasing function with a scale height of 1.0 km. The aerosol optical depth (AOD) of the a priori aerosol profile is set to 0.5 for the retrieval at 360 nm. The uncertainties in the a priori aerosol profile are set to 100 % and the correlation length of the aerosol inversion is assumed to be 0.5 km. As MAX-DOAS measurements are more sensitive to the aerosol and trace gases close to the instrument, we therefore divided the lowest 3.0 km of the troposphere into 15 layers with a thickness for each layer of 200 m. A fixed set of single scattering albedo of 0.92, asymmetry parameter of 0.68 and ground albedo of 0.04 is assumed in the radiative transfer calculations. An example of aerosol extinction profile retrieval is indicated in Fig. 2a–c.
The aerosol information obtained from the procedure described above was used for the differential box air mass factor (ΔDAMF) calculation for the trace gas profile inversion. The ΔDAMFs were calculated at a single wavelength for the retrieval of trace gas profile using the radiative transfer model LibRadTran with the Monte Carlo simulation module MYSTIC (Emde et al., 2016). The ΔDAMF was assumed to be constant within the DOAS spectral fitting windows. As NO2 DSCDs were retrieved in the same fitting window as O4, we therefore adapted the same wavelength of 360 nm for NO2 ΔAMF simulations. An example of NO2 profile retrieval is indicated in Fig. 2d–f. HCHO vertical distribution profile retrievals were retrieved at 340 nm which is close to the central wavelength of the DOAS fitting window of 342 nm. In addition, this wavelength is commonly used in HCHO retrieval, e.g., De Smedt et al. (2018). Aerosol extinction profiles obtained at the 360 nm O4 band are converted to 340 nm assuming a fixed Ångström coefficient (Ångström, 1929) of 1 for the calculation of ΔAMF. The Ångström coefficient can vary significantly with time. Sun photometer measurements in Nanjing (see Sect. 2.2) show that the Ångström coefficient mostly varies between 0.7 (10th percentile) and 1.4 (90th percentile). Based on the sun photometer observations, we estimated that the error caused by fixed Ångström coefficient on aerosol extinction is less than 2 %. The ΔDAMFs are subsequently calculated at 340 nm for the HCHO profile retrieval. An example of HCHO profile retrieval is indicated in Fig. 2g–i.
The atmosphere layer settings of the trace gas profile retrieval are the same as the one used in the aerosol profile retrieval. NO2 and HCHO concentrations above the retrieval height (3 km) are assumed to follow the U.S. Standard Atmosphere (Anderson et al., 1986). As the trace gas profile cannot be fully reconstructed by the small number of measurements, we therefore use the optimal estimation method (Rodgers, 2000) with iterative approach to regularize the inversion (Chan et al., 2015, 2018). The first step uses a fixed initial a priori to retrieve the trace gas distribution. The fixed a priori profile is then scaled to have the vertical column retrieved from the first run. The scaled a priori is used in the next run to retrieve the trace gas profile. The process repeats until the difference between the retrieved and a priori trace gas vertical column is less than 10 % or the number of iteration reaches the limit. In this study, the a priori is assumed to follow an exponential decrease function with a scale height of 1.0 km. The uncertainty in the a priori profile is set to 100 % of the a priori and correlation length is set to 0.5 km in the trace gas profile inversion. The NO2 vertical column density (VCD) of the a priori is set to 2 × 10¹⁶ molec cm−2, while the a priori HCHO VCD is set to 1 × 10¹⁶ molec cm−2.
2.2 Sun photometer measurements
A sun photometer was installed on the roof of a building of Nanjing University of Information Science and Technology (32.20∘ N, 118.70∘ E), which is located at the north bank of the Yangtze River. The sun photometer site is ∼25 km northwest of the MAX-DOAS measurement site. The two instruments are separated by the Yangtze River. An industrial park is about 3 km east of the sun photometer site. Heavy industry factories, i.e., steel and cement plants, are located in the industrial park. In this study, AODs measured by the sun photometer were used for the intercomparison study to validate the MAX-DOAS aerosol retrieval. Cloud screened data were used. The data consist of AOD measurements at seven different wavelength channels from 340 to 1020 nm. AOD measurements at 340 nm and 380 nm are interpolated to 360 nm for comparison.
2.3 Meteorological data
Meteorological parameters such as temperature, wind speed and wind direction are taken from a weather station in Nanjing, which is located about 20 km south of the MAX-DOAS measurement site. The weather station is operated by the National Meteorological Center of the China Meteorological Administration. These data are available on the web page of the China Meteorological Administration (https://data.cma.cn/site/index.html, last access: 7 August 2019). The meteorological data are mainly used for the analysis of meteorological effects on air quality in Nanjing during the Youth Olympic Games in 2014.
2.4 OMI satellite observations
The ozone monitoring instrument (OMI) is a passive nadir-viewing satellite-borne imaging spectrometer (Levelt et al., 2006) on board the Earth Observing System's (EOS) Aura satellite. The EOS Aura satellite orbit at an altitude of ∼710 km with a local Equator overpass time of 13:45 LT (local time). The instrument consists of two charge-coupled devices (CCDs) covering a wavelength range from 264 to 504 nm. A scan provides measurements at 60 positions across the orbital track covering a swath of approximately 2600 km. The spatial resolution of OMI varies from ∼320 km2 (at nadir) to ∼6400 km2 (at both edges of the swath). The instrument scans along 14.5 sun-synchronous polar orbits per day providing daily global coverage.
The NASA OMI NO2 and HCHO standard product version 3 (Krotkov et al., 2017; González Abad et al., 2015) is used in this study. In the NO2 product, the slant column densities (SCDs) of NO2 are derived from Earth's reflected spectra in the visible range (402–465 nm) using an iterative sequential algorithm (Marchenko et al., 2015). Previous studies show the updated SCDs are on average 10 %–40 % lower compared to the previous version of retrieval (Marchenko et al., 2015). The OMI NO2 SCDs are converted to VCDs by using the concept of air mass factor (AMF) (Solomon et al., 1987). The AMFs are calculated using NO2 profiles simulated by the Global Modeling Initiative (GMI) chemistry transport model. The horizontal resolution of GMI is 1∘ (latitude) × 1.25∘ (longitude) (Rotman et al., 2001). Separation of stratospheric and tropospheric columns is achieved by the local analysis of the stratospheric field over unpolluted areas (Bucsela et al., 2013).
The OMI HCHO retrieval algorithm uses the direct fit of radiances in the spectral range from 328.5 to 356.5 nm for the SCD retrieval. In the current version of the HCHO product, OMI radiance measurement over the remote Pacific is used as reference in the fitting process. This approach is reported to reduce the interferences from unresolved spectral structures in the retrieval of weak absorbers like HCHO (De Smedt et al., 2018). The retrieved SCDs are then converted to VCDs using the AMF approach. The AMFs are calculated based on climatological HCHO profiles.
2.5 Backward trajectory modeling
The National Oceanic and Atmospheric Administration Air Resources Laboratory (NOAA ARL) developed the HYbrid Single-Particle Lagrangian Integrated Trajectory (HYSPLIT) model (Stein et al., 2015) (https://www.arl.noaa.gov/hysplit/, last access: 7 August 2019) used to investigate the transportation of pollutants over the Yangtze River Delta. Meteorological data from the Global Data Assimilation System (GDAS) with a spatial resolution of and 24 vertical levels were used in the model for trajectory simulations. Backward trajectories are computed for air masses arriving at the midpoint of each MAX-DOAS retrieval layer.
3.1 Comparison of MAX-DOAS and sun photometer AODs
Aerosol optical depths (AODs) retrieved from the MAX-DOAS observations are compared to the sun photometer measurements. As the sampling resolution of the MAX-DOAS and the sun photometer are different, individual measurements are averaged to hourly, daily and monthly values for comparison. Figure 3 shows the scatter plot of AOD measured by the sun photometer and MAX-DOAS. Both datasets are cloud filtered. AODs measured by both MAX-DOAS and sun photometer are in general in good agreement. The Pearson correlation coefficient (R) of daily averaged data is 0.73. The slope of the total least squares regression between the two datasets is 0.56 with an offset of 0.13. The discrepancies between the two datasets can be explain by the difference in measurement technique and measurement location. The sun photometer derives AOD from direct sun measurements, while the MAX-DOAS retrieves AOD using the O4 absorption information from scattered sunlight. The sun photometer is sensitive to the entire column, while the MAX-DOAS is mostly sensitive to aerosol at the lowest few kilometers of the troposphere. Therefore, the MAX-DOAS is likely to underestimate the AOD when there is an elevated aerosol layer in the upper troposphere. This explanation matches with the observations that the MAX-DOAS agrees better with the sun photometer under low aerosol conditions (AOD < 1) and underestimates the AOD during high AOD conditions. Another source of error is the assumption of aerosol optical properties in the MAX-DOAS retrieval. In order to quantify the error caused by the fixed asymmetry parameter and single scatter albedo used in the aerosol retrieval, we have performed a sensitivity analysis by retrieving the aerosol profile with different asymmetry parameter and single scattering albedo. As the sun photometer in Nanjing does not provide full inversion of aerosol optical properties, aerosol optical properties are taken from the Taihu AERONET (AErosol RObotic NETwork) station which is about 150 km southeast of Nanjing. The 10th and 90th percentiles of asymmetry parameter and single scatter albedo are used for the sensitivity study. The result shows that the error caused by the fixed asymmetry parameter on AOD retrieval can be up to 4 %, while the single scattering albedo shows a smaller impact of up to 1.5 %. In addition, the MAX-DOAS and sun photometer are separated by a distance of ∼25 km and the sun photometer site is very close to an industrial park, where the heavily polluting industries are located, i.e., steel and cement plants. Therefore, the sun photometer measurements are expected to be higher than the MAX-DOAS observations. Accounting for these effects, the MAX-DOAS and sun photometer observations agree well with each other and the MAX-DOAS-derived aerosol profiles are reliable for the retrieval of NO2 and HCHO profiles.
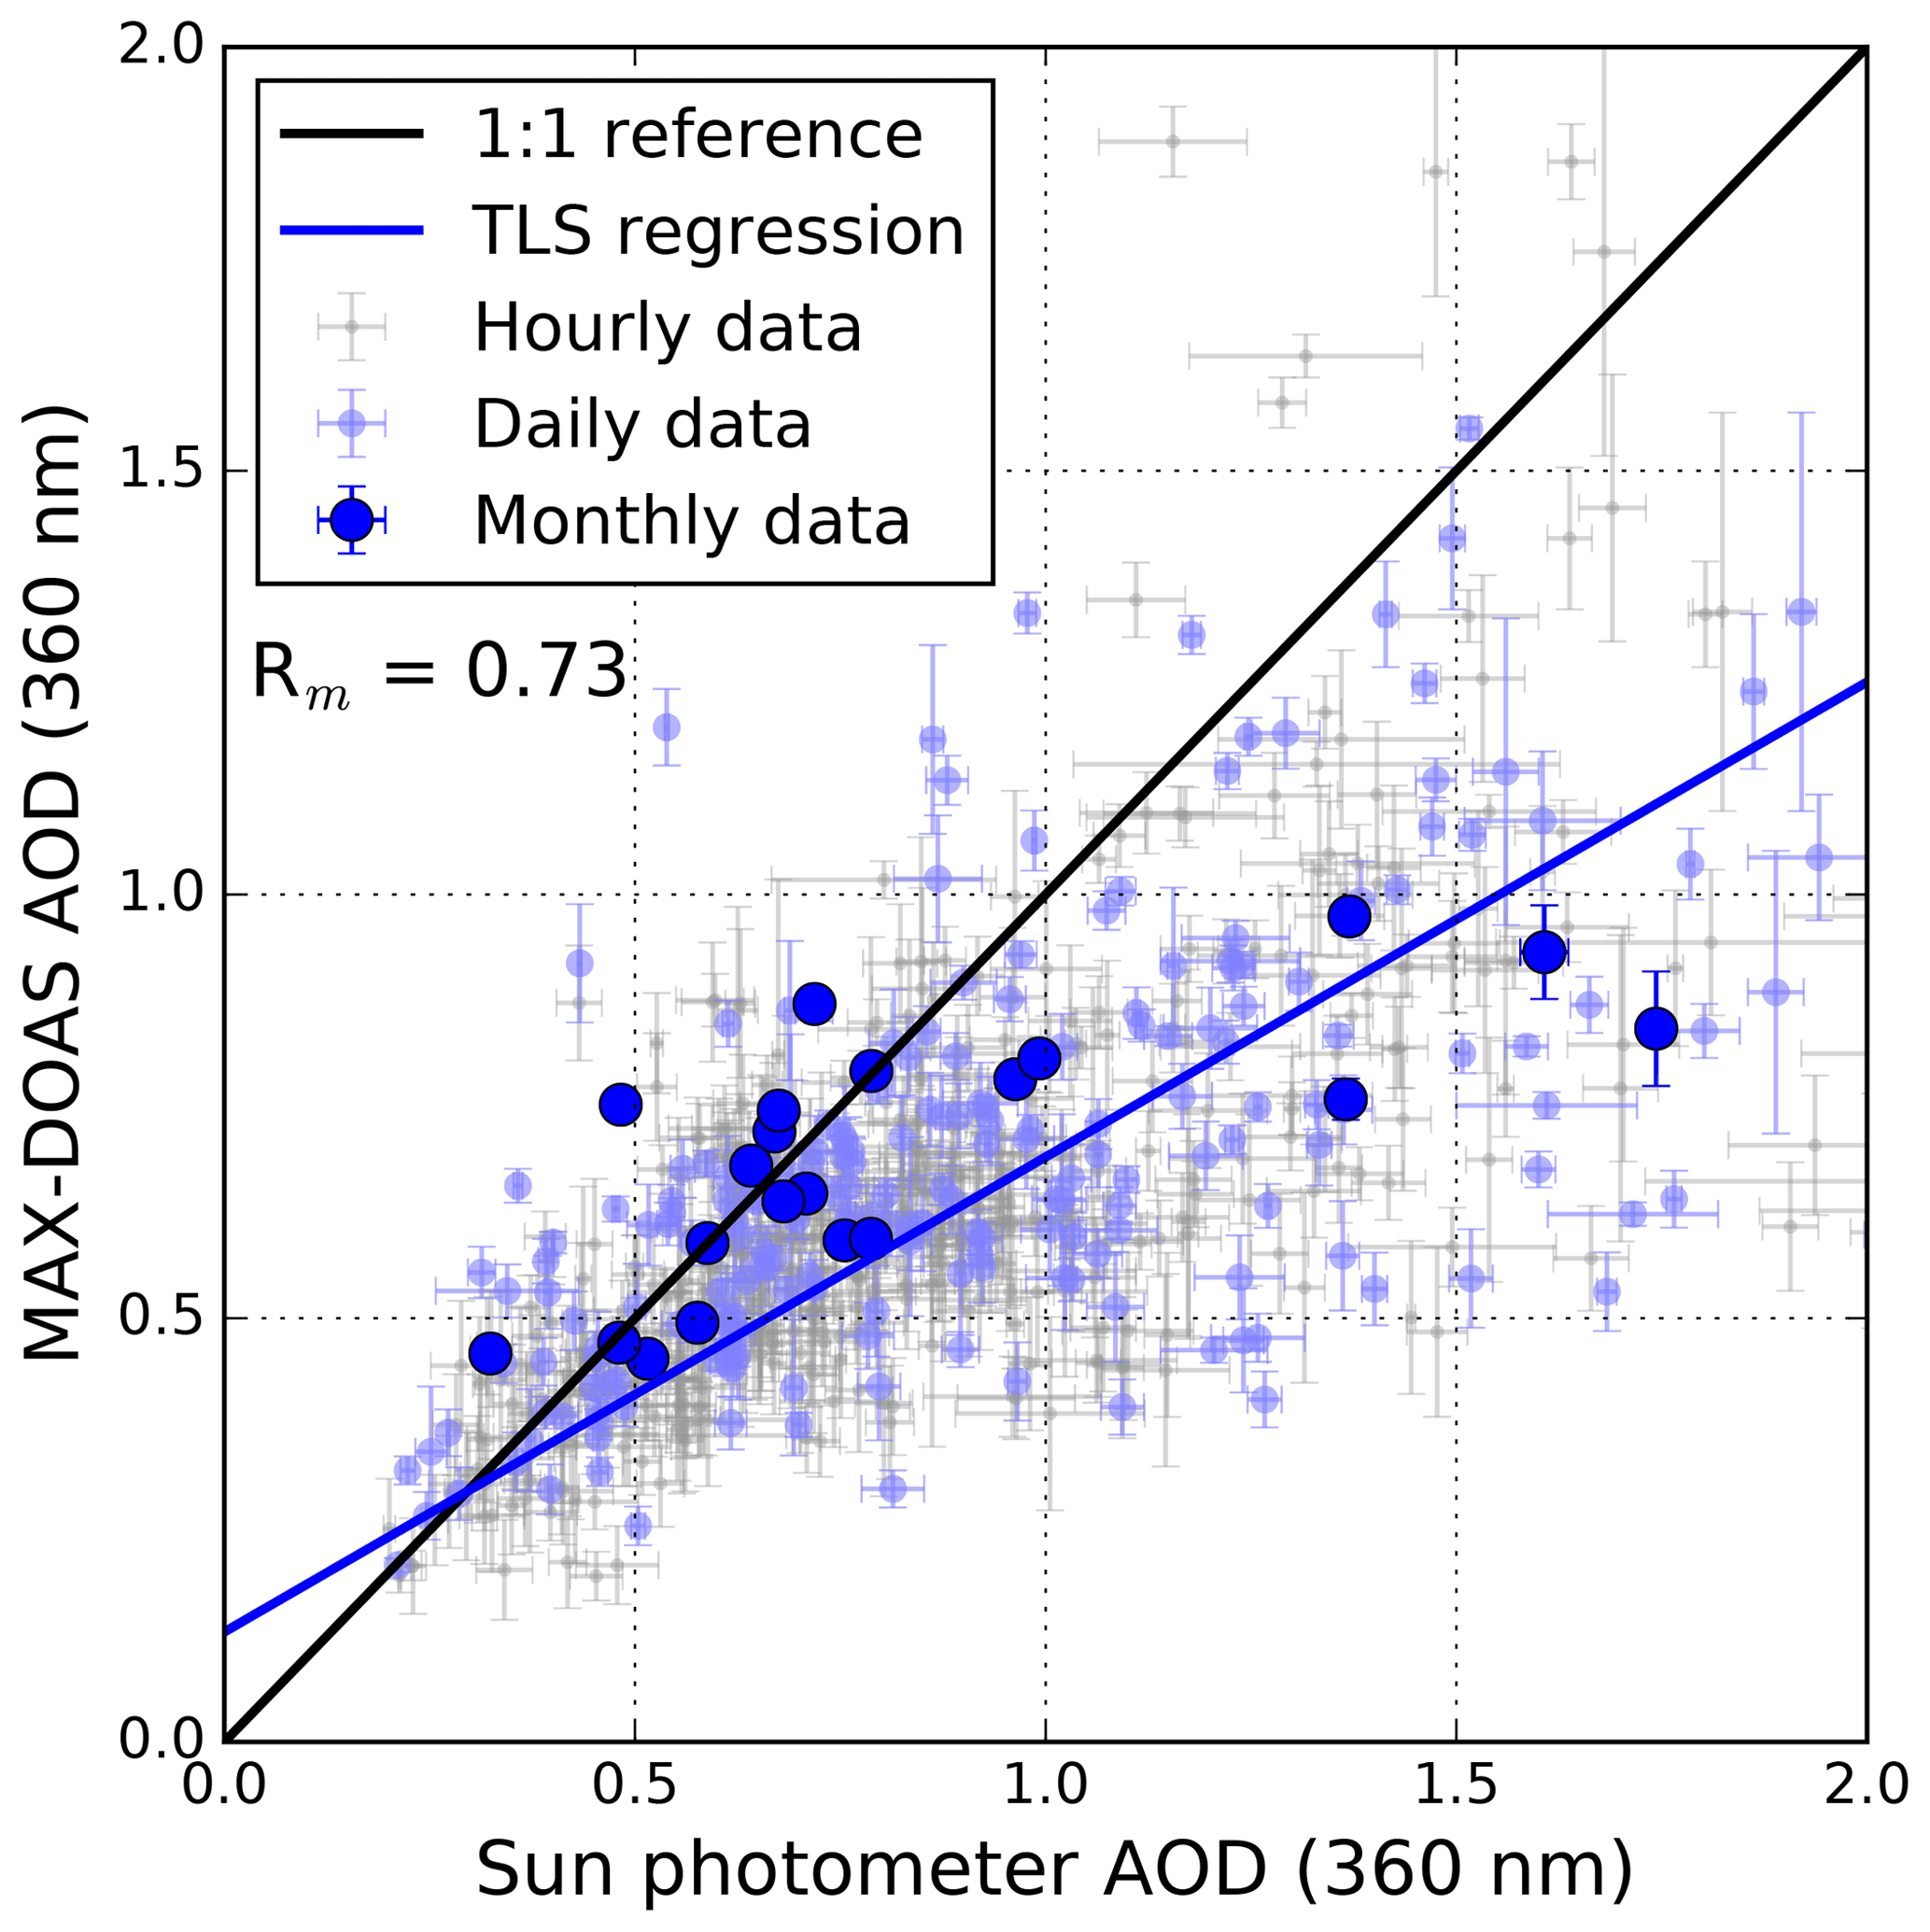
Figure 3Comparison of AOD measured by the MAX-DOAS and sun photometer. The total least squares regression line is calculated based on the daily data.
3.2 Comparison of MAX-DOAS and OMI observations
Vertical column densities of NO2 and HCHO retrieved from the ground-based MAX-DOAS measurements are compared to OMI satellite observations. MAX-DOAS data are temporally averaged around the OMI overpass time from 12:00 to 14:00 LT, while OMI VCDs are spatially averaged for pixels within 20 km of the MAX-DOAS measurement site. Time series of MAX-DOAS and OMI observations of NO2 and HCHO VCDs are shown in Figs. 4 and 5, respectively. Both OMI NO2 and HCHO datasets are filtered for cloud radiance fraction smaller than 0.4. Daily and monthly averaged data are shown. Missing data for some months are due to cloud filtering or instrumental issues of the MAX-DOAS.
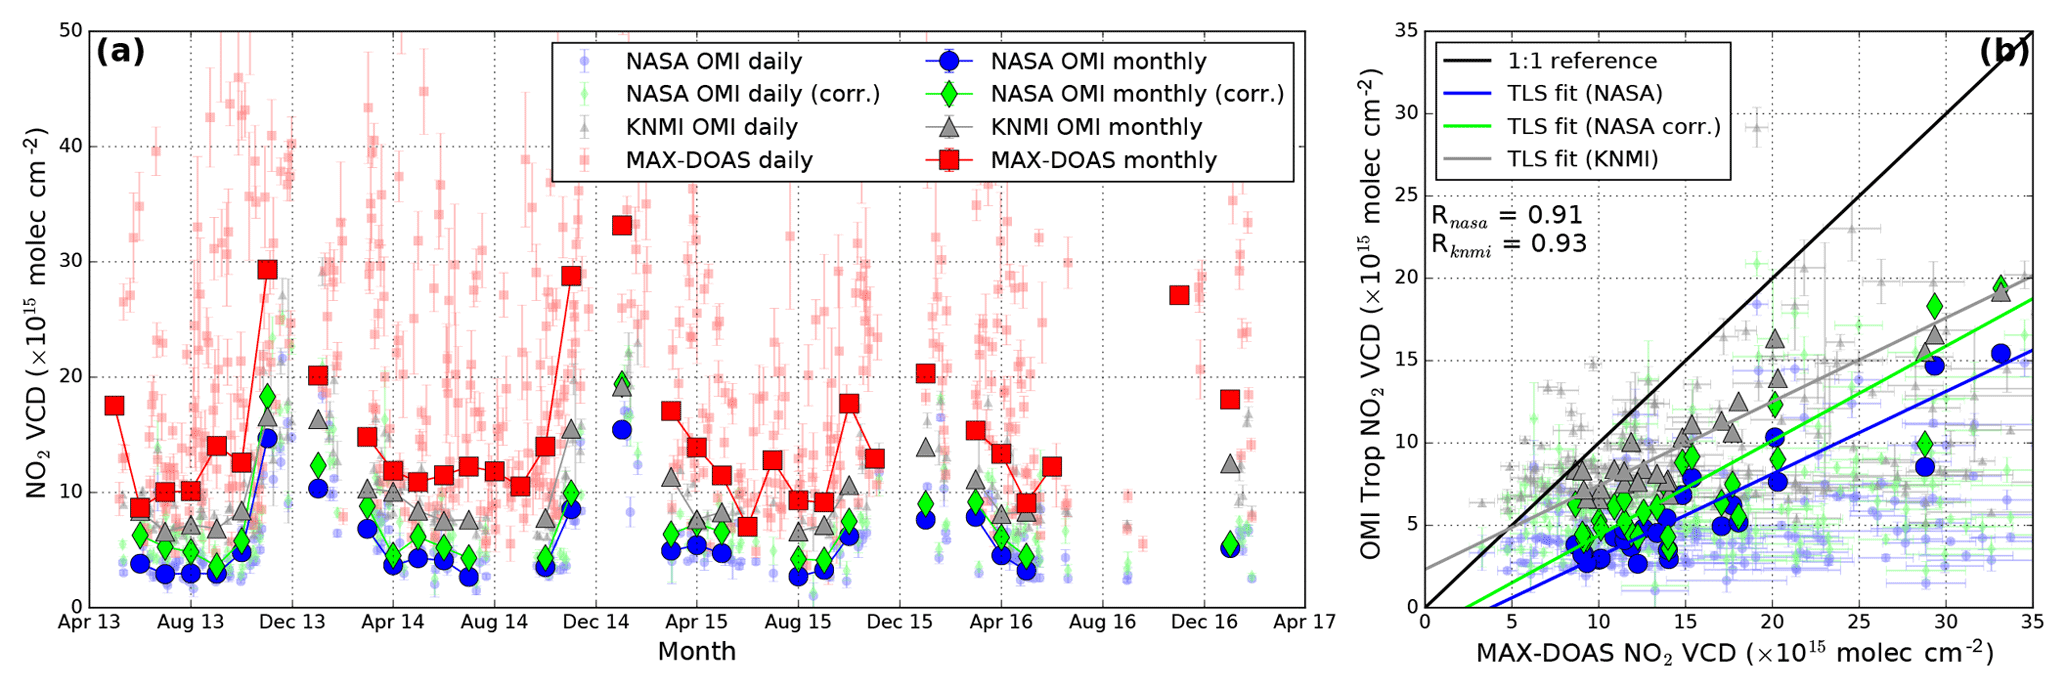
Figure 4(a) Time series of the MAX-DOAS (red markers) and NASA OMI (blue markers) tropospheric NO2 VCDs over Nanjing from 2013 to 2017. MAX-DOAS data are temporally averaged around the OMI overpass time. OMI measurements are spatially averaged for pixels within 20 km of the MAX-DOAS measurement site. OMI NO2 VCDs retrieved using MAX-DOAS profile as a priori information are indicated as green markers. Tropospheric NO2 VCDs taken from a KNMI product are also shown as gray marker for reference. (b) Comparison of tropospheric NO2 VCDs between the MAX-DOAS and OMI satellite observations. The total least squares regression line is calculated based on the monthly average data.

Figure 5(a) Time series of the MAX-DOAS (red markers) and OMI (blue markers) HCHO VCDs over Nanjing from 2013 to 2017. MAX-DOAS data are temporally averaged around the OMI overpass time. OMI measurements are spatially averaged for pixels within 20 km of the MAX-DOAS measurement site. OMI NO2 VCDs retrieved using MAX-DOAS profile as a priori information are indicated as green markers. (b) Comparison of HCHO VCDs between the MAX-DOAS and OMI satellite observations. The total least squares regression line is calculated based on the monthly average data.
NO2 VCDs measured by the MAX-DOAS and the OMI satellite show a similar seasonal pattern with higher NO2 columns during winter and lower NO2 values over summer. Higher NO2 levels are due to a longer atmospheric lifetime of NO2 during winter and higher emissions in winter, e.g., higher power consumption and emissions from individual domestic heating. MAX-DOAS and OMI observations show good temporal consistency with each other with Pearson correlation coefficient (R) of 0.91. Despite the strong correlation between the two datasets, the OMI observations are systematically underestimating the NO2 columns. The slope and offset of the total least squares regression between the two datasets are 0.50 and molec cm−2, respectively. Averaged OMI NO2 column over Nanjing is 5.67 × 10¹⁵ molec cm−2, which is about 60 % lower than the MAX-DOAS averaged VCD of 14.96 × 10¹⁵ molec cm−2 (see Fig. 4). The underestimation of NO2 VCDs from OMI measurements agree with previous studies in the Yangtze River Delta (Chan et al., 2015). The discrepancies can be related to the differences in spatial coverage between the ground-based and satellite observations and the uncertainties related to the NO2 vertical distribution profile shape used in the air mass factor calculation. We quantified the influence of NO2 vertical distribution profile on the air mass factor calculation by recomputed the OMI tropospheric NO2 air mass factor using the MAX-DOAS NO2 profile as a priori information. Seasonal average of OMI a priori NO2 profiles are shown in Fig. 6a. MAX-DOAS observations of NO2 profiles are shown in Sect. 3.3. The MAX-DOAS observations show that most of the NO2 resided below 500 m, while OMI a priori NO2 profiles shoed a larger fraction of NO2 above 500 m. OMI NO2 VCDs retrieved with MAX-DOAS NO2 profiles are also indicated in Fig. 4. Using the MAX-DOAS profile as a priori information in the OMI NO2 VCDs retrieval on average increased the OMI NO2 VCDs by ∼30 % with correlation nearly unchanged. The averaged OMI NO2 column over Nanjing increased to 7.29 × 10¹⁵ molec cm−2. In addition, the slope of the regression line increases from 0.50 to 0.57, while the offset reduces from −1.89 to molec cm−2. The result indicates that a better estimation of NO2 vertical distribution in the satellite VCD retrieval reduces the discrepancies. Our findings agree with previous studies that using better estimated NO2 vertical profile in the satellite air mass factor calculation enhanced the OMI NO2 columns and reduced discrepancies between OMI and ground-based observations (Chan et al., 2012, 2015; Lin et al., 2014; Wang et al., 2017). However, the improved OMI NO2 VCDs are still about 50 % lower than the MAX-DOAS observations indicating that there are still remaining issues. A previous study shows that the OMI NO2 tropospheric vertical columns processed by the Royal Netherlands Meteorological Institute (KNMI; DOMINO version 2.0; Boersma et al., 2011) only underestimated the tropospheric NO2 VCDs by ∼20 % compared to ground-based MAX-DOAS observations in Wuxi (another city in the Yangtze River Delta; Wang et al., 2017). In order to investigate the differences between different OMI NO2 products, we have also plotted the KNMI OMI NO2 product in Fig. 4. The average NO2 column reported from the KNMI) product is 10.10 × 10¹⁵ molec cm−2, which is about a factor of 2 higher than the NASA product. The result shows the KNMI product only underestimate the NO2 columns in Nanjing by ∼30 %, which is consistent with a previous study in the Yangtze River Delta (Wang et al., 2017). The difference between the two OMI products can be related to different spectral analysis techniques, stratospheric tropospheric separation algorithms and a priori profiles used in the retrievals. Investigation of the differences between the two algorithms is, however, beyond the scope of this study. Another source of discrepancy is related to the difference in spatial coverage of OMI and MAX-DOAS observations. The spatial coverage of the OMI measurement footprint is ranging from 330 up to 4600 km2 with an average of 920 km2. Measurements with large pixel size are probably difficult to capture the spatial gradient of NO2 and result in an underestimation over pollution hot spots due to the averaging over a large OMI footprint. This effect is especially significant over Nanjing, as it is a local pollution hot spot surrounded by rather clean areas. The underestimation of NO2 columns is coherent with previous measurements over urban pollution hot spots, i.e., Washington DC and Shanghai (Wenig et al., 2008; Chan et al., 2015). In addition, previous measurements over a suburban area in Shanghai show better agreement with OMI observations compared to the measurements in the city (Chan et al., 2015), indicating the effect of spatial inhomogeneity of NO2 on the satellite data comparison. However, the impact of this effect is difficult to quantify due to a lack of high spatial resolution data. Cloud contamination could be an important source of error in the satellite retrieval. A previous study shows that the cloud effect on OMI NO2 VCD retrieval is only significant for cloud radiance fraction > 0.4 (Wang et al., 2017). The OMI NO2 data used in this study are filtered for cloud radiance fraction smaller than 0.4. Therefore, cloud contamination should only show a negligible effect in the comparison.

Figure 6Seasonal average of (a) NO2 and (b) HCHO a priori profiles used in OMI retrieval. A priori profile of spring (March, April, May), summer (June, July and August), autumn (September, October, November) and winter (January, February and December) are shown.
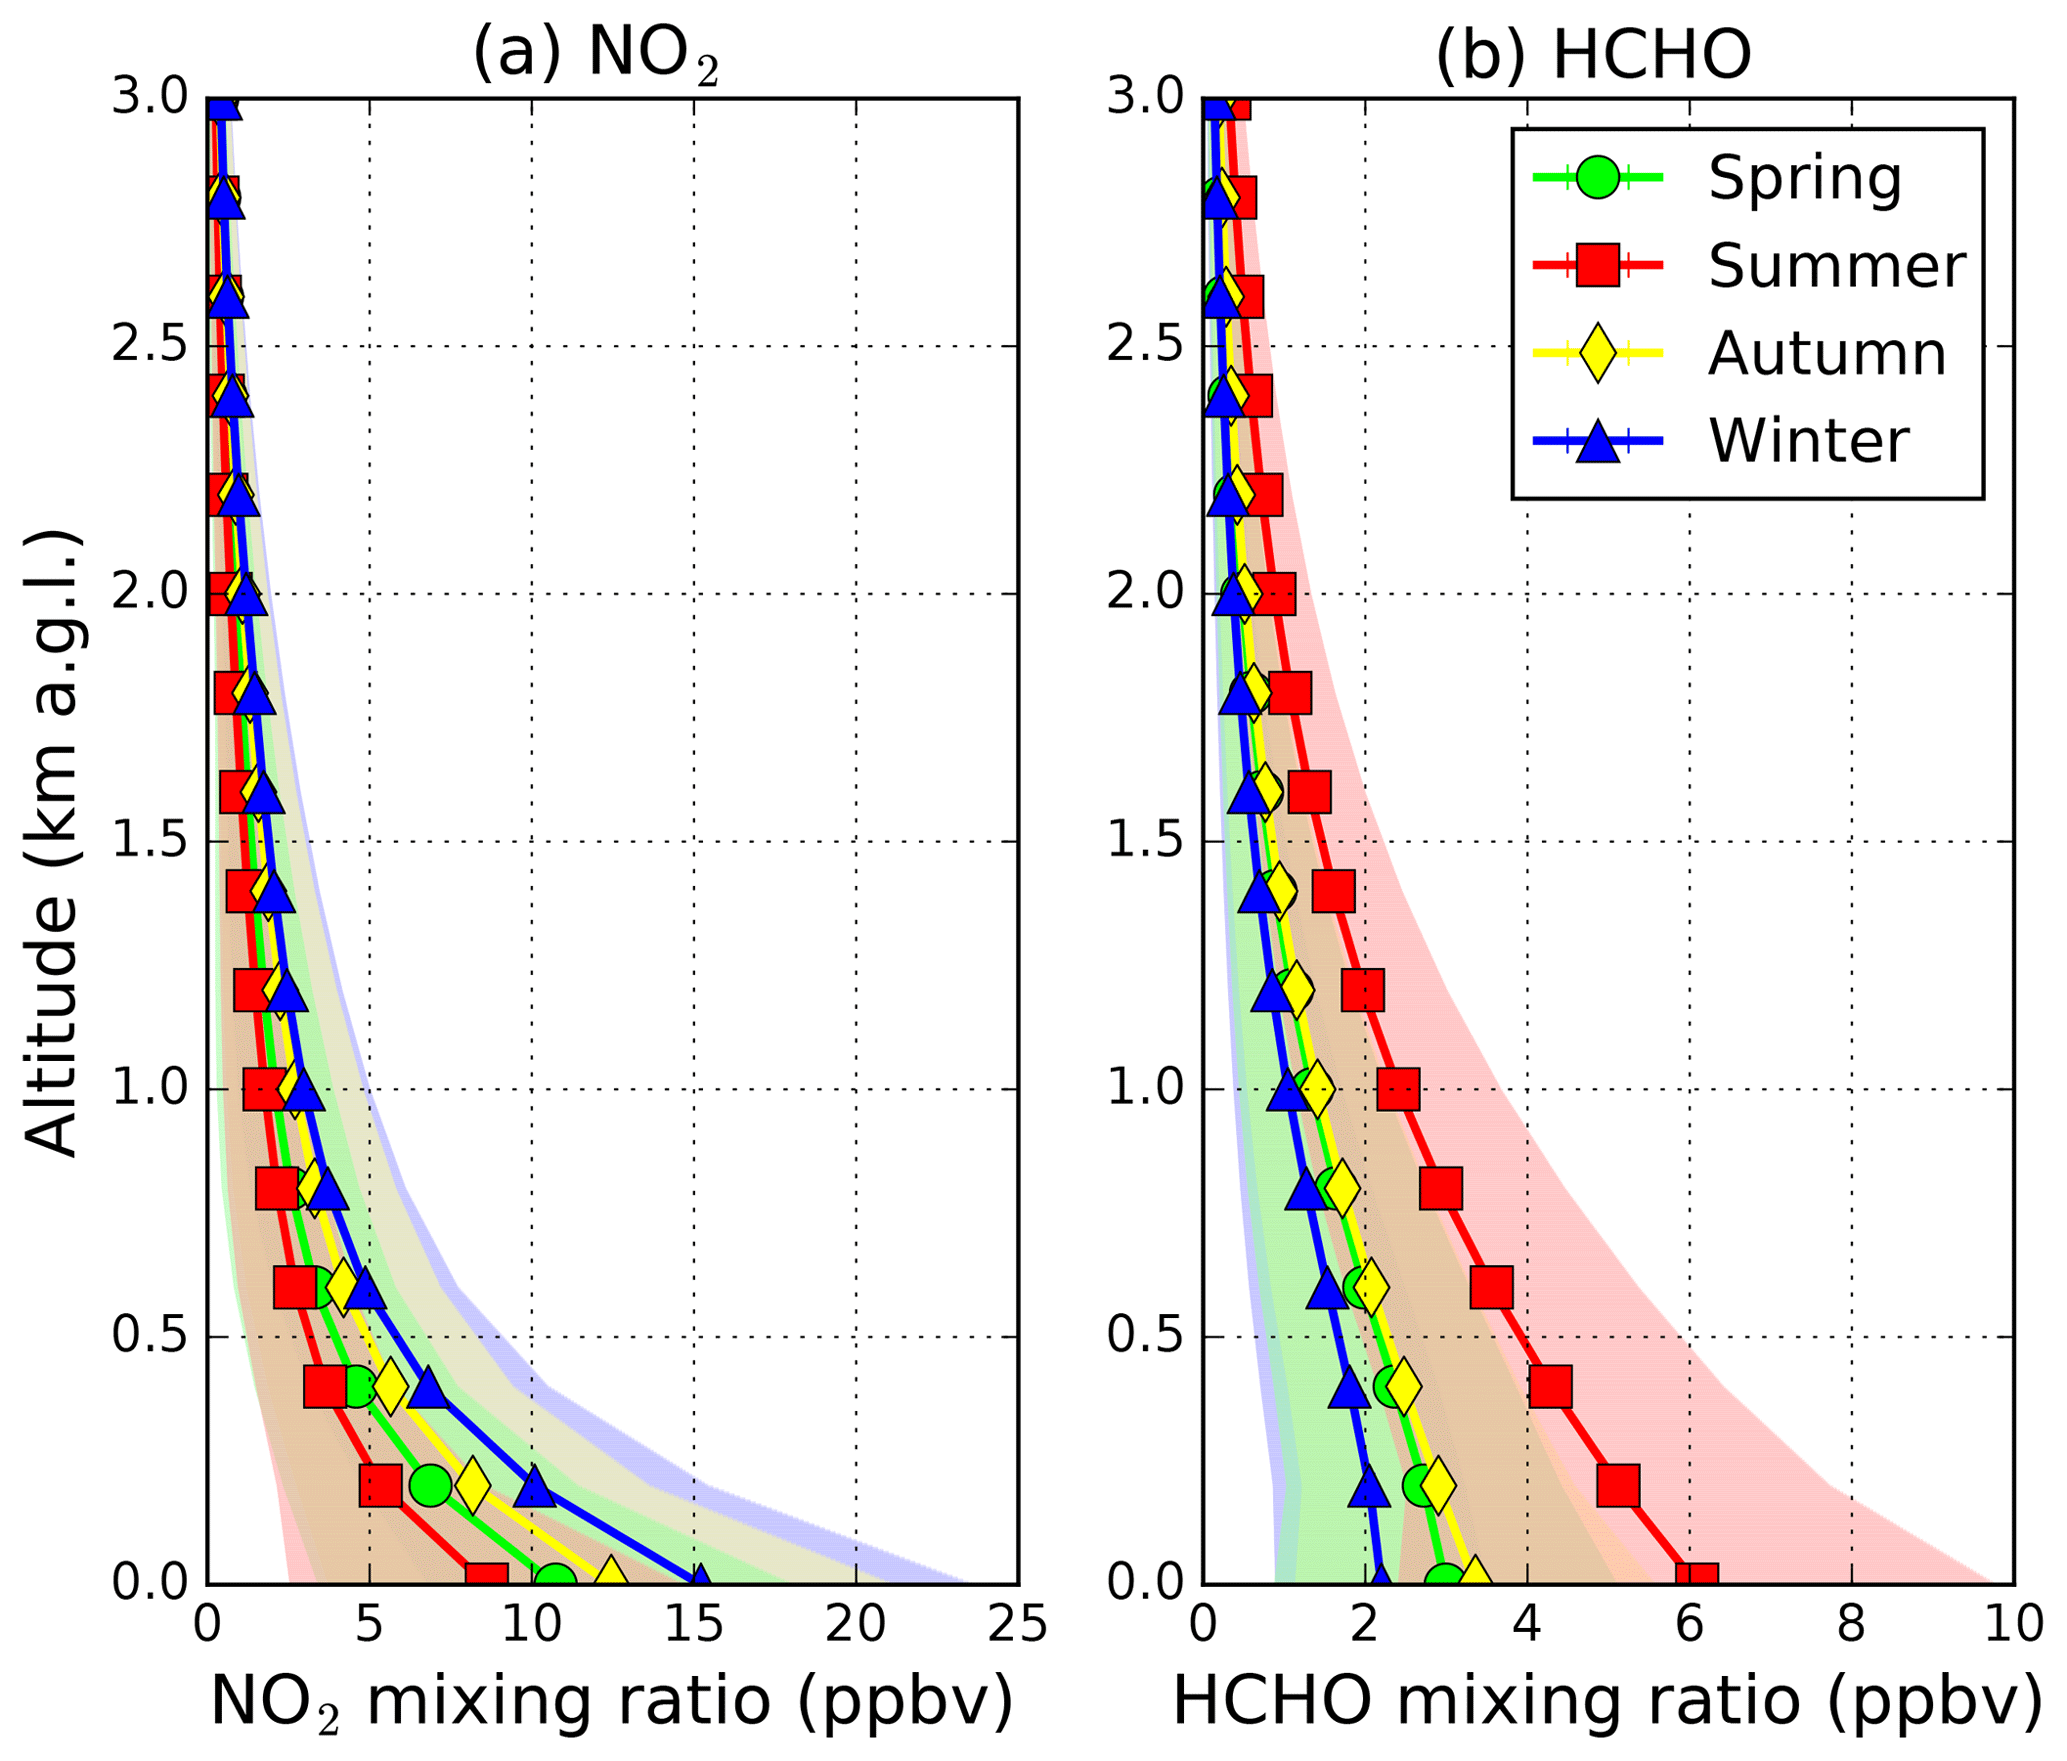
Figure 7Vertical distribution of (a) NO2 and (b) HCHO for different seasons. Shaded areas represent 1σ standard deviation of variation.

Figure 8The upper panels show spatial distribution of NO2 in (a) summer and (b) winter reconstructed from the MAX-DOAS measurements using backward trajectories calculated by the HYSPLIT model. Backward trajectories are calculated over 6 h for summer measurements and 12 h for winter measurements. The lower panels indicates the average OMI NO2 vertical column densities over the Yangtze River Delta during (c) summer and (d) winter.
We have also compared the MAX-DOAS and OMI observations of HCHO and both datasets show a similar seasonal variation pattern. The seasonal variation pattern of HCHO is opposite to NO2 with higher HCHO columns during summer and lower in winter. Higher HCHO levels in summer are related to the increases in biogenic emission of precursor VOCs from plants and higher oxidation rate of VOCs. The MAX-DOAS measurements of HCHO VCDs agree well with the OMI observations with Pearson correlation coefficient (R) of 0.75. In addition, the absolute value of the columns show a perfect agreement. The average HCHO VCD measured by the MAX-DOAS is 8.04 × 10¹⁵ molec cm−2, while the averaged OMI HCHO VCD is 7.89 × 10¹⁵ molec cm−2. The slope of the total least squares regression between the two datasets is 0.99 with an offset of 0.31 × 10¹⁵ molec cm−2 (see Fig. 5b). In order to quantify the influence of HCHO vertical distribution profile on the air mass factor calculation, we have recomputed the OMI HCHO VCDs using the MAX-DOAS HCHO profiles as a priori information. OMI HCHO VCDs retrieved with MAX-DOAS HCHO profiles are also indicated in Fig. 5. Using the MAX-DOAS profile as a priori information in the OMI HCHO VCDs retrieval on average increased the OMI HCHO VCDs by ∼25 % with correlation nearly unchanged. The averaged OMI HCHO column over Nanjing increased to 9.95 × 10¹⁵ molec cm−2. The slope of the regression line also increases from 0.99 to 1.39, while the offset reduces from 0.31 to molec cm−2. Higher HCHO VCDs retrieved from OMI using MAX-DOAS profiles as a priori is mainly due to ignoring HCHO in the upper altitudes. Seasonal average of OMI a priori HCHO profiles are shown in Fig. 6b. The a priori show a considerable amount of HCHO above 3 km especially during summer, while the MAX-DOAS only reports HCHO mixing ratios up to 3 km above ground level. Sources of HCHO in the troposphere include the oxidation of various VOCs, including methane. Some of these VOCs have relatively long atmospheric lifetimes, e.g., methane; therefore, they are rather well mixed in the atmospheric and result in a larger portion of HCHO in the upper troposphere. The MAX-DOAS could not capture HCHO at higher altitudes. Therefore, using the MAX-DOAS profiles for OMI HCHO retrieval likely underestimates the air mass factors and overestimates the HCHO total columns.
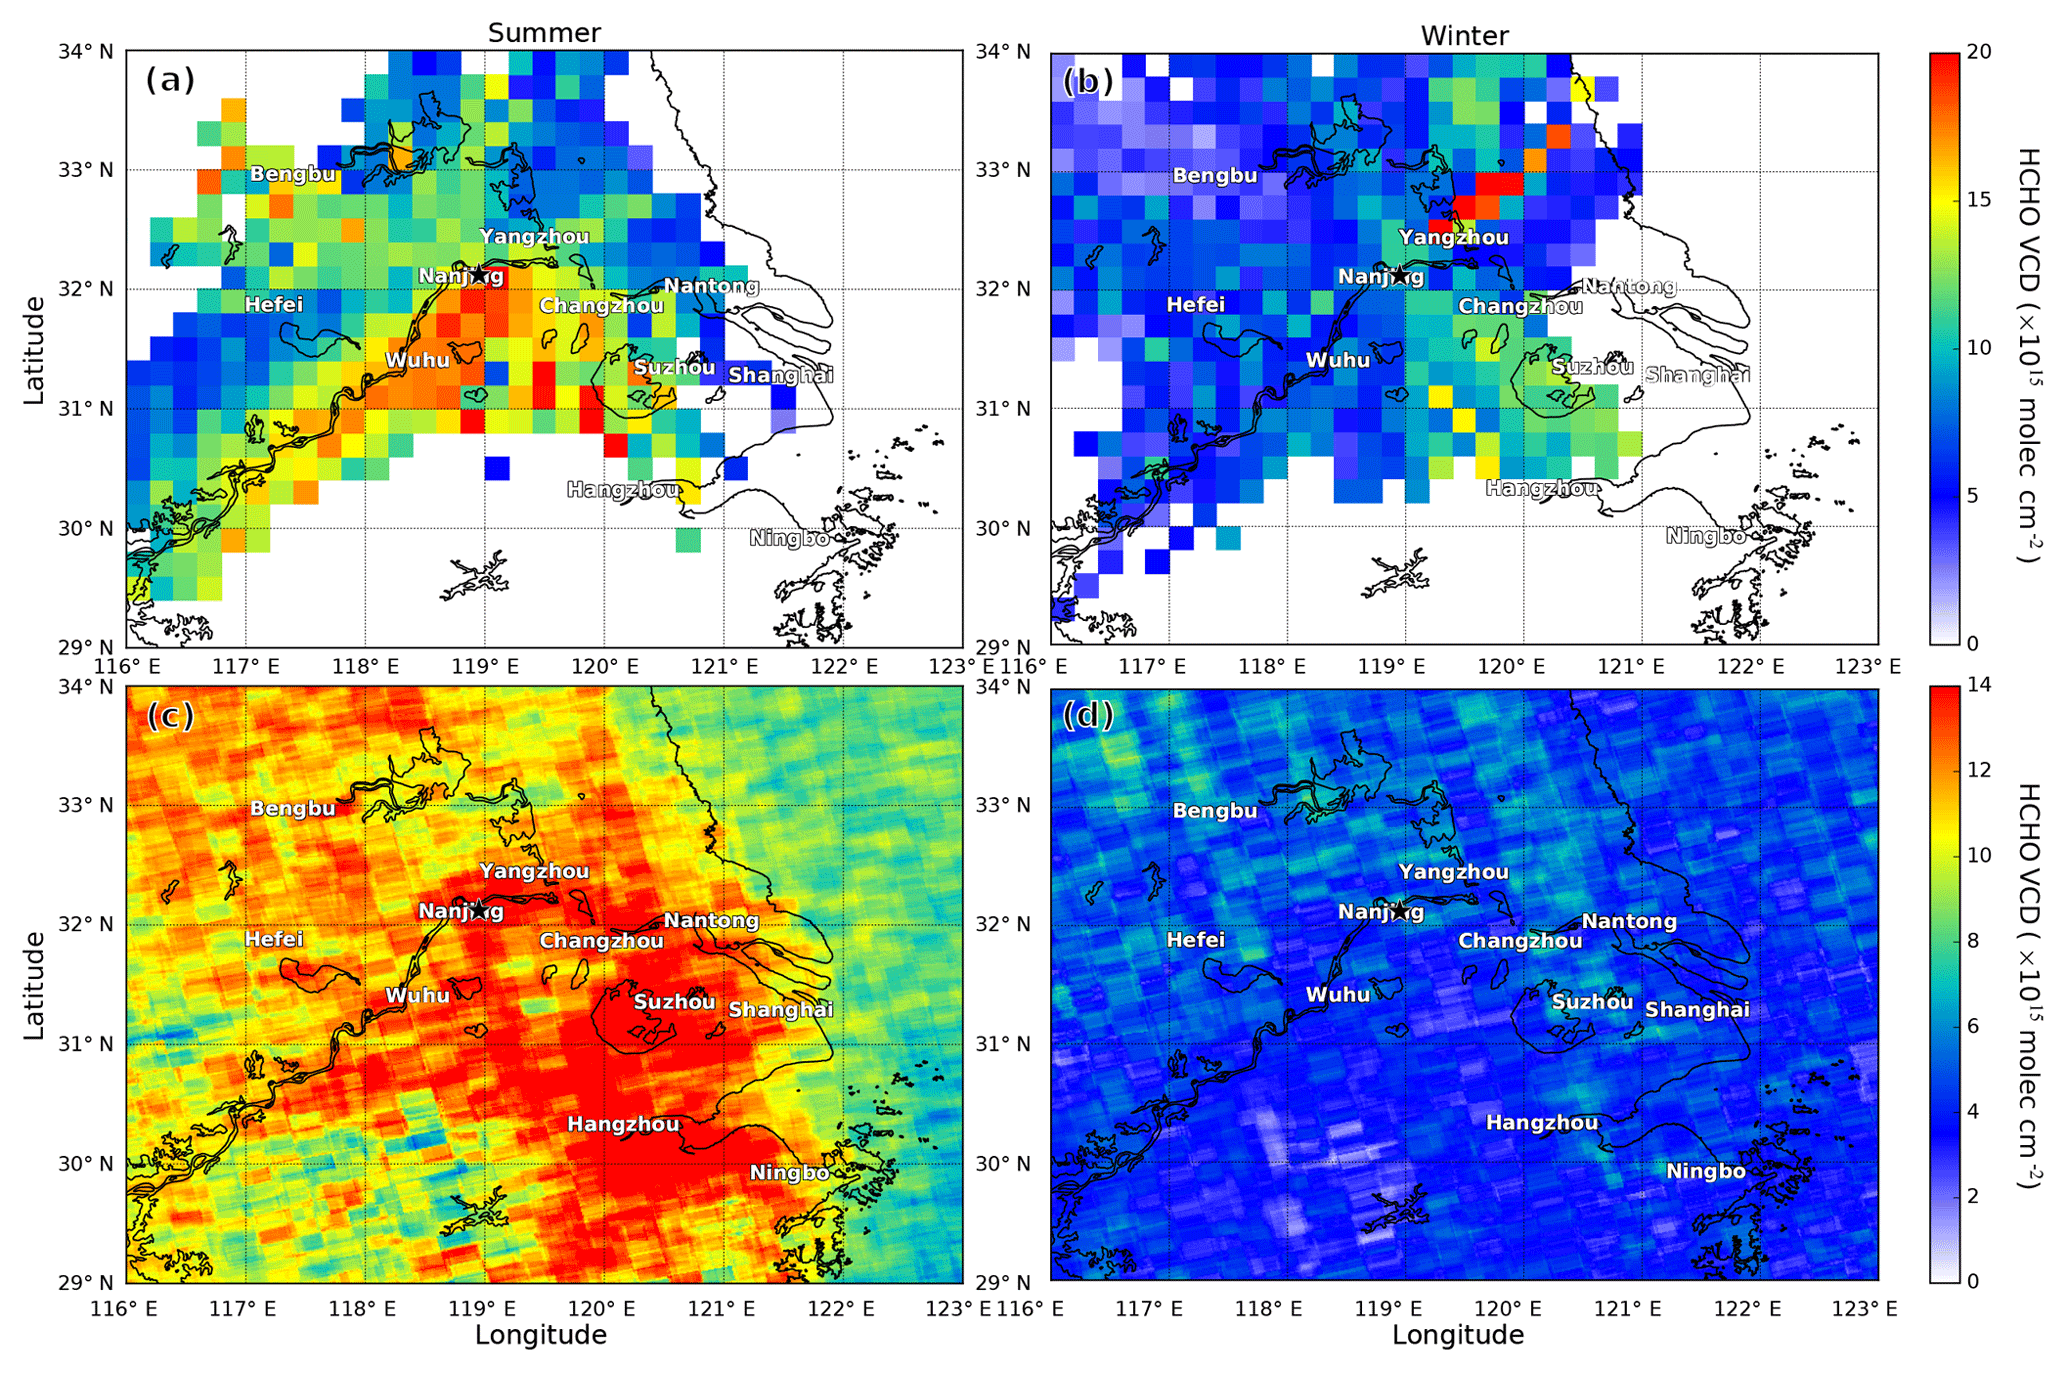
Figure 9The upper panels show spatial distribution of HCHO in (a) summer and (b) winter reconstructed from the MAX-DOAS measurements using backward trajectories calculated by the HYSPLIT model. Backward trajectories are calculated over 6 h for summer measurements and 12 h for winter measurements. The lower panels indicates the average OMI HCHO vertical column densities over the Yangtze River Delta during (c) summer and (d) winter.
3.3 Seasonal variation in aerosol, NO2 and HCHO vertical profiles
The seasonal variations in pollutants are closely related to meteorological conditions as well as the characteristics of different emission sources. Analyzing the seasonal variation patterns of different atmospheric pollutants can provide further information on the emission source characteristic as well as the atmospheric processes. Figure 7 shows the vertical profiles of NO2 and HCHO for all four seasons. Significant seasonal patterns are observed from the NO2 and HCHO data. The NO2 vertical profiles show higher NO2 maximum ratios in autumn and winter and lower in spring and summer. NO2 profiles from all seasons show that the NO2 mixing ratios decrease with increasing altitude. The result indicates most of the measured NO2 is produced close to the surface which agrees with the fact that traffic emission is one of the largest sources of atmospheric NO2 in Nanjing. HCHO measurements show a different seasonal variation pattern with lower values during winter and higher mixing ratios in summer. The seasonal pattern of HCHO indicates the significant contribution from biogenic emissions from vegetation. Although HCHO profiles for all seasons also show decreasing mixing ratio with height, the decreasing rate is in general much lower than that of NO2. A larger fraction of HCHO is located at higher altitudes. This is probably related to the source characteristic of HCHO. A majority of the tropospheric HCHO is secondary produced from the oxidation of VOCs and results in a larger portion of HCHO in the upper altitudes.
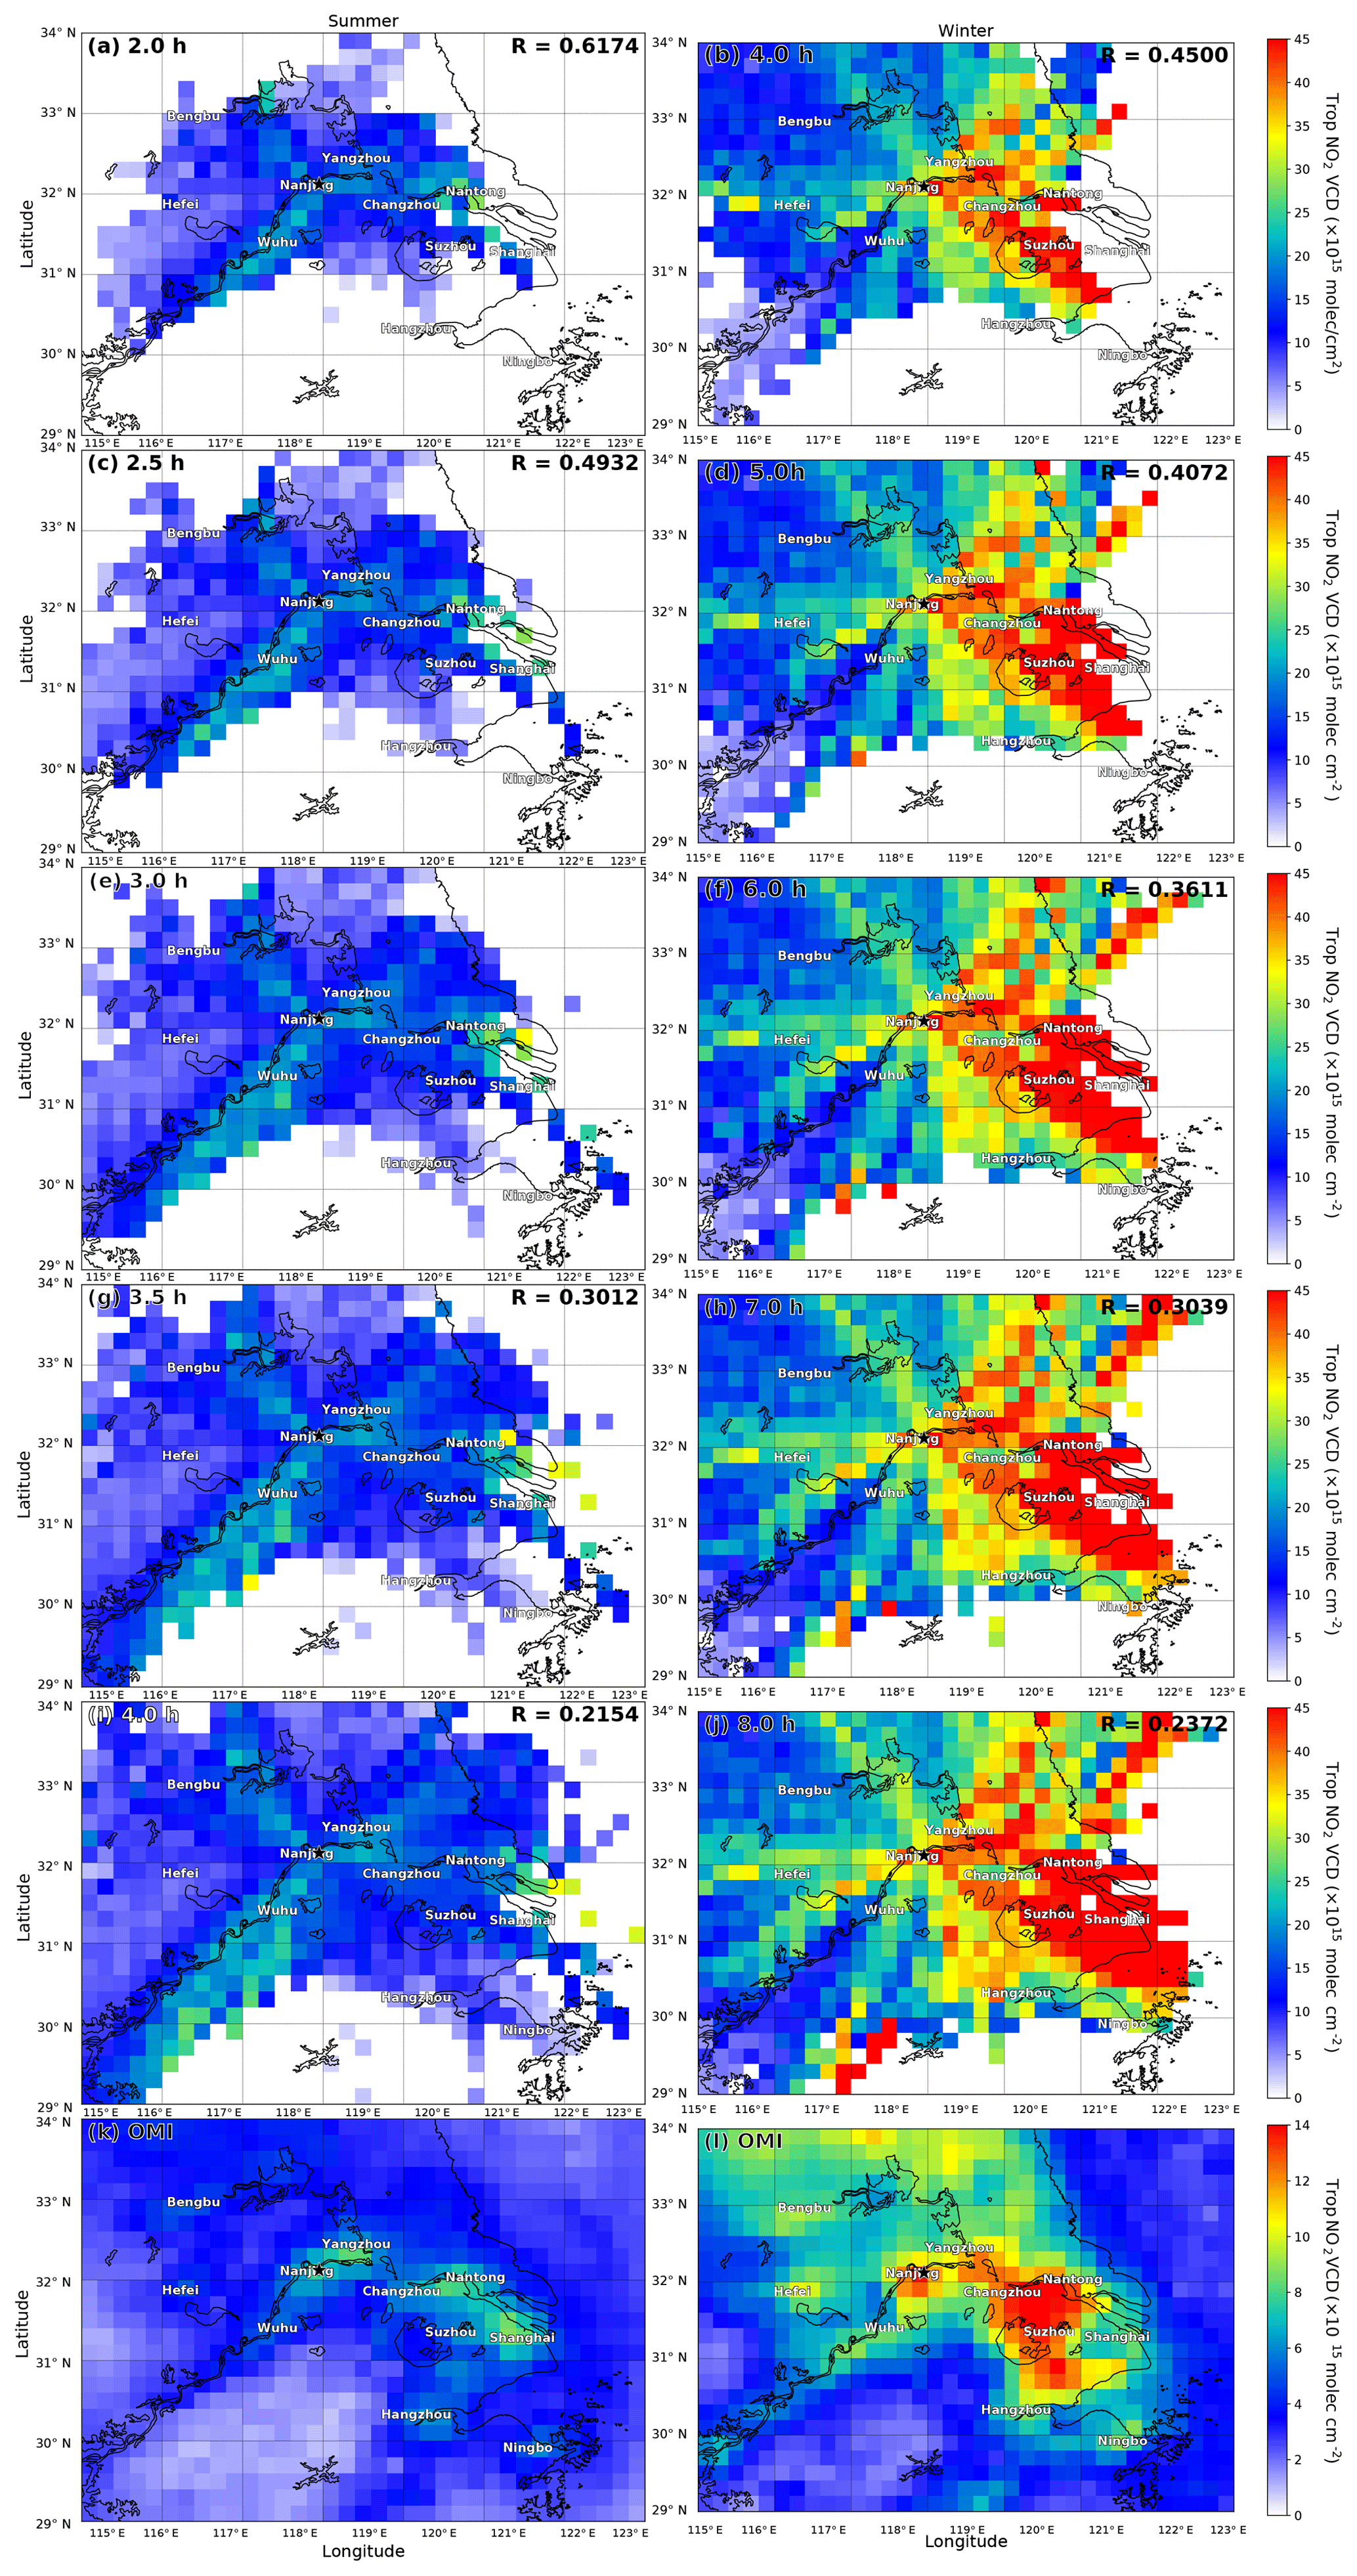
Figure 10Spatial distribution of NO2 in summer (left panels) and winter (right panels) reconstructed from the MAX-DOAS measurements using different assumed lifetime. The average OMI NO2 vertical column densities during summer and winter are shown in (k) and (l), respectively. The corresponding lifetimes used in the calculation and the spatial correlation between the reconstructed maps and OMI observations are indicated each plot.
3.4 Regional pollution transport
Air pollutants released to the atmosphere do not only cause local impacts, but also can influence regions far from the source through regional transport. In order to investigate the influences from regional transportation of air pollutants, we use the backward trajectories calculated by the HYSPLIT model to back-correlate the possible source regions of the MAX-DOAS measured NO2. Similar approaches have also been applied for other source appointment studies (Stohl et al., 2009, 2011; Brunner et al., 2012, 2017; Wang et al., 2019). Backward trajectories are calculated at the center point of each MAX-DOAS retrieval layer below 2 km. The MAX-DOAS measurement of NO2 partial columns are then assigned to the grid points along the backward trajectories. We assume the partial columns represent a 200 m thick layer of the assigned grid point and the vertical distribution of NO2 in the assigned grid point is assumed to be homogeneous from the surface to 2 km above ground. In this study, the backward-propagated NO2 data are binned in a resolution of ∘ grid. As NO2 is a relatively short-life pollutant in the atmosphere, it is less likely to stay in the atmosphere for a long time or be transported far from the sources. Therefore, NO2 measured by the MAX-DOAS is less correlated to pollutant concentrations far from the site, which take longer time to reach the measurement site. In addition, model error accumulates over time. Results with shorter simulation time (or backward time) are considered more reliable. In order to account for this effect, an age weighting factor (wτ) is used in the backward propagation. The age weighting factor is defined by Eq. (1) where τ is the assumed lifetime of NO2 and t represents the time for the air mass to travel to the measurement site. This weighting scheme is useful when multiple trajectories are overlapping each other within a single grid point.
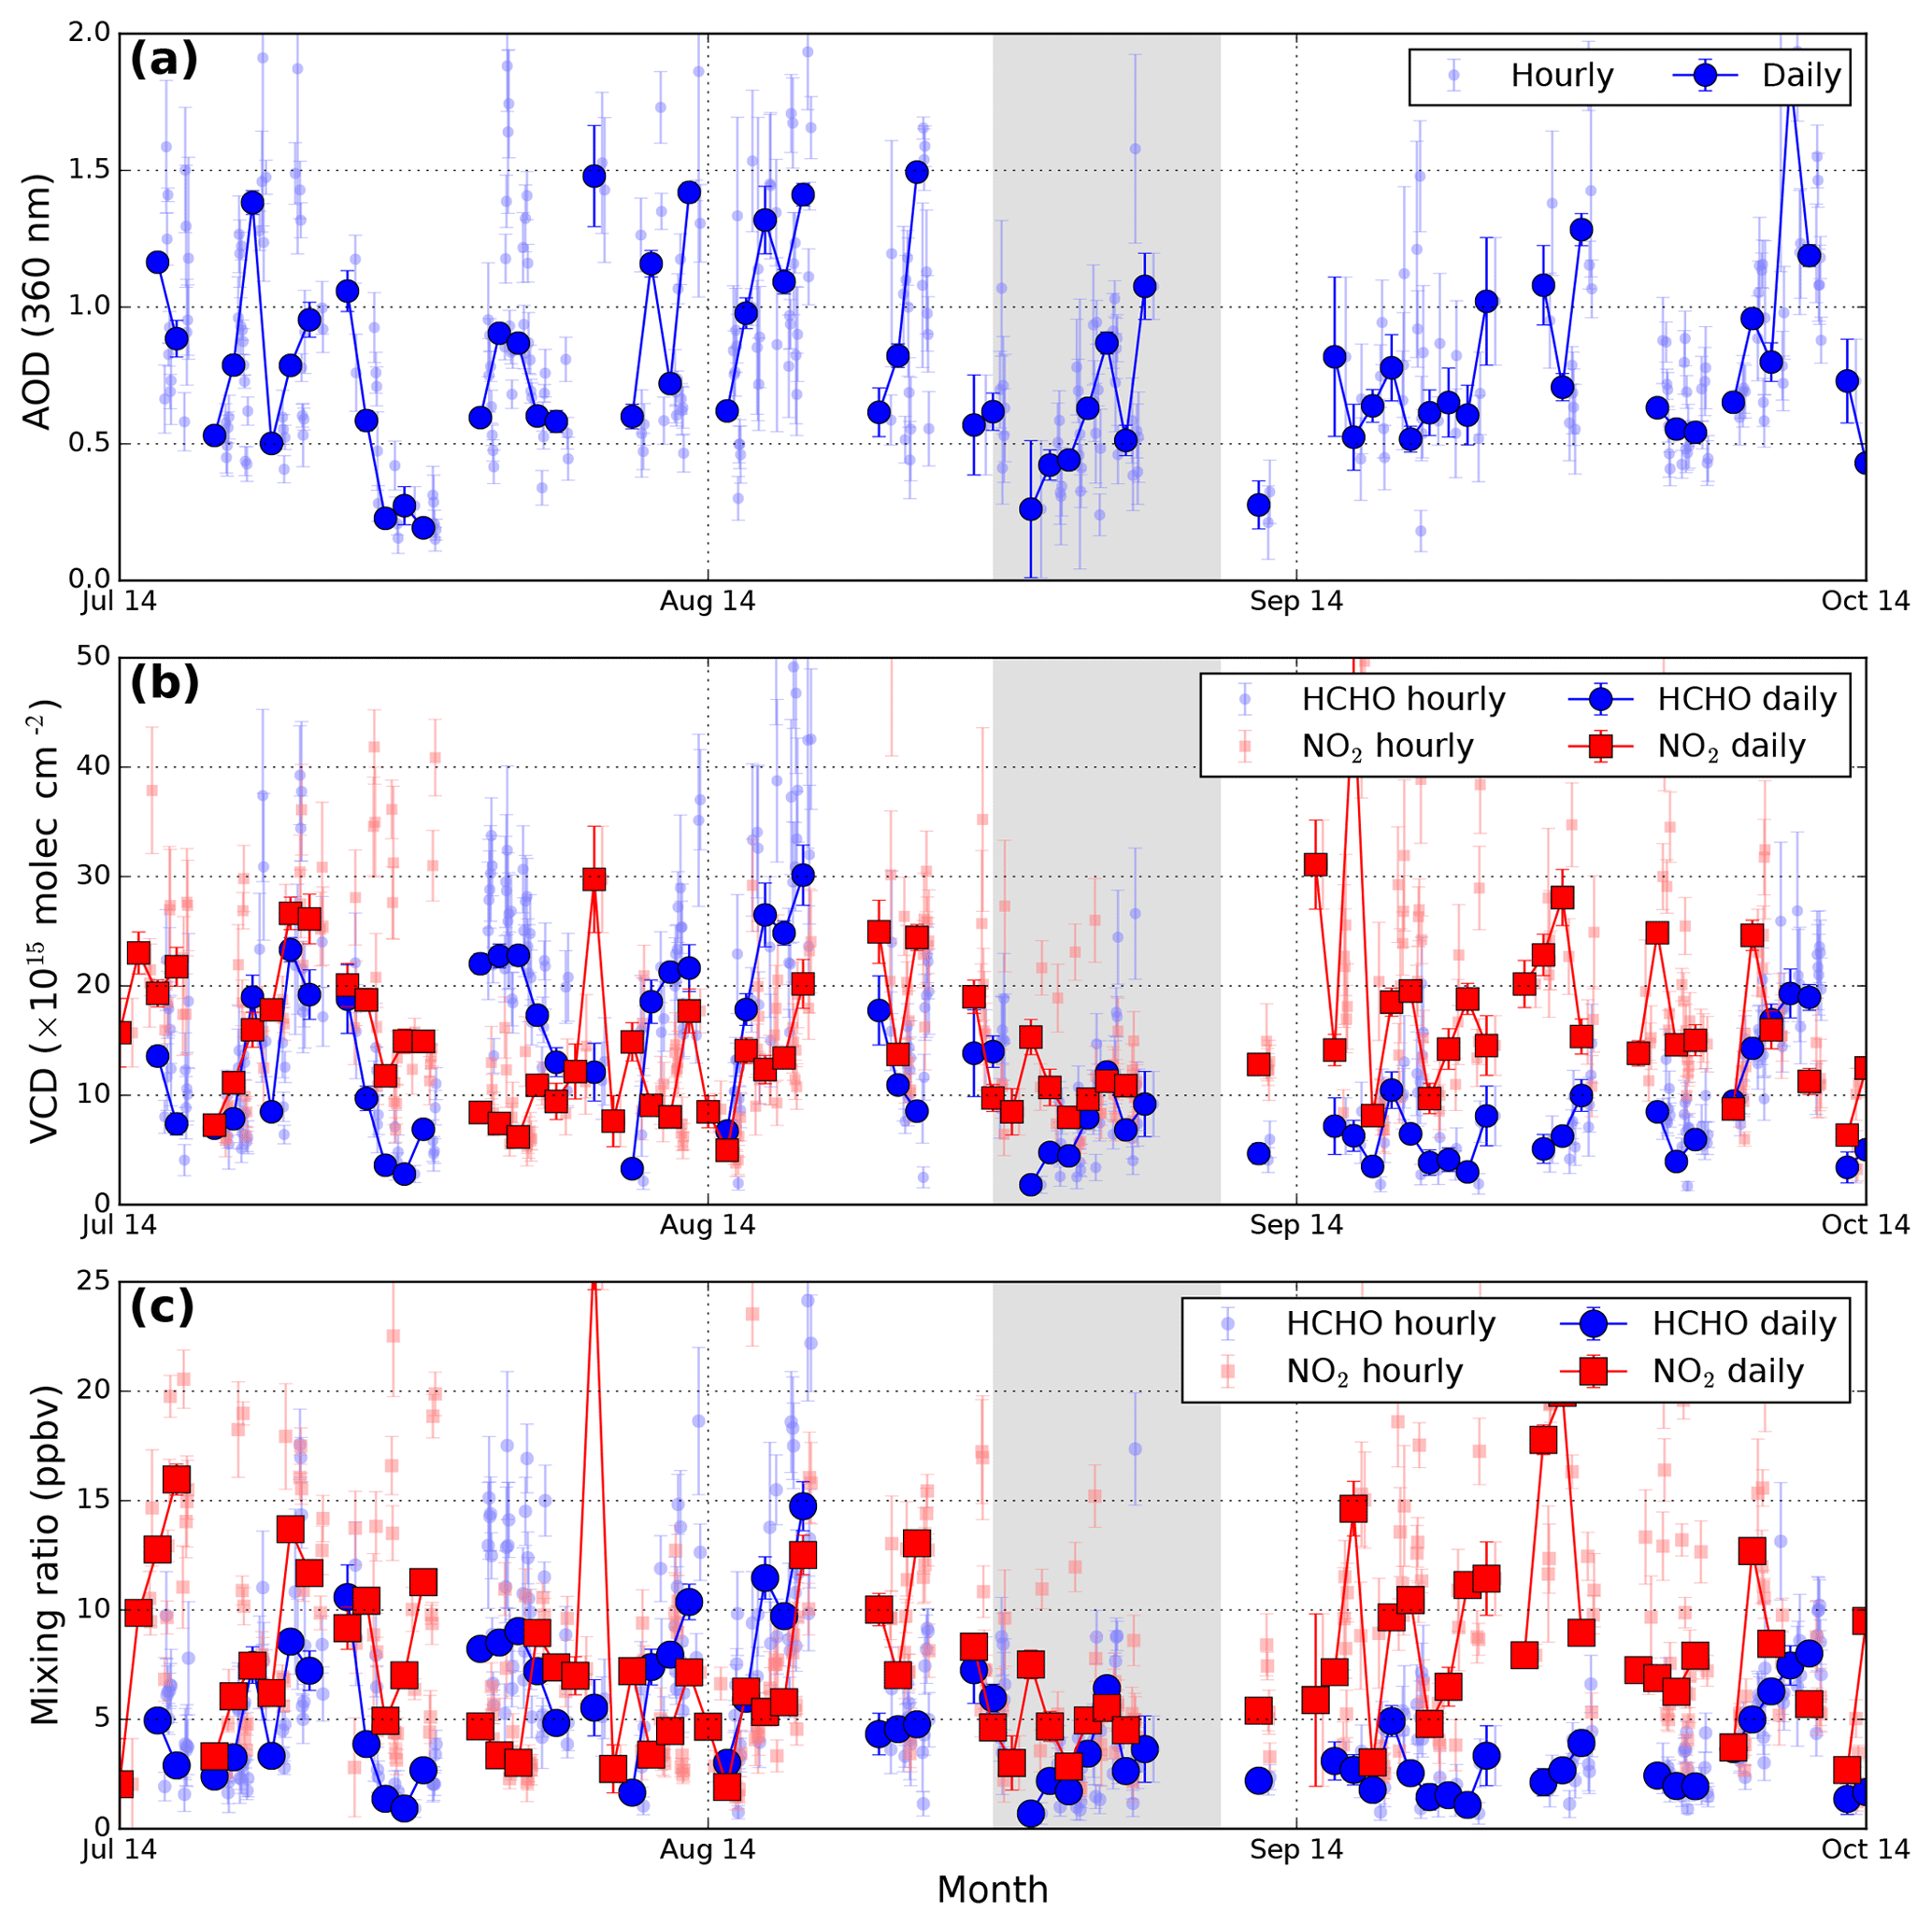
Figure 11Time series of (a) aerosol optical depths, (b) HCHO and NO2 VCDs and (c) HCHO and NO2 surface mixing ratios measured by the MAX-DOAS around the Youth Olympic Games. Hourly and daily averaged values are shown. The gray shadowed area indicates the Youth Olympic Games period (16 to 28 August 2014).
As the lifetime of NO2 has a strong seasonal variability, we separate the measurements into summer (June, July and August) and winter (December, January and February) in our analysis. Figure 10 shows the spatial distribution of NO2 reconstructed from the MAX-DOAS measurements using different assumed lifetime. The corresponding lifetime used in the calculation and the spatial correlation between the reconstructed maps and OMI observations are indicated on the plots. Backward trajectories are calculated over 2 times the assumed lifetime. As the assumed lifetime is only used for the calculation of the age factor, the accuracy of the lifetime does not show a strong impact on the reconstructed spatial pattern. NO2 lifetimes of 3 and 6 h are chosen to reconstruct the spatial distribution of NO2 during summer and winter, respectively. Backward trajectories are calculated over 6 h for summer measurements and 12 h for winter measurements. These values are chosen based on the consideration of attaining a balance between having better spatial coverage and the reliability of the reconstructed pollution maps. Note that the simulation time (or backward time) is changing along the trajectory, and the weighting of each point along the trajectory is depending on its simulation time according to Eq. (1). Points along the trajectory with shorter simulation time are weighted higher in the calculation. NO2 fields reconstructed from the MAX-DOAS measurements in summer and winter using backward trajectories calculated by the HYSPLIT model are shown in Fig. 8a and b. Figure 8c and d shows the averaged OMI satellite observations of NO2 during summer (June, July and August) and winter (December, January and February) from June 2013 to February 2017. The OMI measurements show that Nanjing has a serious NO2 pollution problem in winter.
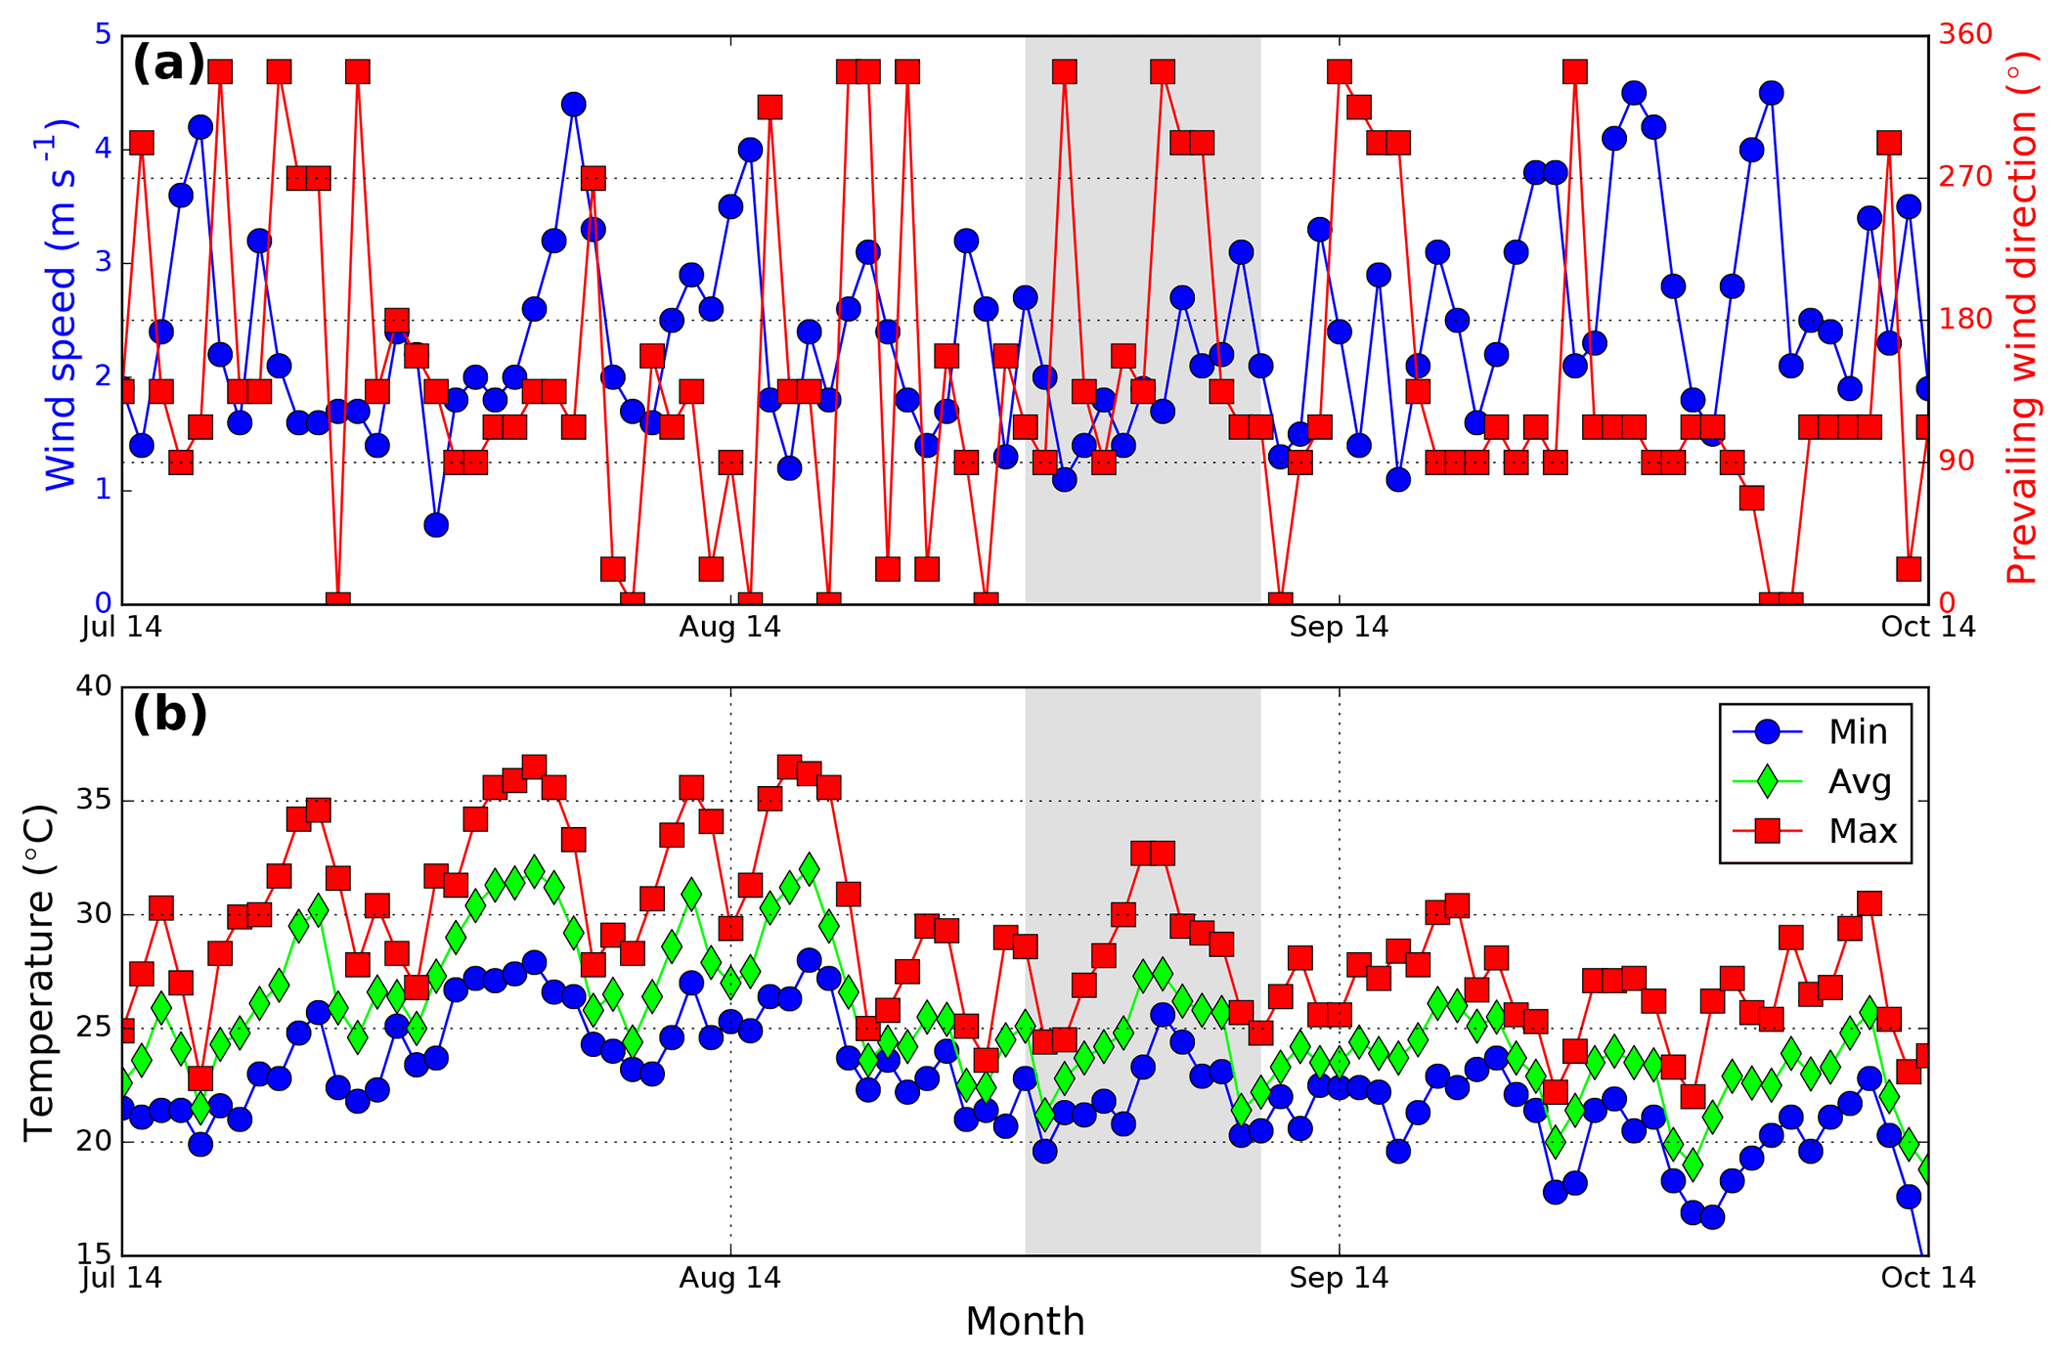
Figure 12(a) Time series of wind speed (blue curve) and wind direction (red curve). (b) Time series of daily minimum (blue curve), daily average (green curve) and daily maximum temperatures. The gray shadowed area indicates the Youth Olympic Games period (16 to 28 August 2014).
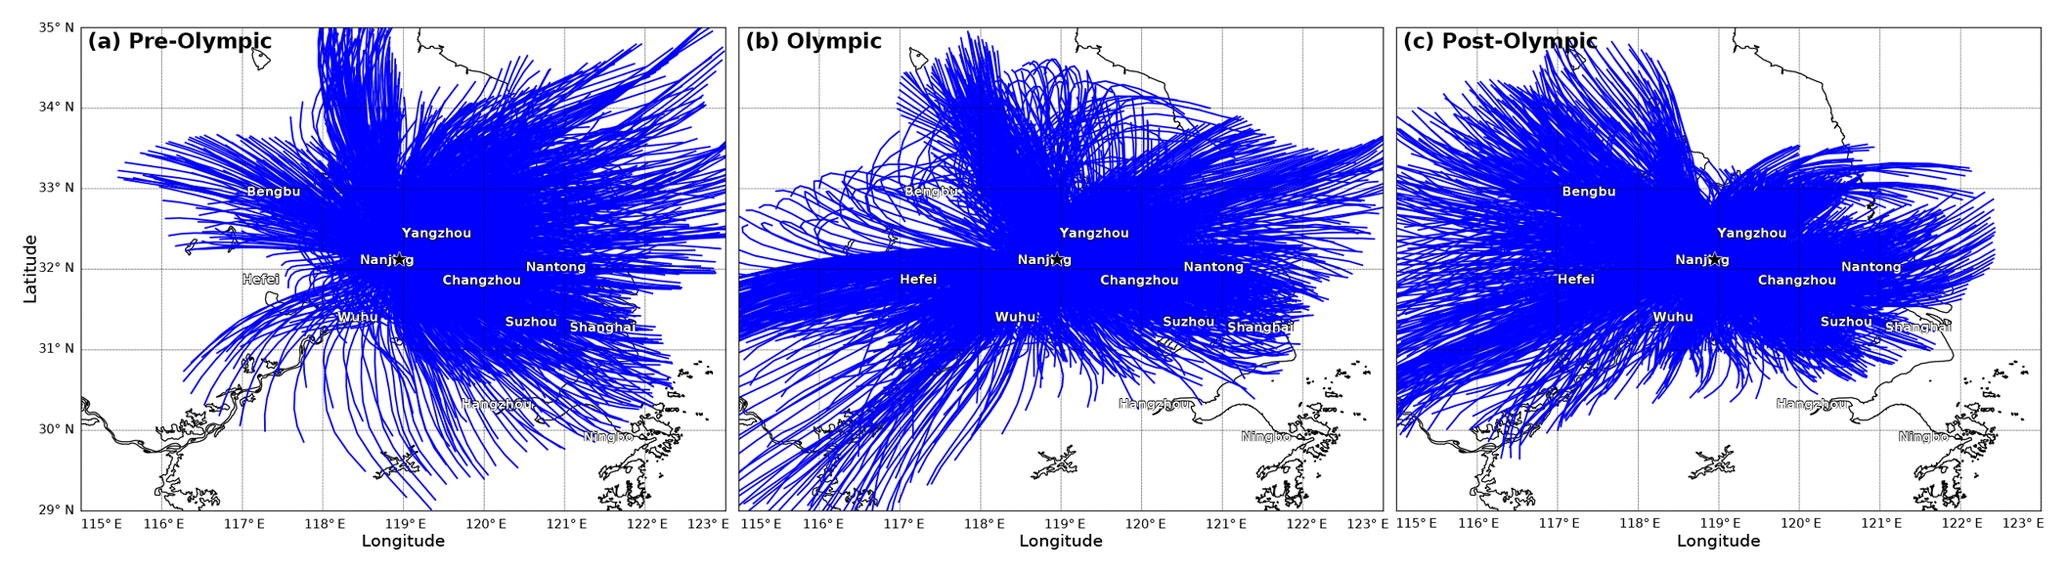
Figure 13Backward trajectories calculated for (a) pre-Olympic, (b) Olympic and (c) post-Olympic periods. Backward trajectories are calculated over 12 h.
The reconstructed NO2 fields show a good spatial agreement with OMI satellite observations retrieved by NASA. However, the reconstructed NO2 fields are on average 3 times higher than the OMI observations. Large discrepancies of the absolute values between the reconstructed data and OMI observations are expected, as the differences are also observed in the direct comparison of VCDs measured by the MAX-DOAS and OMI as presented in Sect. 3.2. Elevated NO2 levels are observed during winter when air mass coming from the east, e.g., Shanghai, Suzhou and Nantong, where OMI observations also show high NO2 levels. The summertime NO2 levels are in general lower. However, elevated values can still be observed along the Yangtze River and over some cities, e.g., Nantong and Wuhu.
We have also applied the same approach to the MAX-DOAS HCHO measurements with HCHO lifetime of 1 and 2 h for summer and winter measurements, respectively. Due to the considerable contribution of secondary formation of HCHO from its precursors and short atmospheric lifetime of HCHO, relatively short lifetimes are chosen to reconstruct the spatial distribution of HCHO. The reconstructed maps would be more related to the spatial distribution of precursors of HCHO instead of HCHO itself if a longer lifetime is applied in the analysis. HCHO fields reconstructed from the MAX-DOAS measurements are shown in Fig. 9a and b. OMI observations of HCHO are also shown in Fig. 9c and d for reference. Summertime HCHO data are in general higher than the observations during winter. However, the spatial distribution of the back-propagated HCHO data does not show a strong correlation with the OMI satellite observations as the NO2 data. This is probably due to that fact that HCHO is mostly secondarily produced in the atmosphere. In addition, the atmospheric lifetime of HCHO is much shorter compared to NO2 and therefore more dependent on the local productions. The result suggests that the MAX-DOAS measurements are sensitive to the regional transport of air pollutants. Despite the strong local contributions, the air quality of Nanjing can also be significantly influenced by the air pollution transportation, especially during winter.
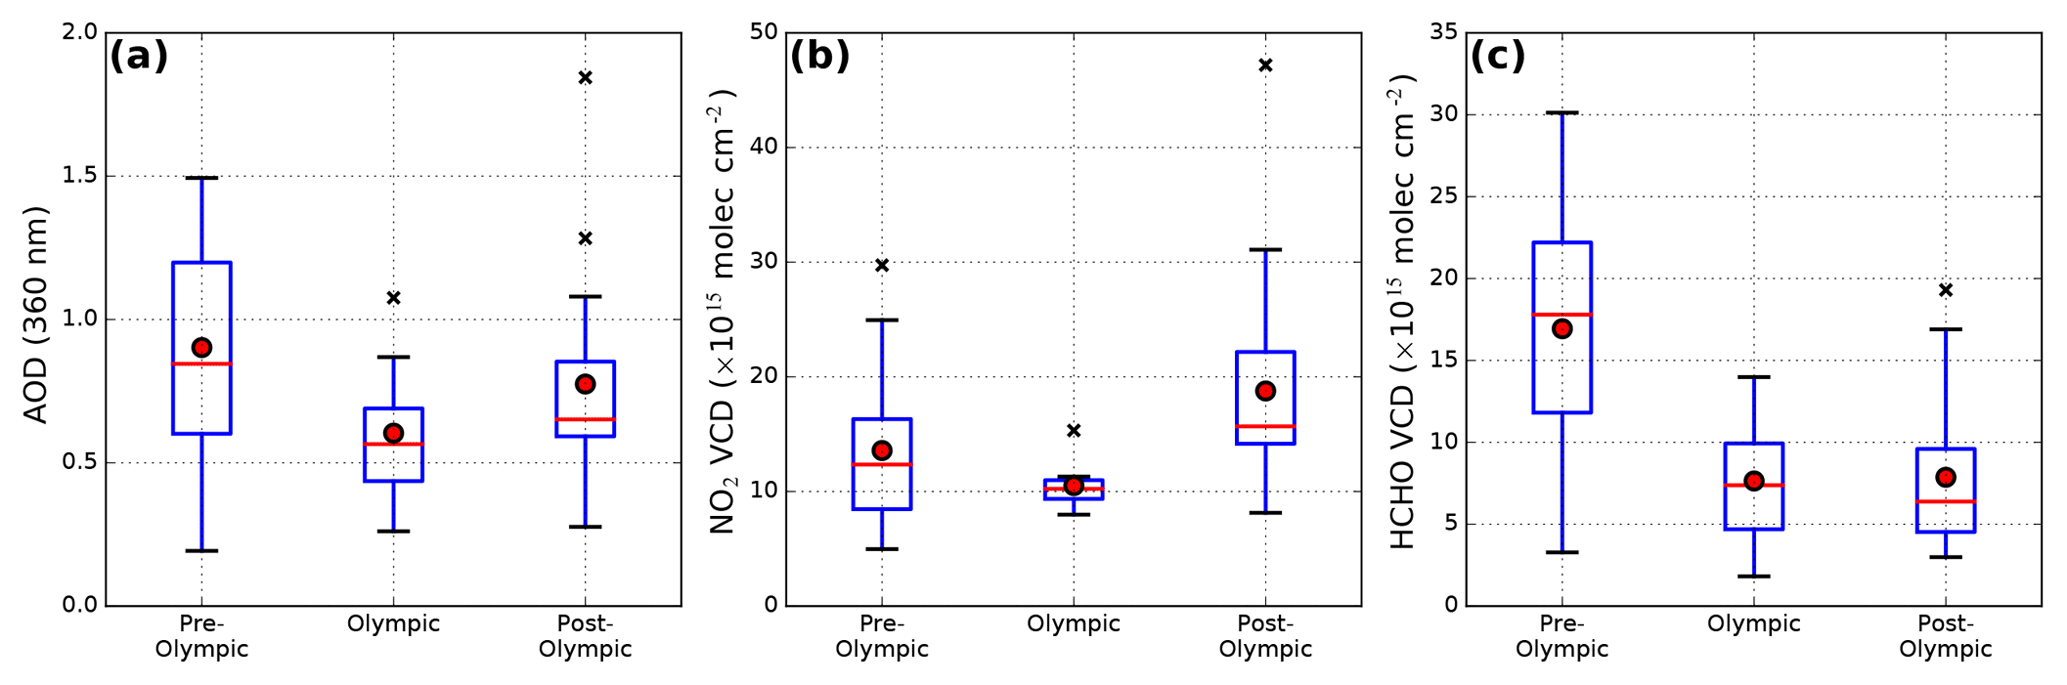
Figure 14Boxplots of (a) aerosol optical depths, (b) NO2 and (c) HCHO VCDs before, during and after the Youth Olympic Games.
3.5 Assessments of emission reduction during the Youth Olympic Games
The summer Youth Olympic Games event was held from 16 to 28 August 2014 in Nanjing, China. During the event, the government implemented a series of air pollution control measures. Heavy emission vehicles were strictly prohibited. Local heavy industries, e.g., petrochemical and steel industries, were required to limit their production during the Youth Olympic Games. These air pollution control measures were often implemented when such international events were held in China (Wu et al., 2013; Wang et al., 2014; Chan et al., 2015; Liu et al., 2016; Sun et al., 2016). In order to study the influences of the emission control measures implemented during the Youth Olympic Games on the local air quality, we compare the MAX-DOAS observations of aerosol, NO2 and HCHO taken before, during and after the Youth Olympic Games. We define the pre-Olympic period from a month before the Youth Olympic Games (16 July 2014) to 1 d before the Youth Olympic Games (15 August 2014). During the pre-Olympic period, the government gradually started to implement some of the emission control measures. During the Youth Olympic Games all those air pollution control measures were strictly implemented. The post-Olympic period is defined from 29 August to 28 September 2014 where the emission control was gradually relaxed back to normal.
Time series of aerosol optical depths, HCHO and NO2 VCDs and surface mixing ratios measured by the MAX-DOAS around the Youth Olympic Games are shown in Fig. . The gray shadowed area indicates the Youth Olympic Games period (16 to 28 August 2014). Meteorological parameters such as temperature, wind speed and wind direction, measured by a weather station in Nanjing during the same period, are shown in Fig. 11. Backward trajectories over the three periods are shown in Fig. 12. The backward trajectories show that there are slightly less air masses coming from the southwest direction during the pre-Olympic period, while the Olympic and post-Olympic periods show very similar air mass transportation conditions. The AODs, HCHO and NO2 measurements show a strong temporal variability. In order to investigate the effect of the Youth Olympic Games, we analyzed the statistics of AODs, HCHO and NO2 VCDs for the pre-Olympic, Olympic and post-Olympic periods. Boxplots of the AODs, HCHO and NO2 VCDs for the three periods are shown in Fig. 13. The results show that AOD, NO2 and HCHO VCDs are the lowest during the Olympic period among those three periods. The MAX-DOAS measurements of AOD reduced from 0.9 during the pre-Olympic period to 0.6 for the Olympic period and bounced back to about 0.8 after the Youth Olympic Games. A reduction of NO2 columns can also be observed during the Youth Olympic Games. Averaged NO2 VCDs are 14, 11 and 19 × 1015 molec cm−2 for periods before, during and after the Youth Olympic Games, respectively. A similar reduction pattern is also observed from the NO2 surface mixing ratios. Averaged NO2 surface mixing ratios are 7.5, 4.7 and 9.0 ppbv for periods before, during and after the Youth Olympic Games, respectively. The HCHO columns measured during the Youth Olympic Games also decreased by more than ∼50 % from 17 × 1015 molec cm−2 before the Olympic down to 8 × 10¹⁵ molec cm−2 during the Youth Olympic Games. Surface HCHO mixing ratios also show similar reduction. The surface HCHO mixing ratios measured also reduced from 7.0 ppbv before the Youth Olympic to 3.3 ppbv during the Youth Olympic. The emission and secondary formation of HCHO are closely related to the ambient temperature. Higher ambient temperature is usually associated with higher formation rate and natural emission of HCHO and its precursors. The meteorological data indicate that the ambient temperature is decreasing with time when the season changes from summer to autumn. The HCHO concentrations measured during the Youth Olympic Games are expected to be higher than those measured in the post-Olympic period if anthropogenic emissions are unchanged. However, the measurement shows that the HCHO concentration is slightly lower during the Youth Olympic compared to the post-Olympic period. The result implies that the emissions of HCHO (and its precursors) are reduced during the Youth Olympic Games. As the other meteorological conditions are very similar during the three periods, the decrease in pollutant concentrations are mainly attributed to the reduction of emissions during the Youth Olympic Games.
In this paper, we present long-term observations of atmospheric NO2 and HCHO in Nanjing using a MAX-DOAS instrument. Ground-based MAX-DOAS measurements were performed from April 2013 to February 2017. Differential slant columns of O4, NO2 and HCHO were retrieved by applying the differential optical absorption technique to the scattered sunlight spectra for the UV band. The results served as inputs for the retrieval of aerosol extinction, NO2 and HCHO profiles in the lower troposphere.
Aerosol results derived from the MAX-DOAS observations are validated by comparing the AODs to sun photometer observations. The MAX-DOAS and sun photometer measurements show a good agreement with each other with Pearson correlation coefficient (R) of 0.73. Considering the differences in measurement technique and measurement location, we concluded that the MAX-DOAS aerosol measurements are reliable for the NO2 and HCHO profile retrievals.
Tropospheric vertical column densities (VCDs) of NO2 derived from MAX-DOAS measurements are used to validate OMI observations. The comparison shows that the OMI observations correlate well with the MAX-DOAS data with Pearson correlation coefficient (R) of 0.91. However, OMI observations are on average 60 % lower than the MAX-DOAS measurements. Using the MAX-DOAS NO2 profile as a priori information in the OMI retrieval on average increased the OMI NO2 VCDs by ∼30 % with correlation nearly unchanged. However, the improved OMI NO2 VCDs are still about 50 % lower than the MAX-DOAS observations. The KNMI OMI NO2 product shows a better agreement with the MAX-DOAS observations with an underestimation of ∼30 %. A large difference between the two OMI product is related to the different spectral analysis techniques, stratospheric tropospheric separation algorithms and a priori profiles used in the retrievals. Another source of discrepancy between MAX-DOAS and OMI observations includes the difference in spatial coverage between the two measurements. We also compared the OMI observation of HCHO VCDs to our MAX-DOAS data. The result shows a good agreement between the two datasets with R of 0.75 and the slope of the regression line is 0.99.
The MAX-DOAS measurement of NO2 and HCHO profiles are analyzed together with the backward trajectory simulations to assess the regional transportation and possible source regions of the MAX-DOAS measured NO2 and HCHO. The age-weighted backward-propagation approach is used to reconstruct the spatial distribution of NO2 and HCHO over the Yangtze River Delta during summer and winter. The reconstructed NO2 fields show a distinct agreement with OMI satellite observations. The result shows the MAX-DOAS measurements are sensitive to the air pollution transportation in the Yangtze River Delta. However, due to the short atmospheric lifetime of HCHO, the backward-propagated HCHO data do not show a strong spatial correlation with the OMI HCHO observations. Our result suggests that the air quality of Nanjing is significantly influenced by air pollution transportation, especially during winter.
We have also used the MAX-DOAS observations of aerosol, NO2 and HCHO for the investigation of the effectiveness of air pollution control measures implemented during the Youth Olympic Games 2014. Our results show a significant reduction (30 %–50 %) of ambient aerosol, NO2 and HCHO compared to measurements before and after the Youth Olympic Games. The results indicate the effects of the reduction of emissions during the Youth Olympic Games. Our findings provide a better understanding of the transportation and sources of pollutants in the Yangtze River Delta as well as the effects of emission control measures during large international events, which are important for the future design of air pollution control policies.
The MAX-DOAS data are available upon request from the corresponding author (ka.chan@dlr.de).
KLC, AD, KPH and NH designed the experiment. KLC, ZW, AD, YS and NH carried out the experiment. JW, FZ and YS provided auxiliary data. MW provided useful comments for the discussion. KLC analyzed the measurement data and prepared the article with contributions from all co-authors.
The authors declare that they have no conflict of interest.
This article is part of the special issue “Regional transport and transformation of air pollution in eastern China”. It is not associated with a conference.
The authors would also like to thank the National Oceanic and Atmospheric Administration (NOAA) Air Resources Laboratory (ARL) for the provision of the HYSPLIT transport and dispersion model used in this publication. The work described in this paper was partly supported by the ESA-MOST Dragon 3 Cooperation Programme under the framework of the East Asian monsoon and air quality project (project ID: 10455).
This research has been supported by the ESA-MOST Dragon 3 Cooperation Programme (East Asian monsoon and air quality (project ID: 10455)).
The article processing charges for this open-access
publication were covered by a Research
Centre of the Helmholtz Association.
This paper was edited by Yugo Kanaya and reviewed by two anonymous referees.
Aliwell, S. R., Roozendael, M. V., Johnston, P. V., Richter, A., Wagner, T., Arlander, D. W., Burrows, J. P., Fish, D. J., Jones, R. L., Tørnkvist, K. K., Lambert, J.-C., Pfeilsticker, K., and Pundt, I.: Analysis for BrO in zenith-sky spectra: An intercomparison exercise for analysis improvement, J. Geophys. Res.-Atmos., 107, ACH 10-1–ACH 10-20, https://doi.org/10.1029/2001JD000329, 2002. a, b
Anderson, G. P., Clough, S. A., Kneizys, F., Chetwynd, J. H., and Shettle, E. P.: AFGL atmospheric constituent profiles (0.120 km), Tech. rep., AIR FORCE GEOPHYSICS LAB HANSCOM AFB MA, 1986. a
Ångström, A.: On the Atmospheric Transmission of Sun Radiation and on Dust in the Air, Geogr. Ann., 11, 156–166, https://doi.org/10.1080/20014422.1929.11880498, 1929. a
Beirle, S., Platt, U., Wenig, M., and Wagner, T.: Weekly cycle of NO2 by GOME measurements: a signature of anthropogenic sources, Atmos. Chem. Phys., 3, 2225–2232, https://doi.org/10.5194/acp-3-2225-2003, 2003. a
Beirle, S., Platt, U., Wenig, M., and Wagner, T.: NOx production by lightning estimated with GOME, Adv. Space Res., 34, 793–797, https://doi.org/10.1016/j.asr.2003.07.069, 2004. a
Boersma, K. F., Eskes, H. J., Dirksen, R. J., van der A, R. J., Veefkind, J. P., Stammes, P., Huijnen, V., Kleipool, Q. L., Sneep, M., Claas, J., Leitão, J., Richter, A., Zhou, Y., and Brunner, D.: An improved tropospheric NO2 column retrieval algorithm for the Ozone Monitoring Instrument, Atmos. Meas. Tech., 4, 1905–1928, https://doi.org/10.5194/amt-4-1905-2011, 2011. a
Bond, D. W., Zhang, R., Tie, X., Brasseur, G., Huffines, G., Orville, R. E., and Boccippio, D. J.: NOx production by lightning over the continental United States, J. Geophys. Res.-Atmos., 106, 27701–27710, https://doi.org/10.1029/2000JD000191, 2001. a
Bovensmann, H., Burrows, J., Buchwitz, M., Frerick, J., Noël, S., Rozanov, V., Chance, K., and Goede, A.: SCIAMACHY: Mission objectives and measurement modes, J. Atmos. Sci., 56, 127–150, 1999. a
Brunner, D., Henne, S., Keller, C. A., Reimann, S., Vollmer, M. K., O'Doherty, S., and Maione, M.: An extended Kalman-filter for regional scale inverse emission estimation, Atmos. Chem. Phys., 12, 3455–3478, https://doi.org/10.5194/acp-12-3455-2012, 2012. a
Brunner, D., Arnold, T., Henne, S., Manning, A., Thompson, R. L., Maione, M., O'Doherty, S., and Reimann, S.: Comparison of four inverse modelling systems applied to the estimation of HFC-125, HFC-134a, and SF6 emissions over Europe, Atmos. Chem. Phys., 17, 10651–10674, https://doi.org/10.5194/acp-17-10651-2017, 2017. a
Bucsela, E. J., Krotkov, N. A., Celarier, E. A., Lamsal, L. N., Swartz, W. H., Bhartia, P. K., Boersma, K. F., Veefkind, J. P., Gleason, J. F., and Pickering, K. E.: A new stratospheric and tropospheric NO2 retrieval algorithm for nadir-viewing satellite instruments: applications to OMI, Atmos. Meas. Tech., 6, 2607–2626, https://doi.org/10.5194/amt-6-2607-2013, 2013. a
Burrows, J. P., Weber, M., Buchwitz, M., Rozanov, V., Ladstätter-Weißenmayer, A., Richter, A., DeBeek, R., Hoogen, R., Bramstedt, K., Eichmann, K.-U., Eisingera, M., and Pernerb, D.: The global ozone monitoring experiment (GOME): Mission concept and first scientific results, J. Atmos. Sci., 56, 151–175, 1999. a
Callies, J., Corpaccioli, E., Eisinger, M., Hahne, A., and Lefebvre, A.: GOME-2-Metop's second-generation sensor for operational ozone monitoring, ESA bulletin, 102, 28–36, 2000. a
Chan, K. L., Pöhler, D., Kuhlmann, G., Hartl, A., Platt, U., and Wenig, M. O.: NO2 measurements in Hong Kong using LED based long path differential optical absorption spectroscopy, Atmos. Meas. Tech., 5, 901–912, https://doi.org/10.5194/amt-5-901-2012, 2012. a
Chan, K. L., Hartl, A., Lam, Y. F., Xie, P. H., Liu, W. Q., Cheung, H. M., Lampel, J., Pöhler, D., Li, A., Xu, J., Zhou, H. J., Ning, Z., and Wenig, M.: Observations of tropospheric NO2 using ground based MAX-DOAS and OMI measurements during the Shanghai World Expo 2010, Atmos. Environ., 119, 45–58, https://doi.org/10.1016/j.atmosenv.2015.08.041, 2015. a, b, c, d, e, f, g, h, i
Chan, K. L., Wiegner, M., Wenig, M., and Pöhler, D.: Observations of tropospheric aerosols and NO2 in Hong Kong over 5 years using ground based MAX-DOAS, Sci. Total Environ., 619–620, 1545–1556, https://doi.org/10.1016/j.scitotenv.2017.10.153, 2018. a, b, c, d, e, f
Clémer, K., Van Roozendael, M., Fayt, C., Hendrick, F., Hermans, C., Pinardi, G., Spurr, R., Wang, P., and De Mazière, M.: Multiple wavelength retrieval of tropospheric aerosol optical properties from MAXDOAS measurements in Beijing, Atmos. Meas. Tech., 3, 863–878, https://doi.org/10.5194/amt-3-863-2010, 2010. a, b
Cleveland, W. S.: LOWESS: A Program for Smoothing Scatterplots by Robust Locally Weighted Regression, Am. Stat., 35, 54–54, https://doi.org/10.2307/2683591, 1981. a
Crutzen, P. J.: The influence of nitrogen oxides on the atmospheric ozone content, Q. J. Roy. Meteor. Soc., 96, 320–325, https://doi.org/10.1002/qj.49709640815, 1970. a
De Smedt, I., Theys, N., Yu, H., Danckaert, T., Lerot, C., Compernolle, S., Van Roozendael, M., Richter, A., Hilboll, A., Peters, E., Pedergnana, M., Loyola, D., Beirle, S., Wagner, T., Eskes, H., van Geffen, J., Boersma, K. F., and Veefkind, P.: Algorithm theoretical baseline for formaldehyde retrievals from S5P TROPOMI and from the QA4ECV project, Atmos. Meas. Tech., 11, 2395–2426, https://doi.org/10.5194/amt-11-2395-2018, 2018. a, b
Emde, C., Buras-Schnell, R., Kylling, A., Mayer, B., Gasteiger, J., Hamann, U., Kylling, J., Richter, B., Pause, C., Dowling, T., and Bugliaro, L.: The libRadtran software package for radiative transfer calculations (version 2.0.1), Geosci. Model Dev., 9, 1647–1672, https://doi.org/10.5194/gmd-9-1647-2016, 2016. a, b
Fleischmann, O. C., Burrows, J. P., and Orphal, J.: Time-windowing Fourier transform absorption spectroscopy for flash photolysis investigations, J. Photoch. Photobio. A, 157, 127–136, https://doi.org/10.1016/S1010-6030(03)00069-8, atmospheric Photochemistry, 2003. a
Fried, A., Cantrell, C., Olson, J., Crawford, J. H., Weibring, P., Walega, J., Richter, D., Junkermann, W., Volkamer, R., Sinreich, R., Heikes, B. G., O'Sullivan, D., Blake, D. R., Blake, N., Meinardi, S., Apel, E., Weinheimer, A., Knapp, D., Perring, A., Cohen, R. C., Fuelberg, H., Shetter, R. E., Hall, S. R., Ullmann, K., Brune, W. H., Mao, J., Ren, X., Huey, L. G., Singh, H. B., Hair, J. W., Riemer, D., Diskin, G., and Sachse, G.: Detailed comparisons of airborne formaldehyde measurements with box models during the 2006 INTEX-B and MILAGRO campaigns: potential evidence for significant impacts of unmeasured and multi-generation volatile organic carbon compounds, Atmos. Chem. Phys., 11, 11867–11894, https://doi.org/10.5194/acp-11-11867-2011, 2011. a
Frieß, U., Monks, P. S., Remedios, J. J., Rozanov, A., Sinreich, R., Wagner, T., and Platt, U.: MAX-DOAS O4 measurements: A new technique to derive information on atmospheric aerosols: 2. Modeling studies, J. Geophys. Res.-Atmos., 111, D14203, https://doi.org/10.1029/2005JD006618, 2006. a, b
González Abad, G., Liu, X., Chance, K., Wang, H., Kurosu, T. P., and Suleiman, R.: Updated Smithsonian Astrophysical Observatory Ozone Monitoring Instrument (SAO OMI) formaldehyde retrieval, Atmos. Meas. Tech., 8, 19–32, https://doi.org/10.5194/amt-8-19-2015, 2015. a
Halla, J. D., Wagner, T., Beirle, S., Brook, J. R., Hayden, K. L., O'Brien, J. M., Ng, A., Majonis, D., Wenig, M. O., and McLaren, R.: Determination of tropospheric vertical columns of NO2 and aerosol optical properties in a rural setting using MAX-DOAS, Atmos. Chem. Phys., 11, 12475–12498, https://doi.org/10.5194/acp-11-12475-2011, 2011. a
Hartl, A. and Wenig, M. O.: Regularisation model study for the least-squares retrieval of aerosol extinction time series from UV/VIS MAX-DOAS observations for a ground layer profile parameterisation, Atmos. Meas. Tech., 6, 1959–1980, https://doi.org/10.5194/amt-6-1959-2013, 2013. a
Hönninger, G. and Platt, U.: Observations of BrO and its vertical distribution during surface ozone depletion at Alert, Atmos. Environ., 36, 2481–2489, https://doi.org/10.1016/S1352-2310(02)00104-8, 2002. a
Hönninger, G., von Friedeburg, C., and Platt, U.: Multi axis differential optical absorption spectroscopy (MAX-DOAS), Atmos. Chem. Phys., 4, 231–254, https://doi.org/10.5194/acp-4-231-2004, 2004. a, b
Irie, H., Kanaya, Y., Akimoto, H., Iwabuchi, H., Shimizu, A., and Aoki, K.: First retrieval of tropospheric aerosol profiles using MAX-DOAS and comparison with lidar and sky radiometer measurements, Atmos. Chem. Phys., 8, 341–350, https://doi.org/10.5194/acp-8-341-2008, 2008. a
Jang, M. and Kamens, R. M.: Characterization of Secondary Aerosol from the Photooxidation of Toluene in the Presence of NOx and 1-Propene, Environ. Sci. Technol., 35, 3626–3639, https://doi.org/10.1021/es010676+, 2001. a
Jin, J., Ma, J., Lin, W., Zhao, H., Shaiganfar, R., Beirle, S., and Wagner, T.: MAX-DOAS measurements and satellite validation of tropospheric NO2 and SO2 vertical column densities at a rural site of North China, Atmos. Environ., 133, 12–25, https://doi.org/10.1016/j.atmosenv.2016.03.031, 2016. a
Kreher, K., Van Roozendael, M., Hendrick, F., Apituley, A., Dimitropoulou, E., Frieß, U., Richter, A., Wagner, T., Abuhassan, N., Ang, L., Anguas, M., Bais, A., Benavent, N., Bösch, T., Bognar, K., Borovski, A., Bruchkouski, I., Cede, A., Chan, K. L., Donner, S., Drosoglou, T., Fayt, C., Finkenzeller, H., Garcia-Nieto, D., Gielen, C., Gómez-Martín, L., Hao, N., Herman, J. R., Hermans, C., Hoque, S., Irie, H., Jin, J., Johnston, P., Khayyam Butt, J., Khokhar, F., Koenig, T. K., Kuhn, J., Kumar, V., Lampel, J., Liu, C., Ma, J., Merlaud, A., Mishra, A. K., Müller, M., Navarro-Comas, M., Ostendorf, M., Pazmino, A., Peters, E., Pinardi, G., Pinharanda, M., Piters, A., Platt, U., Postylyakov, O., Prados-Roman, C., Puentedura, O., Querel, R., Saiz-Lopez, A., Schönhardt, A., Schreier, S. F., Seyler, A., Sinha, V., Spinei, E., Strong, K., Tack, F., Tian, X., Tiefengraber, M., Tirpitz, J.-L., van Gent, J., Volkamer, R., Vrekoussis, M., Wang, S., Wang, Z., Wenig, M., Wittrock, F., Xie, P. H., Xu, J., Yela, M., Zhang, C., and Zhao, X.: Intercomparison of NO2, O4, O3 and HCHO slant column measurements by MAX-DOAS and zenith-sky UV-Visible spectrometers during the CINDI-2 campaign, Atmos. Meas. Tech. Discuss., https://doi.org/10.5194/amt-2019-157, in review, 2019. a
Krotkov, N. A., Lamsal, L. N., Celarier, E. A., Swartz, W. H., Marchenko, S. V., Bucsela, E. J., Chan, K. L., Wenig, M., and Zara, M.: The version 3 OMI NO2 standard product, Atmos. Meas. Tech., 10, 3133–3149, https://doi.org/10.5194/amt-10-3133-2017, 2017. a
Levelt, P., Van den Oord, G. H. J., Dobber, M., Malkki, A., Visser, H., de Vries, J., Stammes, P., Lundell, J., and Saari, H.: The ozone monitoring instrument, Geoscience and Remote Sensing, IEEE T. Geosci. Remote, 44, 1093–1101, https://doi.org/10.1109/TGRS.2006.872333, 2006. a, b
Li, X., Brauers, T., Shao, M., Garland, R. M., Wagner, T., Deutschmann, T., and Wahner, A.: MAX-DOAS measurements in southern China: retrieval of aerosol extinctions and validation using ground-based in-situ data, Atmos. Chem. Phys., 10, 2079–2089, https://doi.org/10.5194/acp-10-2079-2010, 2010. a
Li, X., Brauers, T., Hofzumahaus, A., Lu, K., Li, Y. P., Shao, M., Wagner, T., and Wahner, A.: MAX-DOAS measurements of NO2, HCHO and CHOCHO at a rural site in Southern China, Atmos. Chem. Phys., 13, 2133–2151, https://doi.org/10.5194/acp-13-2133-2013, 2013. a
Lin, J.-T., Martin, R. V., Boersma, K. F., Sneep, M., Stammes, P., Spurr, R., Wang, P., Van Roozendael, M., Clémer, K., and Irie, H.: Retrieving tropospheric nitrogen dioxide from the Ozone Monitoring Instrument: effects of aerosols, surface reflectance anisotropy, and vertical profile of nitrogen dioxide, Atmos. Chem. Phys., 14, 1441–1461, https://doi.org/10.5194/acp-14-1441-2014, 2014. a
Liu, H., Liu, C., Xie, Z., Li, Y., Huang, X., Wang, S., Xu, J., and Xie, P.: A paradox for air pollution controlling in China revealed by “APEC Blue” and “Parade Blue”, Sci. Rep.-UK, 6, 34408, https://doi.org/10.1038/srep34408, 2016. a
Ma, J. Z., Beirle, S., Jin, J. L., Shaiganfar, R., Yan, P., and Wagner, T.: Tropospheric NO2 vertical column densities over Beijing: results of the first three years of ground-based MAX-DOAS measurements (2008–2011) and satellite validation, Atmos. Chem. Phys., 13, 1547–1567, https://doi.org/10.5194/acp-13-1547-2013, 2013. a
Marchenko, S., Krotkov, N. A., Lamsal, L. N., Celarier, E. A., Swartz, W. H., and Bucsela, E. J.: Revising the slant column density retrieval of nitrogen dioxide observed by the Ozone Monitoring Instrument, J. Geophys. Res.-Atmos., 120, 5670–5692, https://doi.org/10.1002/2014JD022913, 2015. a, b
Meller, R. and Moortgat, G. K.: Temperature dependence of the absorption cross sections of formaldehyde between 223 and 323 K in the wavelength range 225–375 nm, J. Geophys. Res.-Atmos., 105, 7089–7101, https://doi.org/10.1029/1999JD901074, 2000. a
Mijling, B., van der A, R. J., Boersma, K. F., Van Roozendael, M., De Smedt, I., and Kelder, H. M.: Reductions of NO2 detected from space during the 2008 Beijing Olympic Games, Geophys. Res. Lett., 36, L13801, https://doi.org/10.1029/2009GL038943, 2009. a
Ortega, I., Berg, L. K., Ferrare, R. A., Hair, J. W., Hostetler, C. A., and Volkamer, R.: Elevated aerosol layers modify the O2-O2 absorption measured by ground-based MAX-DOAS, J. Quant. Spectrosc. Ra., 176, 34–49, https://doi.org/10.1016/j.jqsrt.2016.02.021, 2016. a
Platt, U. and Stutz, J.: Differential optical absorption spectroscopy – principles and applications, Springer, 2008. a
Richter, A., Burrows, J. P., Nüß, H., Granier, C., and Niemeier, U.: Increase in tropospheric nitrogen dioxide over China observed from space, Nature, 437, 129–132, 2005. a
Rodgers, C. D.: Inverse methods for atmospheric sounding: Theory and practice, vol. 2, World scientific, 2000. a, b
Rotman, D. A., Tannahill, J. R., Kinnison, D. E., Connell, P. S., Bergmann, D., Proctor, D., Rodriguez, J. M., Lin, S. J., Rood, R. B., Prather, M. J., Rasch, P. J., Considine, D. B., Ramaroson, R., and Kawa, S. R.: Global Modeling Initiative assessment model: Model description, integration, and testing of the transport shell, J. Geophys. Res.-Atmos., 106, 1669–1691, https://doi.org/10.1029/2000JD900463, 2001. a
Serdyuchenko, A., Gorshelev, V., Weber, M., Chehade, W., and Burrows, J. P.: High spectral resolution ozone absorption cross-sections – Part 2: Temperature dependence, Atmos. Meas. Tech., 7, 625–636, https://doi.org/10.5194/amt-7-625-2014, 2014. a, b
Sinreich, R., Frieß, U., Wagner, T., and Platt, U.: Multi axis differential optical absorption spectroscopy (MAX-DOAS) of gas and aerosol distributions, Faraday Discuss., 130, 153, https://doi.org/10.1039/b419274p, 2005. a
Solomon, S., Schmeltekopf, A. L., and Sanders, R. W.: On the interpretation of zenith sky absorption measurements, J. Geophys. Res.-Atmos., 92, 8311–8319, https://doi.org/10.1029/JD092iD07p08311, 1987. a
Stein, A. F., Draxler, R. R., Rolph, G. D., Stunder, B. J. B., Cohen, M. D., and Ngan, F.: NOAA's HYSPLIT Atmospheric Transport and Dispersion Modeling System, B. Am. Meteorol. Soc., 96, 2059–2077, https://doi.org/10.1175/BAMS-D-14-00110.1, 2015. a
Stohl, A., Seibert, P., Arduini, J., Eckhardt, S., Fraser, P., Greally, B. R., Lunder, C., Maione, M., Mühle, J., O'Doherty, S., Prinn, R. G., Reimann, S., Saito, T., Schmidbauer, N., Simmonds, P. G., Vollmer, M. K., Weiss, R. F., and Yokouchi, Y.: An analytical inversion method for determining regional and global emissions of greenhouse gases: Sensitivity studies and application to halocarbons, Atmos. Chem. Phys., 9, 1597–1620, https://doi.org/10.5194/acp-9-1597-2009, 2009. a
Stohl, A., Prata, A. J., Eckhardt, S., Clarisse, L., Durant, A., Henne, S., Kristiansen, N. I., Minikin, A., Schumann, U., Seibert, P., Stebel, K., Thomas, H. E., Thorsteinsson, T., Tørseth, K., and Weinzierl, B.: Determination of time- and height-resolved volcanic ash emissions and their use for quantitative ash dispersion modeling: the 2010 Eyjafjallajökull eruption, Atmos. Chem. Phys., 11, 4333–4351, https://doi.org/10.5194/acp-11-4333-2011, 2011. a
Sun, Y., Wang, Z., Wild, O., Xu, W., Chen, C., Fu, P., Du, W., Zhou, L., Zhang, Q., Han, T., Wang, Q., Pan, X., Zheng, H., Li, J., Guo, X., Liu, J., and Worsnop, D. R.: “APEC Blue”: Secondary Aerosol Reductions from Emission Controls in Beijing, Sci. Rep.-UK, 6, 20668, https://doi.org/10.1038/srep20668, 2016. a
Thalman, R. and Volkamer, R.: Temperature dependent absorption cross-sections of O2-O2 collision pairs between 340 and 630 nm and at atmospherically relevant pressure, Phys. Chem. Chem. Phys., 15, 15371–15381, https://doi.org/10.1039/C3CP50968K, 2013. a
van der A, R. J., Eskes, H. J., Boersma, K. F., van Noije, T. P. C., Van Roozendael, M., De Smedt, I., Peters, D. H. M. U., and Meijer, E. W.: Trends, seasonal variability and dominant NOx source derived from a ten year record of NO2 measured from space, J. Geophys. Res.-Atmos., 113, D04302, https://doi.org/10.1029/2007JD009021, 2008. a, b
Vandaele, A., Hermans, C., Simon, P., Carleer, M., Colin, R., Fally, S., Merienne, M., Jenouvrier, A., and Coquart, B.: Measurements of the NO2 absorption cross-section from 42000 cm−1 to 10000 cm−1 (238–1000 nm) at 220 K and 294 K, J. Quant. Spectrosc. Ra., 59, 171–184, https://doi.org/10.1016/S0022-4073(97)00168-4, 1998. a, b
Wagner, T., Dix, B., Friedeburg, C. v., Fries, U., Sanghavi, S., Sinreich, R., and Platt, U.: MAX-DOAS O4 measurements: A new technique to derive information on atmospheric aerosols – Principles and information content, J. Geophys. Res.-Atmos., 109, D22205, https://doi.org/10.1029/2004JD004904, 2004. a
Wagner, T., Deutschmann, T., and Platt, U.: Determination of aerosol properties from MAX-DOAS observations of the Ring effect, Atmos. Meas. Tech., 2, 495–512, https://doi.org/10.5194/amt-2-495-2009, 2009. a
Wagner, T., Beirle, S., Brauers, T., Deutschmann, T., Frieß, U., Hak, C., Halla, J. D., Heue, K. P., Junkermann, W., Li, X., Platt, U., and Pundt-Gruber, I.: Inversion of tropospheric profiles of aerosol extinction and HCHO and NO2 mixing ratios from MAX-DOAS observations in Milano during the summer of 2003 and comparison with independent data sets, Atmos. Meas. Tech., 4, 2685–2715, https://doi.org/10.5194/amt-4-2685-2011, 2011. a
Wagner, T., Beirle, S., Benavent, N., Bösch, T., Chan, K. L., Donner, S., Dörner, S., Fayt, C., Frieß, U., García-Nieto, D., Gielen, C., González-Bartolome, D., Gomez, L., Hendrick, F., Henzing, B., Jin, J. L., Lampel, J., Ma, J., Mies, K., Navarro, M., Peters, E., Pinardi, G., Puentedura, O., Puķīte, J., Remmers, J., Richter, A., Saiz-Lopez, A., Shaiganfar, R., Sihler, H., Van Roozendael, M., Wang, Y., and Yela, M.: Is a scaling factor required to obtain closure between measured and modelled atmospheric O4 absorptions? An assessment of uncertainties of measurements and radiative transfer simulations for 2 selected days during the MAD-CAT campaign, Atmos. Meas. Tech., 12, 2745–2817, https://doi.org/10.5194/amt-12-2745-2019, 2019. a
Wang, S., Gao, J., Zhang, Y., Zhang, J., Cha, F., Wang, T., Ren, C., and Wang, W.: Impact of emission control on regional air quality: An observational study of air pollutants before, during and after the Beijing Olympic Games, J. Environ. Sci., 26, 175–180, https://doi.org/10.1016/S1001-0742(13)60395-2, 2014. a
Wang, S., Cuevas, C. A., Frieß, U., and Saiz-Lopez, A.: MAX-DOAS retrieval of aerosol extinction properties in Madrid, Spain, Atmos. Meas. Tech., 9, 5089–5101, https://doi.org/10.5194/amt-9-5089-2016, 2016. a, b
Wang, Y., Beirle, S., Lampel, J., Koukouli, M., De Smedt, I., Theys, N., Li, A., Wu, D., Xie, P., Liu, C., Van Roozendael, M., Stavrakou, T., Müller, J.-F., and Wagner, T.: Validation of OMI, GOME-2A and GOME-2B tropospheric NO2, SO2 and HCHO products using MAX-DOAS observations from 2011 to 2014 in Wuxi, China: investigation of the effects of priori profiles and aerosols on the satellite products, Atmos. Chem. Phys., 17, 5007–5033, https://doi.org/10.5194/acp-17-5007-2017, 2017. a, b, c, d
Wang, Y., Dörner, S., Donner, S., Böhnke, S., De Smedt, I., Dickerson, R. R., Dong, Z., He, H., Li, Z., Li, Z., Li, D., Liu, D., Ren, X., Theys, N., Wang, Y., Wang, Y., Wang, Z., Xu, H., Xu, J., and Wagner, T.: Vertical profiles of NO2, SO2, HONO, HCHO, CHOCHO and aerosols derived from MAX-DOAS measurements at a rural site in the central western North China Plain and their relation to emission sources and effects of regional transport, Atmos. Chem. Phys., 19, 5417–5449, https://doi.org/10.5194/acp-19-5417-2019, 2019. a
Wenig, M., Spichtinger, N., Stohl, A., Held, G., Beirle, S., Wagner, T., Jähne, B., and Platt, U.: Intercontinental transport of nitrogen oxide pollution plumes, Atmos. Chem. Phys., 3, 387–393, https://doi.org/10.5194/acp-3-387-2003, 2003. a
Wenig, M. O., Cede, A. M., Bucsela, E. J., Celarier, E. A., Boersma, K. F., Veefkind, J. P., Brinksma, E. J., Gleason, J. F., and Herman, J. R.: Validation of OMI tropospheric NO2 column densities using direct-Sun mode Brewer measurements at NASA Goddard Space Flight Center, J. Geophys. Res.-Atmos., 113, D16S45, https://doi.org/10.1029/2007JD008988, 2008. a
Witte, J. C., Schoeberl, M. R., Douglass, A. R., Gleason, J. F., Krotkov, N. A., Gille, J. C., Pickering, K. E., and Livesey, N.: Satellite observations of changes in air quality during the 2008 Beijing Olympics and Paralympics, Geophys. Res. Lett., 36, L17803, https://doi.org/10.1029/2009GL039236, 2009. a
Wittrock, F., Oetjen, H., Richter, A., Fietkau, S., Medeke, T., Rozanov, A., and Burrows, J. P.: MAX-DOAS measurements of atmospheric trace gases in Ny-Ålesund – Radiative transfer studies and their application, Atmos. Chem. Phys., 4, 955–966, https://doi.org/10.5194/acp-4-955-2004, 2004. a
Wu, F. C., Xie, P. H., Li, A., Chan, K. L., Hartl, A., Wang, Y., Si, F. Q., Zeng, Y., Qin, M., Xu, J., Liu, J. G., Liu, W. Q., and Wenig, M.: Observations of SO2 and NO2 by mobile DOAS in the Guangzhou eastern area during the Asian Games 2010, Atmos. Meas. Tech., 6, 2277–2292, https://doi.org/10.5194/amt-6-2277-2013, 2013. a, b
Zhang, J., Wang, S., Guo, Y., Zhang, R., Qin, X., Huang, K., Wang, D., Fu, Q., Wang, J., and Zhou, B.: Aerosol vertical profile retrieved from ground-based MAX-DOAS observation and characteristic distribution during wintertime in Shanghai, China, Atmos. Environ., 192, 193–205, https://doi.org/10.1016/j.atmosenv.2018.08.051, 2018. a
Zhang, Q., Streets, D. G., He, K., Wang, Y., Richter, A., Burrows, J. P., Uno, I., Jang, C. J., Chen, D., Yao, Z., and Lei, Y.: NOx emission trends for China, 1995–2004: The view from the ground and the view from space, J. Geophys. Res.-Atmos., 112, D22306, https://doi.org/10.1029/2007JD008684, 2007. a, b
Zhang, R., Tie, X., and Bond, D. W.: Impacts of anthropogenic and natural NOx sources over the U.S. on tropospheric chemistry, P. Natl. Acad. Sci. USA, 100, 1505–1509, https://doi.org/10.1073/pnas.252763799, 2003. a
Zhao, B., Wang, S. X., Liu, H., Xu, J. Y., Fu, K., Klimont, Z., Hao, J. M., He, K. B., Cofala, J., and Amann, M.: NOx emissions in China: historical trends and future perspectives, Atmos. Chem. Phys., 13, 9869–9897, https://doi.org/10.5194/acp-13-9869-2013, 2013. a