the Creative Commons Attribution 4.0 License.
the Creative Commons Attribution 4.0 License.
 | 12 Jul 2018
Statistical analysis of contrail to cirrus evolution during the Contrail and Cirrus Experiment (CONCERT)
Aurélien Chauvigné
Olivier Jourdan
Alfons Schwarzenboeck
Christophe Gourbeyre
Jean François Gayet
Christiane Voigt
Hans Schlager
Stefan Kaufmann
Stephan Borrmann
Sergej Molleker
Andreas Minikin
Tina Jurkat
Ulrich Schumann
Air traffic affects cloudiness, and thus climate, by emitting exhaust gases and particles. The study of the evolution of contrail properties is very challenging due to the complex interplay of vortex dynamics and the atmospheric environment (e.g. temperature, supersaturation). Despite substantial progress in recent years, the optical, microphysical, and macrophysical properties of contrails and ambient cirrus during contrail formation and subsequent ageing are still subject to large uncertainties due to instrumental and observational limitations and the large number of variables influencing the contrail life cycle. In this study, various contrail cases corresponding to different aircraft types and atmospheric conditions are investigated using a statistical method based on the in situ optical measurements performed during the Contrail and Cirrus Experiments (CONCERT) campaigns 2008 and 2011. The two aircraft campaigns encompass more than 17 aircraft contrail cases. A principal component analysis (PCA) of the angular scattering coefficients measured by the polar nephelometer is implemented. The goal is to classify the sampled ice cloud measurements in several clusters representative of different contrail development stages (primary wake, young contrail, aged contrail, and cirrus). Extinction and asymmetry coefficients, nitrogen oxide concentrations, and relative humidity with respect to ice and particle size distributions are analysed for each cluster to characterize the evolution of ice cloud properties during the contrail to cirrus evolution. The PCA demonstrates that contrail optical properties are well suited to identify and discriminate between the different contrail growth stages and to characterize the evolution of contrail properties.


Aircraft exhaust plumes have a significant impact on climate and tropospheric chemistry (Lee et al., 2010; IPCC, 1999). The Intergovernmental Panel on Climate Change IPCC Special Report on Aviation (1999) estimates that NOx emissions from subsonic aircraft increase ozone concentrations at cruise level. Short- and long-lived pollution species have different impacts on atmospheric chemical composition depending on the flight level (Frömming et al., 2012). Emissions of water vapour, black carbon (BC) or soot particles, sulfate (SO4) aerosols, and nitrogen oxides (NOx) contribute to the modification of the chemical composition of the upper troposphere on shorter timescales (Lee et al., 2010; Gettelman and Chen, 2013; Liou et al., 2013). The long-term climate impact is mainly driven by CO2 emissions. Modelling studies have shown that the direct radiative forcing from aviation is expected to represent 3–4 % (50–60 mW m−2) of the anthropogenic forcing (Lee et al., 2010; De León et al., 2012) and could reach 87 mW m−2 in 2025 (Chen and Gettelman, 2016). Aircraft-induced cloudiness also has an important impact on climate, although the quantitative assessment of the radiative forcing remains a major source of uncertainties (Lee et al., 2010).
1.1 Contrail formation and evolution
Contrail formation is mainly controlled by the thermodynamic properties of the ambient air and by the aircraft emissions. The conditions for contrail formation can be determined by the Schmidt–Appleman criterion (SAC) (Schumann, 1996). Contrail chemical composition can have a significant impact on the contrail formation (Kärcher and Yu, 2009). Indeed, contrail microphysical properties such as the total number densities and ice crystal diameters are directly linked to the emission index (e.g. soot emission index in kg fuel−1). Several studies in the past have been dedicated to the evolution of concentrations of nitrogen oxide (NO) and sulfur dioxide (SO2) and their oxidized forms (Kärcher and Voigt, 2006; Voigt et al., 2006; Schäuble et al., 2009; Jurkat et al., 2011).
Two different processes of contrail formation have been studied: combustion condensation trails and aerodynamic condensation trails. Different studies (Gierens and Dilger, 2013; Jansen and Heymsfield, 2015) have illustrated characteristics of aerodynamically controlled contrail formation associated with warmer temperatures (observations at temperatures above −38 ∘C). Contrails primarily initiated by the combustion processes result from the mixing of hot and humid exhaust gases with cooler and dryer ambient air. This increases the local relative humidity in the exhaust plume leading to the formation of contrails when the saturation with respect to liquid water is reached. In this case, soot and sulfate aerosols emitted by the aircraft (Moore et al., 2017) may act as condensation nuclei to form liquid droplets. Homogeneous ice nucleation of the liquid droplets can occur when the exhaust cools down through mixing with the ambient temperature, while preserving ice saturation. Small ice crystals are then formed in the jet phase within some tenths of a second (Kärcher and Yu, 2009).
The life cycle of contrails depends on their interaction with the wake vortices behind aircraft and the ambient atmosphere (Irvine et al., 2012; Graf et al., 2012; Duda et al., 2013; Carleton et al., 2013; Schumann and Heymsfield, 2017). The ice crystals in the young contrails are captured within two counter-rotating wake vortices in the downwash behind the aircraft induced by the aircraft lift; these vortices induce adiabatic compression, heating, and partial sublimation of the ice crystals within the primary wake (Lewellen and Lewellen, 2001; Sussmann and Gierens, 2001; Unterstrasser et al., 2008, 2016; Kärcher and Voigt, 2017). This primary wake may soon disappear if ambient air is subsaturated with respect to ice. In the case of supersaturation, the secondary wake becomes visible, thereby detraining ice particles from the primary wake at a higher level (Sussmann and Gierens, 1999; Kaufmann et al., 2014). Quasi-spherical ice crystals become increasingly aspherical and grow by the uptake of water vapour as long as saturation with respect to ice prevails. In ice-saturated conditions, contrails can persist after the vortex breakdown, spread, and evolve into contrail cirrus (Schumann and Heymsfield, 2017). The associated cloud cover (larger than for linear contrails alone) increases the radiative forcing of contrail cirrus (Burkhardt and Kärcher, 2011; Schumann et al., 2015).
1.2 Optical and microphysical properties of contrail phases
The assessment of the contrail radiative forcing requires, in particular, an accurate estimation of the cloud cover, the visible optical depth, the single-scattering characteristics, and the ice crystal effective size and habit (Yang et al., 2010; Spangenberg et al., 2013). Satellite observations provide a comprehensive dataset to study the contrail to cirrus evolution statistically. The combined contrail tracking algorithms on the Spinning Enhanced Visible and Infrared Imager (SEVIRI) on board the Meteosat Second Generation (MSG) satellites with properties inferred by the Moderate Imaging Spectroradiometer (MODIS) on board the Terra satellite were used by Vázquez-Navarro et al. (2015) to characterize the properties of 2300 contrails. Properties included the lifetime (mean values of 1 h), the length (130 km), the optical thickness (0.34), the altitude (11.7 km), and the radiative forcing (−26 W m−2 for shortwave forcing over land) of these contrails.
However, detailed in situ optical and microphysical measurements are still needed to evaluate satellite products and to develop a more appropriate retrieval algorithm. Distinguishing contrails from natural cirrus from satellite observations remains extremely challenging. Although the optical and microphysical properties of young contrails (linear contrails) differ from natural cirrus properties, the contrail properties are highly time dependent, and persistent contrail cirrus can be embedded in thin cirrus clouds. Recent in situ measurements (Voigt et al., 2017) show that the microphysical properties of contrail cirrus can still be distinguished from natural cirrus at contrail cirrus ages up to several hours.
Most of the previous studies (Jeßberger et al., 2013; Lewellen, 2012; Schumann et al., 2013) divide the contrail analysis into the two wakes phases. Primary and secondary wake properties depend strongly on atmospheric conditions and aircraft type (emission index, vortex, flight level, ambient humidity, temperature, etc.). In the primary wake, contrail ice crystals are quasi-spherical with values of the effective diameter (Deff) typically lower than 4 µm (Schumann et al., 2011, 2017b; Gayet et al., 2012; Järvinen et al., 2016). The total number concentration of ice particles is typically larger than 1000 cm−3 a few seconds after contrail formation (Baumgardner and Gandrud, 1998; Petzold et al., 1997). Then, it decreases by dilution to concentrations below 200 cm−3 within less than 1 min after contrail generation (Poellot et al., 1999; Schröder et al., 2000; Gayet et al., 2012). Gayet et al. (2012) reported mean values of ice water content of 3 mg m−3 and maximum extinction coefficients close to 7 km−1. In agreement with these results, the recent overview on contrail studies presented in Schumann et al. (2017b) reports several microphysical properties at different stages, for different atmospheric conditions as well as comparisons with the Contrail Cirrus Prediction (CoCIP) model simulations. Their study highlights the large variability (which increases with contrail age) in contrail properties.
Several studies reported findings on the secondary wake and its evolution into contrail cirrus. Detrained from the primary wake and submitted to saturated ambient air with respect to ice, ice crystals grow rapidly, while crystal concentration decreases. Within the first minutes after formation, measurements exhibit aspherical ice crystals with effective sizes up to 6 µm, ice water content (IWC) between 2.5 and 10 mg m−3, extinction between 2 and 3 km−1, and crystal concentrations typically lower than 100 cm−3 (Goodman et al., 1998; Voigt et al., 2010; Kübbeler et al., 2011; Gayet et al., 2012; Jeßberger et al., 2013; Schumann et al., 2013; Poellot et al., 1999; Febvre et al., 2009; Kaufmann et al., 2014). Aged contrails can persist and evolve into contrail cirrus if the ambient air is saturated with respect to ice. After a few minutes, tracking contrails by visual navigation is challenging as contrail and contrail cirrus spread in the free troposphere. Aged contrails are often difficult to identify unambiguously (Schumann et al., 2017a).
Observations of the ice crystal shape and their growth over several tens of minutes and up to an hour illustrate that effective crystal sizes can easily exceed 20 µm, with number concentrations ranging from 1 to 5 cm−3 (Lawson et al., 1998; Schäuble et al., 2009), extinction of less than 0.5 km−1 (Febvre et al., 2009), and IWC up to 10 mg m−3 (Schröder et al., 2000; De León et al., 2012). At this stage, within a sustained ice-supersaturated environment, contrail microphysical properties may still differ from those of natural cirrus (Voigt et al., 2017) with concentrations of ice crystals larger than 100 µm in the order of 0.1 cm−3. These crystals typically show bullet rosette type habits (Heymsfield et al., 1998, 2010). Optical depth values can reach 2.3 (Atlas and Wang, 2010), corresponding to an extinction of 0.023 km−1. Nevertheless, the transition from contrails to cirrus highly depends on the ambient saturation conditions. Modelling studies with typical atmospheric conditions show a temporal evolution of the optical and microphysical properties when contrails evolve to contrail cirrus clouds (Burkhardt and Kärcher, 2011; Unterstrasser et al., 2016; Schumann et al., 2015).
In this study, we report on a powerful alternative to classifying cloud events into young contrails, aged contrails, and cirrus. The method is applied to aircraft data of the CONCERT campaigns (Voigt et al., 2010, 2011, 2014). The methodology consists in implementing a principal component analysis (PCA) of the angular light-scattering data measured by the polar nephelometer. The PCA patterns are classified to yield different clusters representing specific contrail types. Corresponding optical, microphysical, and chemical properties are derived for each contrail phase (from young contrails to contrail cirrus). This paper starts with an overview of the properties of contrails and cirrus clouds observed during two specific CONCERT flights (19 November 2008 and 16 September 2011) encompassing a series of different contrail evolution stages. These two flights contain a variety of contrails. The results from these flights can be regarded as an analytical framework which then can be compared to contrails properties of other flights.
2.1 CONCERT campaigns
The CONCERT-1 and CONCERT-2 campaigns took place in October/November 2008 and August/September 2011, respectively. Both campaigns deployed the Deutsches Zentrum für Luft- und Raumfahrt (DLR) Falcon 20 E research aircraft from Oberpfaffenhofen, Germany, and sampled contrails and cirrus at midlatitudes over Europe. The overall objective was to reduce uncertainties on the microphysical, chemical, and radiative properties of contrails behind aircraft of different types and to improve the evaluation of contrails' impact on climate. A few CONCERT flights were also dedicated to study emissions of the Etna and Stromboli volcanos (Voigt et al., 2014; Shcherbakov et al., 2016). A few stratospheric intrusions were also observed during the flight missions. In total, 23 flights were recorded during the two measurement campaigns, wherein 12 flights were entirely focused on aircraft contrail chasing. Overall, more than 17 different aircraft exhausts plumes have been probed. The CONCERT-2 campaign mainly focused on the observation of persistent contrails and hence on the evolution of contrails to contrail cirrus.
During both CONCERT campaigns, the DLR research aircraft Falcon was equipped with a set of instruments to measure the optical and microphysical properties of cloud particles and also the trace gas composition in the UTLS (upper troposphere–lower stratosphere) region. Voigt et al. (2010) provide a detailed description of the aircraft instrumentation. We briefly introduce the instruments used in this study.
2.2 Aircraft instrumentation
The microphysical and optical particle properties of contrails and cirrus presented in this study were mainly derived from the Particle Measuring Systems (PMS) Forward Scattering Spectrometer Probe 300 (FSSP-300), the polar nephelometer (PN), and the PMS 2D-C hydrometeor imaging probe. The combination of these independent techniques characterizes cloud particles within a range of diameters varying from 0.5 µm to 2 mm.
The PN (Gayet et al., 1997) measures the angular scattering coefficients (non-normalized scattering-phase function) of an ensemble of water droplets or ice crystals or a mixture of those particles ranging from a few micrometres to approximately 1 mm in diameter. These particles intersect a collimated laser beam, at a wavelength of 804 nm, near the focal point of a parabolic mirror. The light scattered at angles from 3.49 to 172.5∘ is reflected onto a circular array of 56 near-uniformly positioned photodiodes. In this study, reliable measurements were performed at 30 scattering angles ranging from ±15 to ±162∘. Particle phase (water droplets and/or ice crystals) can be assessed as well as single-scattering properties such as the extinction coefficient and the asymmetry coefficient with uncertainties of 25 and 4 %, respectively (Gayet et al., 2002; Jourdan et al., 2010).
Particle size distributions and corresponding microphysical and optical integrated properties (IWC, Deff, N, and extinction) were derived from both FSSP-300 and 2DC (two-dimensional cloud probe) measurements. The FSSP-300 (Baumgardner et al., 1992) measures the intensity of forward-scattered light from cloud particles passing through the laser beam, with cloud particles in the diameter range 0.35–20 µm. In the forward angular region (from 4 to 12∘), scattering is mainly described by the particle diffraction pattern and therefore depends on the refractive index, the shape, and the size of the particles. The method of data processing and size calibration used during the CONCERT campaigns has been presented in Gayet et al. (2012). We briefly recall that the asymmetry parameter derived from the PN was used to distinguish nearly spherical particles (g ≥ 0.85) from non-spherical ones (g < 0.85) at 804 nm. For spherical ice particles, Mie calculations were used to derive the size bin limits and the corresponding extinction efficiency. Results were adjusted to the calibrated probe response. Additionally, to minimize Mie ambiguities related to the FSSP-300 size response, 31 channels were rebinned to 13 channels with a diameter ranging from 0.5 to 18 µm (upper channels 30 and 31 were excluded from the data analysis). For non-spherical particles, the size of the contrail particles is expressed in terms of an equivalent surface or area diameter, i.e. the diameter of a sphere that has the same area as the projected area of the measured non- spherical particle image (Mishchenko et al., 1997; Schumann et al., 2011). The particles were assumed to be rotationally symmetric ice ellipsoids with an aspect ratio of 0.5. Accordingly, and contrary to the method used for spherical particles, 15 size bins ranging from 0.5 to 18 µm were defined based on T-matrix calculations following Borrmann et al. (2000).
The bi-dimensional optical array spectrometer probe (2DC) provides information on the crystal size and shape within a nominal size range of 25 to 800 µm by recording cloud particle shadow images with a 25 µm resolution. The method of data processing used in this study is described in detail in Gayet et al. (2002) and Febvre et al. (2009). Reconstruction of truncated particles has been considered for the particle size distribution (PSD) calculations and the sampling surfaces have been derived according to Heymsfield and Parrish (1978). To improve the statistical significance of low particle concentrations, a 5 s running mean was applied. As the sensitivity of the probe to small particles decreases with airspeed (Lawson et al., 2006), particles smaller than 100 µm may not be detectable at the Falcon airspeed of typically 180 m s−1. This may result in larger uncertainties of up to 100 % in the derived microphysical parameters such as the IWC (Gayet et al., 2002, 2004).
For spherical and non-spherical particles, the extinction coefficients are calculated from the following equation:
where is the extinction efficiency (values depend on spherical or aspherical particle characterization), Di the mean diameter in channel i, and Ni the number concentration.
Different approaches are used to retrieve ice water content from spherical and non-spherical particles (Garret et al., 2003; Gayet et al., 2004, 2012). For spherical particles (asymmetry parameter (gPN) > 0.85), IWC is computed from the following equation:
with ρice being the bulk ice density (0.917 g cm−3).
For non-spherical ice crystals (gPN < 0.85 and for particle diameters larger than 50 µm), an equivalent diameter method is used (Gayet et al., 2004). For an ice crystal with an area A, the particle equivalent diameter Dequ (in mm for Eqs. 3 and 4), the equivalent mass xequ (in mg), and the ice water content (IWC in mg m−3) are defined as
with ρwater being the bulk water density (1 g cm−3).
These equations do not account for the possible shattering of large ice crystals on the probe inlets. This effect is minor in young contrails but can lead to an underestimation of large ice crystal concentration (diameters greater than 100 µm) and thus an overestimation of small ice crystal concentration in contrail cirrus clouds (Febvre et al., 2009).
Trace gas measurements were also performed. NO ∕ NOy concentrations can be significant in young tropospheric aircraft plumes. The NO and NOy mixing ratios were calculated using the chemiluminescence technique (Schlager et al., 1997) with a time resolution of 1 s. Instruments used for CONCERT campaigns are described in several studies (Jurkat et al., 2010, 2011, 2016; Voigt et al., 2014). The accuracy (and precision) of the NO and NOy measurements is estimated with 7 % (and 10 %) and 10 % (and 15 %), respectively (Ziereis et al., 2000).
Relative humidity with respect to ice (RHI) is also a key parameter to understand contrail formation and microphysical properties. Water vapour was measured with the chemical ionization mass spectrometer AIMS-H2O during CONCERT-2 (Kaufmann et al., 2014, 2016). Hygrometers using the Lyman-α technique (FISH, Zöger et al., 1999; Meyer et al., 2015) and frost point hygrometers (CR-2, Heller et al., 2017) were deployed on the Falcon during CONCERT-1 and 2.
3.1 Overview of the cloud properties sampled during the reference cases
The purpose of this section is to give an overview of the contrail optical properties and more interestingly to evaluate the ability of the polar nephelometer measurements to identify contrails. Two flights, performed on 16 September 2011 during CONCERT-2 (flight 16b) and on 19 November 2008 during CONCERT-1 (flight 19b), were selected for their variety of ice clouds sampled during these two flights. The two flights are considered as a benchmark to illustrate the potential of the PCA methodology described in Sect. 3.2.
Figure 1 displays the time series of the extinction coefficient (ExtPN) and gPN at a wavelength of 804 nm, RHI, the NO concentration, the temperature T, and the altitude for flights 19b and 16b. RHI measured with the AIMS mass spectrometer is shown for both flights. For flight 19b, RHI instrument shortcomings are discussed in details in Kübbeler et al. (2011), Gayet et al. (2012), Jeßberger et al. (2013), and Schumann et al. (2013). For both flights, air traffic control (ATC) provides information on the flight tracks and on the chased aircraft (aircraft type, engine type, fuel flow, weight, engine power setting). From this information, the Falcon measurements were attributed to the exhaust plume of individual aircraft with an estimated plume age. Time series are colour-coded according to ATC information. When no ATC information is available, the cloud segment is called “unidentified ice cloud”.
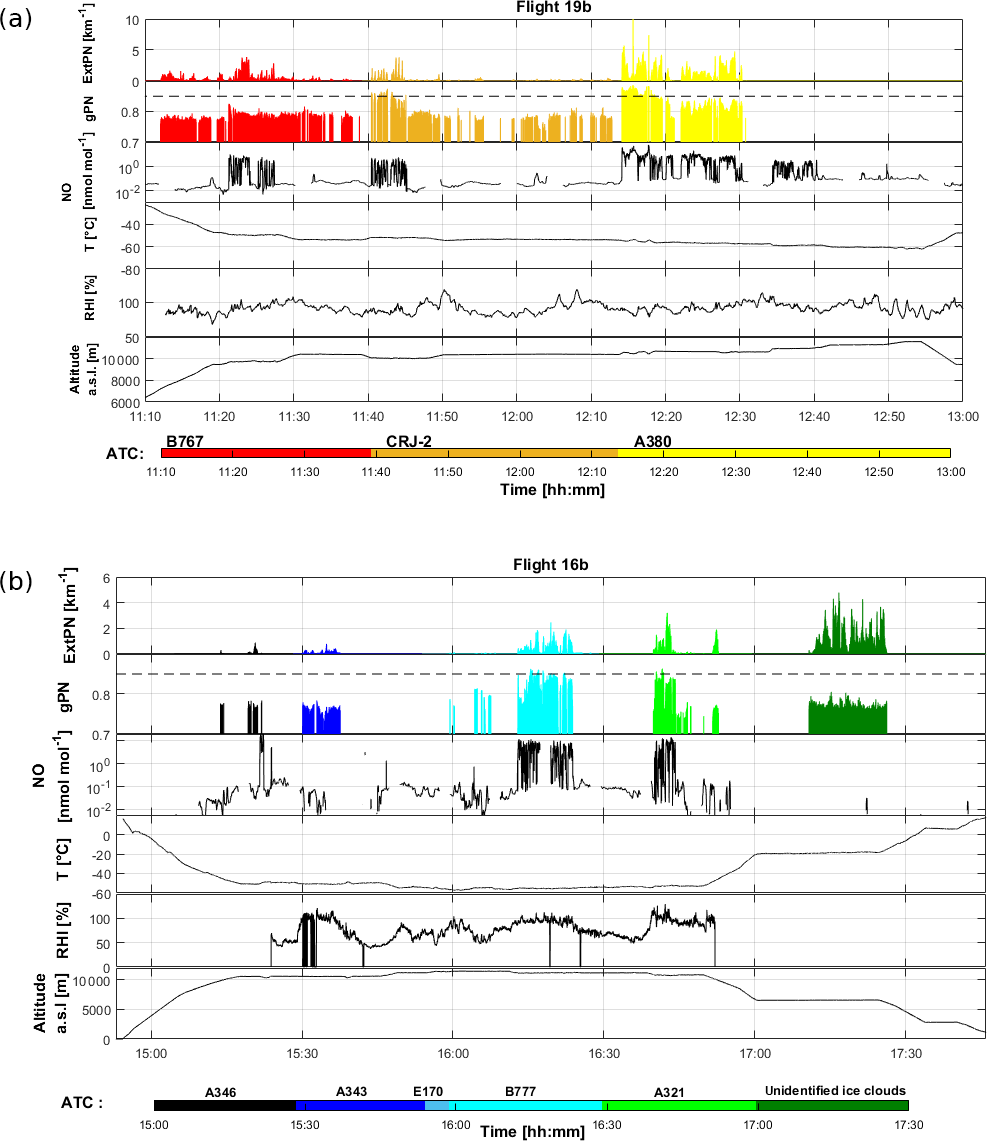
Figure 1Time series at 1 s resolution for flights (a) 19b (CONCERT-1) and (b) 16b (CONCERT-2). From top to bottom: extinction coefficient (in km−1) and asymmetry parameter measured by the polar nephelometer at 804 nm (dashed line corresponds to a 0.85 value), concentration of nitric oxide (in nmol mol−1) measured by chemiluminescence technique, temperature (in ∘C), relative humidity with respect to ice (in %), and altitude a.s.l. (in m). Temporal series are coloured according to time and aircraft chasing information from air traffic control (ATC).
The PN extinction coefficient coupled with the asymmetry parameter seems to be a reasonable proxy to detect contrails and cirrus clouds (see, amongst other references, Voigt et al., 2010). ExtPN values, by definition, depend on the cloud particle concentration and size. Values typically beyond 0.1 km−1 correspond to cloud events that are well correlated to environmental conditions supersaturated with respect to ice (RHI > 100 %). Figure 1 shows that relatively high values of extinction can be found in flights 19b and 16b that are linked to the presence of contrails or ice clouds. Moreover, the temporal distributions of these values are in accordance with ATC information for both flights. For instance, most of the contrails induced by commercial aircraft exhaust plumes are associated with significant extinction coefficient values. The ExtPN values are between 0.2 and 10 km−1 for contrails induced by A346, A340, and A380 commercial aircraft.
The last cloud event (unidentified ice cloud) during flight 16b is not a contrail because it is measured at temperatures significantly above the Schmidt–Appleman temperature (−38 ∘C; Schumann, 1996). This is an ice cloud with high extinction (> 0.5 km−1) and low asymmetry values (< 0.75), characteristic of ice particles (Jourdan et al., 2003; Febvre et al., 2009). Relative humidity and NO mixing ratio data are not available for this cloud.
Most of the aircraft-induced contrails are detected by the PN except for the ones stemming from the E170 airplane. At 15:50 UTC during flight 16b, ATC identified the E170 position close to the Falcon flight trajectory; however, the ExtPN and the NO mixing ratio remained low. Hence, the E170 contrail was not probed by the Falcon. In the following, we assume that only periods with ExtPN values above 0.1 km−1 are considered to be a reliable signature of contrails.
The absolute values of the asymmetry parameter gPN provide additional information on the cloud particle shape. Indeed, gPN is a good indicator of the degree of sphericity of ice crystals (Gayet et al., 2012). Ice clouds with gPN values higher or equal to 0.85 are typically composed of spherical ice crystals, whereas lower values are indicative of aspherical ice particles. In a supersaturated environment, crystals grow by water vapour deposition and become increasingly aspherical with time. However, in very young contrails, spherical ice crystals with an asymmetry coefficient of around 0.85 prevail. gPN decreases when water vapour diffusion generates more and more aspherical crystal shapes at ice supersaturation. This can be observed for A321 chasing during flight 16b where gPN decreases to a value of 0.75 whilst RHI remains around 100 %. This is not the case during B777 chasing where no gPN decrease is observed when RHI < 100 %. However, it is important to note that the RHI measurements during the CRJ-2 chasing events do not show supersaturated conditions, whereas the contrail seems persistent. Indeed, RHI measurements should be discussed carefully for this campaign due to potential calibration issues.
A good example of the evolution of gPN is the CRJ-2 contrail observed between 11:40 and 11:45 during flight 19b. The sequence illustrates the potential of the gPN measurement to characterize the evolution of contrail properties. The evolution of the ice crystal shape is reflected in the decrease in the asymmetry parameter from 0.88 to 0.79 (uncertainties around 0.04) after only 5 min and down to 0.77 after 20 min. A weaker decrease in gPN values (around 0.78 ± 0.02) is then observed until 12:10 corresponding to 30 min of contrail ageing. During this period, ice crystals are expected to grow by water vapour diffusion. A similar decrease in gPN values has been reported by Gayet et al. (2012) in the ageing contrail from an A380 aircraft, and it is also visible in the present study for the B767 and the A321 contrails.
NO concentration measurements can also be used to distinguish natural cirrus clouds from clouds influenced by aircraft traffic. At the typical altitude of 10 km, NO environmental concentrations are close to background values. In contrast, NO concentrations in young contrails may reach several tens of nmol mol−1 (Voigt et al., 2010). Figure 1 shows a good correlation between the expected localization of young contrails and NO concentrations. The dilution effect in the upper troposphere causes an important decay of chemical concentrations. For instance, the first few seconds of the A380 chasing during flight 19b are characterized by a high NO concentration (up to 40 nmol mol−1) followed by a fast decrease to 10 nmol mol−1 in the next 15 min of observation time and less than 5 nmol mol−1 later. NO concentrations finally decrease to background levels within hours (e.g. Voigt et al., 2017). This decrease in the NO concentration is in accordance with the decrease in the extinction coefficient (from 10 to 0.2 km−1) and asymmetry parameter (from 0.88 to 0.77). NO is mainly used as an additional contrail indicator. However, during some aircraft chasing events, NO concentrations were near background levels, while mass spectrometric measurements (not shown here) indicate elevated concentrations of HONO, HNO3, and SO2 representative of contrail chemical species.
Flights 19b and 16b clearly show that the optical properties can be used to discriminate between different cloud events. A first-order analysis of these parameters (supported by the ATC information) can be used to roughly distinguish young contrails (mostly quasi-spherical ice crystals) from aged contrails (mostly aspherical ice crystals). This analysis is mainly qualitative and based solely on a few typical parameters (Fig. 1). A more robust statistical method should be used to accurately separate the different contrail phases. In the following section, scattering properties are investigated more extensively to assess whether the information content of the PN scattering measurements is sufficient to document changes in the contrail microphysical properties.
3.2 Statistical method
In this section, we present a methodology based on a statistical analysis of the optical signature of the cloud measurements. The goal is to classify the contrail properties according to the aircraft origin and evolution stage. The main objective of the PCA is data reduction to allow a better physical interpretation of the light-scattering patterns derived from the polar nephelometer measurements (Legendre and Legendre, 1998; Jourdan et al., 2003). In this study, optical properties of ice crystals in the evolving contrail environment are examined to evaluate contrail evolution. This statistical analysis was already successfully applied to distinguish mixed-phase clouds (Jourdan et al., 2003, 2010) from liquid clouds and ice clouds and to identify porous aerosol in degassing plumes (Shcherbakov et al., 2016).
3.2.1 Reference definition
The PCA is first applied to the PN angular scattering coefficient measurements performed during flights 16b and 19b, which are here considered as our reference dataset. Initially, a correlation matrix is calculated to characterize the link between each scattering angle. The PCA is designed to generate a new limited set of uncorrelated parameters, called principal components Clj, representative of the original dataset variability.
A first implementation of the PCA is performed to detect unreliable data or out of order photodiodes. For instance, seven photodiodes presented a low signal-to-noise ratio and were excluded from the dataset. Flight sequences characterized by ExtPN < 0.1 were also removed. Finally, flight sequences dedicated to aircraft chasing and ice cloud sampling were considered to perform a second PCA. The analysis is performed on the remaining angular scattering coefficients (4669 angular scattering coefficients (ASCs) representing PN measurements of flights 16b and 19b) restricted to 25 angles θ ranging from 15 to 155∘. The new set of variables or coordinates, Clj, can be expressed by the scalar product of the vector of reduced angular scattering coefficients σj(θ) for the jth measurements, expressed on a log scale, and the lth eigenvector ξl(θ) (i.e. principal component) of the total dataset correlation matrix (Jourdan et al., 2010):
where 〈lnσ〉 represents the average ASC of the dataset.
The first three eigenvectors ξl(θ) of the correlation matrix are displayed in Fig. 2 along with their normalized eigenvalues λl, representing more than 99 % of the variability in the PN ASCs.
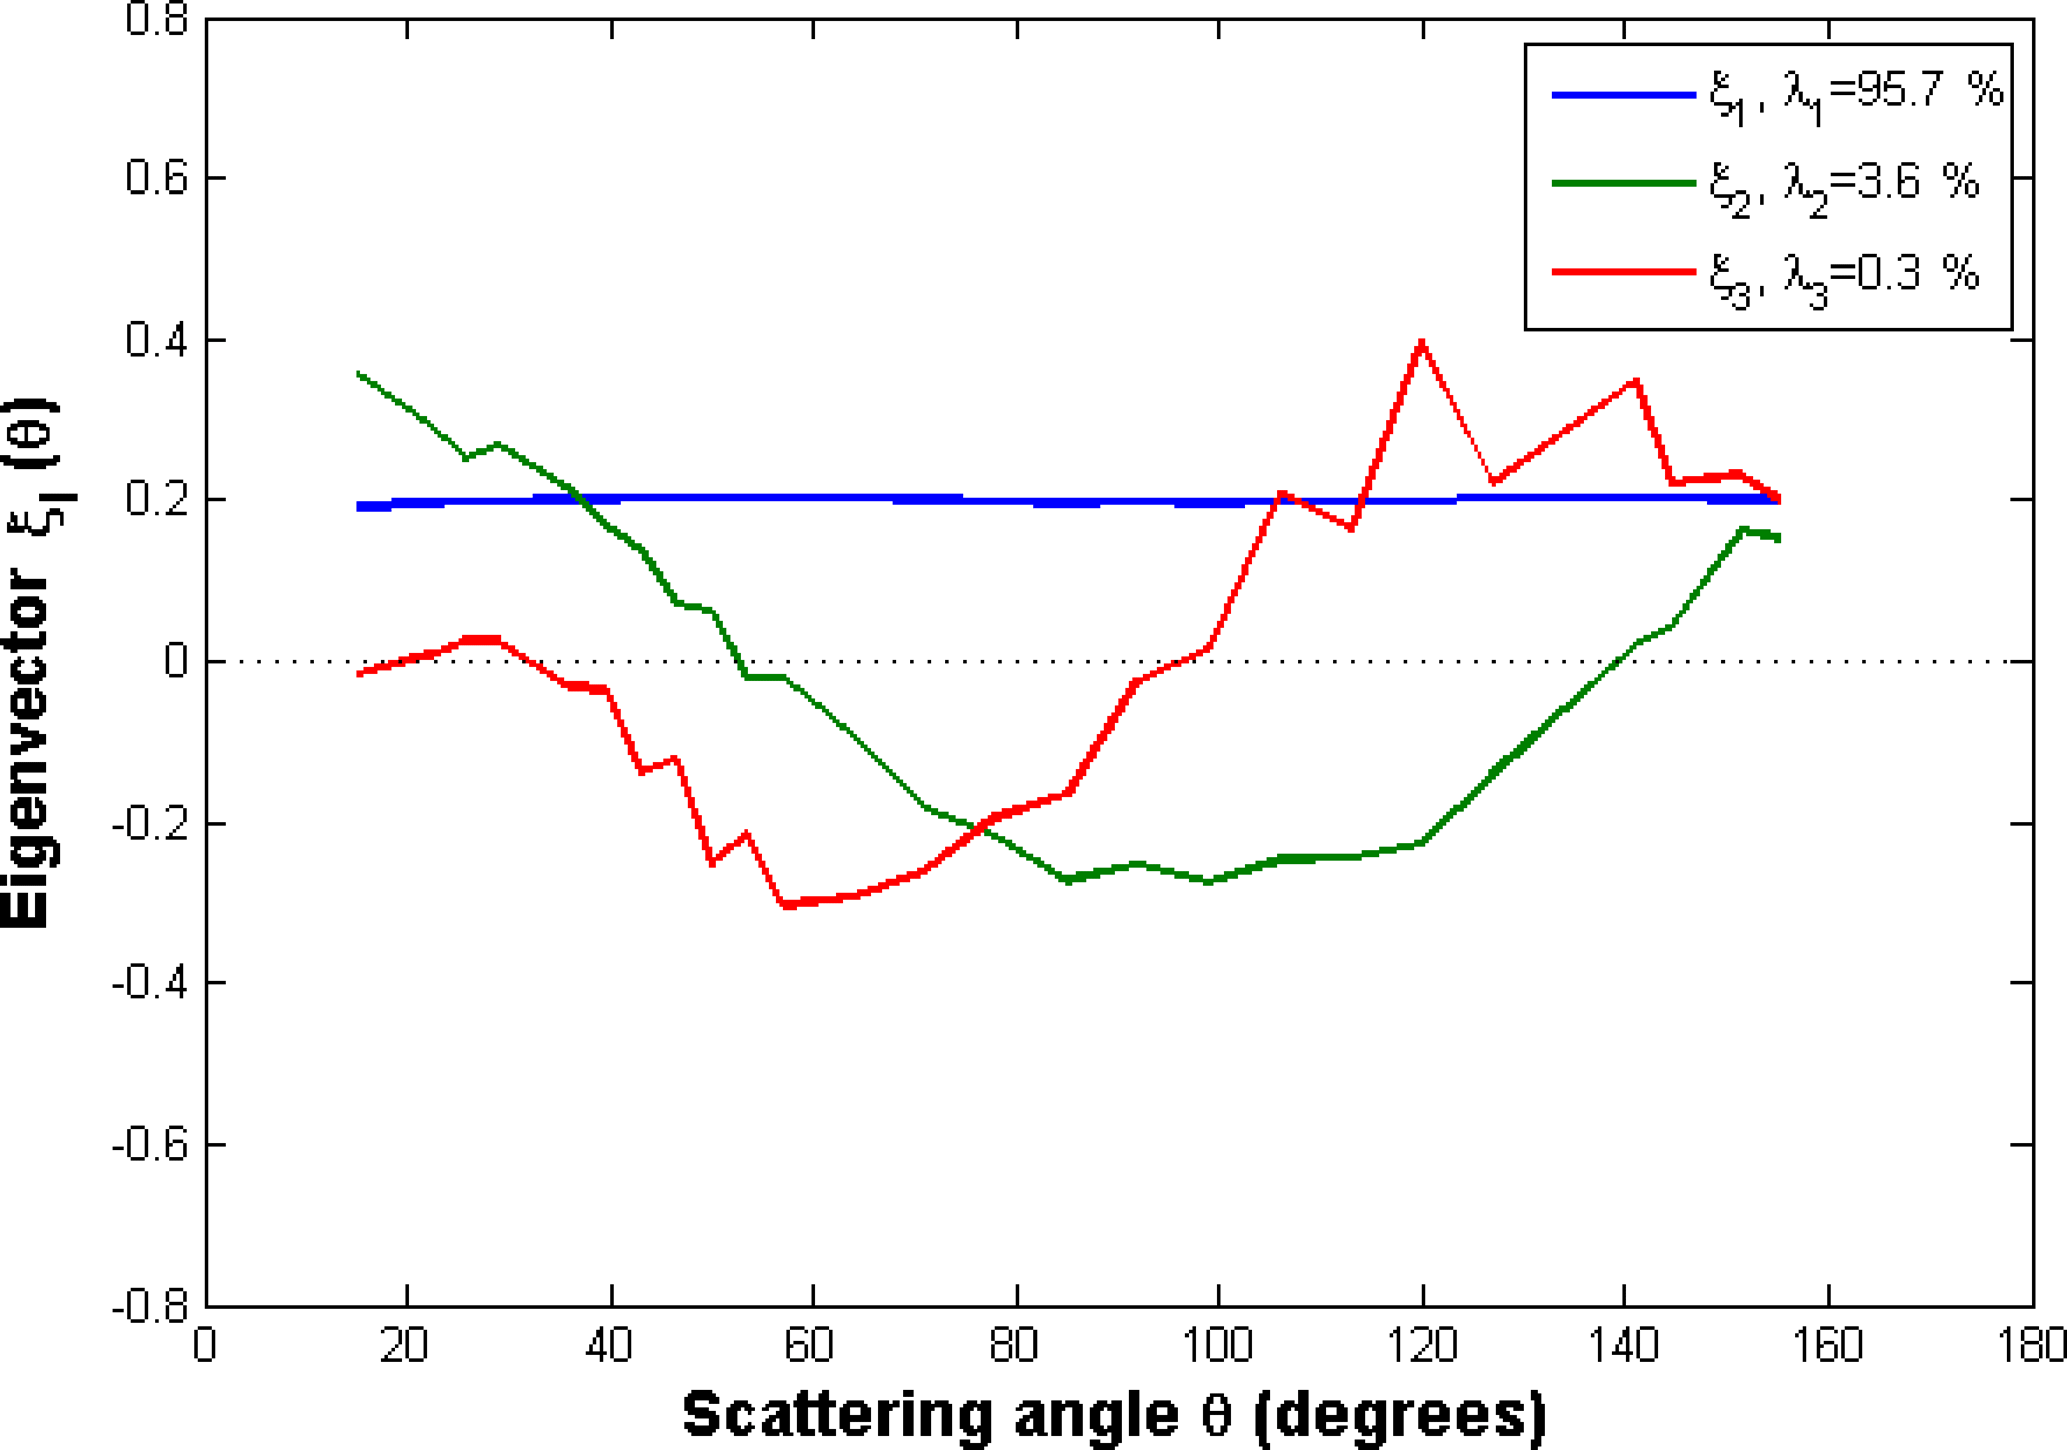
The first eigenvector ξ1(θ) is approximately constant according to the scattering angle and represents 95.7 % of the total variance. It means that this principal component is representative of changes in the magnitude of phase functions without any changes in their global shape. This behaviour means that 95.7 % of the ASC variations are linked to changes in the cloud particle extinction. Results show a good correlation (r2 = 0.98) between the first eigenvector and the extinction derived from the PN measurements (ExtPN).
The second eigenvector ξ2(θ) reverses sign twice at scattering angles equal to 50 and 140∘ with an extremum around 90∘. Accordingly, 3.6 % of the angular scattering variability corresponds to a redistribution of scattered energy from the angular region (50–140∘) to scattering angles lower than 50∘ and higher than 140∘. Light-scattering modelling studies demonstrate that the scattering behaviour in the angular region between 60 and 140∘ is sensitive to the particle shape and thermodynamic phase (Jourdan et al., 2010). A strong linear correlation (r2 = 0.97) between the second eigenvector and the asymmetry coefficient (gPN) at 804 nm is found.
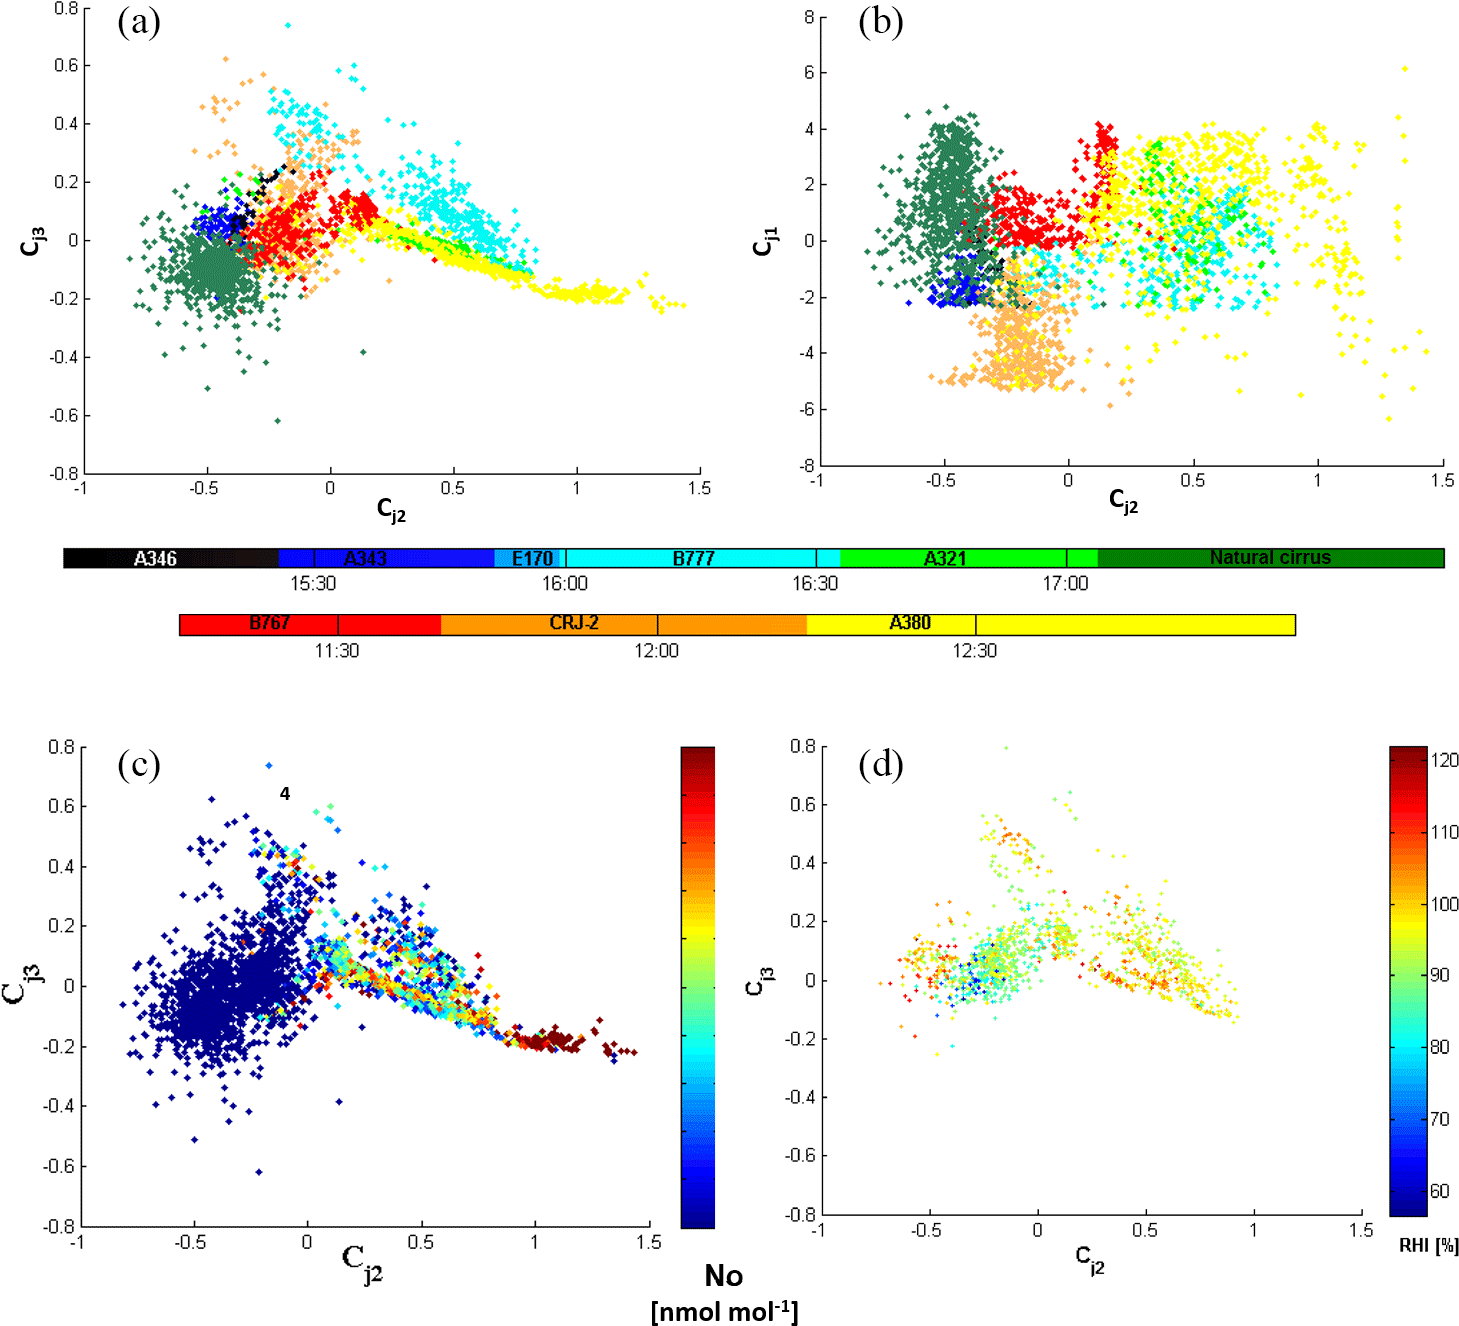
Figure 3Expansion coefficient diagram for flights 16b and 19b: third versus second principal component for (a), (c), and (d) and first versus second principal component for (b). Data points are colour-coded according to ATC information for (a) and (b), by NO concentration for (c), and by RHI values for (d).
The third eigenvector represents only 0.3 % of the total variance. However, this eigenvector provides additional information in scattering regions which are not well described by the first two principal components. It has opposite signs in the angular region (30–90∘ and 90–155∘) with maximum extremal values at 60 and 120∘. The shape of the third eigenvector describes the forward/backward hemisphere partitioning of the scattering. Baran et al. (2012) and Xie et al. (2006, 2009) showed that the scatter pattern for angles between 120 and 160∘, corresponding to ice bow-like effects, is sensitive to quasi-spherical particles. Moreover, these backscattering angles (θ > 120∘) and scattering angles around 22 and 46∘ (corresponding to halo features) can also be linked to the particle habits and surface roughness (Xie et al., 2009; Jourdan et al., 2010).
Each phase function (or ASC) measured by the PN can be expressed with good accuracy as a linear combination of the three principal components (Jourdan et al., 2010). The PN data are projected into a new space defined by the three principal components (3-D space) instead of the 25-dimensional space of the ASC. The scatter plots of the Cj3 and Cj1 expansion coefficients versus the Cj2 coefficient are presented in Fig. 3a and b, respectively. Figure 3a illustrates the features of the ASC measurements in one of the most comprehensive ways. Each point corresponds to a measured phase function documented over 25 angles. The variability in Cj2 coefficients is significant, with values ranging from −1 to 1.5. The angular variation in the second principal component indicates that large values of Cj2 (Cj2 > 0.75) correspond to the ASC with low side scattering (60–130∘) and higher forward scattering (15–40∘) and somehow higher backscattering (145–155∘). This behaviour is connected to an increase in the asymmetry parameter with an increase in Cj2 values. Thus, the fraction of spherical particles increases with increasing Cj2. In the region defined by negative values of Cj2, the density of points is relatively high. These cloud events exhibit optical properties characterized by a large side-scattering and low asymmetry parameter. Therefore, specific cloud sequences sharing similar scattering properties can be identified based on this second principal component. Young contrails characterized by quasi-spherical ice crystals have high positive values of Cj2 while cirrus clouds and contrail cirrus exhibit high negative values.
In the space of the third principal component, high positive values of Cj3 imply that less energy is scattering in the forward hemisphere and thus more energy is scattered in the backward hemisphere. The variability in the expansion coefficients is less pronounced as ASCs are distributed between −0.4 and 0.6. Most of the measured ASCs do not significantly differ from the average ASC in the angular ranges (30–90∘) and (90–155∘). However, some specific clusters linked to scattering behaviour can be identified for values of Cj3 greater than 0.1 and lower than −0.1. These threshold values also depend of the position of the ASC on the second principal component. Finally, the first principal component is directly linked to the extinction coefficient. High values of Cj1 are representative of optically dense cloud sequences.
Figure 3c shows an increase in Cj2 for an increasing NO mixing ratio. This clearly indicates that the contrails are evolving in space and/or time along the Falcon flight track. Hence, contrails characterized by a low side scattering due to the presence of spherical ice crystals correspond to a high NO concentration. This behaviour can be a signature of young contrail properties. Older or aged contrails composed of a higher fraction of non-spherical crystals or growing more aspherically are expected to exhibit an enhanced side-scattering and a lower asymmetry parameter associated with lower NO concentrations. RHI measurements also give relevant information on the capacity of the cloud to be persistent. Thus, Fig. 3d shows higher RHI values with decreasing gPN values.
3.2.2 Clustering analyses
The new representation of each measurement in the space of the first three principal component reveals different clusters, characteristic of specific scattering behaviour. The clustering k-mean method (Seber, 1984; Spath, 1985) is applied to the reference dataset (flights 19b and 16b) to partition the observations into k clusters to minimize the variance within each cluster (i.e. to minimize the distance between each data point and the centre of the cluster it belongs to). The number of the cluster k is an adjustable parameter. Then, in a first step, each observation is assigned to a specific cluster whose mean has the least squared Euclidean distance (i.e. nearest mean). In a second step, the position of each cluster is set to the mean of all data points belonging to that cluster (i.e. the centroids of each of the k clusters become the new means). These two steps are repeated until convergence is reached when the assignments no longer change.
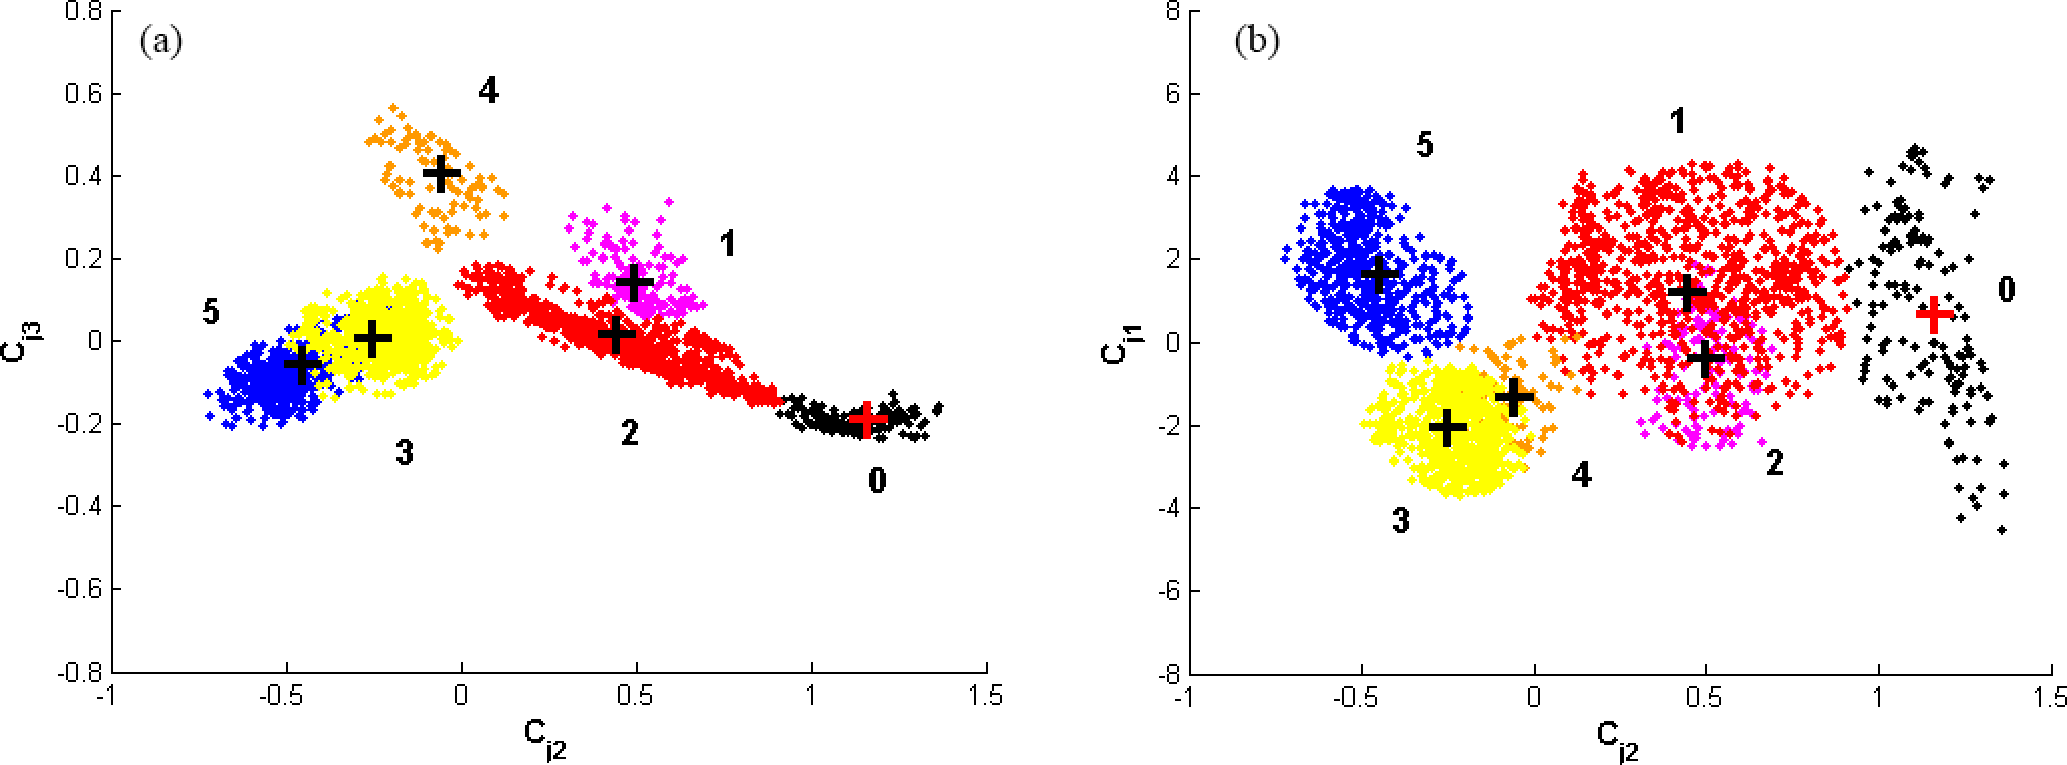
Figure 4Clustering results of the k-mean method applied to the base (flights 16b and 19b). Third versus second principal component for (a), and first versus second principal component for (b). Only data within 10 % of the maximum Mahalanobis distance to the respective cluster's centres have been considered for this analysis.
Sixteen clusters were found to encompass all points of the two flights and to partition each aircraft chasing identified from ATC information (Fig. 3a and b). For clarity and better understanding of the variability in contrail properties, we choose to limit the number of clusters to 6. Nine of the original clusters are merged into two clusters (clusters 3 and 5) presenting similar NO concentrations and optical properties. Four of the original clusters are combined into one new cluster containing the A321/A380 contrails (referred to as cluster 2 hereafter). In addition, only data points within the 10 % of the maximum Mahalanobis distance (De Maesschalck et al., 2000) to the respective cluster's centre are kept for further analysis.
Clusters are defined by their means (or centres), standard deviations (or widths), and cross correlations (or tilts). The Mahalanobis distance is given by the equation
with DM being the Mahalanobis distance between point χ and the ith cluster centre, μi the N-dimensional mean of this cluster, and Si its covariance matrix.
Figure 4 shows the partitioning of the dataset into the six new clusters (clusters 0 to 5). In the following, we use data from chemical tracers and optical measurements and aircraft type information to support and discuss the results of the k-means clustering method.
Clusters 3 and 5 are characterized by very low NO concentrations (Fig. 3c). These cloud events have similar optical properties, in particular a low asymmetry parameter, high side-scattering behaviour, and often supersaturated ambient conditions with respect to ice. According to ATC information, these clusters both contain parts of the measurements in the B767, A343, A346, and CRJ-2 contrails. In addition, the unidentified ice cloud event from flight 16b is fully included in cluster 5. Unpolluted natural cirrus was rarely observed during the CONCERT campaigns (Voigt et al., 2010). Since we have no objective way of discriminating natural cirrus from contrail cirrus region, these clouds are referred to as polluted cirrus, or PC, and cluster 3 is referred to as aged contrails.
Clusters 0, 1, 2, and 4 correspond to higher NO concentrations representative of a significant aircraft exhaust influence. Contrail data for the A380 aircraft are included in clusters 0 and 2 while the ones corresponding to the B777 are assigned to clusters 1 and 4. Pictures from an onboard camera reveal that the data in cluster 0 come mainly from the contrail in the primary wake of the A380.
The contrail and cirrus classification based on ASC measurements appears to be consistent with the independent trace gas measurements. Each cluster represented in Fig. 4 can be linked to a distinct cloud event. Therefore, the combination of flights 16b and 19b can provide a relevant test-bed database to discriminate between contrail properties. Young contrails (spherical ice crystals) are associated with clusters 0, 1, or 2, whereas aged contrails (aspherical ice crystals and high RHI values) with more pristine ice are categorized in clusters 3 and 4. Table 1 summarizes the cluster definitions and names used in this work.
One should keep in mind that some points are still attributed to a particular cluster without strong physical justification.
Table 1Cluster definitions according to ATC information and tracer measurements (NO concentrations and RHI values).
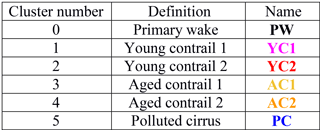
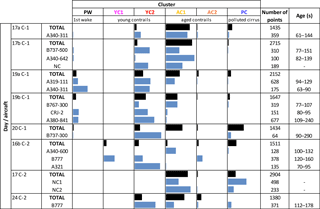
Table 2Classification relative to the six clusters on the Cj2–Cj3 representation of the PCA of all data points for each flight of the two CONCERT campaigns (C-1 in November 2008 and C-2 in September 2011). The legend of the bars represents the relative contribution of data points of individual contrails (blue bars) and also entire flights (black bars) to the six individual clusters.
3.2.3 Merging other CONCERT flights
In this section, we complement the previous analysis with additional cloud optical measurements performed during other CONCERT flights to increase the robustness of the method.
The ASC measured during other flights can be projected in the space of the principal components established with flights 16b and 19b dataset. The coordinates of the data points corresponding to the other flights are calculated from Eq. (4). An example of this data projection is illustrated in Fig. 5, where flight 17a is represented in the Cj2–Cj3 space. Each data point can be attributed to one cluster previously defined by the k-mean clustering method based on the flight 16b and 19b dataset (black points). In other words, the ASC measured during another flight can be merged (projected) into the expansion coefficient diagram displayed in Fig. 3. Data points sharing similar optical properties will be close to each other on such a plot. Figure 5 shows that different contrail phases are observed during flight 17a. Data points are mostly grouped into cluster AC1 but are also present in clusters AC2, YC2, and PW. Finally, cloud data gathered during this flight are mainly categorized as young and aged contrails. We follow this methodology to project and classify each additional contrail event performed during both CONCERT campaigns with minimum Mahalanobis distance (see Eq. 5).
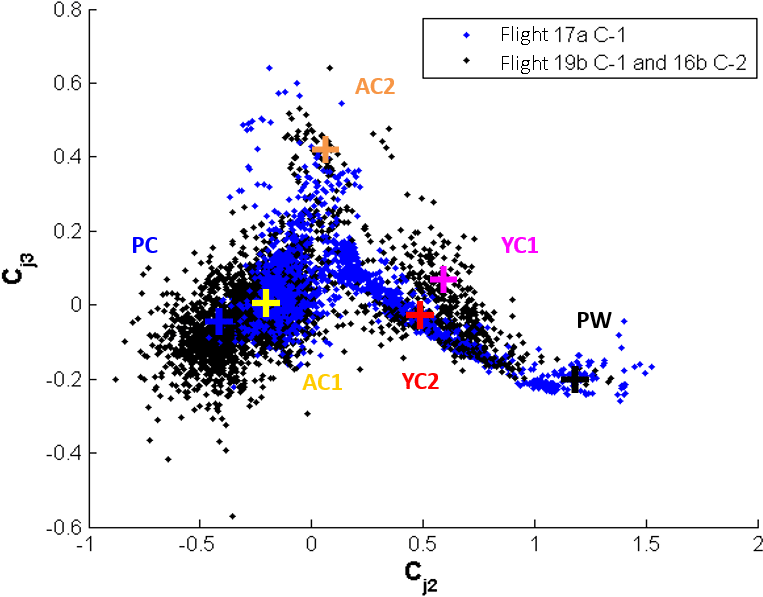
Figure 5Example of data projection in the Cj2–Cj3 space where data from flight 17a (blue data points) are superposed on the data from the benchmark flights 19b and 16b (black data points).
The assignment of the data points to the six clusters shown in the expansion diagrams is summarized in Table 2. Eight flights (six additional flights) representing 4426 ASC measurements were processed. The lengths of the bars in Table 2 represent the distribution of the data points within the different clusters: (a) black bars correspond to the fraction of cloud events within a specific flight (with an extinction coefficient higher than 0.1 km−1), and (b) blue bars represent cases of individual contrails within the flight. Data points with extinction coefficient lower than 0.1 km−1 are not shown in the table. More than 30 % of the data points are located in clusters AC1 and/or PC, meaning that they correspond to aged contrail and sometimes polluted cirrus. Flights clearly performed in well-visible contrails outside cirrus (earlier development stage and/or intensified persistent older contrails) exhibit a significant fraction of data points associated with clusters PW, YC1, and YC2 (young contrails) for both CONCERT-1 and CONCERT-2 campaigns. However, within these flights data points are also gathered in cluster AC1 (aged contrails) and to a lesser extent in cluster AC2 (mostly corresponding to measurements performed during two different B777 contrail chasing events).
These results are in reasonable agreement with previous conclusions (this subsection) drawn for the cluster definitions and associated contrail or ice cloud characteristics. Very young contrails were mostly chased during CONCERT-1 (flights 19a and 19b). Another interesting result is related to flight 17 during CONCERT-2 (flight 17 C-2), where no aircraft information was provided by ATC. Still, ATC data indicate measurements in exhaust plumes, and the Falcon apparently flew in visible contrails (ExtPN > 0.1 km−1) which were probably too old for ATC recognition. Our analysis shows that these data points can mainly be attributed to cluster PC and AC1. This observation suggests that significantly aged contrails were sampled. However, crystal formation and growth processes in contrails and polluted cirrus suggest that very old contrails resemble natural cirrus properties more and more.
ATC information on exhaust plume ages was also collected during each chasing. Some chasings were performed less than 100 s after contrail formation. This is the case for the A340 contrail during flight 19a and for the CRJ-2 contrail during flight 19b of CONCERT-1 and for the A321 contrail during flight 16b of CONCERT-2. One can see that the contrail ages are well correlated to the chosen cluster definitions, revealing that contrail data relative to the A340 are included in cluster PW and YC2 (young contrails) for more than 90 % of the data points and nearly 63 % for the CRJ-2 and 84 % for the A321. According to our cluster classification, only 5 % of the data points gathered during these three flights correspond to aged contrail (clusters AC1 and AC2) categories in contrast to other CONCERT-1 and CONCERT-2 flights (with more than 30 % of data points associated with AC1 and AC2). Even though it is still difficult to associate contrail ages with measurement points, the “contrail age” ranges agree with the cluster definitions.
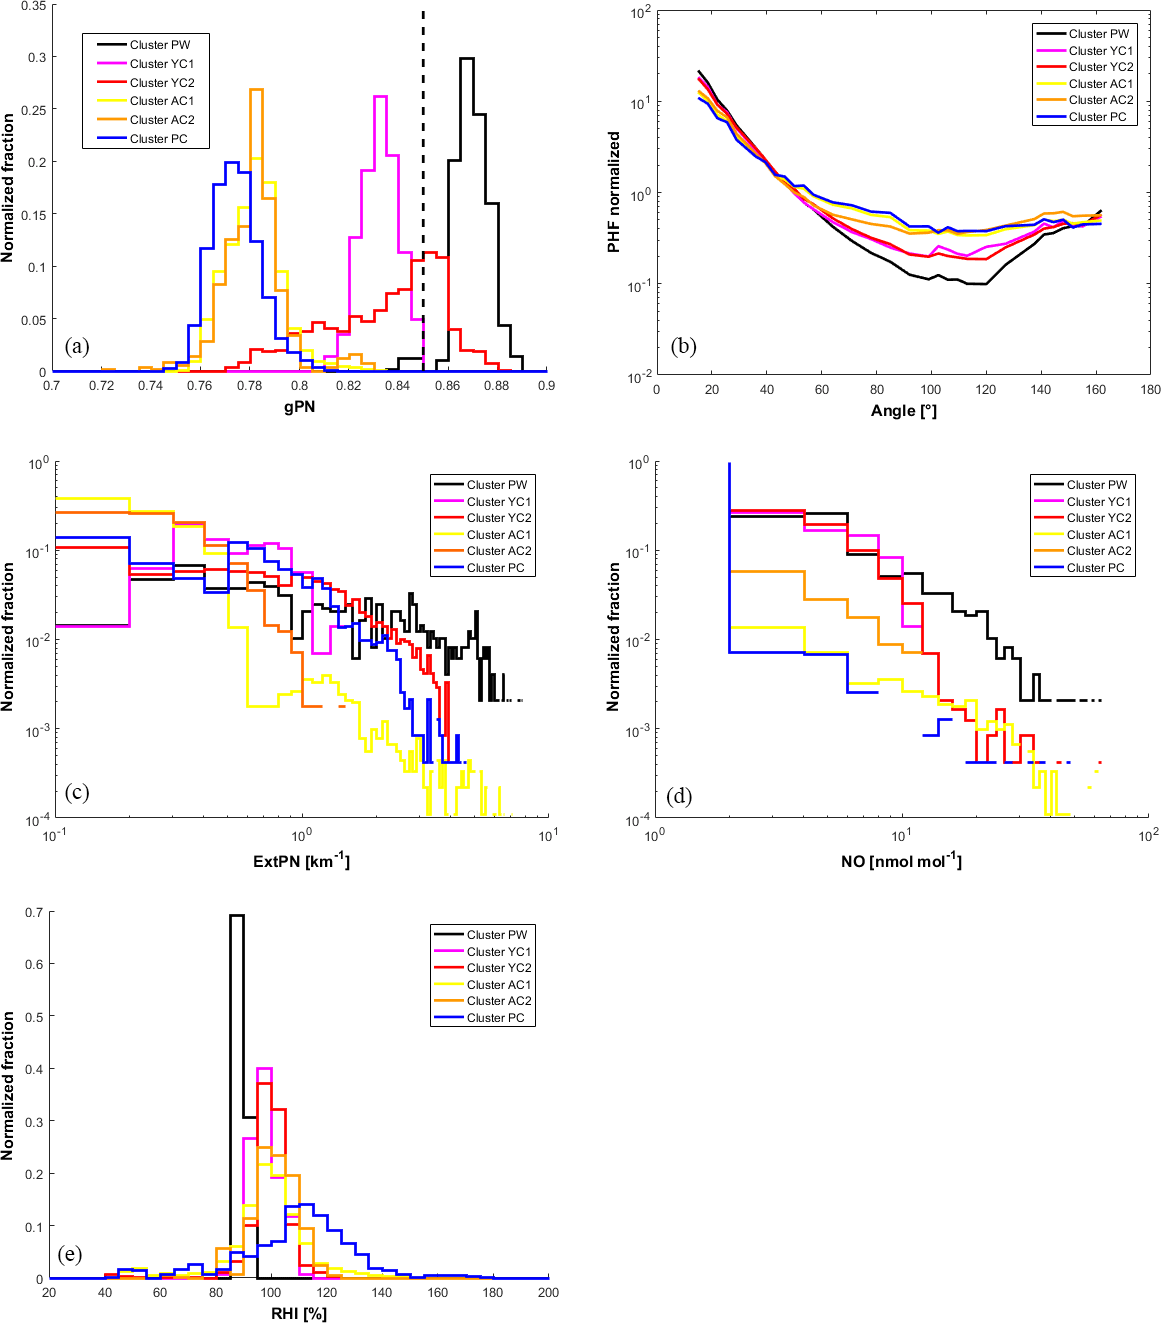
Figure 6Normalized histograms of (a) asymmetry coefficient (dashed line corresponds to a value of 0.85), (b) phase function, (c) extinction retrieved by polar nephelometer, (d) NO concentration for all flights, and (e) RHI conditions for CONCERT-2 flights.
4.1 Optical and chemical cluster properties
In the previous section, we showed that cloud events can be separated according to their light-scattering properties. Six clusters were defined based on two flights having a significant number of data points distributed in each cluster. In this section, we present the mean optical, chemical, and microphysical properties for each cluster. The average properties are calculated for all data points associated with the six individual clusters (all flights, both CONCERT campaigns). Figure 6a, c, and d show the normalized frequency distributions of the asymmetry parameter (gPN), the extinction coefficient (ExtPN), and NO concentrations for the six clusters, respectively. Figure 6b represents the mean normalized scattering-phase functions of each clusters. However, it should be noted that the number of data points could differ significantly from one cluster to another (from 141 measurements for cluster YC1 to 8950 measurements for cluster AC1).
The asymmetry parameter gPN statistics shown in Fig. 6a provide the most striking evidence of the relationship between contrail evolution stage and optical properties. In agreement with findings of Gayet et al. (2012), aged contrails (clusters AC1 and AC2) and polluted cirrus (cluster PC) correspond to gPN values ranging from 0.72 to 0.80. Younger contrails (clusters YC1 and YC2) have gPN values of 0.80 to 0.86. Values of the asymmetry parameter in the primary wake (cluster PW) are typically above 0.86. These features are a consequence of the time evolution of ice crystal shapes from quasi-spherical ice particle after exhaust to non-spherical particle (e.g. column, needle, bullet, and bullet–rosette-type crystals) as the contrail evolves. In the primary wake, the pressure increases in the descending vortex. This leads to adiabatic heating and subsequent sublimation of the ice crystals (Lewellen and Lewellen, 2001; Unterstrasser et al., 2016) that can explain the spherical shapes of ice crystals and thus the high values of the asymmetry coefficients.
Figure 6b shows the normalized phase functions. Primary wake phase functions (cluster PW) are clearly different from the young contrail phase functions (clusters YC1 and YC2), which are themselves different from aged contrails (clusters AC1 and AC2) and polluted cirrus (cluster PC) phase functions. The main difference can be seen in the side-scattering region (50–140∘). This region is sensitive to the ice particle shapes and to the fraction of spherical ice crystals within the contrails. This behaviour is as expected and agrees with the position of clusters PW, YC2, and YC1 on the expansion coefficient diagram (Fig. 2). Indeed, the decrease in the Cj2 coefficient is associated with a side-scattering enhancement. Therefore, very young contrails are composed mainly of spherical ice crystals for which the phase functions indicate a substantial scattering at forward angles and much lower scattering at sideward angles. As the contrails evolve, these features smooth out leading to phase functions with a featureless flat behaviour at side-scattering angles. Finally, the averaged normalized phase functions of aged contrails and polluted cirrus are similar to each other. This also explains that they are difficult to distinguish within the PCA.
Figure 6c presents the extinction coefficient statistics. All the aged contrails (clusters AC1 and AC2) exhibit extinction coefficients lower than 2 km−1. Also, 80 % of the sampled polluted cirrus (cluster PC) show such low extinction coefficients. For younger contrails (clusters YC1 and YC2), the extinction coefficients can reach 5 km−1. Largest extinction coefficients are found in primary wake measurements (cluster PW) with values of up to 8 km−1. Still, the main fraction (more than 50 % of data points) of young contrail data yields extinction coefficients from 0 to 1 km−1.
Concentrations of chemical species can also be used to characterize contrail or cirrus properties. The concentration depends strongly on the type of the tracked aircraft. Figure 6d shows the mean concentration of NO for the six individual clusters. Young contrail NO concentrations (clusters PW, YC1, and YC2) can reach values of up to 10 nmol mol−1 (corresponding to 10 % of measurements). For primary wake measurements (PW in black), a higher concentration can be reached. Approximately 1 % of the data have concentrations close to 60 nmol mol−1 in the primary wake. In contrast, in aged contrails and in polluted cirrus (clusters AC1, AC2, and PC) NO concentrations higher than 2 nmol mol−1 do not exceed 1 % of cases. Indeed, after exhaust, concentrations of NO and SO2 created by combustion reactions decrease rapidly due to the dispersion in the upper troposphere and reactions with other molecules.
Finally, Fig. 6e shows the saturation conditions with respect to ice for all clusters. The median ambient relative humidity of all clusters is near 95 %. Clusters AC1 and PC (yellow and blue lines, respectively) exhibit median RHI values close to 110 and 120 %, respectively. These higher values are suitable for the persistence of the contrail and the formation of cirrus clouds. Supersaturated conditions are not reached for the measurements gathered in the primary wake cluster (PW). Low humidity values may well occur in primary wakes with non-persisting contrails.
These results highlight that the principal component analysis, based on the ASC measurements described in Sect. 3, can be used to discriminate between contrail phases. Specific optical and chemical properties can thus be derived for each contrail phase and can be related to their evolution.
4.2 Microphysical cluster properties
Microphysical properties are assessed using the combination of FSSP-300 and 2DC measurements. The data cover hydrometeor diameters ranging from 0.5 to 800 µm, but with an instrument gap in the size range of 17 to 50 µm. Figure 7 shows the averaged number PSDs for each cluster and for all flights of the study (eight flights from CONCERT-1 and 2). In the instrument gap of the PSD, we use linear interpolation in logarithmic space. Therefore, the derived microphysical properties are to be treated with caution.

Figure 7Number particle size distribution for each cluster including all data points of all flights. FSSP-300 measurements are from 0.5 to 17 µm and 2DC measurements from 50 to 800 µm. The data are linearly interpolated in logarithm space in the gap between 17 m and 50 µm.
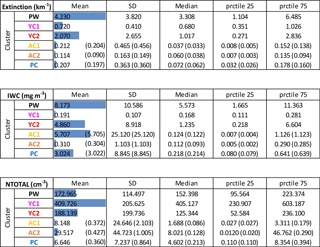
Table 3Optical and microphysical properties for each cluster according to interpolated particle size distributions from FSSP-300 and 2DC measurements. Values in parentheses correspond to number concentrations for sizes larger than 3 µm.
PSD measurements in cirrus and contrails differ significantly depending on ambient air conditions and measurement methods (instrument limitation – Gayet et al., 2002; air speed – Febvre et al., 2009). Previous studies show that a 3 h old contrail cirrus with an effective diameter close to 20 µm (Voigt et al., 2017) and a number concentration larger than 0.1 cm−3 (Schumann et al., 2017) can be composed of ice crystals with sizes of up to 100 µm (blue dashed line, contrail cirrus, Fig. 7). This differs from the PSD of the natural cirrus presented by Voigt et al. (2017) (dashed black line), which has a 1 order of magnitude lower particle number concentration. In natural cirrus at midlatitudes, ice crystals with a size of up to 1600 µm were observed during the ML-CIRRUS campaign (dark dashed line Fig. 7; Voigt et al., 2017).
Figure 7 shows that the mean number PSDs of each cluster are mainly consistent with the cluster definition and previous studies (Schröder et al., 2000; Voigt et al., 2017). Indeed, two categories of PSD can be observed. Within the FSSP-300 size range, PSD relative to old contrails (clusters AC1 and AC2) and polluted cirrus (cluster PC) exhibit a number concentration of small ice particles 1 order of magnitude lower than young contrails (clusters YC1 and YC2) and primary wake (cluster PW). Differences in this size range may reflect uncertainties of the FSSP-300 number concentration measurements. The statistical uncertainty is close to 30 % for typical concentrations of 5 cm−3 but can reach 75 % for concentrations of approximately 0.5 cm−3 (Gayet et al., 2002). However, we can still distinguish primary wake measurements (cluster PW) from secondary wake measurements (clusters YC1 and YC2) in the 3 to 10 µm size range. Differences observed between the PSD of PW, YC1, or YC2 and AC1, AC2, or PC can be explained by the production of small ice crystals (from 1 to 10 µm) in fresh exhaust plumes followed by rapid dilution during subsequent minutes after the exhaust.
Higher concentrations of ice crystals with diameters larger than 100 µm are observed for polluted cirrus (cluster PC) and for well-developed contrails (cluster AC1). The average PSD of the AC1 cluster shows much larger ice concentrations (around 10 times) compared to the YC1 cluster within the 2DC size range.
It is important to note that shattering effects can significantly influence the PSD measurements, especially when particles with diameters greater than 100 µm are present. Polluted cirrus or aged contrail measurements could be subject to such artefacts even though the concentrations of large ice particles were low in the aged contrails and in the polluted cirrus cases during these two campaigns. Shattering effects are likely to be small for the measurements in young contrails.
Table 3 presents IWC (in mg m−3) and total number concentrations of ice crystals (NTOTAL, in cm−3) derived from the measured PSD for each cluster. The extinction coefficient (in km−1) obtained from the PN measurements is also displayed. The aged contrail clusters (AC1 and AC2) and the polluted cirrus cluster (PC) include some data points at temperatures higher than −38 ∘C. These values cannot be contrails and are excluded from this analysis. Ice particles with diameters greater than 3 µm are considered for aged contrails and polluted cirrus to exclude possible contributions from large aerosol particles, as in the earlier studies of Krämer et al. (2009) and Voigt et al. (2017), and these values are shown in parentheses. These results again show that each cluster can be related to a specific contrail phase, and their properties can be compared to previous studies.
In terms of cluster mean values, the microphysical and optical properties of cluster PW agree with the cloud properties expected in the primary wakes. The extinction coefficient has a mean value of 4.23 km−1, IWC is close to 8 mg m−3, and the number concentration yields a typical value of 173 particles cm−3. These properties are in agreement with previous measurement reported by Gayet et al. (2012), with particle number concentrations close to 200 cm−3 for contrails less than 60 s after their formation. Their work also reports an extinction coefficient of around 7 km−1, representing the highest values of the contrail lifetime.
Young (clusters YC1 and YC2) and aged contrails (clusters AC1 and AC2) exhibit distinctive differences in their extinction coefficients and their concentrations of ice particles. Compared to aged contrails, young contrails have higher extinction coefficients and ice number concentrations, with values larger than 0.7 km−1 and 170 cm−3, respectively. Indeed, the averaged extinction and number concentration values of aged contrails do not exceed 0.4 km−1 and 30 cm−3 (0.5 cm−3 for diameters greater than 3 µm), respectively. The ice number concentrations are in agreement with previous results, with values between 200 and 100 cm−3 for contrail ages of between 60 s and 3 min and around 5 cm−3 for contrail ages of around 10 min (Goodman et al., 1998; Lawson et al., 1998; Schröder et al., 2000; Schäuble et al., 2009; Gayet et al., 2012; Voigt et al., 2017). For aged contrails, concentrations of ice particles with sizes greater than 3 µm are below 0.5 cm−3, which agrees with concentrations presented in other contrail studies (close to 1 cm−3 in Lawson et al., 1998; Schumann et al., 2017). Also, aged contrail IWC and extinction coefficient mean values lie between 0.3 and 5.7 mg m−3 and 0.09 and 0.2 km−1, respectively. These values are only weakly sensitive to the cut-off size used (below or above 3 µm) and are in accordance with previous studies where IWC values of up to 10 mg m−3 and an extinction coefficient below 0.5 km−1 were measured (Schröder et al., 2000; Febvre et al., 2009; De León et al., 2012).
Our results also show that differences greater than 5 m mg−3 can be found within young contrail (YC1 and YC2) and aged contrail (AC1 and AC2) clusters. This variability could be attributed to a small number of large particles with a diameter greater than 20 µm in YC1 and AC2 compared to YC2 and AC1 clusters.
Polluted cirrus properties are analysed for ice particles with a size larger than 3 µm. The mean ice particle concentration of 0.36 ± 0.9 cm−3 is in agreement with previous cirrus studies where values are retrieved between 0.5 and 0.005 cm−3 (Heymsfield et al., 2017), and a typical average value of 0.1 cm−3 was found by Voigt et al. (2017). IWC and extinction coefficient values (3.02 mg m−3 and 0.20 km−1, respectively) are significantly higher than the value found in clean cirrus cases (0.055 mg m−3 and 0.023 km−1; Schumann et al., 2017; Atlas and Wang, 2010) but are more consistent with median values reported from Krämer et al. (2016) and Heymsfield et al. (2017) (1.85 mg m−3 for temperatures between −60 and −50 ∘C). Optical and microphysical properties of the polluted cirrus are closer to the ones obtained for aged contrails. As mentioned in Sect. 4.1, cirrus clouds observed during CONCERT campaigns are largely influenced by high-density air traffic over Germany, and it is thus still difficult to separate aged contrails from natural cirrus based on their scattering properties.
In this study, a new form of statistical analysis of contrail to cirrus evolution is presented, based on two intensive contrail measurement campaigns: CONCERT-1 and CONCERT-2. The data are used to study optical and microphysical properties of contrails during their evolution from young contrails to contrail cirrus clouds. The combination of optical, microphysical, and chemical airborne measurements with aircraft chasing information from ATC provides an extended view of cloud properties.
A PCA methodology was applied to the measured polar nephelometer scattering-phase function data to facilitate the division of cloud properties into different contrail phases. The PCA results were derived first for two reference flights that sampled contrails and cirrus in various development stages, including the primary wake, the young secondary wake, old contrails (a few minutes after formation), and polluted cirrus. For these flights, the PCA clearly demonstrates its potential to discriminate between different groups of clouds, justifying the use of these two flights as a benchmark. Thereafter, the scattering-phase functions measured during other CONCERT flights were projected into the space of principal components obtained from the two reference flights. Individual data points were assigned to the predefined cluster with minimum Mahalanobis distances. From the entire dataset, the cloud properties in the various contrail development stages can be analysed separately.
The analysis demonstrates that the clearest separation between clusters is derived from particle shape, which impacts the scattering-phase function and the derived asymmetry parameter gPN. The asymmetry parameter clearly separates young contrails (gPN of 0.72 to 0.80) from contrail or cirrus with gPN ranging from 0.80 to 0.88. Since the exact contrail age was not always known, young and aged contrails are classified also by their optical and chemical properties. The measured NO concentrations are also useful to distinguish cirrus from old contrails. However, no strictly clean cirrus has been observed during these two campaigns due to strong influence from dense air traffic over Germany.
Particle size spectra and mean ice particle number concentration, extinction, and ice water content have been also determined for each cluster. The various clusters clearly show different size distributions. In good agreement with previous findings, we find that young contrails have number concentrations of small ice crystals that greater by more than a factor of 10 (with diameters lower than 20 µm) than aged contrails. On the other hand, aged contrails and polluted cirrus contain larger ice crystals, with diameters larger than 75 µm. The optical and microphysical properties of the aged contrails are often similar to those found in ambient cirrus, which may be polluted cirrus. For polluted cirrus, the agreement with previous cirrus data is better when considering only ice particles with a diameter greater than 3 µm. The results show that the PCA method allows us to identify and discriminate between different contrail growth stages and to provide an independent method for the characterization of the evolution of contrail properties.
In agreement with Shcherbakov et al. (2016), who characterized volcanic and cirrus using optical measurements, the PCA method has been clearly shown here to be suitable for contrail studies. The additional use of microphysical and chemical measurements can be added to the PCA method in order to improve the selection of contrail phases. Different ranges of extinction or asymmetric coefficients could be also used for PCAs in this perspective. However, additional parameters should be carefully selected to limit the bias introduced by the limitations of the probes, and the optimal selection may vary from one measurement campaign to another.
Accurate modelling of cirrus or contrails' single-scattering properties is required for the interpretation of remote-sensing measurements. Therefore, measurements of the optical characteristics of ice crystals in natural conditions are still needed for the validation of numerical techniques and for the determination of free parameters in light-scattering models. In this context, the results from the PCA could be used to develop representative parameterizations of the scattering properties and the ice crystals' shapes and sizes observed in the visible wavelength range.
The data are available through mission-based databases. They can be accessed after signing a data agreement. Data can be accessed via the DLR HALO database: https://halo-db.pa.op.dlr.de/ (last access date: April 2018). Cloud data are available on request by email to o.jourdan@opgc.univ-bpclermont.fr.
AC analysed the PN data with the help of OJ. AS, CG, JFG, CV, HS, SK, SB, SM, AM, TJ, and US collected the data. AC, OJ, and AS designed the research. AC, OJ, AS, CV, and US were involved in the scientific interpretation and discussion. AC wrote the manuscript with help from OJ, AS, CV, and US. All commented on the paper.
The authors declare that they have no conflict of interest.
This article is part of the special issue “ML-CIRRUS – the airborne experiment on natural cirrus and contrail cirrus in mid-latitudes with the high-altitude long-range research aircraft HALO (ACP/AMT inter-journal SI)”. It is not associated with a conference.
We are grateful for financial support by the Helmholtz Association under contract
VH-NG-309 and W2/W3-60. Part of this work was funded by DFG SPP HALO 1294
contract VO1504/4-1 and by the DLR project Eco2Fly in the ML-CIRRUS-cirrus
special issue. We thank Lufthansa, the DLR flight department, and the Deutsche
Flugsicherung for excellent support during the campaign.
Edited by: Darrel
Baumgardner
Reviewed by: two anonymous referees
Atlas, D. and Wang, Z.: Contrails of Small and Very Large Optical Depth, J. Atmos. Sci., 67, 3065–3073, https://doi.org/10.1175/2010JAS3403.1, 2010.
Baran, A. J., Gayet, J.-F., and Shcherbakov, V.: On the interpretation of an unusual in-situ measured ice crystal scattering phase function, Atmos. Chem. Phys., 12, 9355–9364, https://doi.org/10.5194/acp-12-9355-2012, 2012.
Baumgardner, D. and Gandrud, B. E.: A comparison of the microphysical and optical properties of particles in an aircraft contrail and mountain wave cloud, Geophys. Res. Lett., 25, 1129–1132, https://doi.org/10.1029/98GL00035, 1998.
Baumgardner, D., Dye, J. E., Gandrud, B. W., and Knollenberg, R. G.: Interpretation of measurements made by the forward scattering spectrometer probe (FSSP-300) during the Airborne Arctic Stratospheric Expedition, J. Geophys. Res., 97, 8035–8046, 1992.
Borrmann, S., Luo, B., and Mishchenko, M.: Application of the T-Matrix Method to the Measurement of Aspherical (Ellipsoidal) Particles with Forward Scattering Optical Particle Counters, J. Aerosol Sci., 31, 789–799, 2000.
Burkhardt, U. and Kärcher, B.: Global radiative forcing from contrail cirrus, Nat. Clim. Change, 1, 54–58, 2011.
Carleton, A. M., Silva, A. D., Aghazarian, M. S., Bernhardt, J., Travis, D. J., and Allard, J.: Mid-season climate diagnostics of jet contrail “outbreaks” and implications for eastern US sky-cover trends, Clim. Res., 56, 209–230, 2013.
Chen, C.-C. and Gettelman, A.: Simulated 2050 aviation radiative forcing from contrails and aerosols, Atmos. Chem. Phys., 16, 7317–7333, https://doi.org/10.5194/acp-16-7317-2016, 2016.
De León, R. R., Krämer, M., Lee, D. S., and Thelen, J. C.: Sensitivity of radiative properties of persistent contrails to the ice water path, Atmos. Chem. Phys., 12, 7893–7901, https://doi.org/10.5194/acp-12-7893-2012, 2012.
De Maesschalck, R., Jouan-Rimbaud, D., and Massart, D.L.: The Mahalanobis Distance, Chemometr. Intell. Lab., 50, 1–18, https://doi.org/10.1016/S0169-7439(99)00047-7, 2010.
Duda, D. P., Minnis, P., Khlopenkov, K., Chee, T. L., and Boeke, R.: Estimation of 2006 Northern Hemisphere Contrail Coverage Using MODIS Data, Geophys. Res. Lett., 40, 612–617, https://doi.org/10.1002/grl.50097, 2013.
Febvre, G., Gayet, J.-F., Minikin, A., Schlager, H., Shcherbakov, V., Jourdan, O., Busen, R., Fiebig, M., Kärcher, B., and Schumann, U.: On optical and microphysical characteristics of contrails and cirrus, J. Geophys. Res.-Atmos., 114, D02204, https://doi.org/10.1029/2008JD010184, 2009.
Frömming, C., Ponater, M., Dahlmann, K., Grewe, V., Lee, D. S., and Sausen, R.: Aviation-induced radiative forcing and surface temperature change in dependency of the emission altitude, J. Geophys. Res.-Atmos., 117, D19104, https://doi.org/10.1029/2012JD018204, 2012.
Gayet, J. F., Crépel, O., Fournol, J. F., and Oshchepkov, S.: A new airborne polar Nephelometer for the measurements of optical and microphysical cloud properties. Part I: Theoretical design, Ann. Geophys., 15, 451–459, https://doi.org/10.1007/s00585-997-0451-1, 1997.
Gayet, J.-F., Auriol, F., Minikin, A., Ström, J., Seifert, M., Krejci, R., Petzold, A., Febvre, G., and Schumann, U.: Quantitative Measurement of the Microphysical and Optical Properties of Cirrus Clouds with Four Different in Situ Probes: Evidence of Small Ice Crystals, Geophys. Res. Lett., 29, 2230, https://doi.org/10.1029/2001GL014342, 2002.
Gayet, J.-F., Ovarlez J., Shcherbakov, V., Ström, J., Schumann, U., Minikin, A., Auriol, F., Petzold, A., and Monier, M.: Cirrus Cloud Microphysical and Optical Properties at Southern and Northern Midlatitudes during the INCA Experiment, J. Geophys. Res.-Atmos., 109, D20206, https://doi.org/10.1029/2004JD004803, 2004.
Gayet, J.-F., Shcherbakov, V., Voigt, C., Schumann, U., Schäuble, D., Jessberger, P., Petzold, A., Minikin, A., Schlager, H., Dubovik, O., and Lapyonok, T.: The evolution of microphysical and optical properties of an A380 contrail in the vortex phase, Atmos. Chem. Phys., 12, 6629–6643, https://doi.org/10.5194/acp-12-6629-2012, 2012.
Garrett, T. J., Gerber, H., Baumgardner, D. G., Twohy, C. H., and Weinstock, E. M.: Small, highly reflective ice crystals in low-latitude cirrus, Geophys. Res. Lett., 30, 2132, https://doi.org/10.1029/2003GL018153, 2003.
Gettelman, A. and Chen, C.: The climate impact of aviation aerosols, Geophys. Res. Lett., 40, 2785–2789, https://doi.org/10.1002/grl.50520, 2013.
Gierens, K. and Dilger, F.: A climatology of formation conditions for aerodynamic contrails, Atmos. Chem. Phys., 13, 10847–10857, https://doi.org/10.5194/acp-13-10847-2013, 2013.
Goodman, J., Pueschel, R. F., Jensen, E. J., Verma, S., Ferry, G. V., Howard, S. D., Kinne, S. A., and Baumgardner, D.: Shape and size of contrails ice particles, Geophys. Res. Lett., 25, 1327–1330, 1998.
Graf, K., Schumann, U., Mannstein, H., and Mayer, B.: Aviation induced diurnal North Atlantic cirrus cover cycle, Geophys. Res. Lett., 39, L16804, https://doi.org/10.1029/2012GL052590, 2012.
Heller, R., Voigt, C., Beaton, S., Dörnbrack, A., Giez, A., Kaufmann, S., Mallaun, C., Schlager, H., Wagner, J., Young, K., and Rapp, M.: Mountain waves modulate the water vapor distribution in the UTLS, Atmos. Chem. Phys., 17, 14853–14869, https://doi.org/10.5194/acp-17-14853-2017, 2017.
Heymsfield, A. J. and Parrish, J. L.: A computational technique for increasing the effective sampling volume of the PMS two-dimensional particle size spectrometer, J. Appl. Meteorol., 17, 1566–1572, 1978.
Heymsfield, A. J., Lawson, R. P., and Sachse, G. W.: Growth of ice crystals in a precipitating contrail, Geophys. Res. Lett., 25, 1335–1338, https://doi.org/10.1029/98GL00189, 1998.
Heymsfield, A. J., Baumgardner, D., DeMott, P., Forster, P., Gierens, K., and Kärcher, B.: Contrail Microphysics, B. Am. Meteorol. Soc., 91, 465–472, 2010.
Heymsfield, A. J., Krämer, M., Luebke, A., Brown, P., Cziczo, D. J., Franklin, C., Lawson, P., Lohmann, U., McFarquhar, G., Ulanowski, Z., and Van Tricht, K.: Cirrus Clouds, Meteor. Mon., 58, 2.1–2.26, https://doi.org/10.1175/AMSMONOGRAPHS-D-16-0010.1, 2017.
IPCC: Aviation and the Global Atmosphere – A Special Report of IPCC Working Groups I and III, edited by: Penner, J. E., Lister, D. H., Griggs, D. J., Dokken, D. J., and McFarland, M., Cambridge Univ. Press, Cambridge, UK, 1999.
Irvine, E. A., Hoskins, B. J., and Shine, K. P.: The dependence of contrail formation on the weather pattern and altitude in the North Atlantic, Geophys. Res. Lett., 39, L12802, https://doi.org/10.1029/2012GL051909, 2012.
Jansen, J. and Heymsfield, A. J.: Microphysics of aerodynamic contrail formation processes, J. Atmos. Sci., 72, 3293–3308, 2015.
Järvinen, E., Schnaiter, M., Mioche, G., Jourdan, O., Shcherbakov, V. N., Costa, A., Afchine, A., Krämer, M., Heidelberg, F., Jurkat, T., Voigt, C., Schlager, H., Nichman, L., Gallagher, M., Hirst, E., Schmitt, C., Bansemer, A., Heymsfield, A., Lawson, P., Tricoli, U., Pfeilsticker, K., Vochezer, P., Möhler, O., and Leisner, T.: Quasi-spherical Ice in Convective Clouds, J. Atmos. Sci., 73, 3885–3910, https://doi.org/10.1175/JAS-D-15-0365.1, 2016.
Jeßberger, P., Voigt, C., Schumann, U., Sölch, I., Schlager, H., Kaufmann, S., Petzold, A., Schäuble, D., and Gayet, J.-F.: Aircraft type influence on contrail properties, Atmos. Chem. Phys., 13, 11965–11984, https://doi.org/10.5194/acp-13-11965-2013, 2013.
Jourdan, O., Oshchepkov, S., Gayet, J.-F., Shcherbakov, V., and Isaka, H.: Statistical analysis of cloud light scattering and microphysical properties obtained from airborne measurements, J. Geophys. Res., 108, 4155, https://doi.org/10.1029/2002JD002723, 2003.
Jourdan, O., Mioche, G., Garrett, T. J., Schwarzenböck, A., Vidot, J., Xie, Y., Shcherbakov, V., Yang, P., and Gayet, J.-F.: Coupling of the microphysical and optical properties of an Arctic nimbostratus cloud during the ASTAR 2004 experiment: Implications for light-scattering modeling, J. Geophys. Res.-Atmos., 115, D23206, https://doi.org/10.1029/2010JD014016, 2010.
Jurkat, T., Voigt, C., Arnold, F., Schlager, H., Aufmhoff, H., Schmale, J., Schneider, J., Lichtenstern, M., and Dörnbrack, A.: Airborne stratospheric ITCIMS-measurements of SO2, HCl, and HNO3 in the aged plume of volcano Kasatochi, J. Geophys. Res., 115, D00L17, https://doi.org/10.1029/2010JD013890, 2010.
Jurkat, T., Voigt, C., Arnold, F., Schlager, H., Kleffmann, J., Aufmhoff, H., Schäuble, D., Schäfer, M., and Schumann, U.: Measurements of HONO, NO, NOy and SO2 in aircraft exhaust plumes at cruise, Geophys. Res. Lett., 38, L10807, https://doi.org/10.1029/2011GL046884, 2011.
Jurkat, T., Kaufmann, S., Voigt, C., Schäuble, D., Jeßberger, P., and Ziereis, H.: The airborne mass spectrometer AIMS – Part 2: Measurements of trace gases with stratospheric or tropospheric origin in the UTLS, Atmos. Meas. Tech., 9, 1907–1923, https://doi.org/10.5194/amt-9-1907-2016, 2016.
Kärcher, B. and Voigt, C.: Formation of nitric acid/water ice particles in cirrus clouds, Geophys. Res. Lett., 33, L08806, https://doi.org/10.1029/2006GL025927, 2006.
Kärcher, B. and Voigt, C.: Susceptibility of contrail ice crystal numbers to aircraft soot particle emissions, Geophys. Res. Lett., 44, 8037–8046, https://doi.org/10.1002/2017GL074949, 2017.
Kärcher, B. and Yu, F.: Role of aircraft soot emissions in contrail formation, Geophys. Res. Lett., 36, L01804, https://doi.org/10.1029/2008GL036649, 2009.
Kaufmann, S., Voigt, C., Jeßberger, P., Jurkat, T., Schlager, H., Schwarzenboeck, A., Klingebiel, M., and Thornberry, T.: In situ measurements of ice saturation in young contrails, Geophys. Res. Lett., 41, 702–709, https://doi.org/10.1002/2013GL058276, 2014.
Kaufmann, S., Voigt, C., Jurkat, T., Thornberry, T., Fahey, D. W., Gao, R.-S., Schlage, R., Schäuble, D., and Zöger, M.: The airborne mass spectrometer AIMS – Part 1: AIMS-H2O for UTLS water vapor measurements, Atmos. Meas. Tech., 9, 939–953, https://doi.org/10.5194/amt-9-939-2016, 2016.
Krämer, M., Schiller, C., Afchine, A., Bauer, R., Gensch, I., Mangold, A., Schlicht, S., Spelten, N., Sitnikov, N., Borrmann, S., de Reus, M., and Spichtinger, P.: Ice supersaturations and cirrus cloud crystal numbers, Atmos. Chem. Phys., 9, 3505–3522, https://doi.org/10.5194/acp-9-3505-2009, 2009.
Krämer, M., Rolf, C., Luebke, A., Afchine, A., Spelten, N., Costa, A., Meyer, J., Zöger, M., Smith, J., Herman, R. L., Buchholz, B., Ebert, V., Baumgardner, D., Borrmann, S., Klingebiel, M., and Avallone, L.: A microphysics guide to cirrus clouds – Part 1: Cirrus types, Atmos. Chem. Phys., 16, 3463–3483, https://doi.org/10.5194/acp-16-3463-2016, 2016.
Kübbeler, M., Hildebrandt, M., Meyer, J., Schiller, C., Hamburger, Th., Jurkat, T., Minikin, A., Petzold, A., Rautenhaus, M., Schlager, H., Schumann, U., Voigt, C., Spichtinger, P., Gayet, J.-F., Gourbeyre, C., and Krämer, M.: Thin and subvisible cirrus and contrails in a subsaturated environment, Atmos. Chem. Phys., 11, 5853–5865, https://doi.org/10.5194/acp-11-5853-2011, 2011.
Lawson, R. P., Heymsfield, A. J., Aulenbach, S. M., and Jensen, T. L.: Shapes, sizes and light scattering properties of ice crystals in cirrus and a persistent contrail during SUCCESS, Geophys. Res. Lett., 25, 1331–1334, 1998.
Lawson, R. P., O'Connor, D., Zmarzly, P., Weaver, K., Baker, B., Mo, Q., and Jonsson, H.: The 2D-S (stereo) probe: Design and preliminary tests of a new airborne, high-speed, high-resolution particle imaging probe, J. Atmos. Ocean. Tech., 23, 1462–1477, 2006.
Lee, D. S., Pitari, G., Grewe, V., Gierens, K., Penner, J. E., Petzold, A., Prather, M. J., Schumann, U., Bais, A., and Berntsen, T.: Transport impacts on atmosphere and climate: Aviation, Atmos. Environ., 44, 4678–4734, 2010.
Legendre, P. and Legendre, L.: Numerical Ecology, 2nd English Edn., 853 pp., Elsevier Science, New York, 1998.
Lewellen, D. C.: Analytic solutions for evolving size distributions of spherical crystals or droplets undergoing diffusional growth in different regimes, J. Atmos. Sci., 69, 417–434, 2012.
Lewellen, D. C. and Lewellen, W. S.: The effects of aircraft wake dynamics on contrail development, J. Atmos. Sci., 58, 390–406, 2001.
Liou, K. N., Takano, Y., Yue, Q., and Yang, P.: On the radiative forcing of contrail cirrus contaminated by black carbon, Geophys. Res. Lett., 40, 778–784, https://doi.org/10.1002/grl.50110, 2013.
Meyer, J., Rolf, C., Schiller, C., Rohs, S., Spelten, N., Afchine, A., Zöger, M., Sitnikov, N., Thornberry, T. D., Rollins, A. W., Bozóki, Z., Tátrai, D., Ebert, V., Kühnreich, B., Mackrodt, P., Möhler, O., Saathoff, H., Rosenlof, K. H., and Krämer, M.: Two decades of water vapor measurements with the FISH fluorescence hygrometer: a review, Atmos. Chem. Phys., 15, 8521–8538, https://doi.org/10.5194/acp-15-8521-2015, 2015.
Mishchenko, M. I., Travis, L. D., Kahn, R. A., and West, R. A.: Modeling phase functions for dustlike tropospheric aerosols using a shape mixture of randomly oriented polydisperse spheroids, J. Geophys. Res., 102, 16831–16847, 1997.
Moore, R. H., Thornhill, K. L., Weinzierl, B., Sauer, D., D'Ascoli, E., Kim, J., Lichtenstern, M., Scheibe, M., Beaton, B., Beyersdorf, A. J., Barrick, J., Bulzan, D., Corr, C. A., Crosbie, E., Jurkat, T., Martin, R., Riddick, D., Shook, M., Slover, G., Voigt, C., White, R., Winstead, E., Yasky, R., Ziemba, L. D., Brown, A., Schlager, H., and Anderson, B. E.: Biofuel blending reduces particle emissions from aircraft engines at cruise conditions, Nature, 543, 411–415, https://doi.org/10.1038/nature21420, 2017.
Petzold, A., Busen, R., Schröder, F. P., Baumann, R., Kuhn, M., Ström, J., Hagen, D. E., Whitefield, P. D., Baumgardner, D., and Arnold, F.: Near-field measurements on contrail properties from fuels with different sulfur content, J. Geophys. Res.-Atmos., 102, 29867–29880, 1997.
Poellot, M. R., Arnott, W. P., and Hallett, J.: In situ observations of contrail microphysics and implications for their radiative impact, J. Geophys. Res.-Atmos., 104, 12077–12084, 1999.
Schäuble, D., Voigt, C., Kärcher, B., Stock, P., Schlager, H., Krämer, M., Schiller, C., Bauer, R., Spelten, N., de Reus, M., Szakáll, M., Borrmann, S., Weers, U., and Peter, Th.: Airborne measurements of the nitric acid partitioning in persistent contrails, Atmos. Chem. Phys., 9, 8189–8197, https://doi.org/10.5194/acp-9-8189-2009, 2009.
Schlager, H., Konopka, P., Schulte, P., Schumann, U., Ziereis, H., Arnold, F., Klemm, M., Hagen, D. E., Whitefield, P. D., and Ovarlez, J.: In situ observations of air traffic emission signatures in the North Atlantic flight corridor, J. Geophys. Res., 102, 10739–10750, 1997.
Schröder, F., Kärcher, B., Duroure, C., Ström, J., Petzold, A., Gayet, J.-F., Strauss, B., Wendling, P., and Borrmann, S.: On the Transition of Contrails into Cirrus Clouds, J. Atmos. Sci., 57, 464–480, 2000.
Schumann, U.: On conditions for contrail formation from aircraft exhausts, Meteorol. Z., 5, 4–23, 1996.
Schumann, U. and Heymsfield, A.: On the lifecycle of individual contrails and contrail cirrus, Meteor. Mon., 58, 3.1–3.24, https://doi.org/10.1175/AMSMONOGRAPHS-D-16-0005.1, 2017.
Schumann, U., Mayer, B., Gierens, K., Unterstrasser, S., Jessberger, P., Petzold, A., Voigt, C., and Gayet, J.-F.: Effective Radius of Ice Particles in Cirrus and Contrails, J. Atmos. Sci., 68, 300–321, 2011.
Schumann, U., Jeßberger, P., and Voigt, C.: Contrail ice particles in aircraft wakes and their climatic importance, Geophys. Res. Lett., 40, 2867–2872, https://doi.org/10.1002/grl.50539, 2013.
Schumann, U., Penner, J. E., Chen, Y., Zhou, C., and Graf, K.: Dehydration effects from contrails in a coupled contrail–climate model, Atmos. Chem. Phys., 15, 11179–11199, https://doi.org/10.5194/acp-15-11179-2015, 2015.
Schumann, U., Kiemle, C., Schlager, H., Weigel, R., Borrmann, S., D'Amato, F., Krämer, M., Matthey, R., Protat, A., Voigt, C., and Volk, C. M.: Long-lived contrails and convective cirrus above the tropical tropopause, Atmos. Chem. Phys., 17, 2311–2346, https://doi.org/10.5194/acp-17-2311-2017, 2017a.
Schumann, U., Baumann, R., Baumgardner, D., Bedka, S. T., Duda, D. P., Freudenthaler, V., Gayet, J.-F., Heymsfield, A. J., Minnis, P., Quante, M., Raschke, E., Schlager, H., Vázquez-Navarro, M., Voigt, C., and Wang, Z.: Properties of individual contrails: a compilation of observations and some comparisons, Atmos. Chem. Phys., 17, 403–438, https://doi.org/10.5194/acp-17-403-2017, 2017b.
Seber, G. A. F.: Multivariate analysis of variance and covariance, Multivariate observations, 433–495, 1984.
Shcherbakov, V., Jourdan, O., Voigt, C., Gayet, J.-F., Chauvigne, A., Schwarzenboeck, A., Minikin, A., Klingebiel, M., Weigel, R., Borrmann, S., Jurkat, T., Kaufmann, S., Schlage, R., Gourbeyre, C., Febvre, G., Lapyonok, T., Frey, W., Molleker, S., and Weinzierl, B.: Porous aerosol in degassing plumes of Mt. Etna and Mt. Stromboli, Atmos. Chem. Phys., 16, 11883–11897, https://doi.org/10.5194/acp-16-11883-2016, 2016.
Spangenberg, D. A., Minnis, P., Bedka, S. T., Palikonda, R., Duda, D. P., and Rose, F. G.: Contrail radiative forcing over the Northern Hemisphere from 2006 Aqua MODIS data, Geophys. Res. Lett., 40, 595–600, https://doi.org/10.1002/grl.50168, 2013.
Spath, H.: The Cluster Dissection and Analysis Theory FORTRAN Programs Examples, Prentice-Hall, Inc., Upper Saddle River, NJ, USA, 1985.
Sussmann, R. and Gierens, K. M.: Lidar and numerical studies on the different evolution of vortex pair and secondary wake in young contrails, J. Geophys. Res.-Atmos., 104, 2131–2142, 1999.
Sussmann, R. and Gierens, K. M.: Differences in early contrail evolution of two-engine versus four-engine aircraft: Lidar measurements and numerical simulations, J. Geophys. Res.-Atmos., 106, 4899–4911, 2001.
Unterstrasser, S., Gierens, K., and Spichtinger, P.: The evolution of contrail microphysics in the vortex phase, Meteorol. Z., 17, 145–156, 2008.
Unterstrasser, S., Gierens, K., Sölch, I., and Lainer, M.: Numerical simulations of homogeneously nucleated natural cirrus and contrail-cirrus. Part 1: How different are they?, Meteorol. Z., 26, 1–22, 2016.
Vázquez-Navarro, M., Mannstein, H., and Kox, S.: Contrail life cycle and properties from 1 year of MSG/SEVIRI rapid-scan images, Atmos. Chem. Phys., 15, 8739–8749, https://doi.org/10.5194/acp-15-8739-2015, 2015.
Voigt, C., Schlager, H., Ziereis, H., Kärcher, B., Luo, B. P., Schiller, C., Krämer, M., Popp, P. J., Irie, H., and Kondo, Y.: Nitric acid in cirrus clouds, Geophys. Res. Lett., 33, L05803, https://doi.org/10.1029/2005GL025159, 2006.
Voigt, C., Schumann, U., Jurkat, T., Schäuble, D., Schlager, H., Petzold, A., Gayet, J.-F., Krämer, M., Schneider, J., Borrmann, S., Schmale, J., Jessberger, P., Hamburger, T., Lichtenstern, M., Scheibe, M., Gourbeyre, C., Meyer, J., Kübbeler, M., Frey, W., Kalesse, H., Butler, T., Lawrence, M. G., Holzäpfel, F., Arnold, F., Wendisch, M., Döpelheuer, A., Gottschaldt, K., Baumann, R., Zöger, M., Sölch, I., Rautenhaus, M., and Dörnbrack, A.: In-situ observations of young contrails – overview and selected results from the CONCERT campaign, Atmos. Chem. Phys., 10, 9039–9056, https://doi.org/10.5194/acp-10-9039-2010, 2010.
Voigt, C., Schumann, U., Jessberger, P., Jurkat, T., Petzold, A., Gayet, J.-F., Krämer, M., Thornberry, T., and Fahey, D.: Extinction and optical depth of contrails, Geophys. Res. Lett., 38, L11806, https://doi.org/10.1029/2011GL047189, 2011.
Voigt, C., Jessberger, P., Jurkat, T., Kaufmann, S., Baumann, R., Schlager, H., Bobrowski, N., Giuffrida, G., and Salerno, G.: Evolution of CO2, SO2, HCl, and HNO3 in the Volcanic Plumes from Etna, Geophys. Res. Lett., 41, 2196–2203, https://doi.org/10.1002/2013GL058974, 2014.
Voigt, C., Schumann, U., Minikin, A., Abdelmonem, A., Afchine, A., Borrmann, S., Boettcher, M., Buchholz, B., Bugliaro, L., Costa, A., Curtius, J., Dollner, M., Dörnbrack, A., Dreiling, V., Ebert, V., Ehrlich, A., Fix, A., Forster, L., Frank, F., Fütterer, D., Giez, A., Graf, K., Grooß, J.-U., Groß, S., Heimerl, K., Heinold, B., Hüneke, T., Järvinen, E., Jurkat, T., Kaufmann, S., Kenntner, M., Klingebiel, M., Klimach, T., Kohl, R., Krämer, M., Krisna, T. C., Luebke, A., Mayer, B., Mertes, S., Molleker, S., Petzold, A., Pfeilsticker, K., Port, M., Rapp, M., Reutter, P., Rolf, C., Rose, D., Sauer, D., Schäfler, A., Schlage, R., Schnaiter, M., Schneider, J., Spelten, N., Spichtinger, P., Stock, P., Walser, A., Weigel, R., Weinzierl, B., Wendisch, M., Werner, F., Wernli, H., Wirth, M., Zahn, A., Ziereis, H., and Zöger, M.: ML-CIRRUS – The airborne experiment on natural cirrus and contrail cirrus with the high-altitude long-range research aircraft HALO, B. Am. Meteorol. Soc., 98, 271–288, https://doi.org/10.1175/BAMS-D-15-00213.1, 2017.
Xie, Y., Yang, P., Gao, B.-C., Kattawar, G. W., and Mishchenko, M. I.: Effect of ice crystal shape and effective size on snow bidirectional reflectance, J. Quant. Spectrosc. Ra., 100, 457–469, 2006.
Xie, Y., Yang, P., Kattawar, G. W., Minnis, P., and Hu, Y. X.: Effect of the inhomogeneity of ice crystals on retrieving ice cloud optical thickness and effective particle size, J. Geophys. Res.-Atmos., 114, D11203, https://doi.org/10.1029/2008JD011216, 2009.
Yang, P., Hong, G., Dessler, A. E., Ou, S. S., Liou, K.-N., and Minnis, P.: Contrails and induced cirrus: Optics and radiation, B. Am. Meteor. Soc., 91, 473–478, 2010.
Ziereis, H., Schlager, H., Schulte, P., van Velthoven, P., and Slemr, F.: Distributions of NO, NOx, and NOy in the upper troposphere and lower stratosphere between 28 and 61 N during POLINAT 2, J. Geophys. Res.-Atmos., 105, 3653–3664, 2000.
Zöger, M., Afchine, A., Eicke, N., Gerhards, M.-T., Klein, E., McKenna, D. S., Mörschel, U., Schmidt, U., Tan, V., Tuitjer, F., Woyke, T., and Schiller, C.: Fast in situ stratospheric hygrometers: A new family of balloon-borne and airborne Lyman alpha photofragment fluorescence hygrometers, J. Geophys. Res.-Atmos., 104, 1807–1816, 1999.