the Creative Commons Attribution 4.0 License.
the Creative Commons Attribution 4.0 License.
 | 06 Jul 2018
Characteristics of marine shipping emissions at berth: profiles for particulate matter and volatile organic compounds
Qian Xiao
Mei Li
Mingliang Fu
Fanyuan Deng
Zhaofeng Lv
Hanyang Man
Xinxin Jin
Shuai Liu
Kebin He
Emissions from ships at berth play an important role regarding the exposure of high density human populations to atmospheric pollutants in port areas; however, these emissions are not well understood. In this study, volatile organic compounds (VOCs) and particle emissions from 20 container ships at berth were sampled and analyzed during the “fuel switch” period at Jingtang Port in Hebei Province, China. VOCs and particles were analyzed using a gas chromatography-mass spectrometer (GC-MS) and a single particle aerosol mass spectrometer (SPAMS), respectively. VOC analysis showed that alkanes and aromatics, especially benzene, toluene and heavier compounds e.g., n-heptane, n-octane and n-nonane, dominated the total identified species. Secondary organic aerosol (SOA) yields and ozone (O3) forming potential were 0.017 ± 0.007 g SOA g−1 VOCs and 2.63 ± 0.37 g O3 g−1 VOCs, respectively. Both positive and negative ion mass spectra from individual ships were derived and the intensity of specific ions were quantified. Results showed that elemental carbon (35.74 %), elemental carbon–organic carbon mixtures (33.95 %) and Na-rich particles (21.12 %) were major classes, comprising 90.7 % of the particles observed. Particles from ship auxiliary engines were in the 0.2 to 2.5 µm size range, with a peak occurring at around 0.4 µm. The issue of using vanadium (V) as tracer element was examined, and it was found that V was not a proper tracer of ship emissions when using low sulfur content diesel oil. The average percentage of sulfate particles observed in shipping emissions before and after switching to marine diesel oil remained unchanged at 24 %. Under certain wind conditions, when berths were upwind of emission sources, the ratios before and after 1 January were 35 and 27 % respectively. The impact of atmospheric stability was discussed based on PM2.5 and primary pollutant (carbon monoxide) concentration. With a background of frequent haze episodes and complex mechanisms of particulate accumulation and secondary formation, the impact of atmospheric stability is believed to have been weak on the sulfate contribution from shipping emissions. The results from this study provide robust support for port area air quality assessment and source apportionment.


The emission of numerous pollutants and greenhouse gases such as NOx, SO2, particulate matter (PM) and CO2 from ocean-going ships is a significant source of global air pollution (Eyring et al., 2010; Corbett et al., 1999), the impacts of which are seen on a global scale. Along with the effects of these emissions on air quality (Vutukuru and Dabdub, 2008) and climate change, human health impacts have also been revealed and researched by a number of recent studies (Andersson et al., 2009; Corbett et al., 2007). Approximately 60 000 cases of death due to cancer and cardiovascular diseases have been associated with ship exhaust worldwide (Tian et al., 2013). In East Asia, where 8 of the world's top 10 container ports are located, ship emissions are accused of causing the premature death of between 14 500 and 37 500 people in 2013, almost double the number reported for 2005 (Liu et al., 2016).
Emission characteristics, including the size distribution of particles, the chemical compositions of particles and the presence of volatile organic compounds (VOCs) are of particular importance to understanding the climate and health impacts of shipping. Numerous studies on emission factors and chemical characteristics have been conducted throughout the world. In terms of research focused on gaseous pollutants and PM emission factors in China, CO, HC, NOx and PM emission factors were tested during maneuvering and cruising conditions using a portable emission measurement system on seven in-use ships (four container ships included); this illustrated the nucleation and accumulation mode of major PM (Peng et al., 2016). In another case three offshore vessels were tested by onboard systems (Zhang et al., 2016). The exhaust emissions from 71 ships were also analyzed for black carbon in California (Buffaloe et al., 2014). Apart from this direct sampling of shipping exhaust, plumes have been sampled via aircraft 100 km off the California coast (Chen, 2005) and in-port ambient PM measurements have been undertaken in the Port of Cork, Ireland, using a time-of-flight aerosol mass spectrometer (Healy et al., 2009). Furthermore, the chemical properties of PM in plumes of 1100 commercial ships were studied using a time-of-flight aerosol mass spectrometer in the Gulf of Mexico (Lack et al., 2009). In summary, the majority of the studies listed above generally focused on emission factors of typical gaseous pollutants and PM, whilst the plume studies were more focused on the mixture of primary and secondary aerosol; therefore, there is a lack of directly emitted exhaust gas and PM studies. Another noticeable fact is that the studies on emission characteristics mostly explored shipping emissions when ships were at sea; thus, not paying adequate attention to specific at-berth conditions.
Based on the abovementioned studies, it can be concluded that one of the major gaps in exploring emission characteristics is understanding specific shipping emissions when ships are in their “at-berth operating mode”. The significance of ship emissions at berth is attributed to the fact that the contribution of emissions in this operating mode is mainly dominated by the auxiliary engine emissions. This contribution rapidly increases as the target areas is further defined from a global scale to just port regions. For global shipping emissions, the share of emissions from auxiliary engines in at-berth mode was between 2 and 6 % (Corbett and Koehler, 2003). When the domain was further limited to a regional scale, e.g., East Asia, the contribution of SO2 and NOx emissions at berth increased to 26 % (Liu et al., 2016). When focusing on the national costal area the proportion of emissions from ships at berth continued to increase, reaching over 28 % (Fu et al., 2017). An in-port shipping emission inventory of Yangshan Port in China (Song, 2014) revealed that auxiliary engine exhaust contributed 40.5 and 43.3 % to overall PM2.5 and SOx emissions, respectively. This is why the “Fuel Switch at Berth” regulation was proposed in 2011 and enforced in July 2015 in Hong Kong, then proposed in 2015 and enforced in 2017 in mainland China as the first step toward marine fuel quality control. Yet no valid, comprehensive studies on the chemical properties of auxiliary engine exhaust have been conducted in China, which currently owns 12 the world's 20 largest ports (China Port Press, 2014). Consequently, the lack of studies on the chemical characteristics of emissions at berth has become a barrier to further analyzing the mechanism of organic aerosol transition and its effect on human health. Owing to the lack of these specific studies, it was difficult to apply accurate at-berth data to evaluating health impacts; a solution to this issue is to use the general average shipping emission data instead, without distinguishing at-sea emissions and at-berth emissions.
Apart from the significance of at-berth emissions, another critical issue is the impact of different fuels on shipping emission chemical characteristics. The main fuel types applied in ship main engines or auxiliary engines are residential oil, heavy fuel or intermediate fuel oil (Hays et al., 2008) as well as marine diesel oil. Low-grade heavy fuel oil (HFO), known as bunker oil or residual oil, which usually has a sulfur content over 0.5 % and contains metallic elements such as vanadium, nickel and copper, has been commonly used in marine engines and is responsible for high levels of PM and gaseous pollutants such as SOX (Agrawal et al., 2009). In contrast, marine diesel oil (MDO) is a lighter and cleaner diesel with a lower sulfur and metallic element content (Corbett and Winebrake, 2008). Aiming to reduce emissions, a more stringent limit on fuel sulfur content and switching to cleaner marine diesel fuels has become a common trend (IMO, 2017). Various studies have illustrated the effect of using HFO and MDO on shipping emission chemical characteristics. For black carbon (BC), using low sulfur content MDO could result in a reduction of up to 80 % of total BC emissions compared to using HFO (Lack and Corbett, 2012). A recent comparative study focused on HFO and MDO in the European sulfur emission control area (SECA) showed that a decline in sulfur content from 0.48 to 0.092 % led to a reduction of 67 % in PM mass and 80 % in SO2 emissions (Zetterdahl et al., 2016). Another comprehensive study including PM, EC and heavy metals was undertaken to compare HFO and standardized diesel fuel (Streibel et al., 2017). Following the regulations for using low sulfur fuels implemented by western countries, China began to launch its own stepwise regulations associated with domestic emission control areas (DECAs) to minimize conventional pollutants from shipping emissions. Under the new regulations ships are required to use diesel with a sulfur content below 0.5 % at berth, due to the vital role that ship emissions at berth play regarding air quality. This fuel switch should lead to changes in the chemical characteristics of ship-exhausted gas-phase VOCs and PM, which are closely related to ambient air quality in port areas and subsequent health impacts. However, previous comparative studies on different fuels have tended to emphasize the diversity in the total amount of the fuels used and the emission factors; therefore, there has been a notable lack of studies revealing the changes in chemical characteristics caused by the fuel switch, especially in China.
In order to explore the chemical composition of VOCs and particulate matter (PM) from ship auxiliary engines, this study took place in a key port area and was designed to cover the primary period of new policy implementation. The study period ran from 27 December 2016 to 15 January 2017 in Jingtang Port, one of the key pilot ports for the new fuel switch regulation that came into effect on 1 January 2017. Twenty container ships were sampled and measured for VOC and PM emissions from auxiliary engines in at-berth mode. Via the application of gas chromatography-mass spectrometry (GC-MS) and single particle aerosol mass spectrometry (SPAMS), this research conducted a comprehensive exploration of VOC profiles, PM size distribution and typical ion mass spectra, which could be fundamental to impact assessments of shipping emissions and source apportionment in key port regions.
2.1 Sampling methods and instruments
2.1.1 Information from Jingtang Port: sampling sites and ships
The ambient sampling site was located in Jingtang Port, Tangshan City, Hebei Province, China. Jingtang Port is located in Bohai Bay and belongs to the Port of Tangshan, which is one of the core ports in the domestic emission control area. According to the China Port Yearbook 2015, the annual ship traffic in the Port of Tangshan reached 15 084 and the total throughput exceeded 500 million tons, ranking it 5th among global port throughputs. Jingtang Port area is surrounded by the “Port Economic Development Area”, which has a population of 78 300. Tangshan is a typical industrial city with an average PM2.5 concentration of 117 µg m−3 in winter (Zhang et al., 2017). The current PM2.5 source apportionment studies in Tangshan have not included shipping emissions due to a lack of basic information and research. However, background information indicates the significance and urgency of studying the impact of shipping emissions and the effect of the fuel switching policy.
As is shown in Fig. 1a, the population center is mainly concentrated in a residential area, located to the north, about 2 km away from the port. Approximately 2.5 km to the west of the port area there is a thermal power plant with after-treatment facilities, which operates according to the strict emission control standards of power plants in China. Between the port and the other zones are two main roads that trucks use to carry containers in and out of the port; the roads are about 1 km away from the sampling site. Besides trucks and the power plants, there are no further emission sources near the port area.
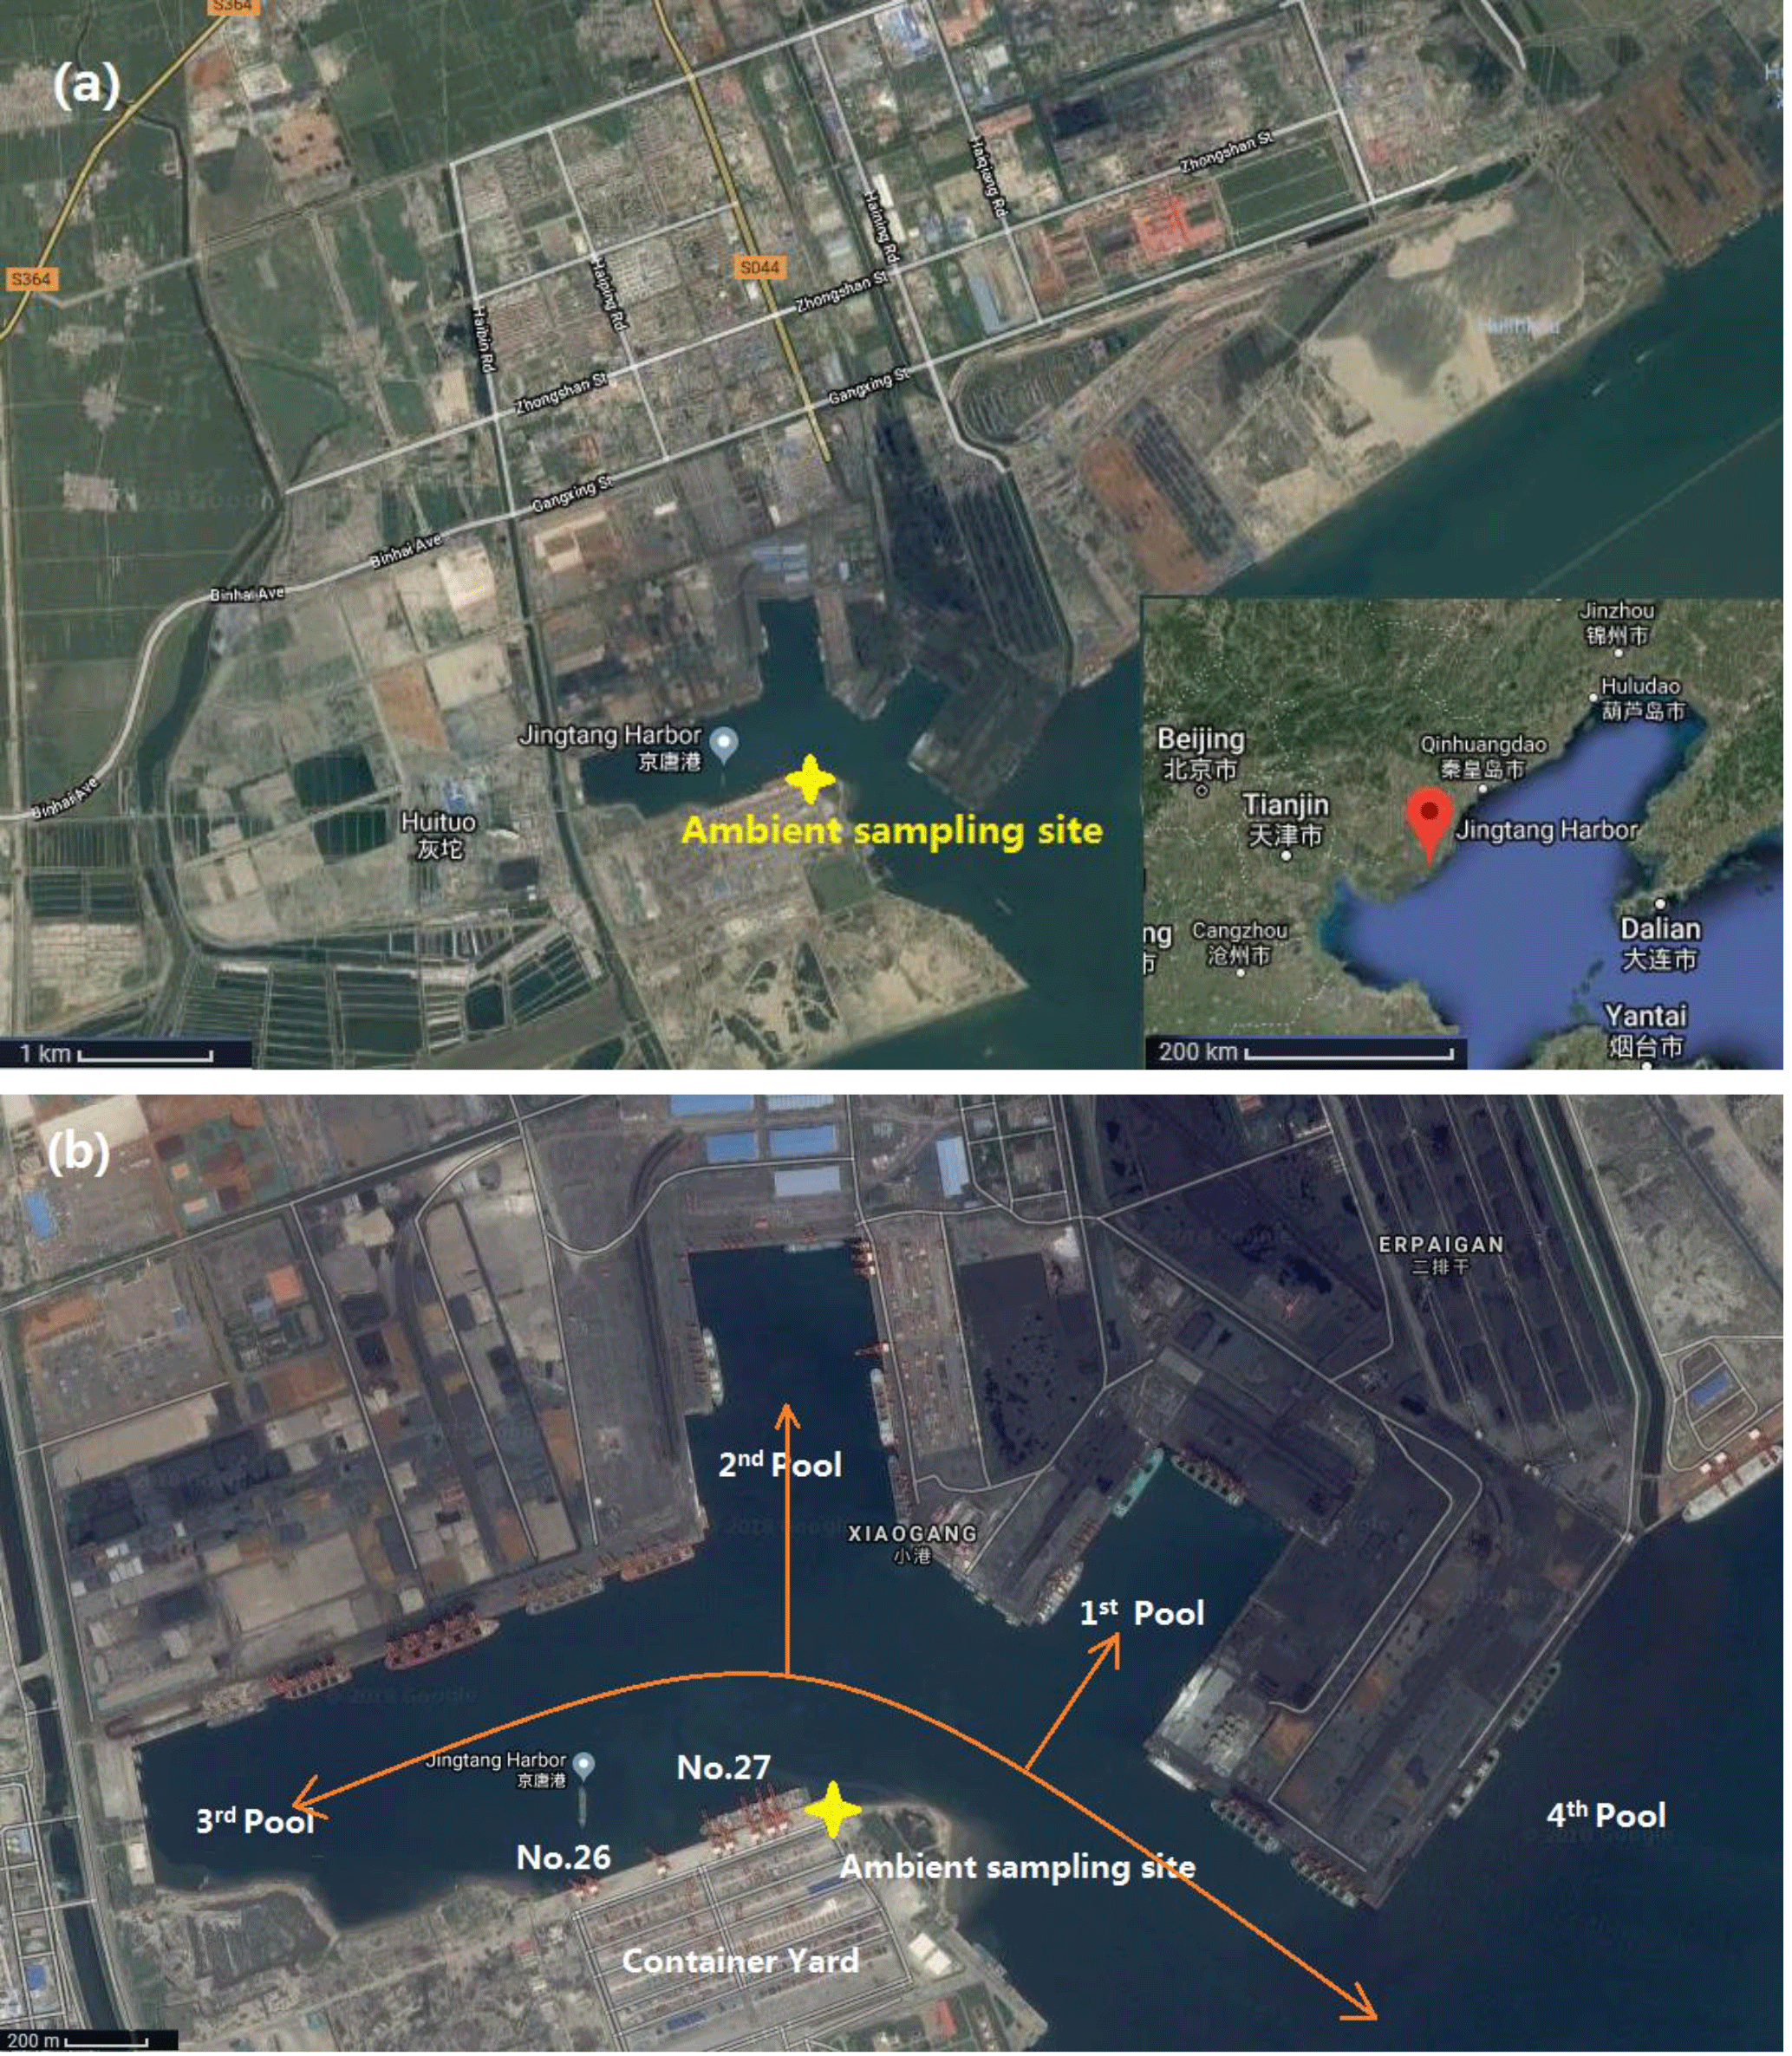
Figure 1(a) The location and surroundings of Jingtang Port shown at both a large scale (map inset) and smaller scale. The yellow marker represents the sampling site inside the port area. The road, the residential distribution and their distance from the port can be observed from this map. (b) The location of the sampling site at a further amplified scale. The distribution of the berths, pools and the surroundings of the sampling site are illustrated on this map.
The site where ambient particle collection and instrumental analysis was carried out is surrounded by four pools and a channel, and is located on an open, flat corner close to the Number 26 and Number 27 berths as well as the container yard inside the port (Fig. 1b). No tall buildings exist around the sampling instrument. The distribution of the berths, the pools and the sampling site guarantees that plumes from ships at berth are prone to reach the sampling instrument.
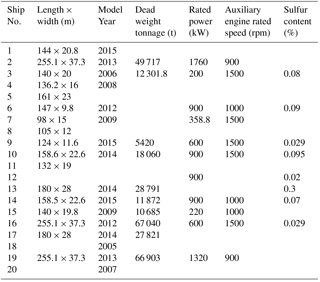
The information for the 20 container ships included in this study was collected via on-board inquiry and is listed in Table 2.
2.1.2 VOC sampling and analysis
VOCs from ships at berth were sampled using Entech SUMMA canisters with a standard volume of 3.2 L. When auxiliary engines were in operation, 1 m Teflon tubing was stretched into the exhaust pipe and the other end was linked to the SUMMA canister. The flow rate was kept constant by an Entech CS1200ES passive canister sampler, which also filtered impurities like particles and ashes. The first batch of samples was regarded as preliminary tests in order to determine proper dilution factors, sampling time and flow rate. Sample dilution was conducted using an Entech 4600 dynamic diluter with various dilution factors ranging from 10 to 80, depending on the original sample concentration. An Agilent 5975C-7890A GC-MS was calibrated with standard gas and used for analyzing diluted VOC samples. A total of 93 VOC species were detected and the mass percentage of single compounds could be calculated according to the sample inlet volume, the dilution factor and the calibration curve. Owing to the limit of the chromatographic column property equipped on the GC-MS, alkanes and olefins with a carbon number smaller than four were not detected. VOCs with a carbon number larger than six are more relevant to the yield of secondary organic aerosols (Gentner et al., 2012).
In order to complement the quantification of lighter hydrocarbon compounds with two to three carbons, selected ion flow tube mass spectrometry (SIFT-MS) was applied, which has been recognized as a real-time analytical technique for combustion gases and components in exhaled breath (Smith and Spanel, 2010). This part of the analysis was done without pretreatments and took place immediately after the gaseous samples were taken from auxiliary engines. VOC samples were transferred from the canister to a Teflon bag using an Agilent headspace syringe with a standard volume of 10 mL and then diluted with nitrogen. The species that SIFT-MS quantified were not totally consistent with the GC-MS. According to the Photochemical Assessment Monitoring Stations (PAMS) and Toxic Organics-15 (TO-15) standard gas applied in GC-MS calibration, 51 species were selected and normalized by mass in SIFT-MS data. Among the 51 species, acetylene, ethane, ethene, propane and propene were the most significant low-carbon compounds that were not quantified by GC-MS. The mass proportion of these species was calculated according to the quantification results obtained by SIFT-MS analysis, and the impact on ozone forming potentials could then be evaluated.
2.1.3 Particle sampling and analysis
Ship exhaust particles were collected directly from the exhaust pipes of the auxiliary engines on ships utilizing Tedlar bags and metal tubing designed specifically for particle sampling. The whole sampling process was achieved using a non-contact sampling box and air pump. Samples were then sent to the single particle aerosol mass spectrometer (Hexin Analytical CO., Ltd) (Li et al., 2011) as soon as possible to be analyzed. SPAMS shared a common principle and mechanism with the aerosol time-of-flight mass spectrometer (ATOFMS), in that it is frequently applied in the online measurement and analysis of single particle aerosol from heavy diesel vehicle exhausts (Shields et al., 2007) and biomass burning (Bi et al., 2011; Xu et al., 2017).
Ambient particle sampling was conducted from 27 December 2016 to 15 January 2017, spanning about 20 days. Ambient particles were sampled and analyzed by SPAMS, with the inlet fixed at a height of 3.6 m from the ground level.
2.2 Ion mass spectra identification and manual grouping
Ion mass spectra with positive and negative ion information were derived from SPAMS output, which were fundamental for further analysis. Both positive and negative ions were in an m∕z range of 1–250. Based on the ART-2a neural network algorithm (Song et al., 1999), single particles sharing similar mass spectral signatures were further grouped into clusters. The whole algorithm process was undertaken using MATLAB 2011a and a vigilance factor of 0.7 and a learning rate of 0.05 were set with 20 iterations. Further manual classification was then required in order to merge particle clusters into expected types, depending on the target of research. Clusters that accounted for the top 95 % of all particles were analyzed according to the previously mentioned method.
To identify each type of particle, ions with certain m∕z values were used as markers (Fu et al., 2014). For elemental carbon (EC) particles, [Cn] signals were the most typical markers distributed in both positive and negative ion mass spectra. For organic carbon (OC) particles, ions with m∕z = 29, 37, 41, 43 and 51 represented , C3H+, and , respectively. Meanwhile, EC ion signals existed that were mixed with typical OC signals. These ions were classified as EC–OC mixed particles (ECOC), as it was hard to accurately divide them into EC or OC types owing to the coexistence of EC and OC ion signals in a single particle spectrum. ECOC particles were formed by EC or VOCs that had been oxidized in the air to form OC attached to the surface of EC particles (Liu et al., 2003). Na+ came from both sea salt and from contents that exist in fuels, especially in heavy fuel oil or residual oil. K+ came from biomass burning and sea spray sources in addition to fuels (Leeuw et al., 2011). V+ and its oxidized ion VO+ were considered to be symbolic of ship exhaust, as V exists in fuels such as heavy fuel oils (HFO). Previous studies (Celo et al., 2015; Liu et al., 2017) have frequently used V+ and VO+ to identify particles from ship exhausts, although they are observed more rarely than other large quantity particles. Other metallic ions such as Fe+ and Cu+ were also observed and had quite a small relative intensity, due to the fact that metal elements scarcely exist in the atmosphere and fuels combust in powertrain systems. In most cases, particles with a relative intensity of metallic ions higher than 0.05 and no other obvious high signals could be classified into metal rich particles.
3.1 VOC speciation
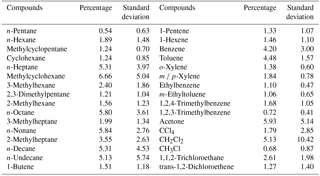
Exhaust emissions from a total of 20 ships were sampled onboard and all samples were diluted to a concentration of approximately 3–4 ppm in order to guarantee the validity and accuracy of the GC-MS analysis. Ninety-three species were detected for each ship sample. The sum of the mass concentration of the 93 identified species was defined as 1, which normalized the mass concentration of single species. Four samples were excluded due to their irregularity after a 3-sigma test for all data. The remaining 16 samples were then averaged by the percentage of the mass concentration, and the VOCs speciation profile was subsequently obtained for all 16 ships; the ships had similar species mass concentration distributions. A histogram of the VOC profile by mass percentage in shown in Fig. 2 and the top 32 species are listed in Table 3. Alkanes and aromatics dominated the total identified VOCs from ship auxiliary engine exhaust. N-heptane, methylcyclohexane, n-octane, n-nonane, n-decane and n-undecane contributed considerably to alkane emissions, which indicated that alkanes with a carbon number of more than seven were more likely to be emitted from ship diesel engines compared to other mobile sources. Among aromatics, benzene and toluene contributed approximately 9 % to the total VOC emissions. This result was consistent with a study by Huang et al. (2015) on diesel emissions in Shanghai. In view of oxygenated VOCs and haloalkane contents, acetone and CH2Cl2 exceeded benzene and toluene. However, there were considerable standard deviations in the average oxygenated VOC and haloalkane mass proportion due to obvious ship-based differences and the quantification inaccuracy of GC-MS for these two classes of compounds.
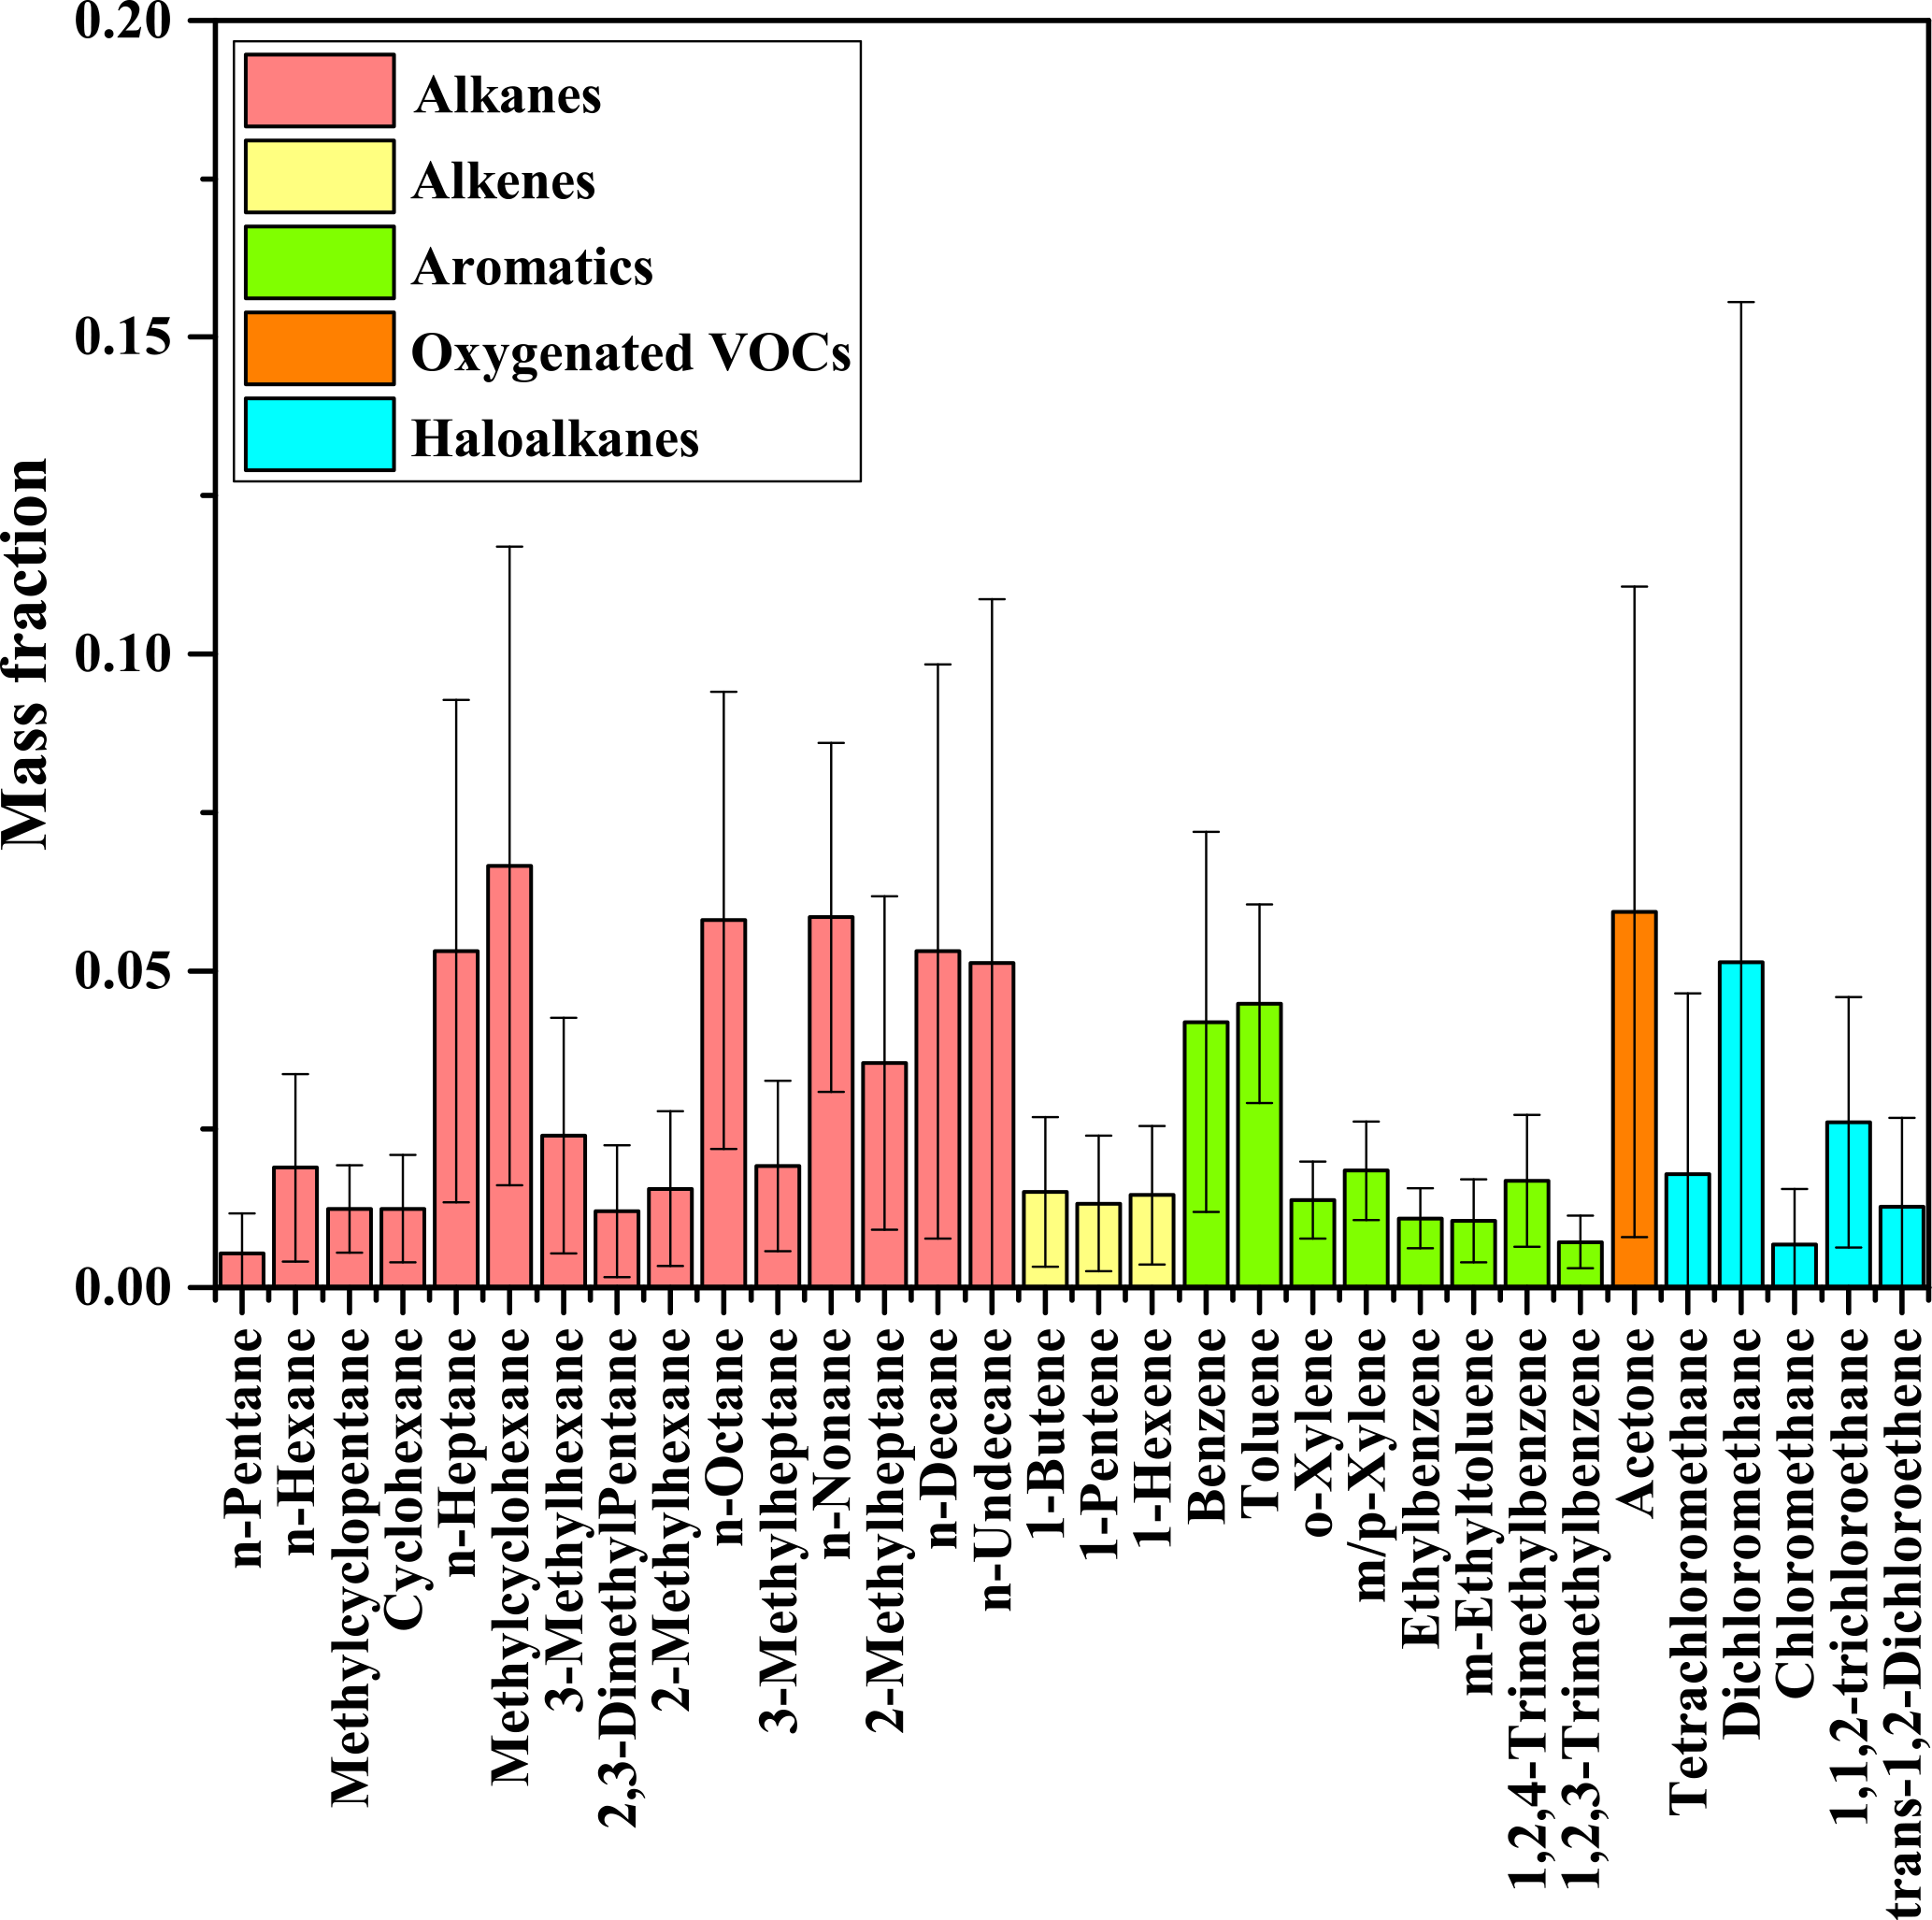
Figure 2VOC source profile from ship auxiliary engine exhausts analyzed by GC-MS; made up of 93 species including PAMS and TO-15. VOC species are classified into alkanes, alkenes, aromatics, oxygenated compounds and haloalkanes, respectively. The top 32 species by weight percentage are listed in this figure.
Table 3Mass percentage of the top 32 VOC species from 16 container ships.
3.2 SOA yields and OFPs of VOCs from ship exhausts
Based on VOC profiles, secondary organic aerosol (SOA) yields and ozone forming potentials (OFPs) for ships were calculated. SOA yield values for individual precursors and for the definition of non-precursors were referenced from Gentner et al. (2012). It should be noted here that intermediate VOCs (IVOCs) were not identified or quantified in this study, which may cause an underestimation of the actual SOA yields. Furthermore, the VOC source profiles of three types of diesel trucks (light-, middle- and heavy-duty trucks) from Yao et al. (2015) and the profiles of heavy-duty diesel trucks from Huang et al. (2015) were referenced to use in calculations and to compare with VOC profiles from this research. The average VOC source profile for light-duty gasoline passenger vehicles was also taken from previous research in China (Cao et al., 2015) to make further comparisons. These comparisons have the potential to provide insights into emission control strategies and fuel quality for different sectors within the same country; therefore, comparisons among studies undertaken in China make the most sense. The results are presented in Fig. 3, and the average SOA yield for the 16 ships measured was 0.017 g SOA g−1 VOCs. As seen in Fig. 3, the conclusion can be drawn, that in terms of SOA yields, ship exhaust VOCs generate more SOA than those of diesel trucks and gasoline vehicles. The main reason for this is the content difference of heavy organic compounds. Ship exhaust contains more heavy VOCs like alkanes and aromatics, with a carbon number of more than nine, than vehicles exhaust, with aromatic contents such as benzene, toluene and xylene being particularly responsible for SOA yields. The unconsidered IVOCs are more commonly found in heavy fuels than in diesel oil or gasoline.

Figure 3Comparison of SOA yields and OFP based on VOC source profiles with calculated results from previous studies (Yao et al., 2015; Cao et al., 2015; Huang et al., 2015). The purple dots represent ships tested in this study. Diesel trucks are divided into three types: light-duty diesel trucks (LDDTs), medium-duty diesel trucks (MDDTs) and heavy-duty diesel trucks (HDDTs).
The ozone forming potential showed a different trend to SOA generation, with VOCs from ship exhaust displaying an approximately equal OFP to diesel and gasoline vehicles. According to the maximum incremental reactivity (MIR) (Carter, 1994b), lighter VOCs have a higher MIR scale, which means that they contribute more to ozone formation. VOCs from ship exhaust had a relatively low light hydrocarbon content, which lowered the overall ozone forming potential. The average OFP of ship emitted VOCs was 2.63 g O3 g−1 VOCs.
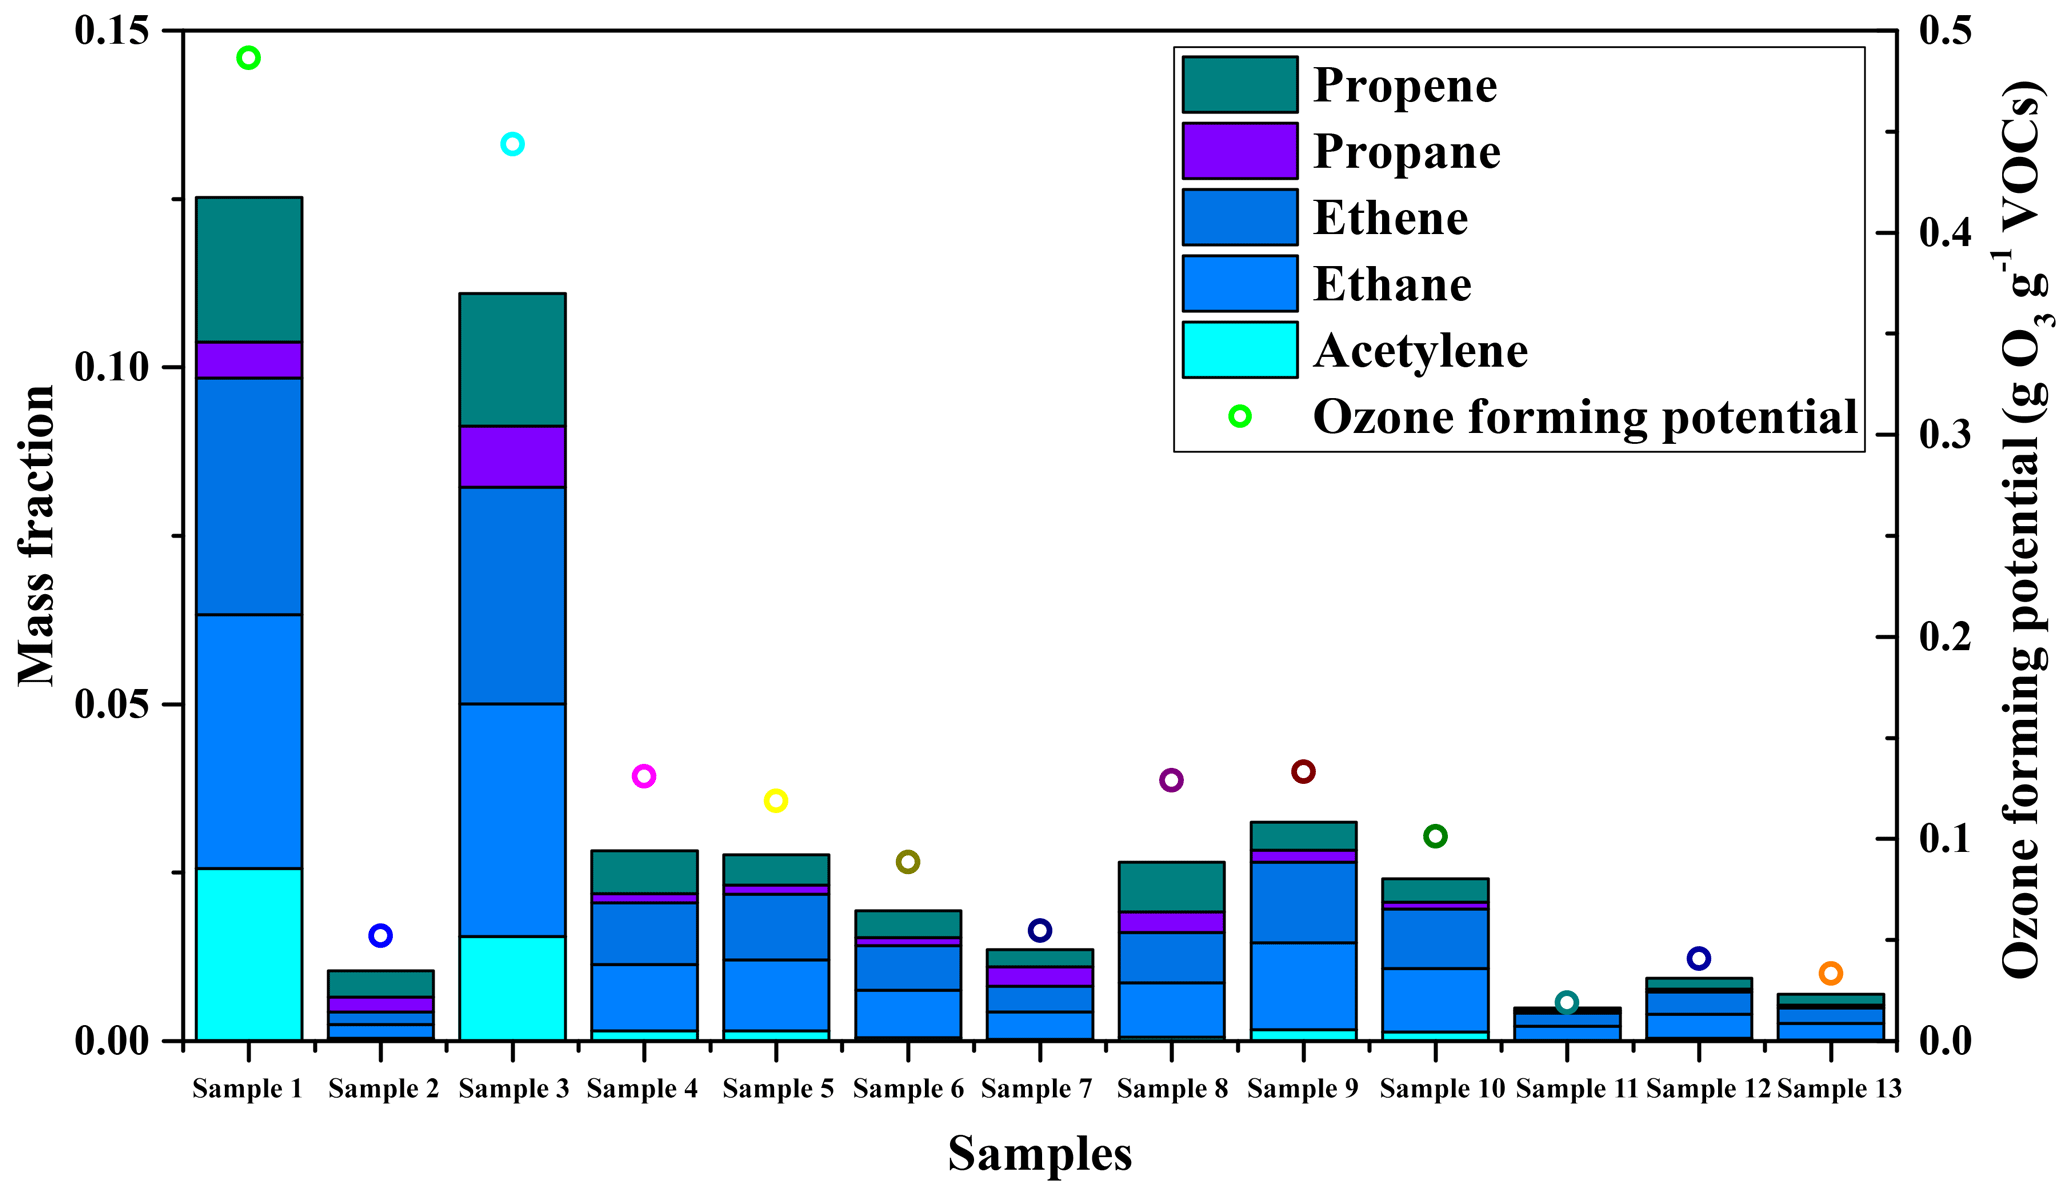
Considering the impact of low carbon hydrocarbons on ozone forming potential, the quantification results by SIFT-MS were used to evaluate the underestimation caused by the absence of C2 and C3 hydrocarbons in GC-MS quantification. A total of 13 auxiliary engine exhaust samples were analyzed by SIFT-MS and the mass fraction of low carbon VOCs as well as their ozone forming potentials are presented in Fig. 4.
Figure 4 shows that besides Sample 1 and Sample 3, the total mass fractions of the low-carbon compounds were below 0.05. Given the fact that SIFT-MS was not able to analyze all 93 VOC species as the GC-MS did, the actual fractions could be even lower. When using the maximum incremental reactivity scale from Carter (1994a), the calculated OFPs of the low-carbon compounds in Sample 1 to Sample 13 were between 0.02 and 0.47 g O3 g−1 VOCs, with an average of 0.14 g O3 g−1 VOCs. Compared to the average value of 2.63 g O3 g−1 VOCs, calculated based on the source profile from the GC-MS without those hydrocarbons with two to three carbon atoms, the underestimation was only around 5 %.
In conclusion, VOCs from ship exhausts might play a more important role in secondary organic aerosol formation in port areas than diesel trucks and gasoline vehicles.
3.3 Overall particle characteristics by SPAMS
3.3.1 Average ion mass spectra
Samples collected by Tedlar bags and glass bottles from 20 ships at berth were analyzed using SPAMS. Excluding some invalid samples with very few particles, the average ion mass spectra of both positive and negative ions expressed in relative area were obtained after SPAMS analysis and classification (Fig. 5).
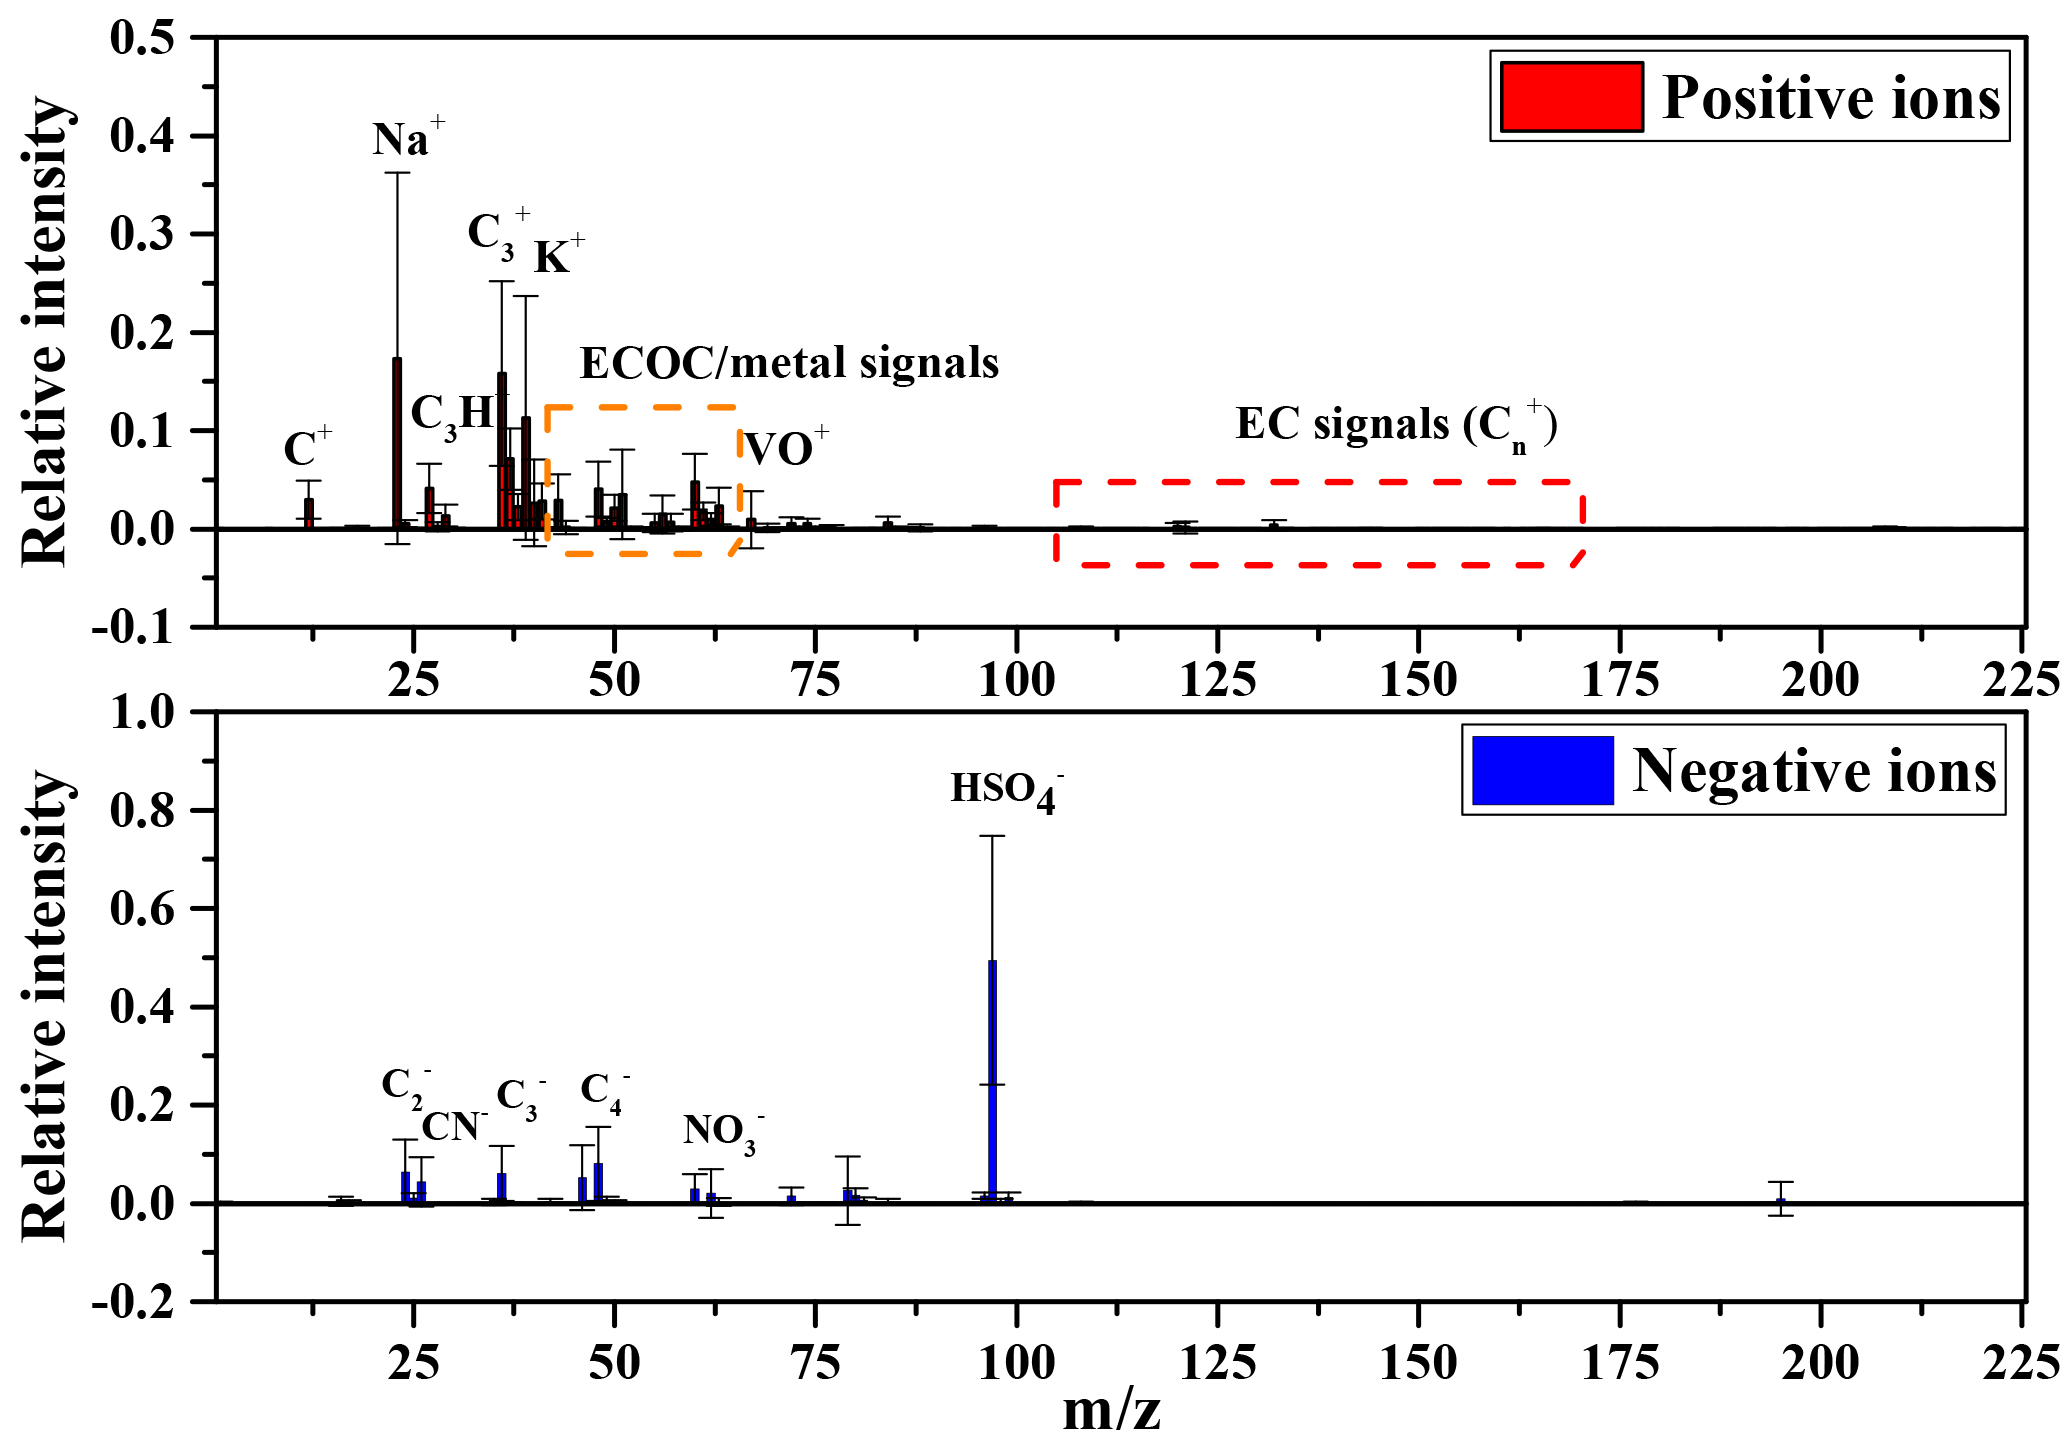
Figure 5Average ion mass spectra derived from SPAMS analysis of 20 samples of ship exhaust. Standard deviations are given in the figure and typical ion peaks are also marked in both the positive and negative ion mass spectra.
The average ion mass spectra presented the overall characteristics of the total 20 ships. For positive ion spectrum, the Na+ signal was observed to be the highest peak. Other abundant ions were EC and OC, occurring in the following forms: C+, , and so on for EC; and C3H+, and so on for OC. It was observed that the relative signal area of EC ions was higher and more widely distributed than for OC ions. This was consistent with previous research that found that fuel combustion produced more EC than OC particles. Although not as obvious as the abundant ions listed above, the percentages of V+ and VO+ were relatively low but not negligible.
For the negative ion spectrum, the components were not as complex as for the positive ion spectrum. The highest peak was with m∕z = −97, which exceeded 50 % of the overall negative ion relative area. is a typical marker of sulfate particles, which are formed via secondary reaction in the atmosphere. This will be discussed further in following sections. EC signals such as , and were also observed in the negative spectrum. In addition, markers of nitrates with m∕z = 46 and 62 were and . Nitrates were regarded as secondary particles that might have come from the aging of primary particles emitted directly by fuel combustion or the transformation of gas-phase NO2. The relative area of nitrate signals was much lower than , illustrating that nitrate particles were not predominant in ship exhausts and not related to the main research goal in this study.
3.3.2 Manual grouping results
Based on single particle ion spectrum similarity and the ART-2a neural network algorithm, particles from ship exhaust were further grouped into clusters of 175, among which the top 86 clusters covered 95 % of total particle numbers, with the rest defined as others. Clusters were set as OC, EC, ECOC, Na (Na-Rich), K (K-rich), V (V-rich), Cu (Cu-rich), Fe (Fe-rich), Mn (Mn-rich) and others, depending on the similarity and manual grouping. The method and criteria of the manual grouping mainly focused on positive ions. Particle grouping is fundamental for accurate source apportionment in a target region.
Following this, a composition analysis was conducted, the result of which are shown in Fig. 6. It was shown that EC and ECOC particles dominated with respective proportions of 35.74 and 33.95 %, while Na-rich particles ranked 3rd with a percentage of 21.12 %. Data regarding EC and ECOC indicated that carbon emitted by fuel combustion tended to produce more EC and ECOC than pure OC particles. The amount and fraction of OC particles were lower than those of EC and ECOC particles by a factor of ∼ 10. Meanwhile, OC tended to attach to EC particles, forming ECOC particles and increasing the fraction of ECOC particles. In view of the composition of fuel combusted by marine engines, Na does exist with a mass concentration of around 13–22 mg kg−1 in several samples of heavy fuel oil (HFO) and at a lower concentration in marine diesel oil (Moldanová et al., 2013; Lack et al., 2009). Moldanová et al. (2009) analyzed particles from ship exhausts using two-step laser mass spectrometry, and Na+ was observed to have an obvious peak in the mass spectra. According to Sippula et al.'s (2014) research on marine diesel engines, Na can also exist in lubrication oil and be exhausted along with the lubrication and grinding process. It is widely recognized that the metal content existent in exhausted particles has a strong correlation with that in fuel (Celo et al., 2015; Moldanová et al., 2013). Although the content of Na is obviously lower than that of vanadium (55–133.8 mg kg−1), the peaks of Na+ in ion mass spectra are mostly higher than the peaks of the V+ ∕ VO+ signal. This phenomenon indicates that there are external sources of Na and that one of the most possible of these is sea salt, where the typical element is Na. In conclusion, the Na-rich particles come from both fuel composition and sea salt perturbation. Only particles with a relative area of Na+ obviously higher than other positive ions were counted as Na-rich particles. The same rule was also adopted for K-rich particles. Owing to the fact that the content of K in most marine fuels is lower than that of Na, V and other typical metallic elements, one of the possible sources of K-rich (as with Na-rich particles) particles is sea salt (O'Dowd et al., 1997). Na+ and K+ were both widely spread among all particles. V-rich particles were likely to contain mixtures of ammonia sulfate or sulfuric acids (Divita et al., 1996), which could be proven from their ion mass spectra. Particles with relatively high V+ ∕ VO+ signals occupied just 1.1 % of the total according to the classification criterion, and were only observed from a few ships. This will be discussed in following sections.
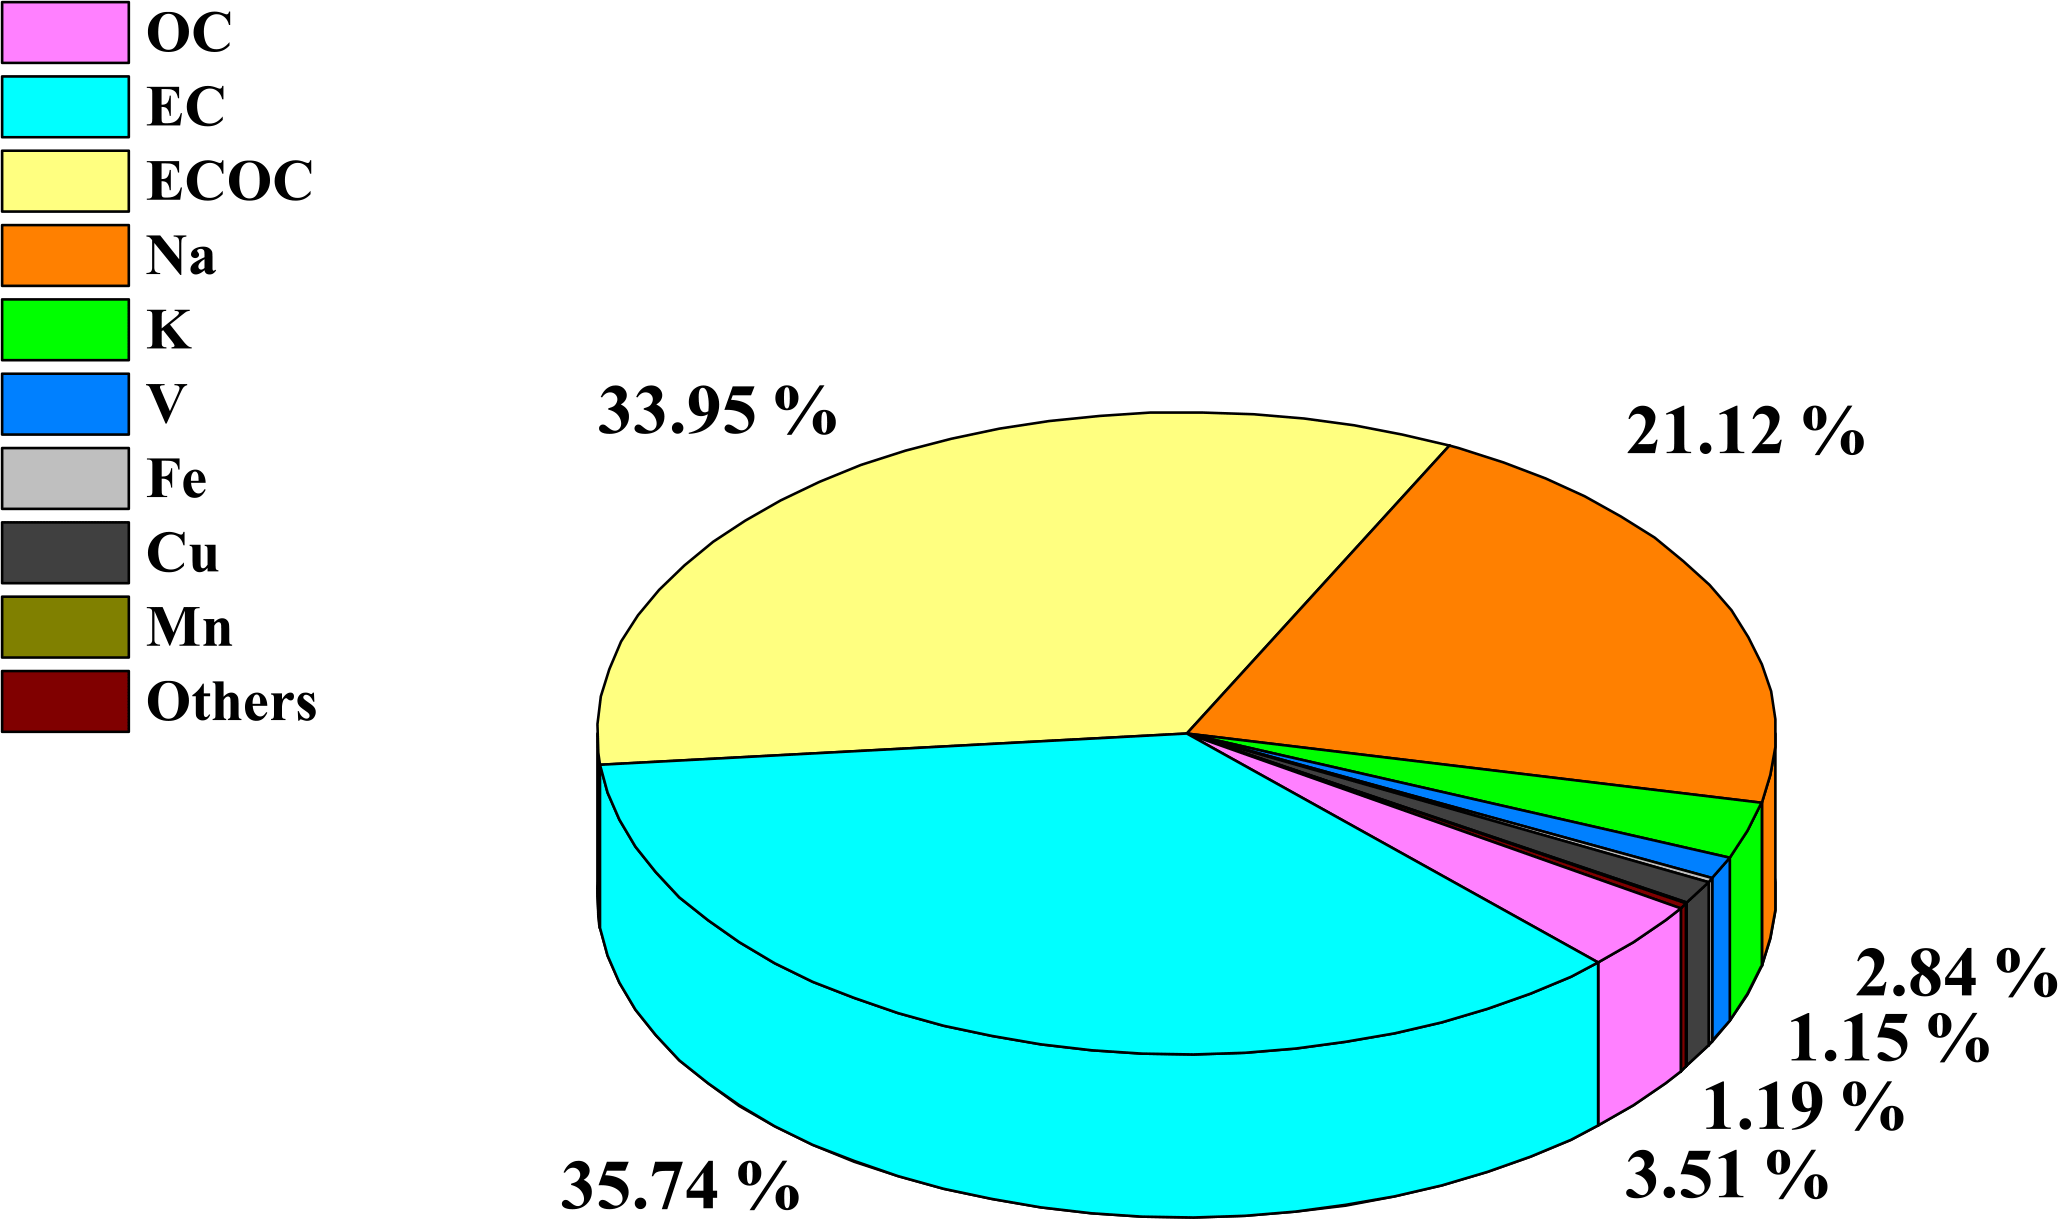
Figure 6Manual classification of 10 types of particles from 20 samples and their proportion by numbers.
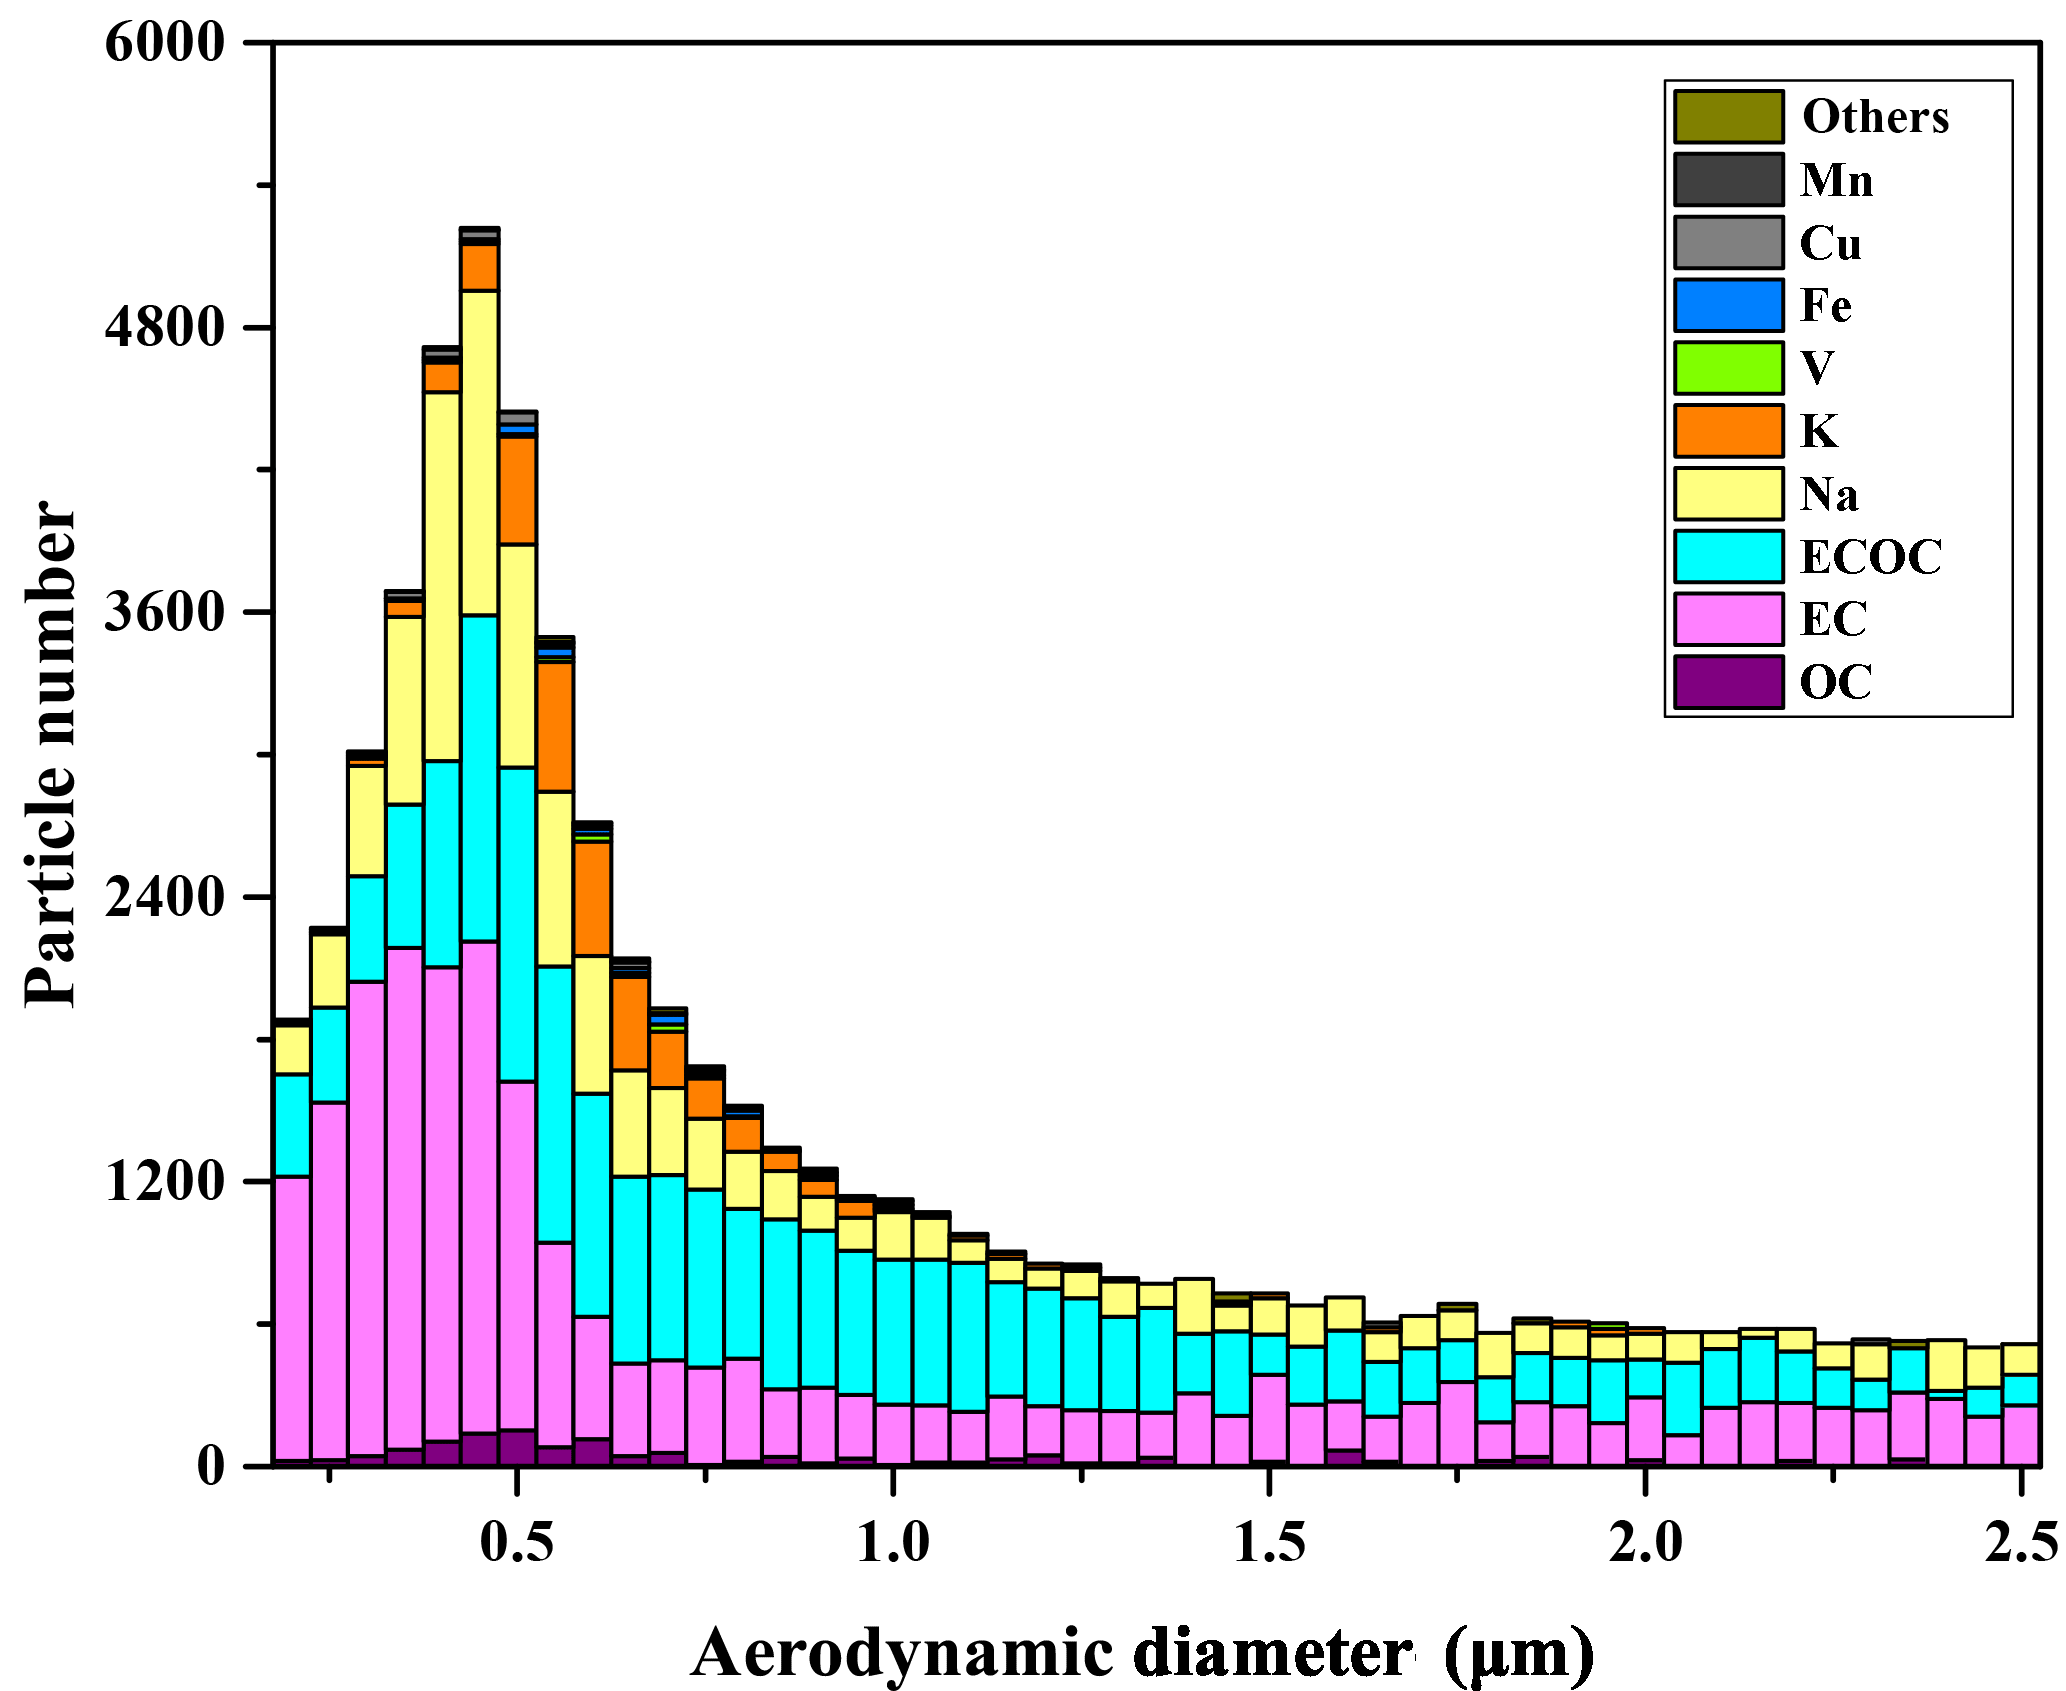
3.3.3 Size distribution
Particles with an aerodynamic diameter ranging from 0.2 to 2.5 µm, covering the accumulation mode (0.1 to 1 µm) and coarse mode (over 1 µm) (Frick and Hoppel, 2010), were analyzed by SPAMS. This size range has a significant correlation with PM2.5 pollution, which should be seriously evaluated. Size information regarding 257 911 particles from 20 ships was derived from SPAMS and 19 342 of them were hit. This result showed a skewed distribution with a peak that appeared between 0.38 and 0.44 µm. This was at odds with the measurements conducted in Ireland using SMPS (Healy et al., 2009), in which particles measured were generally around 100 nm. Moreover, a bimodal distribution was not observed due to the limited measurement of particles smaller than 2.5 µm, while the coarse mode usually occurred above that. This divergence might result from the differences in measurement instruments and fuels. Ninety-five percent of all particles with size information lay between 0.2 and 1.46 µm, which implied that particles from ship auxiliary engine exhaust could be classified as fine particles. This would mean that they would contribute to the PM2.5 in ambient air. It is remarkable that the magnitude of the size distribution in this study was consistent with some of the test results from engines using different fuels. Most of the samples in this study were collected after 1 January, when new policy forcing ships to switch to clean diesel fuel came into effect. This could have resulted in a decline in particle aerodynamic diameter.
In order to further analyze the size distribution information of different types of grouped particles, Fig. 7 was developed to reveal the variation in the proportion of different particles by size range. As OC particles only accounted for less than 5 % of overall particles, they show no apparent trends and were dispersedly distributed in each section. It can be observed that in sections larger than 1.30 µm OC particles occasionally “disappeared” in some bins, while they remained continuous between 0.2 and 1.30 µm. This might indicate that OC particles tend to concentrate in a relatively tiny size range. The EC particle distribution was slightly similar to a bimodal distribution, with the first peak found in the 0 to 0.6 µm section. In the 1.75 to 2.5 µm section, it appeared to present another peak but it was not as obvious as the first one. Accordingly, in the 0.2 to 0.5 µm section, the proportion of ECOC particles was lower than in the over 0.5 µm section, implying that ECOC tends to form larger particles than EC. Another obvious fact was that K-rich particles were more likely to present a normal distribution in the 0.25 to 1.0 µm range, which was discrepant with the size distribution of Na-rich particles. Na-rich particles were distributed almost equally among bins in the 0.2 to 1.25 µm range, and the proportion increased starting from 1.25 µm. Metal containing particles were observed between 0.25 and 1.25 µm, occupying a much lower proportion than other massive sorts of particles. Metal contained in particles emitted by ship engines mainly comes from the combustion of heavy fuel oil and are known to catalyze the oxidation of SO2 and the subsequent formation of sulfuric acid or sulfate particles.
3.4 Can vanadium be used a tracer of ship fuel combustion in the port area atmosphere?
3.4.1 Ion mass spectra differences between ships using different fuels
Owing to the fact that all samples were collected after 1 January 2017, the regulated date for the fuel switch, it could not be determined by date whether ships had changed to diesel fuel. However, it was observed from the ion mass spectra of individual ships that some ships had a high V intensity while others did not (Ni is also an element mostly found in heavy fuel, but SPAMS seemed to be less sensitive to Ni detection (Agrawal et al., 2009)). There was also a considerable difference in the intensity between ships. In order to better distinguish ships using HFO and MDO, an analysis was carried out in MATLAB. Signals that satisfied the intersection of conditions, where the intensity of peak m∕z = 51 and m∕z = 67 were higher than 100 while m∕z = 37 was lower than 100, could be recognized as vanadium-related signals (excluding the possibility of counting OC signals for V signals). Ship 13 and Ship 17 shared a similarity in both high V and relative intensity, as shown in Fig. 8. Owing to the fact that vanadium is a typical metallic element mostly found in heavy fuel oil with a higher sulfur content than distillate fuels (Moldanová et al., 2009; Celo et al., 2015), when obvious vanadium signals occurred in the ion mass spectra of particles from Ship 13 and Ship 17 they were very likely due to the use of heavy fuel oils at berth. Accordingly, the sulfur intensity also had the potential be very high. However, for ships with high sulfur but low vanadium intensity, the actual contents of sulfur and vanadium in the fuels used are unknown. This phenomenon cannot be well explained in this study due to instrumental limits and the quantity of particles analyzed in each sample. The main instrument used in this study was SPAMS, which is considered to be semi-quantitative and unable to give accurate emission factors of sulfur and vanadium. Moreover, similar studies using the same methods on shipping emissions are very rare. Therefore, this issue demands further exploration.

Figure 8Vanadium and sulfate relative intensity correlation obtained from the ion mass spectra of 20 ships.
The two ships with vanadium signals higher than the others included a total particle number of 30 009, 2633 of which were measured with ion mass spectrometry. In the ion mass spectra of these ships, higher V+ ∕ VO+ and signals of over 0.8 in relative intensity were found, while the other ships had an average relative intensity of 0.59 and no apparent V+ ∕ VO+ signals. Due to the lower number of particles from these ships, there might be abnormally low positive EC signals in their ion mass spectra. Nonetheless, major chemical PM characteristics of different fuel types could be observed through a comparison of the ion mass spectra.
3.4.2 Comparison of vanadium intensity between shipping emissions and ambient data
Previous studies have illustrated that, owing to the vanadium contents in heavy fuel, vanadium in the ambient atmosphere could be used as a tracer indicating the heavy fuel combustion related to ship exhausts (Celo and Dabek-Zlotorzynska, 2010). Field measurements in Shanghai Port in 2011 revealed that the V ∕ Ni ratio could be applied to the identification of shipping traffic emission (Zhao et al., 2013). Research, focused on Bohai Rim in 2013, also identified and quantified the contribution of ship PM emission to ambient air quality using V as a tracer (Zhang et al., 2014). Moreover, studies in Europe have focused on metallic elements representing shipping-source particulate matter in the atmosphere, which played a crucial role in the ambient PM source apportionment analysis (Marco et al., 2011; Perez et al., 2016). As the new regulation came into effect and ships were required to use low sulfur diesel oil at berth, whether vanadium could still be used as a tracer of ship emission to accomplish shipping source identification was worthy of exploration. Distinct from previous research, which was mainly based on filter analysis, this study provided an innovative perspective on the abovementioned issue using spectrometric analysis.
Owing to the working principle of SPAMS, the mass fraction of the vanadium element to other symbolic elements could not be derived, and Ni and La showed no apparent signals in SPAMS spectra. The main methodology was to make a comparison between the vanadium intensity of particles from ships to that of particles sampled from the ambient atmosphere. If the vanadium intensity in ship exhaust is commonly lower than that of the corresponding ambient data, then it is no longer a proper tracer to be used to identify ship exhaust sources. The calculation was performed using a similar method to the one previously mentioned. Due to the fact that samples and particle numbers detected by SPAMS differ quite apparently among ships, we defined the ratio of total intensity to SPAMS detected particle number as vanadium-related intensity. The overall results for the 20 ships sampled from 4 to 16 January as well as the ambient vanadium intensity are shown in Fig. 9.
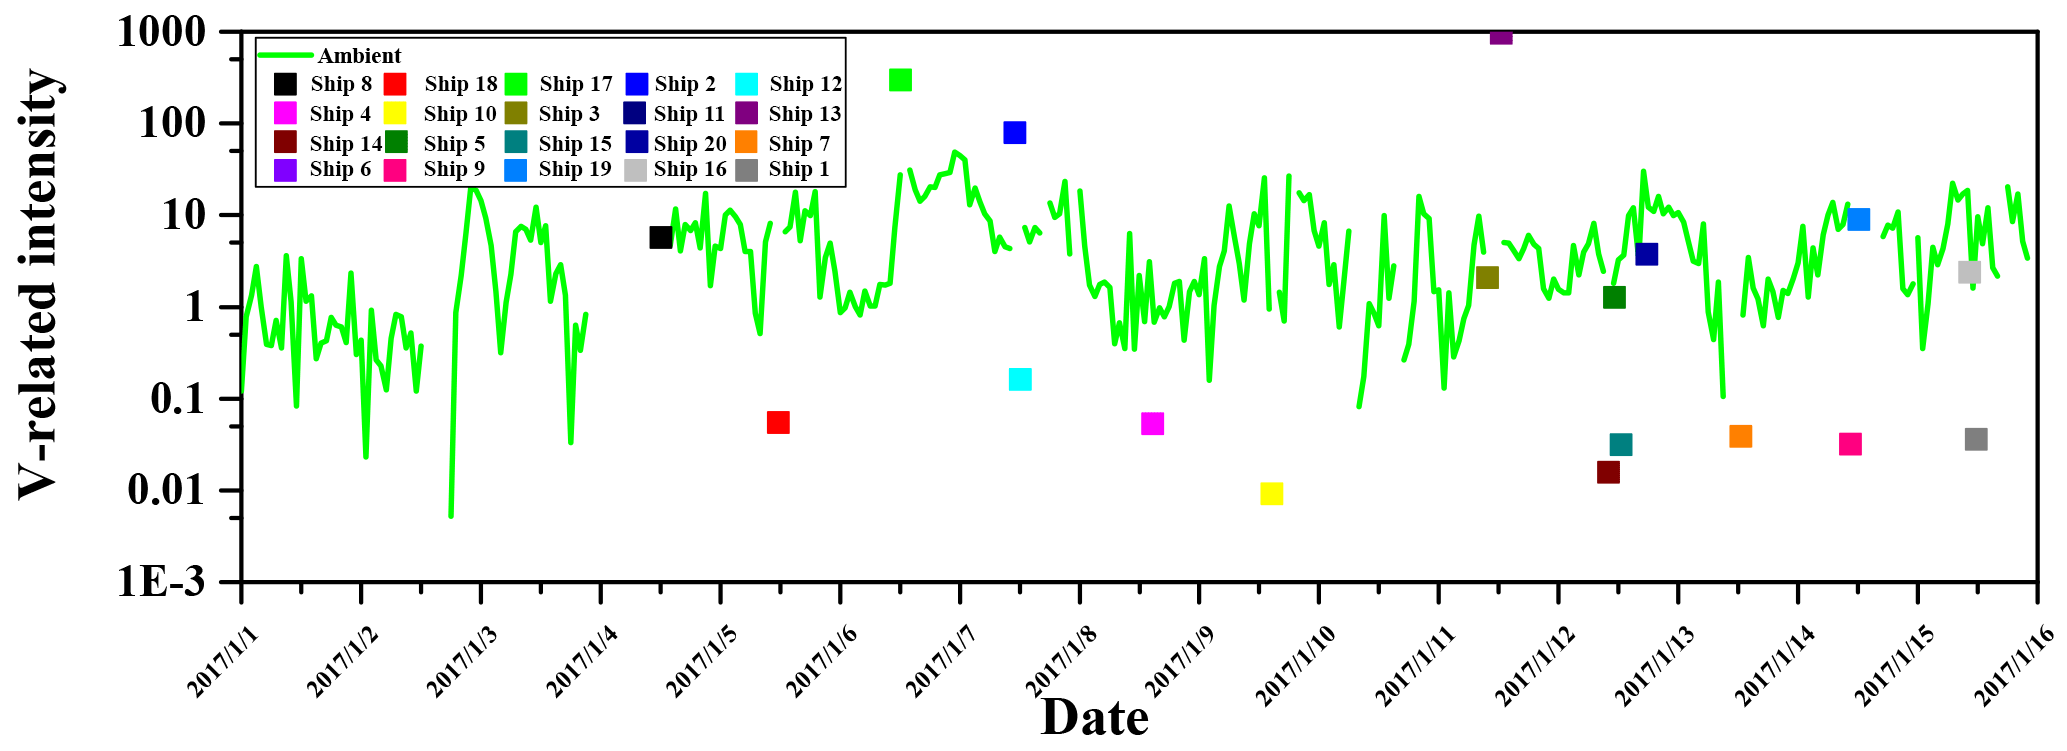
Figure 9Comparison of vanadium intensity of 20 individual ship particle samples to ambient particle samples from 1 to 16 January. The green line is the average vanadium intensity of ambient particles over time. The colored dots represent the average vanadium intensity of different ships distributed by sampling time.
Noticing that the ordinate was logarithmic, considerable distinction existed among ships regarding vanadium intensity. The intensities in the exhausts from 17 ships were well below or comparable to the corresponding ambient intensity, while Ship 2, Ship 13 and Ship 17 were observed to have apparently high vanadium intensity. This phenomenon might revealed the fact that after fuel substitution, vanadium from ship exhausts at berth would not appear to be remarkably higher than that of the ambient atmosphere in most cases. Another crucial piece of evidence is the elemental analysis of three diesel samples collected during field measurements (shown in Table 4). Vanadium was not detected in any of the three diesel samples, which was significantly different from the data from previous studies (38.0–133.8 mg kg−1; Celo et al., 2015) using intermediate fuel oils (IFO) (Table 4). Regarding vanadium “sources”, it can be inferred that if the content of vanadium in fuel keeps declining, the role it plays as a tracer will not be as significant as it has been; furthermore, it will be much harder to detect the existence of vanadium in ambient atmosphere.
Table 4Elemental analysis of three fuel samples and comparison with previous studies.
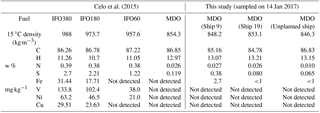
IFO: intermediate fuel oil; MDO: marine diesel oil. Two of the fuel samples were from Ship 9 and Ship 19. The sample marked “unplanned ship” indicates that this ship was not among the 20 ships included in this study.
3.5 Sulfate particle contribution of shipping emissions at berth
The primary goal of domestic ship emission control areas is to control SO2 and sulfate emissions. The concrete demand regarding emission reduction was to lower the sulfur content in fuel oil to a certain level, which was specified to be lower than 0.5 % by weight percentage. Based on these facts, it is meaningful to evaluate the impact of switching to low sulfur oils on ambient air quality. One of the most effective methods to accomplish this is to identify sulfate particles from ships from the total ambient particles sampled using SPAMS, and to observe the change in sulfate contribution.
The first step was to identify and extract ship-source particles from the total particles sampled and analyzed by SPAMS. This operation was based on information obtained from the analyzed ion mass spectra after onboard sampling. Then using algorithm calculation via MATLAB, certain particles were identified as being from ship exhaust. The next step was to extract sulfate particles from the identified particles from ships and ambient sources, respectively. This step was accomplished by defining sulphates as particles with m∕z = −97 or −80, which represented and , two typical markers of sulfates. Finally the temporal (1 h resolution) number change of identified sulfate particles from ships and ambient particles as well as the ratio was obtained. The temporal profile (1 h resolution) of ship-source and ambient particle numbers sampled by SPAMS between 18:00 LT, 27 December and 18:00 LT, 15 January is shown in Fig. 10a.
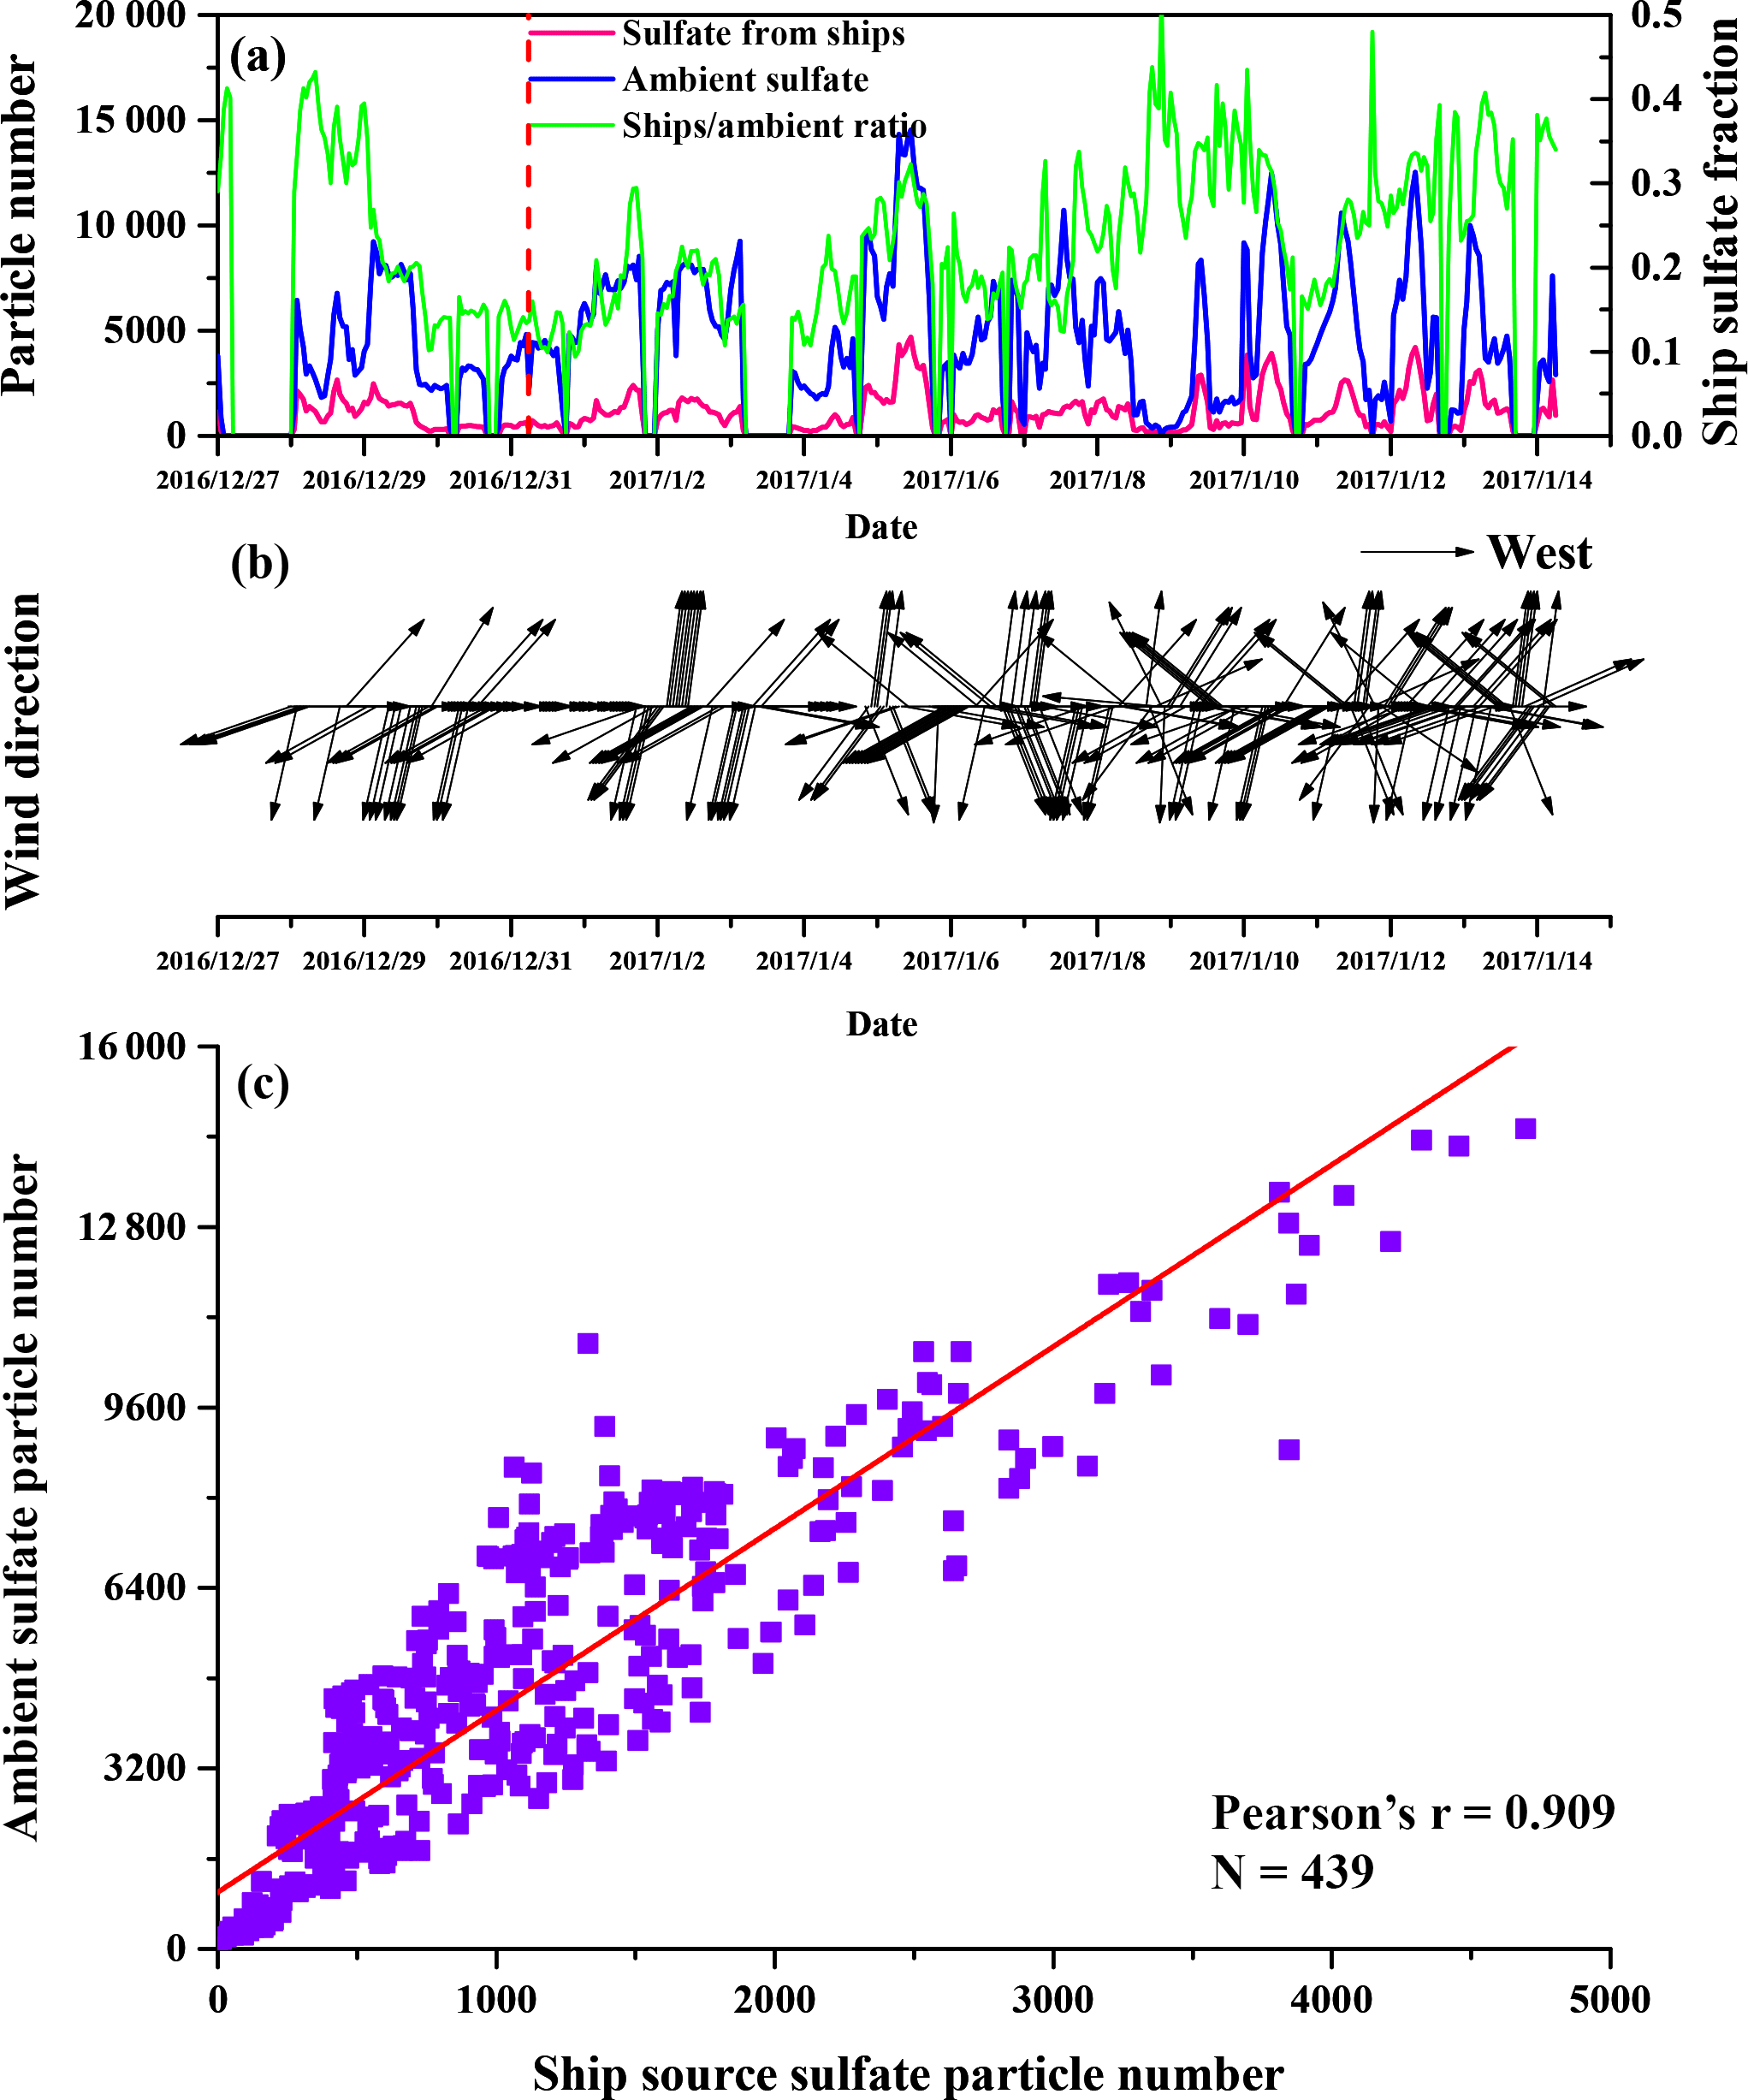
Figure 10(a) Average particle number of sulfate from ships, ambient sulfates and the ratio of the two particle numbers over time. The green line refers to the number fraction of ship-source to ambient sulfates. The red dashed line vertical to the time axis represents 00:00 LT on 1 January when the regulation demanding the use of clean diesel fuel came into effect. (b) Wind direction variation over time during the sampling period. (c) Correlation between sulfates from ships and ambient sulfates. The correlation coefficient and the number of data sets are provided.
A total of 439 sets of data were included in the source apportionment analysis. By linear fitting for ship-source and ambient sulfate particle numbers, the Pearson correlation coefficient was 0.91 as shown in Fig. 10c; this indicated that sulfate particles from ships and those from ambient sources had a strong correlation with each other. Meanwhile, it can also be seen from the change tendency that the change of sulfate particles in ambient air always remained synchronous with ship-source particles, proving that ship-source sulfate particles made a relatively stable contribution to the ambient sulfate particle concentration.
The analysis was divided into two sections, using 1 January 2017 as the division. Before 1 January 2017, it can be seen that (around 29 December) both ambient and ship-source sulfate particles formed several peaks as did the ship-source ∕ ambient ratio. Peaks of ship sulfate particles largely depended on ships sailing into or out of the berth, thereby producing plumes which were sampled by SPAMS. In the following days from 29 December to 4 January, an evident decrease in sulphate particle peaks were seen (especially around 1 January), which might have been due to ships switching to low sulfur diesel oil. Brief surveys were conducted of crew onboard during measurement periods and it was confirmed that some ships had switched to low sulfur oil in advance of the regulation date. Between 4 and 6 January a peak higher than others could be observed, while the ratio dropped even lower than around 29 December. The ship-source ∕ ambient sulfate ratio reached peaks at 18:00 LT on 9 January and 16:00 LT on 12 January. respectively. However, during these two periods the quantity of measured particle numbers was notably low, which could have caused errors that would be easy to neglect. Generally, the average ratio of ship-source sulfate particles to ambient sulfate particles before and after 1 January were 23.82 and 23.61 %, respectively. With regard to the uncertainty in sampling, analyses and calculation, the results can be regarded as unchanged at a level of 24 %.
While it generally seems that the impacts noted in this study stem from the effects of the fuel switch policy on lowering sulfate contribution from auxiliary engines. The results were in fact also determined by a series of meteorological factors, such as wind direction and atmospheric layer stability. These issues will be discussed further in the following.
3.5.1 The impact of wind direction
To better focus on the shipping emissions, we took wind direction data into consideration. The wind directions for the whole sampling period is shown in Fig. 10b. The geographic positions of berths and the wind directions meant that the berths, which were mainly distributed northwest, north and east of the sampling site, had plumes driven to the sampling site by winds from these directions. Moreover, no obvious emission sources other than ships at berth could have interfered with the ambient sampling.
Ambient data with wind directions ranging from northwest to southeast (clockwise) were extracted and separated by the 1 January 2017 cutoff. A total of 10 h with 37 825 particles and a total of 133 h with 682 176 particles were calculated before and after 1 January, respectively. The updated results for the ratio of sulfates identified as shipping emissions to ambient were 35 and 27 % before and after 1 January 2017, respectively, indicating a decrease of the at-berth shipping emission contribution to ambient sulfates.
3.5.2 The impact of atmospheric layer stability
Apart from wind direction, atmospheric layer stability is also a factor that can affect particle diffusion in exhaust plumes. However, owing to the experimental conditions and the obscure sampling location during the measurement period, the actual planetary boundary layer (PBL) height and cloud cover data were not available in this study; these factors can directly reflect the atmospheric stability. Nevertheless, atmospheric layer stability is able to be identified based on indirect parameters. According to a study on the correlation between heavy haze episodes and synoptic meteorological conditions in Beijing, China (Zheng et al., 2015b), polluted periods have been associated with a lower PBL height. This means that the atmospheric layer was found to be more stable during polluted periods than during clean periods. Moreover, according to a study by Petäjä et al. (2016), high particulate concentration decreases the height of the boundary layer via feedback mechanisms. Therefore, it can be inferred that the variation of PM2.5 and wind speed can indirectly reflect changes in atmospheric stability. Additionally, the temporal variation of CO concentrations can also reflect the local diffusion conditions as well as layer stability (Xu et al., 2011), since it is an unreactive air pollutant with a long atmospheric lifetime (two months) (Novelli et al., 1998) and mainly stems from primary emissions.
Based on the discussions above, temporal profiles of PM2.5 and CO concentrations as well as the variation of sulfate contribution from ships are presented in Fig. 11. The CO and PM2.5 data is derived from both an online monitoring instrument at the sampling site and a national monitoring site 20 km away. The trends of data from the two different sites show excellent correlation with Pearson's correlation coefficients of 0.91 and 0.88 for PM2.5 and CO (Fig. 11a and b), respectively; this indicates that our results are representative for the ambient atmospheric environment. It can also be observed that the hourly variation of PM2.5 concentrations at the sampling site was in good agreement with that of CO (r=0.76), which illustrates that the local air pollution levels were mainly determined by the meteorology conditions, and that the trends of the pollution levels near the sampling site can be applied to indirectly defining the stability of the ambient atmosphere. According to the PM2.5 concentration threshold suggested by Zheng et al. (2015b), hourly air pollution levels during the whole measurement period were classified into four categories: clean (hourly PM2.5<35 µg m−3); slightly polluted (35–115 µg m−3); polluted (115–350 µg m−3); and heavily polluted (>350 µg m−3). It was found that the hourly averaged PM2.5 concentrations during our campaign reached 147 µg m−3, and over 85 % of the total hours were under polluted conditions. Therefore, the atmospheric layer condition remained stable during most of the measurement period.
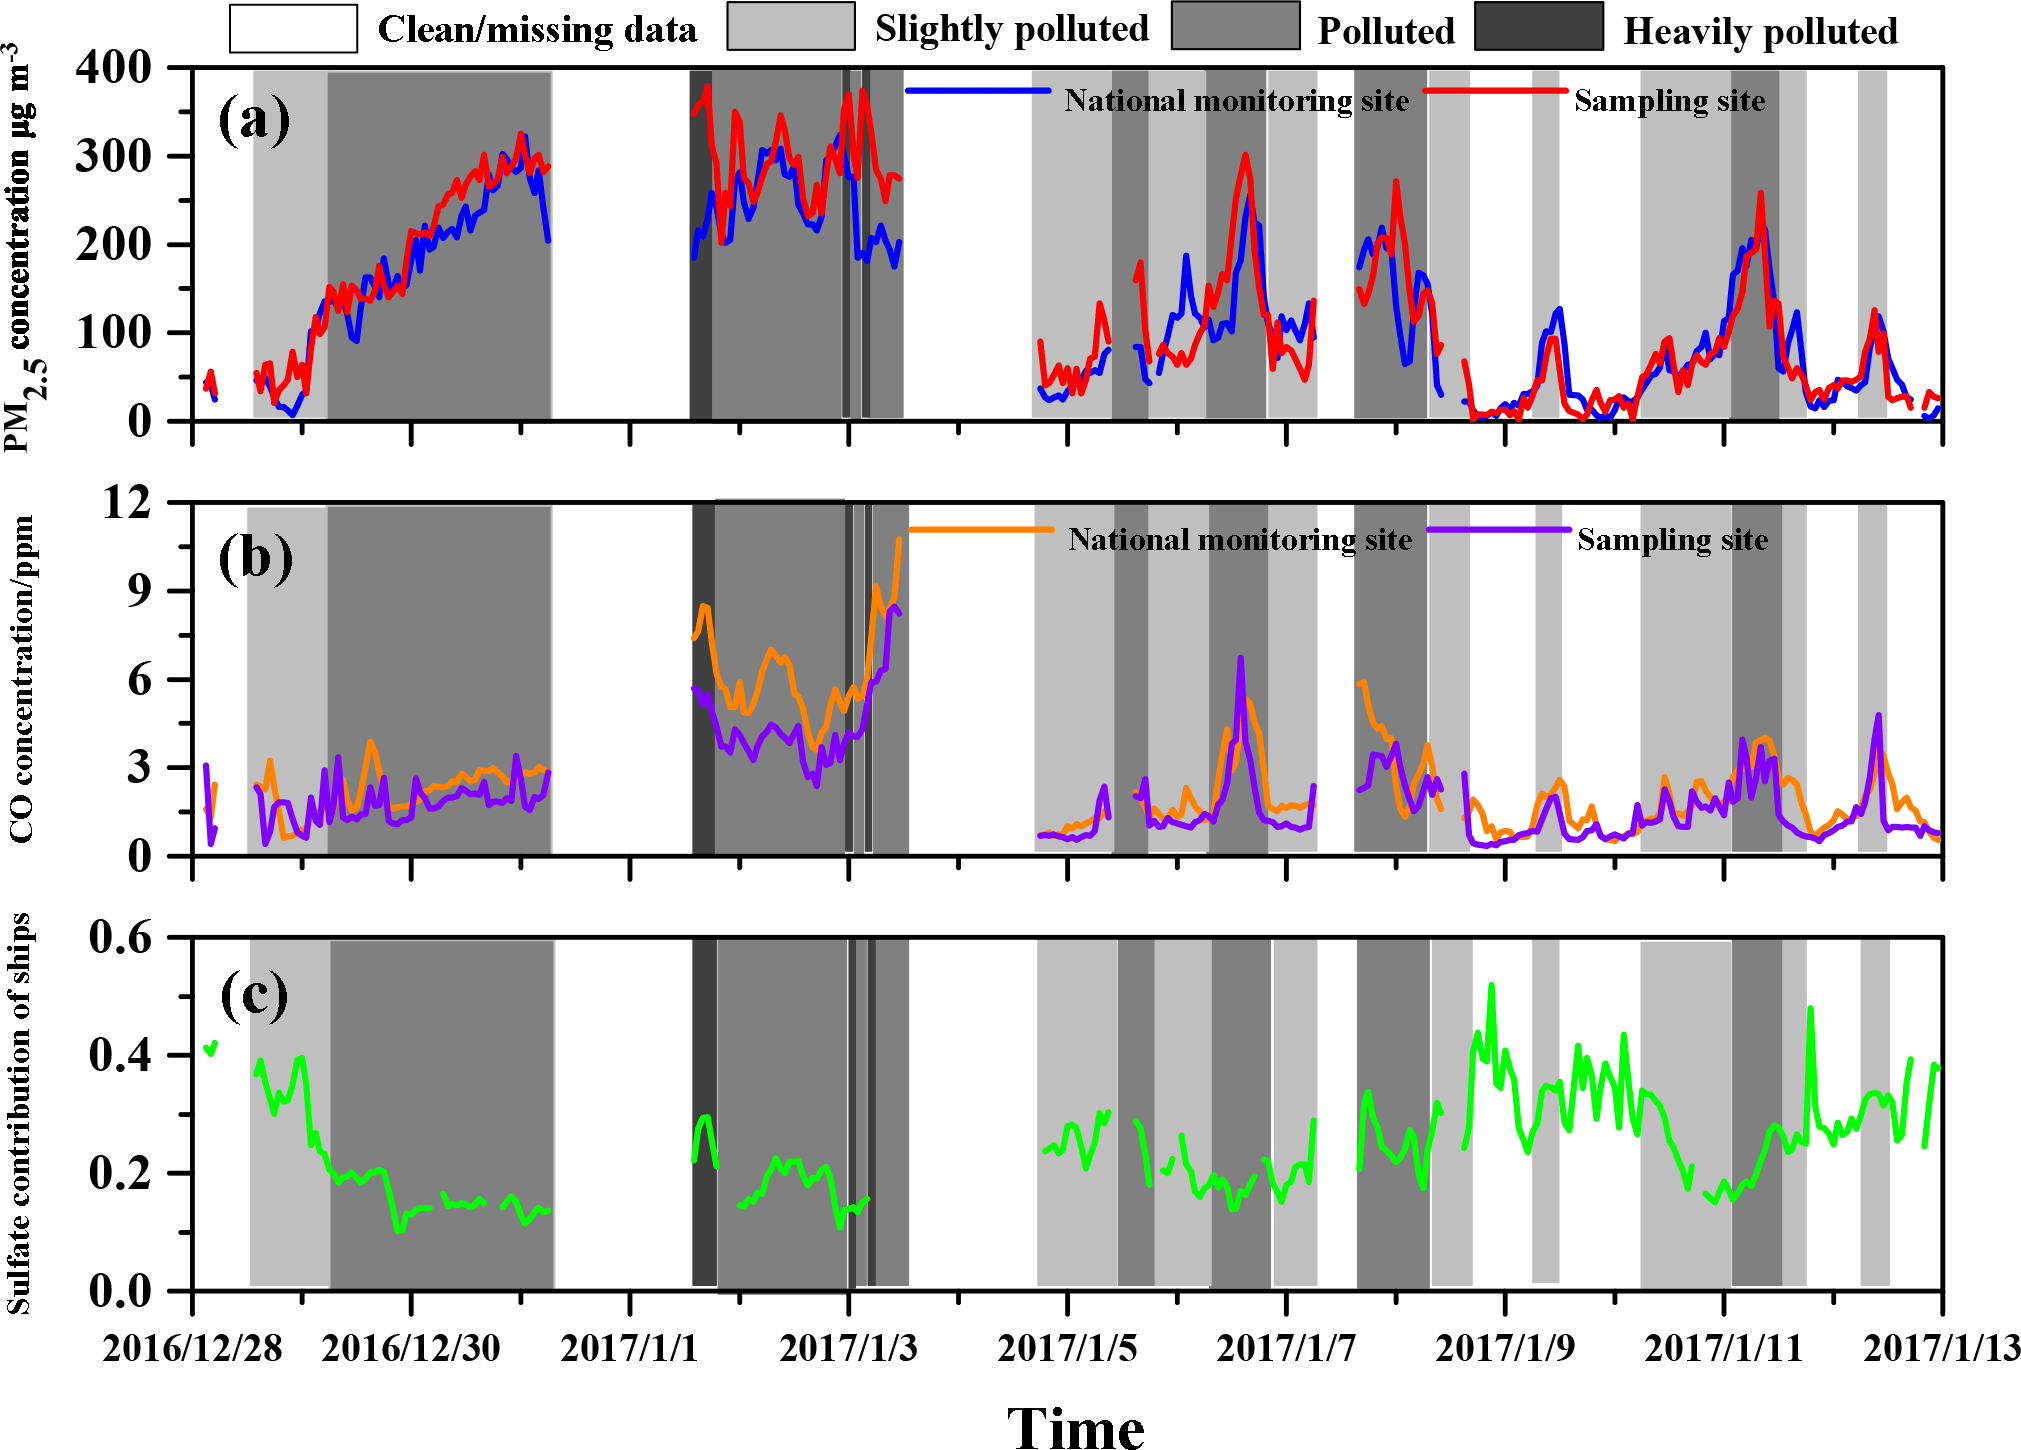
Figure 11Temporal profiles of PM2.5 concentration, CO concentration and sulfate contribution by shipping emissions. (a) PM2.5 concentration from the two monitoring sites. (b) CO concentration from the two monitoring sites. (c) Sulfate contribution from shipping emissions.
While the contribution of sulfate from ships showed an obvious converse trend to pollution levels () (Fig. 11c). The average contributions were calculated as 32.9, 27.6, 19.7 and 15.1 % during the clean, slightly polluted, polluted and heavily polluted periods, respectively. That is, when the atmospheric stability went up, the contribution of ships went go down.
The explanation for this phenomenon can be summarized according to two aspects. Firstly, during the winter haze periods in China, stable atmospheric conditions are not solely to blame for increasing the total concentration of PM2.5; secondary inorganic aerosols are also responsible, especially sulfates, which are rapidly formed via complicated heterogeneous reactions under high relative humidity (RH) (Wang et al., 2016; Cheng et al., 2016; Zheng et al., 2015a). In our study, the RH in port areas was higher than that inland, resulting in the predominance of sulfate formation during polluted periods. The effects of increased ambient sulfate concentrations on reducing the sulfate relative contributions from ships are much more significant than the increased shipping contributions due to stable atmospheric conditions. Moreover, in addition to the local diffusion conditions, the contribution of shipping emissions to the ambient air quality is also highly dependent on the real-time density of ships at berth. The number of ships at berth decreased sharply when heavy haze led to fairly poor visibility. Therefore, less shipping emissions lowered source contributions during the air pollution period. In summary, the effects of atmospheric layer stability on the sulfate contributions from ships was less important during the haze period compared with during clean days. The new Chinese sulfur limit for auxiliary engines corresponds to the global shipping limit that will apply from the year 2020. Studies have been carried out to estimate the effect of the low sulfur fuel limit. On a global level, according to Sofiev et al.'s (2018) estimation, the worldwide implementation of the 0.5 % sulfur content policy could reduce the annual average sulfate concentration by 2–4 µg m−3. However, even after the implementation of the 0.5 % sulfur limit for ships at berth, the PM and SO2 emissions still remain at a level of 770 and 2500 kt, respectively. In Chinese ports, under the scenario of all ships changing over to low sulfur fuel (< 0.5 %) in all of China's emission control areas, the remaining at-berth PM and SO2 emissions in Jing-Jin-Ji port area could reach up to 1 and 8 kt, respectively (Liu et al., 2018).
According to the source apportionment of sulfate particles in the port area, the number concentration contribution of sulfates from shipping emission at berth was lowered from 35 to 27 % after the switching fuel policy implementation on 1 January 2017. The stricter fuel sulfur limit did reduce the contribution of shipping emissions, but these emissions continue to play an important role in atmospheric pollution; electricity from land will is required to ameliorate this situation.
In general, PM and SO2 emissions can't be eliminated by merely controlling the sulfur content of fuels, though the stricter sulfur limits is an effective way to reduce emissions. Hence the option of using electricity from land will probably help maximizing the emission reduction of SO2 and PM.
Sampling of VOCs and particles from 20 ships at berth was conducted in winter at Jingtang Port from 27 December 2016 to 15 January 2017. The average VOC source profile of container ships was obtained, and SOA yields as well as ozone forming potentials were calculated based on this source profile. Comparisons were made to diesel and gasoline vehicles according to the source profiles from previous research. Secondary organic aerosol yields and ozone forming potential were 0.017 ± 0.007 g SOA g−1 VOCs and 2.63 ± 0.37 g O3 g−1 VOCs, respectively. Results showed that VOCs from ships tended to yield more secondary organic aerosol than diesel and gasoline vehicles, while ozone forming potential was comparable between the two.
SPAMS sampling and analysis provided information regarding particle average ion mass spectra, manual grouping, total and specified group size distribution as well as impact of ship-source sulfate particles on ambient atmosphere. EC, ECOC and Na-rich particles were predominant species of the total particles sampled, accounting for over 90.7 %. Size distribution indicated that most particles concentrated in the range between 0.2 and 1.4 µm, and different sorts of particles had various distribution patterns.
The issue of vanadium as tracer element was examined and the conclusion was drawn that after the fuel substitution, fuel vanadium contents had been significantly lowered. Therefore, vanadium from ship auxiliary engine exhausts no longer showed an obvious excess compared to the corresponding ambient data in most cases.
After identifying and extracting ship-source sulfate particles from ambient sulfate particles during the entire sampling period, a temporal profile with a resolution of 1 h was obtained. Comparing post-January 1st 2017 data to that of December 2016, the number contribution of sulfate particles from ships remained unchanged at a level of 24 %. When considering the wind direction, with berths at upwind, the sulfate contribution of ships at berth could be observed dropping from 35 to 27 % before and after the implementation of switching oil policy. The contribution of shipping emissions at berth to the ambient sulfates was lowered by the stricter sulfur limit in fuels. The impact of atmospheric layer stability, reflected by the concentration of PM2.5 and the primary pollutant CO, was also examined. The results showed that, with a background of frequent haze episodes and complex mechanisms of particulate accumulation and secondary formation, the impact of atmospheric stability would be weak on the sulfate contribution of shipping emissions.
Data are available upon request.
QX mainly participated in the measurements and wrote the article. ML provided instrumental and analytical support during sampling and data processing. HL conceived this study and provided guidance on the whole research process as well as manuscript revision. MF participated in designing experiments and was responsible for pilot preparations. FD helped conduct on-board sampling. ZL contributed to manuscript revision. HM, XJ and SL contributed to setting instruments. KH provided constructive comments on this research. QX and ML contributed equally to this article.
The authors declare that they have no conflict of interest.
This article is part of the special issue ”Shipping and the Environment – From Regional to Global Perspectives (ACP/OS inter-journal SI)”. It is a result of the Shipping and the Environment – From Regional to Global Perspectives, Gothenburg, Sweden, 23–24 October 2017.
This work was supported by the National Natural Science Foundation of China
(91544110&41571447), the Beijing Nova Program (Z181100006218077), the National
Research Program for Key Issues in Air Pollution Control (DQGG0201&0207),
the Special Fund of State Key Joint Laboratory of Environment Simulation and
Pollution Control (16Y02ESPCT), the National Key R&D Program
(2016YFC0201504), and the National Program on Key Basic Research
Project (2014CB441301). Mei Li was supported by the National Natural Science
Foundation of China (21607056).
Edited by: Jianzhong Ma
Reviewed by: two anonymous referees
Agrawal, H., Eden, R., Zhang, X., Fine, P. M., Katzenstein, A., Miller, J. W., Ospital, J., Teffera, S., and Rd, C. D.: Primary particulate matter from ocean-going engines in the Southern California Air Basin, Environ. Sci. Technol., 43, 5398–5402, 2009.
Andersson, C., Bergström, R., and Johansson, C.: Population exposure and mortality due to regional background PM in Europe; Long-term simulations of source region and shipping contributions, Atmos. Environ., 43, 3614–3620, 2009.
Bi, X., Zhang, G., Li, L., Wang, X., Li, M., Sheng, G., Fu, J., and Zhou, Z.: Mixing state of biomass burning particles by single particle aerosol mass spectrometer in the urban area of PRD, China, Atmos. Environ., 45, 3447–3453, 2011.
Buffaloe, G. M., Lack, D. A., Williams, E. J., Coffman, D., Hayden, K. L., Lerner, B. M., Li, S.-M., Nuaaman, I., Massoli, P., Onasch, T. B., Quinn, P. K., and Cappa, C. D.: Black carbon emissions from in-use ships: a California regional assessment, Atmos. Chem. Phys., 14, 1881–1896, https://doi.org/10.5194/acp-14-1881-2014, 2014.
Cao, X., Yao, Z., Shen, X., Ye, Y., and Jiang, X.: On-road emission characteristics of VOCs from light-duty gasoline vehicles in Beijing, China, Atmos. Environ., 124, 146–155, https://doi.org/10.1016/j.atmosenv.2015.06.019., 2015.
Carter, W. P. L.: Development of Ozone Reactivity Scales for Volatile Organic Compounds, J. Air. Waste Manage., 44, 881–899, 1994a.
Celo, V. and Dabek-Zlotorzynska, E.: Concentration and Source Origin of Trace Metals in PM2.5 Collected at Selected Canadian Sites within the Canadian National Air Pollution Surveillance Program, in: Urban Airborne Particulate Matter: Origin, Chemistry, Fate and Health Impacts, edited by: Zereini, F. and Wiseman, C. L. S., Adv. Eng. Res., 19–38, 2010.
Celo, V., Dabek-Zlotorzynska, E., and McCurdy, M.: Chemical Characterization of Exhaust Emissions from Selected Canadian Marine Vessels: The Case of Trace Metals and Lanthanoids, Environ. Sci. Technol., 49, 5220–5226, https://doi.org/10.1021/acs.est.5b00127, 2015.
Chen, G.: An investigation of the chemistry of ship emission plumes during ITCT 2002, J. Geophys. Res., 110, 257–266, https://doi.org/10.1029/2004jd005236, 2005.
Cheng, Y., Zheng, G., Wei, C., Mu, Q., Zheng, B., Wang, Z., Gao, M., Zhang, Q., He, K., and Carmichael, G.: Reactive nitrogen chemistry in aerosol water as a source of sulfate during haze events in China, Science Advances, 2, 2016.
China Port Press: China Ports Yearbook 2014, Beijing, 2014.
Corbett, J. J. and Koehler, H. W.: Updated emissions from ocean shipping, J. Geophys. Res.-Atmos., 108, 87–107, 2003.
Corbett, J. J. and Winebrake, J. J.: Emissions tradeoffs among alternative marine fuels: total fuel cycle analysis of residual oil, marine gas oil, and marine diesel oil, J. Air. Waste Manage., 58, 538–542, 2008.
Corbett, J. J., Fischbeck, P. S., and Pandis, S. N.: Global nitrogen and sulfur inventories for oceangoing ships, J. Geophys. Res.-Atmos., 104, 3457–3470, 1999.
Corbett, J. J., Winebrake, J. J., Green, E. H., Kasibhatla, P., Eyring, V., and Lauer, A.: Mortality from Ship Emissions: A Global Assessment, Environ. Sci. Technol., 41, 8512–8518, 2007.
Divita, F., Ondov, J. M., and Suarez, A. E.: Size Spectra and Atmospheric Growth of V-Containing Aerosol in Washington, DC, Aerosol. Sci. Tech., 25, 256–273, https://doi.org/10.1080/02786829608965395, 1996.
Eyring, V., Isaksen, I. S. A., Berntsen, T., Collins, W. J., Corbett, J. J., Endresen, O., Grainger, R. G., Moldanova, J., Schlager, H., and Stevenson, D. S.: Transport impacts on atmosphere and climate: Shipping, Atmos. Environ., 44, 4735–4771, https://doi.org/10.1016/j.atmosenv.2009.04.059, 2010.
Frick, G. M. and Hoppel, W. A.: Airship Measurements of Ship's Exhaust Plumes and Their Effect on Marine Boundary Layer Clouds, J. Atmos. Sci., 57, 2625–2648, 2010.
Fu, H. Y., Yan, C. Q., Zheng, M., Cai, J., Li, X. Y., Zhang, Y. J., Zhou, Z., Fu, Z., Li, M., and Li, L.: Application of on-line single particle aerosol mass spectrometry (SPAMS) for studying major components in fine particulate matter, Environm. Sci., 35, 4070–7, https://doi.org/10.13227/j.hjkx.2014.11.005, 2014.
Fu, M., Liu, H., Jin, X., and He, K.: 1 National- to port-level inventories of shipping emissions in China, Environ. Res. Lett., 12, 11, https://doi.org/10.1088/1748-9326/aa897a, 2017.
Gentner, D. R., Isaacman, G., Worton, D. R., Chan, A. W. H., Dallmann, T. R., Davis, L., Liu, S., Day, D. A., Russell, L. M., Wilson, K. R., Weber, R., Guha, A., Harley, R. A., and Goldstein, A. H.: Elucidating secondary organic aerosol from diesel and gasoline vehicles through detailed characterization of organic carbon emissions, P. Natl. Acad. Sci. USA, 109, 18318–18323, https://doi.org/10.1073/pnas.1212272109, 2012.
Hays, M. D., Beck, L., Barfield, P., Lavrich, R. J., Dong, Y., and Wal, R. L. V.: Physical and Chemical Characterization of Residential Oil Boiler Emissions, Environ. Sci. Technol., 42, 2496–2502, https://doi.org/10.1021/es071598e, 2008.
Healy, R. M., O'Connor, I. P., Hellebust, S., Allanic, A., Sodeau, J. R., and Wenger, J. C.: Characterisation of single particles from in-port ship emissions, Atmos. Environ., 43, 6408–6414, https://doi.org/10.1016/j.atmosenv.2009.07.039, 2009.
Huang, C., Wang, H. L., Li, L., Wang, Q., Lu, Q., de Gouw, J. A., Zhou, M., Jing, S. A., Lu, J., and Chen, C. H.: VOC species and emission inventory from vehicles and their SOA formation potentials estimation in Shanghai, China, Atmos. Chem. Phys., 15, 11081–11096, https://doi.org/10.5194/acp-15-11081-2015, 2015.
IMO: Emission Control Areas (ECAs) designated under MARPOL Annex VI, 2017.
Lack, D. A. and Corbett, J. J.: Black carbon from ships: a review of the effects of ship speed, fuel quality and exhaust gas scrubbing, Atmos. Chem. Phys., 12, 3985–4000, https://doi.org/10.5194/acp-12-3985-2012, 2012.
Lack, D. A., Corbett, J. J., Onasch, T., Lerner, B., Massoli, P., Quinn, P. K., Bates, T. S., Covert, D. S., Coffman, D., and Sierau, B.: Particulate emissions from commercial shipping: Chemical, physical, and optical properties, J. Geophys. Res.-Atmos., 114, D00F04, https://doi.org/10.1029/2008JD011300, 2009.
Leeuw, G. D., Andreas, E. L., Anguelova, M. D., Fairall, C. W., Lewis, E. R., O'Dowd, C., Schulz, M., and Schwartz, S. E.: Production flux of sea spray aerosol, Rev. Geophys., 49, 193–209, 2011.
Li, L., Huang, Z., Dong, J., Li, M., Gao, W., Nian, H., Fu, Z., Zhang, G., Bi, X., and Cheng, P.: Real time bipolar time-of-flight mass spectrometer for analyzing single aerosol particles, Int. J. Mass. Spectrom., 303, 118–124, 2011.
Liu, D. Y., Wenzel, R. J., and Prather, K. A.: Aerosol time-of-flight mass spectrometry during the Atlanta Supersite Experiment: 1. Measurements, J. Geophys. Res.-Atmos., 108, 8426, https://doi.org/10.1029/2001jd001562, 2003.
Liu, H., Fu, M., Jin, X., Shang, Y., Shindell, D., Faluvegi, G., Shindell, C., and He, K.: Health and climate impacts of ocean-going vessels in East Asia, Nat. Clim. Change, 6, 1037–1041, https://doi.org/10.1038/nclimate3083, 2016.
Liu, H., Meng, Z.-H., Shang, Y., Lv, Z.-F., Jin, X.-X., Fu, M.-L., and He, K.-B.: Shipping emission forecasts and cost-benefit analysis of China ports and key regions' control, Environ. Pollut., 236, 49–59, https://doi.org/10.1016/j.envpol.2018.01.018, 2018.
Liu, Z., Lu, X., Feng, J., Fan, Q., Zhang, Y., and Yang, X.: Influence of Ship Emissions on Urban Air Quality: A Comprehensive Study Using Highly Time-Resolved Online Measurements and Numerical Simulation in Shanghai, Environ. Sci. Technol., 51, 202, 2017.
Moldanová, J., Fridell, E., Popovicheva, O., Demirdjian, B., Tishkova, V., Faccinetto, A., and Focsa, C.: Characterisation of particulate matter and gaseous emissions from a large ship diesel engine, Atmos. Environ., 43, 2632–2641, 2009.
Moldanová, J., Fridell, E., Winnes, H., Holmin-Fridell, S., Boman, J., Jedynska, A., Tishkova, V., Demirdjian, B., Joulie, S., Bladt, H., Ivleva, N. P., and Niessner, R.: Physical and chemical characterisation of PM emissions from two ships operating in European Emission Control Areas, Atmos. Meas. Tech., 6, 3577–3596, https://doi.org/10.5194/amt-6-3577-2013, 2013.
Novelli, P. C., Masarie, K. A., and Lang, P. M.: Distributions and recent changes of carbon monoxide in the lower troposphere, J. Geophys. Res.-Atmos., 103, 19015–19033, 1998.
O'Dowd, C. D., Smith, M. H., Consterdine, I. E., and Lowe, J. A.: Marine aerosol, sea-salt, and the marine sulphur cycle: a short review, Atmos. Environ., 31, 73–80, 1997.
Pandolfi, M., Gonzalezcastanedo, Y., Alastuey, A., De, l. R., Jesus, D., Mantilla, E., Sanchez, D. L. C., A., Querol, X., Pey, J., Amato, F., and Moreno, T.: Source apportionment of PM10 and PM2.5 at multiple sites in the strait of Gibraltar by PMF: impact of shipping emissions, Environ. Sci. Pollut. R., 18, 260–269, 2011
Peng, Z., Ge, Y., Tan, J., Fu, M., Wang, X., Chen, M., Yin, H., and Ji, Z.: Emissions from several in-use ships tested by portable emission measurement system, Ocean. Eng., 116, 260–267, https://doi.org/10.1016/j.oceaneng.2016.02.035, 2016.
Perez, N., Pey, J., Reche, C., Cortes, J., Alastuey, A., and Querol, X.: Impact of harbour emissions on ambient PM10 and PM2.5 in Barcelona (Spain): Evidences of secondary aerosol formation within the urban area, Sci. Total. Environ., 571, 237–250, https://doi.org/10.1016/j.scitotenv.2016.07.025, 2016.
Petäjä, T., Järvi, L., Kerminen, V. M., Ding, A. J., Sun, J. N., Nie, W., Kujansuu, J., Virkkula, A., Yang, X., and Fu, C. B.: Enhanced air pollution via aerosol-boundary layer feedback in China, Sci. Rep., 6, 18998, https://doi.org/10.1038/srep18998, 2016.
Shields, L. G., Suess, D. T., and Prather, K. A.: Determination of single particle mass spectral signatures from heavy-duty diesel vehicle emissions for PM2.5 source apportionment, Atmos. Environ., 41, 3841–3852, https://doi.org/10.1016/j.atmosenv.2007.01.025, 2007.
Sippula, O., Stengel, B., Sklorz, M., Streibel, T., Rabe, R., Orasche, J., Lintelmann, J., Michalke, B., Abbaszade, G., and Radischat, C.: Particle emissions from a marine engine: chemical composition and aromatic emission profiles under various operating conditions, Environ. Sci. Technol., 48, 11721–11729, 2014.
Smith, D. and Spanel, P.: Selected ion flow tube mass spectrometry (SIFT-MS) for on-line trace gas analysis, Mass. Spectrom. Rev., 24, 661–700, 2010.
Sofiev, M., Winebrake, J. J., Johansson, L., Carr, E. W., Prank, M., Soares, J., Vira, J., Kouznetsov, R., Jalkanen, J. P., and Corbett, J. J.: Cleaner fuels for ships provide public health benefits with climate tradeoffs, Nat. Commun., 9, 406, 2018.
Song, S.: Ship emissions inventory, social cost and eco-efficiency in Shanghai Yangshan port, Atmos. Environ., 82, 288–297, https://doi.org/10.1016/j.atmosenv.2013.10.006, 2014.
Song, X.-H., Hopke, P. K., Fergenson, D. P., and Prather, K. A.: Classification of Single Particles Analyzed by ATOFMS Using an Artificial Neural Network, ART-2A, Anal. Chem., 71, 860–865, https://doi.org/10.1021/ac9809682, 1999.
Streibel, T., Schnelle-Kreis, J., Czech, H., Harndorf, H., Jakobi, G., Jokiniemi, J., Karg, E., Lintelmann, J., Matuschek, G., Michalke, B., Muller, L., Orasche, J., Passig, J., Radischat, C., Rabe, R., Reda, A., Ruger, C., Schwemer, T., Sippula, O., Stengel, B., Sklorz, M., Torvela, T., Weggler, B., and Zimmermann, R.: Aerosol emissions of a ship diesel engine operated with diesel fuel or heavy fuel oil, Environ. Sci. Pollut. R., 24, 10976–10991, https://doi.org/10.1007/s11356-016-6724-z, 2017.
Tian, L., Ho, K.-f., Louie, P. K. K., Qiu, H., Pun, V. C., Kan, H., Yu, I. T. S., and Wong, T. W.: Shipping emissions associated with increased cardiovascular hospitalizations, Atmos. Environ., 74, 320–325, https://doi.org/10.1016/j.atmosenv.2013.04.014, 2013.
Vutukuru, S. and Dabdub, D.: Modeling the effects of ship emissions on coastal air quality: A case study of southern California, Atmos. Environ., 42, 3751–3764, 2008.
Wang, G., Zhang, R., Gomez, M. E., Yang, L., Zamora, M. L., Hu, M., Lin, Y., Peng, J., Guo, S., and Meng, J.: Persistent sulfate formation from London Fog to Chinese haze, P. Natl. Acad. Sci. USA, 48, 13630–13635, 2016.
Xu, J., Li, M., Shi, G., Wang, H., Ma, X., Wu, J., Shi, X., and Feng, Y.: Mass spectra features of biomass burning boiler and coal burning boiler emitted particles by single particle aerosol mass spectrometer, Sci. Total Environ., 598, 341–352, https://doi.org/10.1016/j.scitotenv.2017.04.132, 2017.
Xu, W. Y., Zhao, C. S., Ran, L., Deng, Z. Z., Liu, P. F., Ma, N., Lin, W. L., Xu, X. B., Yan, P., He, X., Yu, J., Liang, W. D., and Chen, L. L.: Characteristics of pollutants and their correlation to meteorological conditions at a suburban site in the North China Plain, Atmos. Chem. Phys., 11, 4353–4369, https://doi.org/10.5194/acp-11-4353-2011, 2011.
Yao, Z., Shen, X., Ye, Y., Cao, X., Jiang, X., Zhang, Y., and He, K.: On-road emission characteristics of VOCs from diesel trucks in Beijing, China, Atmos. Environ., 103, 87–93, https://doi.org/10.1016/j.atmosenv.2014.12.028, 2015.
Zetterdahl, M., Moldanová, J., Pei, X., Pathak, R. K., and Demirdjian, B.: Impact of the 0.1 % fuel sulfur content limit in SECA on particle and gaseous emissions from marine vessels, Atmos. Environ., 145, 338–345, 2016.
Zhang, F., Chen, Y., Tian, C., Wang, X., Huang, G., Fang, Y., and Zong, Z.: Identification and quantification of shipping emissions in Bohai Rim, China, Sci. Total Environ., 497, 570–577, https://doi.org/10.1016/j.scitotenv.2014.08.016, 2014.
Zhang, F., Chen, Y., Tian, C., Lou, D., Li, J., Zhang, G., and Matthias, V.: Emission factors for gaseous and particulate pollutants from offshore diesel engine vessels in China, Atmos. Chem. Phys., 16, 6319–6334, https://doi.org/10.5194/acp-16-6319-2016, 2016.
Zhang, H., Lang, J., Wei, W., Cheng, S., and Gang, W.: Pollution Characteristics and Regional Transmission of PM2.5 in Tangshan, Journal of Beijing University of Technology, 43, 1252–1262, https://doi.org/10.11936/bjutxb2016090045, 2017.
Zhao, M., Zhang, Y., Ma, W., Fu, Q., Yang, X., Li, C., Zhou, B., Yu, Q., and Chen, L.: Characteristics and ship traffic source identification of air pollutants in China's largest port, Atmos. Environ., 64, 277–286, https://doi.org/10.1016/j.atmosenv.2012.10.007, 2013.
Zheng, B., Zhang, Q., Zhang, Y., He, K. B., Wang, K., Zheng, G. J., Duan, F. K., Ma, Y. L., and Kimoto, T.: Heterogeneous chemistry: a mechanism missing in current models to explain secondary inorganic aerosol formation during the January 2013 haze episode in North China, Atmos. Chem. Phys., 15, 2031–2049, https://doi.org/10.5194/acp-15-2031-2015, 2015a.
Zheng, G. J., Duan, F. K., Su, H., Ma, Y. L., Cheng, Y., Zheng, B., Zhang, Q., Huang, T., Kimoto, T., Chang, D., Pöschl, U., Cheng, Y. F., and He, K. B.: Exploring the severe winter haze in Beijing: the impact of synoptic weather, regional transport and heterogeneous reactions, Atmos. Chem. Phys., 15, 2969–2983, https://doi.org/10.5194/acp-15-2969-2015, 2015b.