the Creative Commons Attribution 4.0 License.
the Creative Commons Attribution 4.0 License.
 | 03 Jul 2018
High occurrence of new particle formation events at the Maïdo high-altitude observatory (2150 m), Réunion (Indian Ocean)
Brice Foucart
Karine Sellegri
Pierre Tulet
Clémence Rose
Jean-Marc Metzger
David Picard
This study aims to report and characterise the frequent new particle formation (NPF) events observed at the Maïdo observatory, Réunion, a Southern Hemisphere site located at 2150 m (a.s.l.) and surrounded by the Indian Ocean. From May 2014 to December 2015, continuous aerosol measurements were made using both a differential mobility particle sizer (DMPS) and an air ion spectrometer (AIS) to characterise the NPF events down to the lowest particle-size scale. Carbon monoxide (CO) and black carbon (BC) concentrations were monitored, as well as meteorological parameters, in order to identify the conditions that were favourable to the occurrence of nucleation in this specific environment. We point out that the annual NPF frequency average (65 %) is one of the highest reported so far. Monthly averages show a bimodal variation in the NPF frequency, with a maximum observed during transition periods (autumn and spring). A high yearly median particle growth rate (GR) of 15.16 nm h−1 is also measured showing a bimodal seasonal variation with maxima observed in July and November. Yearly medians of 2 and 12 nm particle formation rates (J2 and J12) are 0.858 and 0.508 cm−3 s−1, respectively, with a seasonal variation showing a maximum during winter, that correspond to low temperature and RH typical of the dry season, but also to high BC concentrations. We show that the condensation sink exceeds a threshold value (1.04×10⁻³ s−1) with a similar seasonal variation than the one of the NPF event frequency, suggesting that the occurrence of the NPF process might be determined by the availability of condensable vapours, which are likely to be transported together with pre-existing particles from lower altitudes.
- Article
(9815 KB) - Full-text XML
- BibTeX
- EndNote


Aerosol concentrations in the atmosphere influence the Earth's radiative balance, and the formation and lifetime of clouds (Seinfeld and Pandis, 2016; Makkonen et al., 2012). Unlike the primary sources of aerosols, such as soil erosion, sea salt, and volcanic ash, nucleation is a gas-to-particle conversion process leading to the formation of new secondary aerosol particles. Nucleation and subsequent growth are responsible for new particle formation (NPF) events, observed in various environments around the world (Kulmala et al., 2004) but still rarely in the Southern Hemisphere. The frequency, intensity, and duration of NPF events is highly variable according to the location where they are observed. The occurrence and characteristics of NPF episodes depend on various factors, including the emission strength of precursors, the number concentration of the pre-existing aerosol population, and meteorological parameters (in particular solar radiation, temperature, and relative humidity), which directly influence photo-chemical processes (Kulmala, 2003; Martin et al., 2010; Hallar et al., 2016). However, the relationship between these environmental parameters and the characteristics of NPF events is not fully understood and it is still a challenge to predict when an NPF event will take place and how intense it will be (Kulmala et al., 2004; Yu et al., 2008). Consequently, there is still a need to report and describe NPF in environments that have not yet been investigated, notably in the Southern Hemisphere in general and more particularly for both marine and high-altitude tropical sites. These kinds of environments present true specificity in terms of RH variability, emission types (volatile organic compounds ,VOCs, and marine sources), and atmospheric dynamics. Previous studies that have been conducted in the Southern Hemisphere relate to South Africa (Hirsikko et al., 2012), with a low-latitude medium-altitude (1400 m) site; South America (Rose et al., 2015b) and Australia (Bates et al., 1998), with medium-latitude high-altitude sites; and Antarctica (Koponen et al., 2003) as a high-latitude area. Hirsikko et al. (2012) published the highest NPF frequency ever reported, of about 86 %, explaining that both the local sources (strong mining pollution) and regional conditions affected the NPF variation. Recently, Rose et al. (2015b) proposed a low-latitude zone analysis of NPF at Chacaltaya (CHC) in Bolivia, which is one of the highest in situ measurement sites in the world (5240 m). They too found a very high NPF frequency of about 63.9 %. This value has been partly explained by lower concentrations of pre-existing particles than at lower altitudes, leading to smaller loss of gaseous precursors, while photochemical activity is enhanced by higher radiation. In addition, at high-altitude stations, turbulence at the interface between the boundary layer (BL) and the free troposphere (FT) might promote nucleation and growth processes (Hamburger et al., 2011). In general, high-altitude sites report relatively high NPF event frequencies, such as 35 % at the Nepal Climate Observatory (5079 m; Venzac et al., 2008) or 35.9 % at the Puy de Dôme station (1465 m; Boulon et al., 2011a).
Réunion, which is located at low latitude (21∘ S) in an inter-tropical area surrounded by the Indian Ocean, is still poorly documented. The island, which was partly shaped by the active basaltic volcano of Piton de la Fournaise (PdF), is characterised by angular landforms and steep slopes. The interaction of the high, mountainous terrain with the synoptic flow induces large variability in wind fields at the local scale. The maritime and tropical location of the island combined with the complexity of the terrain and wind exposure implies a multitude of local circulations and weather, marked by large variations in temperature and precipitation. These complex atmospheric dynamics added to a large variety of primary and secondary NPF sources (marine, organic and anthropogenic) gives special interest to this study. The Maïdo observatory is located at 2150 m a.s.l., under the influence of the marine BL during daytime and of the FT during nighttime. The main objective of this study is to reinforce the observations of NPF events in the Southern Hemisphere and more particularly for a site that is both marine and at high altitude. We first describe how NPF was observed at the site by differential mobility particle sizer (DMPS) and air ion spectrometer (AIS) interpolation (Sect. 4.1). Based on a more than one-year data set of clusters and aerosol size distributions, secondly we report the frequency (Sect. 4.2), the intensity (Sect. 4.3), and the characteristics of the events, and describe their seasonality. Thirdly, we analyse their annual variations with respect to the meteorological parameters (Sect. 4.4) and the pre-existing particle concentration (Sect. 4.5).
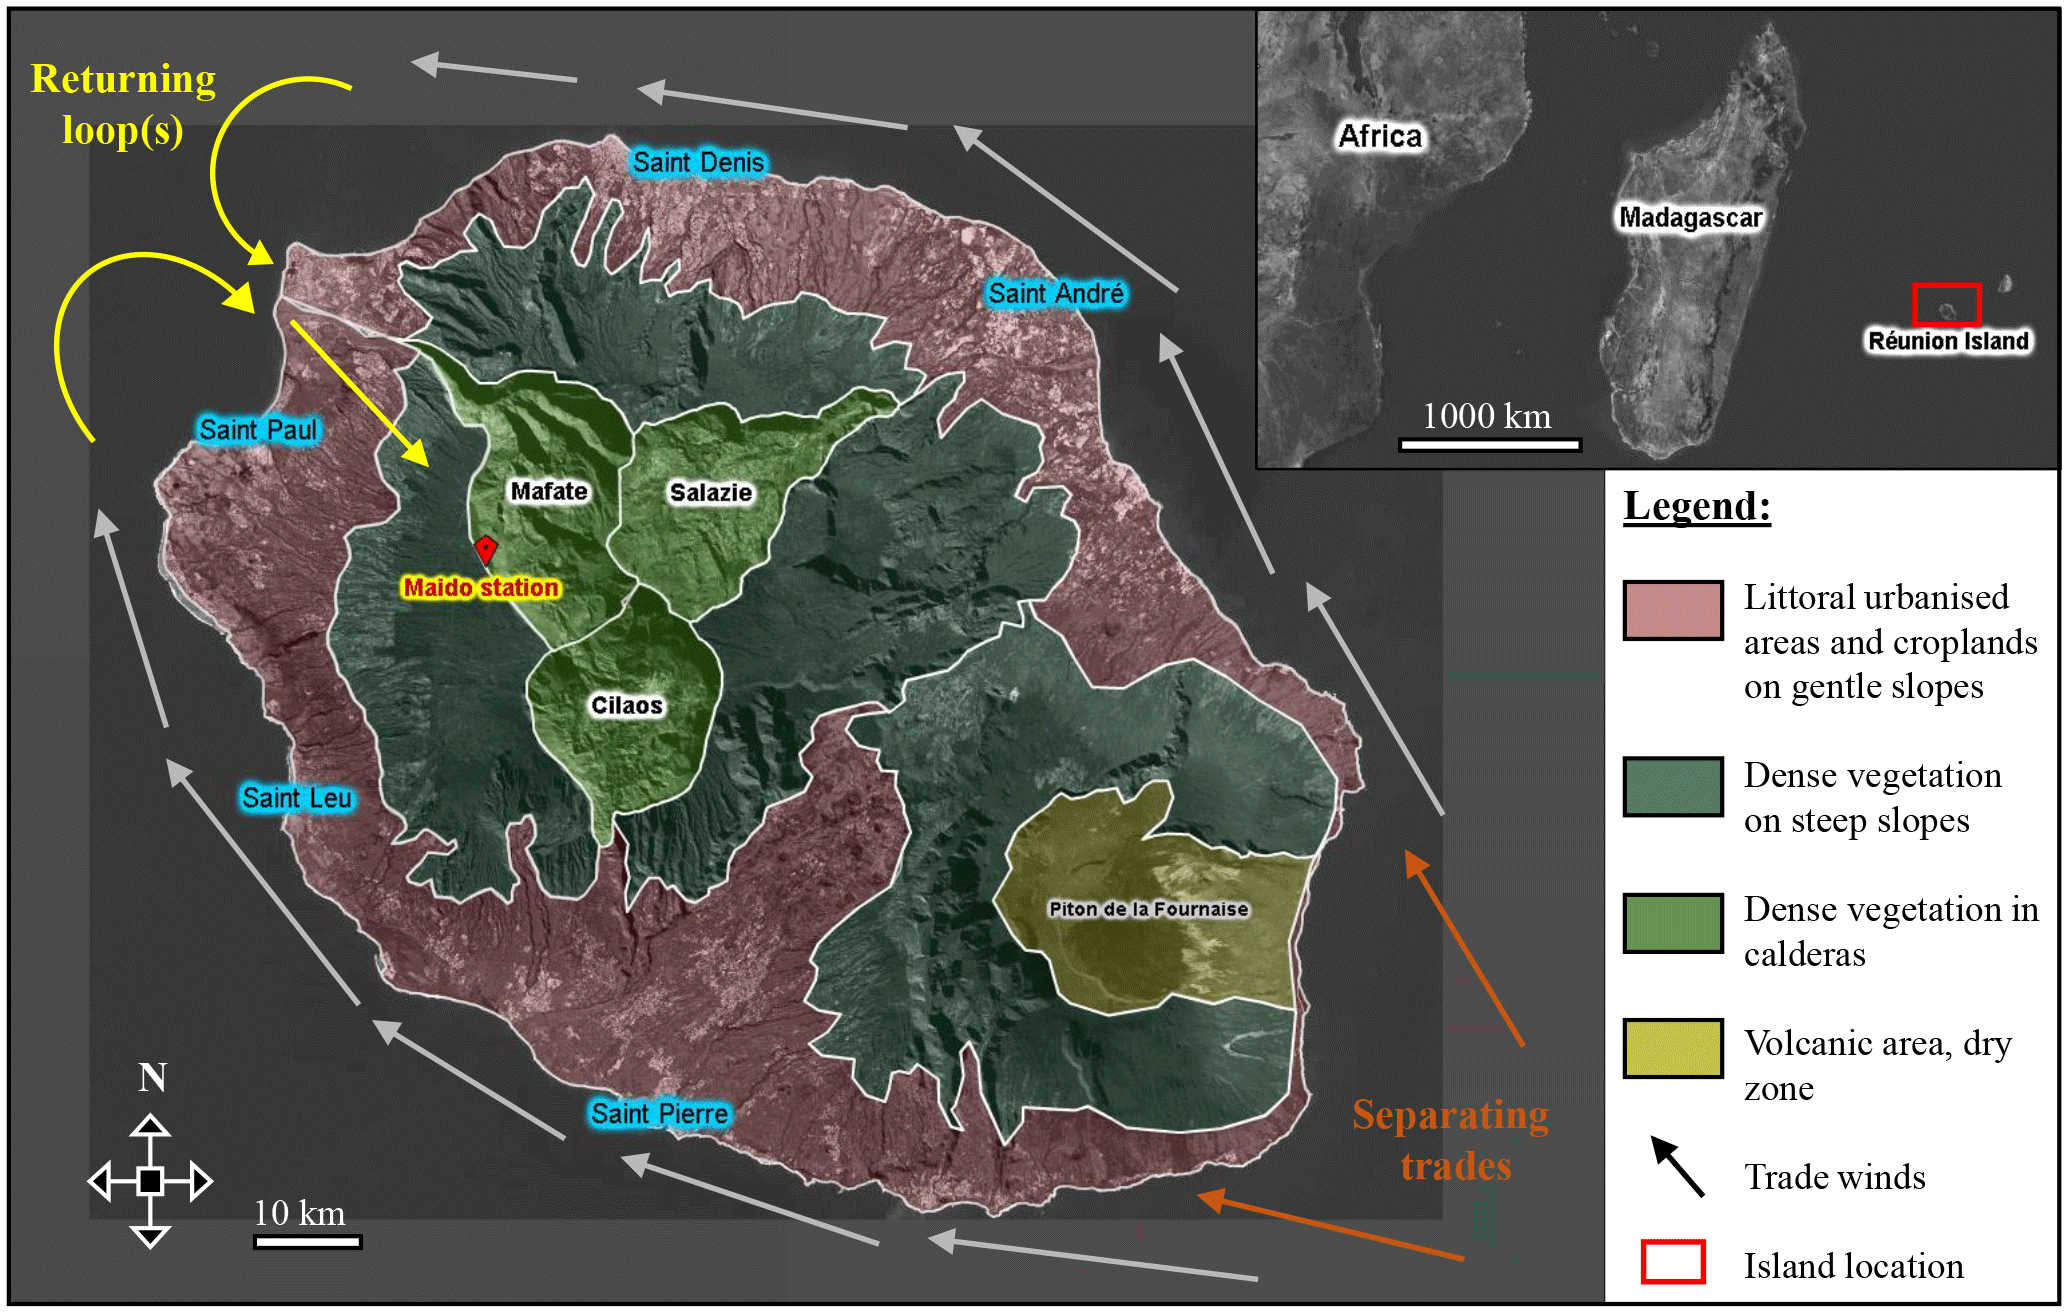
Figure 1Map of Réunion and its location. Different terrain types are represented as well as a simplification of the local atmospheric dynamic pattern around the island.
2.1 Geographical location and networks
Maïdo observatory (21.080∘ S, 55.383∘ E) is situated on Réunion in the Indian Ocean. There are very few multi-instrumented stations in the tropics, and particularly in the Southern Hemisphere (Baray et al., 2013), so the Maïdo observatory was built in 2012 to respond to the needs of major international networks like NDACC (Network for the Detection of Atmospheric Composition Change; http://www.ndacc.org, last access: 25 June 2018) and ACTRIS (Aerosols, Clouds, and Trace gases Research Infra-Structure network). It is a high-altitude station (2150 m), which opens up new perspectives in upper troposphere and lower stratosphere studies. Belonging to the Global Atmosphere Watch regional network (GAW), it also conducts in situ measurements to characterise the atmospheric composition of the lower troposphere. The facility dominates the natural amphitheatre of Mafate, characterised by lush tropical vegetation, to the east and the highland tamarind forests to the west. The nearest urban areas are the coastal cities of Saint-Paul and Le Port with 105 000 and 40 000 inhabitants located 13 and 15 km away from the Maïdo observatory, respectively (Fig. 1).
2.2 Large- and local-scale atmospheric dynamics
On a large scale, the island is located in the descending part of the south Hadley cell (Baldy et al., 1996). It is subject to the intertropical zone atmospheric circulation, which is characterised by a trade wind flow from the south-east in this lower layer, induced by the Hadley cell and accentuated by more zonal driving by the Walker circulation. This lower layer flow is limited in altitude (about 3 km) by westerly winds (westerlies), which constitute the return of the Hadley–Walker circulation. In terms of rainfall, Réunion is characterised by two seasons: the hot, wet season from January to March (southern summer) and the cold, dry season (southern winter), which is longer, lasting from May to November (Baray et al., 2013). April and December are transition months that can be rainy or dry. In the southern summer, the Inter-Tropical Convergence Zone (ITCZ) is situated in the Southern Hemisphere and sometimes reaches Réunion. Over the inversion layer, the westerly flow (between 30∘ N and 30∘ S) and west winds weaken and are strongly affected by the context of heavy rains. During the southern winter, the subtropical high pressures are more powerful than during the southern summer and maintain the synoptic subsidence (descending branch of the Hadley cell) that generates and feeds both the stream of faster moving trade winds on the Mascarene region and the subtropical jet at high altitudes.
On a local scale, it is possible to observe two major atmospheric phenomena on both sides of the island. Trade winds coming from the south-east are separated (Fig. 1) by the high topography of Réunion, which acts as an obstacle (Lesouëf et al., 2011). They are confined under the inversion layer and forced to bypass the island, forming two branches (Soler, 2000). During the day, a returning loop (Fig. 1) forms in the north-east when the winds converge. The inversion of the circulation then brings the winds under the cities of Saint-Paul and Le Port up to the heights towards the Maïdo station. Moreover, the interaction between the trade winds and the abrupt relief of Réunion creates strong climate asymmetry and many microclimates. The warming of mountain slopes by solar radiation during the day, or radiative cooling overnight, is transmitted to the surrounding air layers and creates a complex local circulation. The nocturnal surface radiative cooling induces a cold katabatic wind on the slopes and clears the atmosphere at the Maïdo station, leaving the observatory in the FT, disconnected from the anthropogenic pollution. Thus there are few clouds during the nighttime. After midday, the sea breeze cumulated in the returning loop wind direction generates upward winds on the slopes which transport particles to the high station, accompanied by orographic and slope cloud formation. The surface radiative warming tends to create convection and then form vertical clouds located at the top of the relief. The number of nights with clear sky is then very large in comparison with the coastal site of Saint-Denis, where lidars were operated from 1994 to 2011 (Baray et al., 2013).
2.3 Volcanic activity
Several studies have provided evidence that high SO2 concentrations and high radiation levels favour the formation of large amounts of H2SO4, which in turn contribute to particle formation (Hyvönen et al., 2005; Mikkonen et al., 2006; Petäjä et al., 2009) and growth (Boy et al., 2005; Sihto et al., 2006; Mikkonen et al., 2011). Except for some altitude cases where the role of sulfuric acid in nucleation is limited (Boulon et al., 2011a; Rose et al., 2015b; Bianchi et al., 2016), H2SO4 is thought to be among the major precursors of NPF due to its low saturating vapour pressure under conventional atmospheric temperature conditions (Kulmala and Kerminen, 2008). The Maïdo observatory can be on the pathway of sporadic SO2 volcanic plumes emitted from the Piton de la Fournaise (PdF) volcano, located to the south of the island (Fig. 1). In 2015, four eruptions were observed (Peltier et al., 2016) and multidisciplinary tracking of a volcanic gas and aerosol plume was conducted by Tulet et al. (2017). Unfortunately, H2SO4 was not measured but their results indicated that the Maïdo station was reached by the plume many times, as evidenced by the detection of SO2 concentration peaks (Fig. A1). Specifically in a volcanic plume environment, Boulon et al. (2011b) directly observed NPF events within the Eyjafjallajökull volcanic plume that reached the Puy de Dôme station, and related them to the presence of high H2SO4 concentrations. During the PdF eruption that took place in April 2007, Tulet and Villeneuve (2011) used OMI and CALIOP space sensor data to estimate a total SO2 release of 230 kt, 60 kt of which was transformed into H2SO4, mostly above the Indian Ocean at 6 km a.s.l. As a first analysis, we focus on the parameters influencing NPF processes at the Maïdo station outside the very specific conditions encountered during a volcanic plume advection, which will be the topic of a separate study. Data were therefore screened for the presence of the Piton de la Fournaise plume at the station. The volcanic plume was considered to be present when the SO2 concentration reached values higher than 1 ppb (hourly average), which is the 97th percentile estimated on non-eruptive days. According to Boulon et al. (2011b), this threshold also represented a lower limit of the presence of the plume at the Puy de Dôme station. Consequently, 47 daytime plume days that occurred during three eruptive periods (Fig. A1) were listed and removed from the 2015 data set.
2.4 Instrumentation
The aerosol and ion size distributions used in the present study were measured continuously from 1 January to 31 December 2015 at the Maïdo observatory. The size distribution of the 10–500 nm aerosol particles was measured with a differential mobility particle sizer (DMPS) while the size distribution of the 0.8–42 nm ions was measured with an air ion spectrometer (AIS). Here we use ion size distributions below 10 nm as tracers for the presence of neutral particles below 10 nm in size that could not be detected directly. Additional DMPS measurements conducted between May and December 2014 will also be discussed briefly in Sect. 4.1 to evaluate the interannual variability of the nucleation frequency.
The DMPS was custom-built with a TSI-type differential mobility analyzer (DMA) operating in a closed loop and a condensation particle counter (CPC, TSI model 3010). Particles were charged to equilibrium using an Ni-63 bipolar charger at 95 MBq. The quality of the DMPS measurements was checked for flow rates and RH according to the ACTRIS recommendations (Wiedensohler et al., 2012). DMPS measurements were performed down a whole air inlet with a higher size cut-off of 25 µm (under average wind speed conditions of 4 m s−1).
The AIS was developed by Airel, Estonia, for in situ high time-resolution measurements of ions and charged particles (Mäkelä et al., 1996; Mirme et al., 2007). The device consists of two DMA arranged in parallel, which allows for the simultaneous measurement of both negatively and positively charged particles. Each of the two analysers operates with a total flow of 90 L min−1: 30 L min−1 of air to be sampled and 60 L min−1 of clean air (or carrier gas) circulating in a closed loop. The AIS was directly connected to ambient air through a 30 cm long copper inlet 2.5 cm in diameter, to limit cluster ion losses along the sampling line.
The global radiation was measured using a sunshine pyranometer (SPN1, Delta-T Devices Ltd.) with a resolution of 0.6 W m. The auxiliary measurements used in the present study were the wind direction, the wind speed, the air temperature, the barometric pressure, and the relative humidity. They were measured using the Vaisala weather transmitter WXT510 (http://www.vaisala.com, last access: 25 June 2018).
The analyser used to measure sulfur dioxide (SO2) concentrations uses the ultraviolet fluorescence method, standard NF EN 14212. The molecules are excited under the action of intense, constant UV radiation (214 nm). Sulfur dioxide then de-energises very quickly by emitting higher wavelength radiation (between 320 and 380 nm) than the excitation step. SO2 concentration was finally calculated by means of a photomultiplier. Data sets were provided by the Observatoire Réunionnais de l'Air (ORA). The SO2 analyser resolution was about 0.5 ppb, and outside eruptive periods it never exceeded this threshold (Fig. A1). The corresponding data were used only to list days that were characterised by the presence of the volcanic plume at the Maïdo observatory.
CO monitoring was performed using a PICARRO G2401 analyzer which is compliant with international ambient atmospheric monitoring networks, including the World Meteorological Organization (WMO) and the Integrated Carbon Observation System (ICOS; https://www.icos-ri.eu/, last access: 25 June 2018). It was the property of BIRA-IASB (Belgian Institute for Space Aeronomy).
Figure 2 shows the availability of data for the main aerosol and gas-phase parameters used in this study. The best instrument synchronisation period was from May to November.
The classification of event days was achieved visually using the contour plot of the DMPS size distribution. The positive and negative ion size distributions provided by the AIS confirmed the status of the event when available. Days were classified and separated into three main groups: undefined, (UN) non-event (NE), and event (E) days according to Dal Maso et al. (2005).
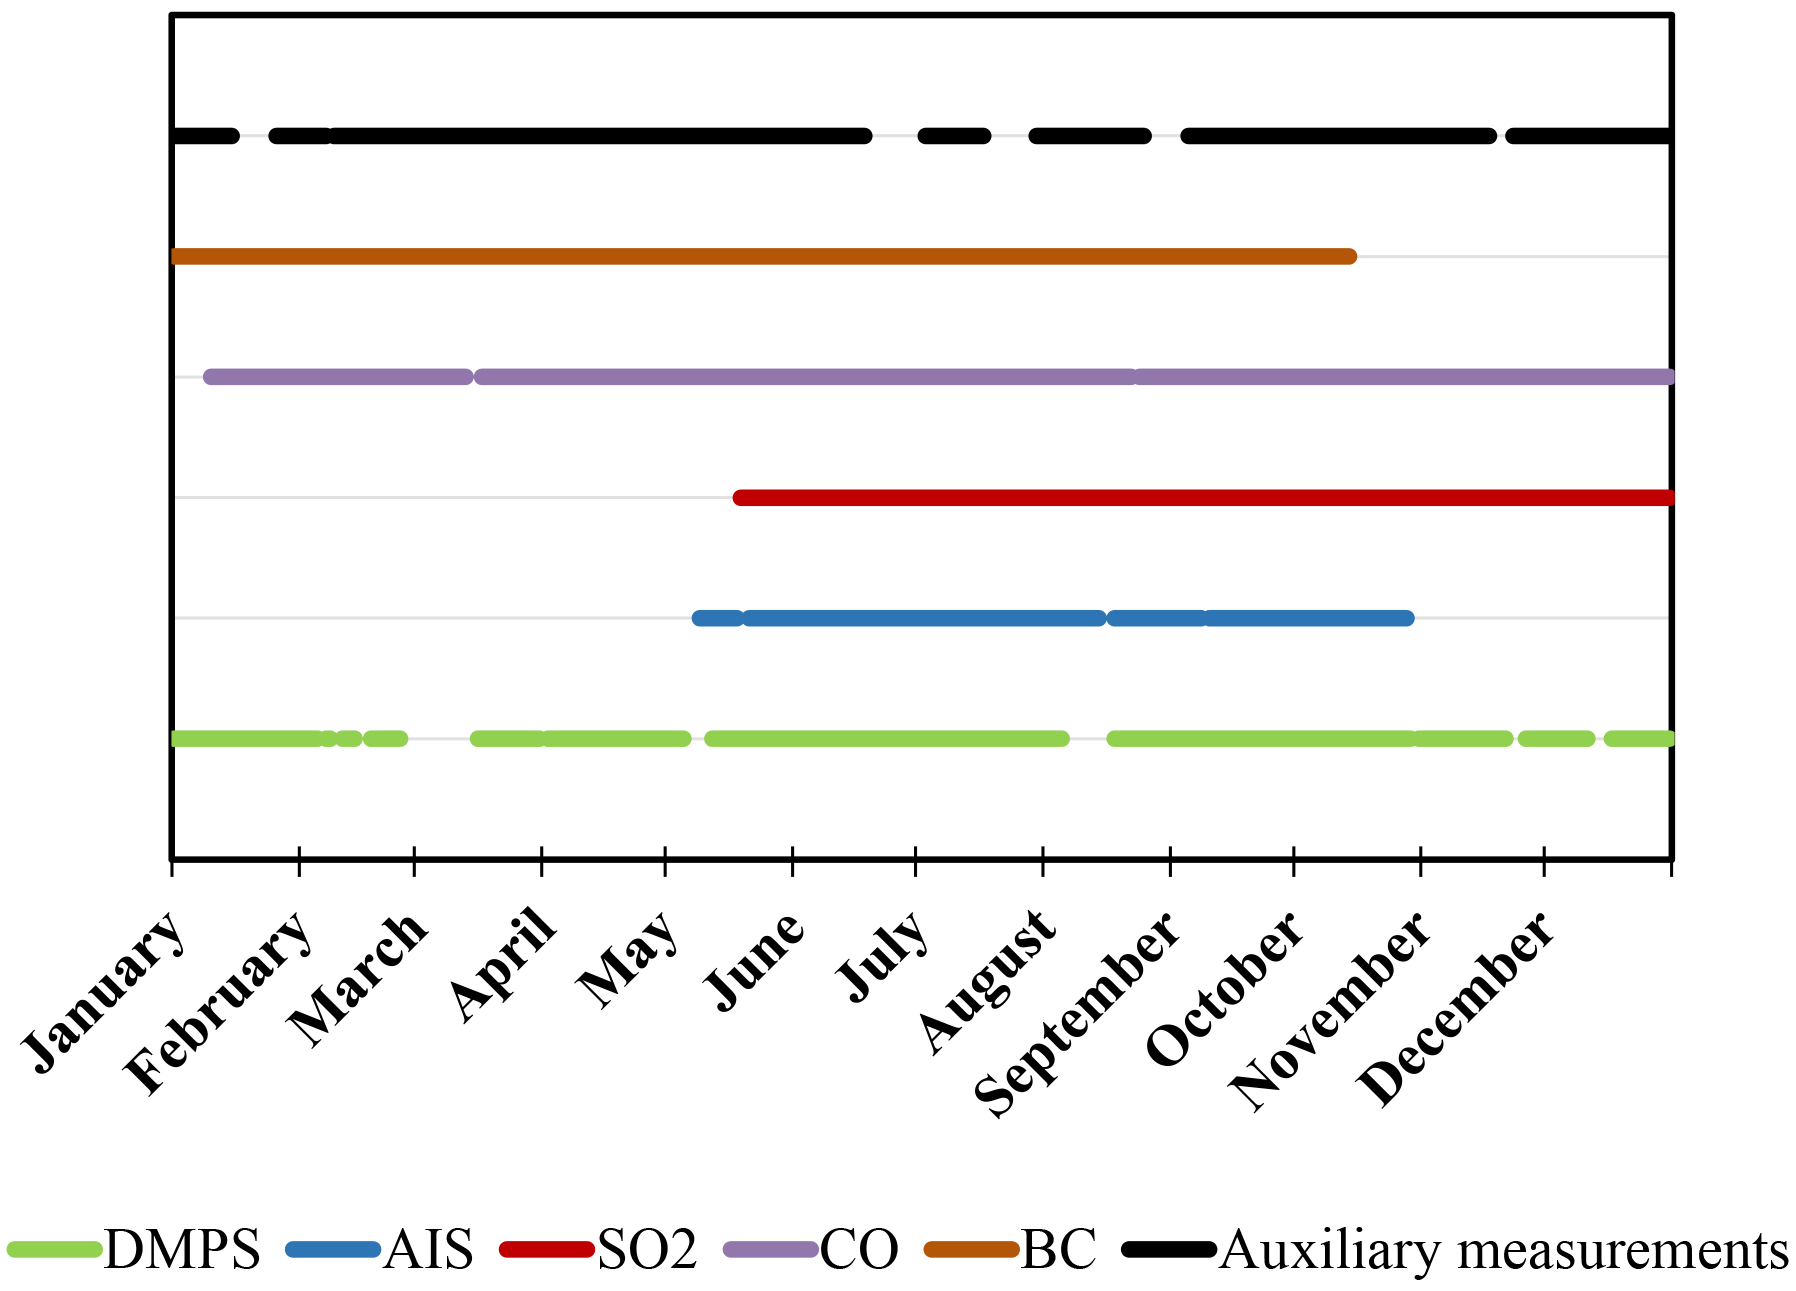
Figure 2Data set from the 2015 Maïdo campaign. Devices recorded data simultaneously from May to November.
The monthly event frequency, fm, was calculated as the ratio of event to numbers of days in months, after having excluded undefined, missing and plume days (PD) according to Eq. (1):
The condensation sink (CS; s−1), which represents the loss rate of vapours on pre-existing particles, was calculated from the DMPS size distributions according to Kulmala et al. (2001) Eq. (2):
where Dvap is the condensable vapour diffusion coefficient, r the particle radius, and N(r) the concentration of particles of radius r. Coefficient β(r) was calculated from the Knudsen number and is given by Eq. (3):
where Kn(r) is the Knudsen number given by , with λ corresponding to the particle free path (depending on pressure and temperature) and the accommodation coefficient α, usually set at 1. The condensation sink was calculated with a 5 min time resolution. As the particles are dried in the DMPS, we are aware that the CS, which depends on the diameter of wet particles, was underestimated.
The particle growth rate (GR; nm h−1) was determined using the “maxima” method of Hirsikko et al. (2005). The method searches, usually over the AIS channel size, for the time that corresponds to the maximum concentration in each size channel. As the DMPS offers a much more extended data set than the AIS, we applied the method to the DMPS 12–19 nm size range for which the lower limit (12 nm) was defined by the smallest channel of the device. In order to detect the concentration maximum, a normal distribution was fitted to the time evolution of the concentration for each channel. GR corresponded to the slope of the linear regression on the time–diameter pairs.
The formation rate of 12 nm particles, J12, (cm−3 s−1) was calculated using the following Eq. (4) given by Kulmala et al. (2007):
where N12−19 is the concentration corresponding to 12 to 19 nm particle diameters, CoagS12 represents the coagulation of 12–19 nm particles on pre-existing larger diameter particles and GR12−19 corresponds to the growth rate estimated between 12 and 19 nm. It was then possible to derive the nucleation rates of particles 2 nm in size, J2, from the J12 previously calculated from DMPS and the growth rate of particles between 12 and 19 nm, following the method first introduced by Kerminen and Kulmala (2002) and improved by Lehtinen et al. (2007) with Eq. (5):
where
and
4.1 Dynamics of the NPF events at the Maïdo observatory
The origin of the newly formed particles at a given site can be attributed to the local environment only if newly formed particles are detected at the smallest size range, when clusters just formed and had no time yet to grow. Thus, we used both the AIS and DMPS size distribution to investigate the evolution of NPF event at Maïdo. The AIS covers the size range between 0.90 and 46.2 nm while the DMPS covers the size range between 11.78 and 706.77 nm. Temporal interpolation was first performed to harmonise the DMPS and the AIS data sets to a 5 min resolution. For visual inspection of the consistency of the two data sets, hybrid plots were drawn up showing the AIS negative ion concentration up to 12 nm and then the particle concentration from the DMPS for larger sizes. Figure 3a shows an example of an NPF event followed by the two devices on 6 July 2015. Typically, NPF events observed at the Maïdo observatory show an increase in small ion concentrations (2–5 nm) at dawn (06:00 UTC, corresponding to 10:00 LT). These small ions are tracers for small particles of the same size that rapidly grow to the first DMPS size classes within the next hour. The initiation of the formation of new particles at 06:00 UTC (10:00 LT) is followed by the appearance of accumulation mode particles. Further growth of the newly formed particles is generally accompanied by the simultaneous growth of the accumulation mode particles, starting around 07:00 UTC (11:00 LT), that are likely representative of the updraught of BL air to the station. We computed the diurnal variation in BC, a good indicator of any anthropogenic, hence BL, influence. The corresponding diurnal variation in both BC (ng m−3) and CO (ppm) are shown in Fig. 3b. BC and CO concentrations clearly increase from 06:30 UTC (when ignoring early sharp peaks that may be due to local contamination), which is 30 min later than the occurrence of the cluster mode particles. We observe this common delay for all of the other NPF event figures that are available in the appendix. Thus, we suggest that nucleation is not initiated within the BL but at the interface between the BL and FT where a mixing of air masses of different composition may be promoting nucleation. Hence, we can hypothesise that boundary air convection to the site is a trigger for NPF events, most particularly when the interface BL–FT is sampled. At 07:00 UTC, as the accumulated particle concentration increase from 2000 to 8000 particles cm−3, the BC and CO concentrations also increase to reach 630 ng m−3 and 0.075 ppm at 09:00, when the BL is fully sampled at the site. At the end of the afternoon, the accumulation mode particle concentrations drop to less than 1000 particles cm−3 and tracer concentrations drop to low values. Most high-altitude stations are strongly influenced by FT air during nighttime regardless of the season, but mostly during wintertime (Venzac et al., 2008; Rose et al., 2015a). This is also true for stations located in complex terrains such as Jungfraujoch station in the Swiss Alps (Herrmann et al., 2015) and at the Chacaltaya station in the Andes (Rose et al., 2015b). These are indicators that the station lays in the FT at night. The Aitken mode particles (from 20 to 100 nm) present during nighttime at the station are hence likely present in the FT and are sampled at the site in subsiding air masses (Tulet et al., 2017).
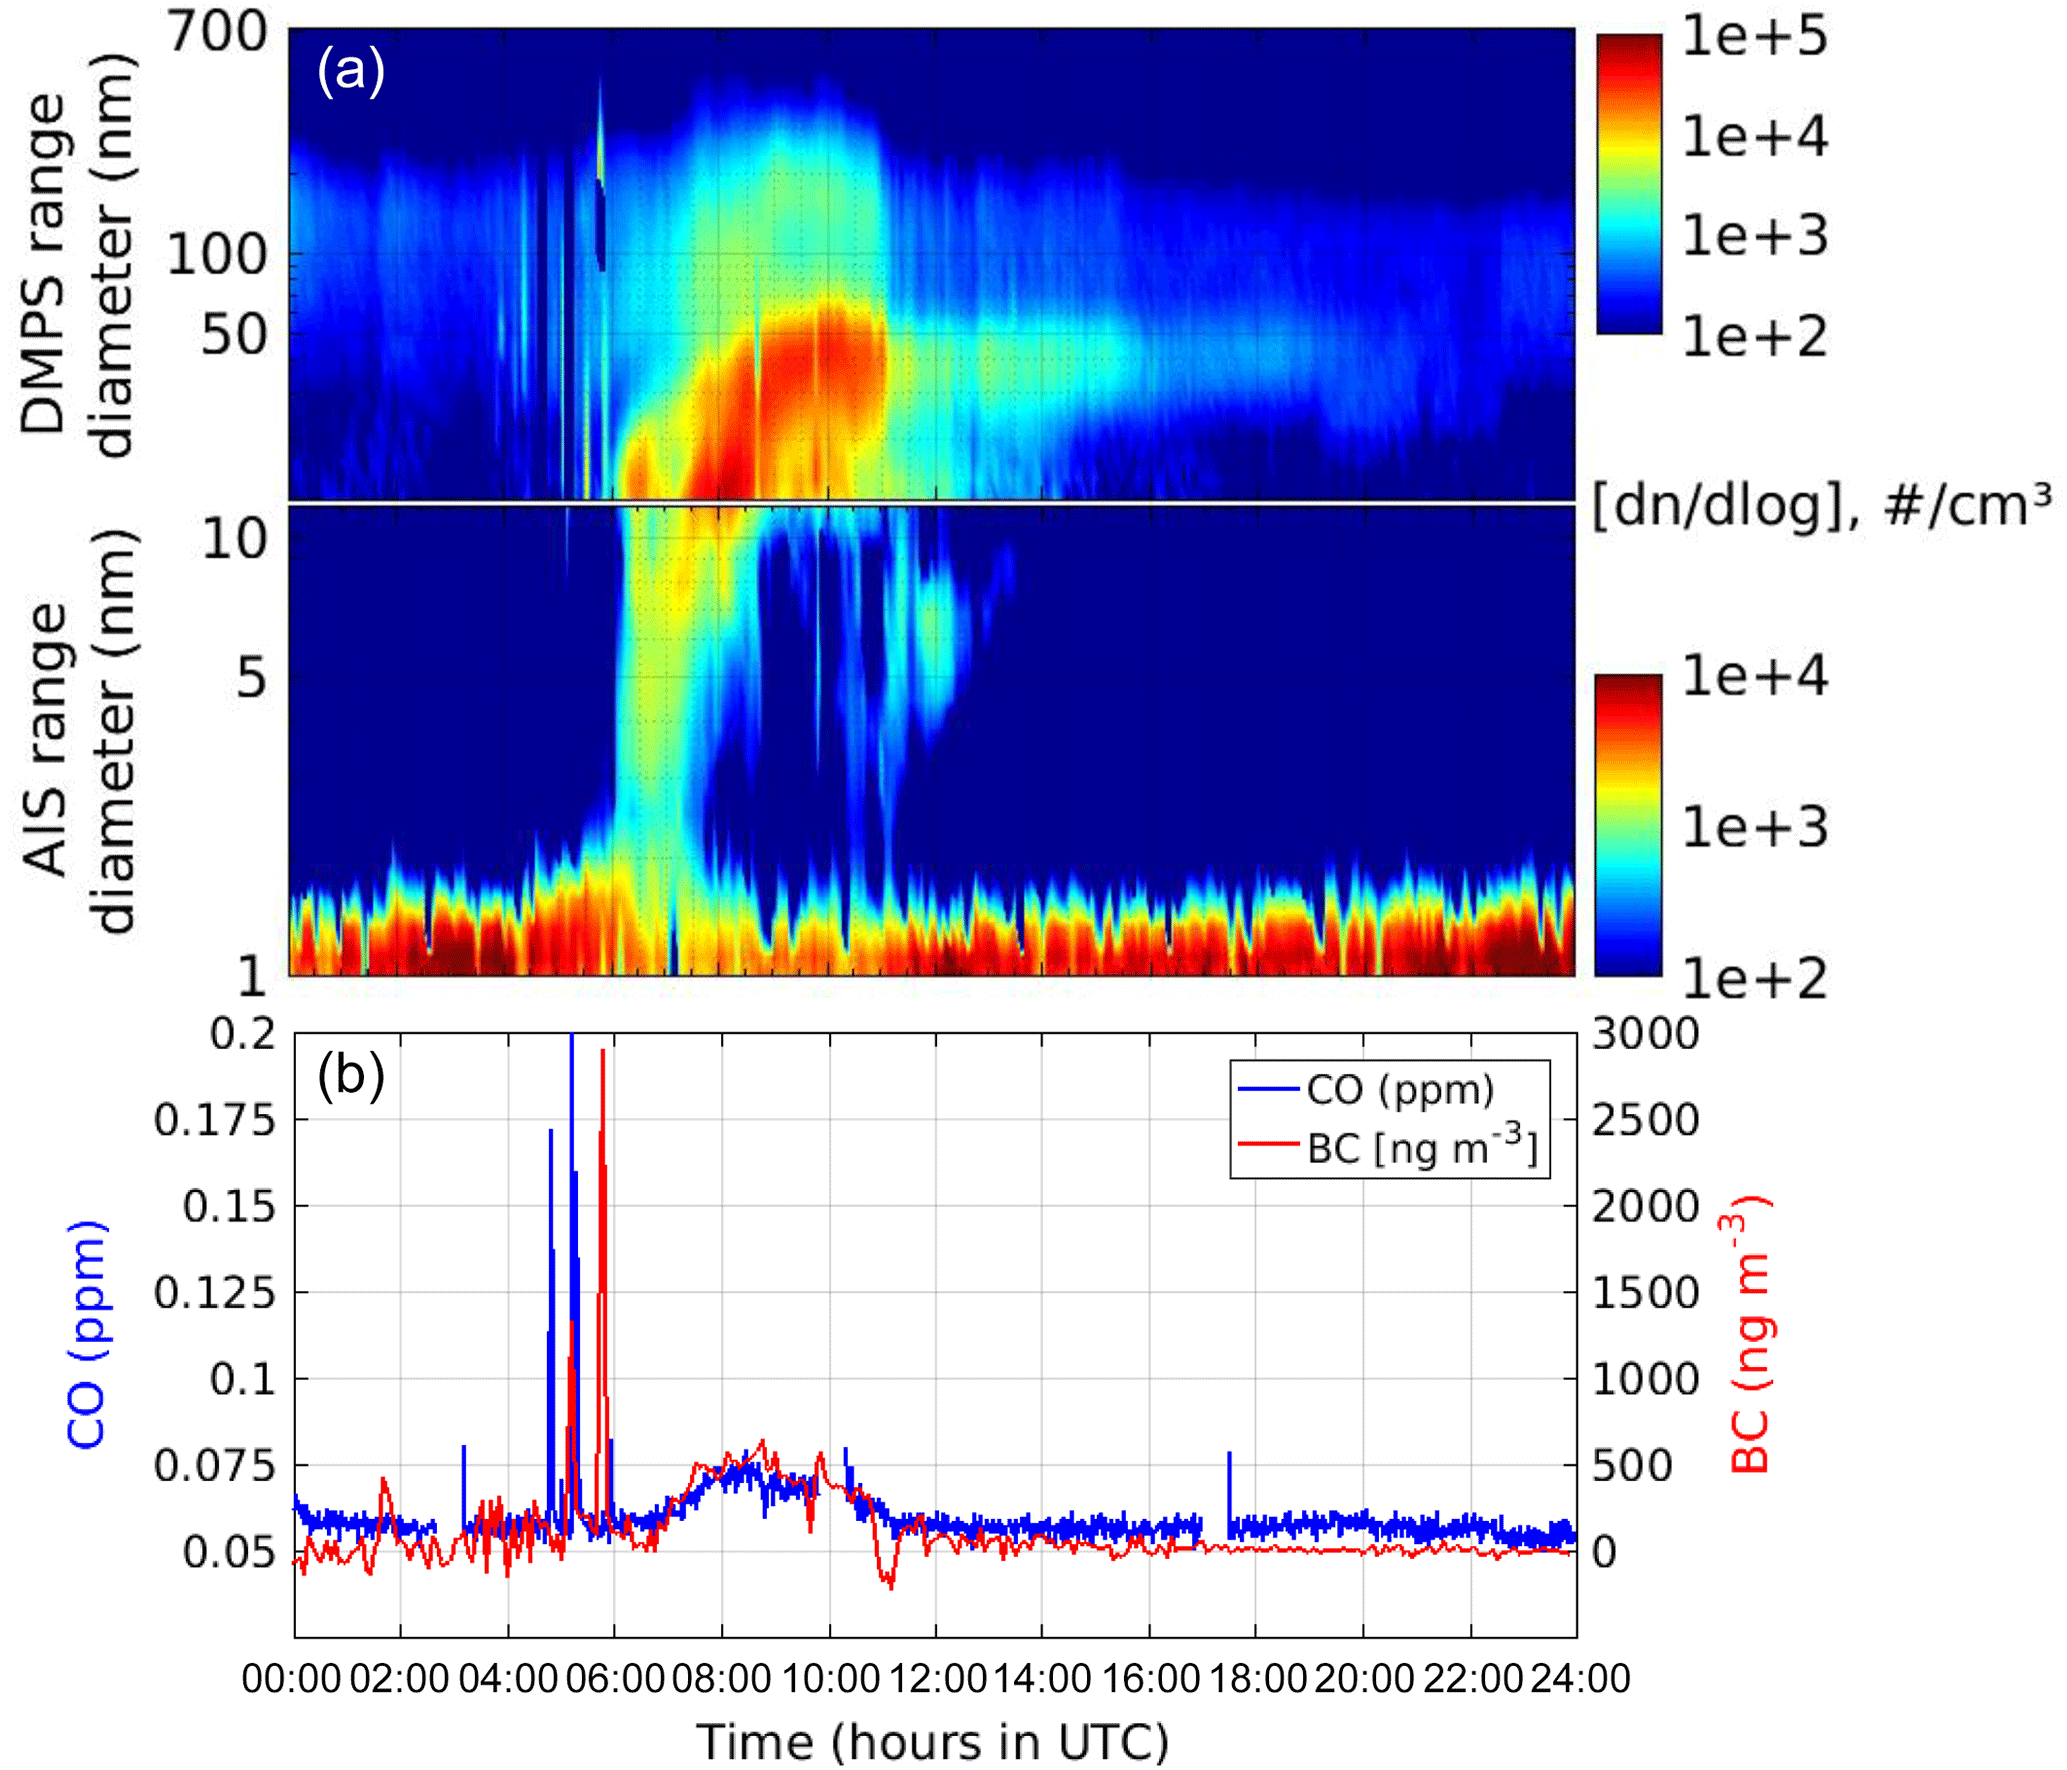
Figure 3The 6 July 2015 diurnal variation in (a) negative ions (1–10 nm) and (10–700 nm) aerosol particle size distribution (note the different concentration scales for ion number and particle concentrations) and (b) both BC and CO concentration variations in ng m−3 and ppm respectively.
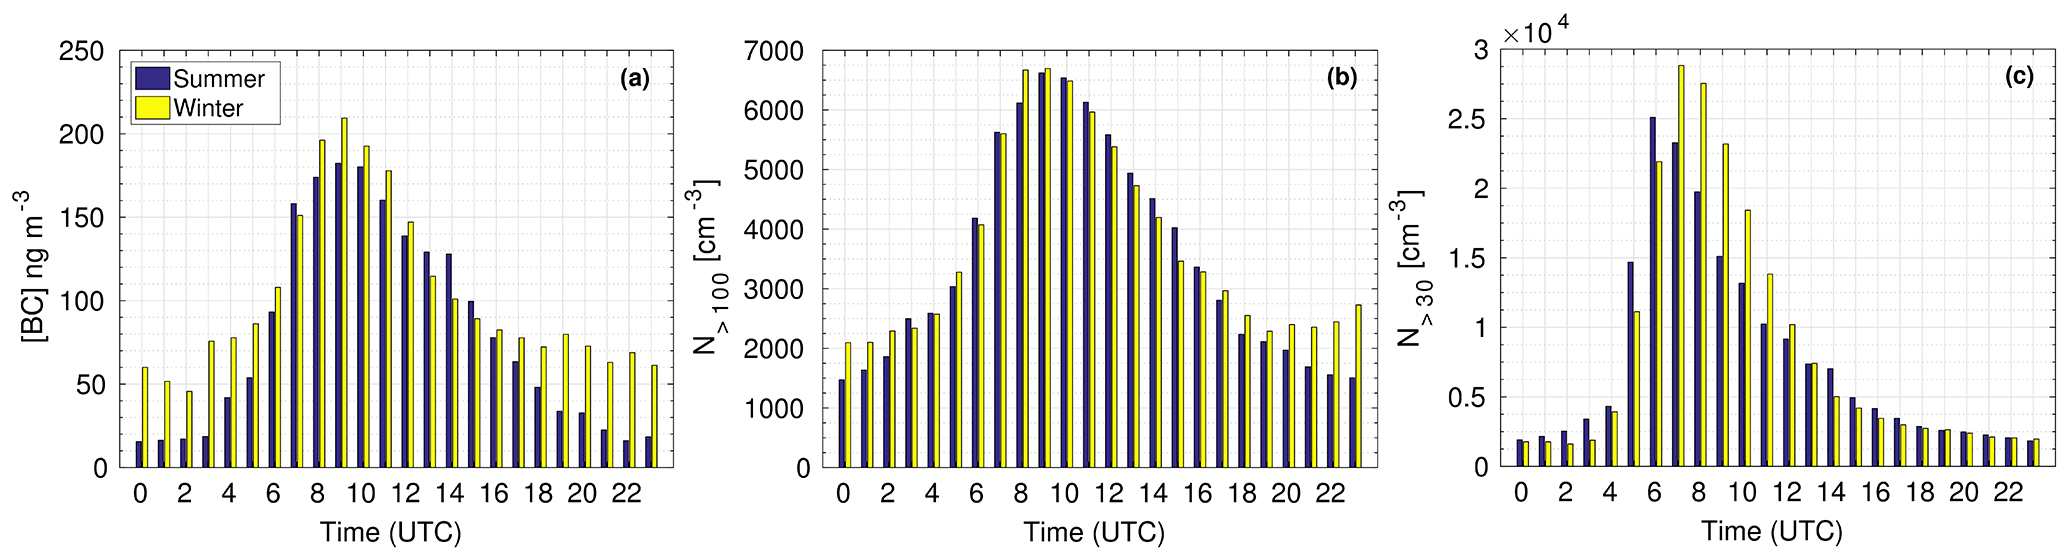
Figure 4Average diurnal variation during winter and summer of the (a) BC concentration, (b) number concentration of particles with diameters larger than 100 nm (N>100), and (c) number concentration of particles with diameters smaller than 30 nm (N<30).

Figure 5Monthly event frequency (%) variation during 2014 (green) and 2015 (blue). Values at the top of the bars correspond to the number of days that were taken into account for calculation.
These features can also be observed, on average, both for the summer and winter seasons. BC average diurnal profiles (Fig. 4a), together with the average diurnal variation in the number concentrations of particles larger than 100 nm (N>100) (Fig. 4b), and the number concentration of nucleation mode particles with a diameter smaller than 30 nm (N<30) (c) are shown in Fig. 4. We observe that, on average, BC concentrations increase in the morning at the same time as N>100 and N<30, confirming the influence of the BL on the occurrence of NPF events at the scale of the season. Moreover, we can note that during winter, BC concentrations are higher during nighttime (from 16:00 to 06:00 UTC) than during summer. This observation is also true for N>100 with higher values from 17:00 to 02:00 UTC during winter compared to summer. We assume that during winter, trade winds favour the large-scale remote primary particle transport to the Maïdo station.
4.2 Nucleation and frequency analysis
Over the measurement period in 2015, 47 volcanic plume days were excluded and data were missing on 61 days. Among the 257 remaining days, 167 days (65 %) were classified as event days, 55 (21 %) as non-event days, and 35 (14 %) as undefined. As a result, the event frequency was high for the Maïdo station, with an annual average of 65 % (med: 65.2 %; 25th percentile: 52.0 %; 75th percentile: 80.0 %) for 2015. This frequency is one of the highest values reported so far, with the exceptions of the South African plateau, where NPF was reported to occur 86 % of the time according to Hirsikko et al. (2012), and savannah, with 69 % of the time (Vakkari et al., 2011). Figure 5 shows the seasonal variation in the monthly event frequency, fm.
As shown in Fig. 5, similar seasonal variations were observed for the nucleation frequency in 2014 and part of 2015. High NPF frequencies were observed during the transition months being on average 72.5 % for October and November (spring), and even slightly higher, 89.4 %, for March to May (autumn). During the southern winter and summer seasons (from June to August and from January to February), NPF was lower. As examples of high and low frequency NPF months, continuous DMPS spectra of April (93.1 % occurrence) and June (46.7 % occurrence) are available in the appendix though (Fig. A4).
4.3 Particle formation, growth, and nucleation rates
The yearly average particle growth rate for 12–19 nm particles was 19.4±12.69 nm h−1 (Table 1), which is above the typical range of GRs reported in the literature for a quite-similar size class of 7–20 nm (GR7−20). The review by Yli-Juuti et al. (2011) of GR7−20, obtained at different measurement sites located in various environments, reports a yearly average of 6.66±3.41 nm h−1 (19 values). However, higher GRs have been observed for a coastal environment in Australia, with an average GR7−20 of 19 nm h−1, (Modini et al., 2009) and for a polluted urban environment in Tecámac, with an 18 nm h−1 average GR3.7−25 (Iida et al., 2008). It is noteworthy that, at high altitudes, the conditions of spatially homogeneous air masses and a steady state, necessary to calculate a realistic growth rate, are not verified since air masses are progressively advected to the site from lower altitudes. Thus the GRs that are reported here are “apparent” growth rates that may be overestimated due to the transport of particles that have already nucleated and grown at lower altitudes at the same time. Nevertheless, the particle GR calculated for the Maïdo station is higher than the average GRs reported by Rose et al. (2015b) for the CHC station (7.62 nm h−1), Boulon et al. (2011a) for the Puy de Dôme station (6.20 nm h−1), and Venzac et al. (2008) for Nepal (1.8 nm h−1).
In our calculation, 19 events were not taken into account because of the special characteristics of the extreme value of GR. The beginning of the NPF was characterised by a clear verticality in the spectrum during the first hours of the event and the corresponding GR was generally very high (100 to 150 nm h−1). Two examples of DMPS spectra belonging to this special class of growth rates are shown in Fig. A2. Most of them were observed in December (8 cases). Dal Maso (2002) and O'Dowd and De Leeuw (2007) obtained such values (100 nm h−1) at Mace Head, a coastal site in western Ireland. They can be explained by the simultaneous transport of nucleated and already grown particles to the sampling site, from seaweed fields. In the case of coastal marine NPF events, the spatial homogeneity of the emission field is not verified, as for high-altitude sites.
Figure 6 highlights a clear seasonal variation in GR12−19, with the highest monthly averages in August (35 nm h−1) and the lowest in May (8.9 nm h−1). These variations in the GR differ from those reported in the literature for other high-altitude sites. Boulon et al. (2011a) did not find a significant seasonal pattern in the GR variation at the Puy de Dôme. In Chacaltaya, Rose et al. (2015b) showed that, on average, the GRs were enhanced during the wet period, which is not in agreement with the present study, as we find high medians during the dry period (22.82 nm h−1 averaged from July to November). Several reasons may explain these discrepancies, such as the topography of each station relative to cloud location during the wet season or the seasonal variation in condensable species responsible for the particle growth.
Formation rates were calculated for 12 and 2 nm particles when the GR12−19 was available. The yearly average formation rates J12 and J2 in Table 1 are respectively 0.931±1.15 and 1.53±2.06 cm−3 s−1. These formation rates are in the upper range of the values reported by Kulmala et al. (2004) from measurements performed in more than 100 locations in the BL (J3=0.01–10 cm−3 s−1). They are of the same order of magnitude as the ones reported for the CHC (1.02 and 1.90 cm−3 s−1 for the wet and dry seasons respectively; Rose et al., 2015b).
Table 1Annual statistical values for GR12−19, J12, J2, CS and CS2 calculated on daily averages.
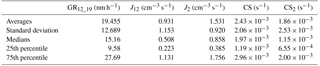
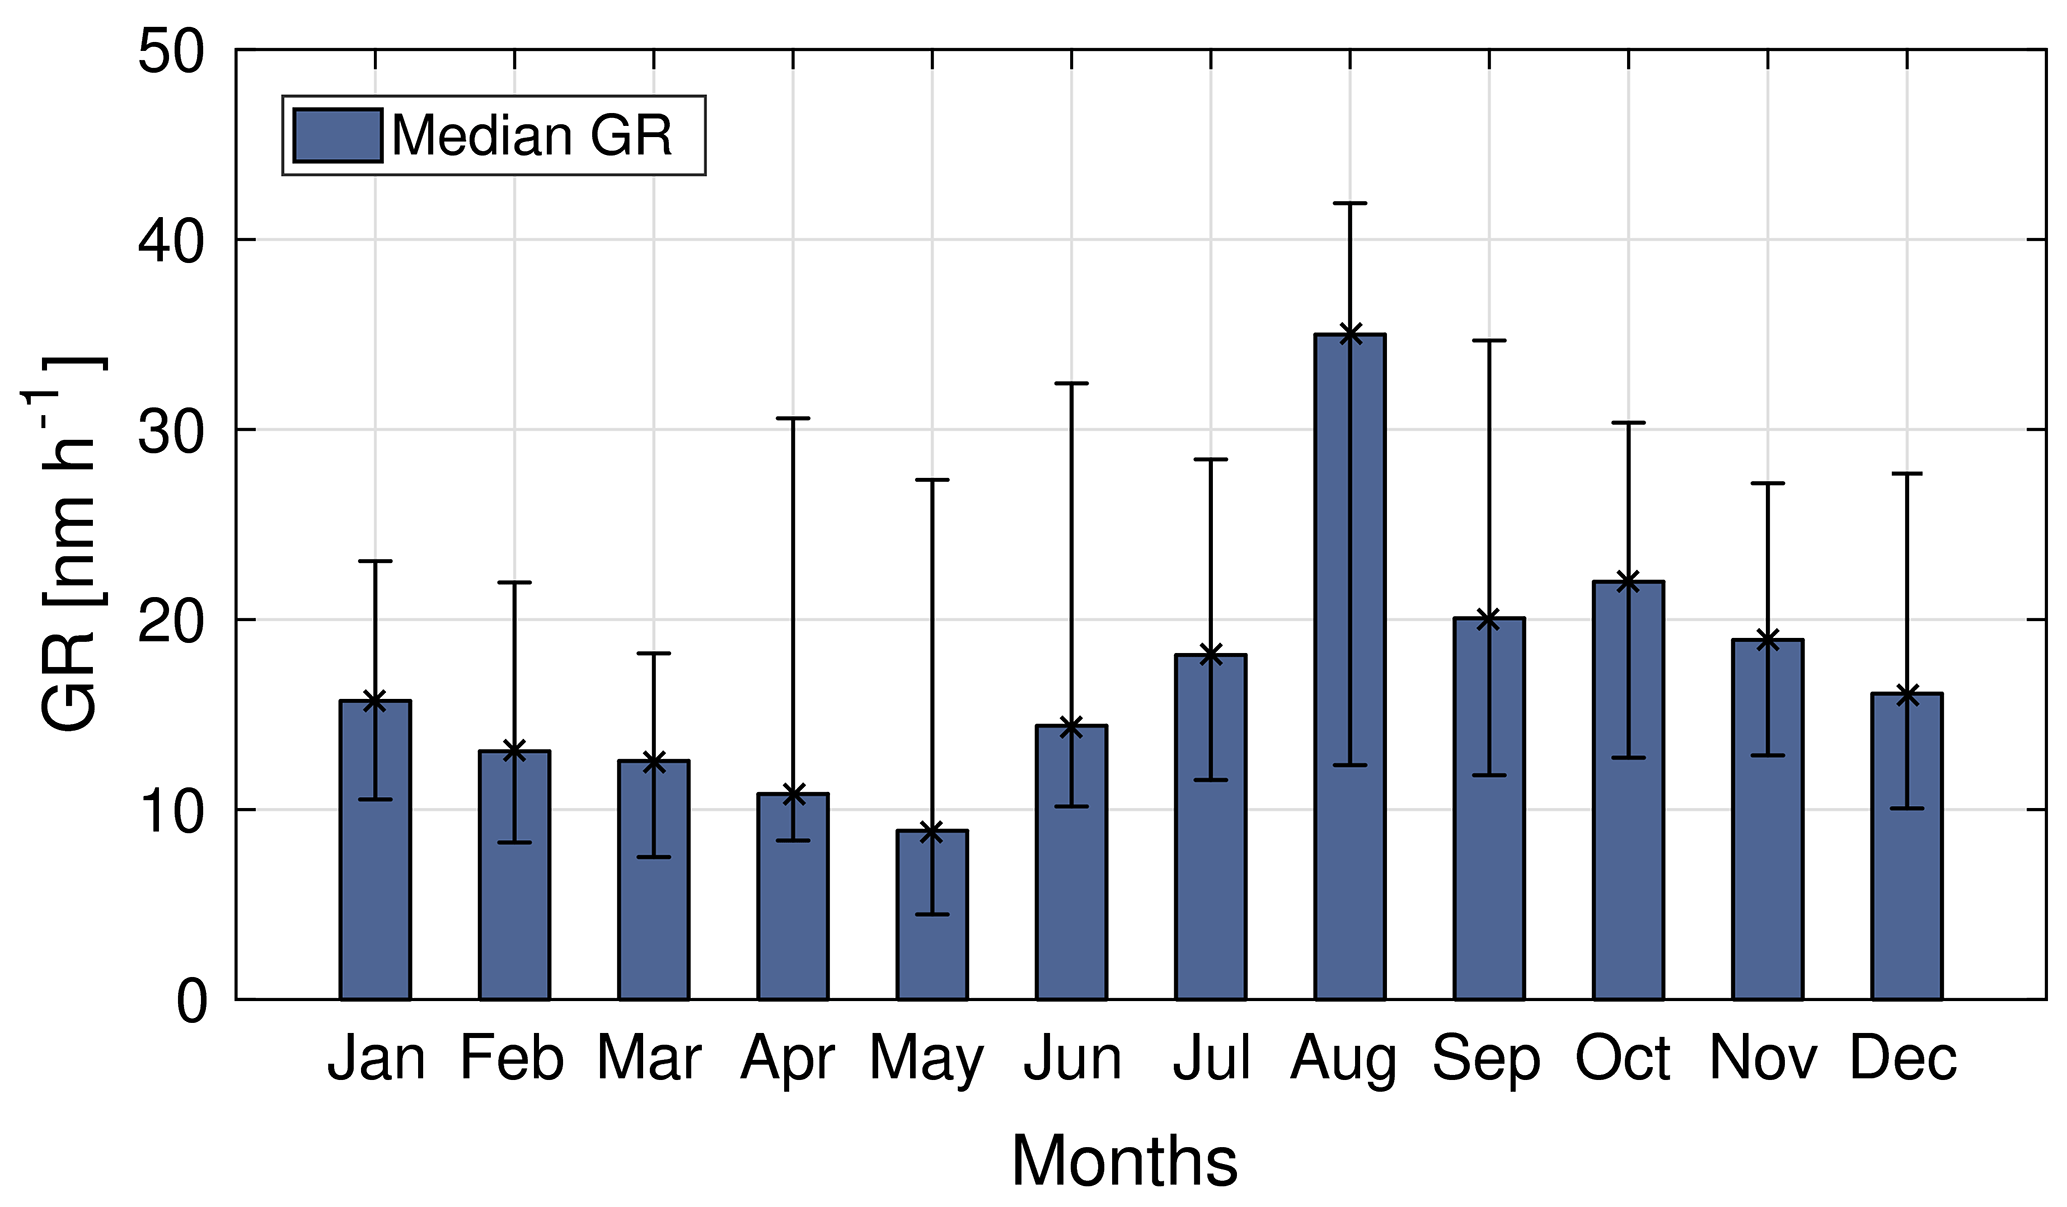
Figure 6Monthly median growth rates in 2015. Error bars in black represent 25th percentile (top) and 75th percentile (base). To build these representation, 146 growth rates were estimated on 167 days classified as event days.
J2 seasonal variation follows the J12 seasonal variation (Fig. 7) but with higher values due to losses by coagulation during the growth process. We observe a clear seasonal cycle with maximum values during the dry season, particularly between July and September (J12=1.60 cm−3 s−1 and J2=2.39 cm−3 s−1 respectively, averaged over 3 months). These observations are consistent with those reported for CHC, where J2 were reported to be twice as high during the dry season as in the wet season (Rose et al., 2015b). The lowest values are obtained around the transition months of December, with J12=0.32 cm−3 s−1 and J2=0.52 cm−3 s−1 (averaged between November and January), and April, with J12=0.44 cm−3 s−1 and J2=0.66 cm−3 s−1 (averaged between April and June). The seasonal variation in the growth rate reported in Fig. 6 also shows highest values around August but the seasonal variation in nucleation rates shows features different from those of the GR. Formation rates reach their maxima slightly earlier in the dry season (July) than the growth rates, and the contrast between July–August–September and the rest of the year is also stronger. This indicates that the condensable vapours necessary for nucleating new particles might not have exactly the same seasonal variation as the ones required for growing the newly formed particles. In addition, high particle formation and growth rates obtained in July–August do not coincide with the highest nucleation frequencies, suggesting that, during these months, NPF might be less frequent but occur in the form of stronger events.
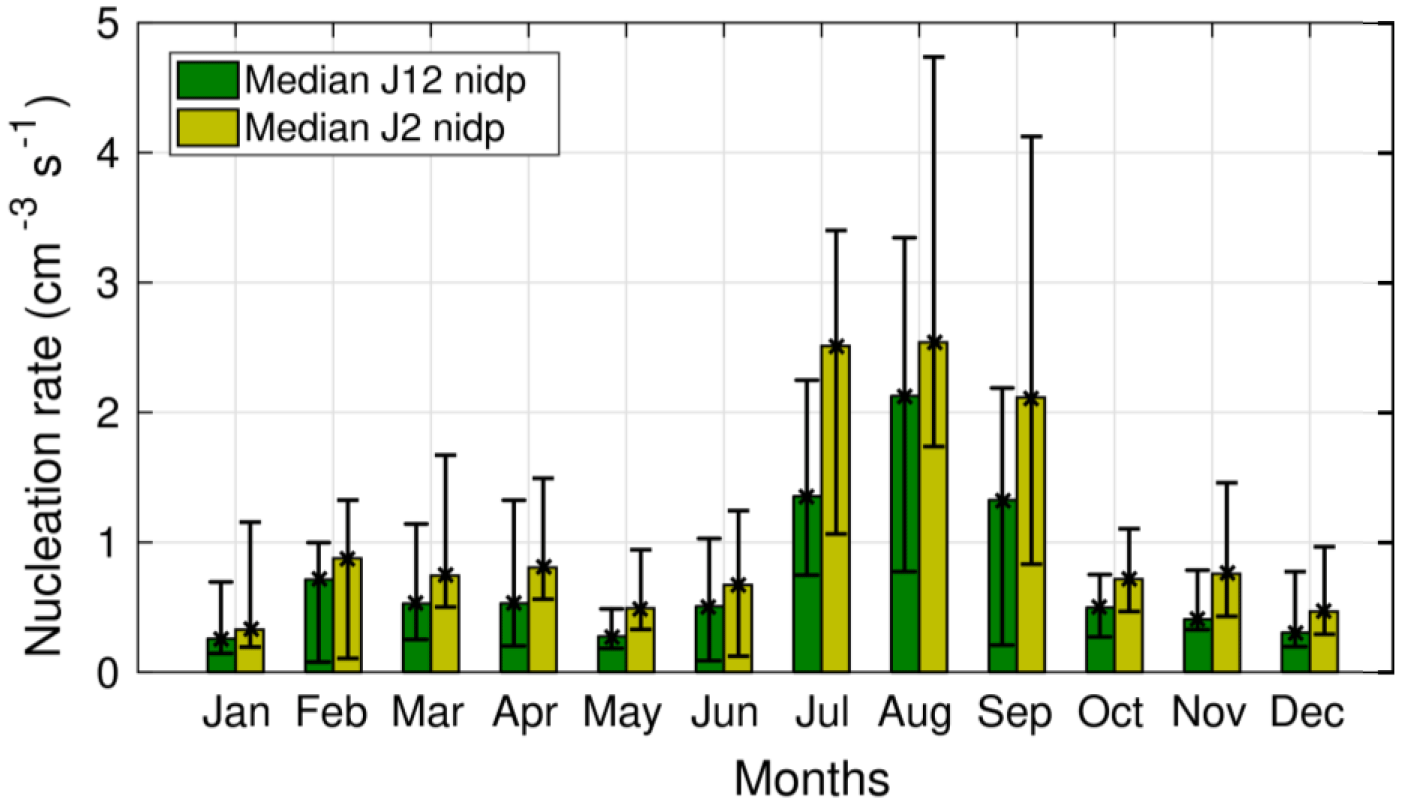
Figure 7Monthly median nucleation rates in 2015 for 2 and 12 nm sizes. Error bars in black represent 25th percentile (top) and 75th percentile (base).
Several factors have previously been reported to influence the seasonal variation in the NPF event frequency, GR, and nucleation rates; they include (i) the availability of condensable gases involved in the formation of new particles, (ii) the number concentration of pre-existing particles transported to the site, and (iii) thermodynamical properties of the atmosphere, such as radiation, temperature, and relative humidity. In the following sections, we will explore the seasonal variation in the last two factors (ii and iii).
4.4 Meteorological parameters and onset of NPF
A summary of incidental radiation, relative humidity, temperature, and pressure monthly averages is available in Table A1. Austral seasons are reflected regarding both the daily averaged temperature and radiation represented in Fig. 8a. We also computed in Table 2 the existing relationships between the monthly average meteorological parameters and the ones of the main characteristics of the NPF events. We observe that radiation is highest between September and November (272.19 W m−2 on average), coinciding with one period of high NPF frequency (Fig. 4), but not with the maximum frequency of occurrence (March to May) nor with any high values of the GR or J2∕J12 (Figs. 6 and 7). As a consequence, no correlation is observed between radiation and the NPF variables. Hence, the availability of light for photochemistry is not the only parameter influencing the NPF frequency nor the formation rates or growth. The temperature averages are higher from November to April (14.02 ∘C). We find a significant (at the 95 % confidence level) anti-correlation between temperature and the nucleation rate and GR. However, the seasonal temperature variations are similar to the seasonal variation in the NPF event frequency even if the correlation is not significant at the 95 % confidence level. Emissions of terpenes is favoured at higher temperatures (Yu et al., 2017) while higher radiation is favouring the isoprene emissions. Some studies have shown that high concentration of isoprene relative to monoterpene can inhibit new particle formation while favouring particle growth (Kiendler-Scharr et al., 2009; Kanawade et al., 2011; Freney et al., 2018). This effect could partly explain how higher temperatures favour the nucleation frequency occurrence but lead to lower growth rates. Other factors such as a direct effect of temperature on the saturation vapour pressure of condensable gases can also influence this result.
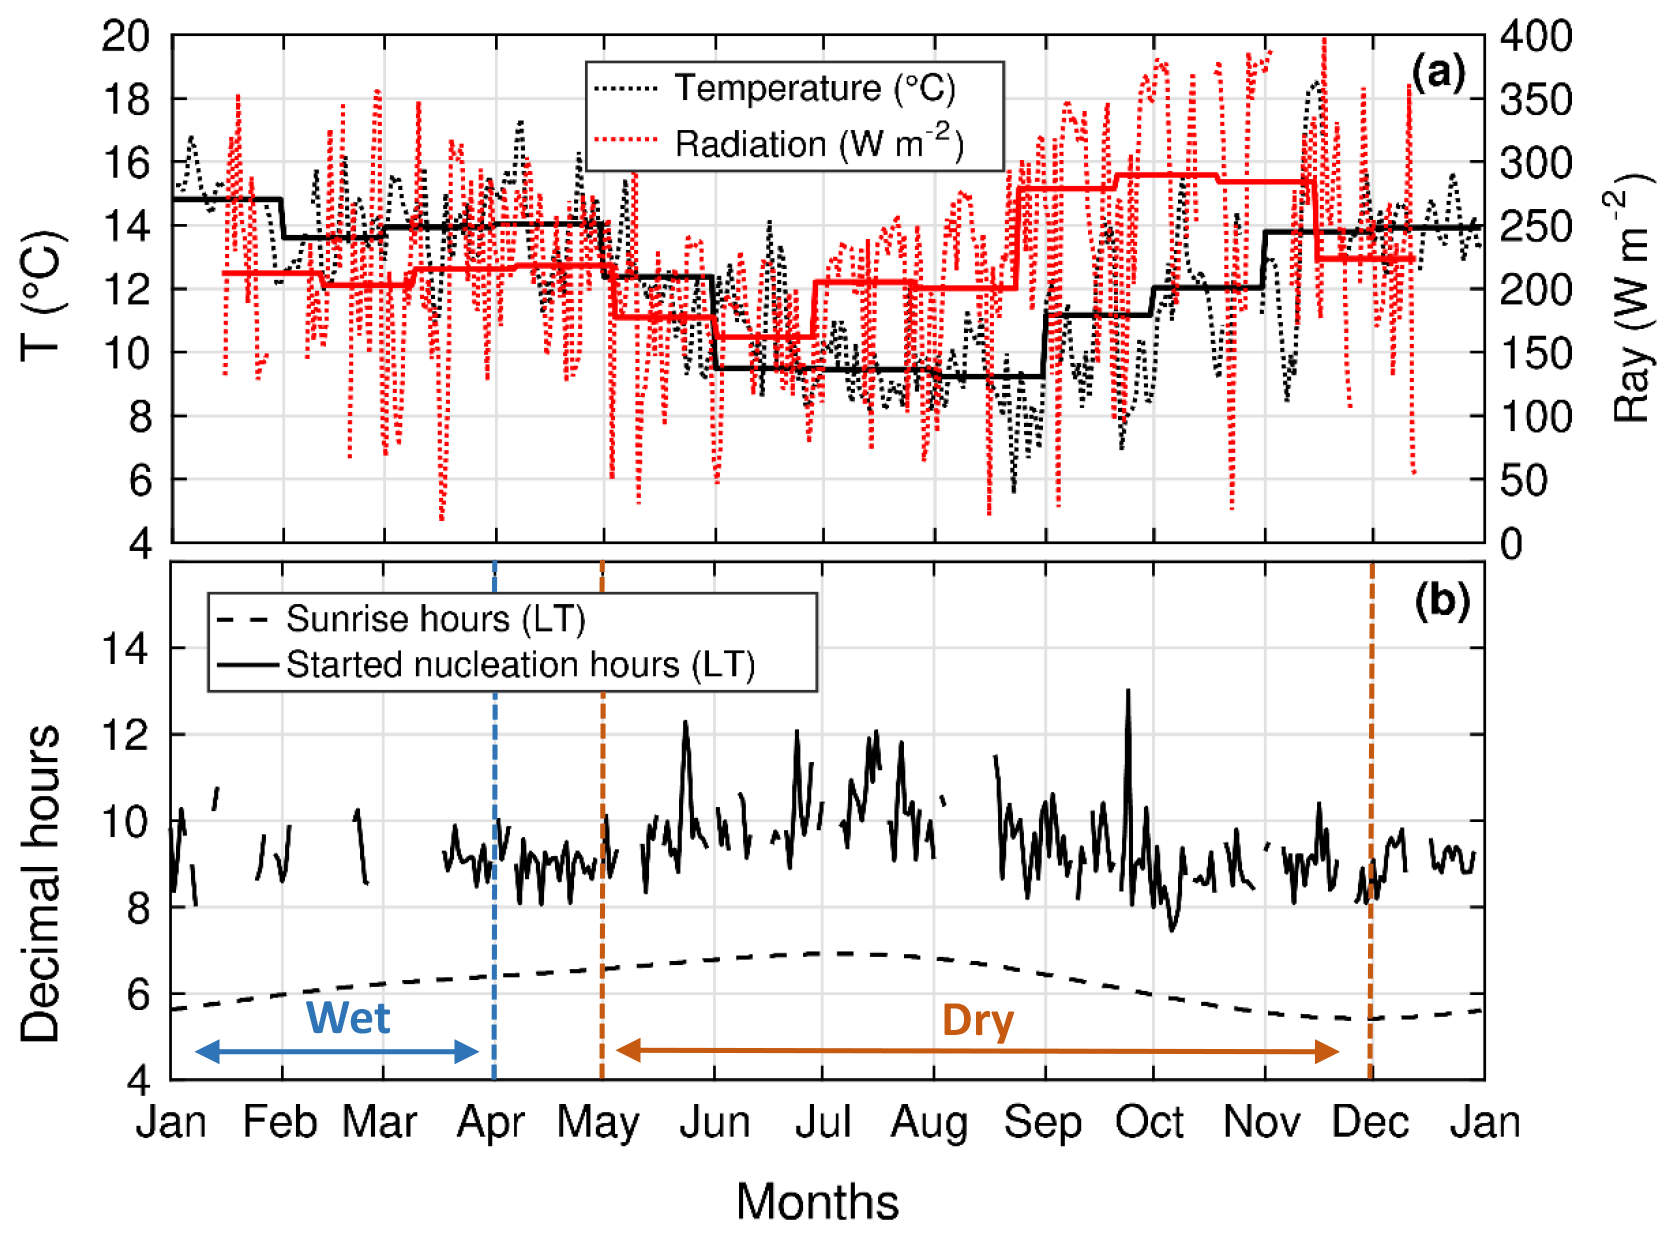
Figure 8(a) Temperature (∘C) and incidental radiation (W m−2) variations during 2015 at Maïdo station given by daily UTC (fine) and monthly (bold) averages; (b) seasonal variation in sunrise and time of NPF onset in local time (LT). The dry and wet seasons are also delimited in orange and blue, respectively.
The relative humidity values are typical of an intertropical island with peaks in summer, between December and March (76.79 % on average), and the lowest values obtained in July and September. Cloudy conditions were previously shown to inhibit formation of new particles, by scavenging newly formed clusters (Venzac et al., 2008). They might also decrease photochemical processes at the origin of the formation of condensable species contributing to the growth of clusters to stable particles. At Chacaltaya, Bolivia (5200 m a.s.l.), Rose et al. (2015b) reported high frequencies during the southern winter, which coincide with the dry season. For the Maïdo station, frequency variations are not fully synchronised with the dry or wet periods as defined in Fig. 8b. However, there is some uncertainty both in the dry/wet season segregation and with the exact identification of maxima/minima in the seasonal variation in the NPF frequency. When considering relative humidity, we do not find any link between RH and the nucleation frequency (Table 2) but a significant anti-correlation with the formation rate: low RH values correspond to the July–August–September nucleation peak. This would be in agreement with the results from the CHC station. Figure 8b shows that the appearance time of the ultrafine particle seasonal variation is well correlated to the sunrise. During the southern summer, NPF starts between approximately 08:00 and 10:00 LT and between 09:00 and 10:00 during the southern winter. This correlation may be due to the need for sunlight to be available to start photochemical processes, and/or to the start of advection of precursor gases from lower-altitude sources in the BL.
Table 2R correlation coefficients giving the relationships between NPF parameters (occurrence, GR, and Js) and influencing factors (Ray, RH, T, P, CS2, CS2prop, CO, BC, COnuc, and BCnuc).
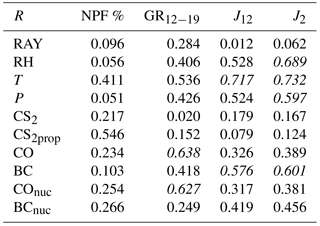
Correlations have been calculated with the twelve 2015 monthly averages for each parameter. Taking a degrees-of-freedom value of 10 and a risk α=0.05 (95 % of confidence), we obtained a lower limit value of 0.576 according to the Pearson table. The italic R values in the table are above the limit value meaning that the variables are significantly dependent.
4.5 Condensation sink
In addition to the meteorological parameters, the seasonal variation in the NPF characteristics might also be influenced by the presence of pre-existing particles, known to inhibit the NPF processes by increasing the competition for available condensable gases. We averaged the CS for 2 hours before the nucleation started (CS2) to properly characterise its influence on the occurrence of an NPF event. In Fig. 8b, nucleation onset times are averaged for each season (08:00 LT for southern summer and 09:00 LT for southern winter). The yearly average condensation sink has been calculated to be 2.43×10⁻³ s−1 and 1.86×10⁻³ s−1 for CS2. These values are similar to the ones reported for the high-altitude stations of Chacaltaya (Rose et al., 2015b) and Nepal (Venzac et al., 2008), which are 2.4×10⁻³ and 2.1×10⁻³ s−1, respectively, and also for the Mace Head coastal station (Dal Maso, 2002), which is about 2×10⁻³ s−1.
Monthly averages of the CS2 were calculated for event days and non-event days and are shown for 2015 in Fig. 9a, together with the NPF event monthly frequency fm. This representation highlights monthly averaged CS2 peaks for February (2.65×10⁻³ s−1), May (3.74×10⁻³ s−1), and September (4.72×10⁻³ s−1). The September value is similar to the South African savannah yearly average (Vakkari et al., 2011), which was about 4.3×10⁻³ s−1. It attests to a considerable presence of pre-existing particles at the Maïdo station for this period. However, the NPF frequency seasonal pattern does not match that of low CS2. May and September CS2 peaks are associated with fm peak values while January and June CS2 low averages (0.89 and 0.96×10⁻³ s−1 respectively) are correlated to weak NPF occurrence.

Figure 9(a) Monthly CS2 (blue) calculated 2 hours before NPF onset (scale at the right in s−1) and monthly event frequency fm (scale at the left in percentage). Averages have been calculated for event days (green), non-event days (red), and all days (blue). (b) Monthly CS2 proportion exceeding the average of CS2ev and CS2noev medians (1.04 × 10⁻³ s−1).
Moreover, we calculated that the annual CS2ev (event) median (1.2×10⁻³ s−1) was significantly higher than the annual CS2noev (no event) median (8.5×10⁻⁴ s−1). The previous observations thus suggest that the condensation sink does not inhibit NPF at Maïdo, as previously reported for other high-altitude stations (Manninen et al., 2010; Boulon et al., 2010; Rose et al., 2015b). At these sites, the occurrence of the NPF process might be determined rather by the availability of condensable vapours, which are likely to be transported together with pre-existing particles from lower altitudes. In order to further investigate this aspect, we evaluated whether the frequency of nucleation was correlated to a frequency of exceeding a CS threshold. Hence, we calculated a monthly average frequency for which the CS2 exceeded a threshold value of 1.04×10⁻³ s−1. The threshold was chosen arbitrarily as a value intermediate between the annual CS2ev and CS2noev medians. We started our investigation by choosing the median CS over the whole year as a threshold value. We then used an iteration process to fix the threshold so we have a reasonable seasonal variation in days exceeding this threshold values. Choosing other threshold values within CS2ev and CS2noev medians range would have led to less pronounced variability but would not have changed the shape of the seasonal trend. The resulting frequency at which CS2 exceeded the threshold (Fig. 9b) had a clear seasonal variation with maxima during the transitional periods. For April–May, and September–November, more than 60 % of the CS2 were higher than 1.04×10⁻³ s−1, while for January, June, and July the frequency was lowest. Hence, we actually find a similar seasonal variation between the frequency of CS exceeding a threshold value and the frequency of occurrence of NPF events (also shown by Table 2). This strengthens the hypothesis that there are precursors potentially transported simultaneous to aerosols from lower altitudes.
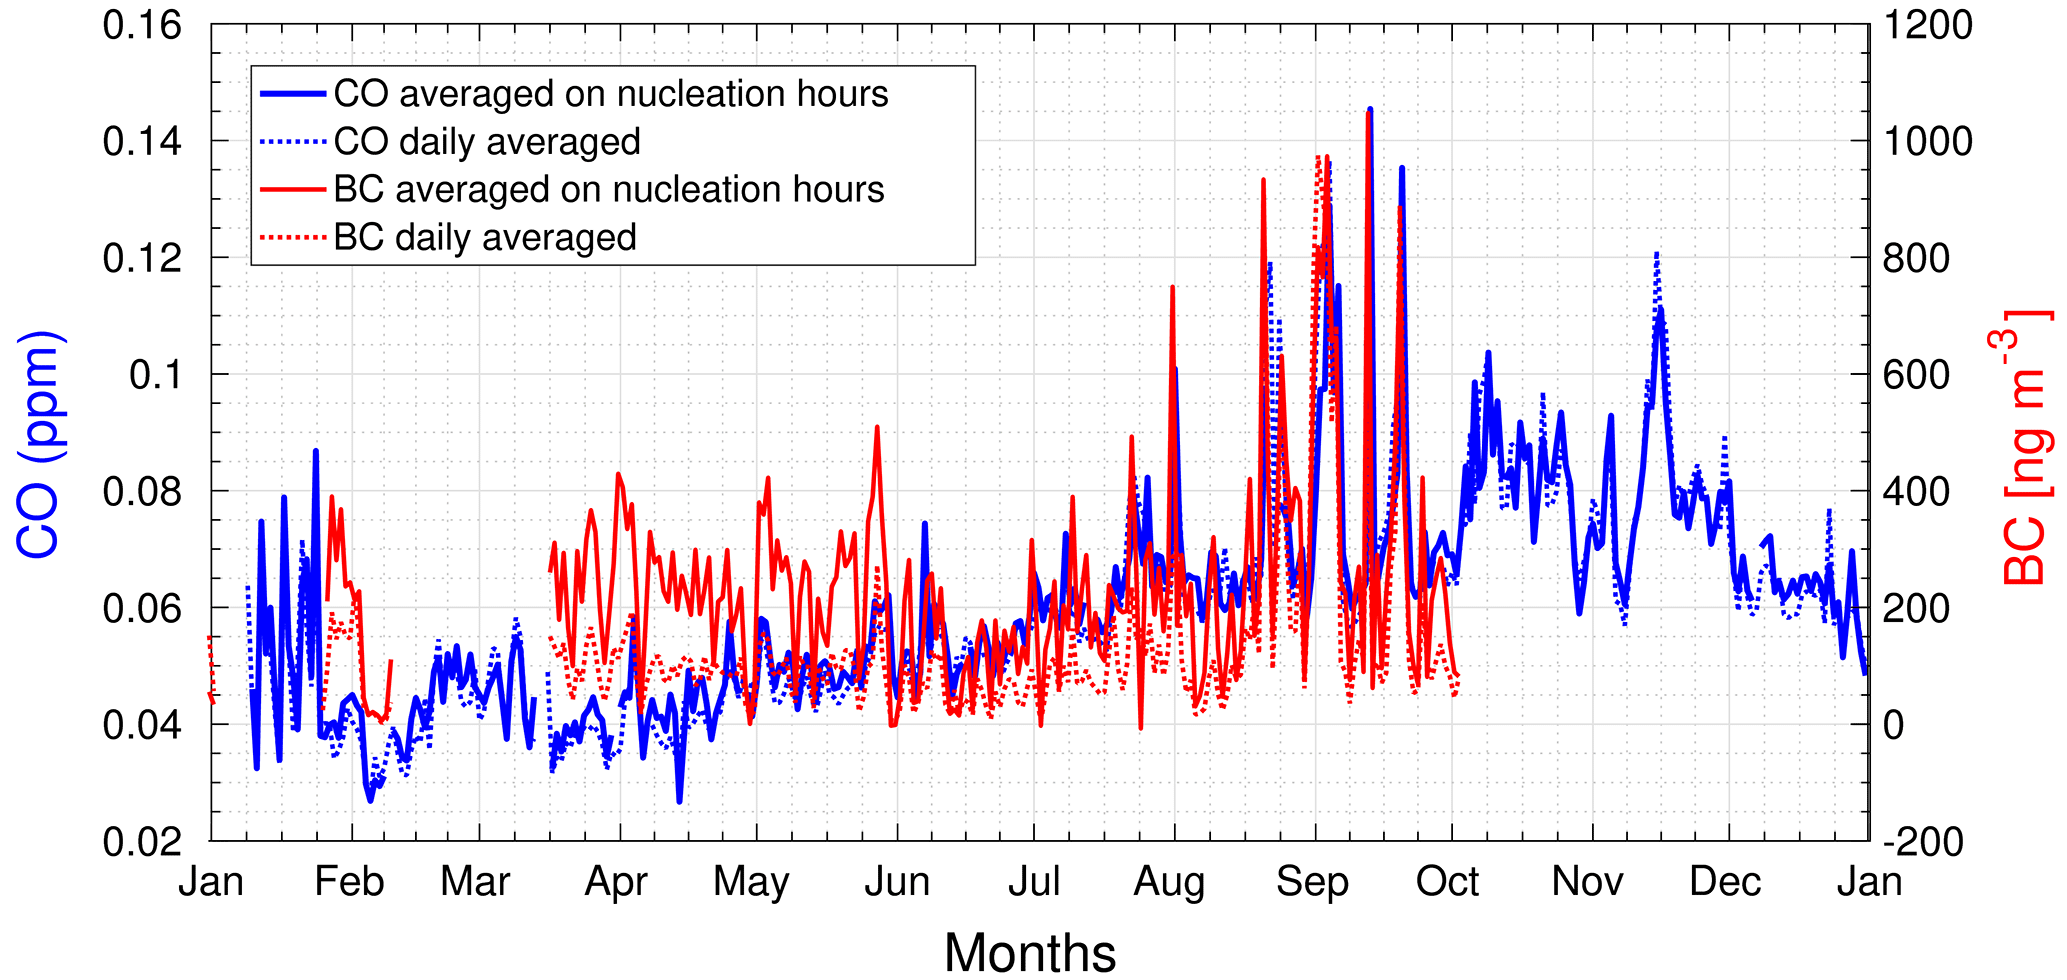
Figure 10Annual variation in daily (doted lines) and between the period around the nucleation onset (solid lines) of the BC (ng m−3) and CO (ppm) concentration over the year 2015.
4.6 Black carbon as a tracer of the anthropogenic contribution
Potential precursors may be of anthropogenic origin and we investigated their potential contribution by using BC as a tracer. Figure 10 shows the annual variations in daily concentrations of BC (ng m−3) and CO (ppm) over the year 2015, together with the annual variation in the BCnuc and COnuc averaged over the h period of time around nucleation onset. CO concentrations are more stable throughout the day than BC and the diurnal averages of CO concentrations are very similar to the average COnuc concentrations calculated over the time period around nucleation onset. For BC, we notice a difference in the April-to-June period when BC concentrations are higher during the nucleation hours than when averaged during the whole day. The best similarity between the seasonal variations of BC ad the ones of NPF parameters is found for the nucleation rate (Table 2). This may indicate that air masses influenced by a larger contribution of anthropogenic compounds are favourable to more intense NPF events, but not necessarily more frequent. Indeed, moderately high NPF frequencies are observed for high BC monthly mean values during the spring period, but the high frequencies of NPF event occurrence observed during the autumn period are not associated to very large BC monthly mean concentrations, and thus other contributors are expected during autumn. Moreover, BCnuc is less correlated to the nucleation rates than BC is, due to the difference in monthly concentrations of BC and BCnuc during autumn. This would confirm that during this period, precursors other than the anthropogenic ones are possibly participating in the nucleation process. The growth rate of newly formed particles is best correlated to CO concentrations (Table 2). This suggests that CO and BC do not have the exact same sources. CO may originate from sources other than combustion processes, such as marine source. This result also confirms that condensable species necessary to form new particles are likely different from the ones responsible for their further growth.
In the present study, we provide a new NPF observations for a high-altitude site of the Southern Hemisphere, the Maïdo observatory. We report a remarkably high frequency of occurrence of NPF events at the Maïdo observatory (65 %) with a bimodal seasonal variation in this frequency, characterised by high values during spring and autumn. We show that the condensation sink exceeds a threshold value (1.04×10⁻³ s−1) with a similar seasonal variation than the one of the NPF event frequency, suggesting that, similarly to other altitude sites, the condensation sink does not inhibit NPF at Maïdo, but the occurrence of the NPF process might be determined rather by the availability of condensable vapours, which are likely to be transported together with pre-existing particles from lower altitudes during the day. This indicates an influence of the BL dynamics, confirmed by daily variations in BL tracers (N>100 and BC). The daily average BC concentrations, taken as one anthropogenic tracer, has a main peak during winter and hence they match only a fraction of NPF frequency. Thus, anthropogenic precursors may contribute to some of the springtime NPF occurrence, but the high NPF occurrence during the autumn season is likely initiated by other contributors. The seasonal variations of the formation rate and growth rate are not correlated to the NPF frequency seasonal variation. High formation rates correspond to high BC concentrations, low relative humidity conditions, and low temperatures. While annual average J12 and J2 are in the typical ranges found in the literature ( and 1.53 ± 2.06 cm−3 s−1 respectively), GR12−19 values are higher than the typical range of GRs reported in the literature (19.4 ± 12.69 nm h−1). At Réunion, the identification of different sources contributing to the gas phase composition of the atmosphere is not well established. To complete this work, it would be valuable to have direct measures of the cluster ion composition that would provide indication of the anthropogenic, vegetation, or marine source contributions to nucleation at the site. In addition and although they are complex, modelling methods such as a detailed back-trajectory analysis should be used to understand the origin of the local air masses and source contributions at the Maïdo observatory.
DMPS data are already available on the EBAS data center. AIs data will be made available on request for the moment, until a clear data submission protocol is provided by the ACTRIS community.
Sulfur dioxide concentrations allow us to distinguish days when NPF can be affected by the presence of the volcanic plume. Based on a 1 ppb threshold, which was the 97th percentile of the series, we considered that 47 days were plume days at the Maïdo station and removed them. The eruptive periods are clearly visible in this figure.
Table A2 is given to help in the comparison of NPF parameters as a function of the different types of environments. A few stations are listed here. The values of the present study are summarised in the last line and the closest ones are highlighted (bold). Réunion seems to present NPF characteristics of several environment types. The GRs and Js listed in the table are in a similar range to those estimated in the present study.
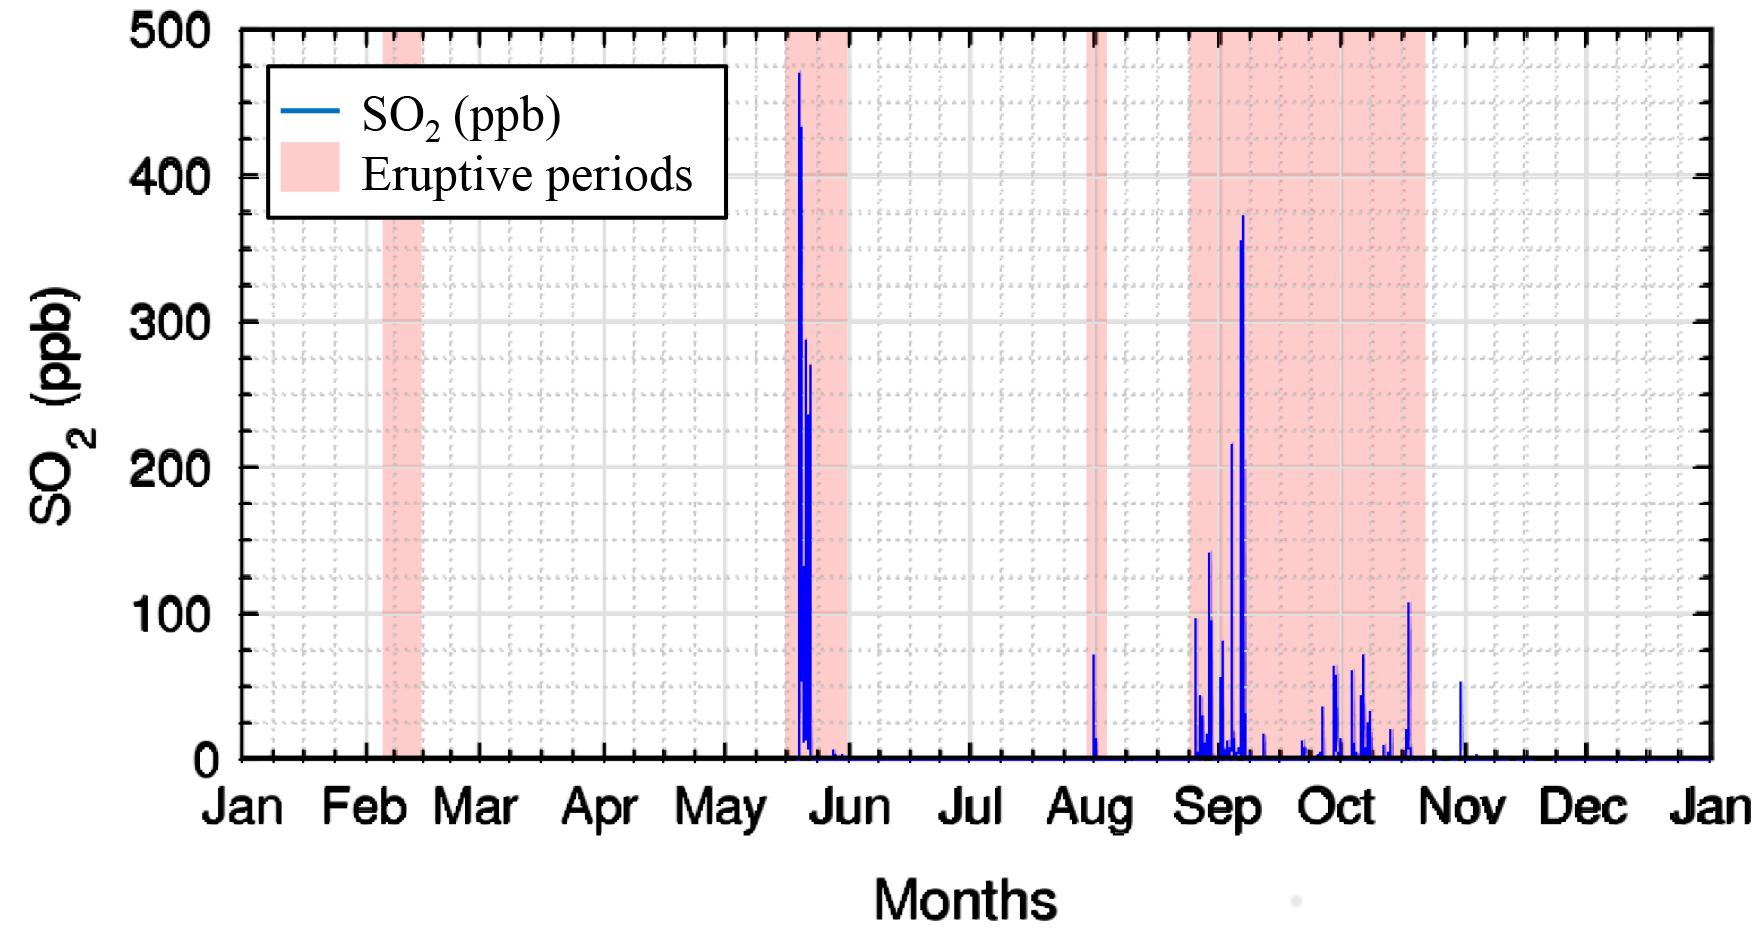
Figure A1SO2 concentration (ppb) at Maïdo station in 2015, showing the occurrence of three eruptive periods in red (17 to 30 May, 31 July to 2 August, and 24 August to 18 October).
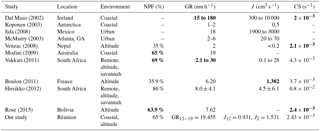
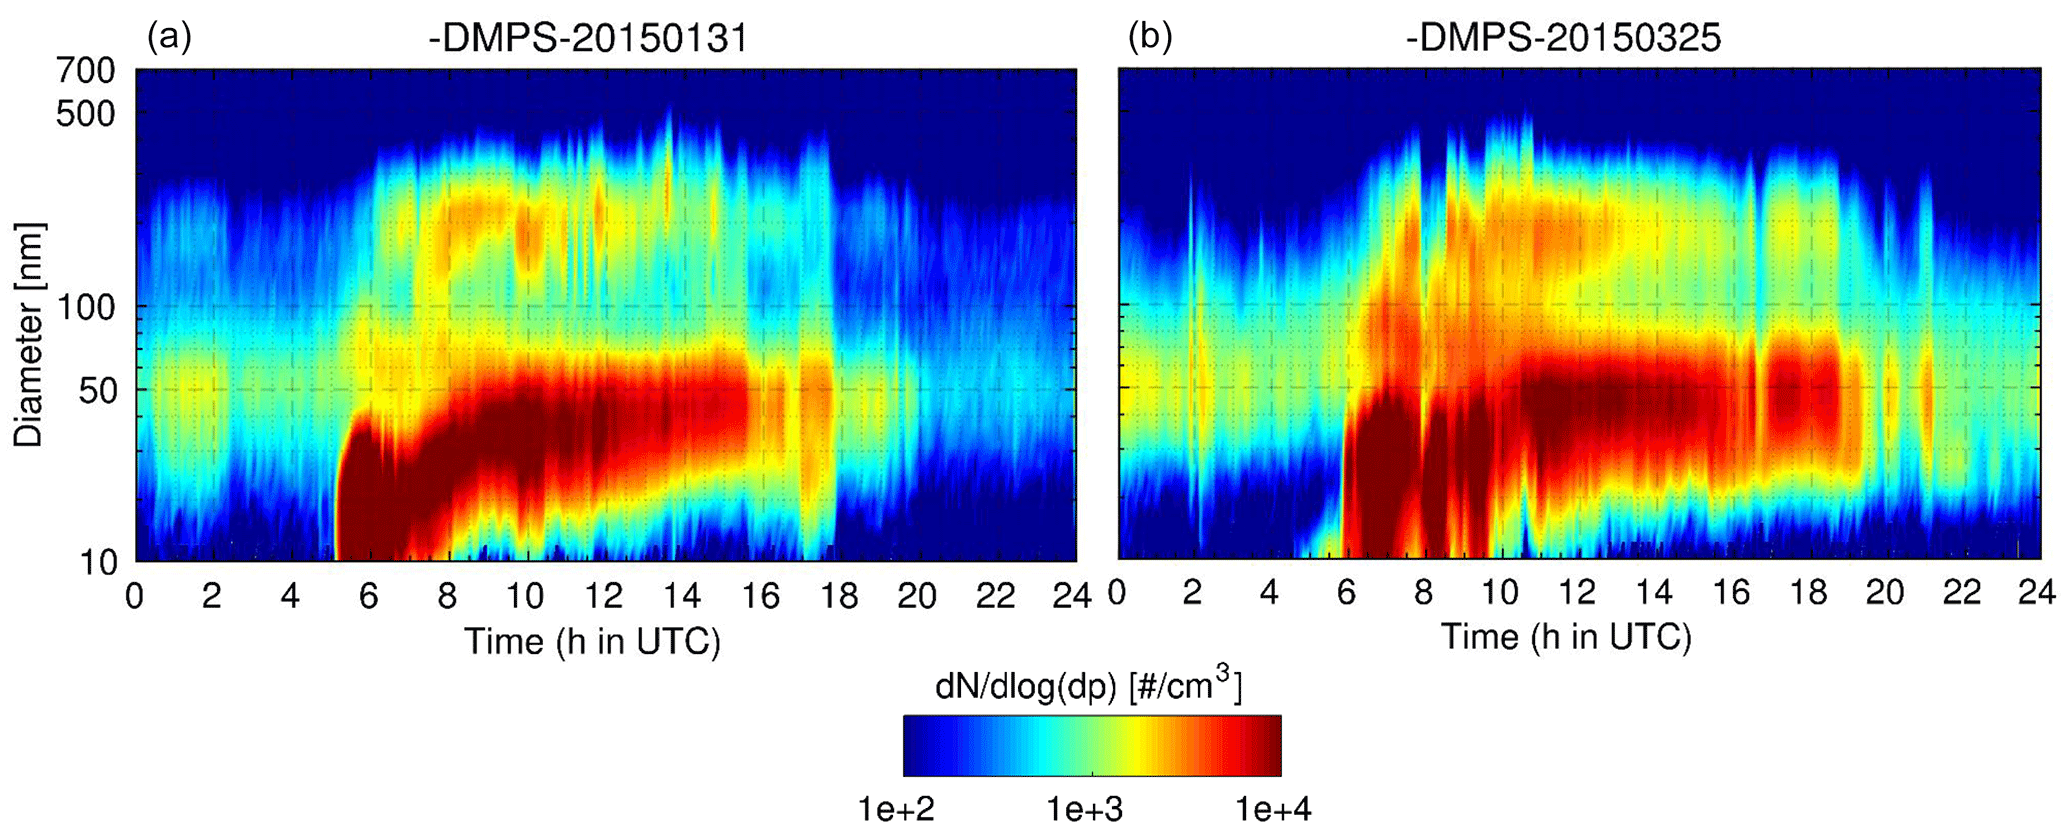
Figure A2DMPS spectra for 31 January on the left and 25 March on the right. This is an evolution of the size distribution (left scale in nanometres) and of the aerosol concentration (colour scale) with time (from 00:00 to 24:00 UTC).
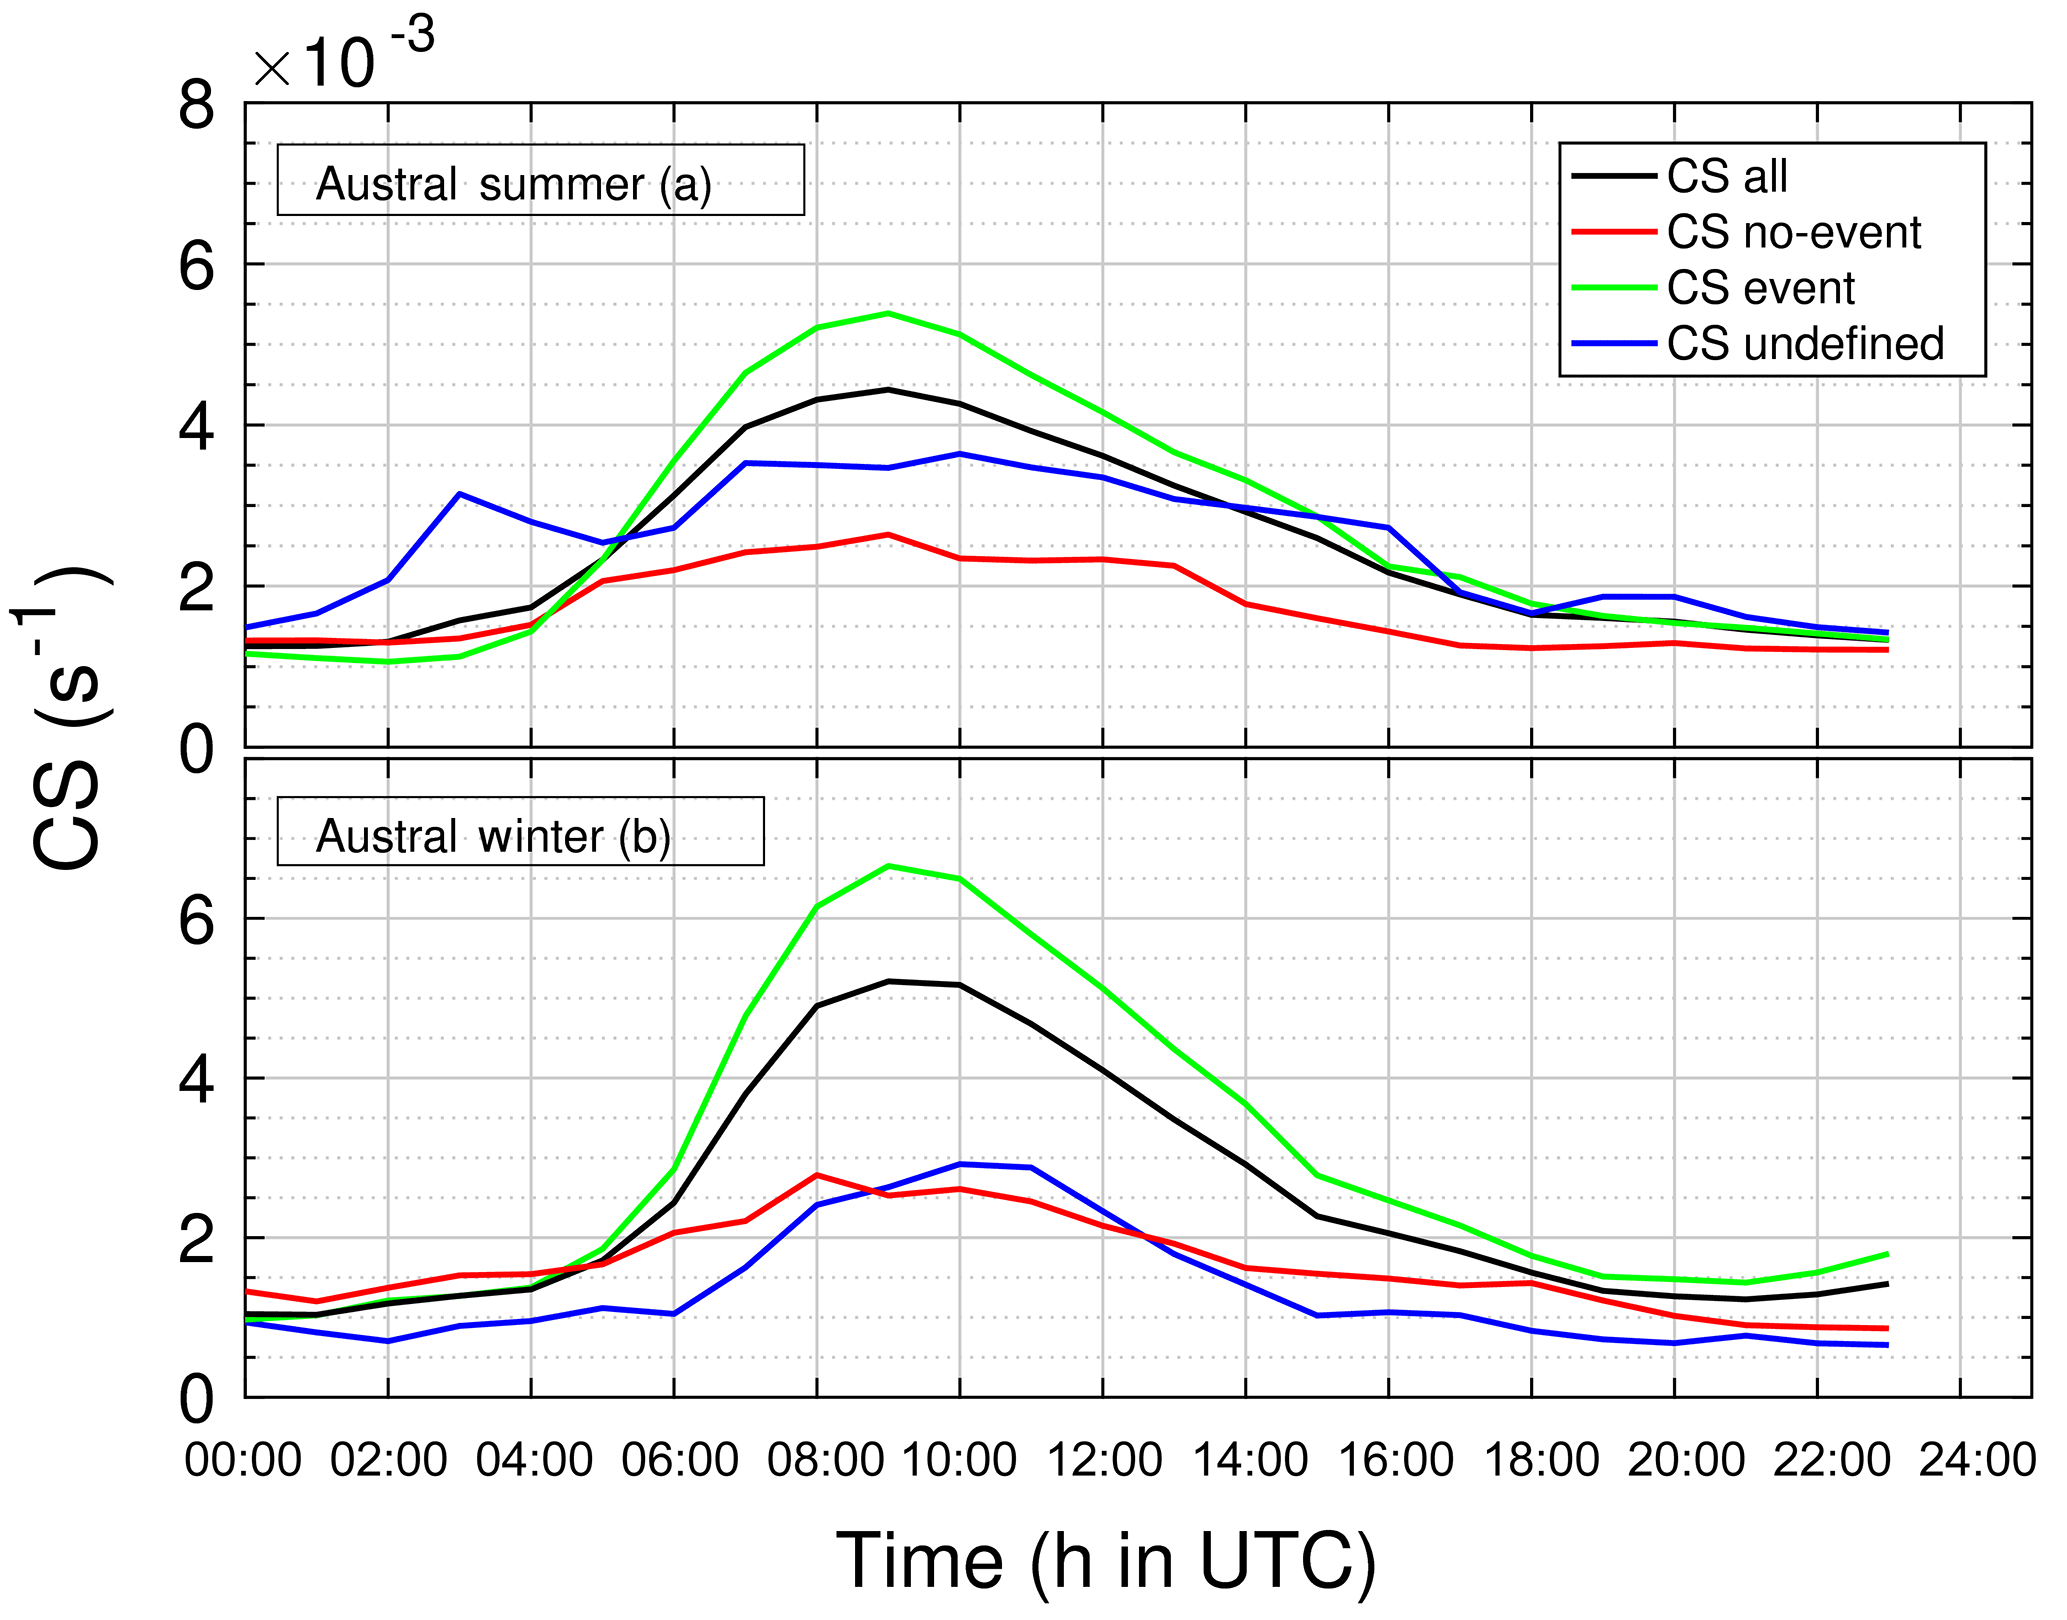
As the CS parameter varies throughout the day, we have also chosen to show the average daily variation in CS for summer (Fig. A3a) and for winter (Fig. A3b). Averages were calculated on undefined (CSun), no-event (CSnoev), event (CSev), and all days. Maximum of CS all and CSev are reached at 09:00 UTC for both seasons but are higher for winter (CS s−1; CSev=6.9 × 10⁻³ s−1) than summer (CSall=4.5 × 10⁻³ s−1; CSev=5.2 × 10⁻³ s−1). The CSev really begins to increase at 04:00 UTC for summer but 05:00 UTC for winter. This corresponds to the moment when CSnoev becomes lower than CSev. Before these times, CSnoev is 10−4 higher than CSev, implying that CSnoev is too large to trigger new particle formation. Consequently, and thanks to this daily representation, we assume that CS affects the new particle formation trigger for both seasons in 2015. Moreover, it can be seen that CSun curves follow the CSnoev curves better than CSev so it is possible that no-event days were not well recognised.
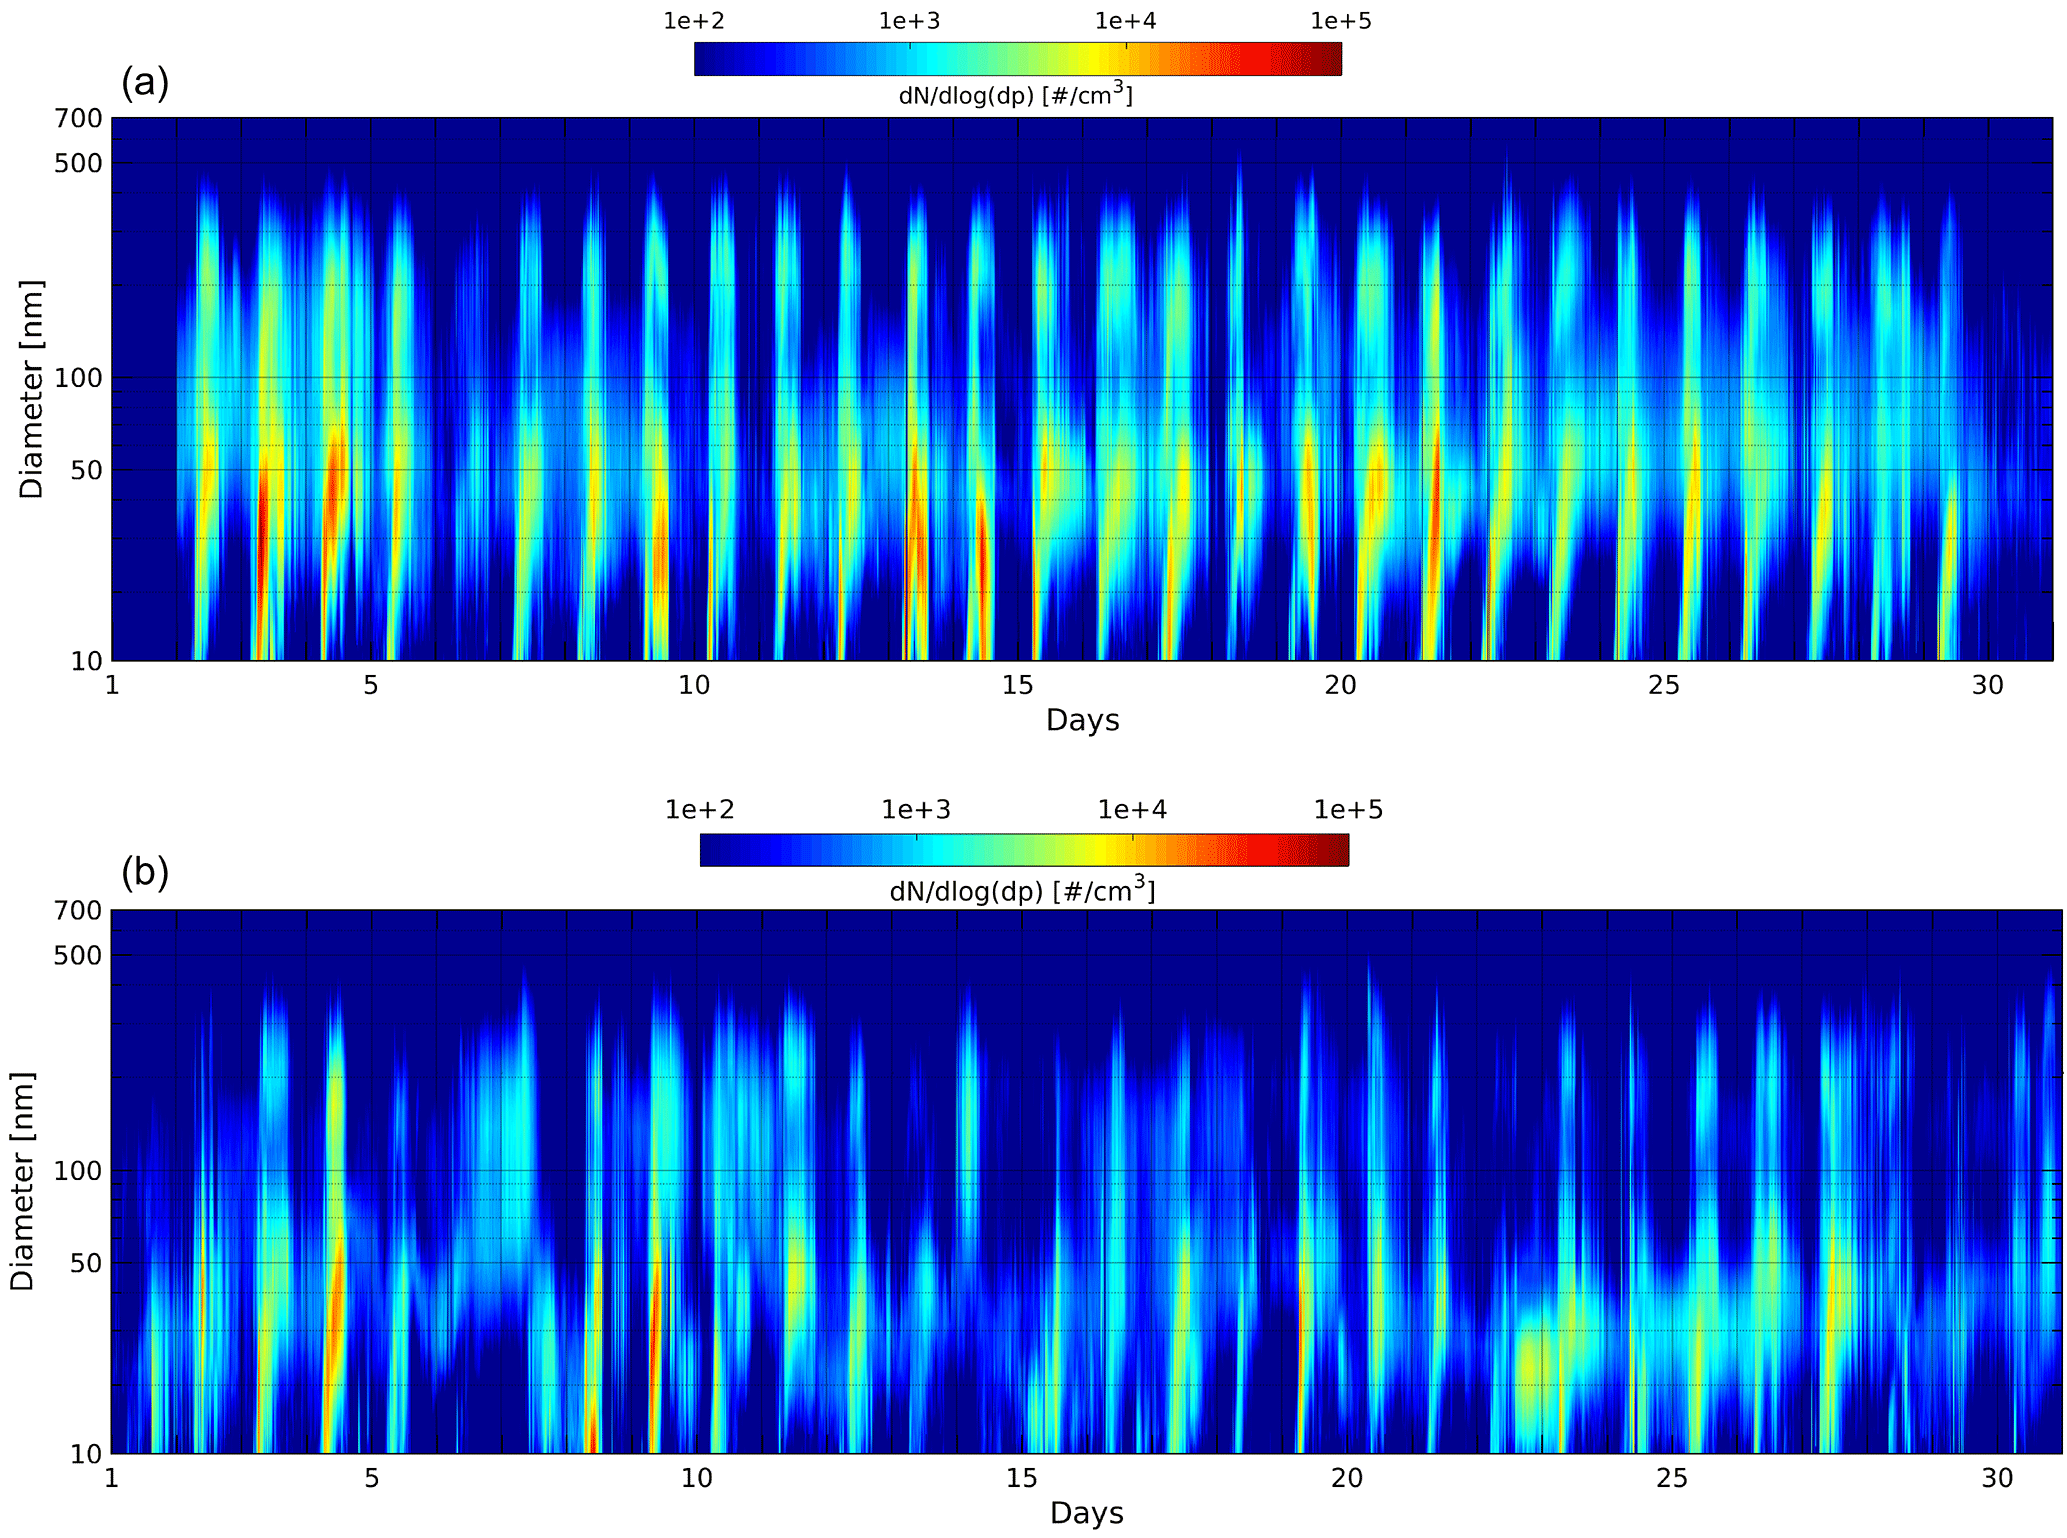
Figure A4DMPS spectra for (a) April and (b) June months. We can clearly observe an event number difference between the two months according to the different NPF occurrence averages which are 93.1 % for April and 46.7 % for June.
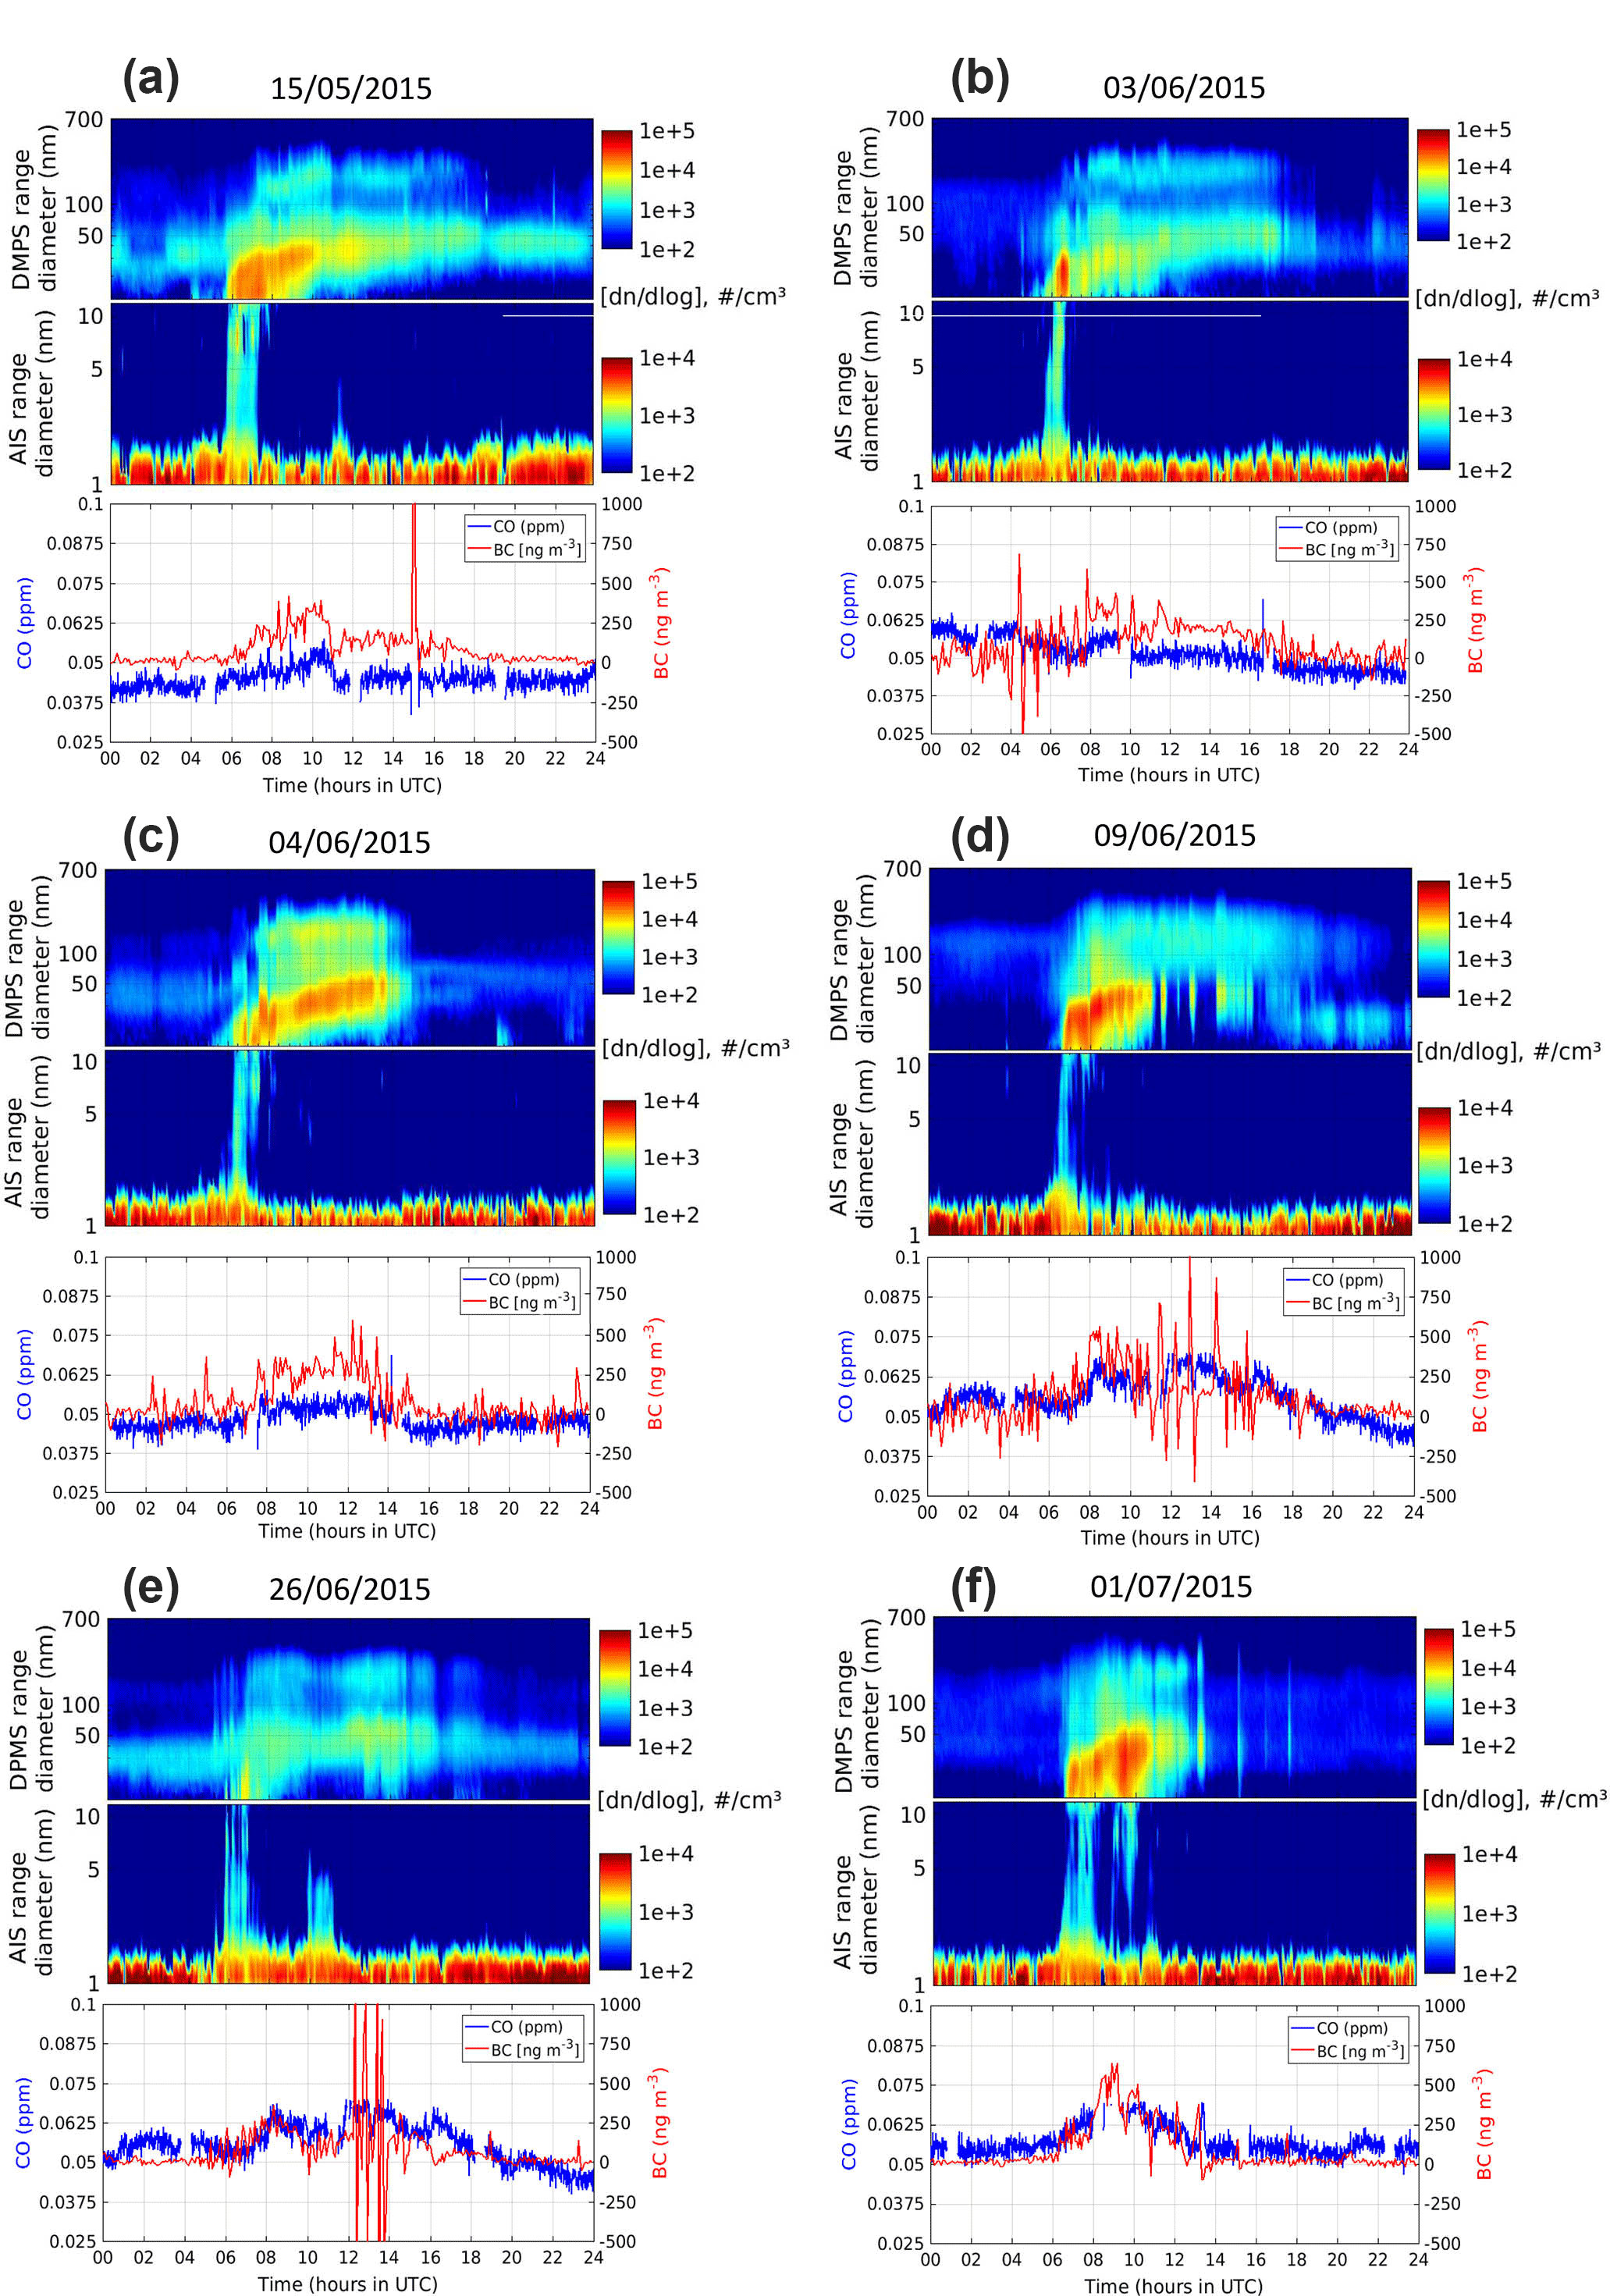
Figure A5Diurnal variation in (upper two subpanels) negative ions (1–10 nm) and (10–700 nm) aerosol particle size distribution (note the different concentration scales for ion number and particle concentrations) and (lower subpanels) both BC and CO concentration variations in ng m−3 and ppm, respectively, for (a) 15/05/2015, (b) 03/06/2015, (c) 04/06/2015, (d) 09/06/2015, (e) 26/06/2015, and (f) 01/07/2015.
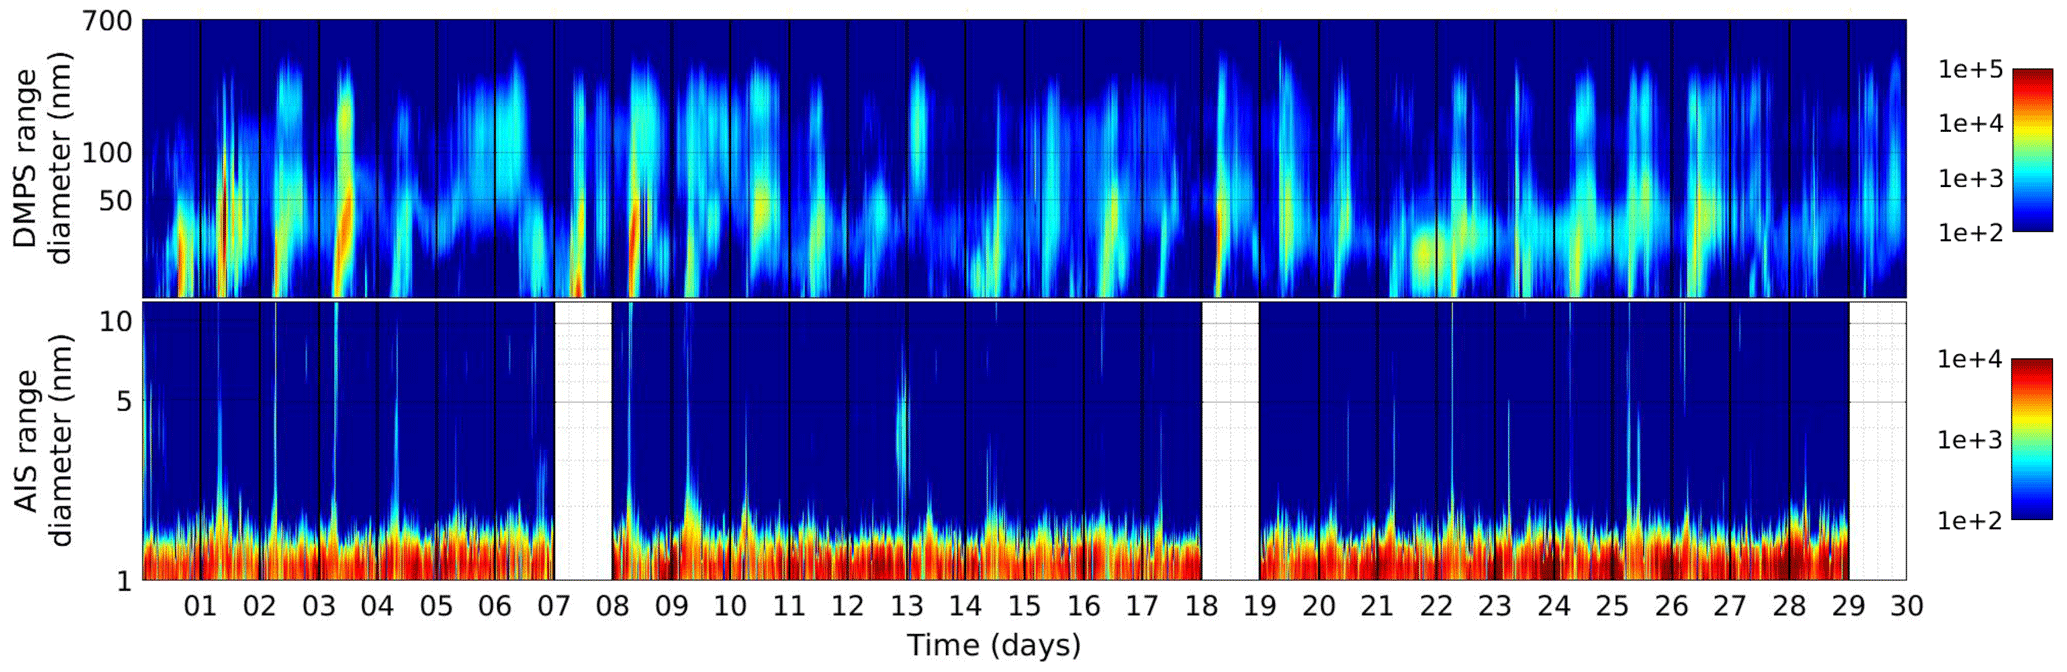
Figure A6DMPS and AIS spectra for June 2015. We can see that 8th, 19th, and 30th June were not available because of missing data.
The authors declare that they have no conflict of interest.
This project has received funding from the European Union's Horizon 2020
research and innovation programme under grant agreement No 654109
(ACTRIS-2), from the French programme SNO-CLAP, and from the OMNCG/OSU-R
programme of La Réunion University. We also wish to thank the ORA
(Observatoire Réunionnais de l'Air) for providing the SO2 data set
as Jean Sciare who provides the processed data from the aethalometer.
Edited by: Fangqun Yu
Reviewed by: Fangqun Yu and two anonymous referees
Baldy, S., Ancellet, G., Bessafi, M., Badr, A., and Luk, D. L. S.: Field observations of the vertical distribution of tropospheric ozone at the island of Reunion (southern tropics), J. Geophys. Res.-Atmos., 101, 23835–23849, https://doi.org/10.1029/95JD02929, 1996.
Baray, J.-L., Courcoux, Y., Keckhut, P., Portafaix, T., Tulet, P., Cammas, J.-P., Hauchecorne, A., Godin Beekmann, S., De Mazière, M., Hermans, C., Desmet, F., Sellegri, K., Colomb, A., Ramonet, M., Sciare, J., Vuillemin, C., Hoareau, C., Dionisi, D., Duflot, V., Vérèmes, H., Porteneuve, J., Gabarrot, F., Gaudo, T., Metzger, J.-M., Payen, G., Leclair de Bellevue, J., Barthe, C., Posny, F., Ricaud, P., Abchiche, A., and Delmas, R.: Maïdo observatory: a new high-altitude station facility at Reunion Island (21∘ S, 55∘ E) for long-term atmospheric remote sensing and in situ measurements, Atmos. Meas. Tech., 6, 2865–2877, https://doi.org/10.5194/amt-6-2865-2013, 2013.
Bates, T. S., Kapustin, V. N., Quinn, P. K., Covert, D. S., Coffman, D. J., Mari, C., Durkee, P. A., De Bruyn, W. J., and Saltzman, E. S.: Processes controlling the distribution of aerosol particles in the lower marine boundary layer during the First Aerosol Characterization Experiment (ACE 1), J. Geophys. Res.-Atmos., 103, 16369–16383, https://doi.org/10.1029/97JD03720, 1998.
Bianchi, F., Tröstl, J., Junninen, H., Frege, C., Henne, S., Hoyle, C. R., Molteni, U., Herrmann, E., Adamov, A., Bukowiecki, N., Chen, X., Duplissy, J., Gysel, M., Hutterli, M., Kangasluoma, J., Kontkanen, J., Kürten, A., Manninen, H. E., Münch, S., Peräkylä, O., Petäjä, T., Rondo, L., Williamson, C., Weingartner, E., Curtius, J., Worsnop, D. R., Kulmala, M., Dommen, J., and Baltensperger, U.: New particle formation in the free troposphere: A question of chemistry and timing, Science, 352, 1109–1112, 2016.
Boulon, J., Sellegri, K., Venzac, H., Picard, D., Weingartner, E., Wehrle, G., Collaud Coen, M., Bütikofer, R., Flückiger, E., Baltensperger, U., and Laj, P.: New particle formation and ultrafine charged aerosol climatology at a high altitude site in the Alps (Jungfraujoch, 3580 m a.s.l., Switzerland), Atmos. Chem. Phys., 10, 9333–9349, https://doi.org/10.5194/acp-10-9333-2010, 2010.
Boulon, J., Sellegri, K., Hervo, M., Picard, D., Pichon, J.-M., Fréville, P., and Laj, P.: Investigation of nucleation events vertical extent: a long term study at two different altitude sites, Atmos. Chem. Phys., 11, 5625–5639, https://doi.org/10.5194/acp-11-5625-2011, 2011a.
Boulon, J., Sellegri, K., Hervo, M., and Laj, P.: Observations of nucleation of new particles in a volcanic plume, P. Natl. Acad. Sci., 108, 12223–12226, 2011b.
Boy, M., Kulmala, M., Ruuskanen, T. M., Pihlatie, M., Reissell, A., Aalto, P. P., Keronen, P., Dal Maso, M., Hellen, H., Hakola, H., Jansson, R., Hanke, M., and Arnold, F.: Sulphuric acid closure and contribution to nucleation mode particle growth, Atmos. Chem. Phys., 5, 863–878, https://doi.org/10.5194/acp-5-863-2005, 2005.
Dal Maso, M.: Condensation and coagulation sinks and formation of nucleation mode particles in coastal and boreal forest boundary layers, J. Geophys. Res., 107, https://doi.org/10.1029/2001JD001053, 2002.
Dal Maso, M., Kulmala, M., Riipinen, I., Wagner, R., Hussein, T., Aalto, P. P., and Lehtinen, K. E.: Formation and growth of fresh atmospheric aerosols: eight years of aerosol size distribution data from SMEAR II, Hyytiala, Finland, Boreal Environ. Res., 107, AAC 10-1-PAR 9-11, 2005.
Freney, E., Sellegri, K., Chrit, M., Adachi, K., Brito, J., Waked, A., Borbon, A., Colomb, A., Dupuy, R., Pichon, J.-M., Bouvier, L., Delon, C., Jambert, C., Durand, P., Bourianne, T., Gaimoz, C., Triquet, S., Féron, A., Beekmann, M., Dulac, F., and Sartelet, K.: Aerosol composition and the contribution of SOA formation over Mediterranean forests, Atmos. Chem. Phys., 18, 7041–7056, https://doi.org/10.5194/acp-18-7041-2018, 2018.
Hallar, A. G., Petersen, R., McCubbin, I. B., Lowenthal, D., Lee, S., Andrews, E., and Yu, F.: Climatology of New Particle Formation and Corresponding Precursors at Storm Peak Laboratory, Aerosol Air Qual. Res., 16, 816–826, https://doi.org/10.4209/aaqr.2015.05.0341, 2016.
Hamburger, T., McMeeking, G., Minikin, A., Birmili, W., Dall'Osto, M., O'Dowd, C., Flentje, H., Henzing, B., Junninen, H., Kristensson, A., de Leeuw, G., Stohl, A., Burkhart, J. F., Coe, H., Krejci, R., and Petzold, A.: Overview of the synoptic and pollution situation over Europe during the EUCAARI-LONGREX field campaign, Atmos. Chem. Phys., 11, 1065–1082, https://doi.org/10.5194/acp-11-1065-2011, 2011.
Herrmann, E., Weingartner, E., Henne, S., Vuilleumier, L., Bukowiecki, N., Steinbacher, M., Conen, F., Collaud Coen, M., Hammer, E., and Jurányi, Z.: Analysis of long-term aerosol size distribution data from Jungfraujoch with emphasis on free tropospheric conditions, cloud influence, and air mass transport, J. Geophys. Res.-Atmos., 120, 9459–9480, 2015.
Hirsikko, A., Laakso, L., Hõrrak, U., Aalto, P. P., Kerminen, V., and Kulmala, M.: Annual and size dependent variation of growth rates and ion concentrations in boreal forest, Boreal Environ. Res., 10, 357–369, 2005.
Hirsikko, A., Vakkari, V., Tiitta, P., Manninen, H. E., Gagné, S., Laakso, H., Kulmala, M., Mirme, A., Mirme, S., Mabaso, D., Beukes, J. P., and Laakso, L.: Characterisation of sub-micron particle number concentrations and formation events in the western Bushveld Igneous Complex, South Africa, Atmos. Chem. Phys., 12, 3951–3967, https://doi.org/10.5194/acp-12-3951-2012, 2012.
Hyvönen, S., Junninen, H., Laakso, L., Dal Maso, M., Grönholm, T., Bonn, B., Keronen, P., Aalto, P., Hiltunen, V., Pohja, T., Launiainen, S., Hari, P., Mannila, H., and Kulmala, M.: A look at aerosol formation using data mining techniques, Atmos. Chem. Phys., 5, 3345–3356, https://doi.org/10.5194/acp-5-3345-2005, 2005.
Iida, K., Stolzenburg, M. R., McMurry, P. H., and Smith, J. N.: Estimating nanoparticle growth rates from size-dependent charged fractions: Analysis of new particle formation events in Mexico City, J. Geophys. Res.-Atmos., 113, https://doi.org/10.1029/2007JD009260, 2008.
Kanawade, V. P., Jobson, B. T., Guenther, A. B., Erupe, M. E., Pressley, S. N., Tripathi, S. N., and Lee, S.-H.: Isoprene suppression of new particle formation in a mixed deciduous forest, Atmos. Chem. Phys., 11, 6013–6027, https://doi.org/10.5194/acp-11-6013-2011, 2011.
Kerminen, V.-M. and Kulmala, M.: Analytical formulae connecting the “real” and the “apparent” nucleation rate and the nuclei number concentration for atmospheric nucleation events, J. Aerosol Sci., 33, 609–622, https://doi.org/10.1016/S0021-8502(01)00194-X, 2002.
Kiendler-Scharr, A., Wildt, J., Maso, M. D., Hohaus, T., Kleist, E., Mentel, T. F., Tillmann, R., Uerlings, R., Schurr, U., and Wahner, A.: New particle formation in forests inhibited by isoprene emissions, Nature, 461, 381–384, https://doi.org/10.1038/nature08292, 2009.
Koponen, I. K., Virkkula, A., Hillamo, R., Kerminen, V.-M., and Kulmala, M.: Number size distributions and concentrations of the continental summer aerosols in Queen Maud Land, Antarctica, J. Geophys. Res.-Atmos., 108, https://doi.org/10.1029/2003JD003614, 2003.
Kulmala, M.: ATMOSPHERIC SCIENCE: How Particles Nucleate and Grow, Science, 302, 1000–1001, https://doi.org/10.1126/science.1090848, 2003.
Kulmala, M. and Kerminen, V.-M.: On the formation and growth of atmospheric nanoparticles, Atmos. Res., 90, 132–150, https://doi.org/10.1016/j.atmosres.2008.01.005, 2008.
Kulmala, M., Maso, M. D., Mäkelä, J. M., Pirjola, L., Väkevä, M., Aalto, P., Miikkulainen, P., Hämeri, K., and O'Dowd, C. D.: On the formation, growth and composition of nucleation mode particles, Tellus B, 53, 479–490, https://doi.org/10.3402/tellusb.v53i4.16622, 2001.
Kulmala, M., Vehkamäki, H., Petäjä, T., Dal Maso, M., Lauri, A., Kerminen, V.-M., Birmili, W., and McMurry, P. H.: Formation and growth rates of ultrafine atmospheric particles: a review of observations, J. Aerosol Sci., 35, 143–176, https://doi.org/10.1016/j.jaerosci.2003.10.003, 2004.
Kulmala, M., Riipinen, I., Sipilä, M., Manninen, H. E., Petäjä, T., Junninen, H., Maso, M. D., Mordas, G., Mirme, A., Vana, M., Hirsikko, A., Laakso, L., Harrison, R. M., Hanson, I., Leung, C., Lehtinen, K. E. J., and Kerminen, V.-M.: Toward Direct Measurement of Atmospheric Nucleation, Science, 318, 89–92, https://doi.org/10.1126/science.1144124, 2007.
Lehtinen, K. E. J., Dal Maso, M., Kulmala, M., and Kerminen, V.-M.: Estimating nucleation rates from apparent particle formation rates and vice versa: Revised formulation of the Kerminen–Kulmala equation, J. Aerosol Sci., 38, 988–994, https://doi.org/10.1016/j.jaerosci.2007.06.009, 2007.
Lesouëf, D., Gheusi, F., Delmas, R., and Escobar, J.: Numerical simulations of local circulations and pollution transport over Reunion Island, Ann. Geophys., 29, 53–69, https://doi.org/10.5194/angeo-29-53-2011, 2011.
Mäkelä, J. M., Riihelä, M., Ukkonen, A., Jokinen, V., and Keskinen, J.: Comparison of mobility equivalent diameter with Kelvin-Thomson diameter using ion mobility data, J. Chem. Phys., 105, 1562–1571, https://doi.org/10.1063/1.472017, 1996.
Makkonen, R., Asmi, A., Kerminen, V.-M., Boy, M., Arneth, A., Hari, P., and Kulmala, M.: Air pollution control and decreasing new particle formation lead to strong climate warming, Atmos. Chem. Phys., 12, 1515–1524, https://doi.org/10.5194/acp-12-1515-2012, 2012.
Manninen, H. E., Nieminen, T., Asmi, E., Gagné, S., Häkkinen, S., Lehtipalo, K., Aalto, P., Vana, M., Mirme, A., Mirme, S., Hõrrak, U., Plass-Dülmer, C., Stange, G., Kiss, G., Hoffer, A., Töro, N., Moerman, M., Henzing, B., de Leeuw, G., Brinkenberg, M., Kouvarakis, G. N., Bougiatioti, A., Mihalopoulos, N., O'Dowd, C., Ceburnis, D., Arneth, A., Svenningsson, B., Swietlicki, E., Tarozzi, L., Decesari, S., Facchini, M. C., Birmili, W., Sonntag, A., Wiedensohler, A., Boulon, J., Sellegri, K., Laj, P., Gysel, M., Bukowiecki, N., Weingartner, E., Wehrle, G., Laaksonen, A., Hamed, A., Joutsensaari, J., Petäjä, T., Kerminen, V.-M., and Kulmala, M.: EUCAARI ion spectrometer measurements at 12 European sites – analysis of new particle formation events, Atmos. Chem. Phys., 10, 7907–7927, https://doi.org/10.5194/acp-10-7907-2010, 2010.
Martin, S. T., Andreae, M. O., Artaxo, P., Baumgardner, D., Chen, Q., Goldstein, A. H., Guenther, A., Heald, C. L., Mayol-Bracero, O. L., McMurry, P. H., Pauliquevis, T., Pöschl, U., Prather, K. A., Roberts, G. C., Saleska, S. R., Silva Dias, M. A., Spracklen, D. V., Swietlicki, E., and Trebs, I.: Sources and properties of Amazonian aerosol particles, Rev. Geophys., 48, RG2002, https://doi.org/10.1029/2008RG000280, 2010.
Mikkonen, S., Lehtinen, K. E. J., Hamed, A., Joutsensaari, J., Facchini, M. C., and Laaksonen, A.: Using discriminant analysis as a nucleation event classification method, Atmos. Chem. Phys., 6, 5549–5557, https://doi.org/10.5194/acp-6-5549-2006, 2006.
Mikkonen, S., Romakkaniemi, S., Smith, J. N., Korhonen, H., Petäjä, T., Plass-Duelmer, C., Boy, M., McMurry, P. H., Lehtinen, K. E. J., Joutsensaari, J., Hamed, A., Mauldin III, R. L., Birmili, W., Spindler, G., Arnold, F., Kulmala, M., and Laaksonen, A.: A statistical proxy for sulphuric acid concentration, Atmos. Chem. Phys., 11, 11319–11334, https://doi.org/10.5194/acp-11-11319-2011, 2011.
Mirme, A., Tamm, E., Mordas, G., Vana, M., Uin, J., Mirme, S., Bernotas, T., Laakso, L., Hirsikko, A., and Kulmala, M.: A wide-range multi-channel Air Ion Spectrometer, Boreal Environ., 12, 247–264, 2007.
Modini, R. L., Ristovski, Z. D., Johnson, G. R., He, C., Surawski, N., Morawska, L., Suni, T., and Kulmala, M.: New particle formation and growth at a remote, sub-tropical coastal location, Atmos. Chem. Phys., 9, 7607–7621, https://doi.org/10.5194/acp-9-7607-2009, 2009.
O'Dowd, C. D. and De Leeuw, G.: Marine aerosol production: a review of the current knowledge, Philos. Trans. R. Soc. Lond. Math. Phys. Eng. Sci., 365, 1753–1774, 2007.
Peltier, A., Beauducel, F., Villeneuve, N., Ferrazzini, V., Di Muro, A., Aiuppa, A., Derrien, A., Jourde, K., and Taisne, B.: Deep fluid transfer evidenced by surface deformation during the 2014–2015 unrest at Piton de la Fournaise volcano, J. Volcanol. Geotherm. Res., 321, 140–148, https://doi.org/10.1016/j.jvolgeores.2016.04.031, 2016.
Petäjä, T., Mauldin III, R. L., Kosciuch, E., McGrath, J., Nieminen, T., Paasonen, P., Boy, M., Adamov, A., Kotiaho, T., and Kulmala, M.: Sulfuric acid and OH concentrations in a boreal forest site, Atmos. Chem. Phys., 9, 7435–7448, https://doi.org/10.5194/acp-9-7435-2009, 2009.
Rose, C., Sellegri, K., Asmi, E., Hervo, M., Freney, E., Colomb, A., Junninen, H., Duplissy, J., Sipilä, M., Kontkanen, J., Lehtipalo, K., and Kulmala, M.: Major contribution of neutral clusters to new particle formation at the interface between the boundary layer and the free troposphere, Atmos. Chem. Phys., 15, 3413–3428, https://doi.org/10.5194/acp-15-3413-2015, 2015a.
Rose, C., Sellegri, K., Velarde, F., Moreno, I., Ramonet, M., Weinhold, K., Krejci, R., Ginot, P., Andrade, M., Wiedensohler, A., and Laj, P.: Frequent nucleation events at the high altitude station of Chacaltaya (5240 m a.s.l.), Bolivia, Atmos. Environ., 102, 18–29, https://doi.org/10.1016/j.atmosenv.2014.11.015, 2015b.
Seinfeld, J. H. and Pandis, S. N.: Atmospheric Chemistry and Physics: From Air Pollution to Climate Change, Third edition, John Wiley & Sons, New York, 2016.
Sihto, S.-L., Kulmala, M., Kerminen, V.-M., Dal Maso, M., Petäjä, T., Riipinen, I., Korhonen, H., Arnold, F., Janson, R., Boy, M., Laaksonen, A., and Lehtinen, K. E. J.: Atmospheric sulphuric acid and aerosol formation: implications from atmospheric measurements for nucleation and early growth mechanisms, Atmos. Chem. Phys., 6, 4079–4091, https://doi.org/10.5194/acp-6-4079-2006, 2006.
Soler, O.: Atlas climatique de La Réunion (study report, 77 p.), 2000.
Tulet, P. and Villeneuve, N.: Large scale modeling of the transport, chemical transformation and mass budget of the sulfur emitted during the April 2007 eruption of Piton de la Fournaise, Atmos. Chem. Phys., 11, 4533–4546, https://doi.org/10.5194/acp-11-4533-2011, 2011.
Tulet, P., Di Muro, A., Colomb, A., Denjean, C., Duflot, V., Arellano, S., Foucart, B., Brioude, J., Sellegri, K., Peltier, A., Aiuppa, A., Barthe, C., Bhugwant, C., Bielli, S., Boissier, P., Boudoire, G., Bourrianne, T., Brunet, C., Burnet, F., Cammas, J.-P., Gabarrot, F., Galle, B., Giudice, G., Guadagno, C., Jeamblu, F., Kowalski, P., Leclair de Bellevue, J., Marquestaut, N., Mékies, D., Metzger, J.-M., Pianezze, J., Portafaix, T., Sciare, J., Tournigand, A., and Villeneuve, N.: First results of the Piton de la Fournaise STRAP 2015 experiment: multidisciplinary tracking of a volcanic gas and aerosol plume, Atmos. Chem. Phys., 17, 5355–5378, https://doi.org/10.5194/acp-17-5355-2017, 2017.
Vakkari, V., Laakso, H., Kulmala, M., Laaksonen, A., Mabaso, D., Molefe, M., Kgabi, N., and Laakso, L.: New particle formation events in semi-clean South African savannah, Atmos. Chem. Phys., 11, 3333–3346, https://doi.org/10.5194/acp-11-3333-2011, 2011.
Venzac, H., Sellegri, K., Laj, P., Villani, P., Bonasoni, P., Marinoni, A., Cristofanelli, P., Calzolari, F., Fuzzi, S., Decesari, S., Facchini, M. C., Vuillermoz, E., and Verza, P. G.: High frequency new particle formation in the Himalayas, P. Natl. Acad. Sci., 105, 15666–15671, 2008.
Wiedensohler, A., Birmili, W., Nowak, A., Sonntag, A., Weinhold, K., Merkel, M., Wehner, B., Tuch, T., Pfeifer, S., Fiebig, M., Fjäraa, A. M., Asmi, E., Sellegri, K., Depuy, R., Venzac, H., Villani, P., Laj, P., Aalto, P., Ogren, J. A., Swietlicki, E., Williams, P., Roldin, P., Quincey, P., Hüglin, C., Fierz-Schmidhauser, R., Gysel, M., Weingartner, E., Riccobono, F., Santos, S., Grüning, C., Faloon, K., Beddows, D., Harrison, R., Monahan, C., Jennings, S. G., O'Dowd, C. D., Marinoni, A., Horn, H.-G., Keck, L., Jiang, J., Scheckman, J., McMurry, P. H., Deng, Z., Zhao, C. S., Moerman, M., Henzing, B., de Leeuw, G., Löschau, G., and Bastian, S.: Mobility particle size spectrometers: harmonization of technical standards and data structure to facilitate high quality long-term observations of atmospheric particle number size distributions, Atmos. Meas. Tech., 5, 657–685, https://doi.org/10.5194/amt-5-657-2012, 2012.
Yli-Juuti, T., Nieminen, T., Hirsikko, A., Aalto, P. P., Asmi, E., Hõrrak, U., Manninen, H. E., Patokoski, J., Dal Maso, M., Petäjä, T., Rinne, J., Kulmala, M., and Riipinen, I.: Growth rates of nucleation mode particles in Hyytiälä during 2003–2009: variation with particle size, season, data analysis method and ambient conditions, Atmos. Chem. Phys., 11, 12865–12886, https://doi.org/10.5194/acp-11-12865-2011, 2011.
Yu, F., Wang, Z., Luo, G., and Turco, R.: Ion-mediated nucleation as an important global source of tropospheric aerosols, Atmos. Chem. Phys., 8, 2537–2554, https://doi.org/10.5194/acp-8-2537-2008, 2008.
Yu, F., Luo, G., Nadykto, A. B., and Herb, J.: Impact of temperature dependence on the possible contribution of organics to new particle formation in the atmosphere, Atmos. Chem. Phys., 17, 4997–5005, https://doi.org/10.5194/acp-17-4997-2017, 2017.