the Creative Commons Attribution 4.0 License.
the Creative Commons Attribution 4.0 License.
 | 29 Jun 2018
Comparison of polycyclic aromatic compounds in air measured by conventional passive air samplers and passive dry deposition samplers and contributions from petcoke and oil sands ore
Narumol Jariyasopit
Yifeng Zhang
Jonathan W. Martin
Tom Harner
Conventional passive air samplers (PAS) and passive dry deposition samplers (PAS-DD) were deployed along a 90 km south–north transect at five sites in the Athabasca oil sands region (AOSR) during October to November 2015. The purpose was to compare and characterize the performance of the two passive sampling methods for targeted compounds across a range of site types. Samples were analyzed for polycyclic aromatic compounds (PACs), nitrated polycyclic aromatic hydrocarbons (NPAHs), and oxygenated PAHs (OPAHs). ΣPAC and ΣNPAH concentrations were highest in PAS and PAS-DD samplers at site AMS5, which is the closest sampling site to surface mining and upgrading facilities. The OPAHs were elevated at site AMS6, which is located in the town of Fort McMurray, approximately 30 km south of the main mining area. PAS-DD was enriched relative to PAS in particle-associated target chemicals, which is consistent with the relatively more open design of PAS-DD intended to capture particle-phase (and gas-phase) deposition. Petroleum coke (petcoke) (i.e., the carbonaceous byproduct of bitumen upgrading) and oil sands ore (i.e., the material mined in open-pit mines from which bitumen is extracted) were assessed for their potential to be a source of PACs to air in the oil sands region. The ore samples contained ∼ 8 times and ∼ 40 times higher ΣPACs concentrations (dry weight basis) than delayed and fluid petcoke, respectively. The residue analysis of ore and petcoke samples also revealed that the chemical 4-nitrobiphenyl (4-NBP) can be used to track gas-phase emissions to air. A comparison of chemical residues in ore, petcoke, and air samples revealed that the ore is likely a major contributor to volatile PACs present in air and that both ore and petcoke are contributing to the particle-associated PACs in air near open-pit mining areas. The contribution of petcoke particles in passive air samples was also confirmed qualitatively using scanning electron microscopy coupled with energy dispersive X-ray spectroscopy (SEM-EDS).
- Article
(1313 KB) -
Supplement
(817 KB) - BibTeX
- EndNote


Application of passive air sampling techniques has become widespread due to their simplicity, convenience, and cost-effectiveness. It enables us to routinely monitor air pollutants at a larger scale and to extend air monitoring networks to strategic sites that are not feasible for active air sampler installation. Illustrated in Fig. S1 in the Supplement, conventional double-domed polyurethane foam (PUF) disk passive air samplers (PAS) have been commonly used in several air monitoring programs, including the Athabasca oil sands air monitoring network, which uses the Global Atmospheric Passive Sampling (GAPS) Network-type sampler (Harner et al., 2006; Pozo et al., 2004; Klánová et al., 2006; Jaward et al., 2004; Schuster et al., 2015). A recent study demonstrated that the GAPS-type polyurethane foam (PUF)-PAS was capable of accumulating particles, ranging in size from 250 to 4140 nm, with no discrimination compared to conventional PS-1-type active air samplers (Markovic et al., 2015). The geometry of the PUF-PAS allows it to capture fine particles (aerodynamic diameter < 2.5 µm) in addition to gas-phase compounds, which makes it suitable for investigating semi-volatile organic compounds (Deng et al., 2007; Albinet et al., 2008b; Chrysikou et al., 2009). However, coarse particles (aerodynamic diameter > 10 µm) are excluded from collection since the overlapping double-dome design of the PUF-PAS does not allow direct flow of bulk air through the sampler (Thomas et al., 2006). The coarse particle component is the major contributor to the particle deposition flux, particularly in the settling zone near emission sources (Holsen and Noll, 1992). As such, a prototype passive dry deposition sampler (PAS-DD) was introduced in our recent study to assess dry deposition of polycyclic aromatic hydrocarbons (PAHs) and related compounds (Eng et al., 2013). The design of PAS-DD, which incorporates a PUF disk as the collection substrate, positioned between two open parallel flat plates that are shielded above, allows for dry particle deposition from bulk air as well as dry gas-phase deposition (Fig. S1).
Starting in October 2015, PAS-DD were co-deployed with PAS at five sampling sites in the Athabasca oil sands region (AOSR) in order to compare the performance of the two samplers. These sampling sites are part of a larger 16-site passive air monitoring network that has been operating since 2010 (Schuster et al., 2015) under the Canada–Alberta Oil Sands Monitoring (OSM) plan and reporting on polycyclic aromatic compounds (PACs) (i.e., parent and alkylated PAHs; dibenzothiophene, DBT; alkylated DBTs; retene, RET); PAH derivatives, including nitrated polycyclic aromatic hydrocarbons (NPAHs) and oxygenated PAHs (OPAHs); and an assessment of the toxicity potential of the chemical mixture (Schuster et al., 2015; Jariyasopit et al., 2016).
As a result of an increase in oil sands production, there has been growing concern over impacts of organic constituents in air, their transport and deposition, and the associated impact on the health of the environment and on humans. One of the important classes of organic pollutants in this context is the PACs. PACs are emitted from a variety of sources such as combustion processes (e.g., forest fires, trash burning) and also petrogenic sources; they are present in the bitumen-containing ore that is mined in the AOSR (Yang et al., 2011). Information on PAC sources can be obtained from the National Pollutant Release Inventory (NPRI) and environmental impact assessment (EIA), but these are limited to PACs which do not account for compounds produced by transformation reactions (NPRI, http://ec.gc.ca/inrp-npri/donnees-data/index.cfm?lang=En, last access: 30 May 2017; Government of Alberta, https://exts2.aep.alberta.ca/DocArc/EIA/Pages/default.aspx, last access: 17 March 2017). The major mining-related sources of PACs include stacks, mining fleet vehicles, open mine pits, exposed ore deposits, and fugitive dusts such as petroleum coke (petcoke) (Zhang et al., 2016). Secondary and evaporative sources of PACs (e.g., tailings ponds) have also been suggested through measurements and models (Galarneau et al., 2014; Parajulee and Wania, 2014). The atmospheric deposition of PACs across the oil sands region has also been investigated using snow and lichens and estimated through modeling (Zhang et al., 2015; Studabaker et al., 2012; Kelly et al., 2009). Zhang et al. (2016) have also investigated the role of petcoke particle deposition to snow as a mechanism of the transport and deposition of PACs to terrestrial surfaces.
Petcoke is a solid residue and is a byproduct of the upgrading of bitumen after lighter hydrocarbon molecules have been fractionated. There are two major types of coking in the AOSR referred to as “delayed” and “fluid” coking processes (Anthony, 1995). Both coking processes involve thermal cracking of the feedstock to extract lighter products and leave behind petcoke. In the delayed coking process, the cracking process continues, after a short thermal cracking in a furnace, in coke drums where solid coke is produced. In the fluid coking process, the coke produced in a heated reactor is circulated between the reactor and a burner to transfer heat. The delayed coking process occurs at lower temperature than the fluid coking process; therefore, the delayed petcoke contains more volatiles and potentially more PACs than the fluid petcoke.
The majority of petcoke produced in the AOSR has been stockpiled while only a small percentage is reused on-site as fuel (Alberta Energy Regulator, 2018). Recently petcoke has been used for capping decommissioned tailings ponds, which greatly enhances its surface area available for erosion and evaporation (Alberta Energy Regulator, 2018). We hypothesize that secondary emissions to air of PACs from oil sands ore (open-pit mines) and/or petcoke stockpiles, either through evaporation or particle suspension in air (e.g., wind transport), contribute substantially to PAC burdens in air, especially in nearby source areas. Therefore, in addition to comparing the performance of PUF-PAS and PAS-DD samplers, a secondary objective of this study is to assess the extent to which oil sands ore and petcoke contribute to the PAC burden of air in the AOSR.
2.1 Sampling
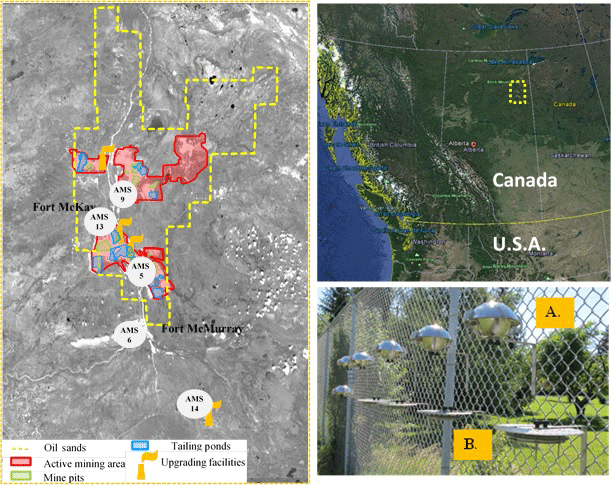
Figure 1Passive sampling site map (110 km × 180 km). AMS5 – Mannix, AMS6 – Fort McMurray, AMS9 – Barge landing, AMS13 – Syncrude, AMS14 – Anzac. (a) Conventional PUF disk passive air samplers (PAS) and (b) passive dry deposition sampler (PAS-DD).
Five sampling sites (Fig. 1) are part of the passive air monitoring network in the AOSR. Details regarding site locations, sampling media preparation, and sample deployment have been previously described (Schuster et al., 2015). The samplers were mounted approximately 3 m above the ground. In brief, PUF disks were pre-cleaned with accelerated solvent extraction (Dionex ASE 350) using acetone, petroleum ether, and acetonitrile, prior to use. Since October 2015, PAS-DD have been deployed alongside PAS at a subset of five sites (Figs. 1 and S1). PAS-DD was previously demonstrated to collect gas-phase PAHs (i.e., dry gas-phase deposition) at similar rates as PAS (Eng et al., 2013). A sampling rate of about 5 m3 d−1 was derived previously using co-located PAS and high-volume samplers for the gas- and particle-phase PACs (Harner et al., 2013). Concentrations measured by PAS-DD were expressed as ng m−3 for comparison with PAS, using the PAS effective air sample volume, corrected for reduced exposure surface of PAS-DD (Shoeib and Harner, 2002). Two field blanks were included in the sampling. Oil sands ore was collected from an open-pit mine and provided through the cooperation of Canada's Oil Sands Innovation Alliance (COSIA) and samples of delayed and fluid petcoke were obtained from the University of Alberta and were the same samples previously characterized and reported by Zhang et al. (2016).
2.2 Chemicals and materials
The monitored PACs, NPAHs, and OPAHs are listed in Table S1 in the Supplement. Standards for the target analytes were purchased from Cambridge Isotope Labs (Andover, MA), Chiron (Trondheim, Norway), and AccuStandard (New Haven, CT). Deuterium-labeled recovery and internal standards were purchased from Cambridge Isotope Labs (Andover, MA) and CDN Isotopes (Point-Claire, Québec, Canada). The deuterated recovery surrogates included 2,6-dimethylnaphthalene-d12, acenaphthene-d10, anthracene-d10, benzo(b)naphtho(2,1-d)-thiophene-d10, 1-nitronaphthalene-d7, 2-methyl-1-nitronaphthalene-d9, 5-nitroacenaphthene-d9, 9-nitroanthracene-d9, 3-nitrofluoranthene-d9,1-nitropyrene-d9, and 6-nitrochrysene-d11. The deuterated internal standards included fluorine-d10 and benz(a)anthracene-d12, 2-nitrobiphenyl-d9, and 2-nitrofluorene-d9. PUF disks (TE-1014, 14 cm diameter × 1.35 cm thick) were purchased from Tisch Environmental (Village of Cleves, OH).
2.3 Sample preparation and analyses
2.3.1 Chemical analyses
PUF disk, fluid petcoke (∼ 0.5 g), delayed petcoke (0.2 g), and oil sands ore (∼ 0.15 g) samples were spiked with the labeled recovery PAC and NPAH surrogates (250 ng) prior to extraction by accelerated solvent extraction (Dionex ASE 350) using petroleum ether and acetone (75:25, v:v; 2 cycles). For the passive air and petcoke samples, the extracts were purified using 5 g silica columns (Mega BE-SI, Agilent Technologies, New Castle, DE), eluted with dichloromethane. The oil sands ore samples were purified using 20 g silica columns (Mega BE-SI, Agilent Technologies, New Castle, DE), eluted with dichloromethane. Following solvent reduction under a purified N2 stream with a TurboVap II (Biotage, NC), the sample extracts were spiked with the labeled PAC (100 ng) and NPAH (250 ng) internal standards. PAC analysis was carried out using gas chromatography mass spectrometry (GC-MS, Agilent 6890 coupled with an Agilent 5975 MSD), by electron impact ionization in selected ion monitoring mode, on a DB-XLB column (30 m × 0.25 mm I.D., 0.25 µm film thickness, Agilent Technologies). NPAH and OPAH analysis was conducted using a GC-MS (Agilent 7890A coupled with an Agilent 7000 MSD), in electron capture negative ionization (ECNI), on a DB-5 column (30 m × 0.25 mm I.D., 0.25 µm film thickness, Agilent Technologies) (Jariyasopit et al., 2016).
2.3.2 Scanning electron microscopy
Analysis using scanning electron microscopy coupled with energy dispersive X-ray spectroscopy (SEM-EDS; Zeiss Sigma 300 VP-FESEM) was carried out at the University of Alberta Earth and Atmospheric Sciences SEM lab. A pie-shaped wedge section of the PUF disk (2 cm base) was used for the SEM-EDS analysis. Particles entrained in the PUF wedges were removed by ultrasonication in dichloromethane, which was subsequently dried by nitrogen gas. A portion of the dried particles was transferred to double-sided adhesive conductive tape for SEM-EDS analysis. The EDS spectra were acquired by a Bruker energy EDS system with dual silicon drift detectors, each with an area of 60 mm2 and a resolution of 123 eV. Additional details on the SEM-EDS approach are provided in Zhang et al. (2016).
2.3.3 Quality assurance and quality control
Results were corrected to account for the wedge portion removed for the SEM analysis and also for the area of the PUF disk covered by the open plate and perforated support that holds the PUF in place (representing about ∼ 36 % of the PUF area). All data were recovery and blank corrected. Average surrogate recoveries for PACs and PAC derivatives were 80 % (±27 %) and 65 % (±15), respectively. The instrumental and method detection limits (IDL and MDL) are given in Table S1. Values below MDL were replaced by two-thirds of MDL for statistical purposes (Schuster et al., 2015).
3.1 Ambient concentrations of PACs, NPAHs, and OPAHs
The highest concentrations in air for ΣPACs_PAS and ΣPACs_PAS-DD were 58 and 150 ng m−3, respectively (Table S2), and observed at site AMS5, which is in close proximity to upgrading facilities. The lowest concentrations of ΣPACs_PAS and ΣPACs_PAS-DD were 14 and 24 ng m−3, respectively, and were observed at AMS14, which is ∼ 35 km southeast of Fort McMurray and adjacent to a near-lake residential settlement (Anzac) that is well removed from the open-pit mining (Table S2) but within several kilometers of a bitumen upgrading facility. For all the sites, the PAS and PAS-DD samples exhibited similar relative PAC compositions, with C1 phenanthrenes and anthracenes (C1-PHEs+ANTs) and PHE being the most abundant alk-PAH and parent PAH, respectively (Fig. S2). For both PAS and PAS-DD samplers, the PAC chemical compositions were dominated by the 2–3-ring PAHs and 2–3-ring alk-PAHs, which accounted for 77–87 % of the sum of all target compounds (Fig. 2). Residential sites (AMS6 and AMS14) were characterized by lower concentrations in air of dibenzothiophene (DBT) and alk-DBTs (compounds that are enriched in bitumen) but higher retene (RET) concentrations (a marker of wood combustion) (Ramdahl, 1983), compared to other sampling sites that are closer to the main oil sands activities. This suggests reduced influence of petrogenic sources and an increased contribution from wood combustion at sites AMS6 and AMS14, which is consistent with their greater distance from open mining areas and greater proximity to residential area where wood is burned for heating and recreational activities. However, it should be noted that RET does not solely originate from wood burning and has also been reported for stack emissions in the oil sands region during the winter period, which challenges the explanation above (Watson et al., 2013). It is also possible that the small (relative to main mining area) upgrading facility, which is several kilometers southeast of AMS14, may play a role.

Figure 2Composition of target compounds in air samples from five sites in the oil sands region, collected using the conventional passive sampler (PAS) and the passive dry deposition sampler (PAS-DD), collected during October to November 2015. “PAC” includes parent PAHs and alk-PAHs.
For all the sites, ΣNPAHs_PAS and ΣNPAHs_PAS-DD were dominated by 2-ring NPAHs, (Table S2). Concentrations in air of ΣNPAHs_PAS and ΣNPAHs_PAS-DD were highest at AMS5 (152 and 170 pg m−3, respectively) and lowest at AMS14 (8.42 and 14.2 pg m−3, respectively). At AMS5, 1-methyl-5-nitronaphthalene/2-methyl-1-nitronaphthalene (1M5NN/2M1NN) was the most abundant NPAH in the PAS sample, whereas 4-nitrobiphenyl (4-NBP) was the most abundant NPAH in the PAS-DD sample. The nitromethylnaphthalenes are known products of the gas-phase OH- and NO3-radical-initiated reactions with methylnaphthalenes (Reisen and Arey, 2004), while 4-NBP emission sources are not well understood and are usually not included in air monitoring campaigns. Past studies reported that ambient 4-NBP concentrations were low or below detection even in urban areas (Crimmins and Baker, 2006; Wang et al., 2011). A study reported an average 4-NBP concentration in air of 45 pg m−3 in Texas, at a sampling site close to petrochemical manufacturing plants and oil refineries (Wilson et al., 1995). Previous chamber reaction experiments demonstrated that 3-nitrobiphenyl (3-NBP) was the only nitro product formed by the OH-radical-initiated chamber reaction of biphenyl and that no nitro products were observed from the NO3-radical-initiated chamber reaction (Atkinson and Arey, 1994). In this study, 3-NBP was below the detection limit at all the sites, while 4-NBP was detected only at AMS5 and AMS9. It should be noted that, in the same sampling period, the 4-NBP concentration measured in a PAS sample at site AMS11 (data not shown), designated as the main oil sands source region (Jariyasopit et al., 2016), was a factor of 5 higher than that observed at AMS5, suggesting that airborne 4-NBP is closely linked to oil sands industrial activities. However, according to our previous study, 4-NBP was below the detection limit at all 15 passive sampling sites during the reporting period April to May 2014 (Jariyasopit et al., 2016). Long-term monitoring of NPAHs could provide insight into seasonal and temporal trends of NPAHs in air in the AOSR and improve understanding of their formation and sources.
NPAHs have been previously measured in PM2.5 released from stacks emissions in the AOSR (Watson et al., 2013). The majority of NPAH target compounds were below detection limits in the PM2.5 collected from stacks in the oil sands region, with the exception of 9-nitroanthracene (9-NAN) (Watson et al., 2013). In general, 9-NAN was the dominant NPAH in urban areas and present at approximately as high concentrations as 2-nitrofluoranthene (2-NF), which is the major particle-associated NPAH known to be formed by atmospheric OH- and NO3-radical-initiated reactions (Wang et al., 2011; Bamford and Baker, 2003; Albinet et al., 2007). In this study site, AMS5, which is close to upgrading facilities, exhibited the highest ΣNPAHs concentration; however, 9-NAN was below detection limits. This result suggests that stack emissions were not a major PM source contributing to NPAH concentrations measured by passive samplers.
For OPAHs, the highest concentration was found at AMS6 which is located in the town of Fort McMurray, approximately 30 km south of the main mining area. This is consistent with our previous study. The elevated OPAHs at this site are due to local primary combustion sources (e.g., vehicular exhausts) as well as the enhanced atmospheric transformation process which is dependent on gaseous oxidants emitted from the combustion sources (Jariyasopit et al., 2016). The highest concentrations for ΣOPAHs_PAS and ΣOPAHs_PAS-DD were 753 and 1480 pg m−3. The lowest concentrations for ΣOPAHs_PAS and ΣOPAHs_PAS-DD were 213 and 352 pg m−3, respectively, and were observed at AMS13. The dominant contributor was 2–3-ring OPAHs (Table S2). For both sampler types 9-fluorenone (FLO) was the dominant OPAH at all sites. Different target OPAHs have been reported by various air monitoring campaigns, making it challenging to compare the OPAH air concentrations in the AOSR to data available in the literature. On average, the ΣOPAHs concentrations derived from PAS and PAS-DD samplers in this study were comparable to or lower than concentrations measured at urban sites (Wang et al., 2011; Ahmed et al., 2015; Albinet et al., 2008a).
3.2 PUF-PAS versus PAS-DD
A key aspect of the study was to compare the performance of PAS and PAS-DD to capture PACs, NPAHs, and OPAHs. Their relative performance can be illustrated using the enhancement ratio which is defined as the ratio of the concentration of an analyte in PAS-DD to that in PAS. A value close to 1 indicates comparable ability of the two sampler types for capturing an analyte. Figure 3 shows enhancement ratios for PACs for all the sampling sites. Average ratios for 2–3-ring, 4-ring, and 5–6-ring PACs were 2.3, 2.8, and 3.6 respectively. Similarly, the enhancement ratio increased with molecular weight for the NPAHs (Fig. S3) up to an average value of about 4. Comparison of the enhancement ratios of PACs among the sites indicates that the ratio is partly dependent on particle loadings. This is evident from higher enhancement ratios of higher-ring PACs, except for BghiP (Benzo(ghi)perylene), observed in AMS5, which is the near-source site where ΣPACs, ΣNPAHs, and ΣOPAHs concentrations were highest. This finding illustrates the enhanced ability of PAS-DD to capture more of the higher-molecular-weight target compounds that are associated with the larger depositing particles in air, whereas the PUF-PAS preferentially samples the smaller airborne particles.
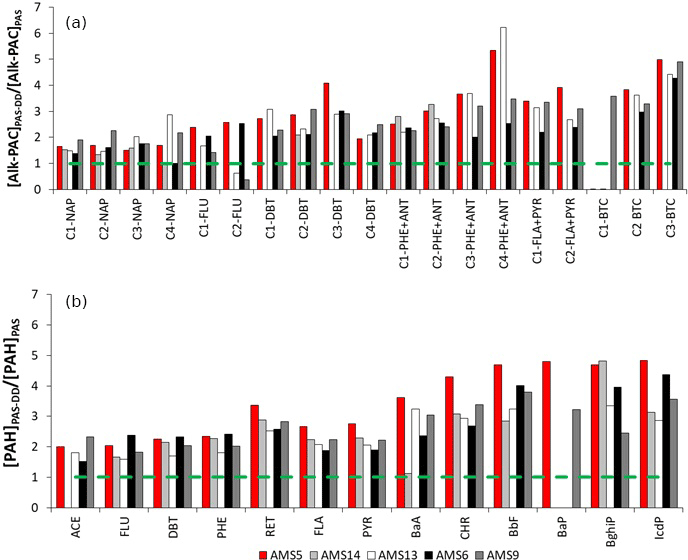
Figure 3Enhancement ratios (expressed as a ratio of the concentration of an analyte in PAS-DD to that in PAS) for (a) alk-PAHs and alk-DBTs and (b) parent PAHs, DBT, and RET during October to November 2015 across five sites in the oil sands region.
The enhancement ratios for the NPAHs and OPAHs were considerably more variable among sites compared to the patterns observed for the PACs (Fig. S3). This may be due to multiple factors contributing to their presence in air, which can be by direct emission from primary sources as well as production in air through transformation processes. Transformation reaction rates will vary among NPAH and OPAH compounds and also spatially, depending on atmospheric conditions and oxidant concentrations.
3.3 Chemical compositions of petcoke and oil sands ore
The composition of PACs, NPAHs, and OPAHs in petcoke and oil sands ore samples was investigated in order to assess if these compositions are reflected in the passive air samplers, thereby indicating potential contributions. Results of residue analysis are discussed below and summarized in Table 1. Individual PAC concentrations and composition are given in Table S3 and Fig. S4.
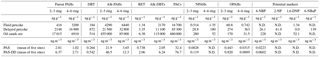
Table 1Concentrations of parent PAHs, dibenzothiophene (DBT), alk-PAHs, retene (RET), alk-DBTs, NPAHs, OPAHs, and potential NPAH markers in fluid petcoke, delayed petcoke, oil sands ore (ng g−1 on a dry weight basis), and air samples (ng m−3, PAS and PAS-DD).
N.D.: non-detect.
3.4 PACs
The levels of ΣPACs (dry weight basis) were approximately 5 times higher in the delayed petcoke (85 300 ng g−1) compared to the fluid petcoke (16 700 ng g−1) (Table 1). The greater abundance of PACs in delayed petcoke (vs. fluid petcoke) is likely due to the lower temperatures involved in the delayed coking process (Anthony, 1995), resulting in reduced losses of PACs due to degradation and volatilization, leaving PACs more concentrated in the residue. Furthermore, the residues of 2–3-ring alk-PAHs and 4–6-ring alk-PAHs were ∼ 10 times and ∼ 2 times higher than their parent PACs (Table 1). DBT and alk-DBTs concentrations in the delayed petcoke were ∼ 5 times higher than the concentrations in the fluid petcoke. Despite the difference in absolute residue concentrations of PACs, the PAC profiles were similar in delayed and fluid petcoke: 4–6-ring compounds accounting for ∼ 60 % of the ΣPACs (Figs. 4 and S4), of which 4–6-ring alk-PAHs were the dominant group. It is also noteworthy that chrysene (CHR) and the sum of alk-benzo(a)anthracenes, alk-triphenylenes, and alk-chrysenes (alk-BTCs) were major components of petcoke (Table S3 and Fig. S4). The oil sands ore residue concentration of ΣPACs (dry weight basis) was 680 000 ng g−1, which was ∼ 40 and ∼ 8 times higher than ΣPACs determined in the fluid and delayed petcoke, respectively (Tables 1 and S3). The oil sands ore had the highest residue concentrations of 2–3-ring parent PAHs, alk-PAHs, RET, and alk-DBTs; however, the delayed petcoke had the greatest residue concentrations of 4–6-ring parent PAHs and DBT (Table 1). In contrast to the PAC compositions of the fluid and delayed petcoke, 2–3-ring PACs were the major component in the oil sands ore accounting for ∼ 70 % of the ΣPACs (Table 1 and Fig. 4). A past study reported percent contribution of 2–3-ring PACs in oil sands samples ranging from 79 to 94 % of the ΣPACs (Yang et al., 2011). Variability in percent contribution was caused by the degree of biodegradation in the samples, with greater biodegradation leading to reductions in 2–3-ring alkylated PAHs (Yang et al., 2011).
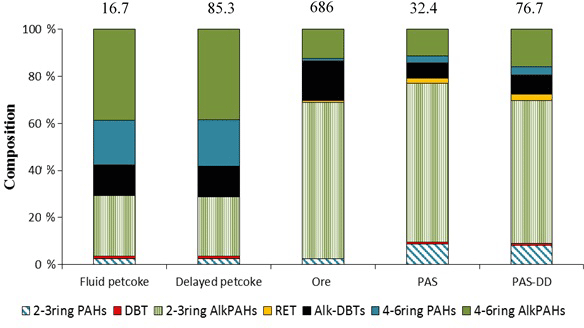
Figure 4PAC compositions of fluid petcoke, delayed petcoke, oil sands ore, and air samples (PAS and PAS-DD). PAC compositions of air samples are averages of five sites. The number at the top of each bar represents the total residue concentration (ng mg−1, dry weight basis) or concentration in air (ng m−3), for PAS and PAS-DD air samples.
3.5 NPAH and OPAH
For the petcoke and oil sands ore samples, residues of the sum of NPAH and OPAH concentrations were 2 to 4 orders of magnitude lower than the PAC concentrations. Similar to the results for PACs in petcoke samples, the oil sands ore exhibited higher ΣNPAHs (332 ng g−1), which were 1.6 times and 178 times higher, respectively, than in the delayed (208 ng g−1) and fluid petcoke (1.91 ng g−1) (Table S3). However, the delayed petcoke was the most enriched in 4–6-ring NPAHs. The most abundant NPAHs in the delayed petcoke were 6-nitrobenzo(a)pyrene (6-NBaP) (138 ng g−1), whereas the most abundant in the ore was 4-NBP (228 ng g−1). The presence and absence of these compounds in the various source samples present an opportunity to use these as markers to evaluate emission sources to air. Figure 5 summarizes the occurrence of the various NPAH marker compounds by showing extracted ion chromatograms for samples of delayed and fluid petcoke, ore, and two passive air samples. In the following section of the discussion, we consider the implication of these profiles for indicating potential contributions to air of petcoke and ore particles.
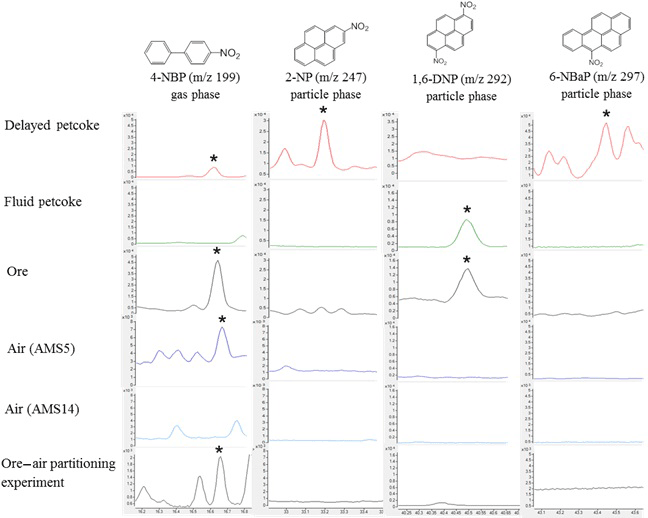
Figure 5GC-MS extracted ion chromatograms of 4-nitrobiphenyl (4-NBP), 2-nitropyrene (2-NP), 1,6-dinitropyrene (1,6-NP), and 6-nitrobenzo(a)pyrene (6-NBaP) in a selection of samples including delayed petcoke, fluid petcoke, oil sands ore, passive dry deposition sample at AMS5, passive dry deposition sample at AMS14, and air sample collected from the ore–air partitioning study. The phase distribution of each marker is also indicated as gas phase or particle phase.
The delayed petcoke exhibited higher residues of ΣOPAHs compared to fluid petcoke and ore – approximately 10 times and 3 times higher, respectively (Tables 1 and S3). The most abundant OPAHs in fluid petcoke, delayed petcoke, and ore were 9,10-anthraquinone (ANQ, 31 ng g−1), benzo(a)fluorenone (BaFL, 180 ng g−1), and FLO (113 ng g−1), respectively. All individual OPAH concentrations measured in the delayed petcoke were higher than those measured in the fluid petcoke and the oil sands ore except for FLO, which was highest in the ore. The fluid petcoke and ore were enriched in lower-ring OPAHs; however, the delayed petcoke was enriched in higher-ring OPAHs. OPAHs have been identified as transformation products of biological and chemical processes and reported to be abundant in soils from PAH-contaminated sites in Sweden and thought to be formed through PAH remediation processes including bioremediation and Fenton oxidation (Lundstedt et al., 2007).
3.6 Contribution of petcoke and oil sands ore to PAC burdens in air
Comparisons of PAC compositions for the delayed petcoke, fluid petcoke, and oil sands ore versus the PUF-PAS, and PAS-DD air samples revealed interesting differences as shown in Figs. 4 and S4. For instance, the petcoke particles exhibited enrichment in the higher-molecular-weight, semi-volatile, and particulate-associated parent PAHs and alk-PAHs, while the oil sands ore and passive air samples were dominated by lower-molecular-weight and more-volatile alk-PAHs. DBT makes up a small proportion (∼ 0.1–1 %) in all the samples. Alk-DBTs comprise 13 % of the ΣPACs in the delayed and fluid petcoke but were 17 % in the oil sands ore (Table S3), whereas small compositions of alk-DBTs were observed in the PAS and PAS-DD air samples (mean of 6–7 %) (Table S4). RET accounted for 1–3 % of the ΣPACs in the oil sands ore, PAS, and PAS-DD but it accounted for much smaller proportions in the fluid petcoke and delayed petcoke. Furthermore, as illustrated in Fig. S4, individual 2–3-ring PACs in the oil sands ore and passive air samples make up similar proportions of the ΣPAC burden. Given the relatively higher volatility of these 2–3-ring PACs, this suggests that oil sands ore is contributing substantially to these gas-phase PACs in air, most likely through volatilization from open mine faces.
To assess the potential contributions of particle-associated PACs in air, stemming potentially from either petcoke or the exposed ore from open-pit mines, we focus on the higher-molecular-weight compounds which exist primarily in the particle phase. These compounds dominate the PAC composition of petcoke (Fig. S4), since the more-volatile, lower-molecular-weight compounds are depleted during the high temperature coking process. If petcoke and/or ore particles represent an important contributor to PACs present in air, then their compositions should be reflected in PAS and especially the PAS-DD samples. The compositions of the 4–6-ring PACs in delayed petcoke, fluid petcoke, oil sands ore, and passive air samples are compared in Fig. S5. The parent 4–6-ring PAH composition of the passive air samples did not match the 4–6-ring PAH compositions of the petcoke and ore, suggesting a minimal contribution of these sources to parent PAH burdens in air. This implies that other sources of parent PAHs (e.g., combustion, vehicle emissions) were more dominant, whereas the 4–6-ring alk-PAH compositions for all samples were more similar, suggesting some contribution of petcoke and oil sands ore particles in the passive air samples. However, these findings for parent PAHs and alk-PAHs are somewhat contradictory. If petcoke particles had contributed substantially to alk-PAHs in air, then the parent PAHs contained in these same particles (and making up ∼ 25 % of the PAC residue, Table S3) should have also been important contributors, especially since concentrations in air of parent PAHs are much lower and therefore more sensitive to the petcoke contribution. The results are less contradictory in the case of ore since ore residues are dominated by alk-PAHs (∼ 95 %, Table S3). In other words, ore particles could be contributing substantially to the alk-PAHs present in air but not substantially to parent PAHs in air, which is consistent with Figs. S4 and S5. In fact, the relative proportions of alk-PAHs to parent PAHs in ore are consistent with the relative proportions observed in air, with a dominance of the alk-PAHs (Fig. 4, Table S2).
In the case of NPAHs and OPAHs, their relatively low residue concentrations in petcoke and ore samples complicate the assessment of potential contributions of these particles to air samples. As shown in Fig. 5, the high molecular weight and particle-associated NPAH marker compounds, 2-NP, 1,6-DNP, and 6-NBaP are detected in various petcoke and ore samples but not reflected in air. However, the gas-phase marker compound 4-NBP which is present in the delayed petcoke and the oil sands ore, is also captured at site AMS5 and AMS9 (Table S2). These two sites are the closest to open-pit mines, which points to the potential importance of volatilization from open-pit mines as a source to air of 4-NBP and other volatile PACs. This finding is supported by the results of a simple ore–air partitioning experiment showing that 4-NBP was in fact detected in air that has equilibrated with ore. Details of the experimental setups which are based on Francisco et al. (2017) are provided in the Supplement.
We conclude that oil sands ore is contributing substantially to burdens of PACs in air near mining areas but not at sites further removed from open mines. This finding is consistent with air and snow monitoring studies that indicate that most of the deposition of mining-related particles and associated chemicals occurs within the first several kilometers of mining areas (Schuster et al., 2015; Kelly et al., 2009).
3.7 Qualitative SEM-EDS analysis of PUF disks
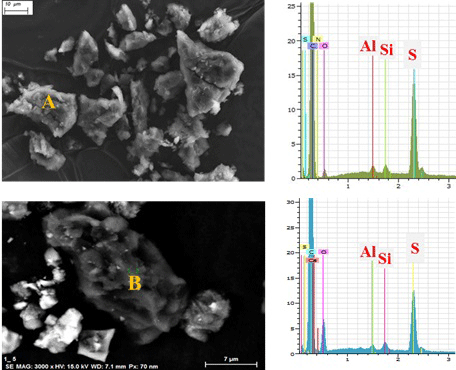
Figure 6Scanning electron microscopy (SEM) images and energy dispersive X-ray (EDS) spectra of (a) authentic delayed petcoke particles and (b) a petcoke particle found in a PAS-DD sample collected at AMS5. Al, aluminum; Si, silicon; S, sulfur.
In this aspect of the study, passive air samples were screened for petcoke particles using scanning electron microscopy (SEM) and energy dispersive X-ray spectroscopy (EDS). Petcoke particles can be distinguished from ore and other particle types by their unique morphology (using SEM) and elemental composition (based on EDS spectra). An image and EDS spectrum of an authentic delayed petcoke particle is shown in Fig. 6a, demonstrating the unique relative elemental abundance (excluding carbon) as S (sulfur) > Si (silicon) ≈ Al (aluminum), whereas ore particles have different relative elemental abundance (i.e., Si > S > Al) (Zhang et al., 2016). Based on their morphology and elemental composition, petcoke particles were screened for and identified in all of the passive air samples. It should be noted that the elemental composition of delayed and fluid petcoke particles are indistinguishable; however, they can be distinguished from each other by morphology at 1000× magnification (Zhang et al., 2016). Figure 6b shows an image of petcoke-like particle in PAS-DD PUF deployed at AMS5, as well as the elemental profile with the dominance of sulfur. The results of the particle screening exercise carried out on all of the PAS and PAS-DD samples confirmed the presence of petcoke particles in PUFs collected at AMS5, AMS9, and AMS13, which are the sampling sites closest to mining activities (Fig. 1). This indicates that surface-derived particles such as petcoke and ore particles can be suspended in air and transported away from mining areas, albeit over relatively short distances. Because volatile PAC residues in ore particles are much greater than in petcoke particles (Table S3), it is also very likely that ore makes a larger contribution to air burdens of PACs, which is consistent with the earlier discussion related to marker compounds and chemical profiles.
In summary, this study demonstrated the performance of PAS-DD in capturing depositing particles that are enriched with the higher-molecular-weight PACs and PAC derivatives. Due to the design of PAS-DD where the PUF disk is shielded from precipitation and direct sunlight by a cover plate, PACs captured by PAS-DD reflect dry deposition of PACs that have been protected from photolytic degradation. Alternatively, environmental passive samplers such as peat and moss have been used to collect wet and dry depositions (Zhang et al., 2016). These environmental passive samplers are exposed to direct sunlight but potentially collect more of the dry deposited fraction, especially the very large particles which may be excluded by PAS-DD due to the top cover plate. The environmental samplers also accumulate PACs deposited in precipitation. Therefore, we consider PAS-DD, peat, and moss as complementary tools for assessing ecosystem impacts through atmospheric deposition. The comparisons of chemical composition of PACs in passive air samples with petcoke and oil sands ore samples demonstrated an important contribution of oil sands ore to PAC concentrations in air for sites that were closer to open-pit mining areas. Further characterization of ore–air partitioning is identified as a topic for future experimental work and modeling. Lastly, in this study we identify 4-NBP (4-nitrobiphenyl) as a potential marker chemical of oil sands ore and delayed petcoke.
Data used in this study are provided in the Supplement.
The supplement related to this article is available online at: https://doi.org/10.5194/acp-18-9161-2018-supplement.
NJ was responsible for the study design and conducting PUF-PAS and PAS-DD sample preparation, sample analysis, data analysis and preparation of the manuscript; YZ and JM contributed to the analysis and interpretation of the petcoke samples and XRF analysis; TH was the study lead and contributed to the study design and data interpretation and reporting.
The authors declare that they have no conflict of interest.
This article is part of the special issue “Atmospheric emissions from oil sands development and their transport, transformation and deposition (ACP/AMT inter-journal SI)”. It is not associated with a conference.
This project was jointly supported by the Climate Change and Air Quality
Program of Environment and Climate Change Canada and the Joint Oil Sands
Monitoring program. The Wood Buffalo Environmental Association (WBEA) is
acknowledged for their support in passive air sample collection.
Yifeng Zhang acknowledges financial support from Alberta Innovates. We thank thank Eftade Gaga, Jasmin
Schuster, and Elisabeth Galarneau for their comments on the
manuscript.
Edited by: Jennifer G. Murphy
Reviewed by: three anonymous referees
Ahmed, T. M., Ahmed, B., Aziz, B. K., Bergvall, C., and Westerholm, R.: Native and oxygenated polycyclic aromatic hydrocarbons in ambient air particulate matter from the city of Sulaimaniyah in Iraq, Atmos. Environ., 116, 44–50, 2015.
Albinet, A., Leoz-Garziandia, E., Budzinski, H., and Villenave, E.: Polycyclic aromatic hydrocarbons (PAHs), nitrated PAHs and oxygenated PAHs in ambient air of the Marseilles area (South of France): Concentrations and sources, Sci. Total Environ., 384, 280–292, 2007.
Albinet, A., Leoz-Garziandia, E., Budzinski, H., Villenave, E., and Jaffrezo, J. L.: Nitrated and oxygenated derivatives of polycyclic aromatic hydrocarbons in the ambient air of two French alpine valleys: Part 1: Concentrations, sources and gas/particle partitioning, Atmos. Environ., 42, 43–54, 2008a.
Albinet, A., Leoz-Garziandia, E., Budzinski, H., Villenave, E., and Jaffrezo, J.-L.: Nitrated and oxygenated derivatives of polycyclic aromatic hydrocarbons in the ambient air of two French alpine valleys Part 2: Particle size distribution, Atmos. Environ., 42, 55–64, 2008b.
Anthony, E.: Fluidized bed combustion of alternative solid fuels; status, successes and problems of the technology, Prog. Energ. Combust., 21, 239–268, 1995.
Atkinson, R. and Arey, J.: Atmospheric Chemistry of Gas-Phase Polycyclic Aromatic Hydrocarbons: Formation of Atmospheric Mutagens, Environ. Health Persp., 102, 117–126, 1994.
Bamford, H. A. and Baker, J. E.: Nitro-polycyclic aromatic hydrocarbon concentrations and sources in urban and suburban atmospheres of the Mid-Atlantic region, Atmos. Environ., 37, 2077–2091, 2003.
Chrysikou, L. P., Gemenetzis, P. G., and Samara, C. A.: Wintertime size distribution of polycyclic aromatic hydrocarbons (PAHs), polychlorinated biphenyls (PCBs) and organochlorine pesticides (OCPs) in the urban environment: Street-vs rooftop-level measurements, Atmos. Environ., 43, 290–300, 2009.
Crimmins, B. S. and Baker, J. E.: Improved GC/MS methods for measuring hourly PAH and nitro-PAH concentrations in urban particulate matter, Atmos. Environ., 40, 6764–6779, 2006.
Deng, W., Zheng, J., Bi, X., Fu, J., and Wong, M.: Distribution of PBDEs in air particles from an electronic waste recycling site compared with Guangzhou and Hong Kong, South China, Environ. Int., 33, 1063–1069, 2007.
Eng, A., Harner, T., and Pozo, K.: A prototype passive air sampler for measuring dry deposition of polycyclic aromatic hydrocarbons, Environ. Sci. Tech. Let., 1, 77–81, 2013.
Francisco, A. P., Harner, T., and Eng, A.: Measurement of polyurethane foam – air partition coefficients for semivolatile organic compounds as a function of temperature: Application to passive air sampler monitoring, Chemosphere, 174, 638–642, 2017.
Galarneau, E., Hollebone, B. P., Yang, Z., and Schuster, J.: Preliminary measurement-based estimates of PAH emissions from oil sands tailings ponds, Atmos. Environ., 97, 332–335, 2014.
Harner, T., Bartkow, M., Holoubek, I., Klanova, J., Wania, F., Gioia, R., Moeckel, C., Sweetman, A. J., and Jones, K. C.: Passive air sampling for persistent organic pollutants: Introductory remarks to the special issue, Environ. Pollut., 144, 361–364, 2006.
Harner, T., Su, K., Genualdi, S., Karpowicz, J., Ahrens, L., Mihele, C., Schuster, J., Charland, J.-P., and Narayan, J.: Calibration and application of PUF disk passive air samplers for tracking polycyclic aromatic compounds (PACs), Atmos. Environ., 75, 123–128, 2013.
Holsen, T. M. and Noll, K. E.: Dry deposition of atmospheric particles: application of current models to ambient data, Environ. Sci. Technol., 26, 1807–1815, 1992.
Jariyasopit, N., Harner, T., Wu, D., Williams, A., Halappanavar, S., and Su, K.: Mapping Indicators of Toxicity for Polycyclic Aromatic Compounds in the Atmosphere of the Athabasca Oil Sands Region, Environ. Sci. Technol., 50, 11282–11291, 2016.
Jaward, F. M., Farrar, N. J., Harner, T., Sweetman, A. J., and Jones, K. C.: Passive air sampling of PCBs, PBDEs, and organochlorine pesticides across Europe, Environ. Sci. Technol., 38, 34–41, 2004.
Kelly, E. N., Short, J. W., Schindler, D. W., Hodson, P. V., Ma, M., Kwan, A. K., and Fortin, B. L.: Oil sands development contributes polycyclic aromatic compounds to the Athabasca River and its tributaries, P. Natl. Acad. Sci. USA, 106, 22346–22351, 2009.
Klánová, J., Kohoutek, J., Hamplová, L., Urbanová, P., and Holoubek, I.: Passive air sampler as a tool for long-term air pollution monitoring: Part 1. Performance assessment for seasonal and spatial variations, Environ. Pollut., 144, 393–405, 2006.
Lundstedt, S., White, P. A., Lemieux, C. L., Lynes, K. D., Lambert, I. B., Öberg, L., Haglund, P., and Tysklind, M.: Sources, Fate, and Toxic Hazards of Oxygenated Polycyclic Aromatic Hydrocarbons (PAHs) at PAH- contaminated Sites, Ambio, 36, 475–485, 2007.
Markovic, M. Z., Prokop, S., Staebler, R. M., Liggio, J., and Harner, T.: Evaluation of the particle infiltration efficiency of three passive samplers and the PS-1 active air sampler, Atmos. Environ., 112, 289–293, 2015.
Parajulee, A. and Wania, F.: Evaluating officially reported polycyclic aromatic hydrocarbon emissions in the Athabasca oil sands region with a multimedia fate model, P. Natl. Acad. Sci. USA, 111, 3344–3349, 2014.
Pozo, K., Harner, T., Shoeib, M., Urrutia, R., Barra, R., Parra, O., and Focardi, S.: Passive-Sampler Derived Air Concentrations of Persistent Organic Pollutants on a North–South Transect in Chile, Environ. Sci. Technol., 38, 6529–6537, 2004.
Ramdahl, T.: Retene – a molecular marker of wood combustion in ambient air, Nature, 306, 580–582, 1983.
Reisen, F. and Arey, J.: Atmospheric Reactions Influence Seasonal PAH and Nitro-PAH Concentrations in the Los Angeles Basin, Environ. Sci. Technol., 39, 64–73, 2004.
Schuster, J. K., Harner, T., Su, K., Mihele, C., and Eng, A.: First Results from the Oil Sands Passive Air Monitoring Network for Polycyclic Aromatic Compounds, Environ. Sci. Technol., 49, 2991–2998, 2015.
Shoeib, M. and Harner, T.: Characterization and comparison of three passive air samplers for persistent organic pollutants, Environ. Sci. Technol., 36, 4142–4151, 2002.
Studabaker, W., Krupa, S., Jayanty, R., and Raymer, J.: Measurement of polynuclear aromatic hydrocarbons (PAHs) in epiphytic lichens for receptor modeling in the Athabasca Oil Sands Region (AOSR): A pilot study, in: Developments in Environmental Science, Elsevier, 391–425, 2012.
Thomas, J., Holsen, T. M., and Dhaniyala, S.: Computational fluid dynamic modeling of two passive samplers, Environ. Pollut., 144, 384–392, 2006.
Wang, W., Jariyasopit, N., Schrlau, J., Jia, Y., Tao, S., Yu, T.-W., Dashwood, R. H., Zhang, W., Wang, X., and Simonich, S. L. M.: Concentration and Photochemistry of PAHs, NPAHs, and OPAHs and Toxicity of PM2.5 during the Beijing Olympic Games, Environ. Sci. Technol., 45, 6887–6895, 2011.
Watson, J., Chow, J., Wang, X., Kohl, S., and Sodeman, D.: Measurement of real-world stack emissions in the Athabasca Oil Sands Region with a dilution sampling system during March, 2011, Renov. NV, Desert Research Institute, 2013.
Wilson, N. K., McCurdy, T. R., and Chuang, J. C.: Concentrations and phase distributions of nitrated and oxygenated polycyclic aromatic hydrocarbons in ambient air, Atmos. Environ., 29, 2575–2584, 1995.
Yang, C., Wang, Z., Yang, Z., Hollebone, B., Brown, C. E., Landriault, M., and Fieldhouse, B.: Chemical fingerprints of Alberta oil sands and related petroleum products, Environ. Forensics, 12, 173–188, 2011.
Zhang, L., Cheng, I., Muir, D., and Charland, J.-P.: Scavenging ratios of polycyclic aromatic compounds in rain and snow in the Athabasca oil sands region, Atmos. Chem. Phys., 15, 1421–1434, https://doi.org/10.5194/acp-15-1421-2015, 2015.
Zhang, Y., Shotyk, W., Zaccone, C., Noernberg, T., Pelletier, R., Bicalho, B., Froese, D. G., Davies, L., and Martin, J. W.: Airborne petcoke dust is a major source of polycyclic aromatic hydrocarbons in the Athabasca Oil Sands Region, Environ. Sci. Technol., 50, 1711–1720, 2016.